KFF designs, conducts and analyzes original public opinion and survey research on Americans’ attitudes, knowledge, and experiences with the health care system to help amplify the public’s voice in major national debates.
Medicaid is the primary program providing comprehensive health and long-term care coverage to approximately one in five low-income Americans. States administer Medicaid programs within broad federal rules, but have flexibility in designing programs, which creates variation in spending and enrollment as well as spending per enrollee across eligibility groups and states. Understanding variation in Medicaid spending per enrollee can help inform the implications of various policy proposals – such as expanding coverage for Medicaid enrollees or closing the coverage gap, as favored by the Biden-Harris Administration, or restructuring Medicaid financing into a block grant or a per capita cap as well as limiting Medicaid eligibility and benefits, policies that have in the past been favored by former President Trump.
This data note provides an overview of total Medicaid (state and federal shares) spending per enrollee for full-benefit Medicaid enrollees by eligibility group and state in 2021. Data from 2021 is the most current final version of Medicaid data at the time of this analysis. Full-benefit Medicaid enrollees are those that qualify for a full range of Medicaid services such as doctor’s visits, hospitalizations, prescription drugs, and home health services. A small number of total enrollees (9% of all enrollees in 2021) qualify for only a limited set of Medicaid benefits such as family planning or treatment of an emergency medical condition and are not included in this analysis. References to Medicaid enrollees in this data note refer to full-benefit enrollees. See methods for more details. Detailed state-level data are also available on State Health Facts.
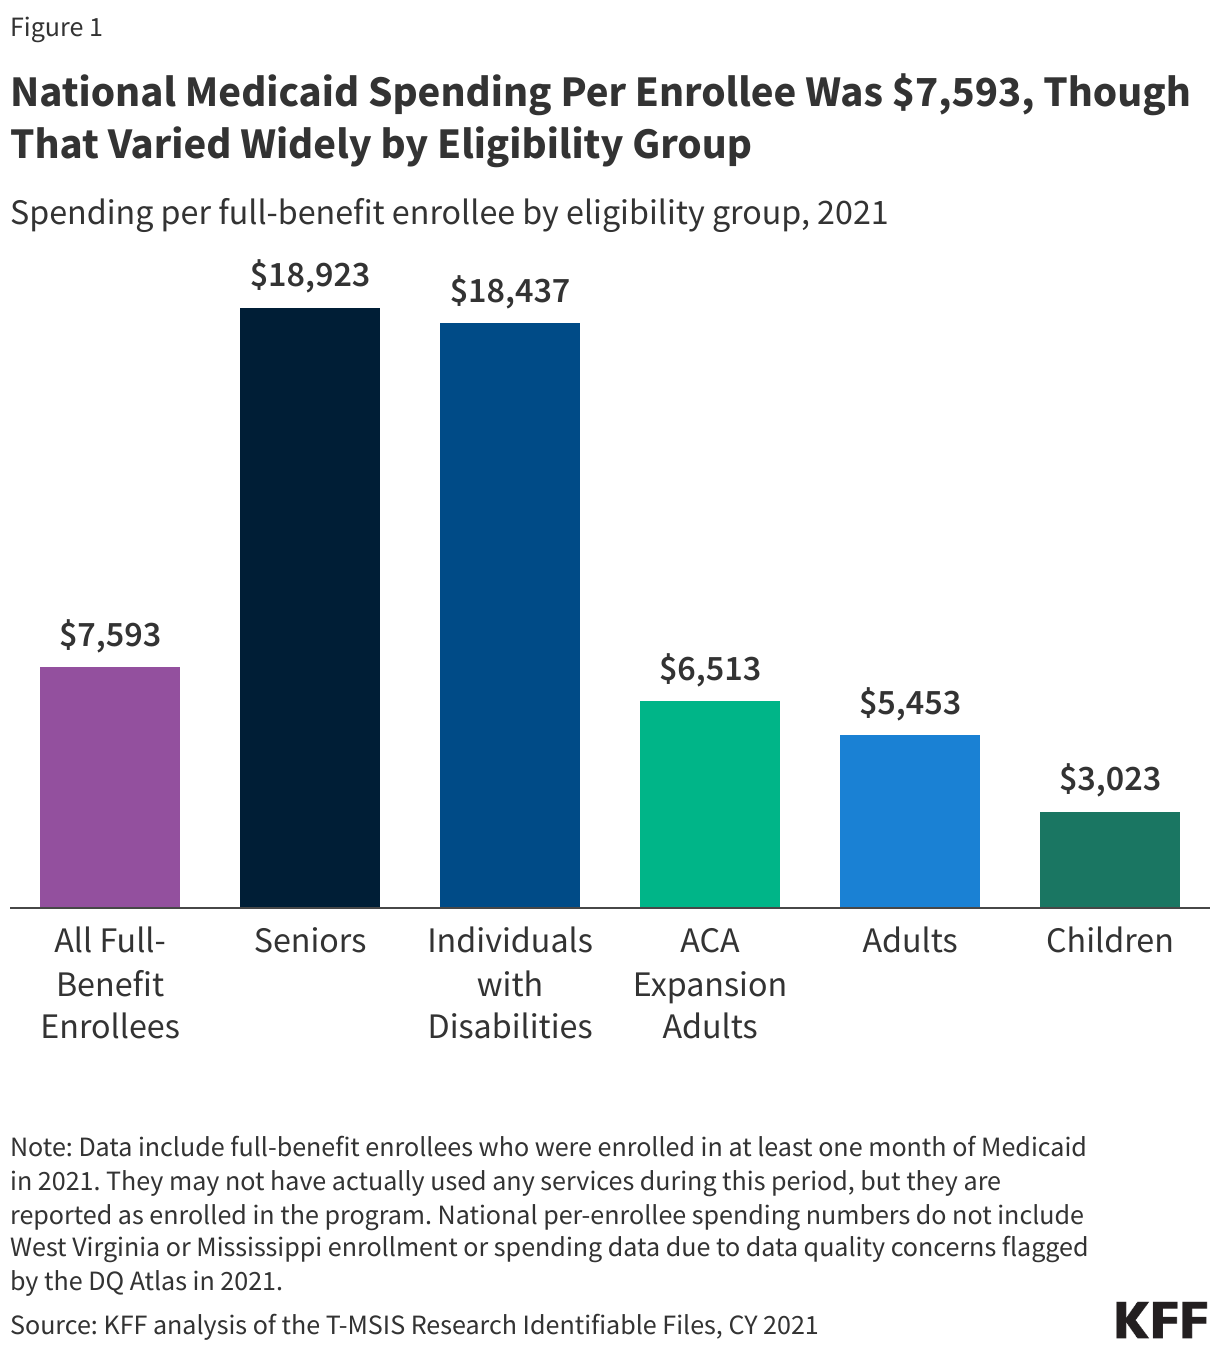
National Medicaid spending per enrollee was $7,593 in 2021, though that varied widely by eligibility group (Figure 1). Overall, children account for 37% of full-benefit enrollment, but 15% of the spending, while seniors and individuals with disabilities account for 21% of enrollment but 52% of the spending (data not shown.) The disproportionate spending on certain eligibility groups stems from variation in spending per enrollee across the eligibility groups. Spending per enrollee was highest for seniors, those ages 65 and older ($18,923), and individuals with disabilities ($18,437) (Figure 1). Those groups had per-enrollee spending approximately six times higher than child enrollees ($3,023), which had the lowest spending of any eligibility group (Figure 1). Differences in spending per enrollee reflect differences in health care needs and utilization. For example, seniors and those eligible on the basis of disability tend to have higher rates of chronic conditions, more complex health care needs and are more likely to utilize long-term services and supports (LTSS) than other enrollees. Most seniors and some individuals with disabilities enrolled in Medicaid are also dually eligible for Medicare. For dual-eligible individuals, Medicare is the primary payer for acute care services while Medicaid pays for services that Medicare does not, including vision, dental, and most LTSS. Medicaid spending per enrollee accounts for less than half of all spending for full-benefit dual-eligible individuals that are 65 and older.
Flexibility for states to determine eligibility levels, benefits, and provider payments in the Medicaid program leads to wide variation in per-enrollee spending across states (Figure 2). Other factors contributing to variation in per-enrollee spending include variation in state populations and demographics, ability and effort to raise revenue, and variation in health care costs and markets. Across states, Medicaid spending per enrollee ranged from $3,750 to $12,425, with a median spending of $7,784 (Figure 2). Tennessee, Florida, Oklahoma, and Nevada reported some of the lowest spending per enrollee, while Washington, D.C., Virginia, Massachusetts, and Minnesota reported the highest spending per enrollee. Approximately one-fifth of states had spending greater than $9,000 per enrollee (Figure 2).
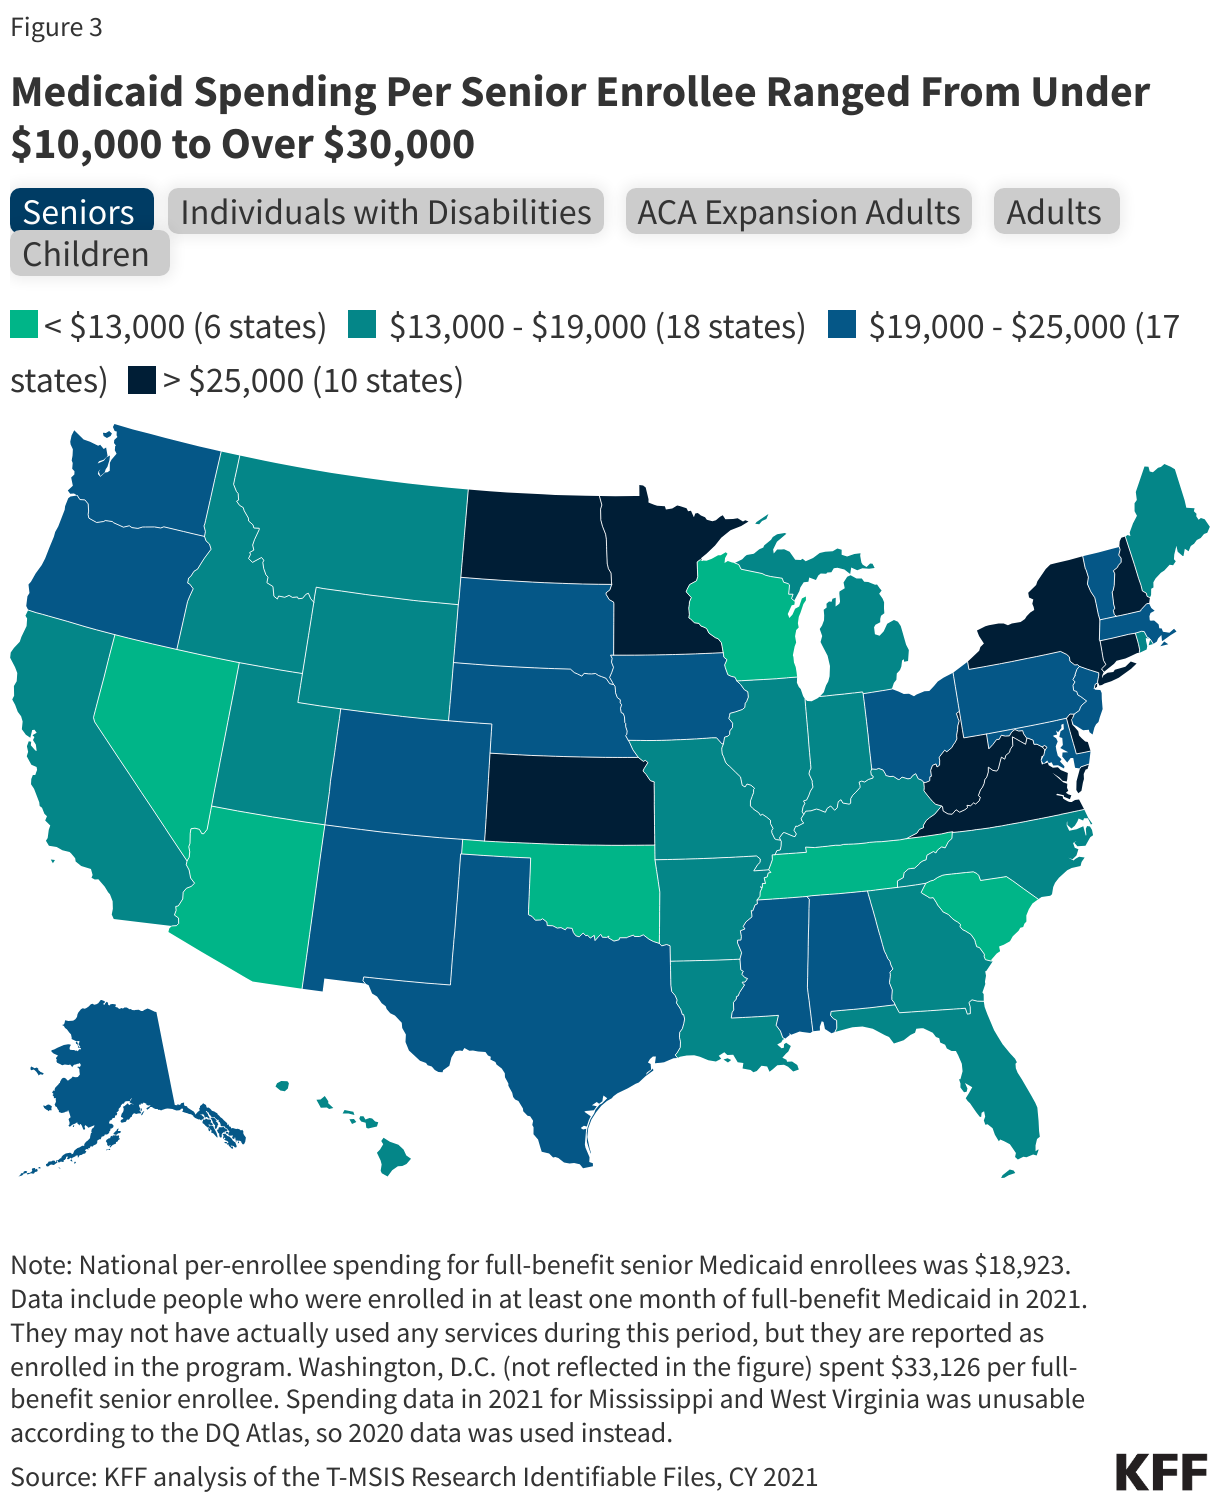
Within each eligibility group, there is also considerable variation in spending per enrollee across states (Figure 3). Individuals with disabilities had the widest variation across states for per-enrollee spending, ranging from $4,602 in Florida to $52,602 in Connecticut (Figure 3). States have considerable flexibility to decide the populations and services covered for LTSS, which drives large variation in per-enrollee spending for seniors and people with disabilities, who are more likely to use LTSS. In contrast, per-enrollee spending for children ranges from $1,958 in Tennessee to $6,012 in Kentucky (Figure 3). All states must provide comprehensive coverage for children through the Early Periodic Screening Diagnosis and Treatment (EPSDT), which contributes to somewhat less variation in per-enrollee spending for children.
Many—but not all—states that have relatively high or low overall per-enrollee spending tend to see those same patterns across eligibility groups in the state (Figure 3). Some states with the lowest overall per-enrollee spending (e.g. Tennessee, Oklahoma) fall among the states with the lowest per-enrollee spending for all eligibility groups (Figure 3). Others, such as Florida and Nevada are more mixed across eligibility groups. For example, Florida, has low per-enrollee spending across all eligibility groups except for children, where it has one of the highest per-enrollee spending. Similarly, some states with the highest overall per-enrollee spending (e.g. Washington, D.C., Virginia) fall among the states with the highest per-enrollee spending for all eligibility groups. However, states like Minnesota and Massachusetts are less consistently high across all eligibility groups (Figure 3).
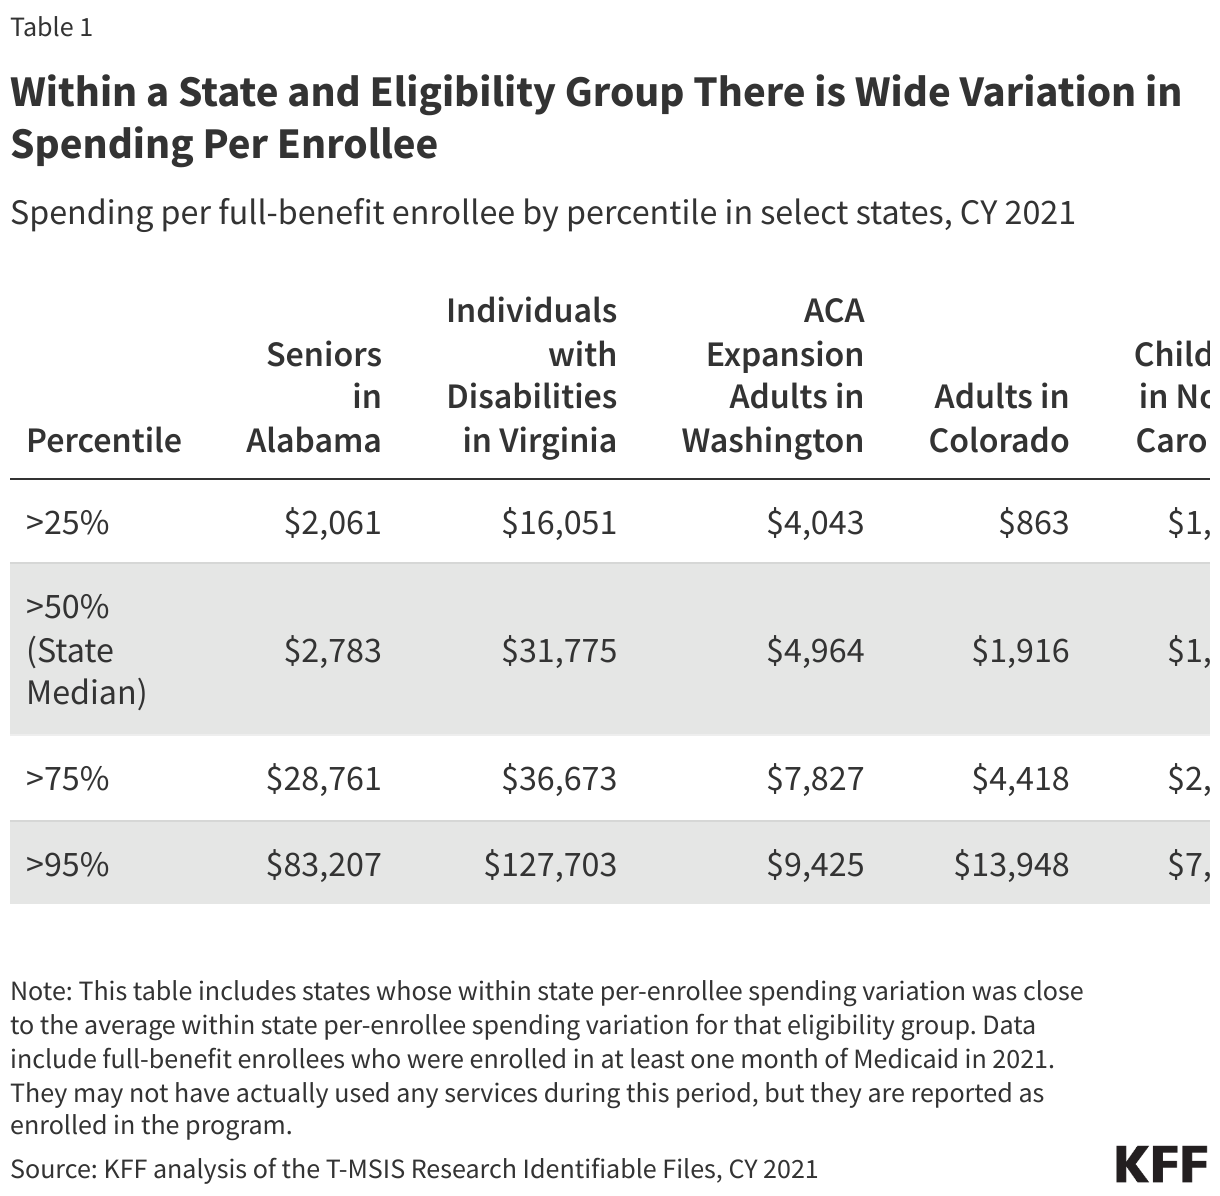
Even within a given state and eligibility group, there is wide variation in spending (Table 1). For example, among individuals with disabilities in Virginia, 25% had spending less than $16,051 and 5% had spending more than $127,703 – eight times higher (Table 1). Additionally, 25% of seniors in Alabama had spending less than $2,061, and 25% had spending fourteen times greater ($28,761) (Table 1). Despite the generally lower costs for non-disabled adult and child enrollees, the variation in spending for these eligibility groups was wide in Washington, Colorado, and North Carolina as well.
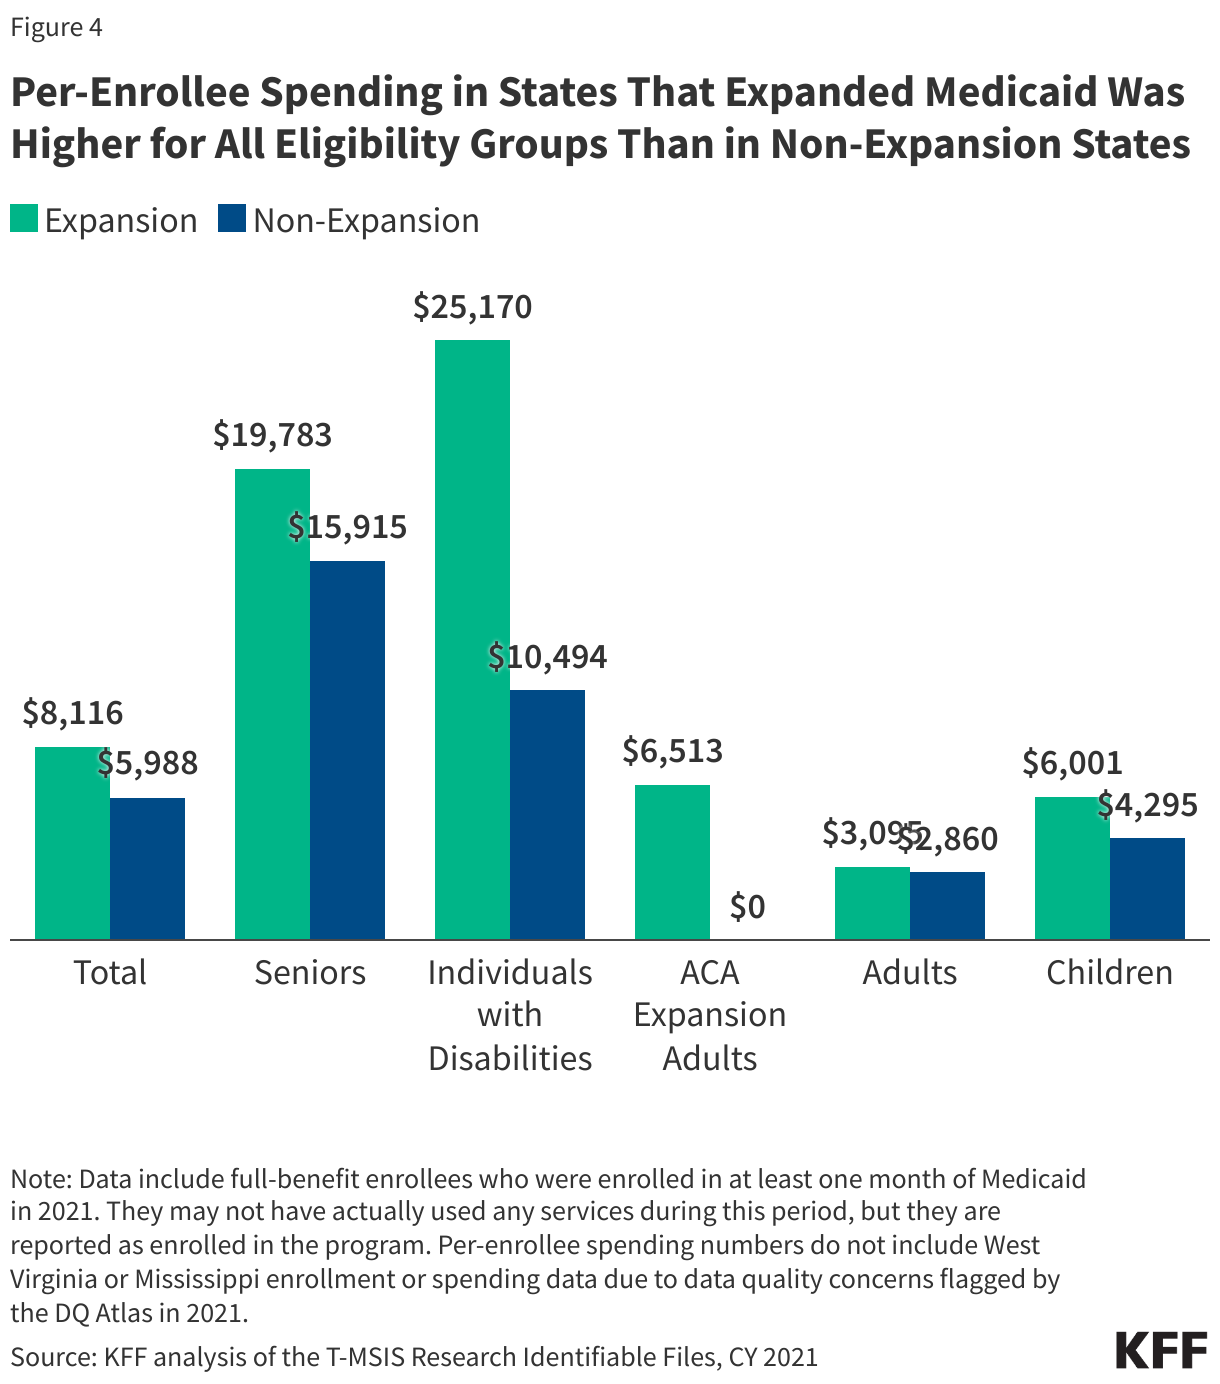
Per-enrollee spending in states that expanded Medicaid was higher for all eligibility groups than in non-expansion states (Figure 4). Expansion states spent on average $8,116 per enrollee – over $2,000 more per enrollee when compared to non-expansion states, which spent $5,988 per enrollee (Figure 4). Some have argued that adopting Medicaid expansion diverts funding from non-expansion enrollees (e.g. children, individuals with disabilities) to enrollees eligible only after expanding Medicaid (i.e. ACA expansion adults). However, across all categories, average per-enrollee spending is higher in expansion states. For instance, expansion states have an average spending of $25,170 per enrollee eligible based on disability, while non-expansion states spend on average $10,494 per enrollee in the same eligibility group. Similarly, expansion states spend $19,783 per senior enrollee compared to $15,915 for non-expansion states (Figure 4). These differences in spending may reflect state policy choices about benefits and eligibility, in addition to payment rates, regional variation in health care costs, and state demographics.
Methodology
Data: The KFF State Health Facts on spending per full-benefit enrollee use the T-MSIS Research Identifiable Demographic-Eligibility and Claims Files (T-MSIS data). This data note is based on State Health Facts data from CY 2021.
Overview of methods: KFF defined full-benefit enrollees as those who participated in Medicaid for at least 1 month with full-benefits or those who received at least one month of benefits through an alternative package of benchmark equivalent coverage. They may have not actually used any services during this period, but they are reported as enrolled in the program and are eligible to receive services. References to dual-eligible enrollees do not include Medicare Savings Program (MSP) enrollees due to the restriction of data to full-benefit enrollees only.
Spending: Spending was calculated by summing the total spending of all claims per full-benefit enrollee in the T-MSIS claims files.
Key limitations: National per-enrollee spending numbers do not include West Virginia or Mississippi due to data quality concerns flagged by the DQ Atlas in 2021.
June 2024 marked the 13th-consecutive month of record-breaking high temperatures. In early July 2024, the Eastern and Central regions of the U.S. experienced a record breaking heat wave, that exposed more than 200 million people to 90 degree Fahrenheit weather for more than seven days. As of mid-July, 37 people were suspected to have died from heat-related causes, however this is likely an undercount. As temperatures continue to rise and extreme heat events become more frequent in the U.S., people of color and other underserved communities are likely to be disproportionately affected due to increased exposure to heat and more limited access to air conditioning.
This brief examines disparities in access to air conditioning in the home by race and ethnicity and income and discusses the implications for heat-related health risks, including heat-related mortality. It is based on KFF analysis of data from the Residential Energy Consumption Survey, a nationally representative household survey. The survey asks respondents about how energy is utilized in their home, such as powering air conditioning units, while also collecting demographic and local weather information. Temperature in the respondent’s region is estimated from weighted temperatures of nearby weather stations.
Overall, this analysis shows that Asian-, Black-, and Hispanic-led households are more likely to report not having an air conditioning unit in their home compared to White households and keeping their homes at unsafe or unhealthy temperatures. Black- and Hispanic-led households are more likely than Asian- and White-led households to report being unable to use their air conditioning units due to financial challenges and to say they reduced or went without basic needs due to their home energy bills in the past year. Lower income households also are more likely than higher-income households to report these challenges.
More limited access to air conditioning contributes to disproportionate exposure to extreme heat and the development of heat-related illnesses, including death. As extreme heat worsens, strategies to increase access to residential air conditioning units and reduce exposure to extreme heat will be important for reducing the health risks associated with heat-related illnesses and mitigating disparities in these risks and negative health outcomes.
Access to and Use of Air Conditioning
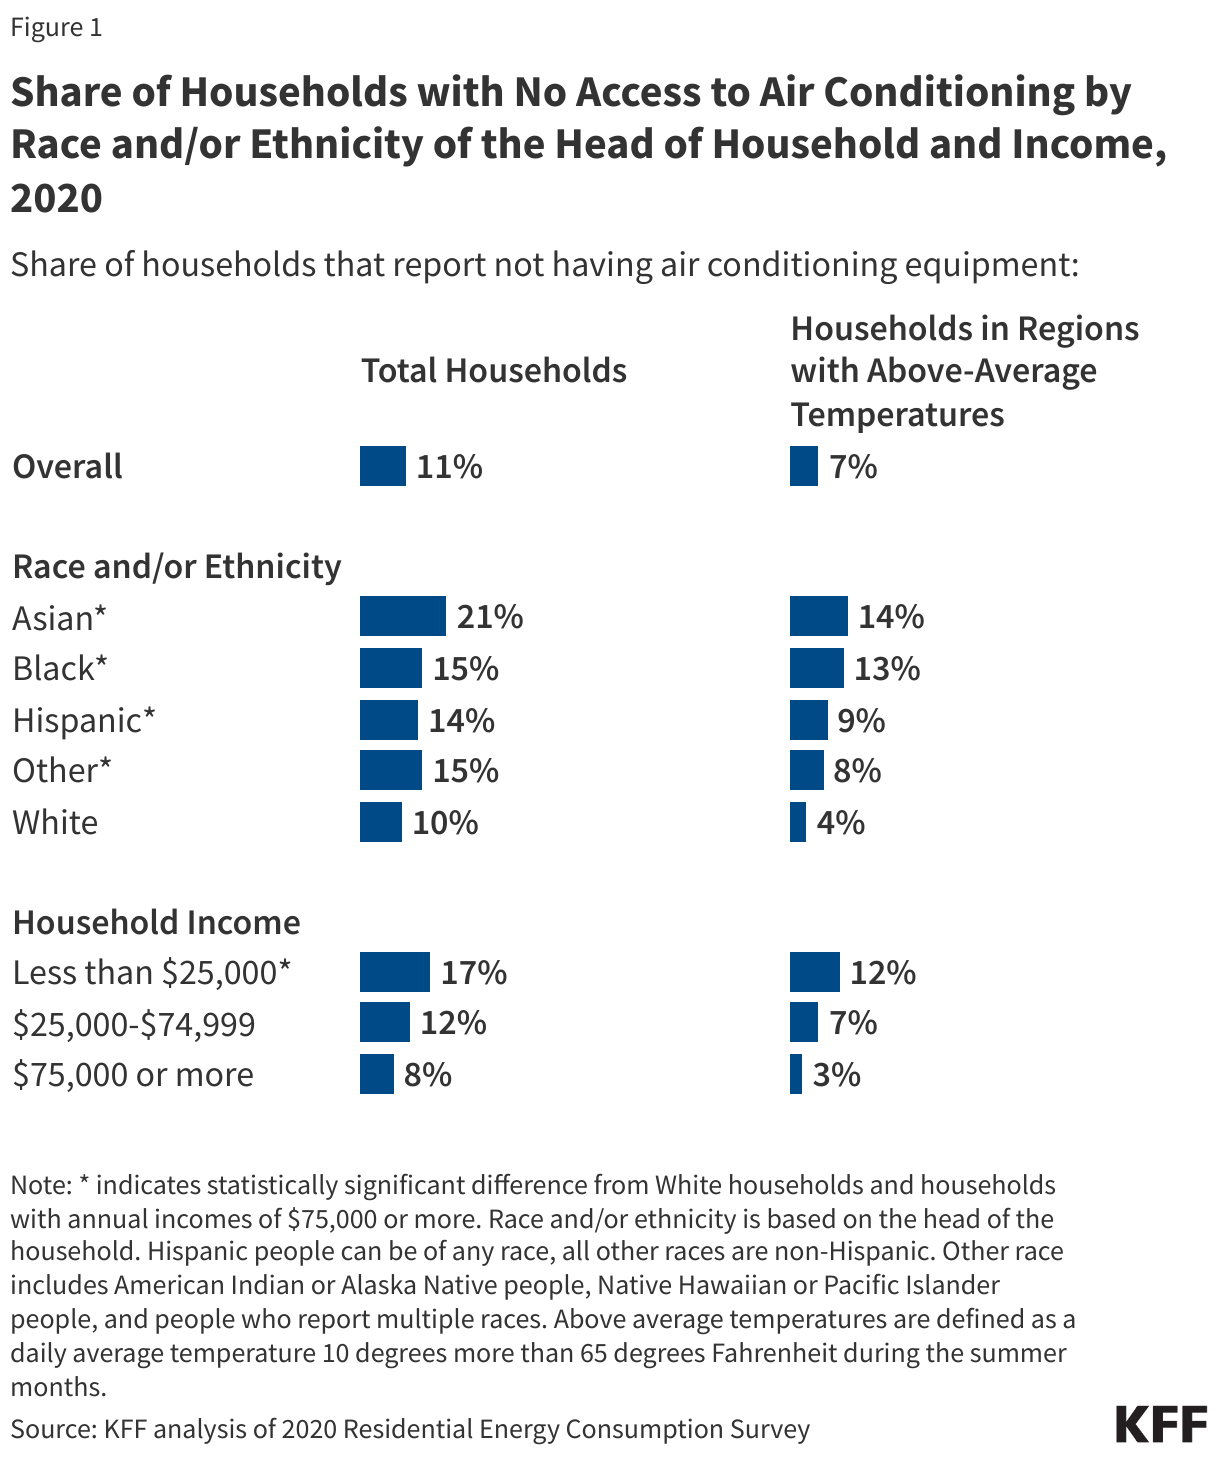
People of color and those with lower household incomes are more likely to say they lack air conditioning than their White and higher income counterparts. In total, over 35 million people in the US report living in a household without an air conditioner, including almost 5 million people with a Black head of household, 6.2 million people with a Hispanic head of household, 3.6 million people with an Asian head of household, and 19.2 million people with a White head of household. One in five (21%) Asian-led households and about one in seven Black (15%) and Hispanic (14%) households do not have air conditioning equipment compared to one in ten (10%) White households. In addition, 17% of households with lower incomes (annual household income of less than $25,000) say they lack air conditioning compared to 8% of households with higher incomes (annual household income of $75,000 or more) (Figure 1). These disparities in access to air conditioning by race and ethnicity and by household income persist when limited to regions with above-average temperatures (see Appendix A), where 7% of households overall lack access.
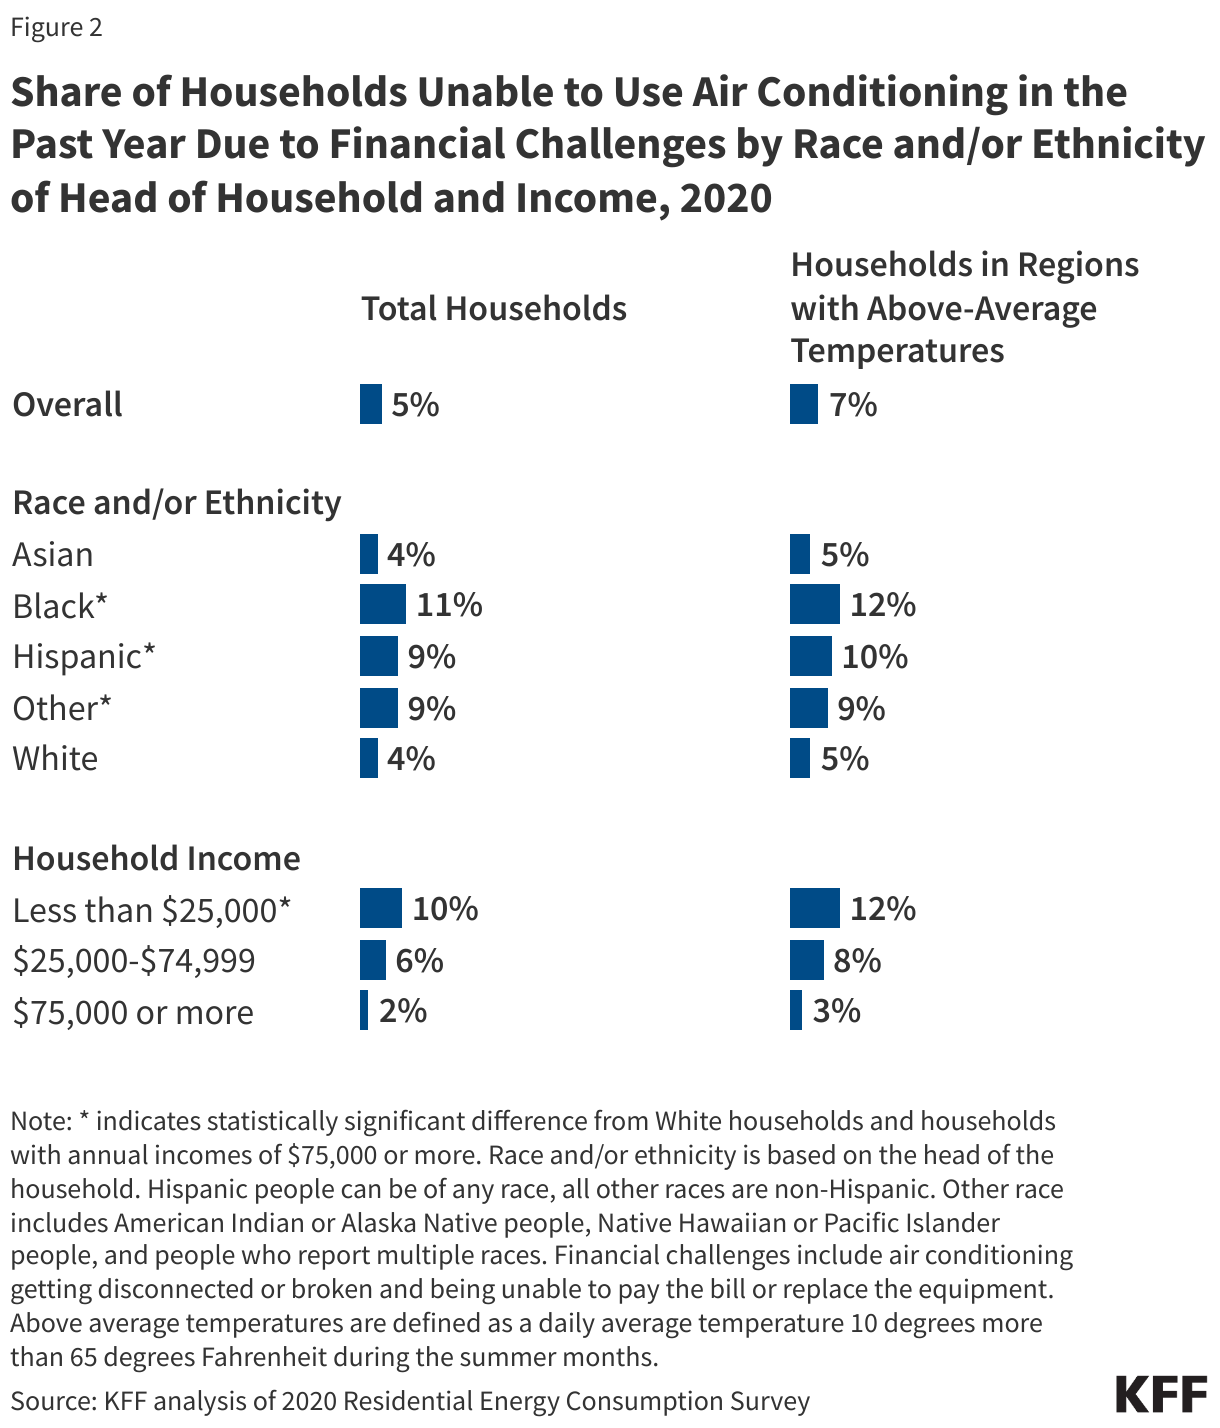
Black and Hispanic households and those with lower incomes are more likely to report not using their air conditioners due to financial challenges compared to White and higher income households. Overall, 5% of households say they were unable to use air conditioning equipment in the past year because their equipment broke and they couldn’t afford to replace it, or their equipment was shut off because they were unable to pay their bills (Figure 2). This includes about one in ten Black (11%), Hispanic (9%), and lower income households (10%) compared to 4% of White households and 2% of higher income households. These disparities persist even in regions with above-average temperatures, where 7% of households say they were unable to use air conditioning equipment due to these reasons.
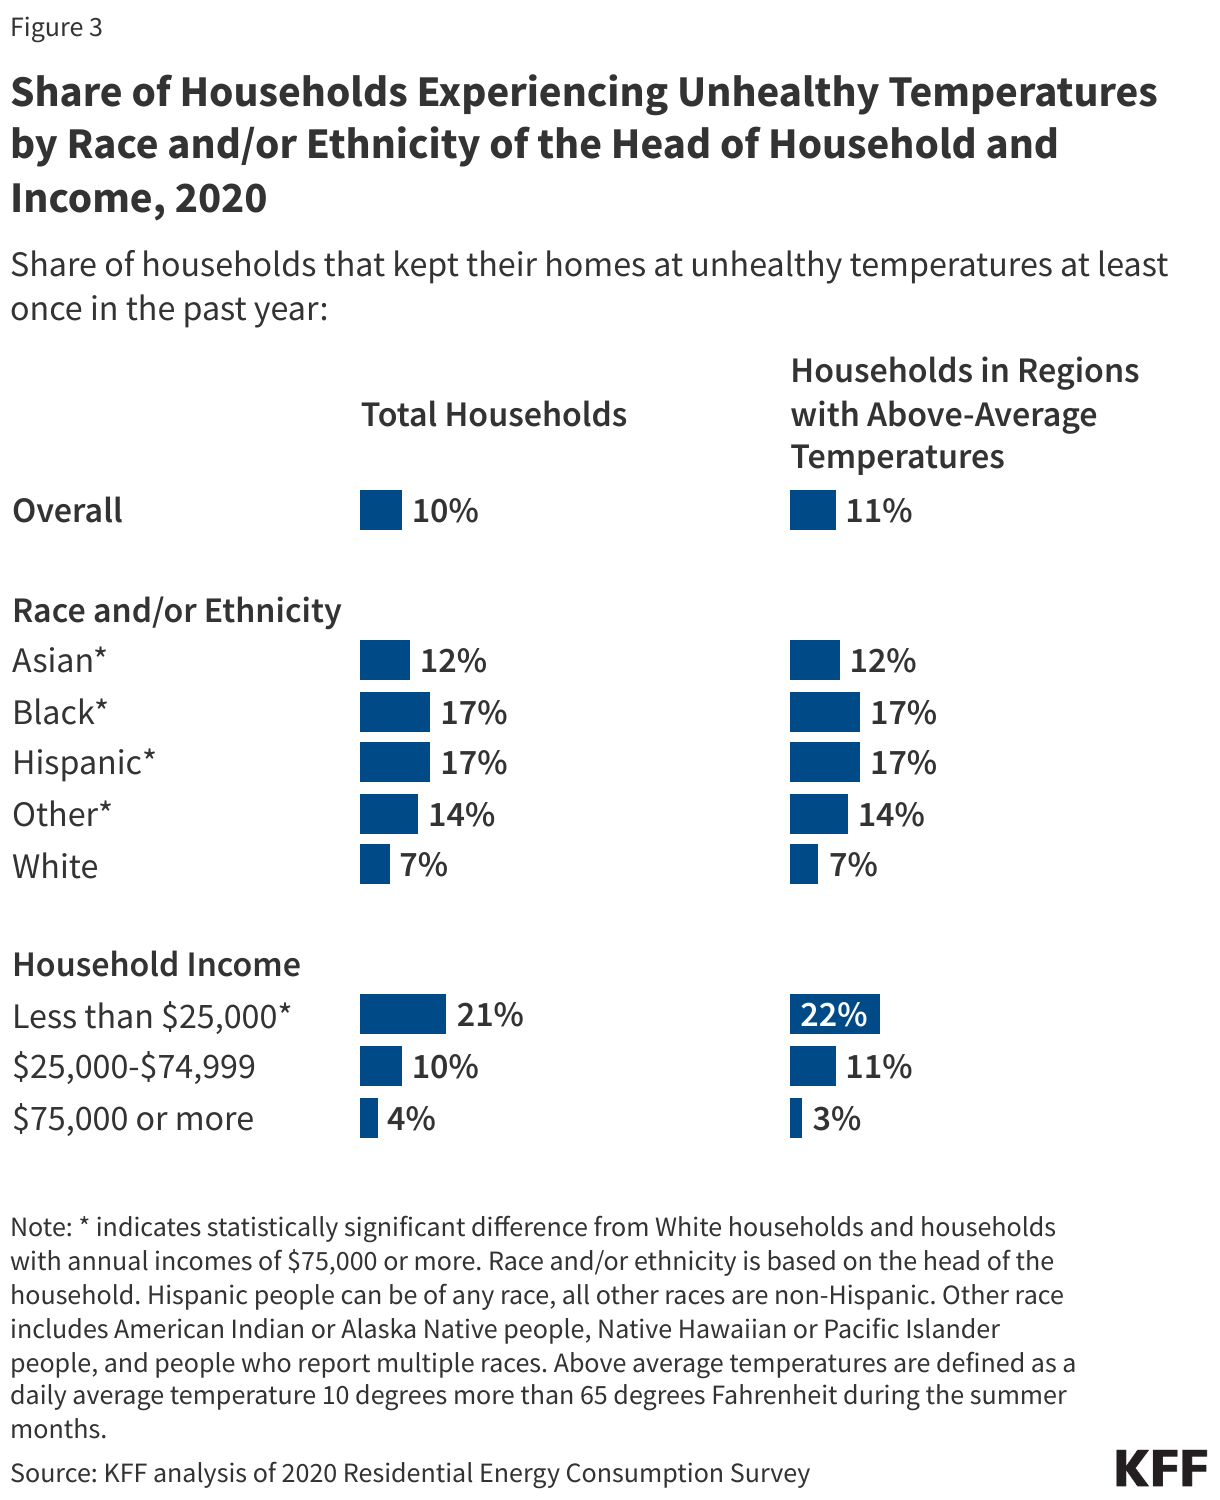
People of color and those with lower household incomes are more likely to say they keep their homes at temperatures they identified as unsafe or unhealthy than their White and higher income counterparts. Overall, one in ten households say they kept their homes at unhealthy temperatures at least once in the past year. This share was higher among Black (17%), Hispanic (17%), and Asian (12%) households compared to White households (7%) (Figure 3). One in five (21%) lower income households also say this compared to 4% of higher income households. These disparities persist even in regions with above-average temperatures.
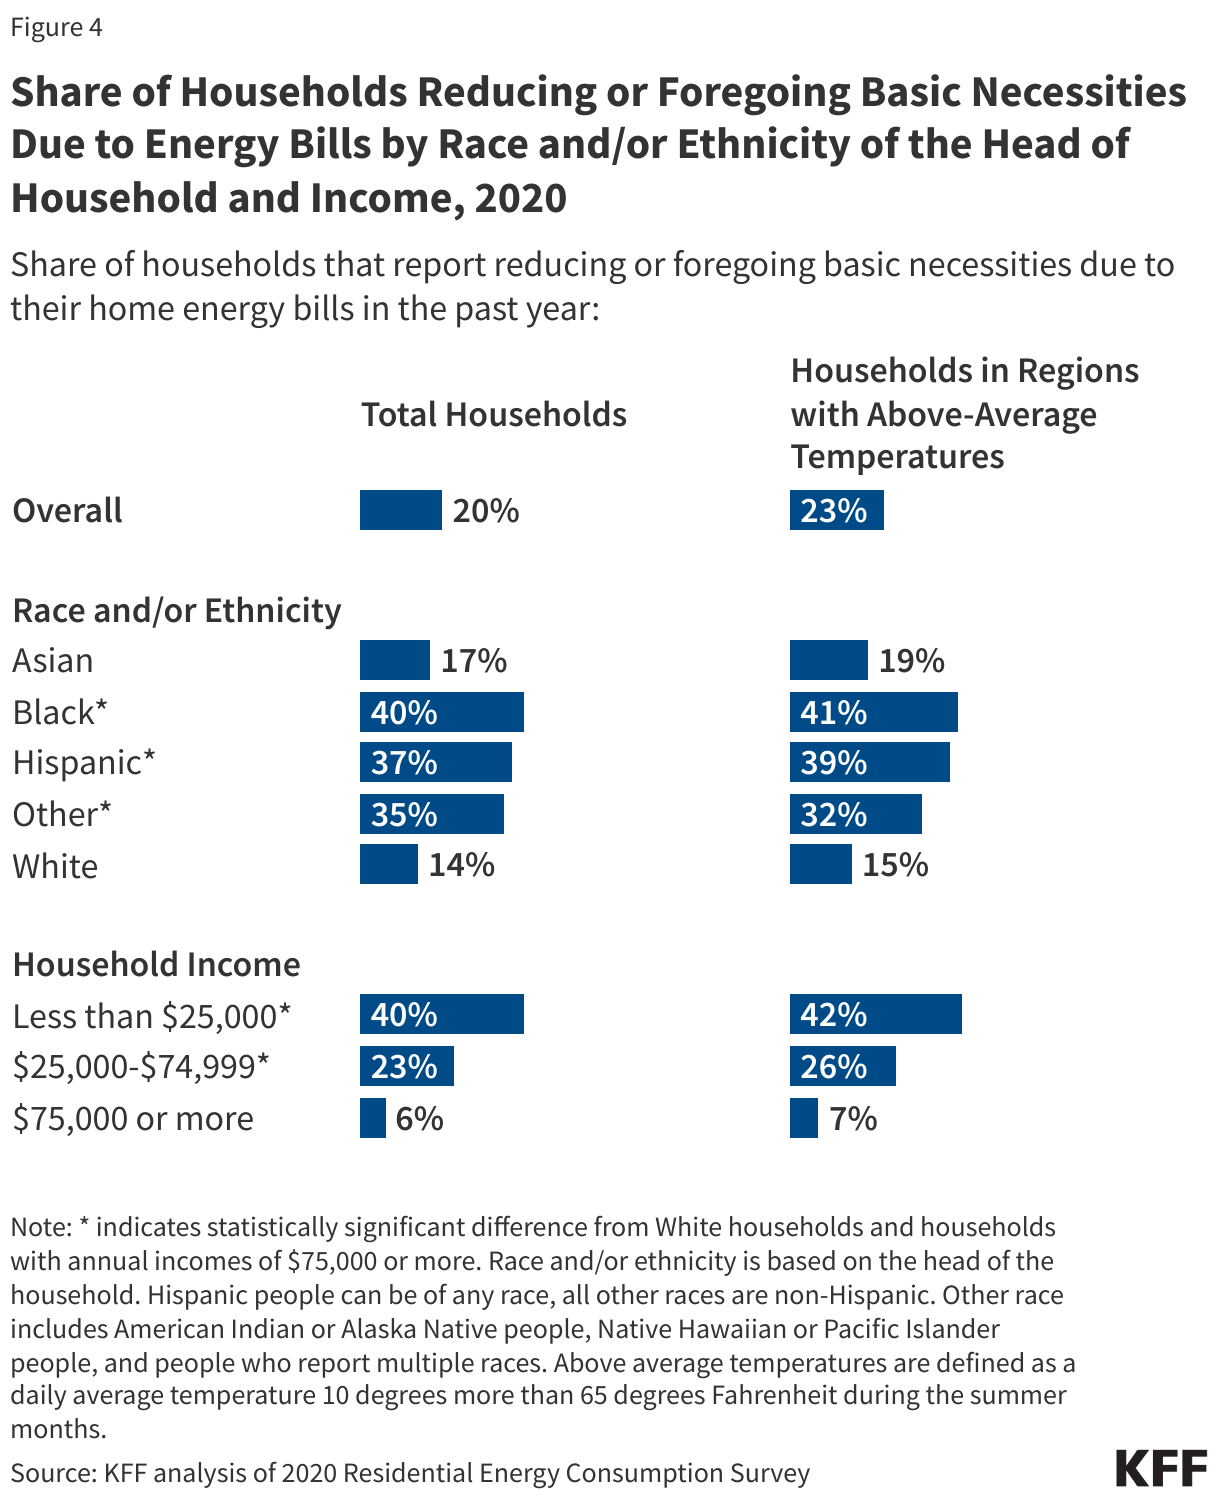
Black, Hispanic, and lower income households also are more likely than White and higher income households to report reducing or foregoing basic needs due to their home energy bills in the past year (Figure 4). About four in ten Black (40%) and Hispanic (37%) households say they had to reduce or forego basic necessities such as medicine or food due to their energy bills in the past year compared to one in seven (14%) White households. Four in ten (40%) lower income households also report this compared to 6% of higher income households. These disparities persist even in regions with above-average temperatures, where almost a quarter (23%) of households say they had to reduce or forgo basic needs due to their energy bills.
Implications for Heat-Related Health Risks
Extreme heat is a serious threat to health and is the leading cause of weather-related deaths in the U.S. An analysis finds that 2023 set the record for the number of heat-related deaths in the U.S., with at least 2,300 death certificates citing the effects of excessive heat as a cause of death. Further, the Centers for Disease Control and Prevention reports that there were 119,605 emergency department visits for heat-related illness in 2023. In 2020, about 660,000 households reported that someone needed medical attention in the past year because their home was too hot.1,2
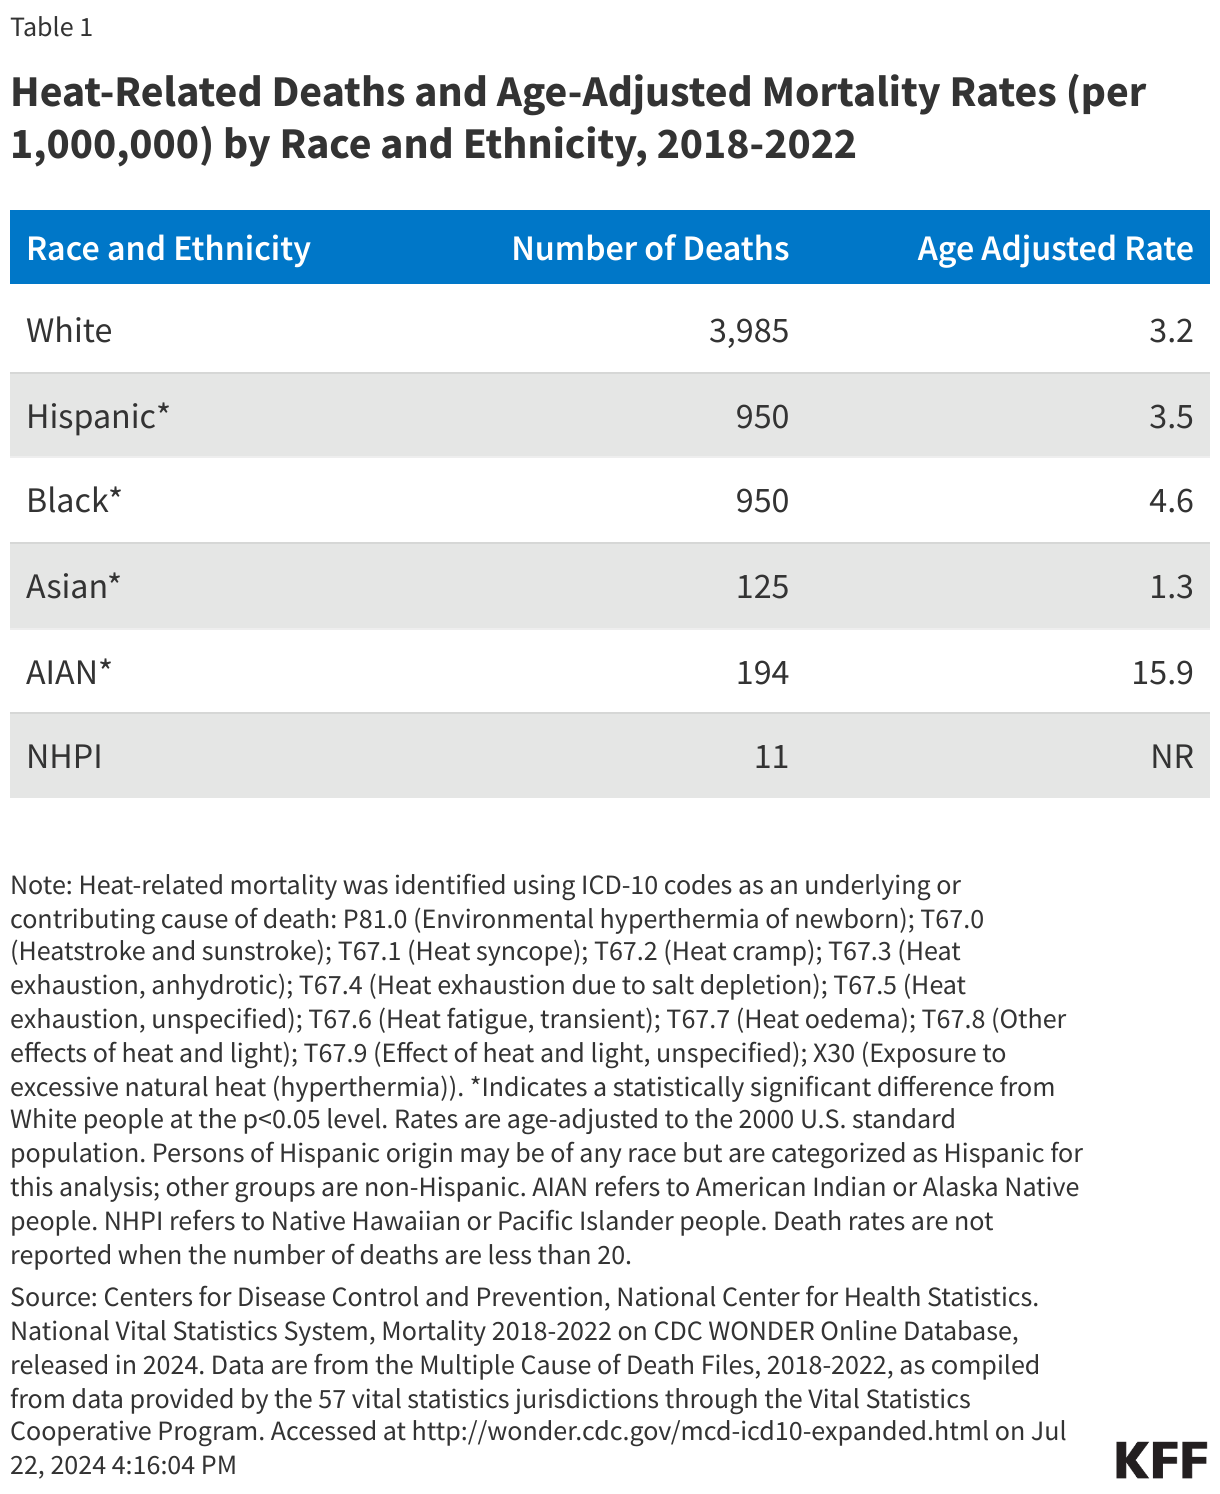
While extreme heat has health implications for everyone in the U.S., some communities of color have higher risks of heat-related mortality than White people due to underlying inequities. Consistent with trends in earlier years, between 2018-2022, American Indian or Alaska Native people had the highest age-adjusted heat-related death rate, and Black people had a higher rate of heat-related deaths compared to White people. The rate for Hispanic people was more similar to that of White people, while Asian people had a lower age-adjusted rate of heat-related death (Table 1).[1]Data also show that noncitizens are more likely to die from heat exposure compared with U.S. citizens. These higher mortality risks reflect increased exposure to heat due to underlying inequities. Historical policies such as redlining have led to the residential segregation of communities of color who have a higher likelihood of living in a census tract with higher summer daytime surface urban heat island intensity compared to their White counterparts. Communities that live in these historically zoned areas are also more likely to have higher rates of asthma,cardiovascular illnesses, and other diseases that increase their risk of poor health outcomes associated with exposure to climate change-related extreme heat and air pollution. Low-income communities and communities of color also suffer from tree inequity, increasing the risk of exposure to extreme heat and subsequent heat-related illnesses.
As temperatures continue to rise, U.S. power grids may be unable to support the surges in energy use due to increases in air conditioning usage during heat wave events. Power outages that are considered medically relevant—lasting more than 8 hours and outlasting the lifespan of most medically necessary devices— tend to most frequently happen during the spring and summer months. They also tend to occur during severe weather or climate events, and during times of high electricity usage. These power outages can leave people without air conditioning or heating for extended periods of time, potentially increasing the risk of adverse health outcomes. In November 2023, the Biden-Harris administration announced up to $3.9 billion to strengthen the country’s electric grid’s resilience and reliability against climate change and extreme weather events.
As extreme heat worsens, strategies to increase access to residential air conditioning units and reduce exposure to extreme heat will be important for reducing the health risks associated with heat-related illnesses and mitigating disparities in these risks and negative health outcomes. There have been efforts to increase access to air conditioning units, which have played an important role in reducing heat-related deaths. In 2023, the Biden-Harris administration released about $3.7 billion in Low Income Home Energy Assistance Program (LIHEAP) funding that helps families sustain safe and healthy indoor temperatures. LIHEAP funds can also help households pay for energy bills and help them stay cool during the summer through the LIHEAP Cooling Assistance Program. In June 2024, the U.S. Department of Housing and Urban Development (HUD) announced new guidance on the use of HUD funding to reduce the impacts of extreme heat on residents of public housing. The guidance seeks to reduce the energy costs associated with cooling their homes during heat waves by increasing utility allowances and forgoing surcharges for the use of air conditioning for residents. HUD and the U.S. Department of Agriculture also announced the adoption of minimum energy standards for new single-family and multi-family unit homes that will reduce energy use and maximize energy cost-savings for residents. Continued efforts to address rising temperatures, reduce risks of heat exposure, and increase protections for those most at-risk for heat exposure will be important for reducing negative health impacts due to extreme heat, particularly for groups who already face disparities in exposure to heat and health risks.
Methods
This analysis was conducted using data from the Residential Energy Consumption Survey, conducted by the U.S. Energy Information Administration. It is administered to a nationally representative sample of housing units. Both web and mail forms were utilized in survey implementation. 18,500 households were surveyed from a survey population of 123.5 million primary residences. The survey respondent was identified as head of the household, and all demographic questions were asked only of that respondent. For example, in the instance of a household with people of different races, the recorded race and ethnicity is only the race or ethnicity of the respondent, not any other member of the household. Analysis was conducted in R using the survey package. Survey design was implemented based on analysis by Anthony Damico. Above average temperatures are defined as places with cooling degree days greater than or equal to the median (1143). Cooling degree days (CDD) are calculated by taking the 30-year average temperature (between 1981 and 2010) from the nearest weather station to the respondent and inoculating it with random errors. This measurement is defined as a summation of the difference between 65 degrees Fahrenheit and a day with a mean temperature above 65 degrees Fahrenheit for every day during a given year. For example, if the mean temperature is 80 degrees, then that day would have a cooling degree day value of 15. This measure identifies places that have both consistently high temperatures, and those with days much hotter than 65 degrees. Another explanation is if a region has the same number of cooling degree days as the median (1143), this could be equivalent to that area’s average daily temperature being 77 degrees Fahrenheit (12 degrees above 65) every day during the summer months. Population totals were scaled to the United States population in 2020 from the Decennial Census. Individuals in group quarters were subtracted from this population to represent individuals in households.
Appendix A
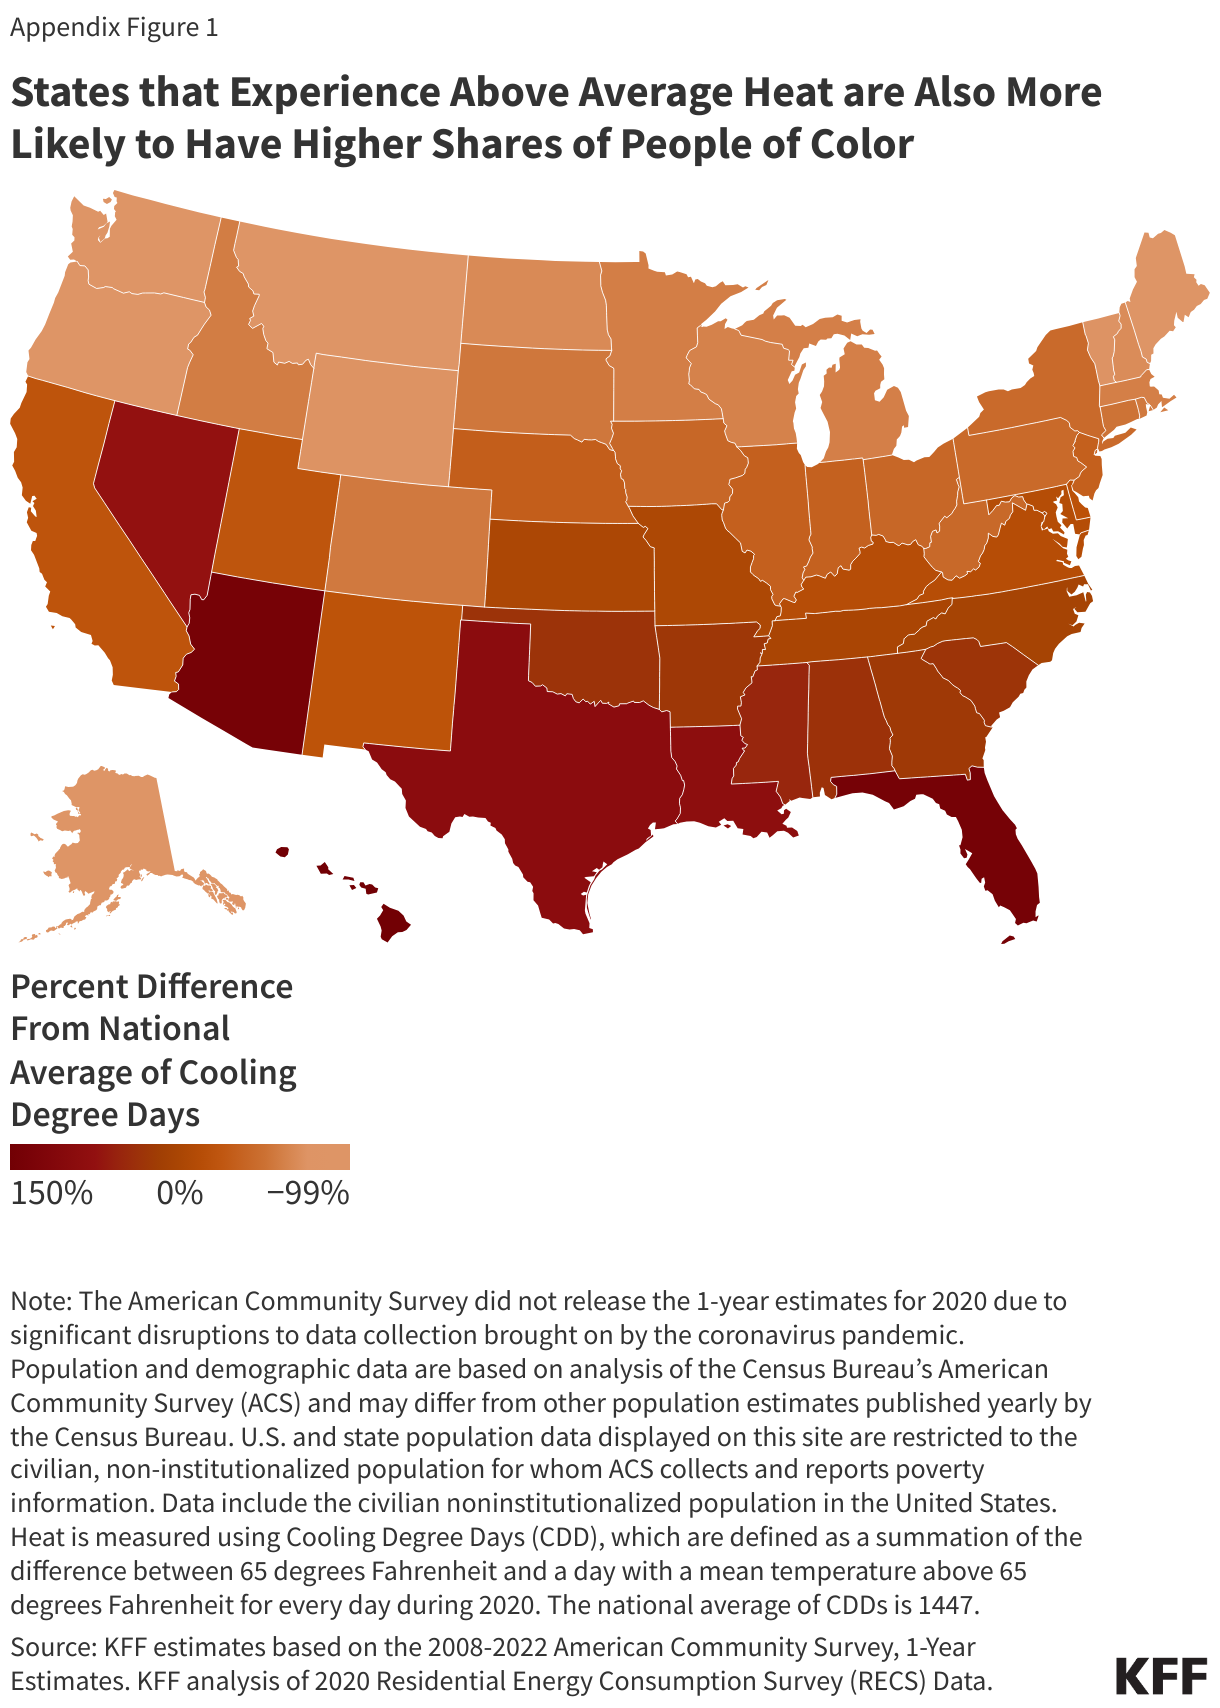
A majority of states (35 states) have households that are in the top 50 percent of hottest places in the U.S. In 2023, the West, South Central, and South Atlantic regions of the United States were identified as places with at least one household with above average heat.3 Some of the hottest states that frequently experience a higher number of Cooling Degree Days (CDDs) than the national average also have high shares of people of color, including Hawaii, which experiences +145% CDDs above the national average and about eight in ten (81%) of its population are people of color, Florida, which experiences +141% CDDs above the national average and about half (49%) of its population are people of color, and Texas, which experiences +92% CDDs above the national average and about six in ten (61%) of its population are people of color. Similar trends are seen in states with the highest shares of people who live below the Federal Poverty Line (FPL), including Louisiana, which experiences +86% CDDs above the national average and Mississippi, which experiences +51% CDDs above the national average and about one in five (both at 19%) of the population live below the FPL (Appendix Figure 1).
It is well documented that the measured number of deaths associated with extreme heat is likely an undercount. Deaths associated with heat-related illness or extreme heat may not be captured on death certificates, while heat may be a contributing factor to death the underlying cause may be listed as a cardiovascular or respiratory event or other underlying diagnosis. These values are likely underestimates of the number of deaths caused by exposure to extreme heat. ↩︎
KFF analysis of 2020 Residential Energy Consumption Survey. ↩︎
The latest KFF Health Misinformation Tracking Poll finds that about two-thirds of adults say they have used or interacted with artificial intelligence (AI), though a smaller share – about one-third – say they do so at least a few times a week. Most adults (56%) are not confident that they can tell the difference between what is true and what is false when it comes to information from AI chatbots. Even among those who use or interact with AI, half say they are not confident in their ability to tell fact from fiction when it comes to information from chatbots.
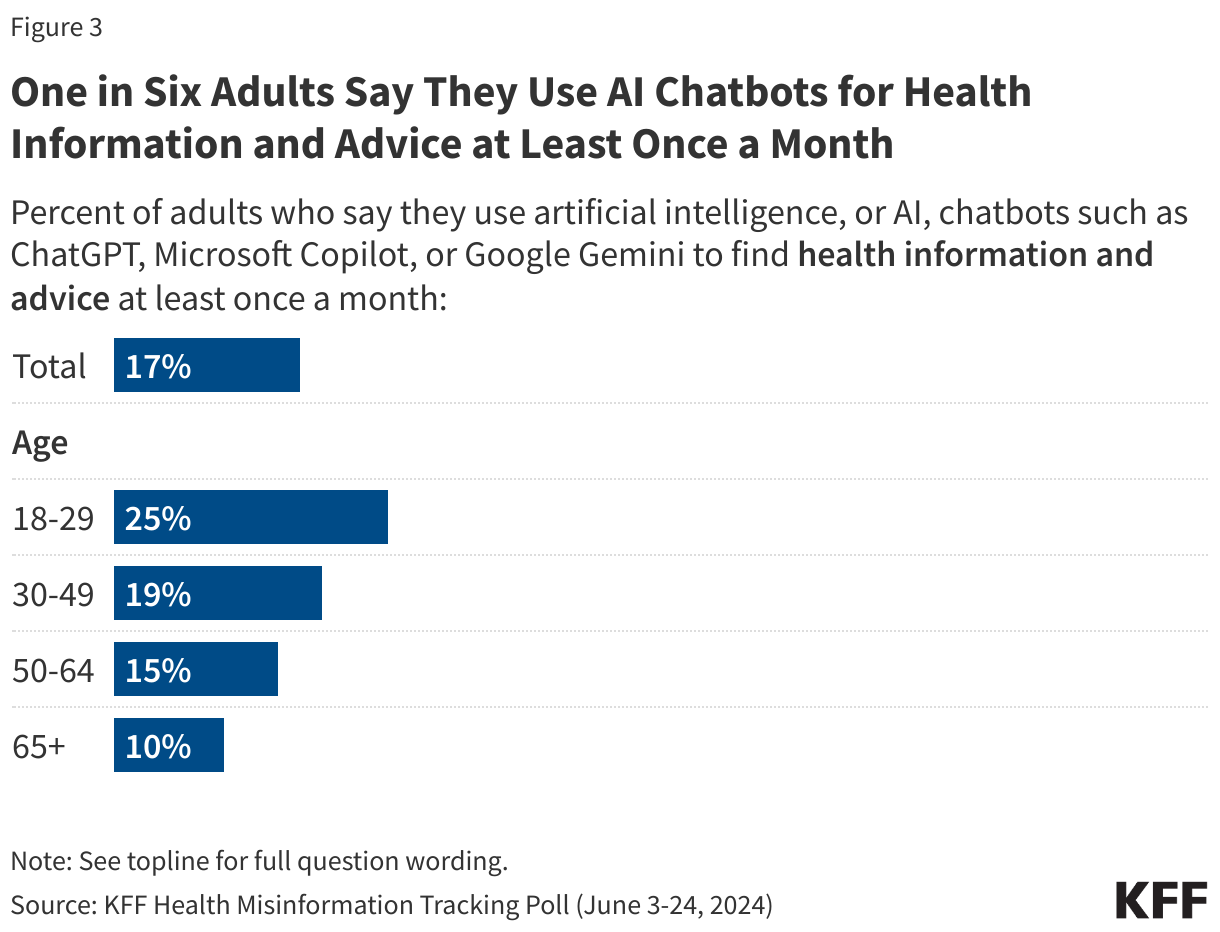
About one in six adults (17%) say they use AI chatbots at least once a month to find health information and advice, rising to one quarter of adults under age 30 (25%).
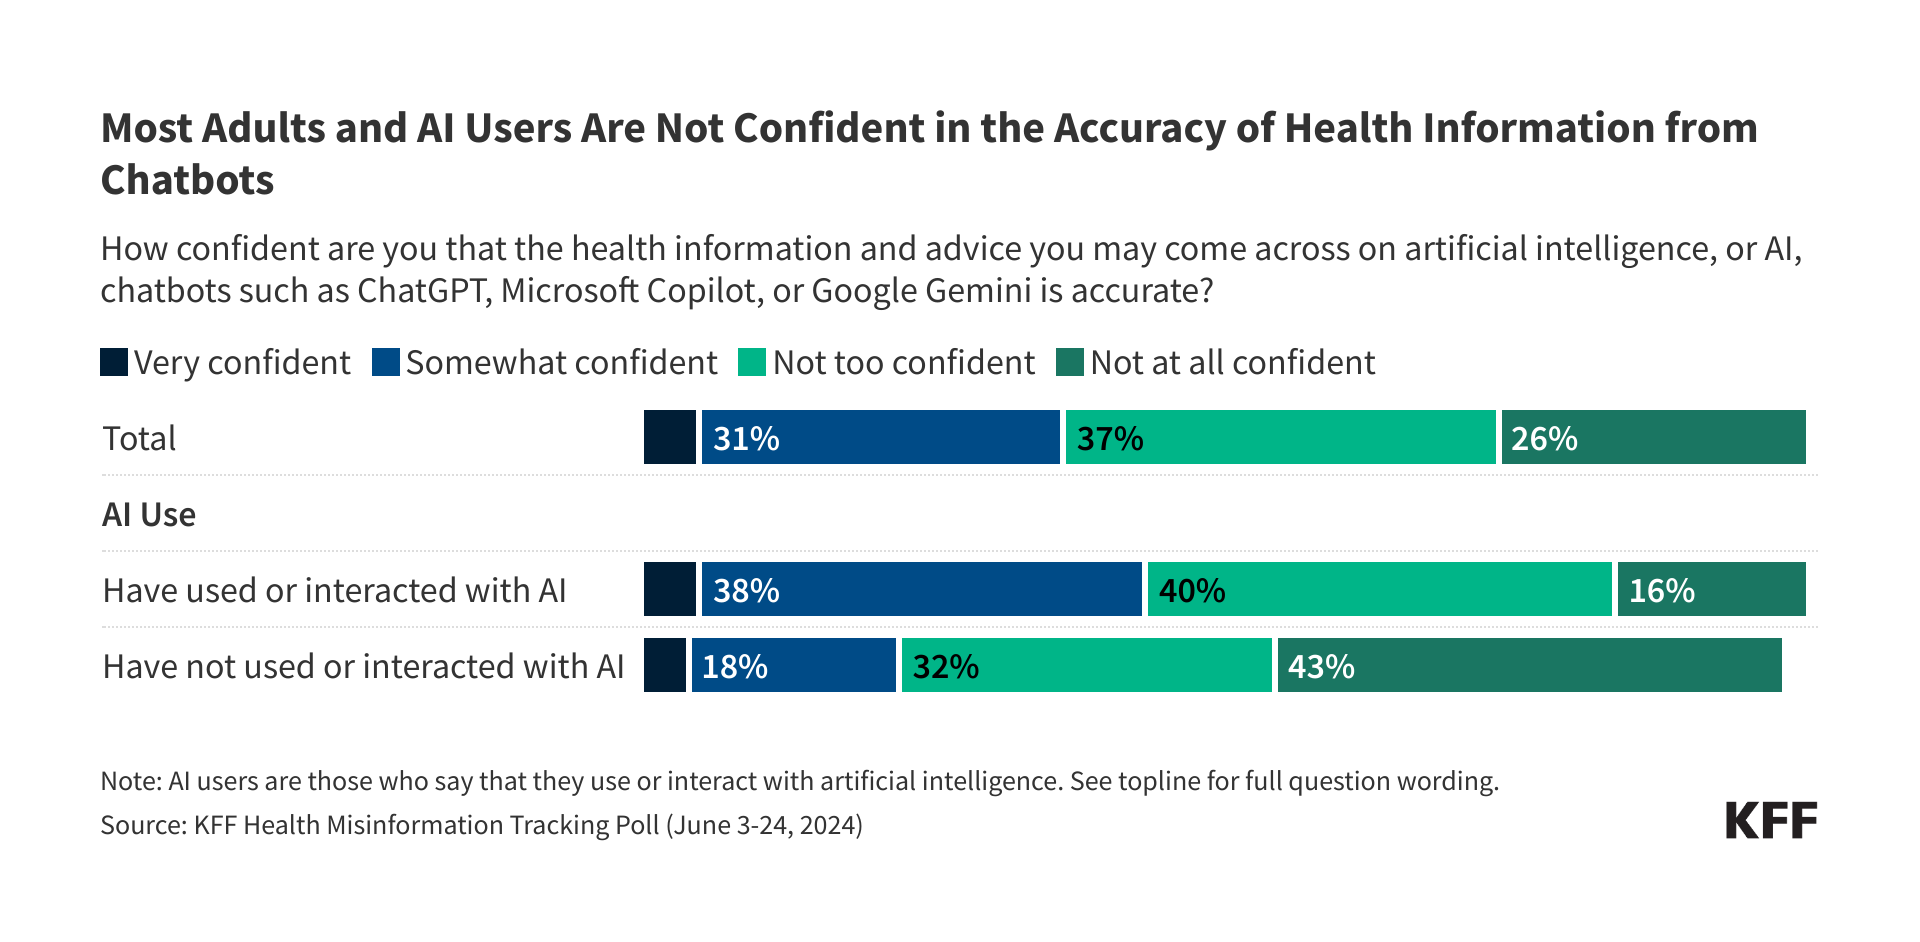
Most adults – including a majority (56%) of those who use or interact with AI – are not confident that health information provided by AI chatbots is accurate. While about half of the public say they trust AI chatbots, such as ChatGPT, Microsoft CoPilot, or Google Gemini, to provide reliable information on practical tasks like cooking and home maintenance and on technology, fewer say they trust chatbots to provide reliable health (29%) or political information (19%). Even among those who use AI, small shares say they trust chatbots to provide reliable information about health (36%) or politics (24%).
For most of the public, the verdict is still out on whether AI is doing more to help or doing more to hurt people trying to find accurate health information online. About one in five adults (23%) say AI is doing more to hurt those seeking accurate health information while a similar share (21%) say it is doing more to help those efforts. However, a majority of the public (55%) – including half of those who use or interact with AI (49%) – say they are unsure of the impact of AI on health information seekers.
A Third of the Public, and Nearly Half of Younger Adults, Say They Use or Interact with AI At Least Several Times A Week
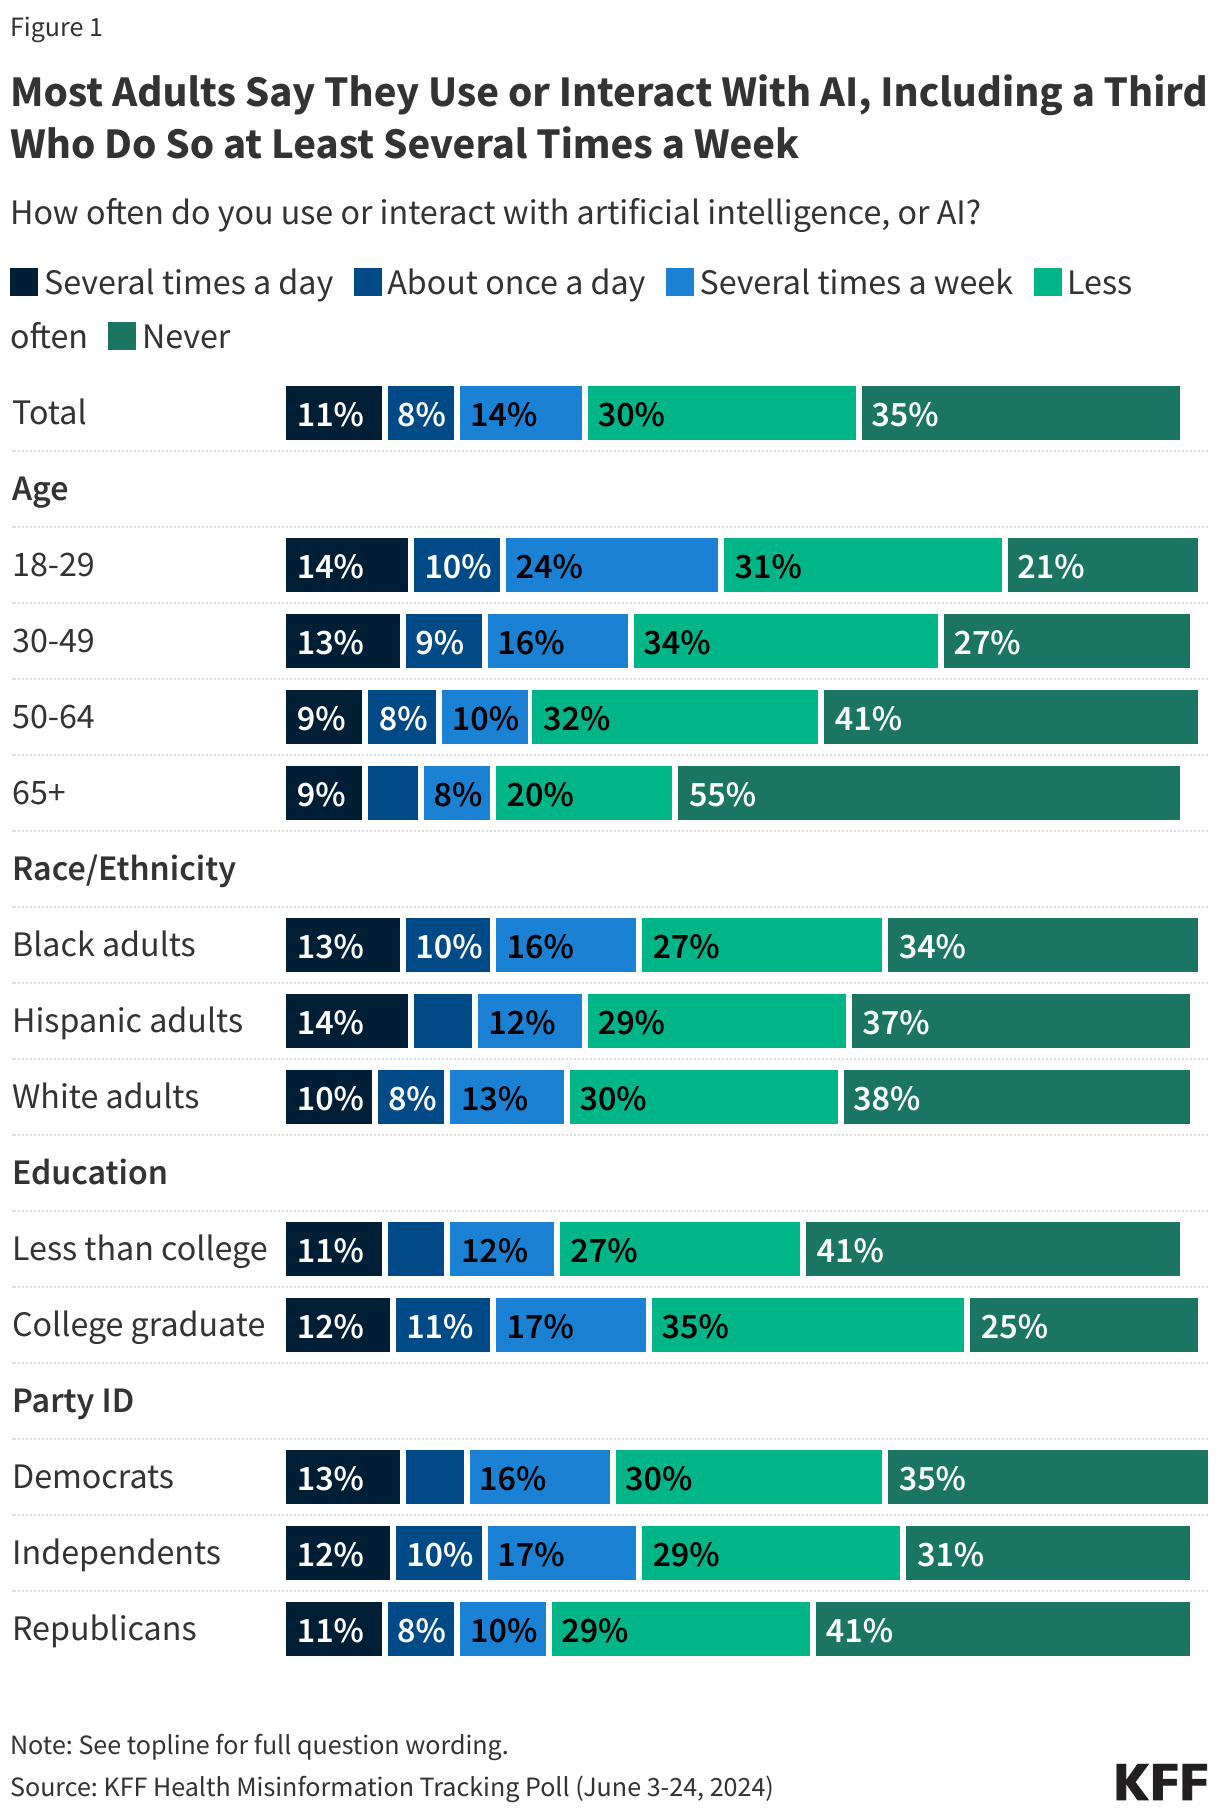
Amidst the growing use of artificial intelligence by both companies and individuals, most adults (64%) say they have used or interacted with AI, though just one in three (34%) say they do so at least several times a week, including one in ten (11%) who say they interact with or use AI several times a day. About one-third of the public (35%) say they never use or interact with AI. However, as AI features become increasingly integrated into internet search engines such as Google and social media platforms such as Facebook and Instagram, these shares may not capture adults who are unknowingly using or interacting with artificial intelligence on these platforms. Perhaps unsurprisingly, younger adults ages 18-29 (47%) and those with a college degree (39%) are more likely than their counterparts to say they use or interact with AI at least several times a week.
Most Adults are Not Confident They Can Tell Whether Information from AI Chatbots Is True or False
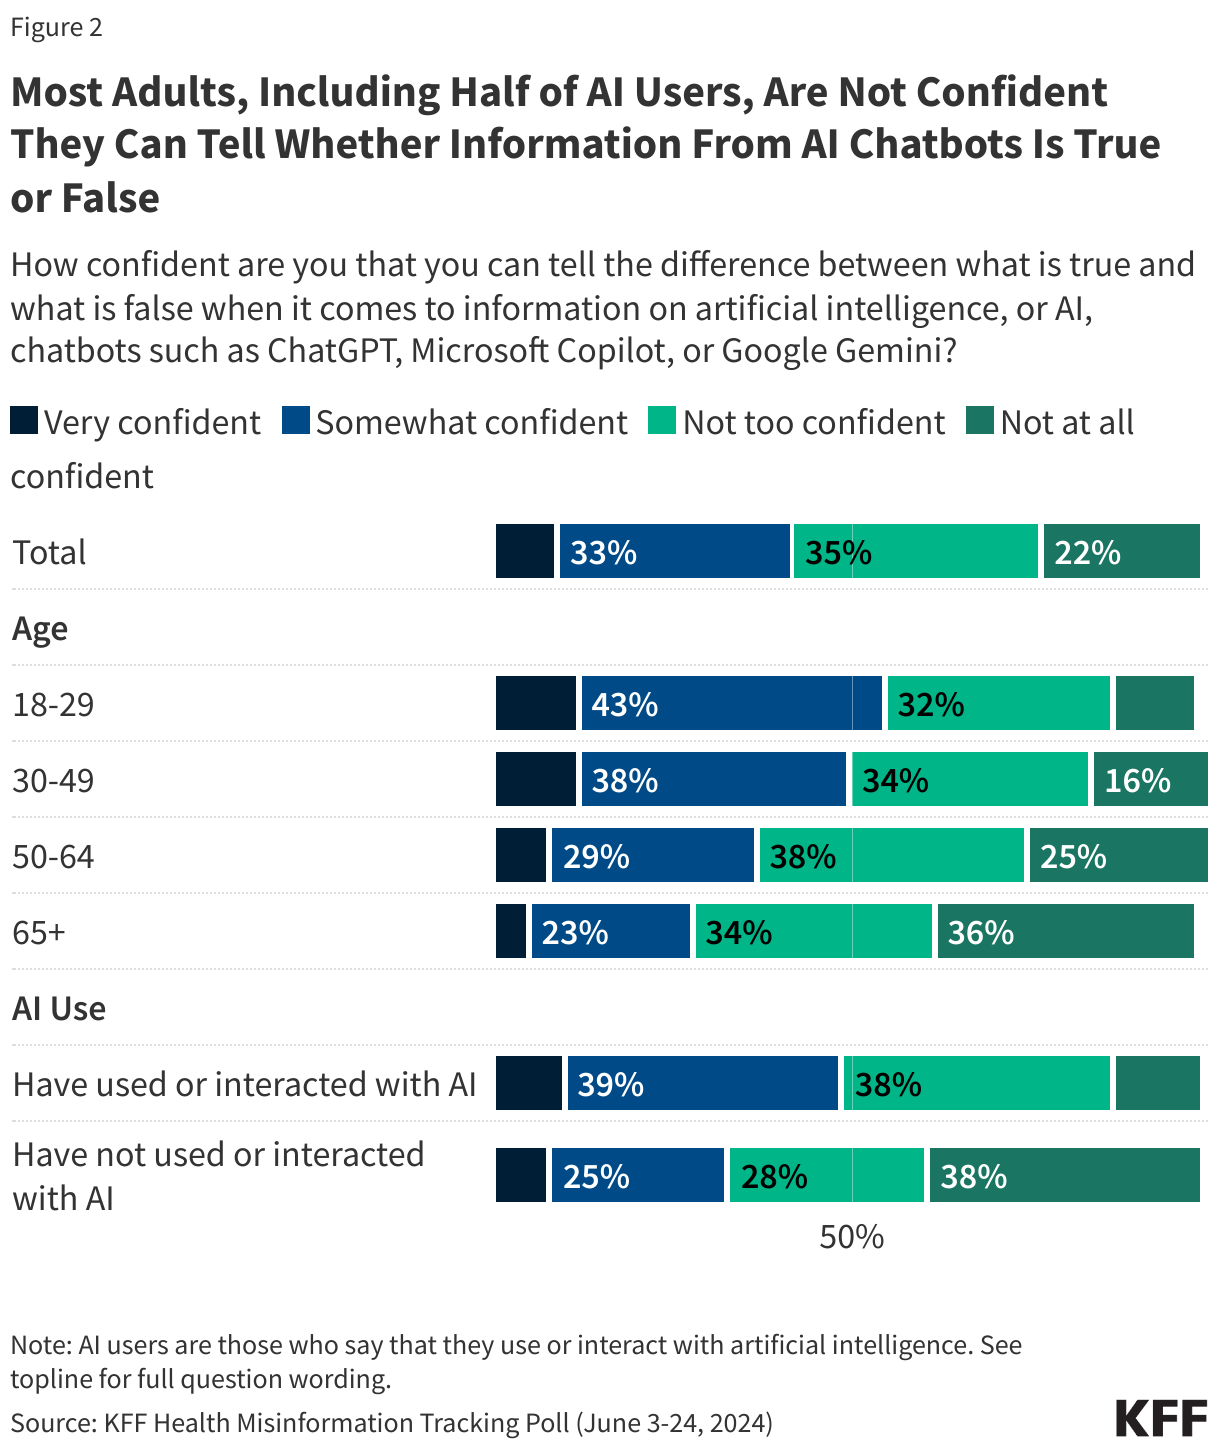
Most U.S. adults are not confident that they can tell what is true versus what is false when it comes to information from AI chatbots, such as Chat-GPT and Microsoft Copilot. Fewer than half say they are either “very confident” (9%) or “somewhat confident” (33%) that they can tell the difference between true and false information from an AI chatbot, while a majority say they are either “not too confident” (35%) or “not at all confident” (22%). While adults who say they have used or interacted with AI are more likely than non-users to say they are at least somewhat confident in their ability to tell fact from fiction in information from AI chatbots (49% vs. 32%), even among users of this technology, half say they are not confident they can tell what is true from what is false.
Corresponding to their greater propensity to use AI platforms, younger adults are more likely than older adults to express confidence in their own ability to tell truth from fiction on these platforms. Notably, seven in ten adults ages 65 and over say they are not confident they can tell whether information is true or false on AI chatbots. This difference in confidence across age groups persists among AI users as well, with younger adults ages 18-49 who use or interact with AI reporting higher levels of self-confidence in their abilities to detect true and false information from AI chatbots than their counterparts ages 50 and older (54% vs. 41%).
One in Six Adults – and a Quarter of Young Adults – Say They Use AI Chatbots At Least Once a Month for Health Information and Advice
About one in six adults (17%) report that they use AI chatbots at least once a month to find health advice and information. Reflecting their greater use of AI overall, younger adults are more likely than older adults to say they use chatbots for health information, with a quarter (25%) of adults ages 18-29 saying they do this at least once a month.
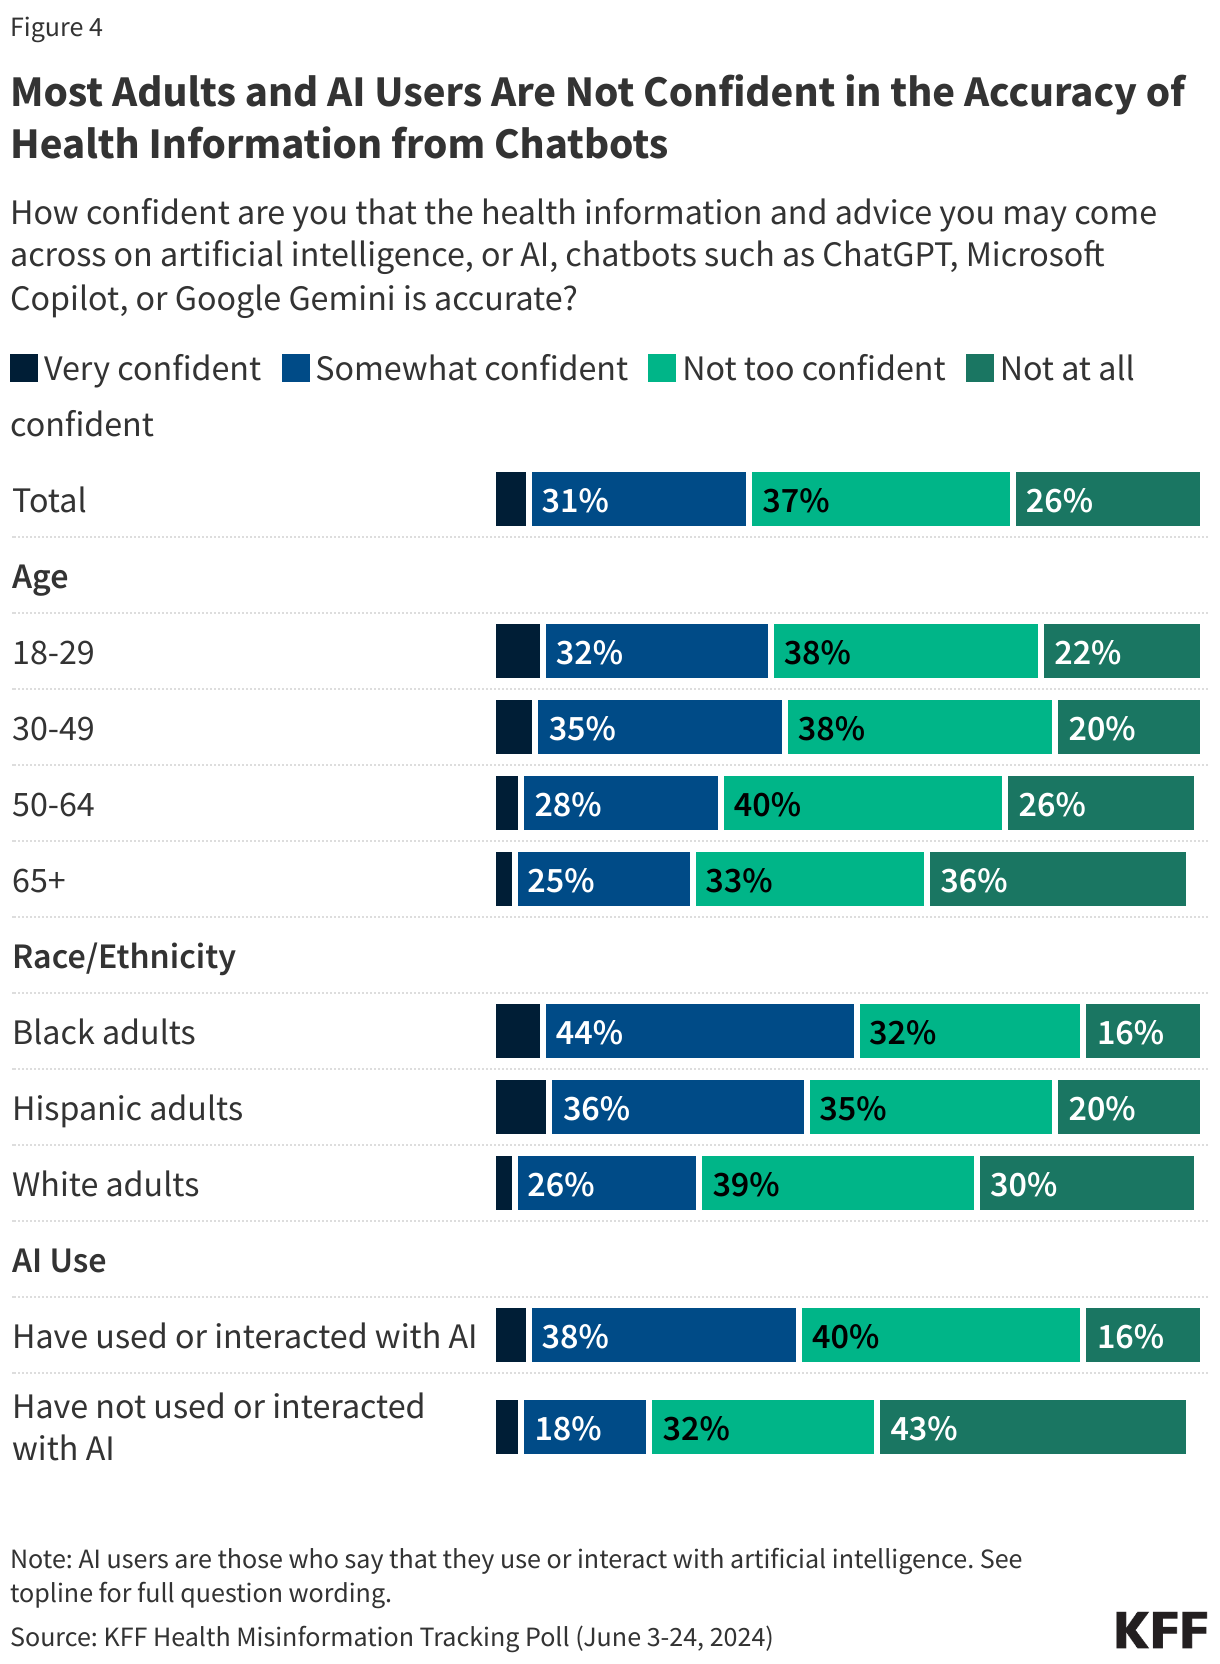
Most Adults – Including Most AI Users – Are Not Confident That Health Information Provided by AI Chatbots is Accurate
When it comes to health information, the public is not yet convinced that AI chatbots can provide accurate information. Just one in three adults say they are “very confident” (5%) or “somewhat confident (31%) that the health information and advice they may come across on AI chatbot platforms is accurate. About six in ten adults – including a majority (56%) of AI users – say they are “not too confident” or “not at all confident” in the accuracy of health information provided by AI chatbots. Adults under age 50 and Black and Hispanic adults are somewhat more likely than those over age 50 and White adults, respectively, to say they have confidence in the accuracy of health information from AI chatbots, though about half or more across age and racial and ethnic groups say they are not confident.
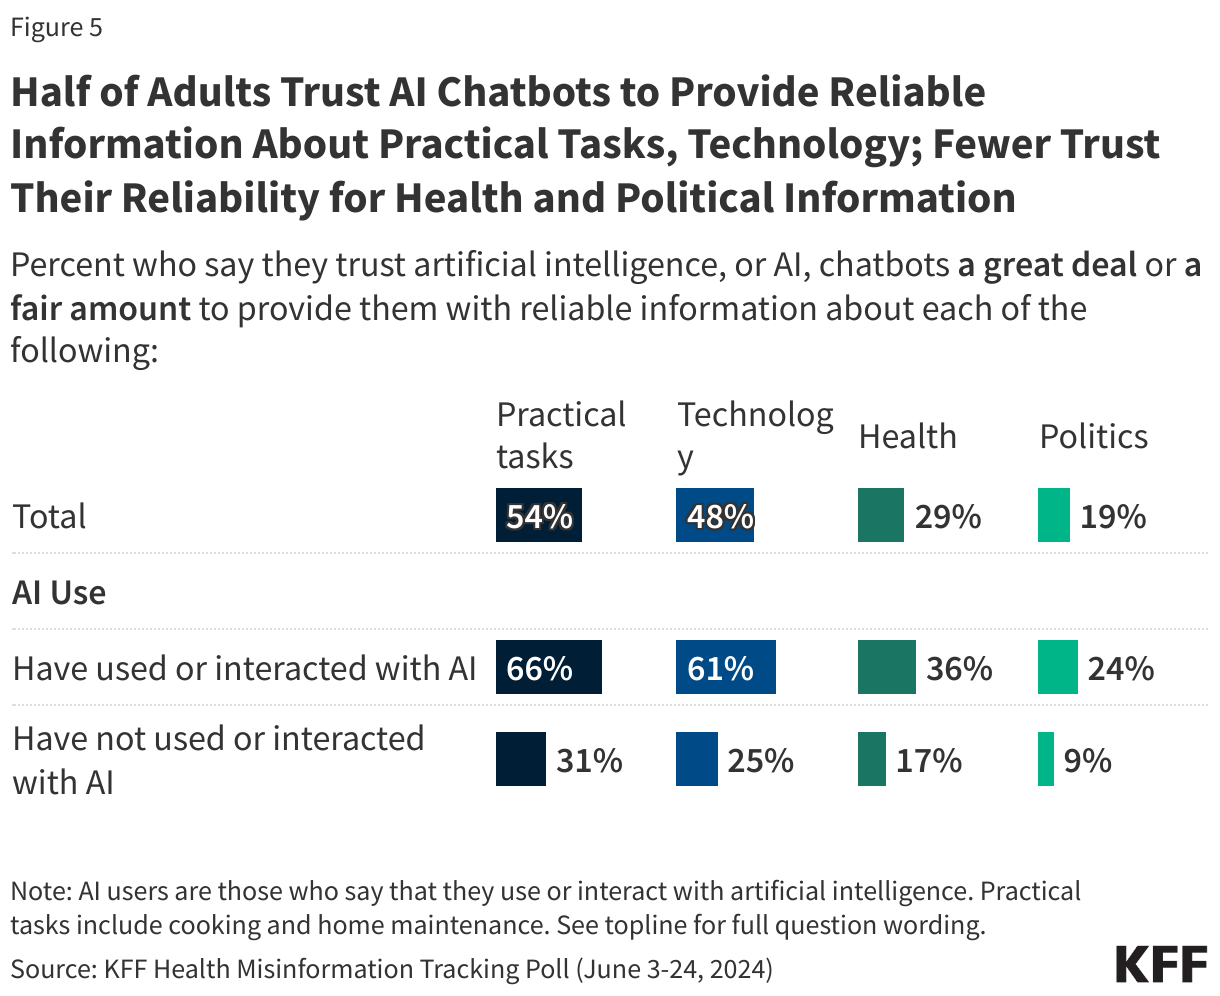
Though the public is skeptical of health information from AI chatbots, larger shares say they trust AI bots to provide reliable information about other topics, including technology and practical tasks like cooking or home maintenance. Just over half of adults say they have at least “a fair amount” of trust in AI chatbots to provide reliable information about practical tasks (54%), while nearly half trust them to provide reliable information about technology (48%). However, about three in ten adults trust AI bots to provide reliable health information (29%) and one in five trust them for information about politics (19%). Trust is higher among those who use AI, with at least six in ten AI users saying they trust chatbots to provide reliable information about practical tasks and technology. Still, small shares of AI users say they trust chatbots to provide reliable information about health (36%) or politics (24%).
The Public Is Uncertain Whether AI Will Help or Hurt People Trying to Find Accurate Health Information
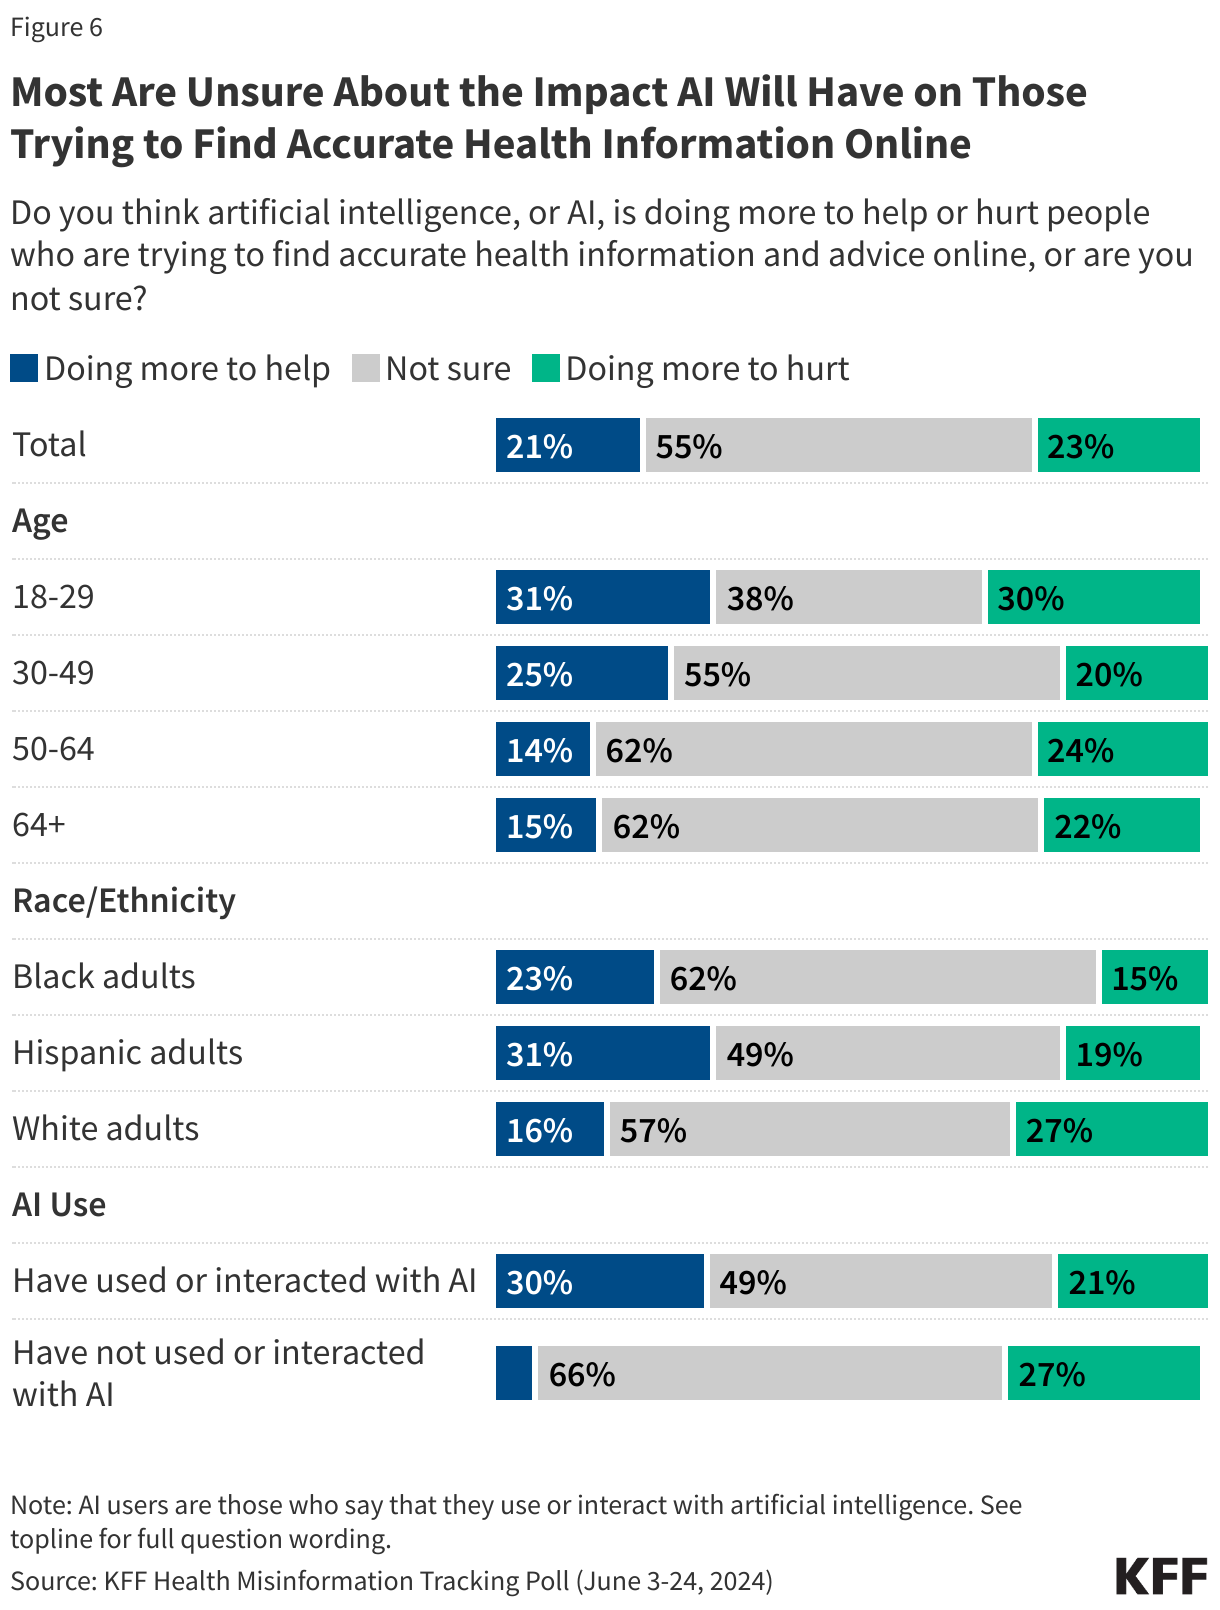
At this early stage in the development of consumer-facing, generative AI models, many are uncertain if these technologies are having a positive or negative impact on those seeking health information online. Over half (55%) of adults say they are not sure if AI is doing more to help or to hurt those who are trying to find accurate health information and advice online, while about one in five say they think it is doing more to help (21%) and a similar share say it is doing more to hurt (23%) these efforts. Younger adults under age 30 are divided on whether AI is doing more to help (31%) or hurt (30%) those trying to find health information and advice online, with 38% saying they are unsure; whereas majorities of adults over age 30 say they are unsure of the impact of AI when it comes to people trying to find accurate health information.
Notably, even among the people who are utilizing this technology, there is still a lot of skepticism, as three in ten AI users (30%) think it is doing more to help people trying to find accurate health information while one in five (21%) say it is doing more to hurt those efforts and about half of AI users (49%) are unsure.
Methodology
This KFF Health Misinformation Tracking Poll was designed and analyzed by public opinion researchers at KFF. The survey was conducted June 3 – 24, 2024, online and by telephone among a nationally representative sample of 2,428 U.S. adults in English (2,358) and Spanish (70).
The sample includes 2,021 who were reached through an address-based sample (ABS) and completed the survey online (1,799) or over the phone (222). An additional 407 respondents were reached through a random digit dial telephone (RDD) sample of prepaid (pay-as-you-go) cell phone numbers. Marketing Systems Groups (MSG) provided both the ABS and RDD sample. All fieldwork was managed by SSRS of Glen Mills, PA; sampling design and weighting was done in collaboration with KFF.
Both ABS and RDD samples were stratified to increase the likelihood of reaching certain populations. To increase the likelihood of reaching households with Hispanic and Black adults in the ABS sample, Census block groups with higher shares of Hispanic and Black populations were oversampled. The ABS sample was also stratified based on model-based prediction of household-members’ party identification (Republican, Democratic, or independent). The prepaid cell phone sample was disproportionately stratified to reach Hispanic and non-Hispanic Black respondents, based on the likely county associated with phone numbers.
Respondents received a $10 incentive for their participation, with interviews completed by phone receiving a mailed check and web respondents receiving a $10 electronic gift card incentive.
A series of data quality checks were run on the final data. The online questionnaire included two questions designed to establish that respondents were paying attention and cases were monitored for data quality including item non-response, mean length, and straight lining. Cases were removed from the data if they failed two or more of these quality checks. Based on this criterion, five cases were removed.
The combined ABS and cell phone samples were weighted to match the sample’s demographics to the national U.S. adult population using data from three sources: the Census Bureau’s 2023 Current Population Survey (CPS), the 2021 Census Planning Database, and the 2023 National Public Opinion Reference Survey (NPORS). The combined sample was weighted by sex by age, sex by education, age by education, race/ethnicity by education, education, race, census region, population density, and frequency of internet usage. The weights also take into account differences in the probability of selection for each sample type (ABS and prepaid cell phone). This includes adjustment for the sample design and geographic stratification of the samples, and within household probability of selection.
The margin of sampling error including the design effect for the full sample is plus or minus 3 percentage points. Numbers of respondents and margins of sampling error for key subgroups are shown in the table below. For results based on other subgroups, the margin of sampling error may be higher. Sample sizes and margins of sampling error for other subgroups are available by request. Sampling error is only one of many potential sources of error and there may be other unmeasured error in this or any other public opinion poll. The Misinformation module included in this survey was designed, analyzed, and paid for by KFF. The demographic questions included in this study were developed and funded jointly by CNN and KFF as part of an unrelated project, with each organization having independent editorial control over its portion of the survey. KFF public opinion and survey research is a charter member of the Transparency Initiative of the American Association for Public Opinion Research.
Amid rising interest in and use of artificial intelligence (AI) by individuals and businesses, most of the public (63%), including most AI users (56%), are not confident that AI chatbots provide accurate health information, a new KFF Health Misinformation Tracking Poll finds.
The poll comes as AI chatbots such as ChatGPT, Google Gemini, and Microsoft CoPilot have become widely available and public use has risen. About one in six (17%) adults now say they use such chatbots at least once a month to find health information and advice. That includes a quarter (25%) of those under age 30.
“While most of the attention around AI in health is focused on how it can transform medical practice and create new business opportunities, consumers are also using it, and the jury is still out on whether it will empower or confuse them,” KFF President and CEO Drew Altman said. “At KFF, our focus will be on how AI and other information technologies affect people.”
Other findings include:
AI users’ trust in chatbot responses varies based on the type of information provided. For example, most users say they trust chatbots’ responses related to practical tasks (66%) and technology (61%) at least a fair amount. Far fewer say so about responses related to health (36%) and politics (24%).
When asked about AI chatbots generally, most of the public (56%) say they are not confident that they can tell what information is true and what is false in their responses. Even among those who use AI, half say they aren’t sure they can tell fact from fiction.
For most of the public, the verdict is still out on whether they believe AI mostly helps or hurts people trying to find accurate health information. Similar shares say it mostly helps (21%) or mostly hurts (23%), with a majority (55%) saying they are unsure.
Designed and analyzed by public opinion researchers at KFF. The survey was conducted June 3-June 24, 2024, online and by telephone among a nationally representative sample of 2,428 U.S. adults in English and in Spanish. The margin of sampling error is plus or minus 3 percentage points for the full sample. For results based on other subgroups, the margin of sampling error may be higher.
There has been heightened focus on health disparities and their underlying causes in recent years. These disparities are not new and reflect longstanding structural and systemic inequalities rooted in contemporary and historical racism and discrimination. This brief provides an introduction to what health and health care disparities are, why it is important to address them, what the status of disparities is today, recent federal actions to address disparities, and key issues related to addressing disparities in the future. More detailed information on this topic can be found in KFF’s Health Policy 101 chapter on Race, Inequality, and Health.
What are Health and Health Care Disparities?
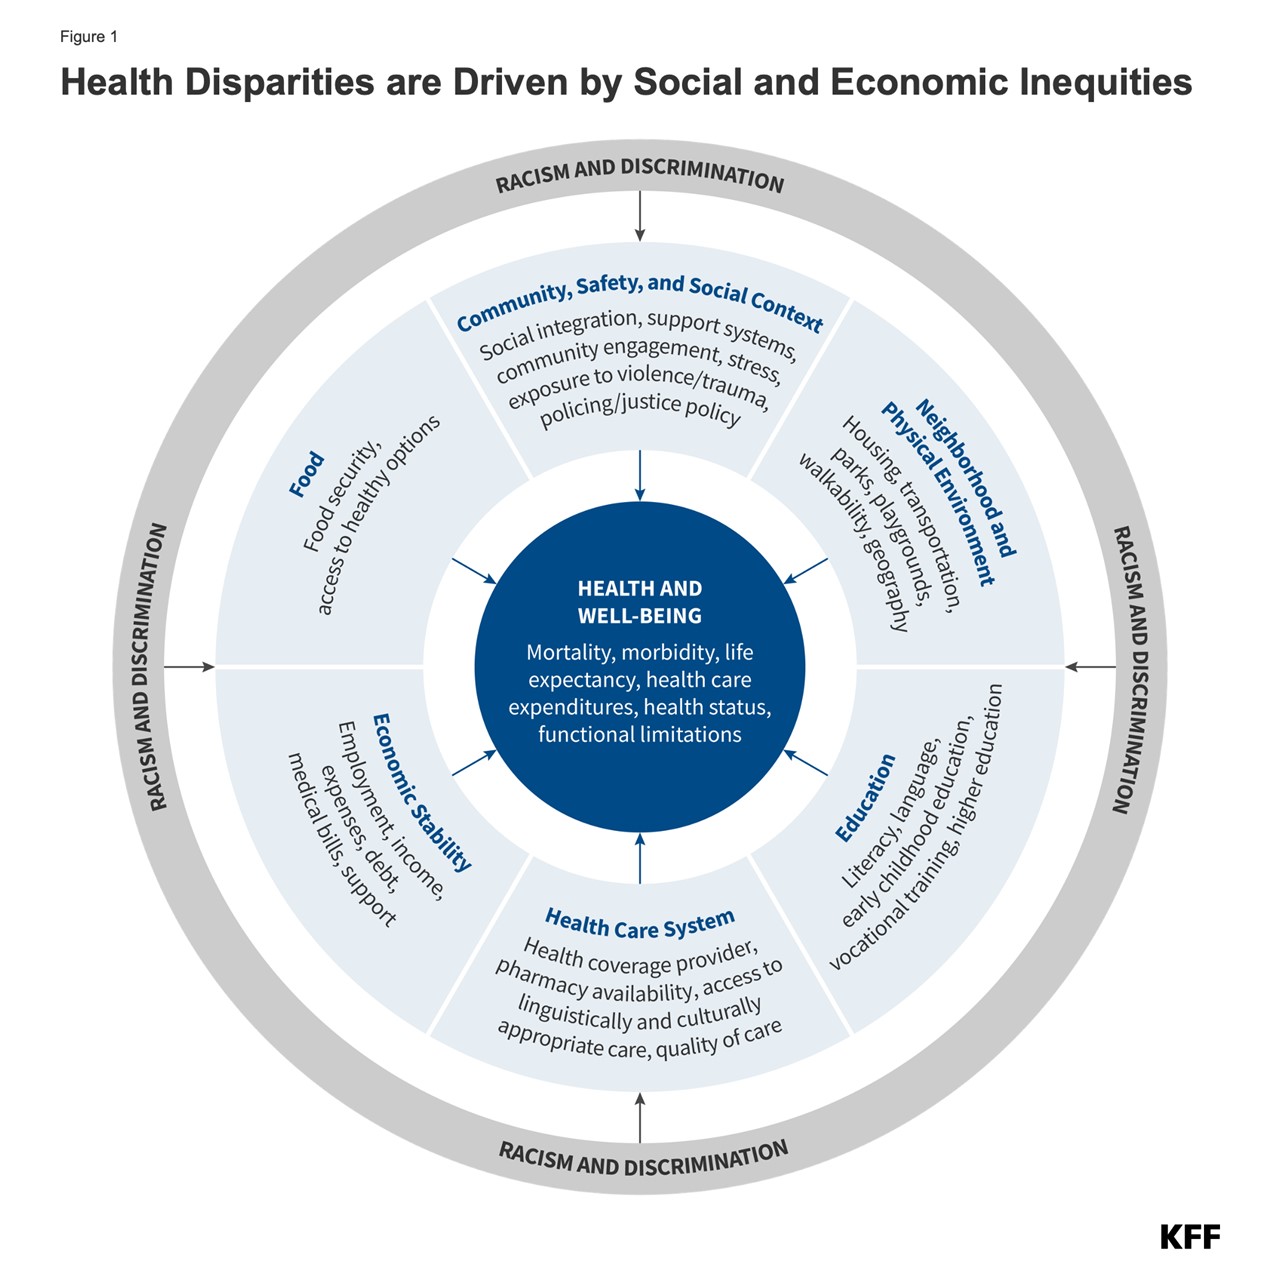
Health and health care disparities refer to differences in health and health care between groups that stem from broader social and economic inequities (Figure 1). Health disparities include differences in health outcomes, such as life expectancy, mortality, health status, and prevalence of health conditions. Health care disparities include differences between groups in measures such as health insurance coverage, affordability, access to and use of care, and quality of care. Disparities occur across multiple factors including race and ethnicity, socioeconomic status, age, geography, language, gender, disability status, citizenship status, and sexual identity and orientation. Reflecting the intersectional nature of people’s identities, some individuals experience disparities across multiple dimensions. The U.S. has a long history of exclusionary policies and events that have driven and continue to contribute to racial and ethnic disparities in health today.
Why is it Important to Address Disparities?
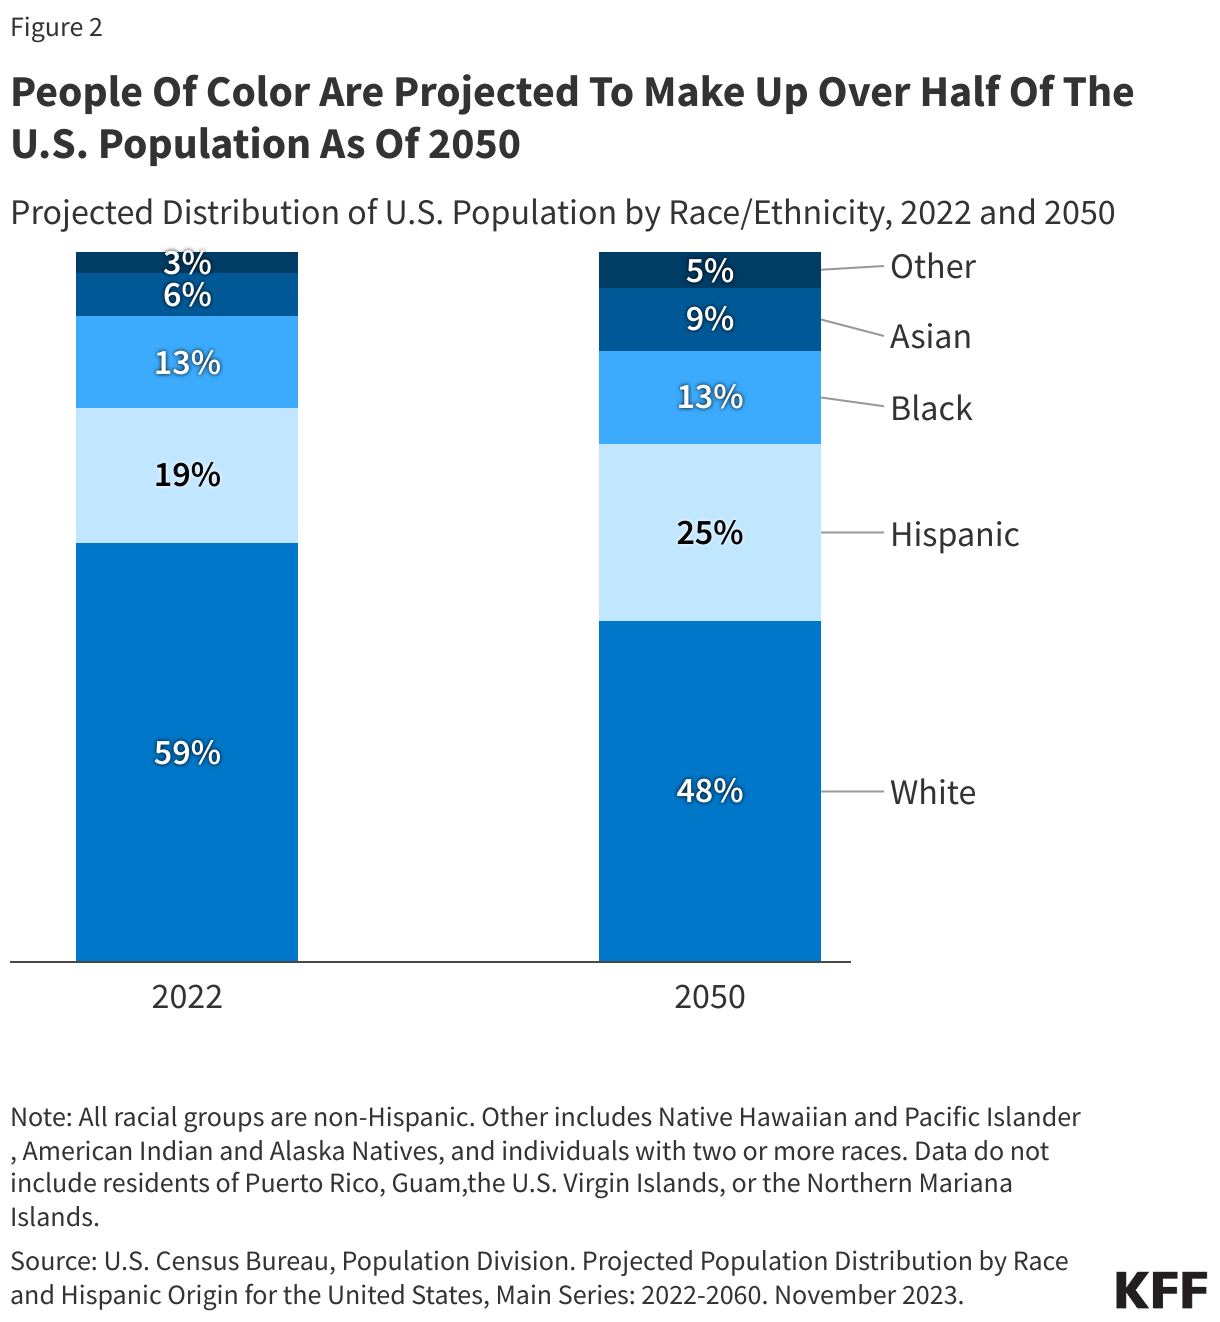
Addressing disparities in health and health care is important from an equity standpoint and for improving the nation’s overall health and economic prosperity. Racial and ethnic health disparities result in higher rates of illness and death across a wide range of health conditions. Research shows that these disparities are costly, resulting in excess medical care costs and lost productivity, as well as additional economic losses due to premature deaths. In addition, it is increasingly important to address health disparities as the population becomes more diverse. The U.S. Census Bureau projects that people of color will account for over half (52%) of the population by 2050, with the largest growth occurring among people who identify as Asian or Hispanic (Figure 2).
What is the Status of Disparities Today?
Despite the recognition and documentation of disparities for decades and overall improvements in population health over time, many disparities persist, and in some cases, have widened over time. Analysis across a broad range of measures of health finds that Black and American Indian or Alaska Native (AIAN) people fare worse than their White counterparts across half or more of these measures including infant mortality, pregnancy-related mortality, diabetes mortality, and cancer mortality. Data for Hispanic people are more mixed relative to White people, which reflects that some subgroups, such as recent immigrants, generally fare better on health outcomes despite faring worse on many measures of health access and social and economic factors that influence health. Asian people on aggregate fare the same or better than White people on most measures of health, but there are some subgroups of the population that face significant disparities. Disaggregated data for Native Hawaiian or Pacific Islander (NHPI) people are limited, but available data show that they fare worse than White people across the majority of examined measures.
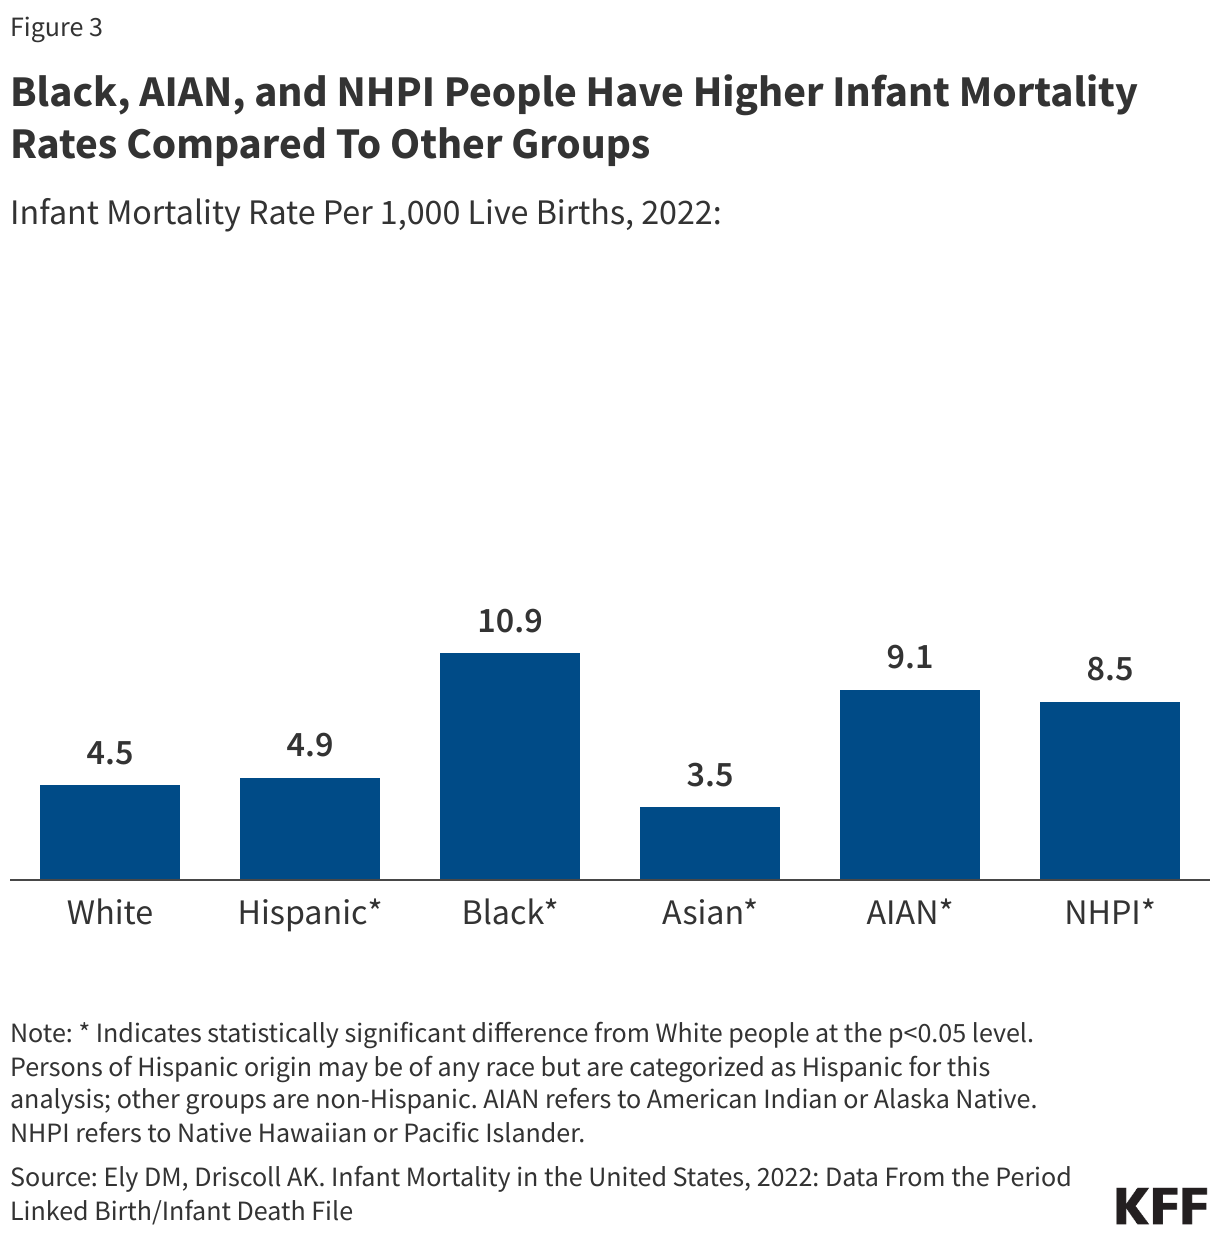
Disparities in health occur across the life course. Black infants were more than two times as likely to die as White infants (10.9 vs. 4.5 per 1,000 live births), and AIAN (9.1 per 1,000 live births) and NHPI (8.5 per 1,000 live births) infants were roughly twice as likely to die as White infants in 2022 (Figure 3). Hispanic infants (4.9 per 1,000 live births) also have a slightly higher mortality rate than White infants. NHPI (62.8 per 100,000), Black (39.9 per 100,000) and AIAN (32 per 100,000) women had the highest rates of pregnancy-related mortality between 2017 and 2019. In 2022, the age-adjusted mortality rates for diabetes for NHPI (49.9 per 100,000), AIAN (47.7 per 100,000), and Black (42.9 per 100,000) people were about twice as high as the rate for White people (21.3 per 100,000); Hispanic people also had a higher diabetes death rate compared to White people (28.3 per 100,000). AIAN and Black people have consistently had a shorter life expectancy than White people, with gaps widening during the COVID-19 pandemic. Based on provisional data for 2022, life expectancy for Black people was about five years shorter than White people (72.8 vs. 77.5), and nearly ten years shorter for AIAN people (67.9).
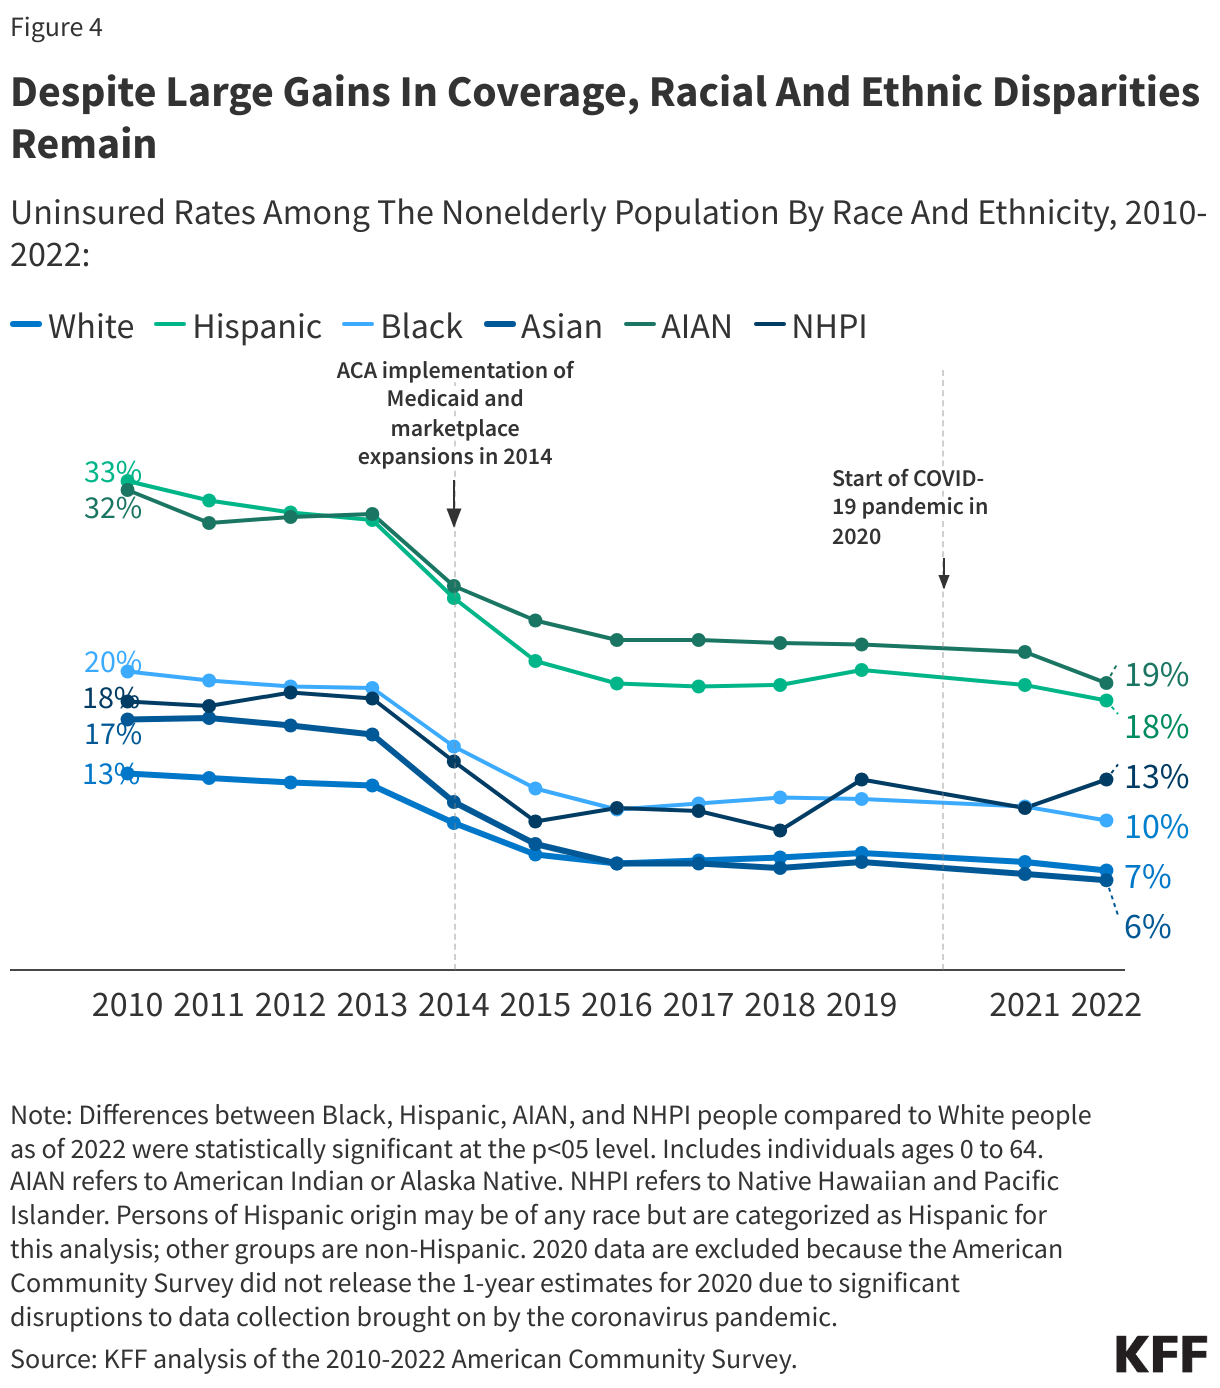
There also are ongoing disparities in health coverage and access to care. For example, nonelderly AIAN, Black, Hispanic, and NHPI people are more likely to be uninsured than their White counterparts despite large gains in coverage since the Affordable Care Act (Figure 4).
What are Recent Federal Actions to Address Disparities?
Early in his presidency, President Biden issued a series of executive orders focused on advancing health equity and directing federal agencies to develop Equity Action Plans. The Centers for Medicare and Medicaid (CMS) released an updated framework to advance health equity for people covered by Medicare, Medicaid, the Children’s Health Insurance Program (CHIP) and the Health Insurance Marketplaces. The Administration and Congress took a range of actions to stabilize and increase access to health coverage amid the pandemic, with some extending beyond the Public Health Emergency and others ending; this included a temporary requirement of continuous enrollment in Medicaid which came to an end on March 31, 2023, with millions of Medicaid enrollees being disenrolled since. There has also been a growing focus by the Biden Administration on addressing maternal health disparities and increasing the availability of disaggregated racial and ethnic data to better identify and address disparities.
The Biden Administration also expanded the Child Tax Credit, which has contributed to reductions in child poverty and improvements in health and well-being. The Biden Administration temporarily increased the Child Tax Credit (CTC) as part of the American Rescue Plan in 2021. Research shows that this expansion was associated with significant reductions in child poverty rates for Black and Hispanic children and that it will likely lead to short- and long-term benefits for children’s health and well-being, particularly poor and younger children, stemming from improved outcomes associated with increased parental income. However, the expansion expired at the end of 2021, and poverty rates rebounded. A bipartisan bill that would provide a Child Tax Credit expansion primarily to children in low-income families is pending, although its future remains uncertain.
What are Key Issues Related to Health Disparities Looking Ahead?
Growing mental health needs, increasing climate-related health risks, policy changes, and the outcome of the 2024 presidential election will all have important implications for future efforts to address disparities. People of color face disproportionate barriers to accessing mental health care and there also have been large increases in drug overdose death rates for AIAN, Black, and Hispanic people compared to White people between 2019 and 2022, amplifying the focus on disparities in mental health. Growing climate-related health impacts may exacerbate disparities given their disproportionate impacts on marginalized communities. In addition, evolving federal and state policies related to reproductive health, Medicaid, and immigration impact disparities. For example, state variation in access to abortion in the wake of the Dobbs decision may exacerbate the already large racial disparities in maternal health. Coverage losses following the end of the Medicaid continuous enrollment provision may lead to widening disparities in coverage due to people of color being more likely to be covered by Medicaid. In addition, proposals to convert federal Medicaid funds to per capita caps or block grants could further exacerbate disparities in access to health coverage. On the other hand, take-up of the ACA Medicaid expansion in the remaining states that have not yet expanded as well as other Medicaid initiatives could narrow disparities. Evolving immigration policies may impact health care access for immigrants, who are more likely than U.S.-born people to be uninsured and to face challenges accessing health care. Finally, the 2024 presidential election will have far-reaching implications for these and other key health policy areas.
While Medicare Drug Price Negotiations Don’t Apply to Private Insurance, 3.4 Million People with Employer Coverage Take at Least One of the Selected Drugs
Among the 167 million people with employer-sponsored insurance in 2022, 3.4 million used at least one of the first 10 drugs identified for Medicare price negotiations, according to a new KFF analysis. Medicare is expected to release the negotiated drug prices, which will go into effect in 2026, by no later than September 1, 2024.
The most used drug for people with employer-sponsored health insurance was Jardiance, a drug used to treat diabetes and heart failure, which was taken by more than 911,000 enrollees.In the future, the Medicare program will negotiate prices for additional drugs, which millions more people with employer coverage could also be taking. As the policy currently stands, lowering drug prices in Medicare has no direct effect on private insurance plans, and the indirect effects are still unclear. Some argue lower negotiated prices in Medicare will result in higher prices in private insurance plans, while others suggest Medicare prices could serve as a benchmark and lead to savings.The full analysis and other data on health costs are available on the Peterson-KFF Health System Tracker, an online information hub dedicated to monitoring and assessing the performance of the U.S. health system.
Among the 167 million people with employer-sponsored insurance in 2022, 3.4 million used at least one of the first 10 drugs identified for Medicare price negotiations, according to a new analysis. The most used drug for people with employer-sponsored health insurance was Jardiance, a drug used to treat diabetes and heart failure, which was taken by more than 911,000 enrollees.
The analysis uses the Merative MarketScan 2022 commercial claims to estimate the number of enrollees in the employer-sponsored insurance market who use one or more of the ten drugs selected for Medicare Part D price negotiations.
The full analysis and other data on health costs are available on the Peterson-KFF Health System Tracker, an online information hub dedicated to monitoring and assessing the performance of the U.S. health system.
The 2024 KFF Women’s Health Survey (WHS) is the latest in a series of nationally representative surveys on women’s health conducted by KFF since 2001. The survey’s objective is to track and document women’s experiences and knowledge related to health and well-being. The 2024 survey includes a nationally representative sample of 6,246 adults ages 18 to 64, including 5,055 women and 1,191 men, and was conducted from May 15 to June 18, 2024. To better understand health care disparities, the survey includes representative samples of Black, Hispanic, and Asian or Pacific Islander women as well as those who identify as LGBT+. Briefs are focused on abortion experiences, knowledge, and attitudes among reproductive age women in the U.S., as well Florida and Arizona. Additional areas of focus include women’s experiences with contraception, and fertility services, mental health, and intimate partner violence and other topics related to health care access, cost, and insurance coverage.
Information from the 2024 KFF Women’s Health Survey about women’s experiences with abortion, the fallout of overturning Roe v. Wade, women’s knowledge about abortion laws in their states including medication abortion, as well as their opinions on the legality of abortion.
This brief provides information about abortion experiences, awareness, and attitudes of Florida women ages 18 to 49, based on findings from the 2024 KFF Women’s Health Survey, a nationally representative survey on health care issues.
Information about abortion experiences, awareness, and attitudes of Arizona women ages 18 to 49, based on findings from the 2024 KFF Women’s Health Survey, a nationally representative survey on health care issues.
This analysis, based on findings from the 2024 KFF Women’s Health Survey, focuses on women with children ages 5 & under and their perceptions on how easy or difficult they feel it is to access a range of services that are important to the health of women and families, including maternity care, Medicaid coverage, food stamps, contraceptive services, and affordable childcare.
This brief provides new data from the 2024 KFF Women’s Health Survey on access to fertility care, including women’s opinions about access in their state, cost barriers, and the range of fertility services that women use.
This issue brief presents KFF WHS data on access to mental health services among women and men ages 18 to 64, and it also takes a closer look at mental health coverage among women.
KFF’s 2024 Women’s Health Survey finds that women aren’t fully aware that the Affordable Care Act (ACA) requires insurance plans to cover the full cost of recommended preventive health care services – especially contraception.
This brief offers a close examination of women’s experiences with contraception, insurance coverage, contraceptive preferences, and interactions with the health care system. We also explore the influence and reach of contraceptive information on social media.
As part of the 2024 KFF Women’s Health Survey, a nationally representative sample of 1,191 men ages 18 to 64 were surveyed on a broad range of health issues. This data note highlights their responses to their experiences, knowledge, and perspectives about vasectomy services.
This data note presents findings from the 2024 KFF Women’s Health Survey on women’s experiences with disrespectful and unfair treatment as well as negative interactions with providers during health care visits in the past two years.
This data note presents findings from the KFF Women’s Health Survey on women’s health status, access to health care services, and use of preventive health services.
This analysis provides data on women experiencing intimate partner violence (IPV) and reports on a range of health topics affecting women who experienced IPV in the past five years, including their health care needs and use, barriers, and mental health.
This brief presents key data points on the health care experiences of LGBT+ women from the KFF Women’s Health Survey, a nationally representative survey of women in the United States conducted from May 13 – June 18, 2024.
Similar Shares of Republican, Democratic, and Independent Women (One in Seven) Report Having Had an Abortion
More than Six in Ten Women of Reproductive Age Are Concerned About Access to Abortion If It Was Needed to Preserve Their Own Life or Health or That of Someone Close to Them
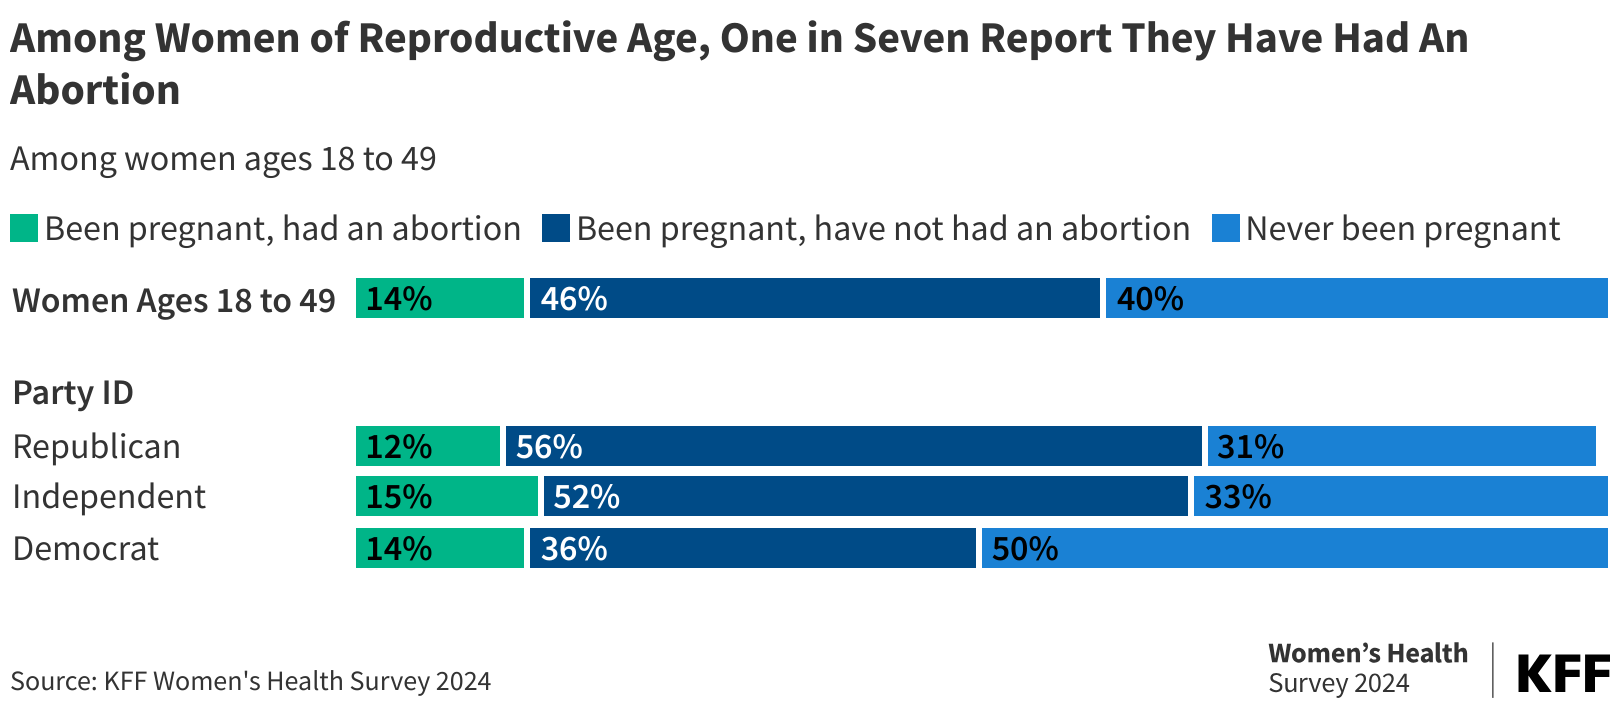
A new nationally representative KFF Women’s Health Survey, which explores the extensive implications of Roe v. Wade being overturned by the Supreme Court, reveals that one in seven (14%) women of reproductive age report having had an abortion at some point in their life. Across partisanship, similar shares of Republican women (12%), Democratic women (14%), and independents (15%) report having had an abortion.
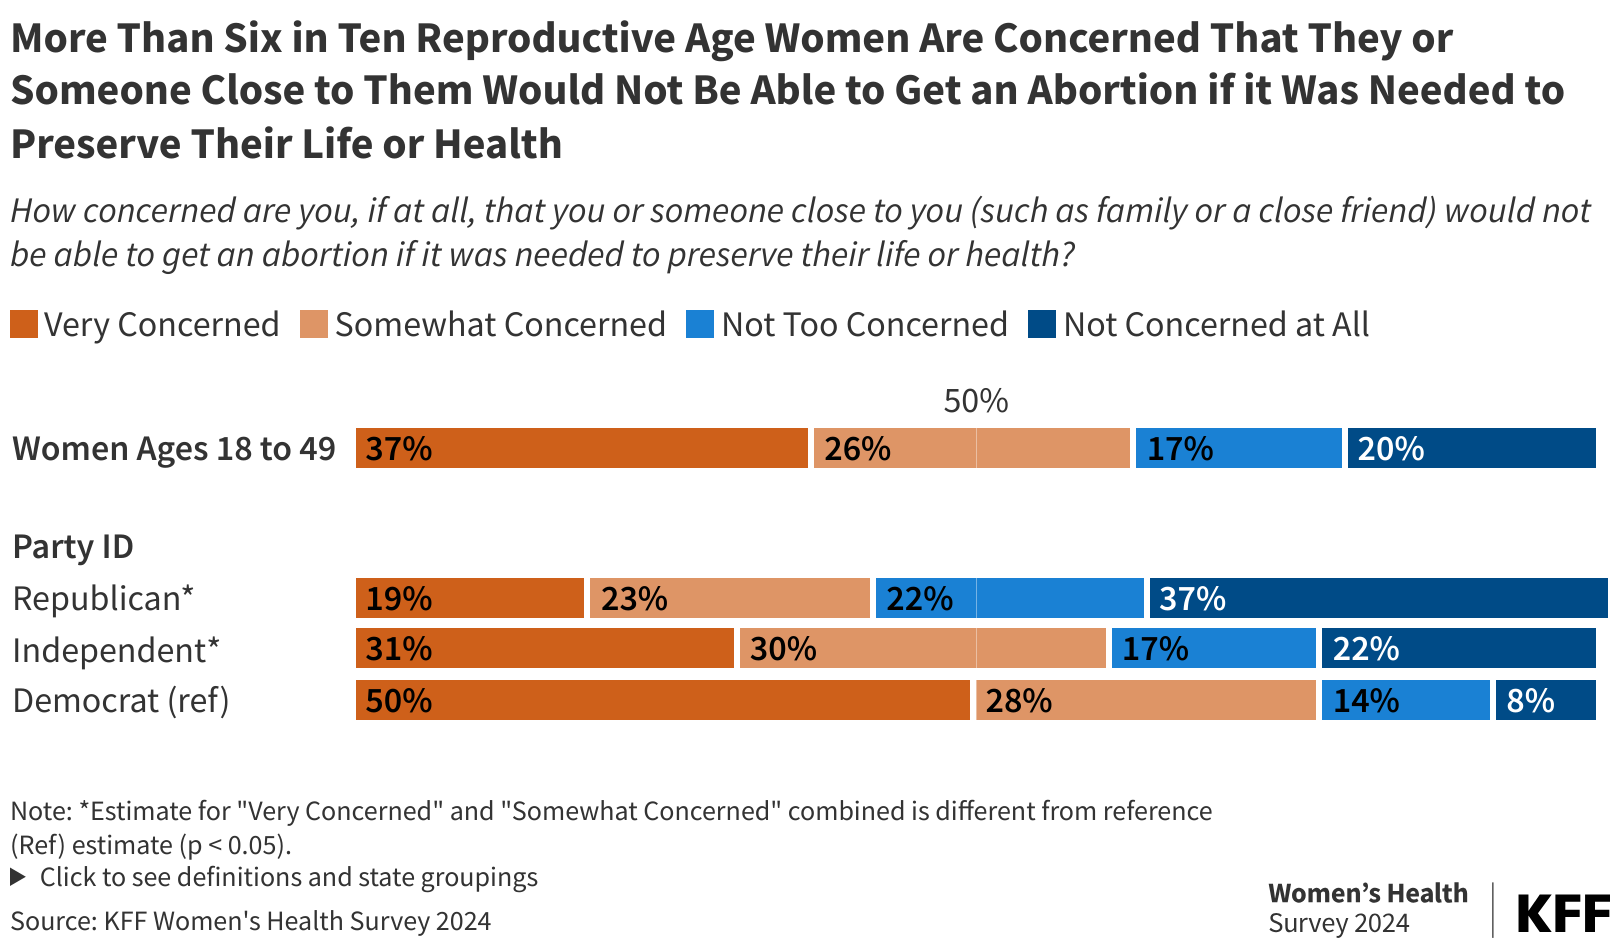
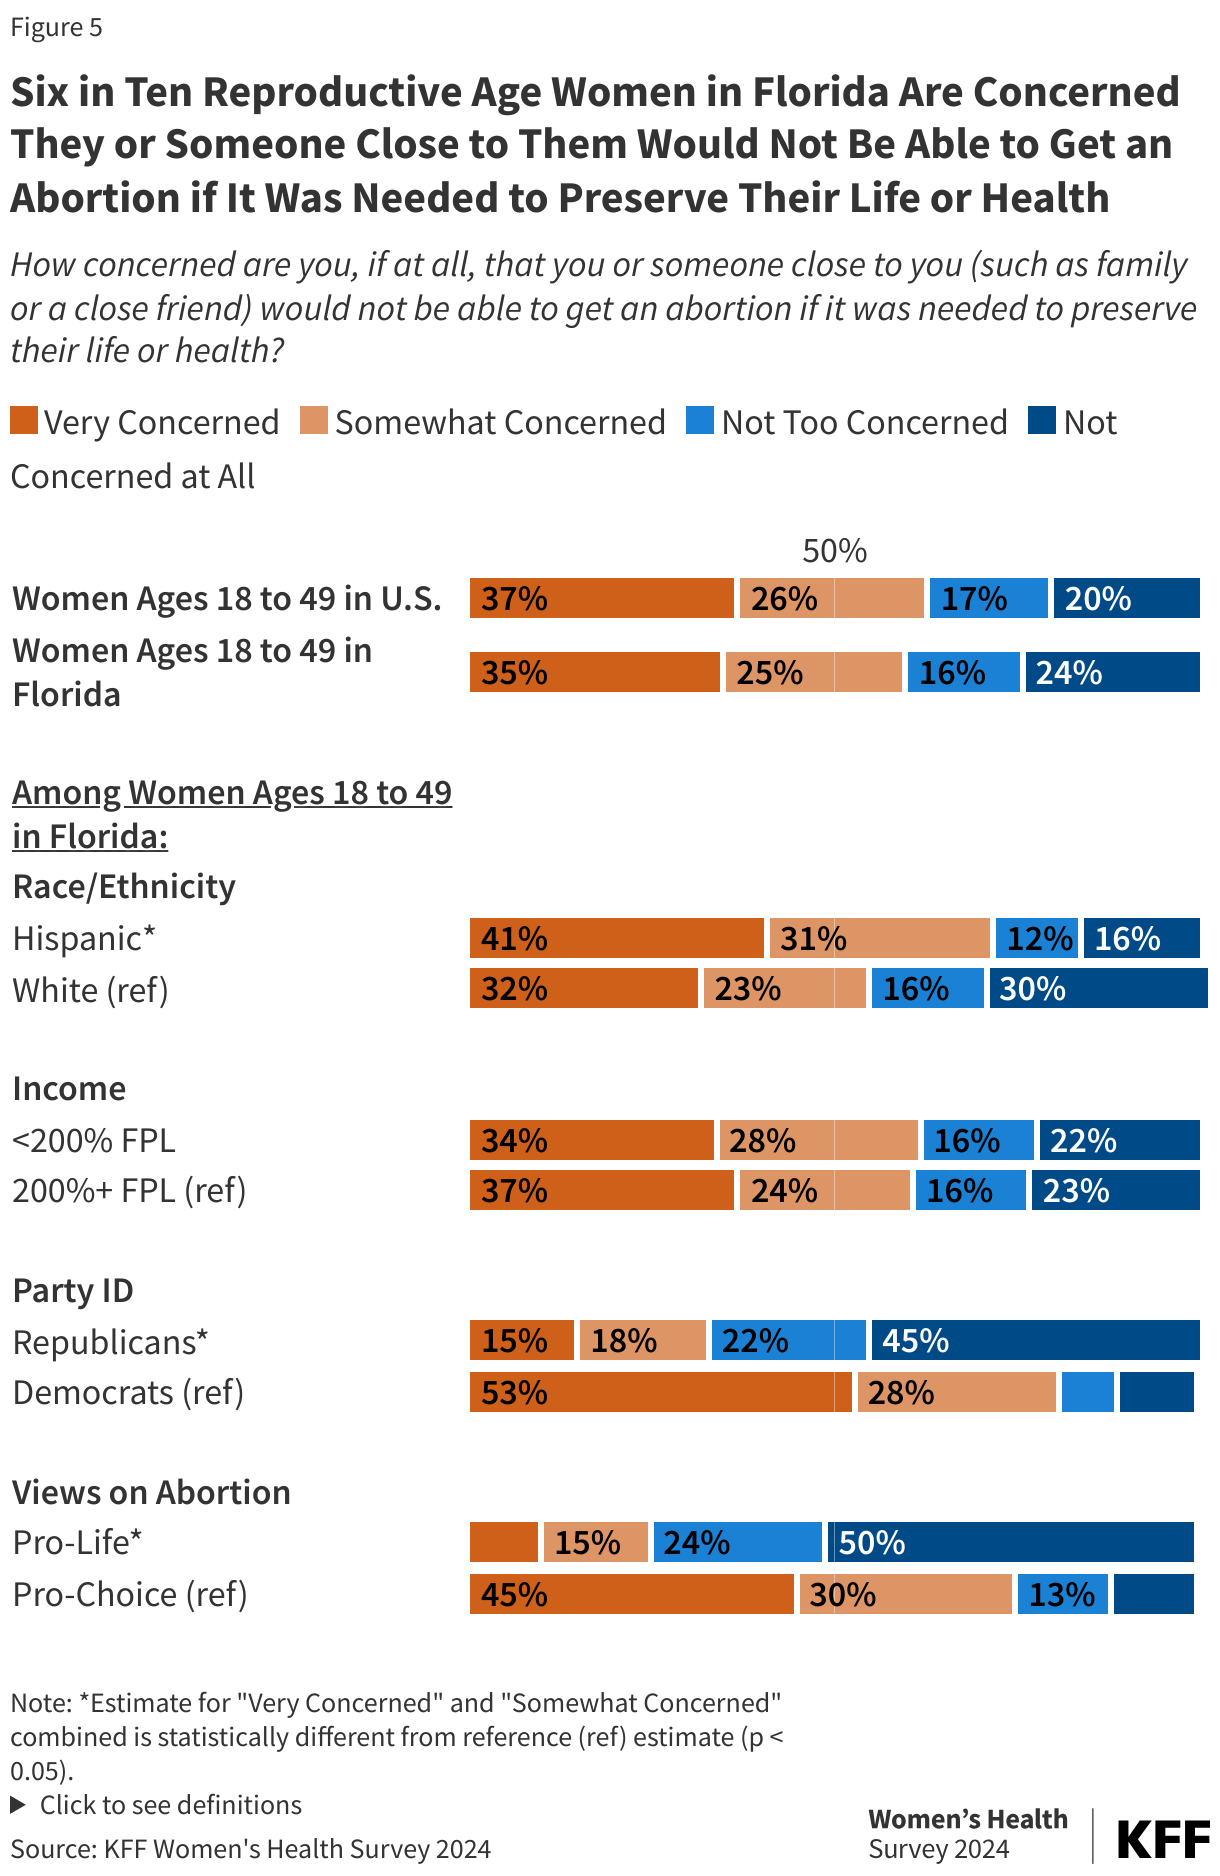
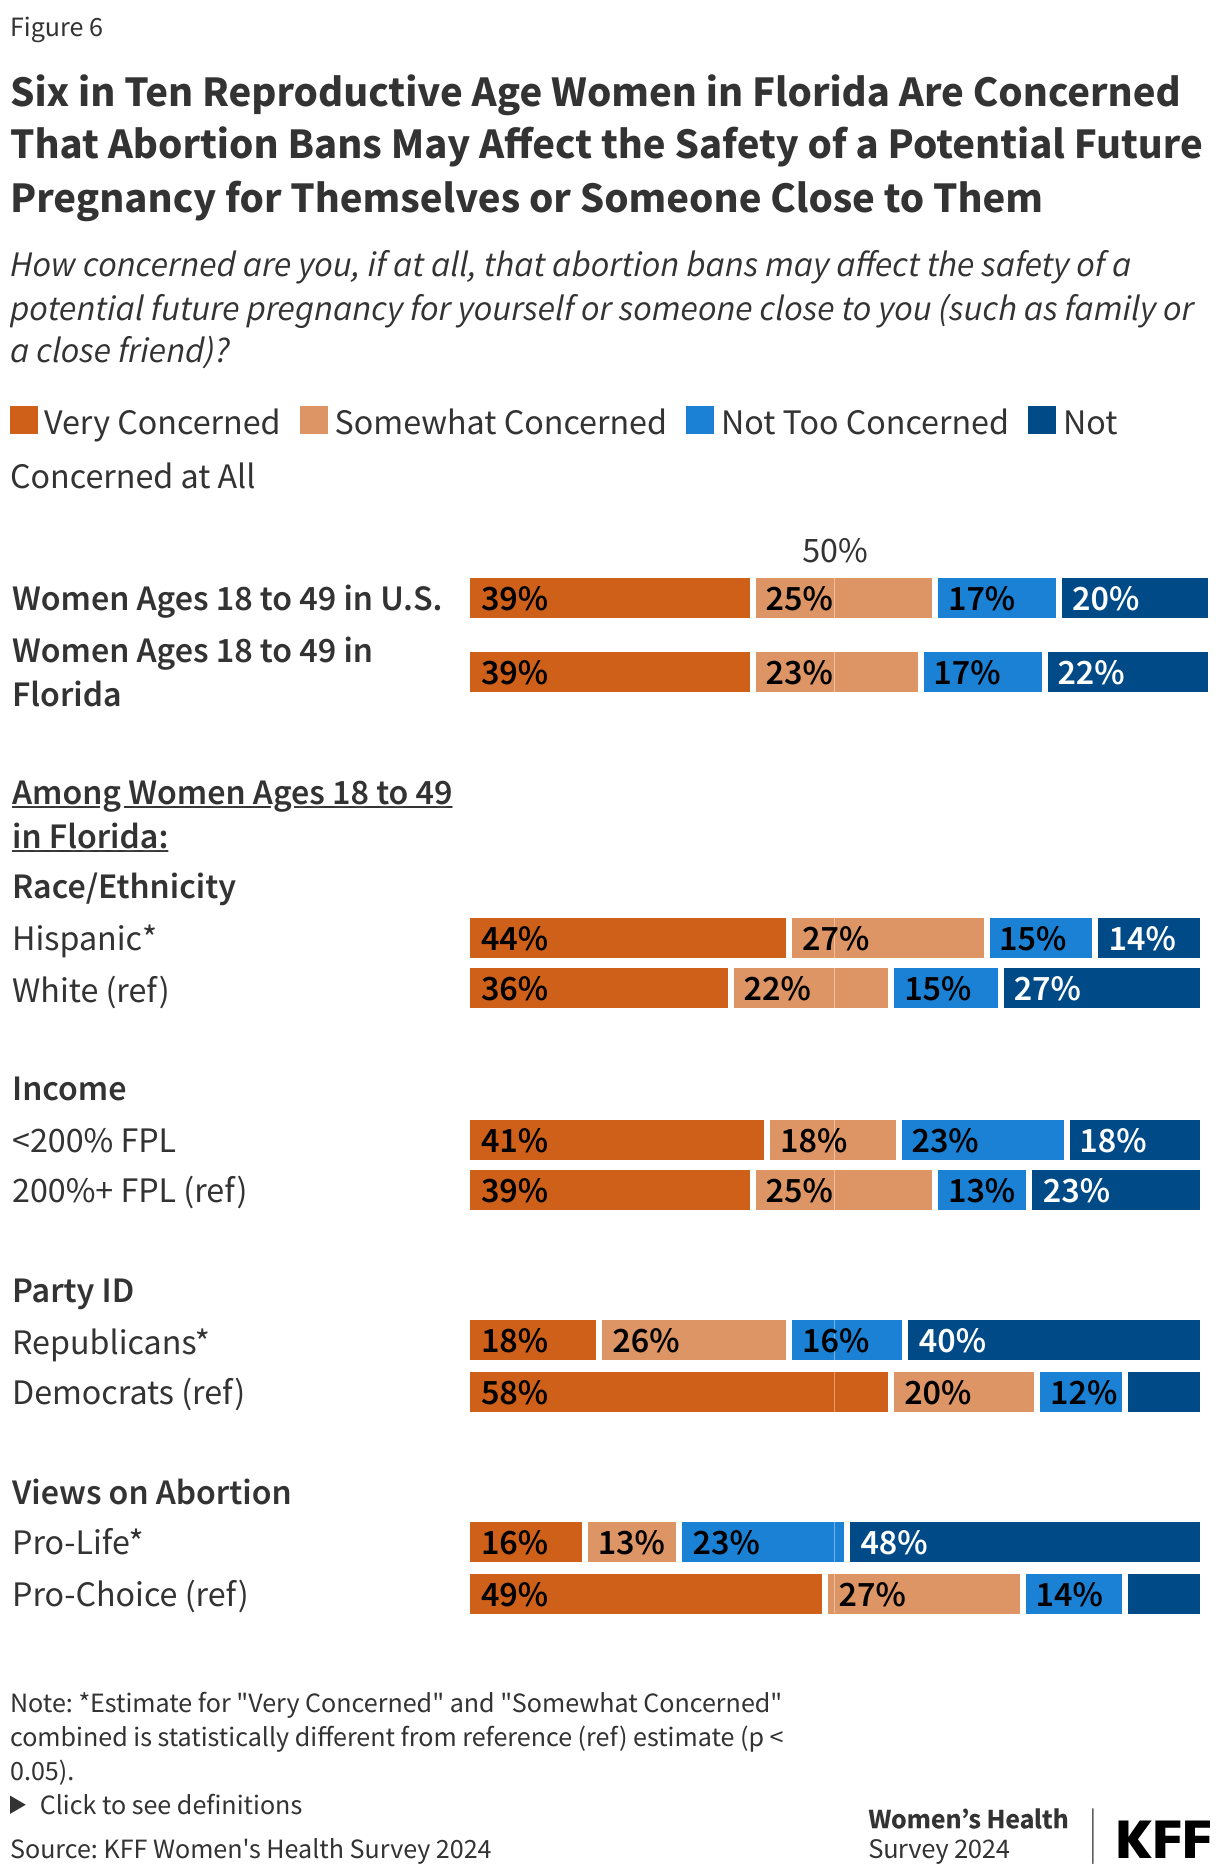
The survey uncovered concern over access to abortion services in emergencies. More than six in 10 women of reproductive-age (18-49 years old) across the United States (63%) are concerned that they, or someone close to them, would not be able to get an abortion if it was needed to preserve their life or health. They are also concerned that abortion bans may affect the safety of a potential future pregnancy for themselves or someone close to them (64%).
Nationally, three-quarters of reproductive-age women who are Democrats and six in 10 independent women are concerned about abortion access in cases of pregnancy-related emergencies. A sizable minority of Republican women in this age group nationally (42%) also share these concerns.
A cross-partisan trend emerged in whether abortion policy should be left up to individual states, a policy that former President Trump has said he supports, which allows the current bans and restrictions to stay in effect across half the country. The survey shows that seven in 10 reproductive-age women (74%) oppose leaving abortion policy up to the individual states to determine, including most Republicans (53%), Democrats (86%), and independents (73%).
In addition, many women across the U.S. are unaware of the status of abortion policy in their state (45%), how to obtain an abortion if they need one in the near future (26%), or that people in their state can get medication abortion pills online (19%). Since Roe v. Wade was overturned, the landscape involving abortion bans and restrictions at the state level has been shifting rapidly.
The survey also explores the abortion experiences and perspectives of women in Florida—where it is on the ballot this November—and Arizona, a swing state that may have an abortion ballot initiative this fall. Nearly one in five (18%) reproductive-age women in Florida report they have had an abortion. Among women of reproductive-age in Arizona, 15% say they have had an abortion at some point in their lives. Seven in 10 women in Arizona (70%) and Florida (72%) say abortion should be legal in all or most cases.
Additional findings include:
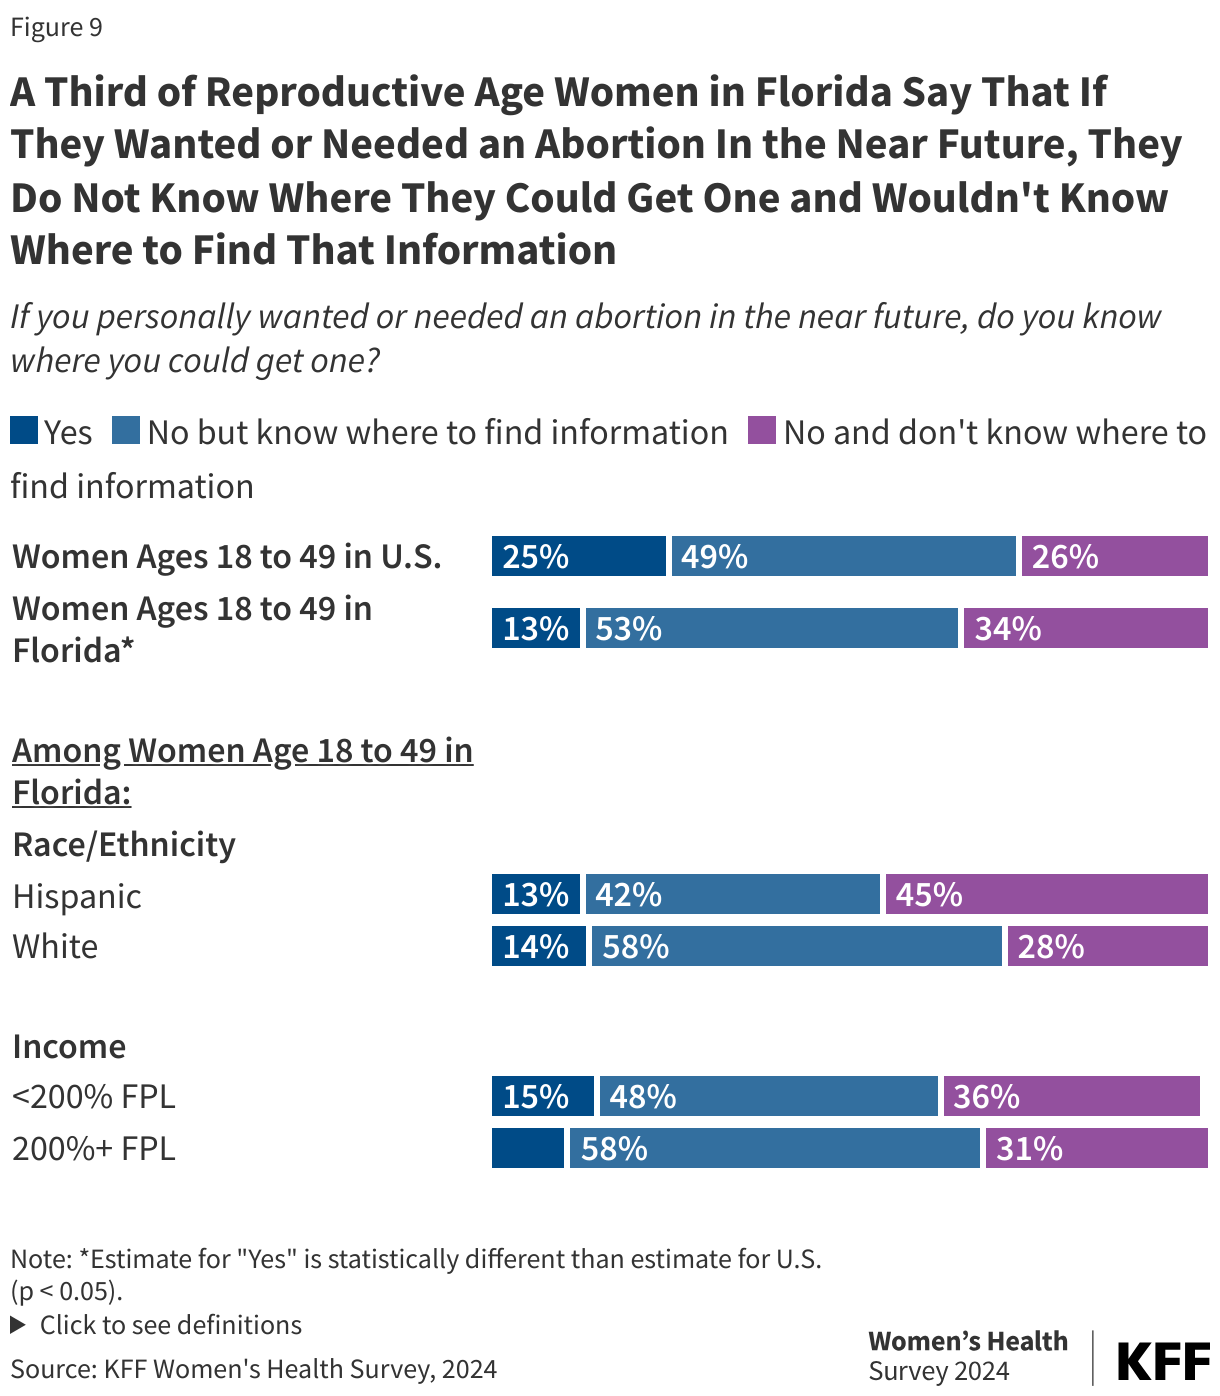
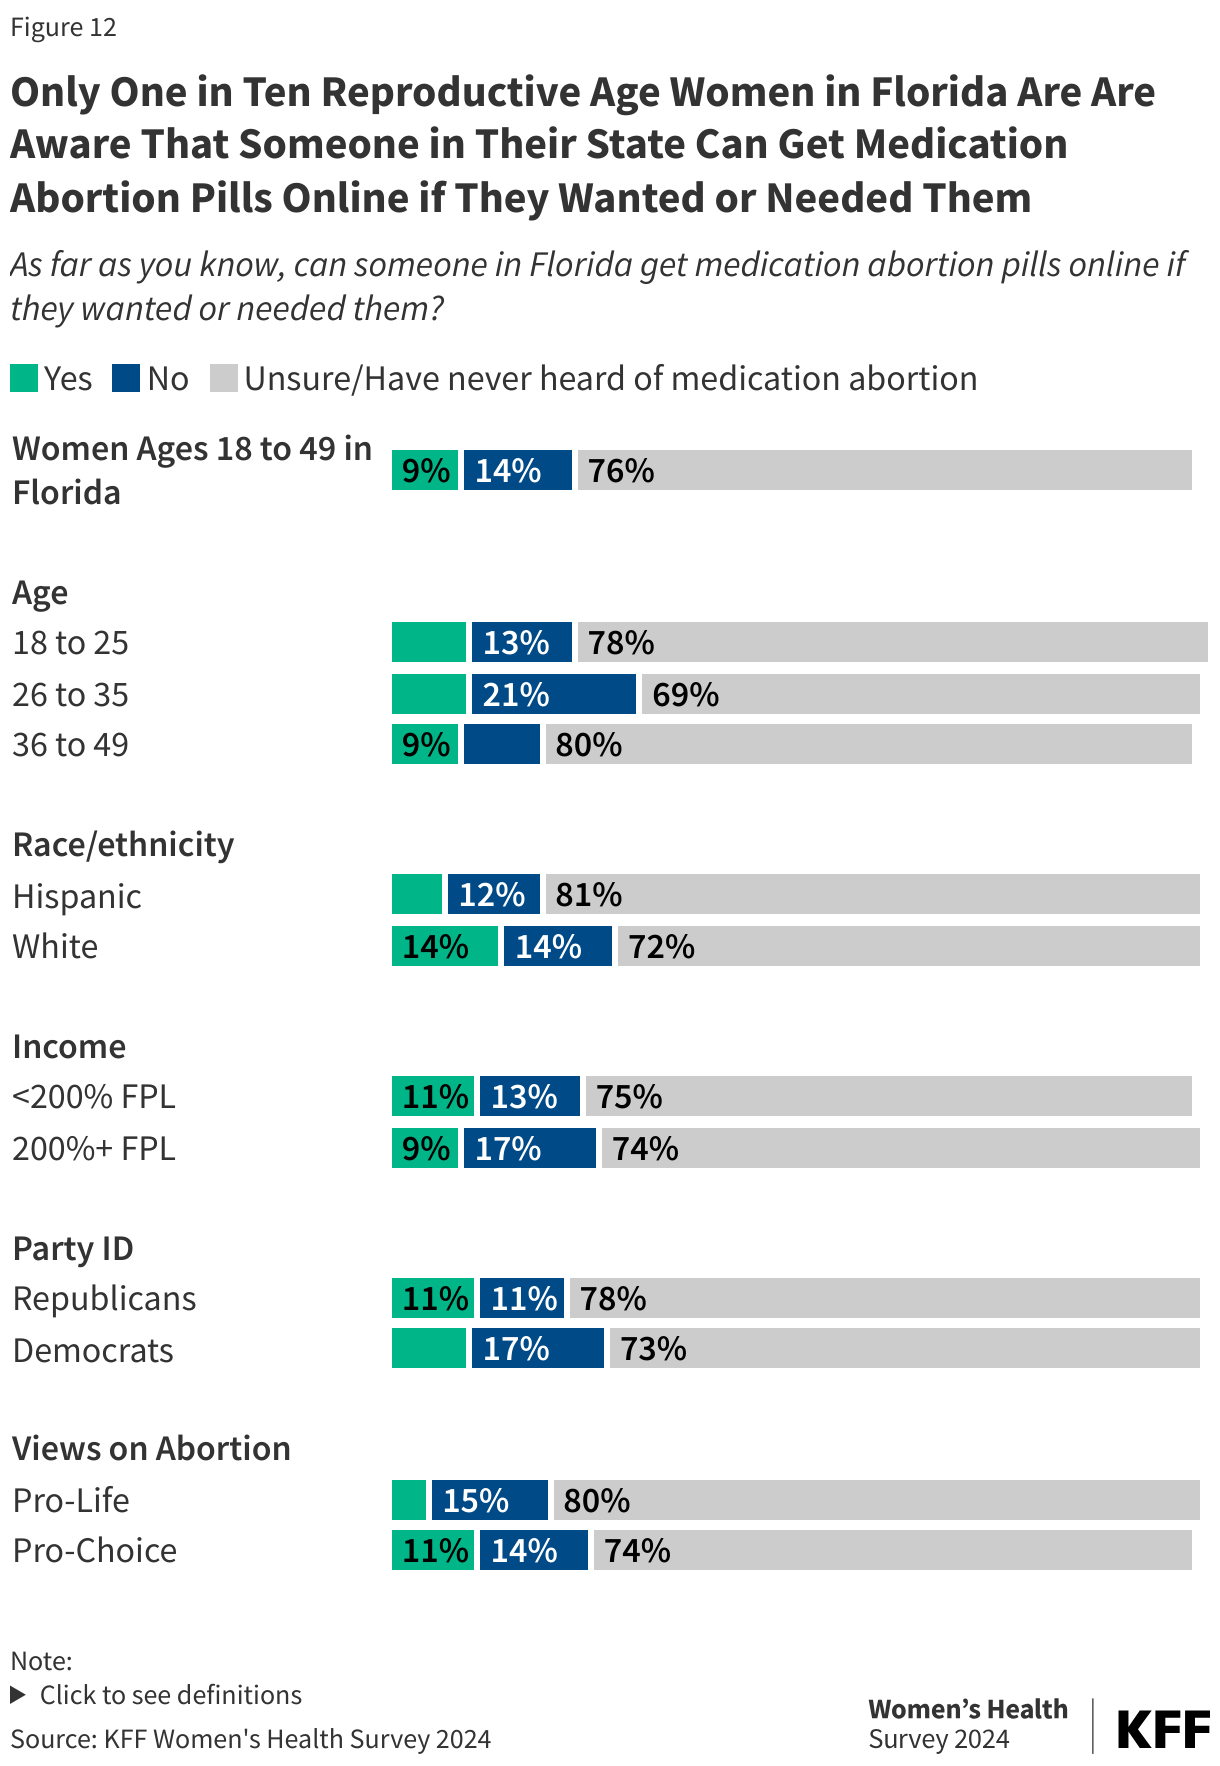
In Florida, only one in five (18%) are aware medication abortion is still legal in their state (abortion is available until six weeks in Florida). About a third (34%) don’t know where to get an abortion or where to find the information should they need one, and only one in ten (9%) are aware that medication abortion pills can be obtained online. Awareness is similarly limited in Arizona (where abortion is currently available up to 15 weeks), particularly among women with lower incomes who are affected disproportionately by restrictions on abortion, have lower awareness about abortion access in their state, and have more significant concerns about pregnancy safety.
The fallout from the overturning of Roe v. Wade has resulted in a substantial number of women who report struggling themselves—or knowing someone who struggled—to get an abortion. Nearly one in ten (8%) women of reproductive age in the United States personally know someone, including themselves, who has had difficulty getting an abortion since Roe v. Wade was overturned, including 11% of Hispanic women and 13% of women living in states with abortion bans. Among the barriers cited were traveling out of state for care, not knowing where to go, and lacking the money to cover the cost.
Across the United States, 17% of reproductive-age women report changing their contraceptive practices as a result of Roe v. Wade being overturned. Actions taken include starting birth control, getting a sterilization procedure, switching to a more effective method, or purchasing emergency contraceptive pills to have on hand.
Periodically conducted since 2001, this 2024 KFF Women’s Health Survey analysis includes a nationally representative sample of 3,901 women ages 18 to 49. The survey was fielded from May 15 to June 18, 2024, and was developed and analyzed by KFF staff.
Nearly one in five (18%) reproductive age women in Florida say they have had an abortion. Similar shares of Republican (20%) and Democratic (19%) women report having an abortion.
One in ten (10%) reproductive age women in Florida know someone, including themselves, who has had difficulty getting an abortion since Roe v. Wade was overturned and over a third (34%) of women would not know where they could get an abortion or find the information if they wanted or needed one.
Six in ten women of reproductive age in Florida are concerned that they or someone close to them would not be able to get an abortion if it was needed to preserve their life or health (60%) and that abortion bans may affect the safety of a potential future pregnancy for themselves or someone close to them, such as a family or close friend (62%).
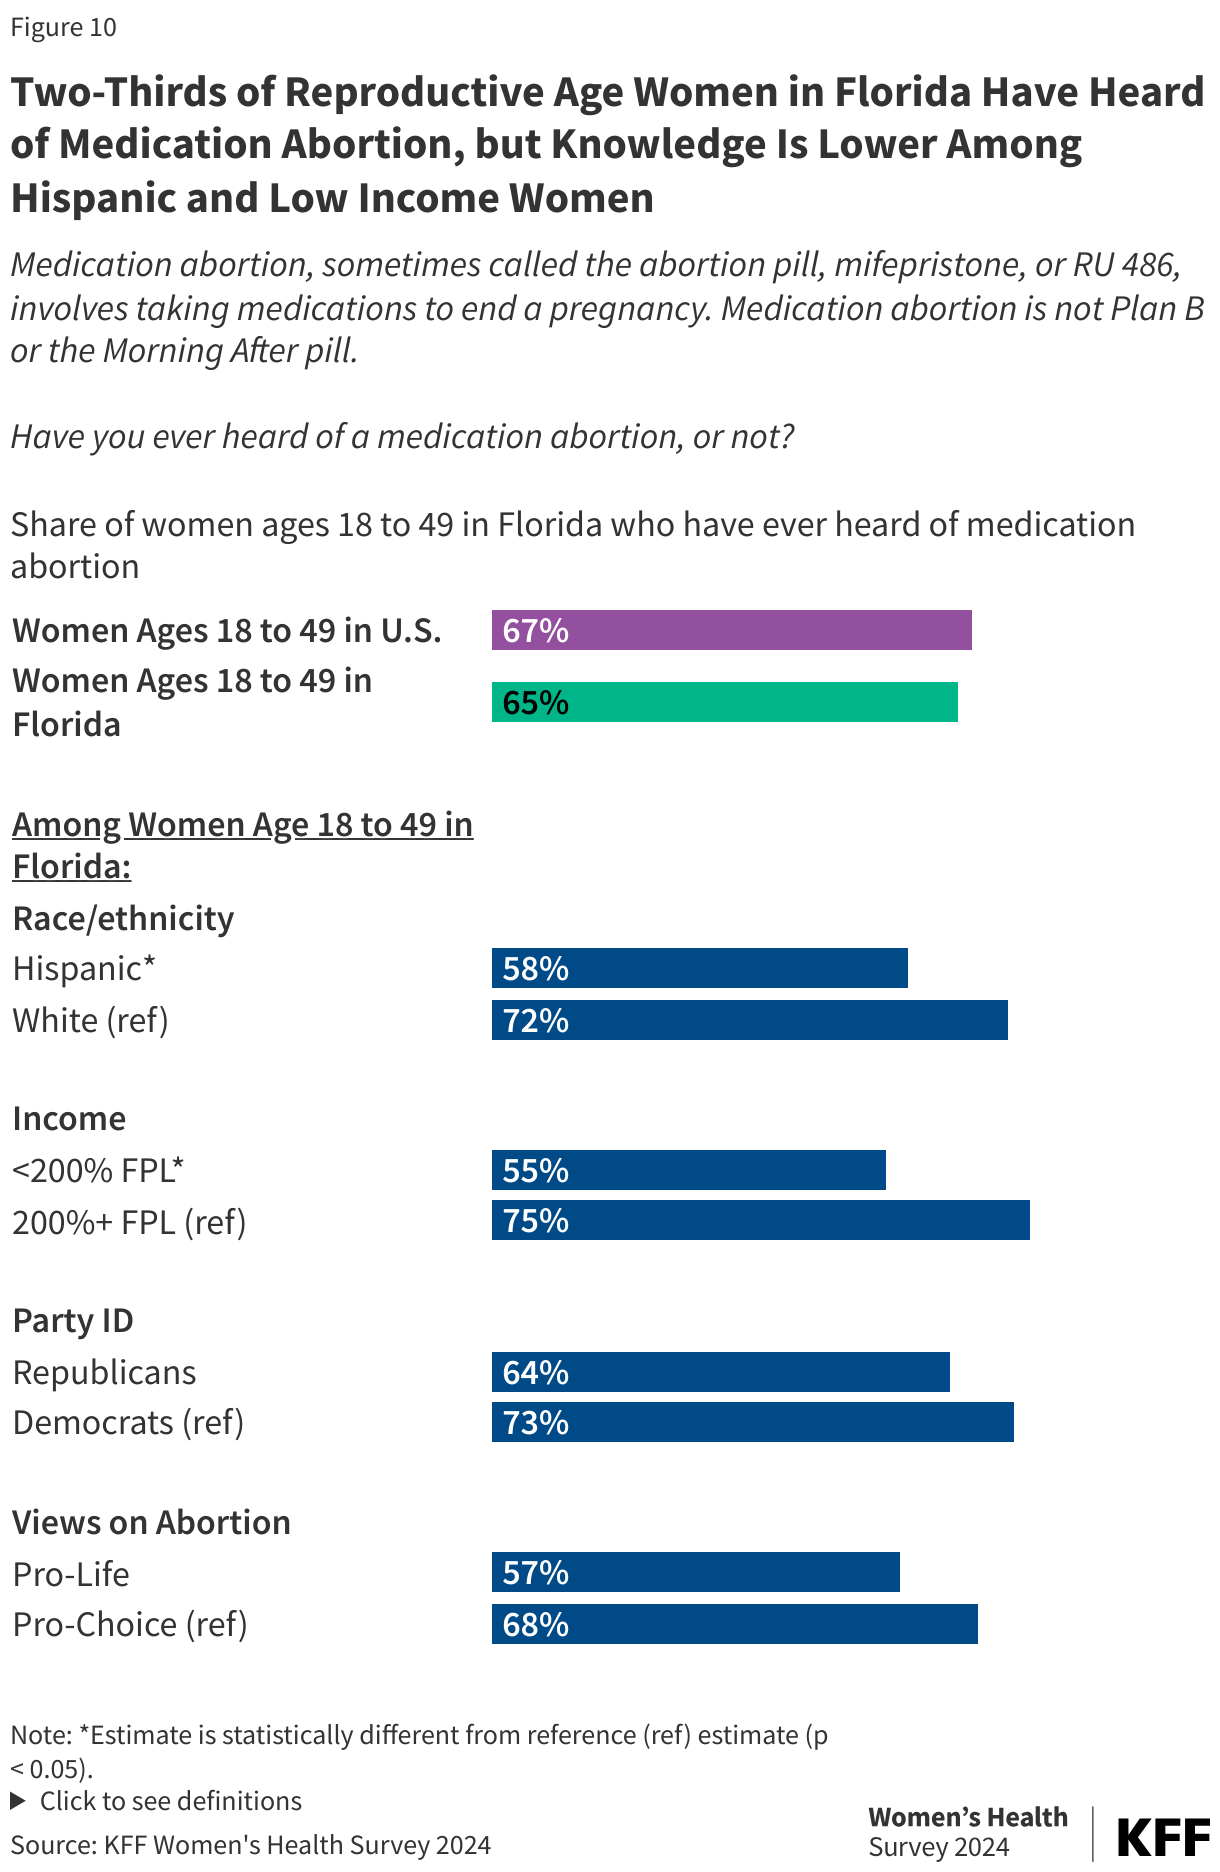
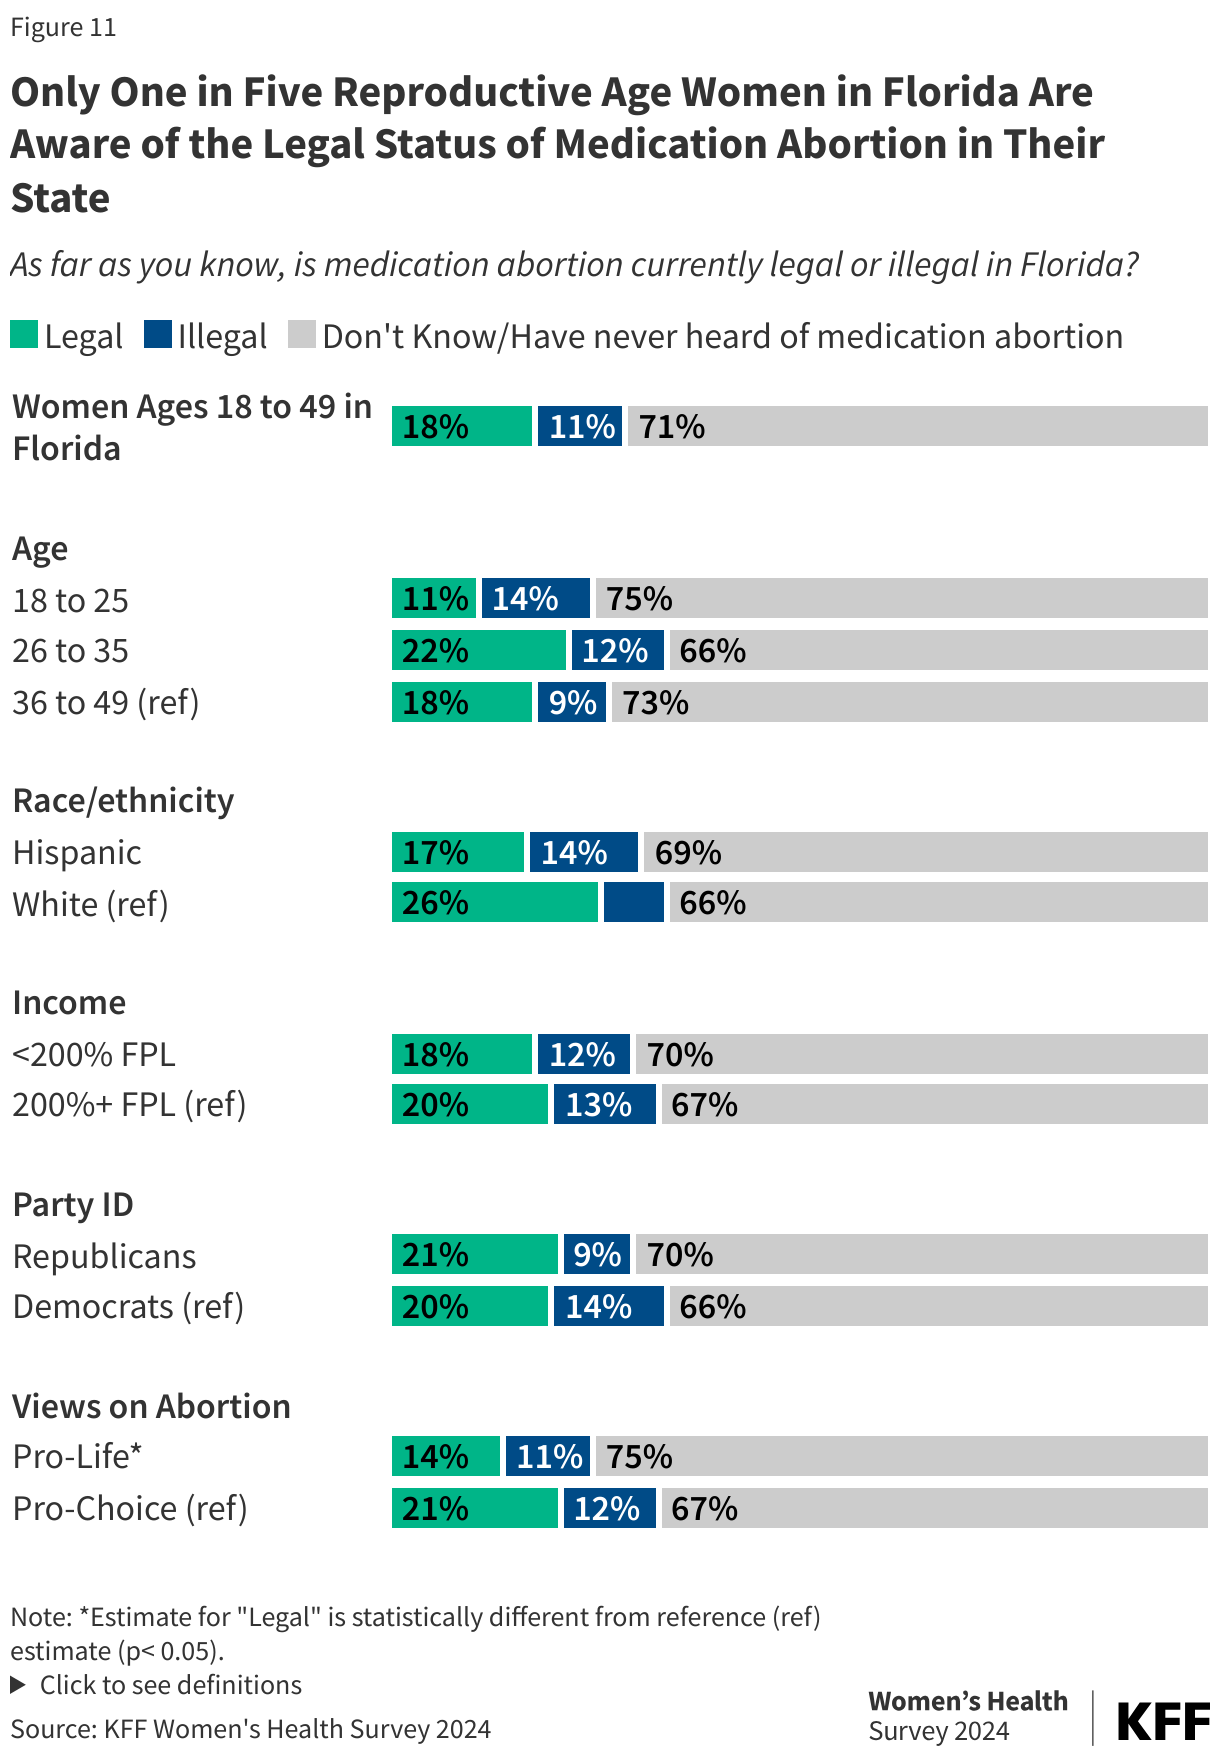
Two-thirds (65%) of reproductive age women in Florida have heard of medication abortion. Only one in five (18%) are aware it is still legal in their state and one in ten (9%) are aware they could access pills online if they wanted or needed them.
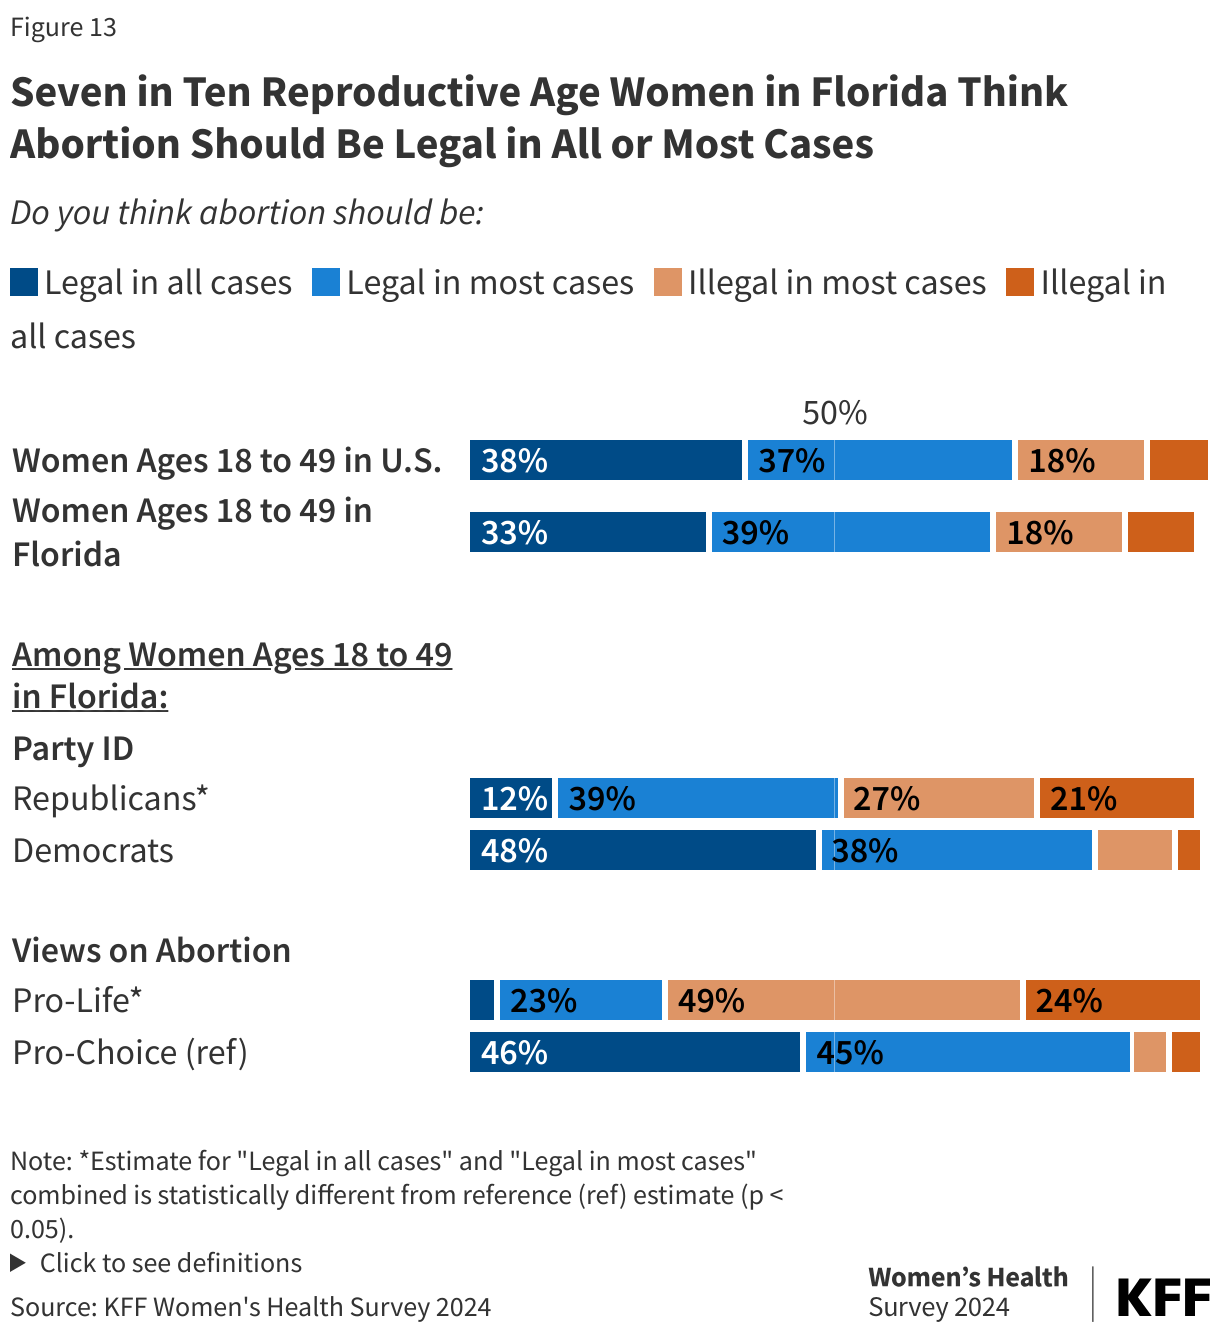
Nearly three in four (72%) reproductive age women in Florida think abortion should be legal in all or most cases, including the majority of Republican (51%) and Democratic (86%) women.
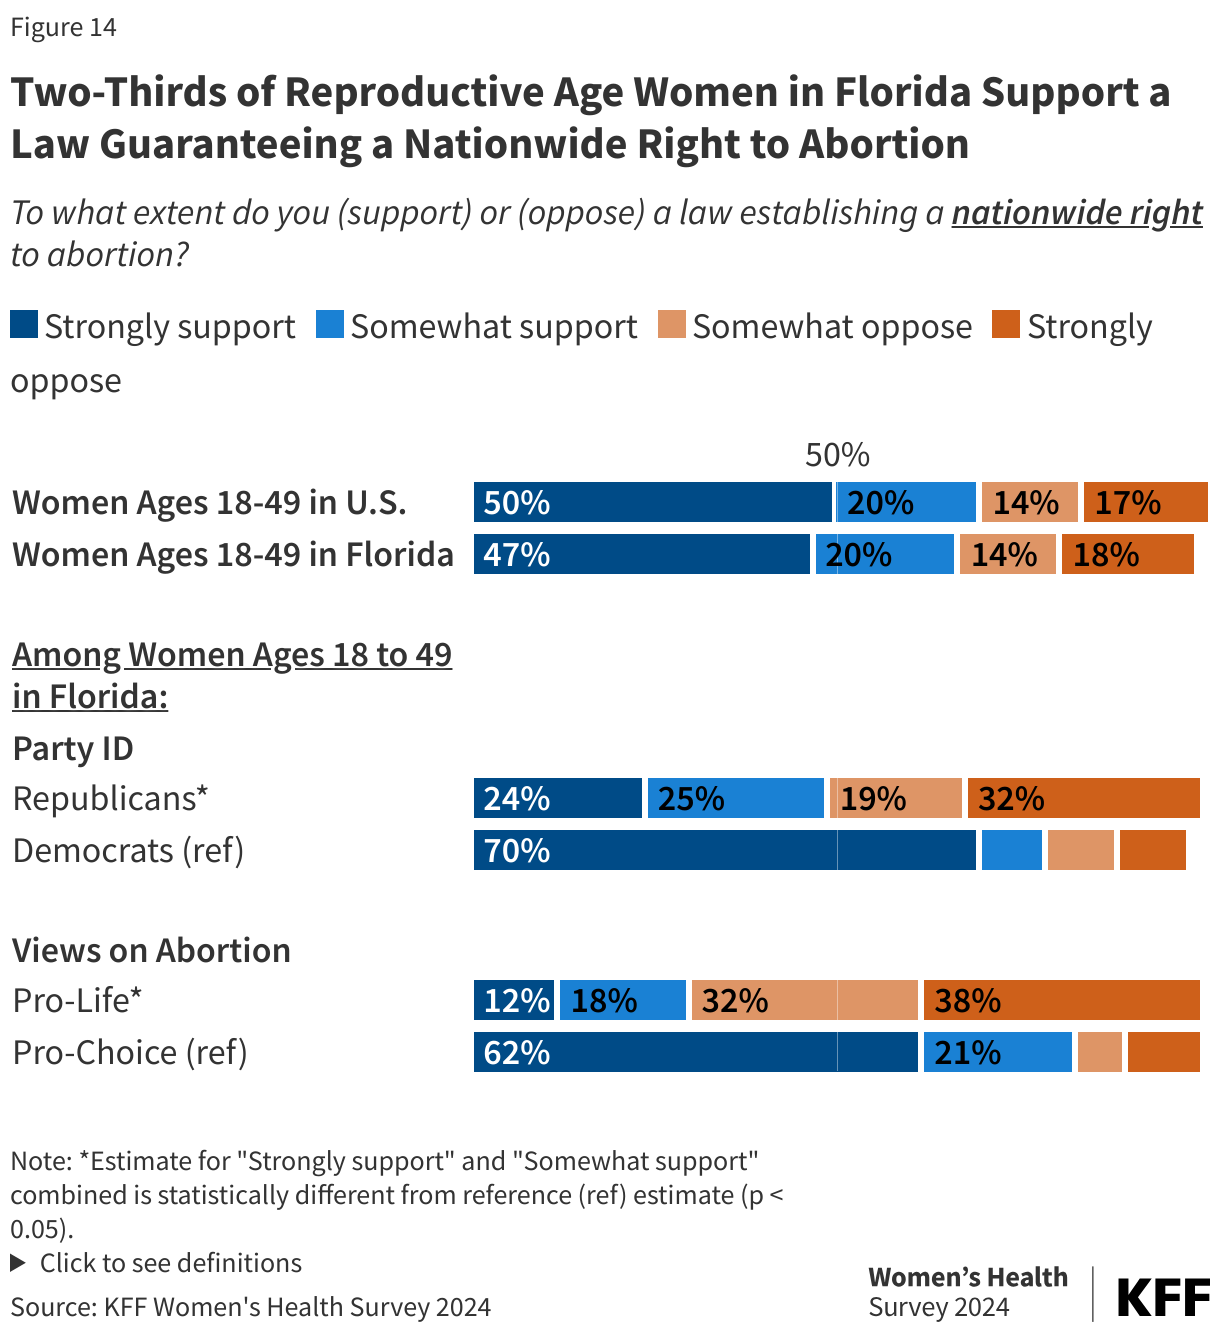
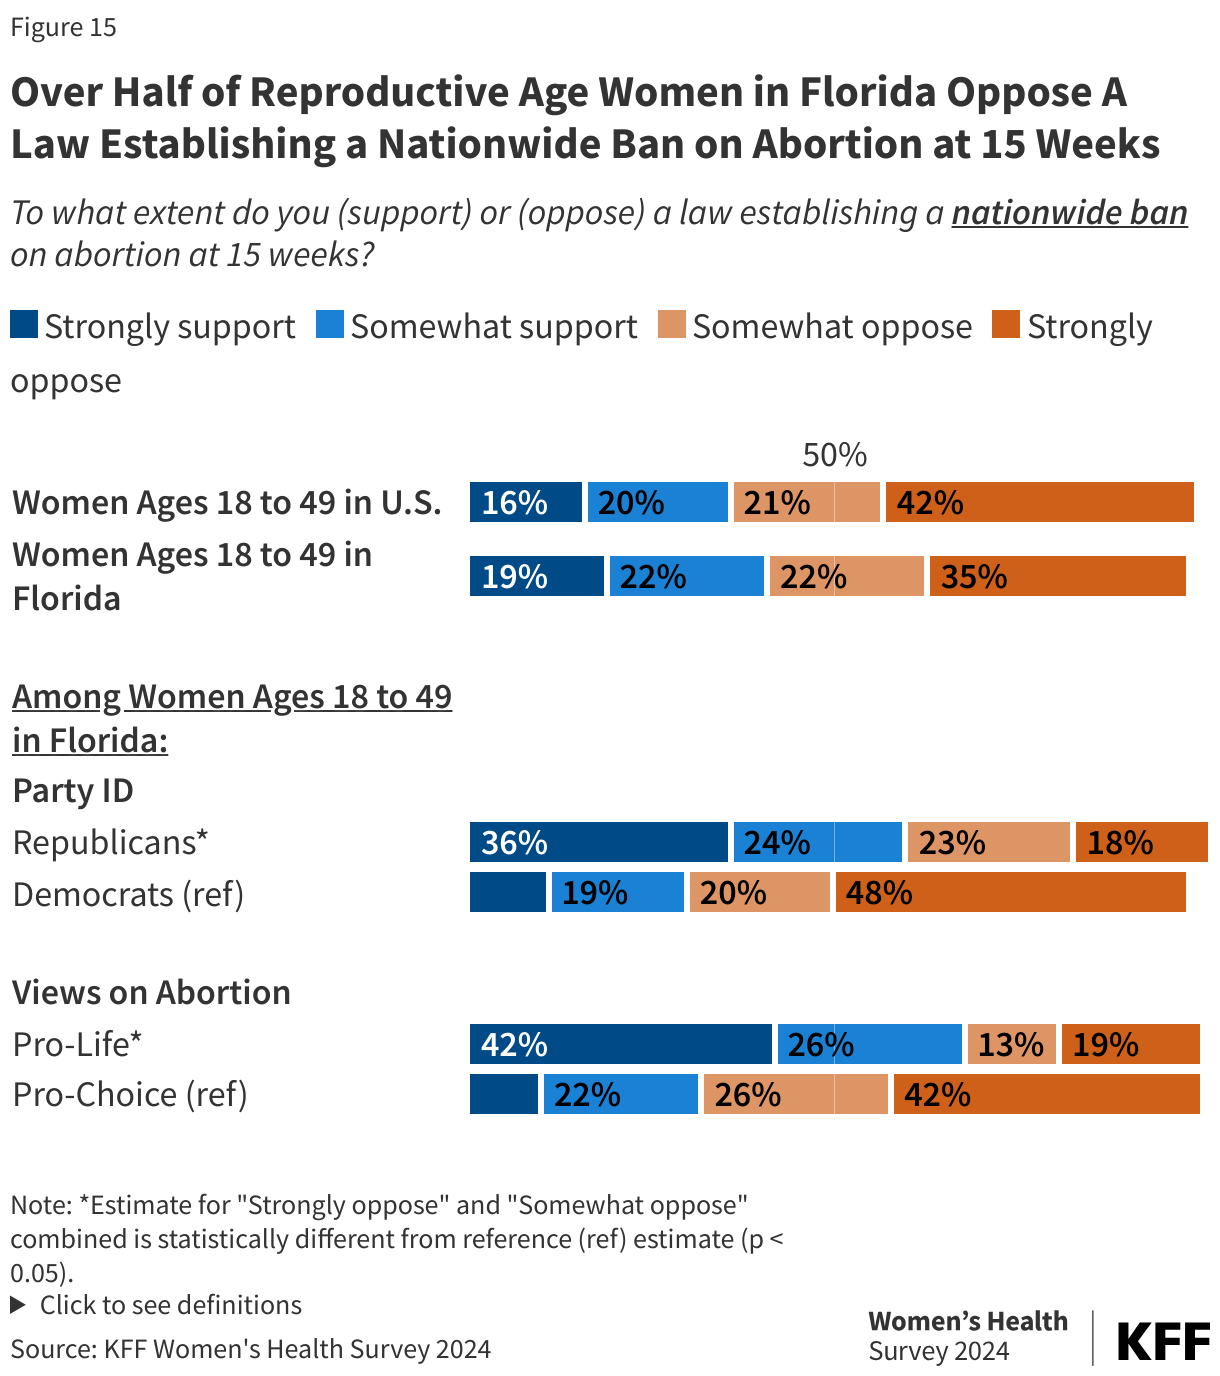
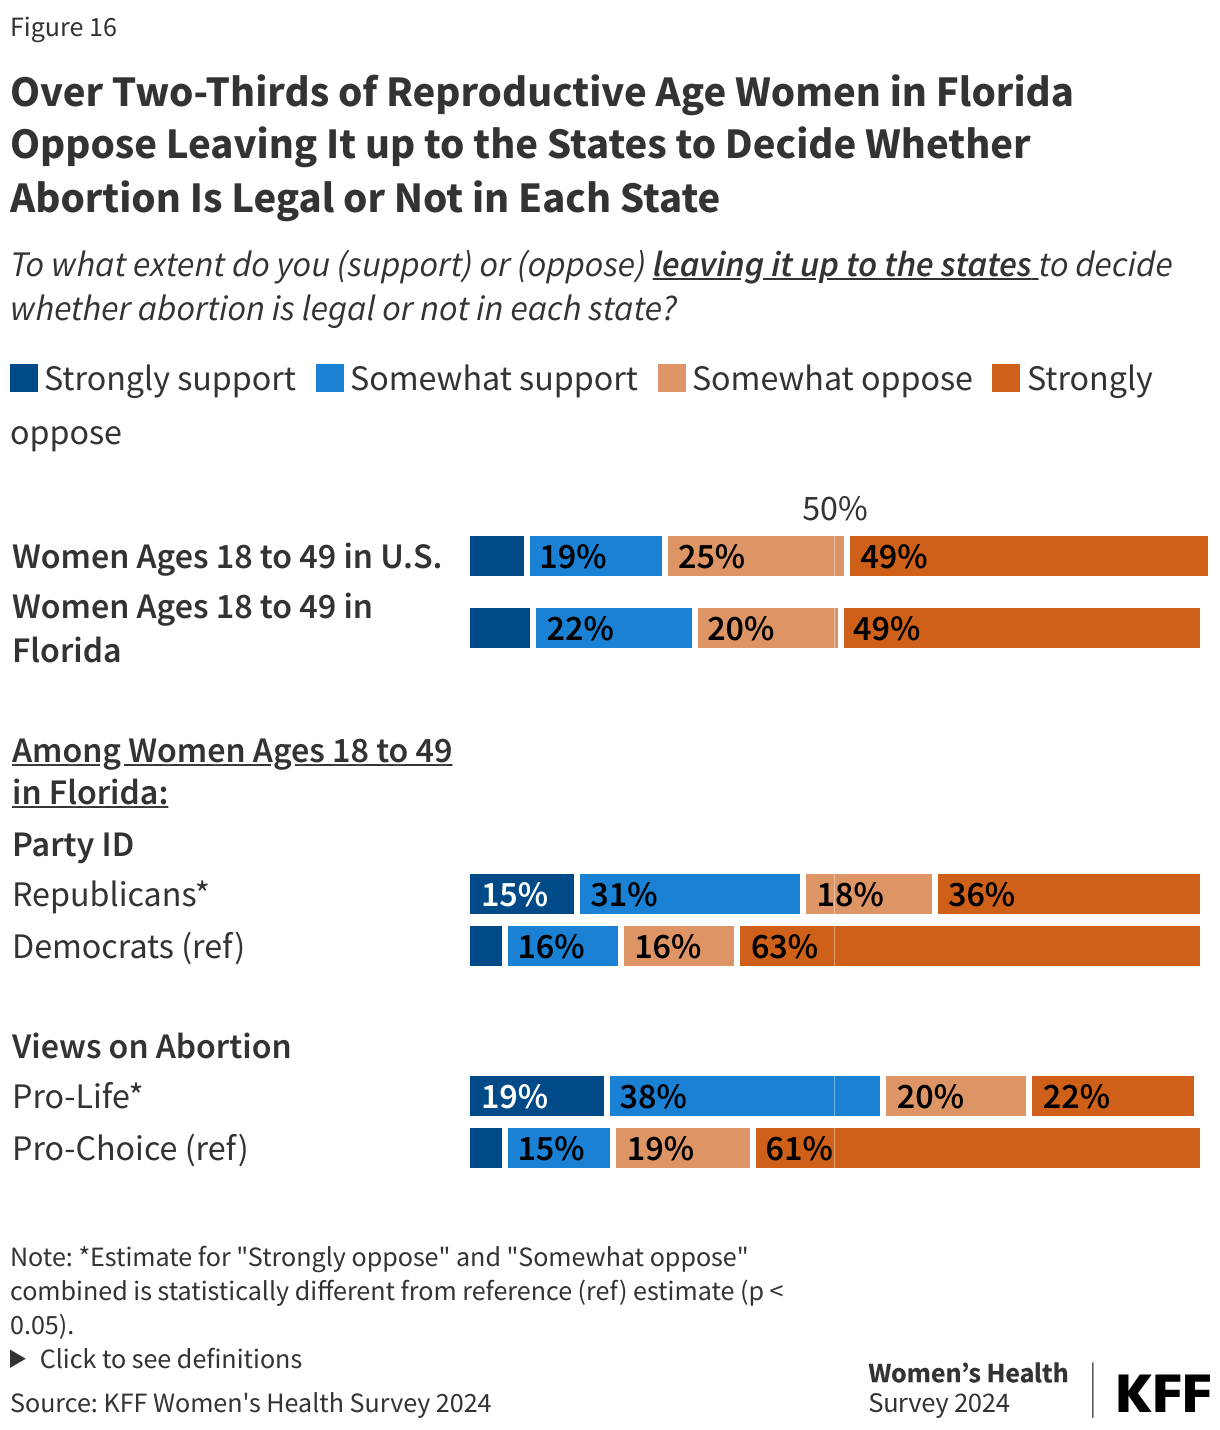
Two-thirds (67%) support a nationwide right to abortion, including large shares of Republican (49%) and Democratic (79%) women. Over half (57%) oppose a nationwide ban on abortion at 15 weeks and nearly seven in ten (69%) oppose leaving it up to the states to decide whether abortion is legal or not in each state. The majority of Republican (54%) and Democratic (79%) women oppose leaving it up to the states.
Introduction
Abortion is a key issue in the upcoming 2024 election and voters in up to 11 states across the U.S. may have an opportunity to vote on abortion-related ballot measures. On May 1, 2024, Florida’s 6-week abortion ban went into effect, limiting abortion before many women know they are pregnant and restricting access for women who were traveling to Florida to access abortion from across the South. This November, Florida voters will have an opportunity to vote on a citizen-initiated ballot measure that would protect the right to abortion up to viability (around 24 weeks of pregnancy) and when necessary, after that point to safeguard the pregnant person’s health.
This brief presents findings from the 2024 KFF Women’s Health Survey for 512 reproductive age women in Florida to provide state representative estimates of women’s experiences with and views on abortion among women in the state. The survey was fielded from May 13 to June 18, 2024, before Biden withdrew from the presidential race. While the survey asked about many topics related to women’s experiences around a broad set of health topics, this brief focuses on women’s experiences and knowledge around abortion in Florida. An analysis of the findings for women in the United States and also in Arizona are also available. See the methodology section for detailed definitions, sampling design, and margins of sampling error.
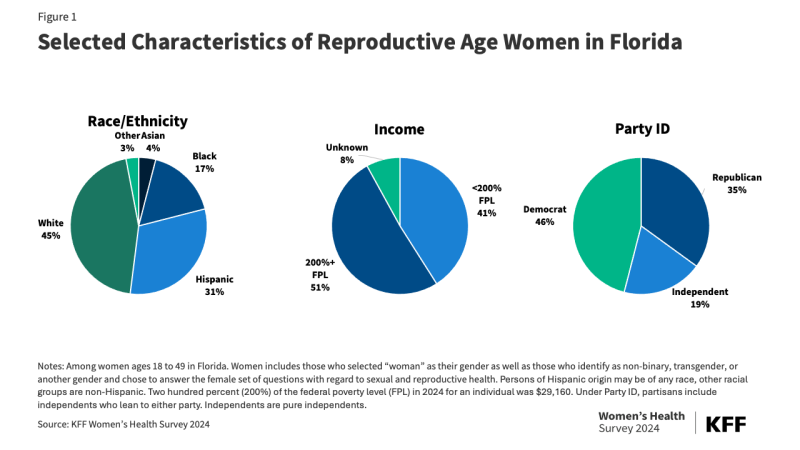
The findings in this brief are focused on a state-representative sample of 512 reproductive age (18-49 years old) women in Florida (Figure 1). Findings for White and Hispanic women are presented where there was a large enough share to report on with nearly a third (31%) of reproductive age women in Florida identifying as Hispanic and 45% as non-Hispanic White. Over four in ten (41%) reproductive age women in Florida have incomes below 200% of the federal poverty level (FPL), which is $29,160 in 2024. Nearly half (46%) of reproductive age women in Florida are Democrats or Democrat-leaning, while 35% are Republican or Republican-leaning, and 19% are independents. These demographics are similar to the U.S. demographics overall, aside from race/ethnicity, where 21% are Hispanic and 54% as non-Hispanic White.
Findings
Women’s Experiences with Abortion
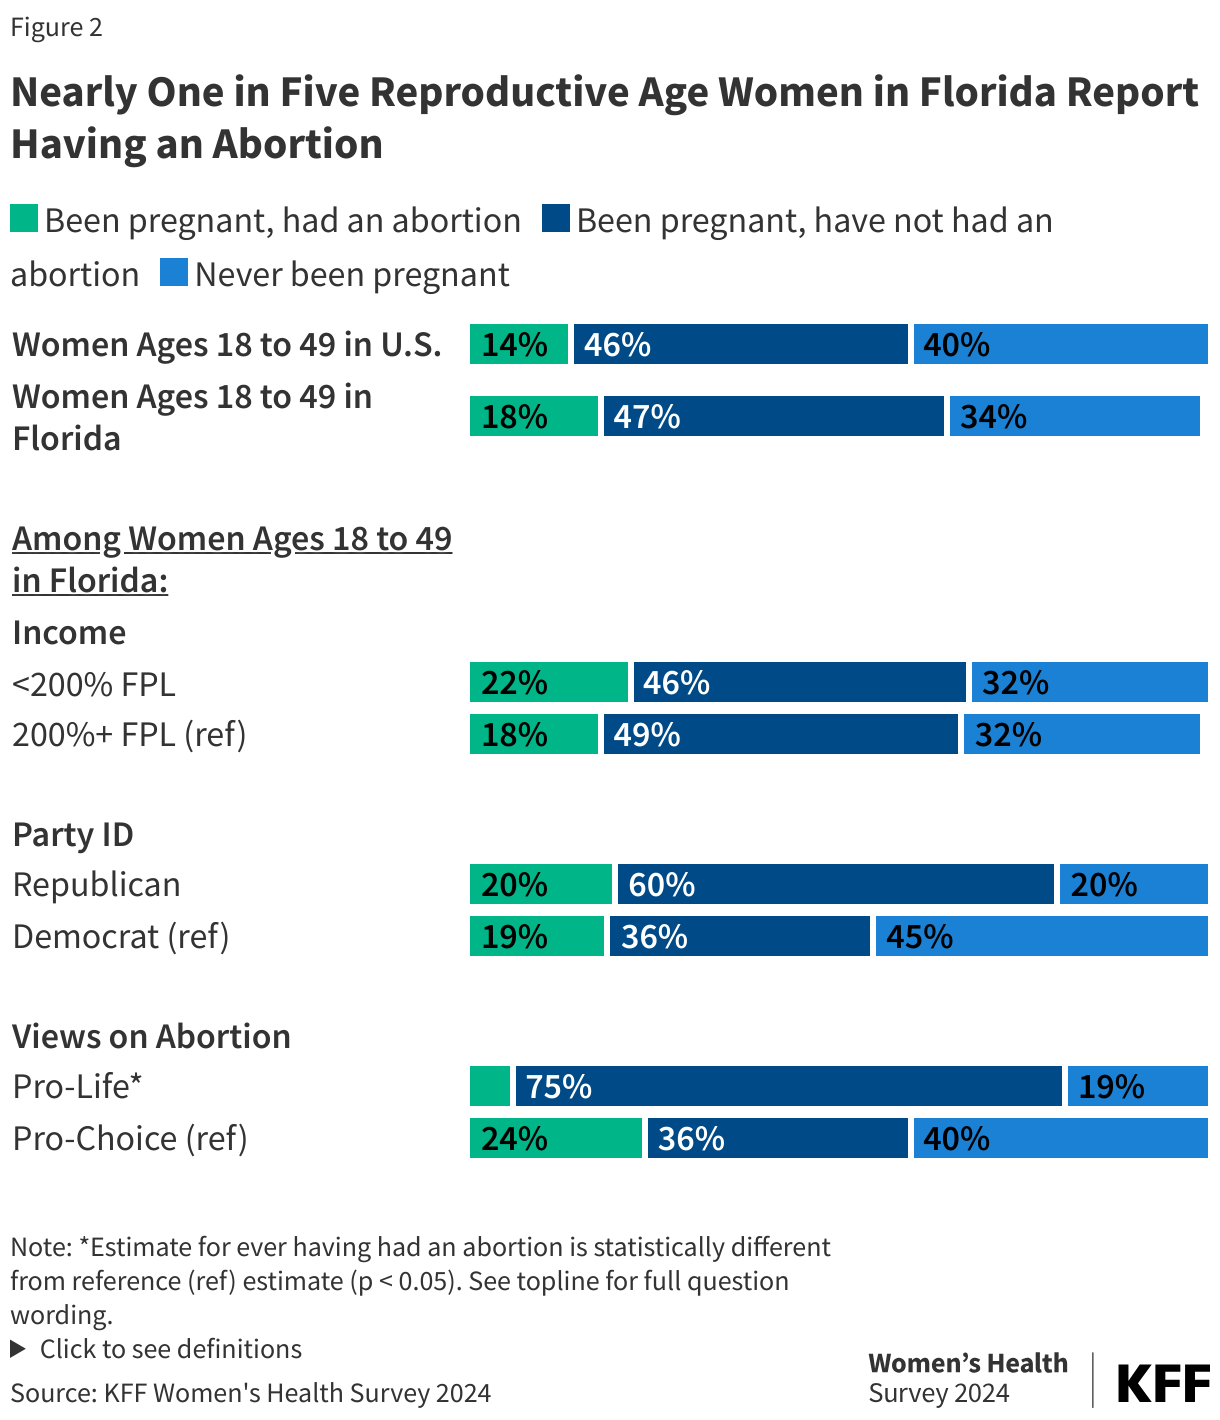
Nearly one in five reproductive age women in Florida report they have ever had an abortion (Figure 2). Similar shares of women across income and party ID report having had an abortion. Smaller shares of women who identify as pro-life say they have had an abortion compared to women who identify as pro-choice.
Among those who say they have wanted or needed an abortion, 14% say they were unable get one (3% among all reproductive age women). Among the reasons women cite for not getting an abortion include not being able to afford it, being too far along, not being in a position to care for a child and being pro-life or having religious reasons.
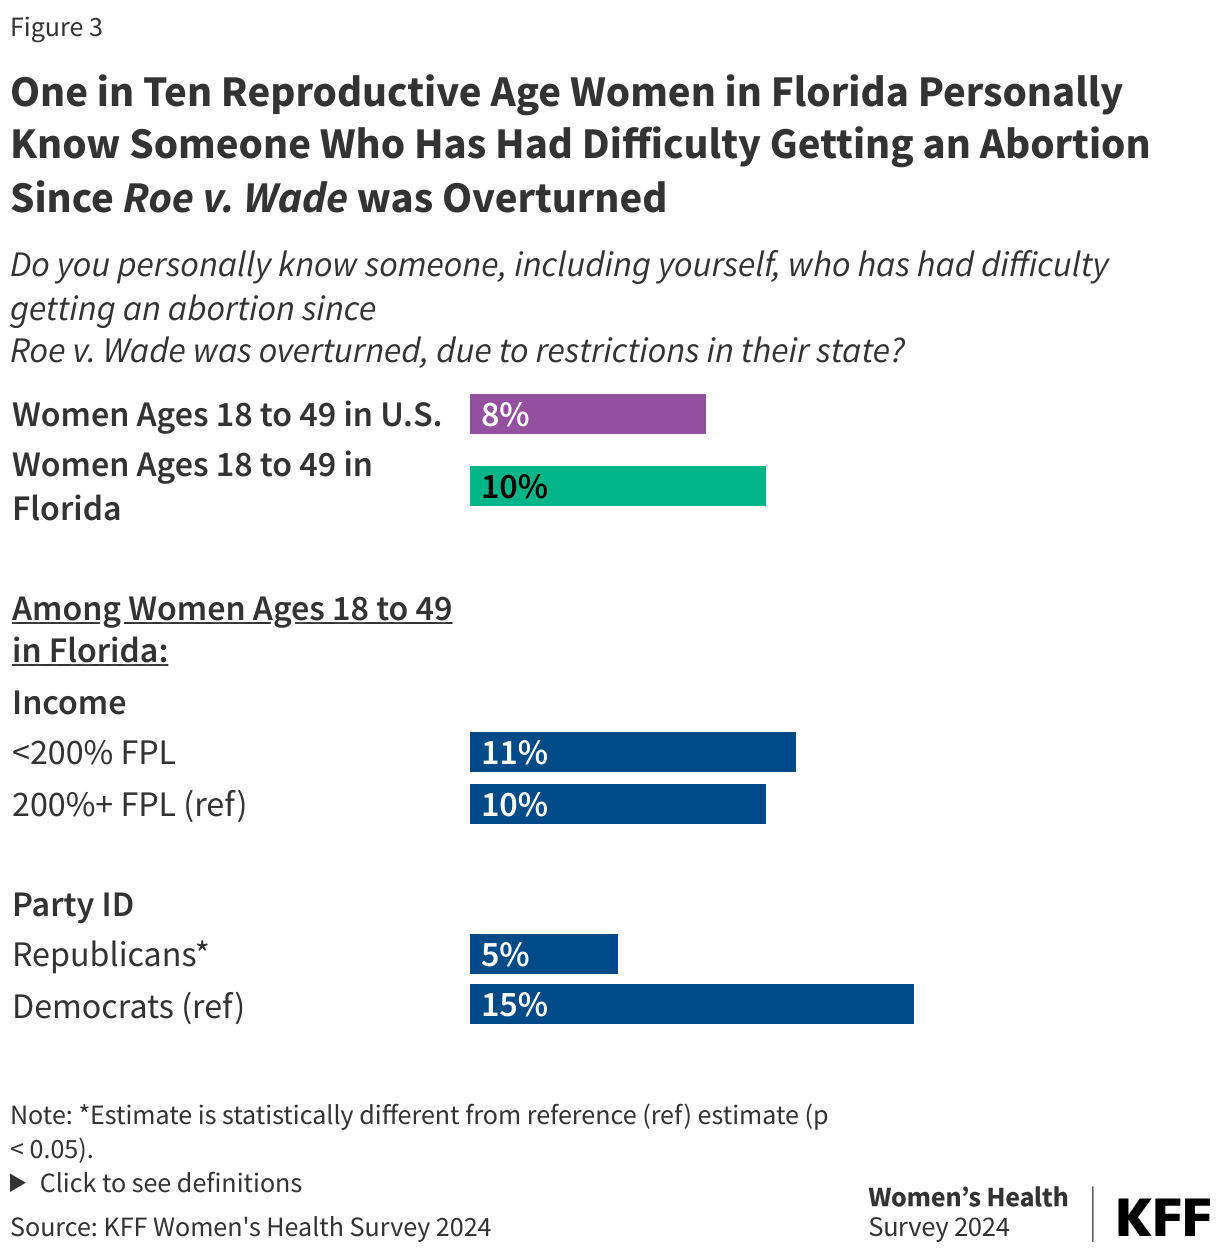
One in ten (10%) women in Florida know someone, including themselves, who has had difficulty getting an abortion since Roe v. Wade was overturned, similar to the U.S. share (8%) (Figure 3). Larger shares of Democratic women say they know someone, including themselves, who has had difficulty getting an abortion compared to Republican women (15% vs. 5%).
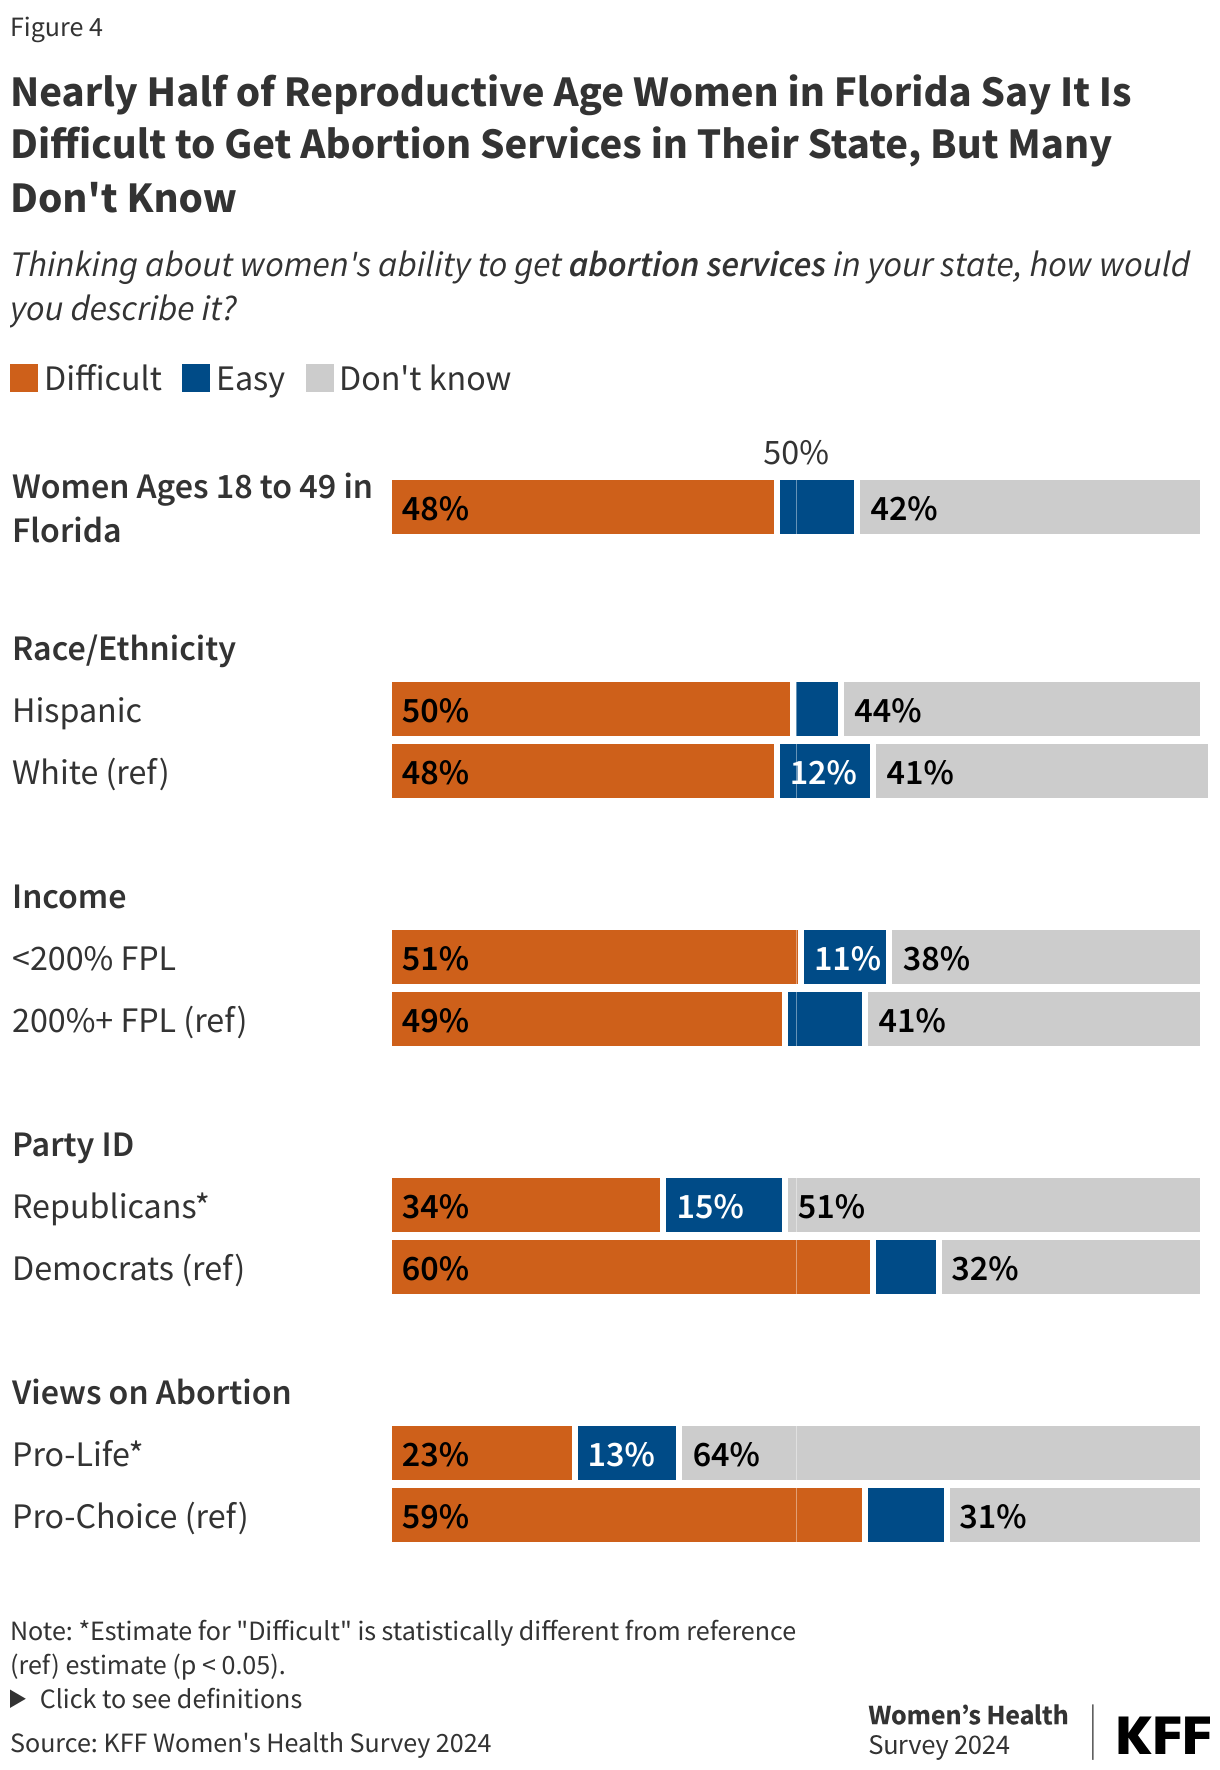
When asked about ease or difficulty accessing abortion services in Florida, nearly half (48%) say abortion services are difficult to access, and another 42% say they don’t know (Figure 4). Larger shares of Democratic women (60%) and those who identify as pro-choice (59%) say it is difficult to access these services compared to Republican women (34%) and those who identify as pro-life (23%). When the survey was fielded, Florida had just instituted a 6-week LMP abortion ban after having a 15-week ban in place since 2022.
The majority of women in Florida are concerned about the impact of abortion restrictions on health and safety for themselves and loved ones. Florida currently limits abortions to 6-weeks of pregnancy with exceptions for life, physical health, rape/incest, and lethal fetal anomalies after that gestational limit. Six in ten reproductive age women in Florida say they are concerned (60%) they or someone close to them would not be able to get an abortion if it was needed to preserve their life or health, including a third (35%) who say they are very concerned (Figure 5). Nearly three in four Hispanic women (72%) and women who identify as pro-choice (75%), as well as eight in ten (81%) Democratic women are concerned.
Florida Amendment 4, the Right to Abortion InitiativeFlorida Amendment 4, a citizen-initiated ballot measure, will appear on the November 2024 ballot in Florida. Abortion access is currently limited to the first 6 weeks of pregnancy, but a “yes” vote in the election will support the establishment of a constitutional right to abortion before fetal viability (around 24 weeks of pregnancy) or when necessary to protect the patient’s health, as determined by the patient’s healthcare provider. It will need 60% of Florida voters to vote “yes” in order to pass.
Nearly two-thirds (62%) of reproductive age women in Florida say they are concerned about the impact abortion bans may have on the safety of a potential future pregnancy for themselves or someone close to them (Figure 6). Seven in ten Hispanic women (71%), Democratic women (78%), and women who identify as pro-choice (76%) are concerned compared to 58% of White women, 44% of Republican women, and 29% of women who identify as pro-life.
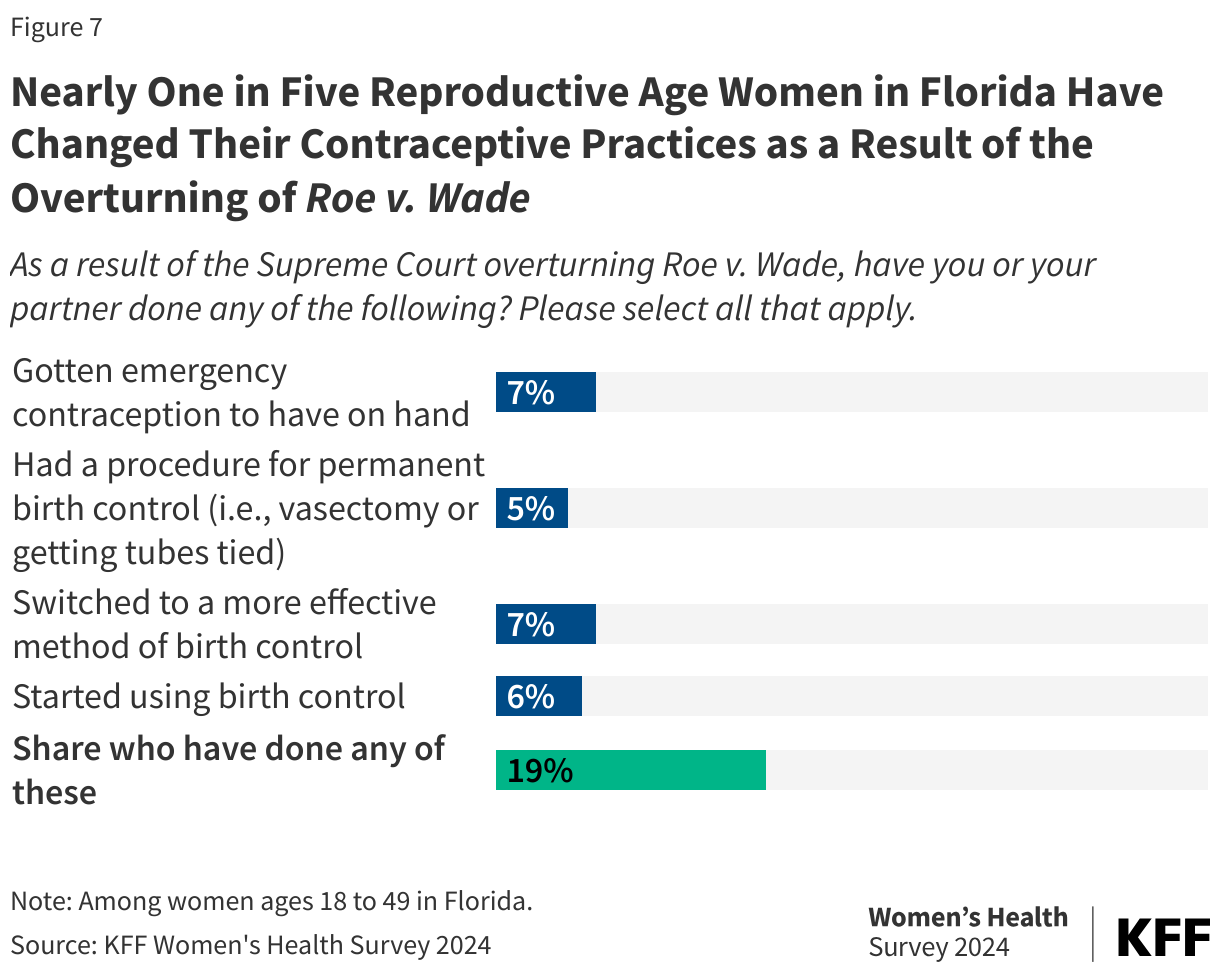
About one in five (19%) reproductive age women in Florida have changed their contraceptive practices as a result of the overturning Roe v. Wade. Women report either obtaining emergency contraception to have on hand, having a procedure for permanent birth control, switching to a more effective method of birth control, or starting using birth control since the overturning of Roe v. Wade (Figure 7). One in four (26%) reproductive age women with low incomes (below 200% of the FPL) report taking one of these actions, double the rate of women with higher incomes (13%) (data not shown). Women with low incomes report getting emergency contraception at more than twice the rate of women with higher incomes (11% vs. 4%) (data not shown).
Awareness of Abortion Availability and Policy
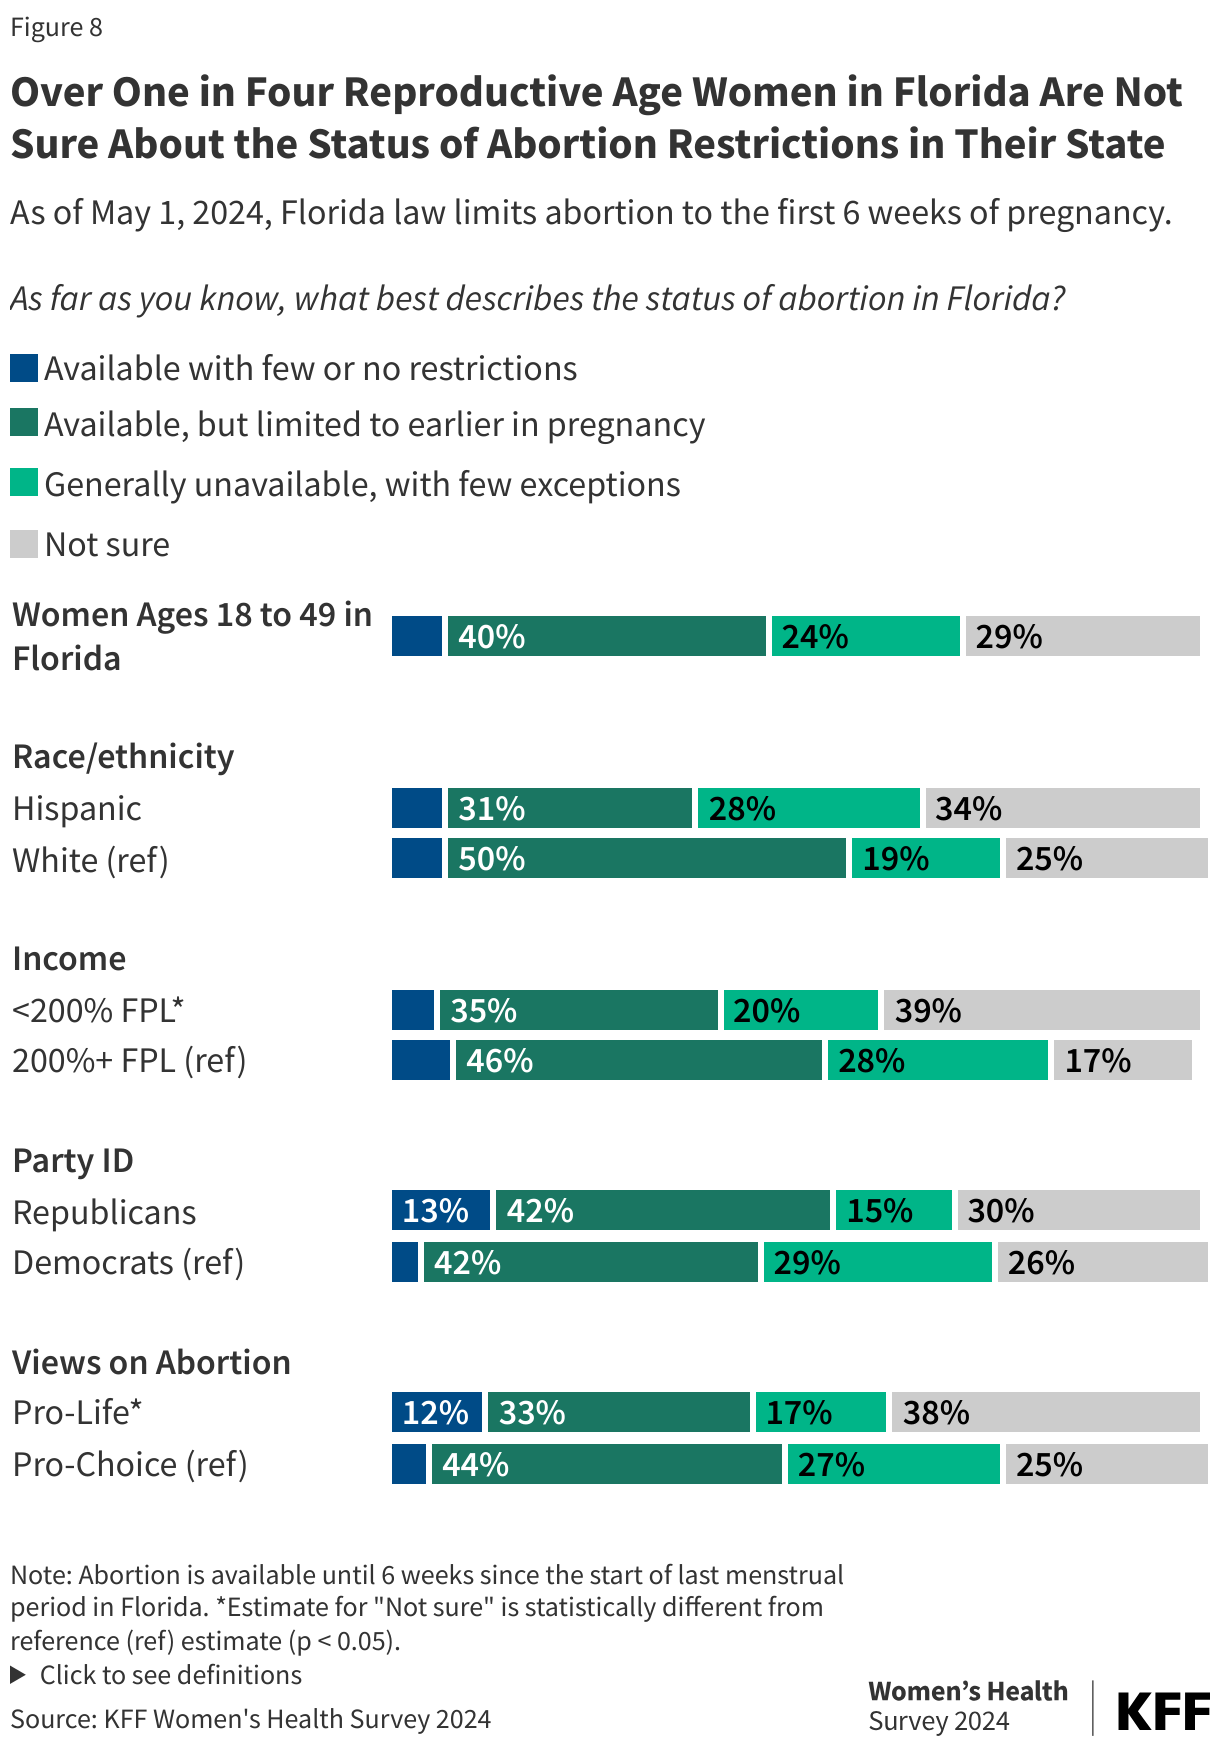
Many women reproductive age women in Florida are unsure about the status of abortion availability in the state. When this survey was fielded, Florida’s 6-week LMP ban had recently taken effect. Four in ten women in Florida (40%) correctly describe the status of abortion in Florida as available but limited to earlier in pregnancy (Figure 8). Nearly a quarter (24%) of women describe abortion as generally unavailable, with few exceptions, which for many is an accurate description of a 6-week ban. Another three in ten (29%) are not sure of the status of abortion in Florida and 7% incorrectly respond that abortion is available with few or no restrictions. About four in ten women with lower incomes (39%) and women who identify as pro-life (38%) are not sure of the status of abortion in Florida compared to 17% of women with higher incomes and 25% of women who identify as pro-life.
A third (34%) of reproductive age women in Florida say they would not know where they could get an abortion nor where to find the information about getting one if they wanted or needed an abortion in the near future (Figure 9). Websites like Plan C , AbortionFinder and ineedana.com, identify the nearest online and bricks-and-mortar abortion providers, as well as funding assistance. These websites also identify how people can find medication abortion pills online.
Two-thirds (65%) of women of reproductive age in Florida have heard of medication abortion, with awareness highest among White women, those with higher incomes and Democrats (Figure 10). The overall share of reproductive age women in Florida who have heard of medication abortion is similar to the overall share across the U.S (67%).
Although medication abortion is a legal option in Florida for abortions up to six weeks of pregnancy, only one in five (18%) reproductive age women are aware that it is the case. A larger share of women who identify as pro-choice are aware compared to women who identify as pro-life (21% vs. 14%) (Figure 11).
Few are aware of the availability of medication abortion pills online. In Florida, medication abortion is permitted up to six weeks of pregnancy, but only from an in-person clinic. The law that bans abortions after six weeks of pregnancy also prohibits providers from using telehealth to offer abortion services, requiring that physicians dispense medication abortion pills to their patients in person. There are websites, however, such as Plan C, ineedana, or AbortionFinder, that provide information for people seeking to buy medication abortion pills online and have them sent to Florida. However, awareness of these online services is low. Only one in ten (9%) reproductive age women in Florida are aware that someone could get medication abortion pills online if they wanted or needed them (Figure 12). Awareness is similarly low across age, race/ethnicity, income, party ID, and people’s views on abortion.
Opinions on Abortion Policy
Seven in ten (72%) of reproductive age women living in Florida think abortion should be legal in all or most cases (Figure 13). Notably, half of reproductive age women who are Republican in the state say they believe abortion should be legal in most or all cases. Even among women who say they are “pro-life, one in four believe abortion should be legal in most cases. Nearly three in four women who identify as pro-life (73%), and half (48%) of Republican women think abortion should be illegal in all or most cases.
Since the Supreme Court’s Dobbs decision, there have been calls to establish a nationwide right to abortion, which is supported by two-thirds of reproductive age women in Florida. Not surprisingly, higher shares of Democratic women in Florida support a national guarantee of abortion rights compared to Republican women (79% vs. 49%) and larger shares of women who identify as pro-choice compared to pro-life (83% vs. 30%) (Figure 14). The majority of Hispanic and White women in Florida, as well as women across incomes, support a law guaranteeing a nationwide right to abortion.
Support for a nationwide ban on abortion at 15 weeks is weak in Florida. Early in the campaign, Former President Trump said he would consider supporting a national 15 or 16-week ban on abortion, but more recently has said he supports leaving abortion policy to states, which allows full bans and gestational restrictions to stay in effect. While a higher share of Republican women (60%) and women who identify as pro-life (68%) would support it, over half (57%) of reproductive age women in Florida oppose a law establishing a nationwide ban on abortion at 15 weeks (Figure 15).
Over two-thirds (69%) of women in Florida oppose leaving it up to the states to decide the legality of abortion, a policy that has been supported by former President Donald Trump (Figure 16). This policy, however, is somewhat or strongly supported by 54% of reproductive age Republican women. Larger shares of women who identify as pro-life support leaving it up to the states compared to women who identify as pro-choice (57% vs. 19%).
After six months of living with a highly restrictive abortion law that limits abortion access to the first six weeks of pregnancy, voters will have an opportunity to cast a vote regarding whether the right to abortion up to viability will be enshrined in their state constitution. If the amendment gets the support of 60 percent of voters, it will reverse the current 6-week ban and protect abortion rights until the point of viability, considered to be about 24 weeks.
Methodology
The 2024 KFF Women’s Health Survey was designed and analyzed by women’s health researchers at KFF. The survey was conducted from May 13 – June 18, 2024, online and by telephone among a nationally representative sample of 6,246 adults ages 18 to 64, including 3,901 women ages 18 to 49. Women include anyone who selected woman as their gender (n = 3,867) or who said they were non-binary (n = 26), transgender (n = 4), or another gender (n = 3) and chose to answer the female set of questions with regard to sexual and reproductive health. The project includes oversamples of women ages 18 to 49 in Arizona (n = 298) and Florida (n = 512). Sampling, data collection, weighting, tabulation, and IRB approval by the University of Southern Maine’s Collaborative Institutional Review Board were managed by SSRS of Glenn Mills, Pennsylvania in collaboration with women’s health researchers at KFF.
Throughout the reports of findings, we refer to “women”. This includes respondents who said their gender is “woman,” plus those who said their gender is “transgender,” or “non-binary,” or another gender and that they prefer to answer the survey’s set of questions for females. We followed this approach to try to include as many people as possible but recognize that some people who need and seek abortion and other reproductive health care services may not be represented in the findings or identify as women.
The national sample as well as the samples in Arizona and Florida were drawn from two nationally representative probability-based panels: the SSRS Opinion Panel and the Ipsos KnowledgePanel. The SSRS Opinion Panel is a nationally representative probability-based panel where panel members are recruited randomly in one of two ways: (a) Through invitations mailed to respondents randomly sampled from an Address-Based Sample (ABS) provided by Marketing Systems Groups (MSG) through the U.S. Postal Service’s Computerized Delivery Sequence (CDS); (b) from a dual-frame random digit dial (RDD) sample provided by MSG. For the online panel component, invitations were sent to panel members by email followed by up to five reminder emails. 5,276 panel members completed the survey online and panel members who do not use the internet were reached by phone (175). Another 970 respondents were reached online through the Ipsos Knowledge Panel to help reach adequate sample sizes among subgroups of interest, specifically women ages 18 to 49. This panel is recruited using ABS, based on a stratified sample from the CDS. The questionnaire was translated into Spanish, so respondents were able to complete the survey in English or Spanish.
The national sample was weighted by splitting the sample into three groups: [1] Women 18-49, [2] Women 50-64, and [3] Men 18-64 and each group was separately weighted to match known population parameters (see table below for weighting variables and sources). Weights within the three groups were then trimmed at the 4th and 96th percentiles, to ensure that individual respondents do not have too much influence on survey-derived estimates. After the weights were trimmed, the samples were combined, and the weights adjusted, so that the groups were represented in their proper proportions for a final combined, gender by age-adjusted weight. Lastly, two additional weights for interviews among women 18-49 in Arizona and Florida were calculated for analyses among those specific sub-groups. Each of the state-specific weights were trimmed at the 2nd and 98th percentiles, to ensure that individual respondents do not have too much influence on survey-derived estimates.
The margins of sampling error for the national sample of reproductive age women, Arizona reproductive age women, and Florida reproductive age women are plus or minus 2 percentage points, 8 percentage points, and 6 percentage points respectively. Numbers of respondents and margins of sampling error for key subgroups are shown in the table below. For results based on other subgroups, the margin of sampling error may be higher. Sampling error is only one of many potential sources of error and there may be other unmeasured error in this survey.
Group
N (unweighted)
M.O.S.E.
National Women Ages 18-49
3901
± 2 percentage points
White, non-Hispanic
1856
± 3 percentage points
Black, non-Hispanic
603
± 5 percentage points
Hispanic
963
± 4 percentage points
Asian
286
± 7 percentage points
<200% FPL
1667
± 3 percentage points
200%+ FPL
1974
± 3 percentage points
Pro-life
1074
± 4 percentage points
Pro-choice
2815
± 2 percentage points
Republican/Republican-leaning
1076
± 4 percentage points
Democrat/Democrat-leaning
1803
± 3 percentage points
Urban/Suburban
3379
± 2 percentage points
Rural
473
± 6 percentage points
Lives in a state where abortion is banned
857
± 4 percentage points
Lives in a state where abortion has gestational limits 6-12 weeks
819
± 5 percentage points
Lives in a state where abortion has gestational limits 15-22 weeks
594
± 6 percentage points
Lives in a state where gestational limited are 24+ weeks or none