Immigrants are a diverse group who play a significant role in our nation’s workforce and communities. As of June 2025, there were 51.9 million immigrants living in the U.S., and roughly one in four children in the U.S. live with at least one immigrant parent. During his second term, President Trump has implemented an array of immigration policy changes focused on restricting immigration and increasing interior immigration enforcement efforts. KFF conducted this survey in partnership with The New York Times to increase understanding of immigrant experiences amid this policy environment. It builds on the 2023 KFF/LA Times Survey of Immigrants and two additional surveys conducted by KFF in 2024 and 2025. This is one of three reports from this survey. Other reports focus on the health and health care experiences of immigrants and the political views of immigrant voters.
Key Takeaways
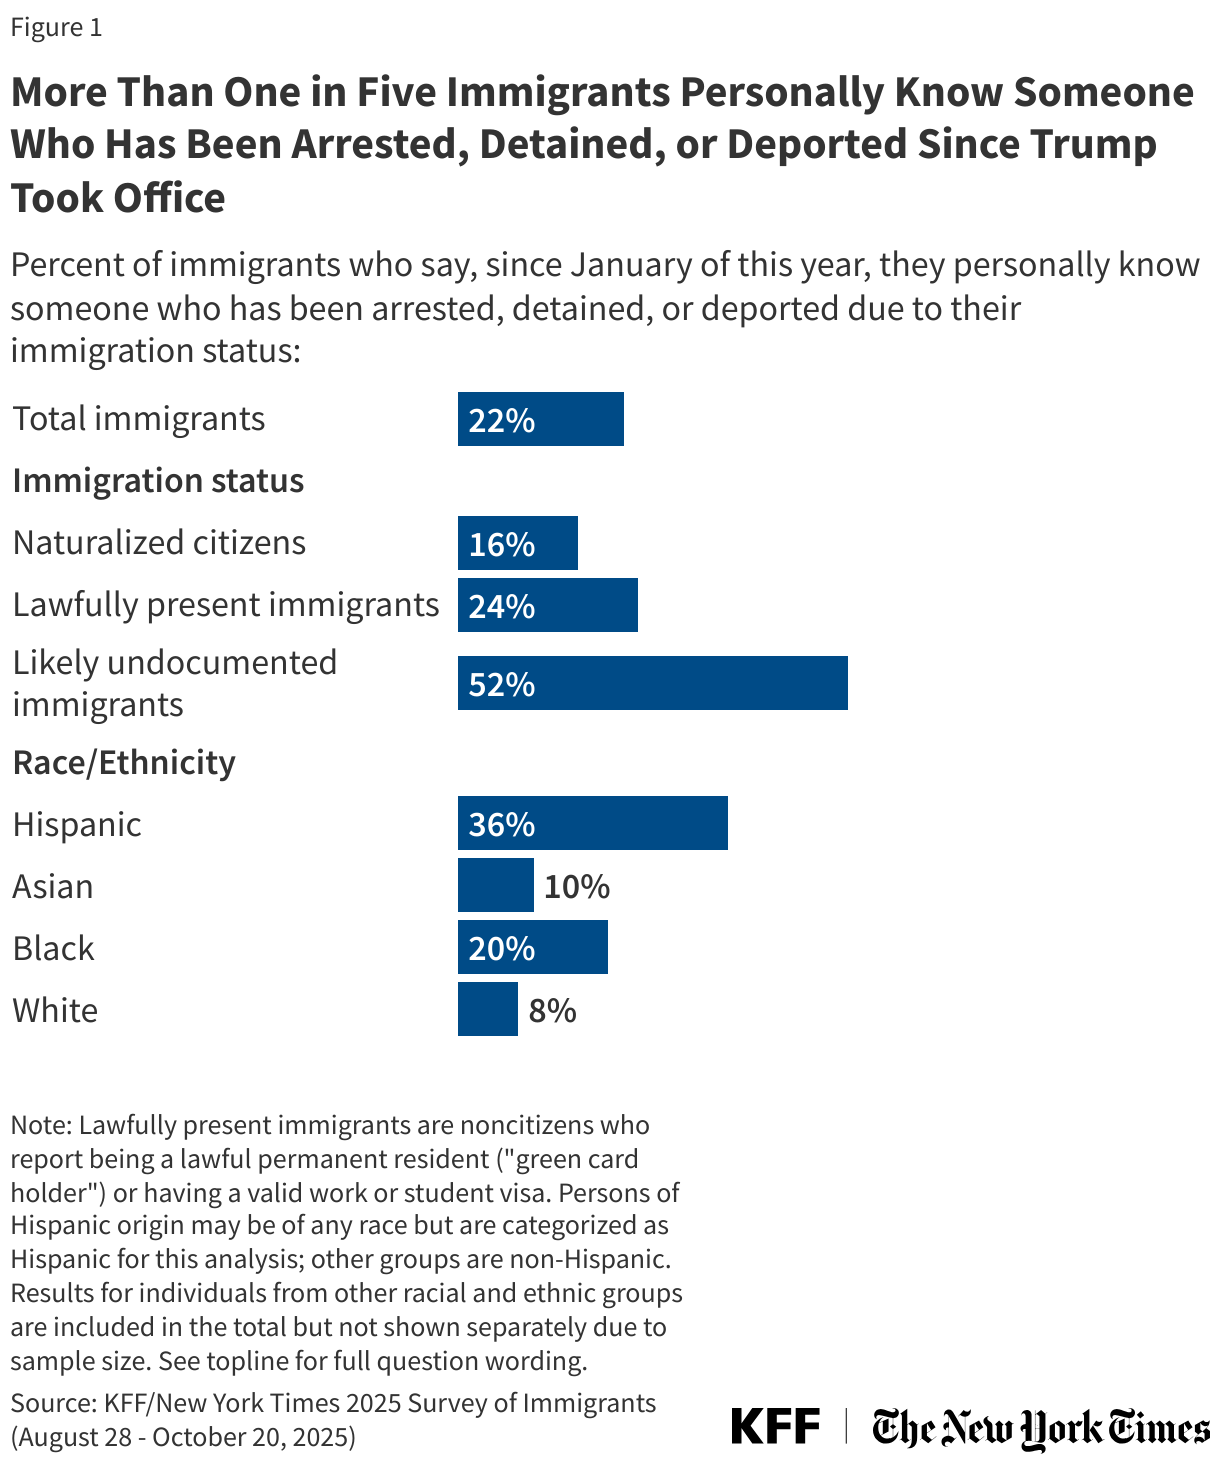
- As the Trump administration’s crackdown on immigration continues, an increasing share of immigrants know someone who has been detained or deported. More than one in five (22%) immigrants say they personally know someone who has been arrested, detained, or deported on immigration-related charges since President Trump took office in January, nearly three times the share who said so in April (8%). A large majority of those who know someone who was arrested, detained, or deported say that person had never committed a serious crime.
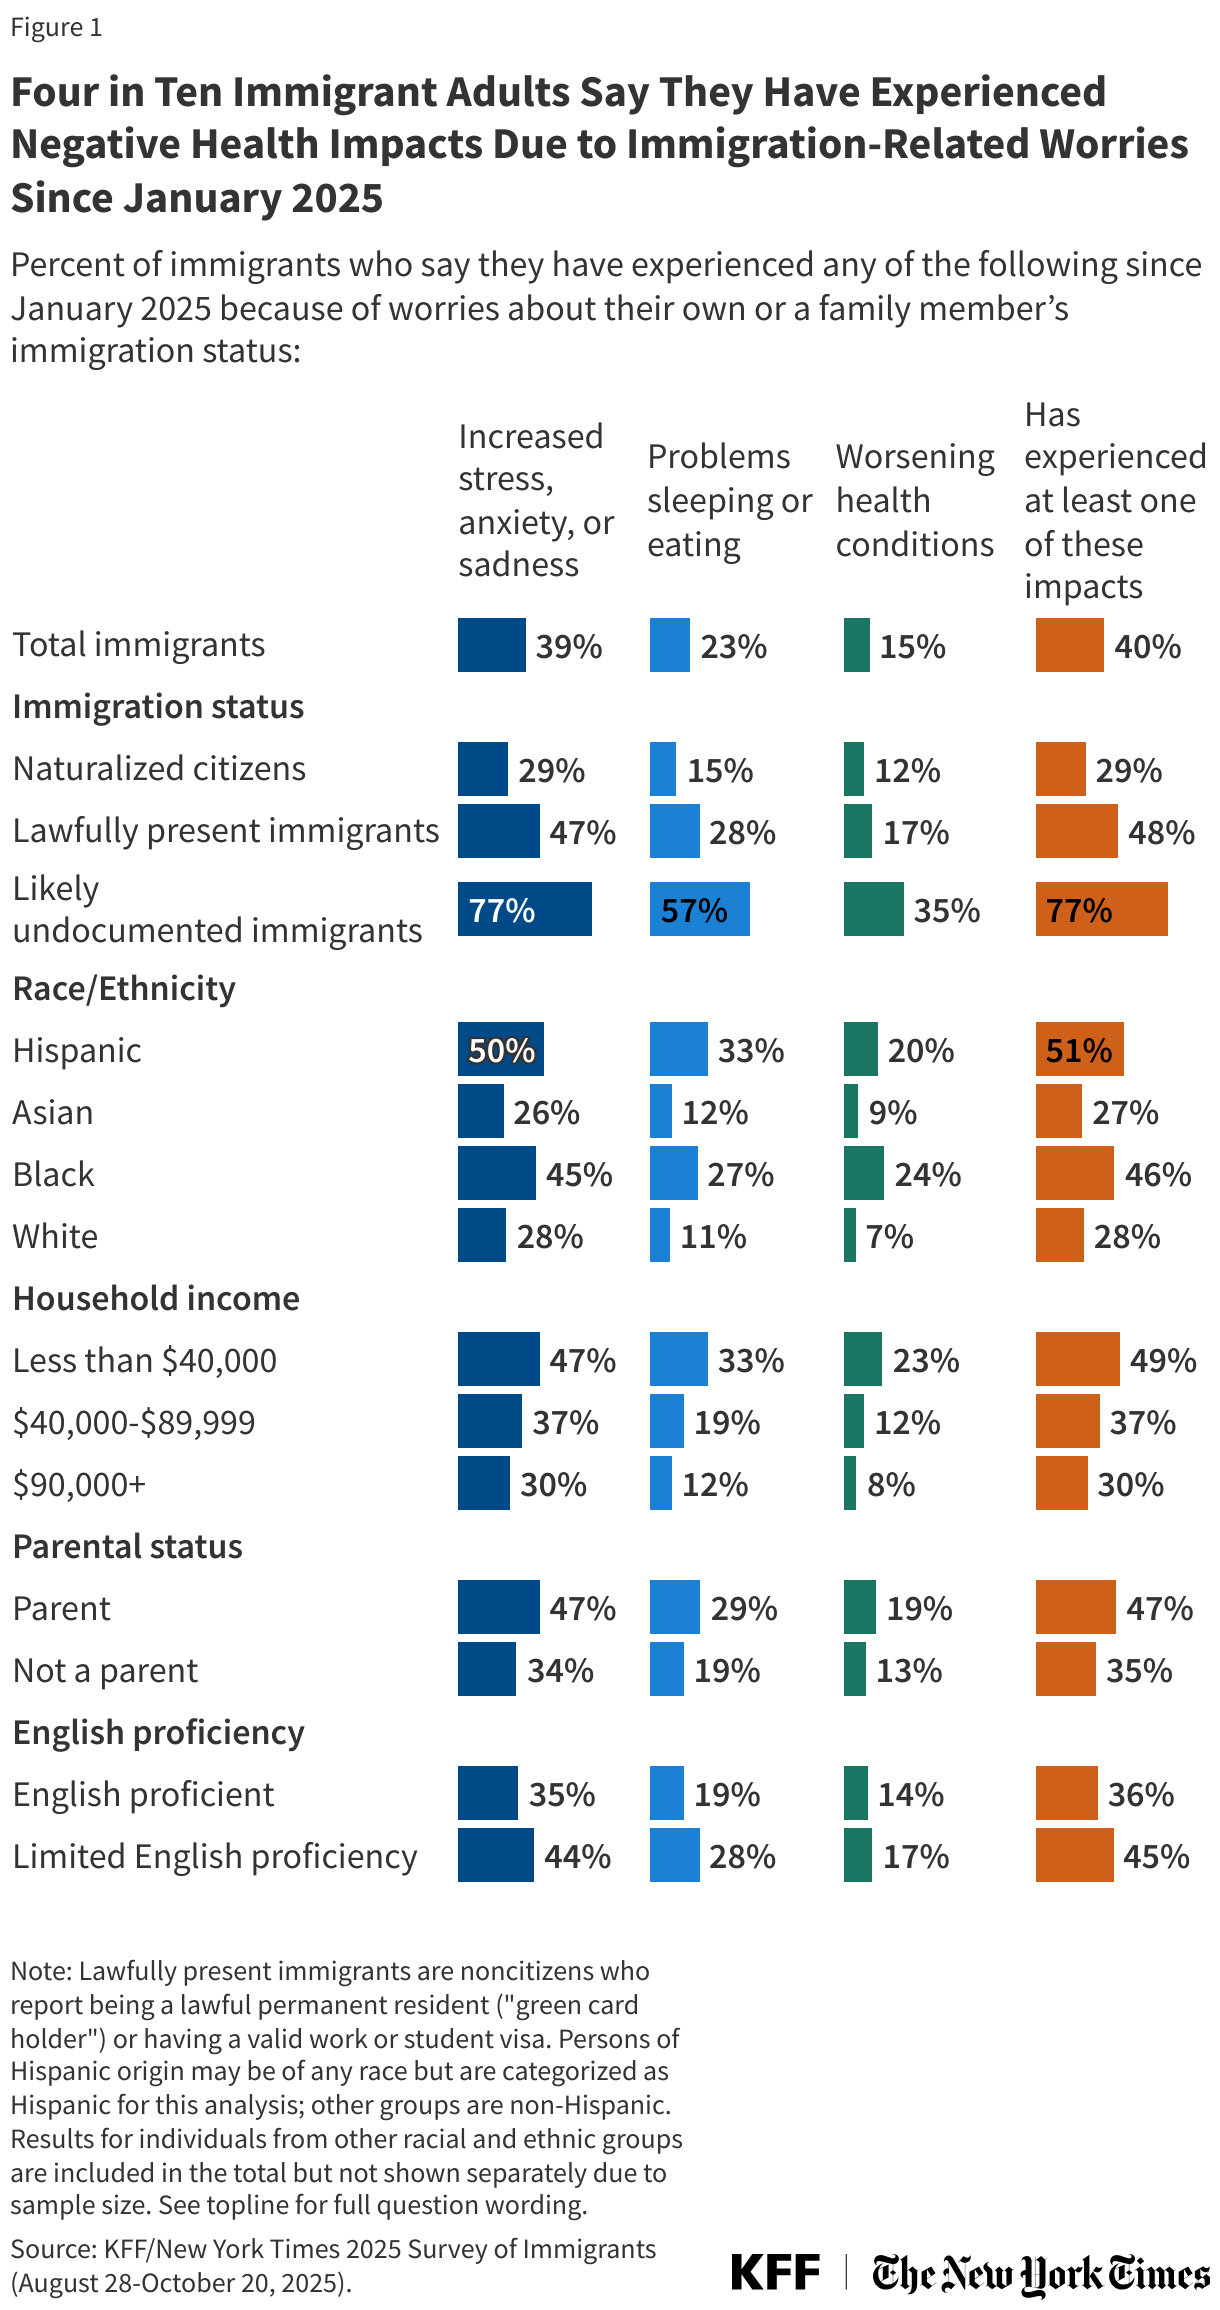
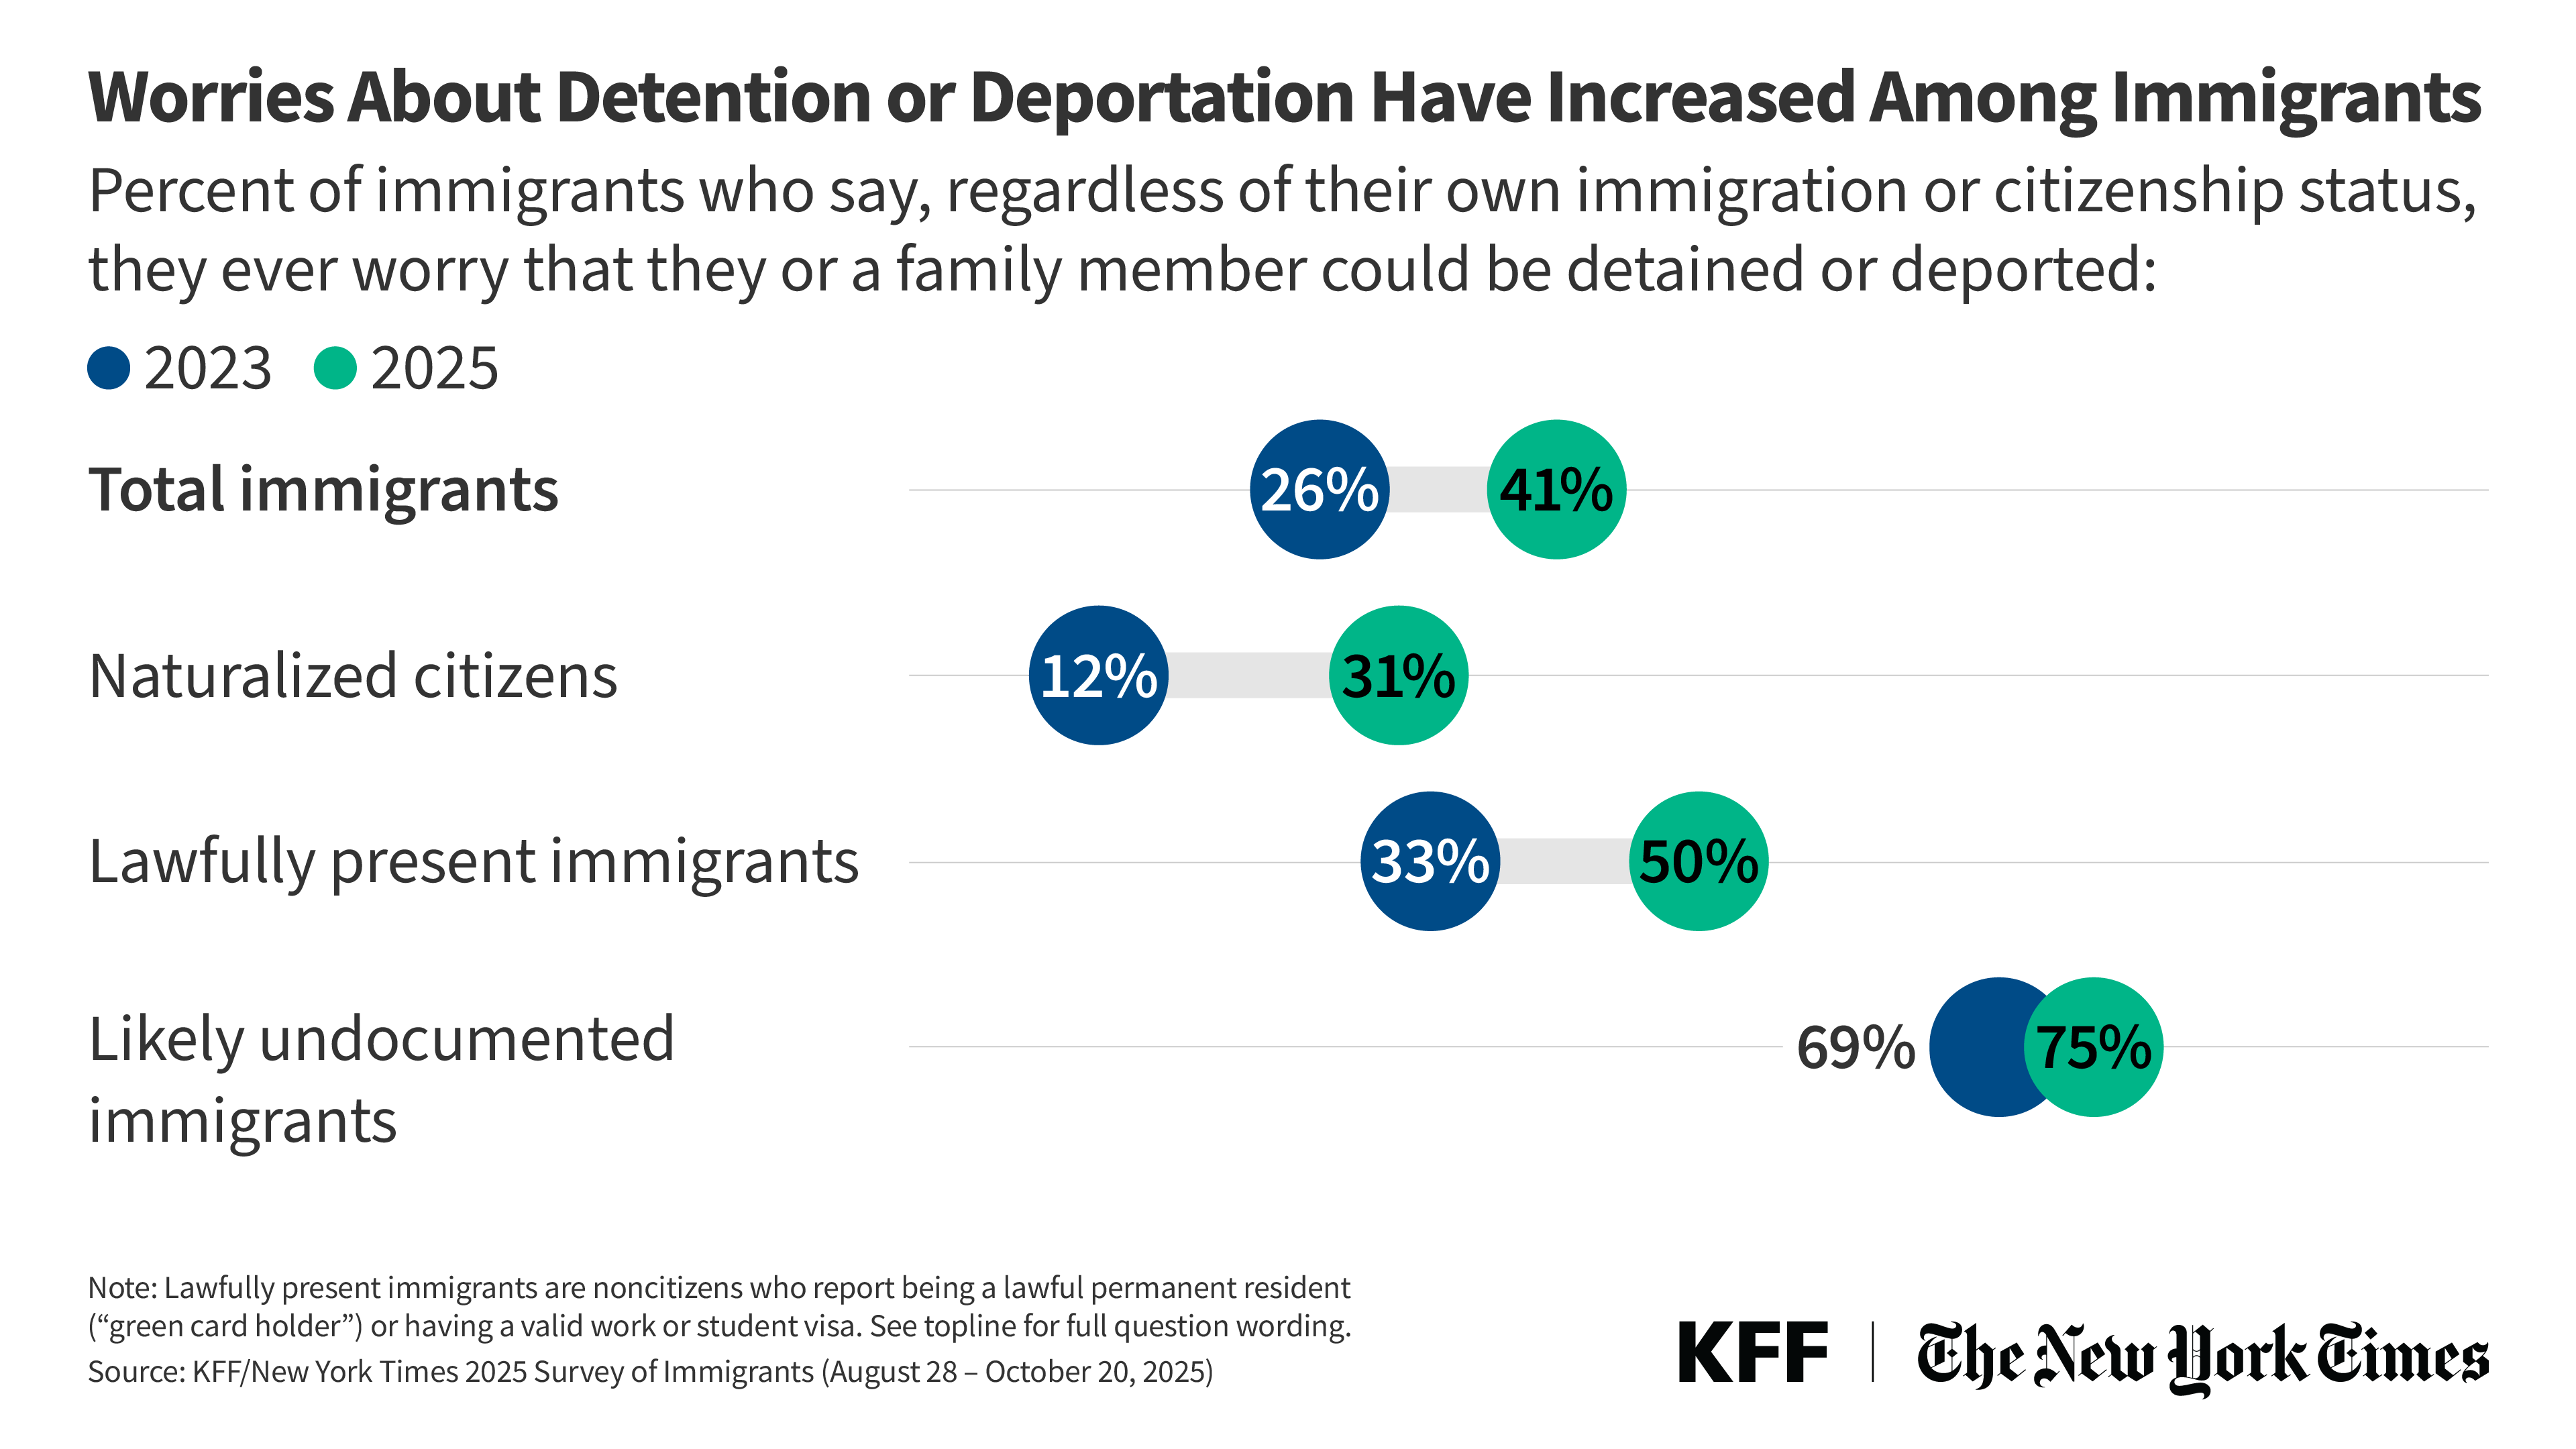
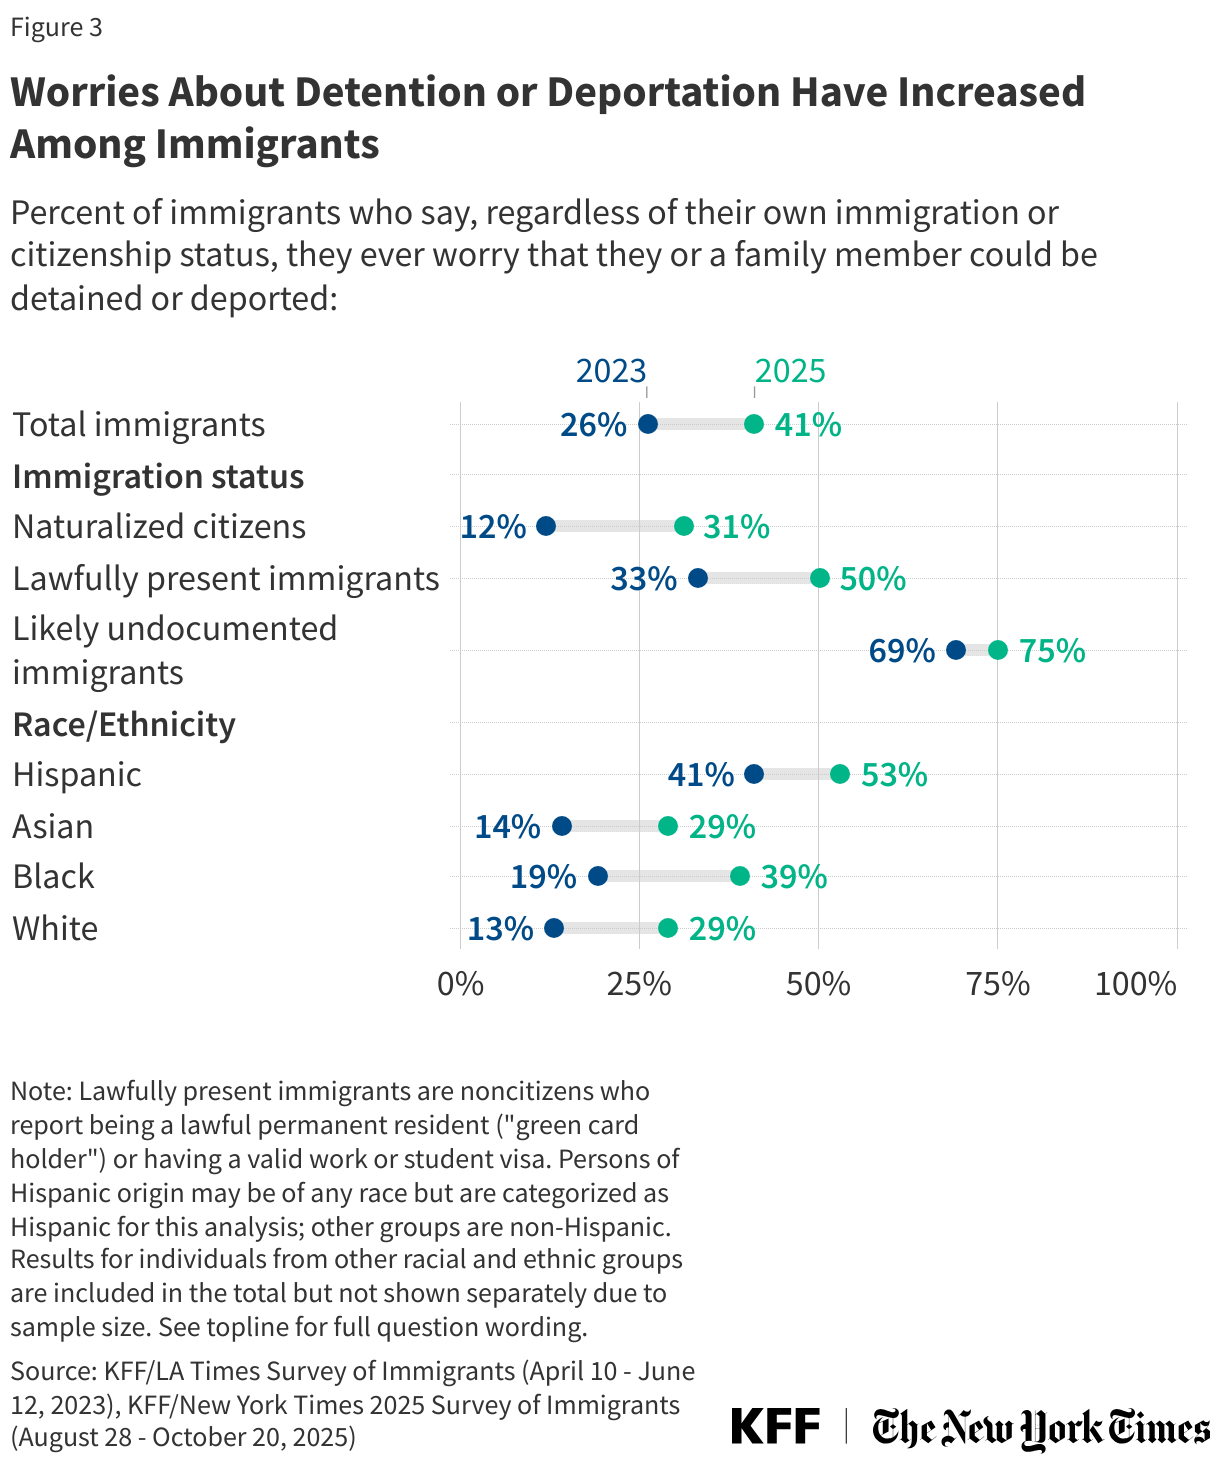
- Amid this environment, worries have increased among immigrants across immigration statuses, leading many to avoid activities outside the home, including seeking health care or going to work. Four in ten (41%) immigrants say they personally worry they or a family member could be detained or deported, much more than the 26% who said so in 2023. While worries are most pronounced among likely undocumented immigrants (75%), they have increased the most among lawfully present immigrants (from 33% to 50%) and naturalized citizens (from 12% to 31%). More than half of immigrants (53%), including majorities of naturalized citizens and lawfully present immigrants, are not confident they or a family member would receive fair treatment by the U.S. legal system if detained on immigration-related charges. Living with these fears, three in ten immigrants, including about three in four likely undocumented immigrants and about one-third of lawfully present immigrants, report avoiding traveling, seeking medical care, or going to work or other public spaces.
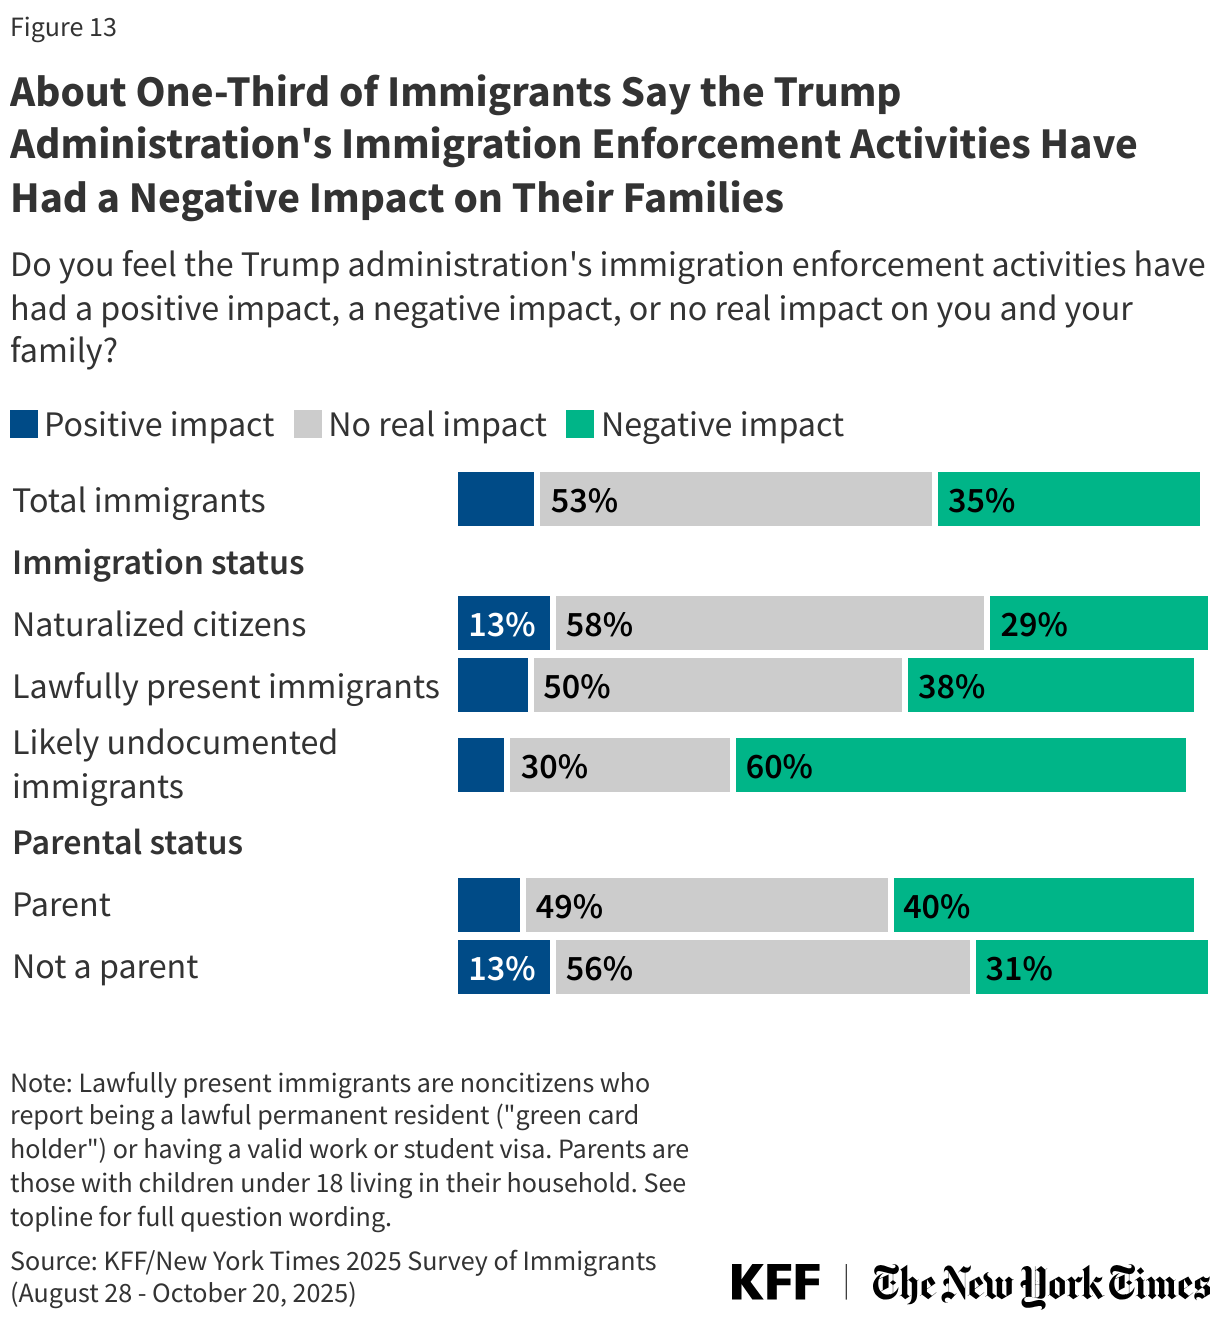
- An increasing share of immigrants hold a negative view of U.S. immigration enforcement, and many say they feel less safe since President Trump took office. Four in ten (41%) immigrants now say the U.S. is too tough in enforcing immigration laws, double the share who said so in 2023 (19%). About half of immigrants say they feel “less safe” since President Trump took office, including roughly half of naturalized citizens and lawfully present immigrants. In addition, about a third (35%) of immigrants say the administration’s immigration enforcement activities have had a direct negative impact on their families, citing things like avoiding everyday activities, increased racism, and worries about immigration enforcement.
- Immigrants’ financial struggles have increased substantially since 2023. About half of immigrants say they have had problems paying for essentials like housing, food, and health care in the past 12 months, up from three in ten who said the same in 2023. In addition, about half of all immigrants, including naturalized citizens and those who are lawfully present, say it has been harder for them to earn a living since January.
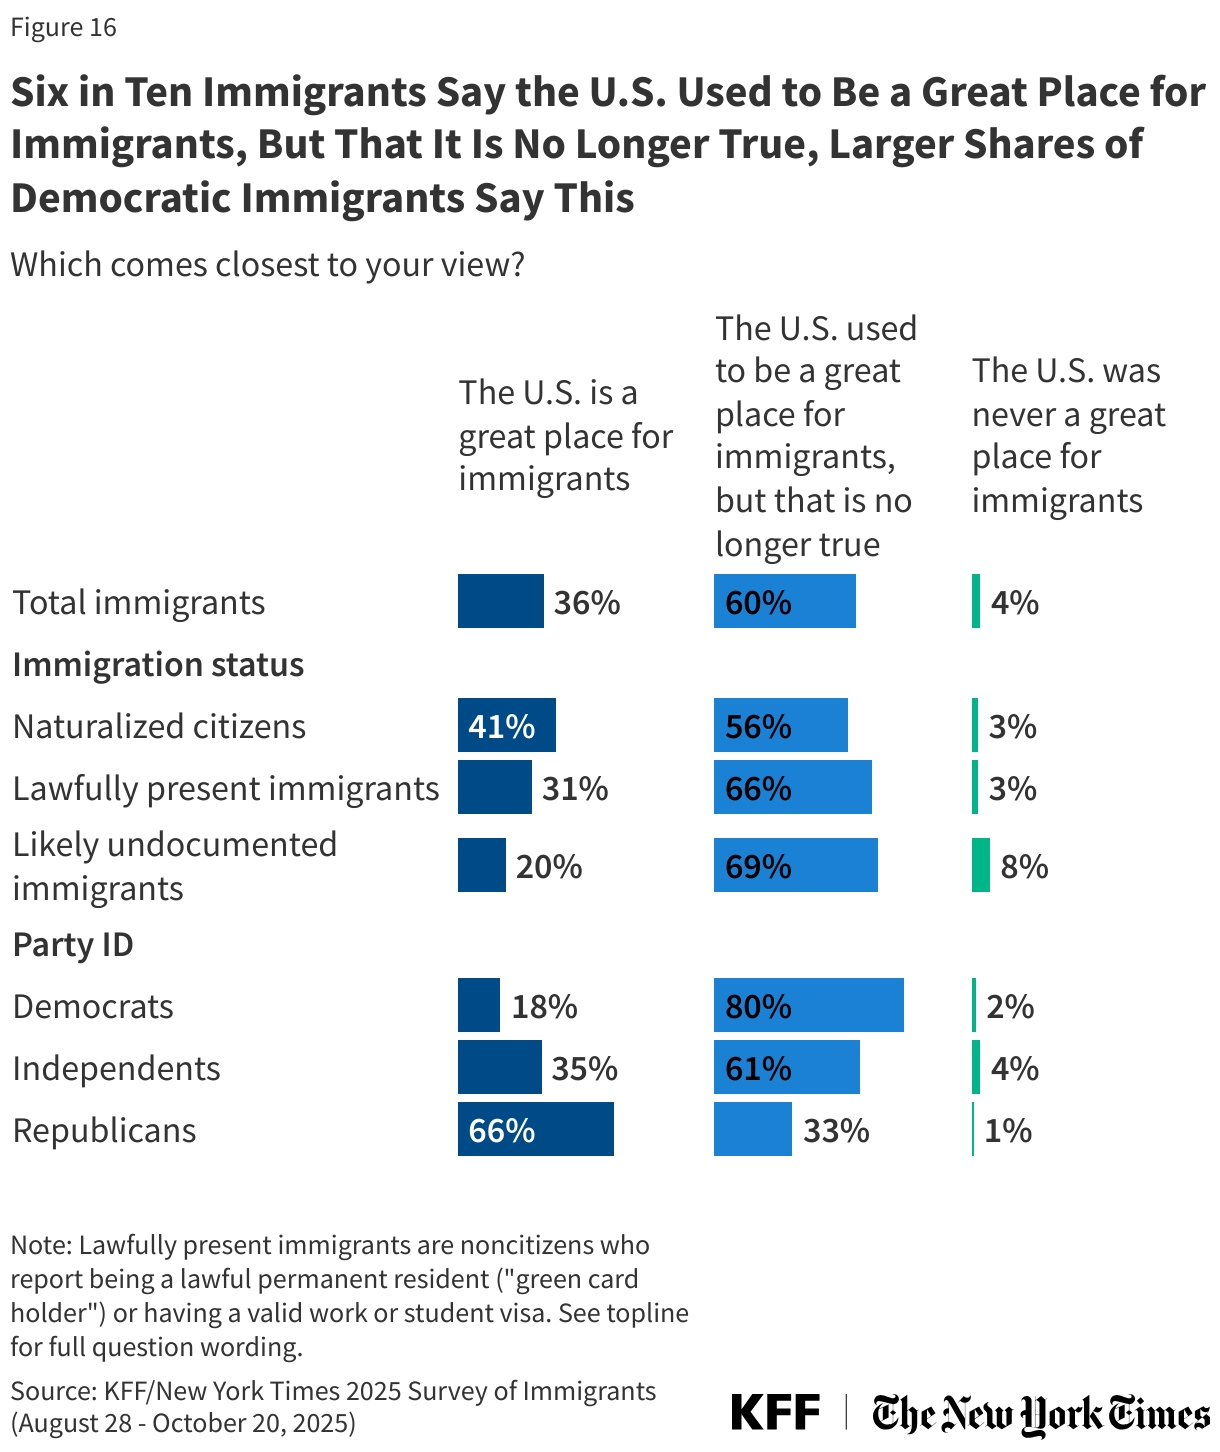
- While most still feel positively about their own decision to immigrate, many no longer view the U.S. as a good destination for immigrants. Reflecting the resilience and optimism of immigrant communities, most immigrants continue to say their lives are better as a result of moving to the U.S., and most would choose to come again. But while one-third say the U.S. is a great place for immigrants, nearly twice as many (60%) say the U.S. used to be a great place for immigrants, but that is no longer true.
Key Terms and Groups
Immigrants: In this report, immigrants are defined as adults residing in the U.S. who were born outside the U.S. and its territories. This includes naturalized citizens, lawfully present immigrants, and immigrants who are likely undocumented.
Naturalized citizen: Immigrants who said they are a U.S. citizen.
Lawfully present immigrant: Immigrants who said they are not a U.S. citizen, but currently have a green card (lawful permanent status) or a valid work or student visa.
Likely undocumented immigrant: Immigrants who said they are not a U.S. citizen and do not currently have a green card (lawful permanent status) or a valid work or student visa. These immigrants are classified as “likely undocumented” since they have not affirmatively identified themselves as undocumented.
More than one in five (22%) immigrants say they personally know someone who has been arrested, detained, or deported since President Trump took office, rising to half (52%) of likely undocumented immigrants and about a third of (36%) Hispanic immigrants. The share of immigrants who know someone who has been arrested, detained, or deported since President Trump took office has nearly tripled (22% vs. 8%) since the question was last asked in April. About one in four (24%) lawfully present immigrants say they personally know someone who has been arrested, detained, or deported since January, as do about one in six (16%) naturalized citizens.
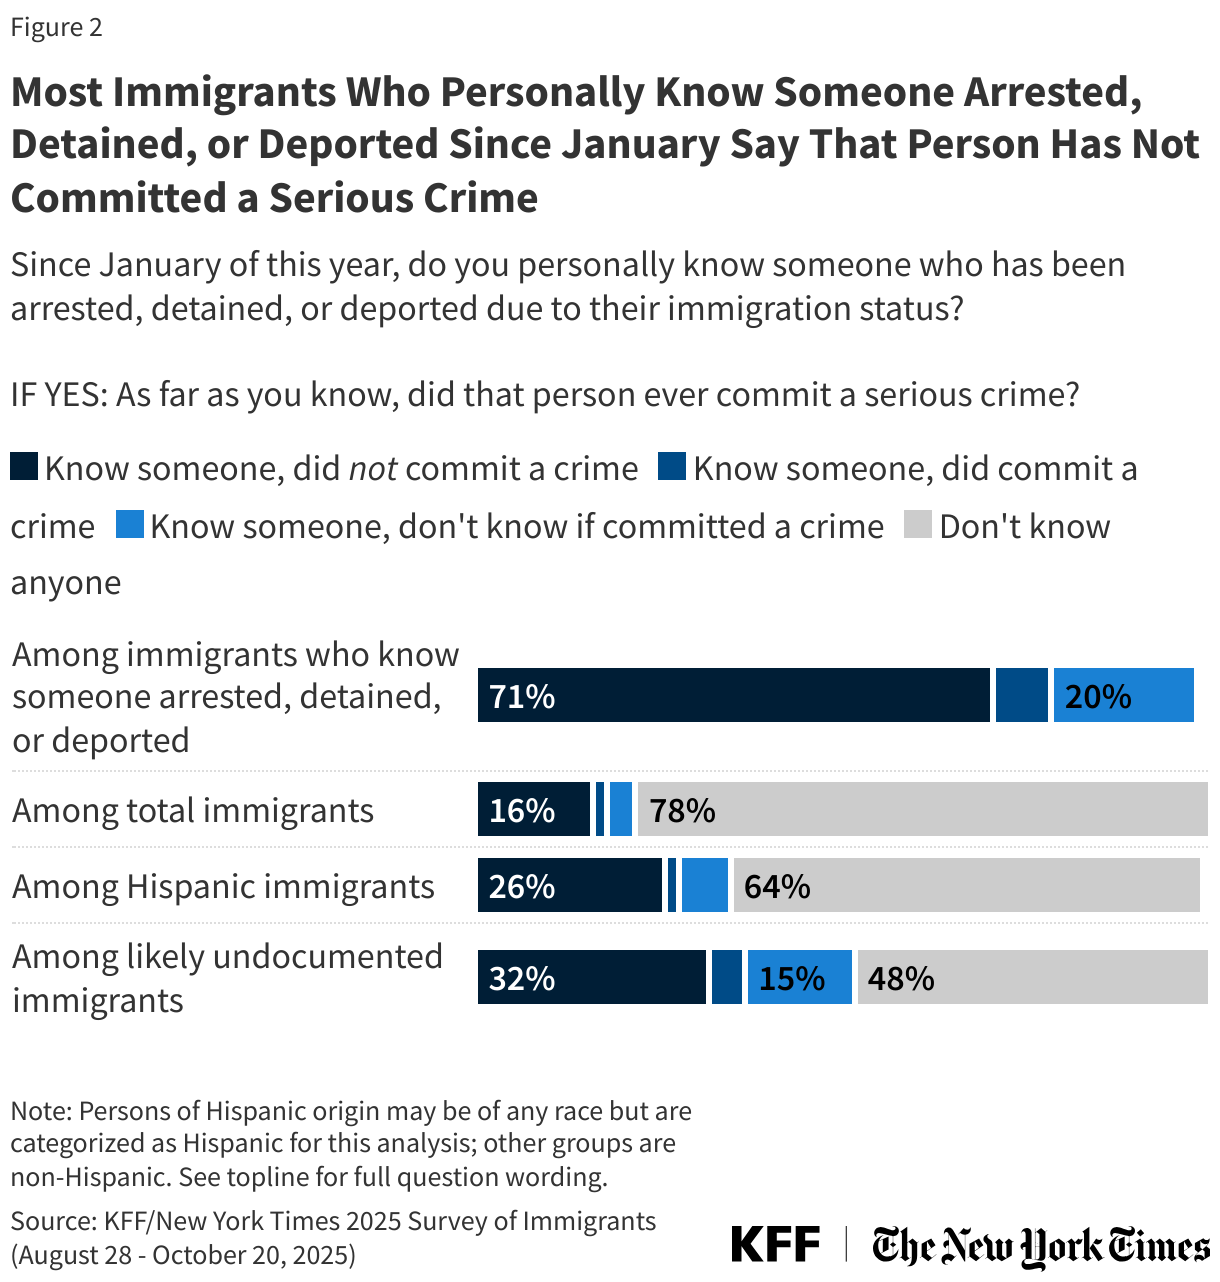
Among those who know someone who has been arrested, detained, or deported since January, most (71%) say that person had never committed a serious crime. About one in ten (8%) say that person had committed a serious crime, and one in five (20%) said they were not sure. Sixteen percent of immigrants overall say they know someone who was arrested, detained, or deported without committing a serious crime, rising to one-quarter of Hispanic immigrants and one-third of those who are likely undocumented.
Amid the Trump administration’s immigration crackdown, four in ten (41%) immigrants say they worry that they or a family member could be detained or deported, up from 26% in 2023, including substantial increases among naturalized citizens and lawfully present immigrants. Worries about detention or deportation among likely undocumented immigrants remain high reaching 75% as of 2025, while worries have increased the most among naturalized citizens and lawfully present immigrants. More than twice as many naturalized citizens now say they worry that they or a family member could be detained or deported compared to 2023 (31% vs. 12%). Similarly, half (50%) of lawfully present immigrants now say they worry about this, much higher than the share (33%) who said this in 2023.
Hispanic immigrants are more likely to express worries about detention and deportation than immigrants of other backgrounds, but worries have increased substantially among immigrants of all racial and ethnic backgrounds. About half (53%) of Hispanic immigrants say they worry they or a family member could be detained or deported, up from 41% in 2023. Worry has also increased among Black immigrants (39% vs. 19%), Asian immigrants (29% vs. 14%) and White immigrants (29% vs. 13%). Compared to other groups, the relatively larger shares of Hispanic immigrants who say they worry about detention or deportation likely reflects the fact that a larger share of Hispanic immigrants are noncitizens as well as racial-profiling of Hispanic adults by federal immigration agents.
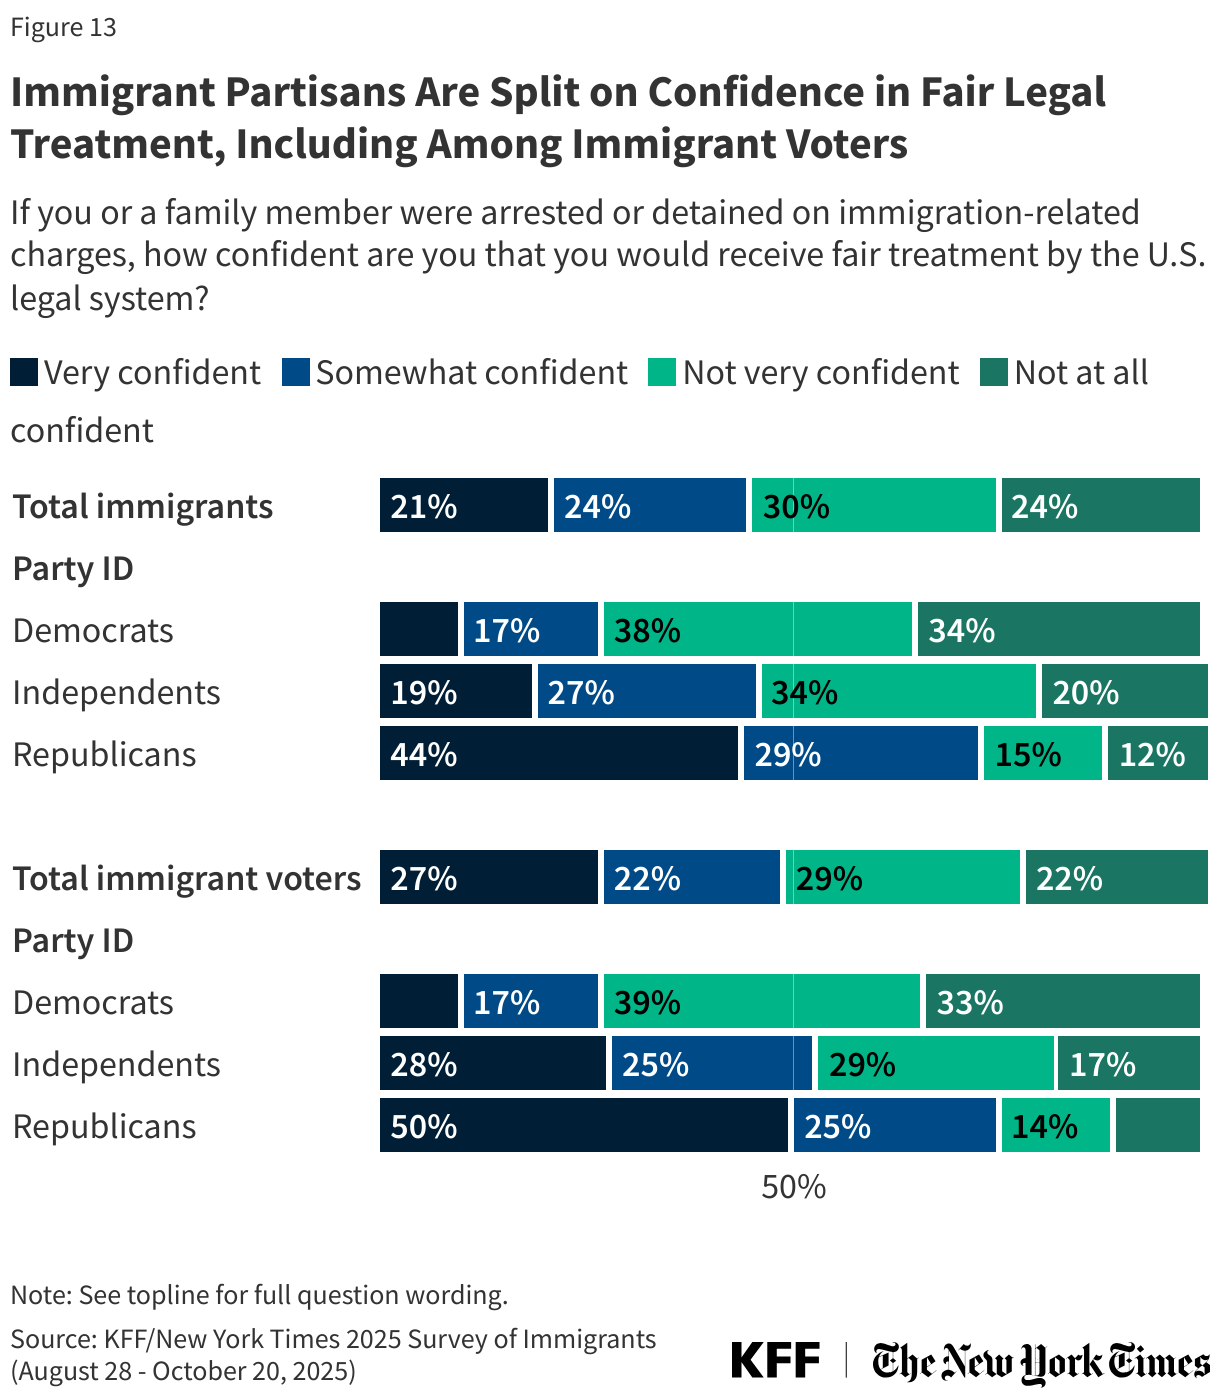
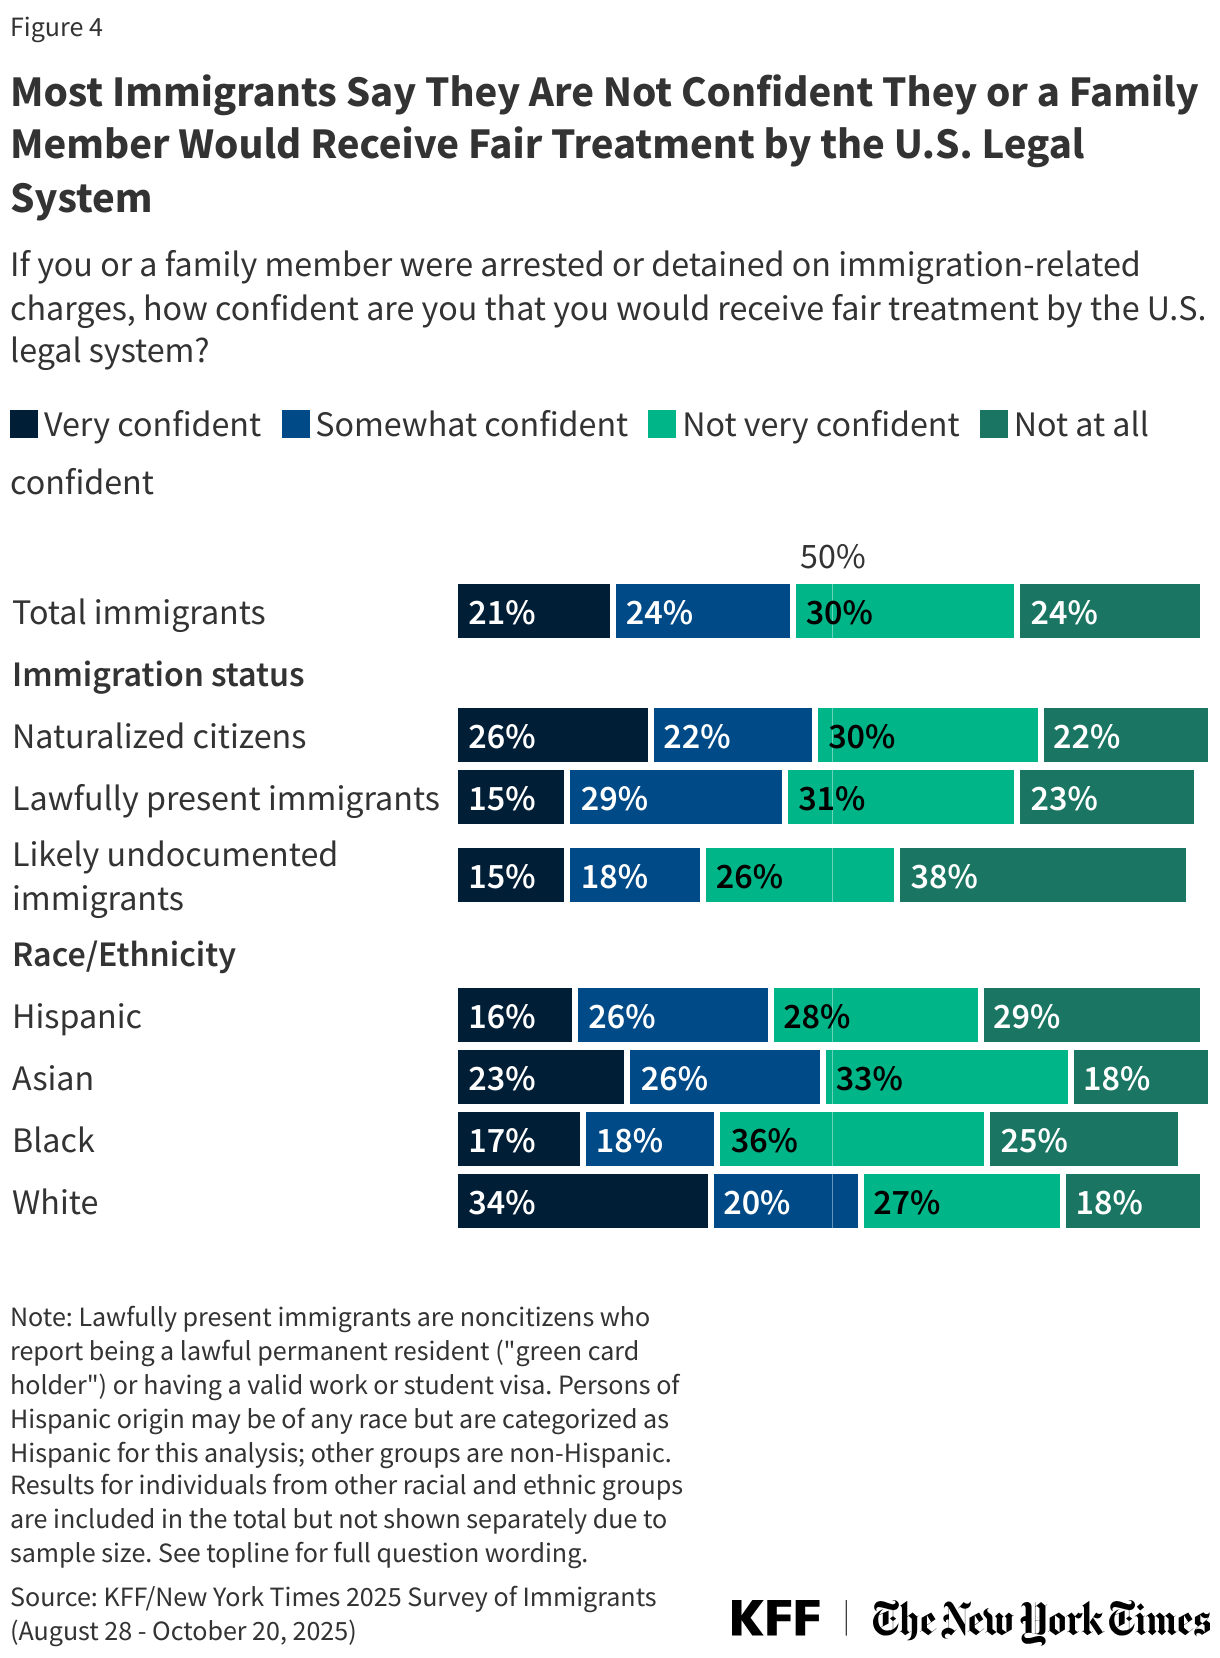
If they were to be arrested or detained on immigration-related charges, more than half (53%) of immigrants say they are not confident they or a family member would receive fair treatment by the U.S. legal system. At least half of immigrants feel this way across immigration statuses, including 51% of naturalized citizens and 54% of lawfully present immigrants. About six in ten Black (61%) and Hispanic (57%) immigrants say they are not confident they would receive fair treatment.
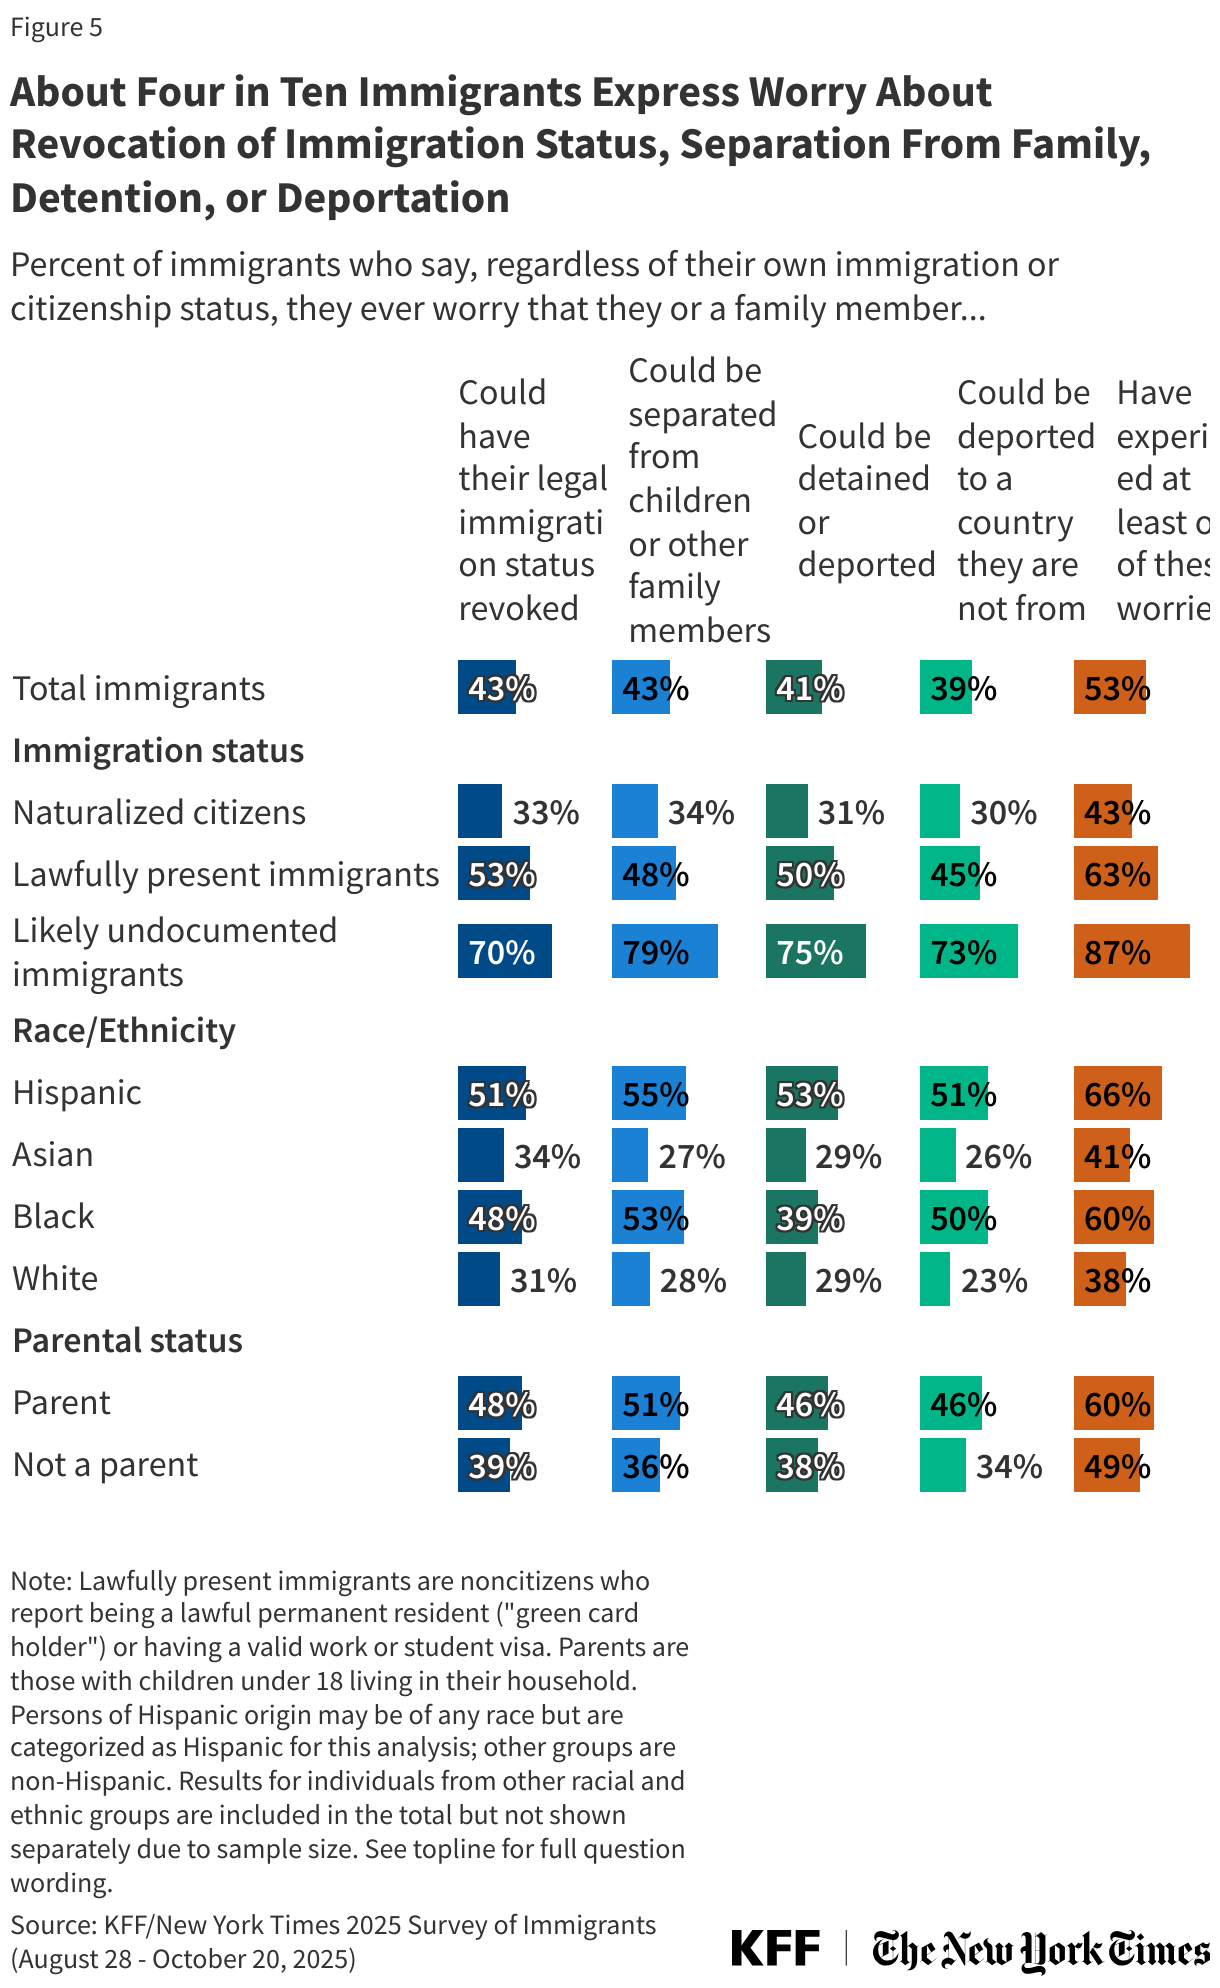
About four in ten immigrants express other immigration-related worries, such as that they or a family member might have their legal immigration status revoked (43%), be separated from children or family members (43%), or be deported to a country they are not from (39%). Overall, about half (53%) of immigrants say they worry about at least one of these things, rising to about six in ten (63%) lawfully present immigrants and more than eight in ten (87%) likely undocumented immigrants. About six in ten or more Hispanic immigrants (66%), Black immigrants (60%), and immigrant parents (60%) also say they worry about at least one of these things happening to them and their families.
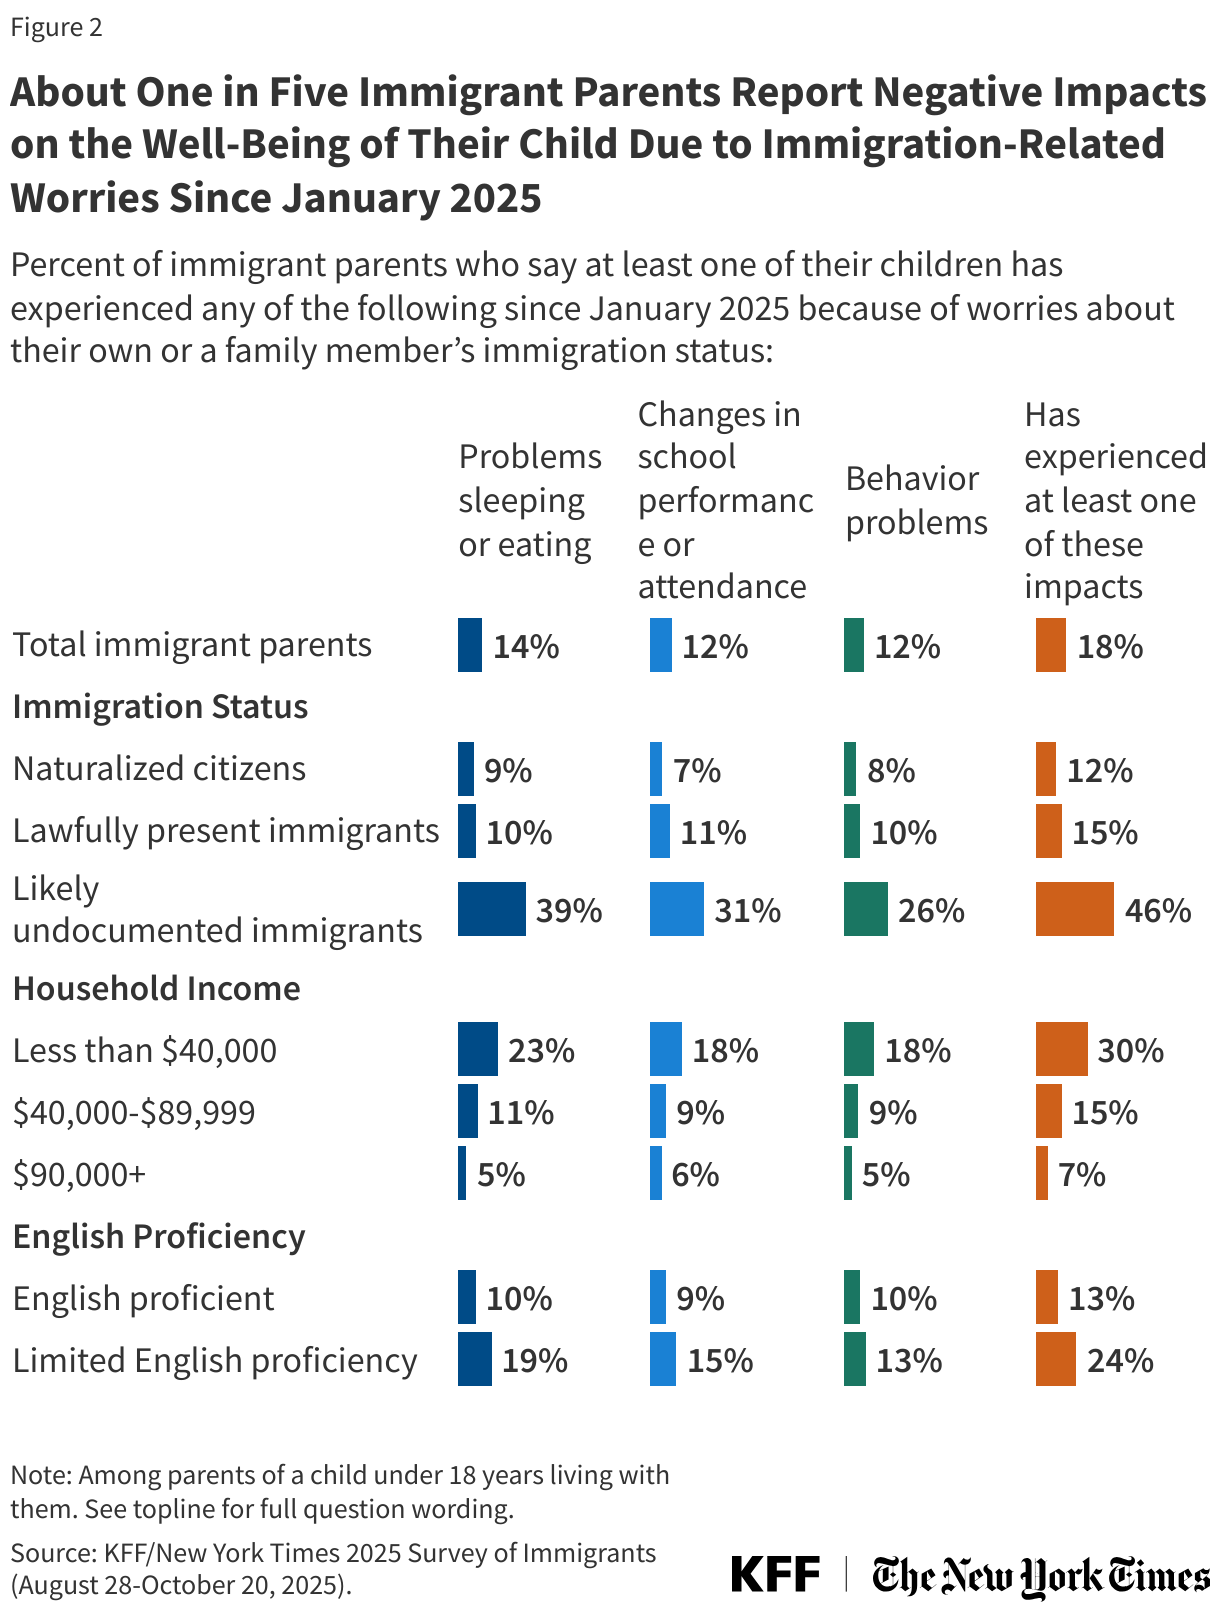
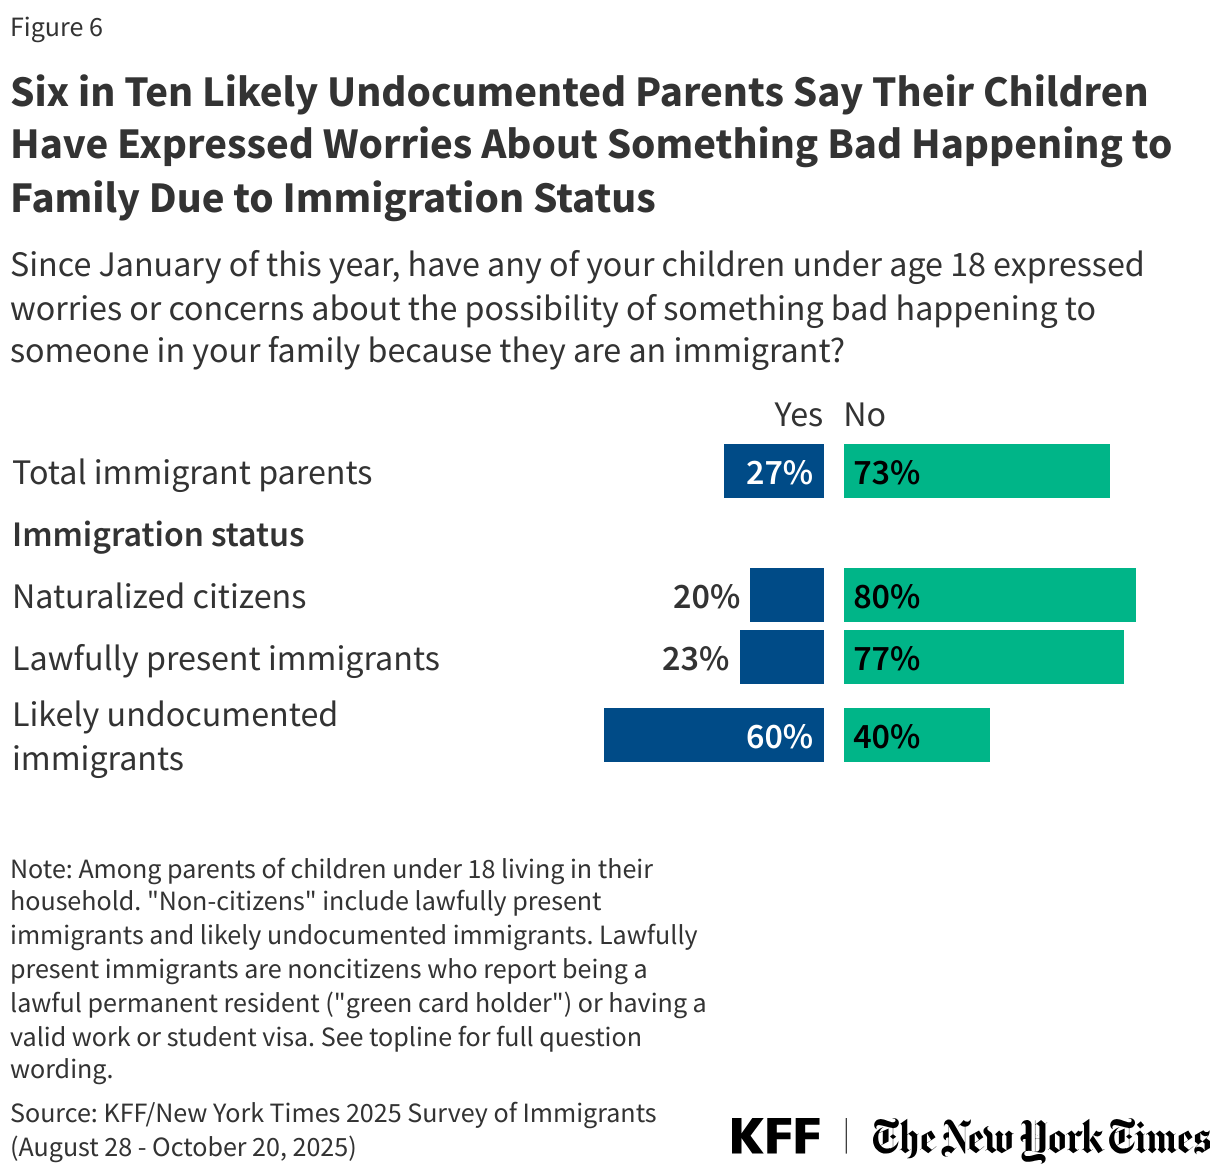
Immigration-related fears extend to children in immigrant families, with about a quarter (27%) of immigrant parents saying their children have expressed worries or concerns about something bad happening to someone in their family because they are an immigrant. The share who say this rises to six in ten (60%) likely undocumented immigrant parents and about four in ten (39%) Hispanic immigrant parents.
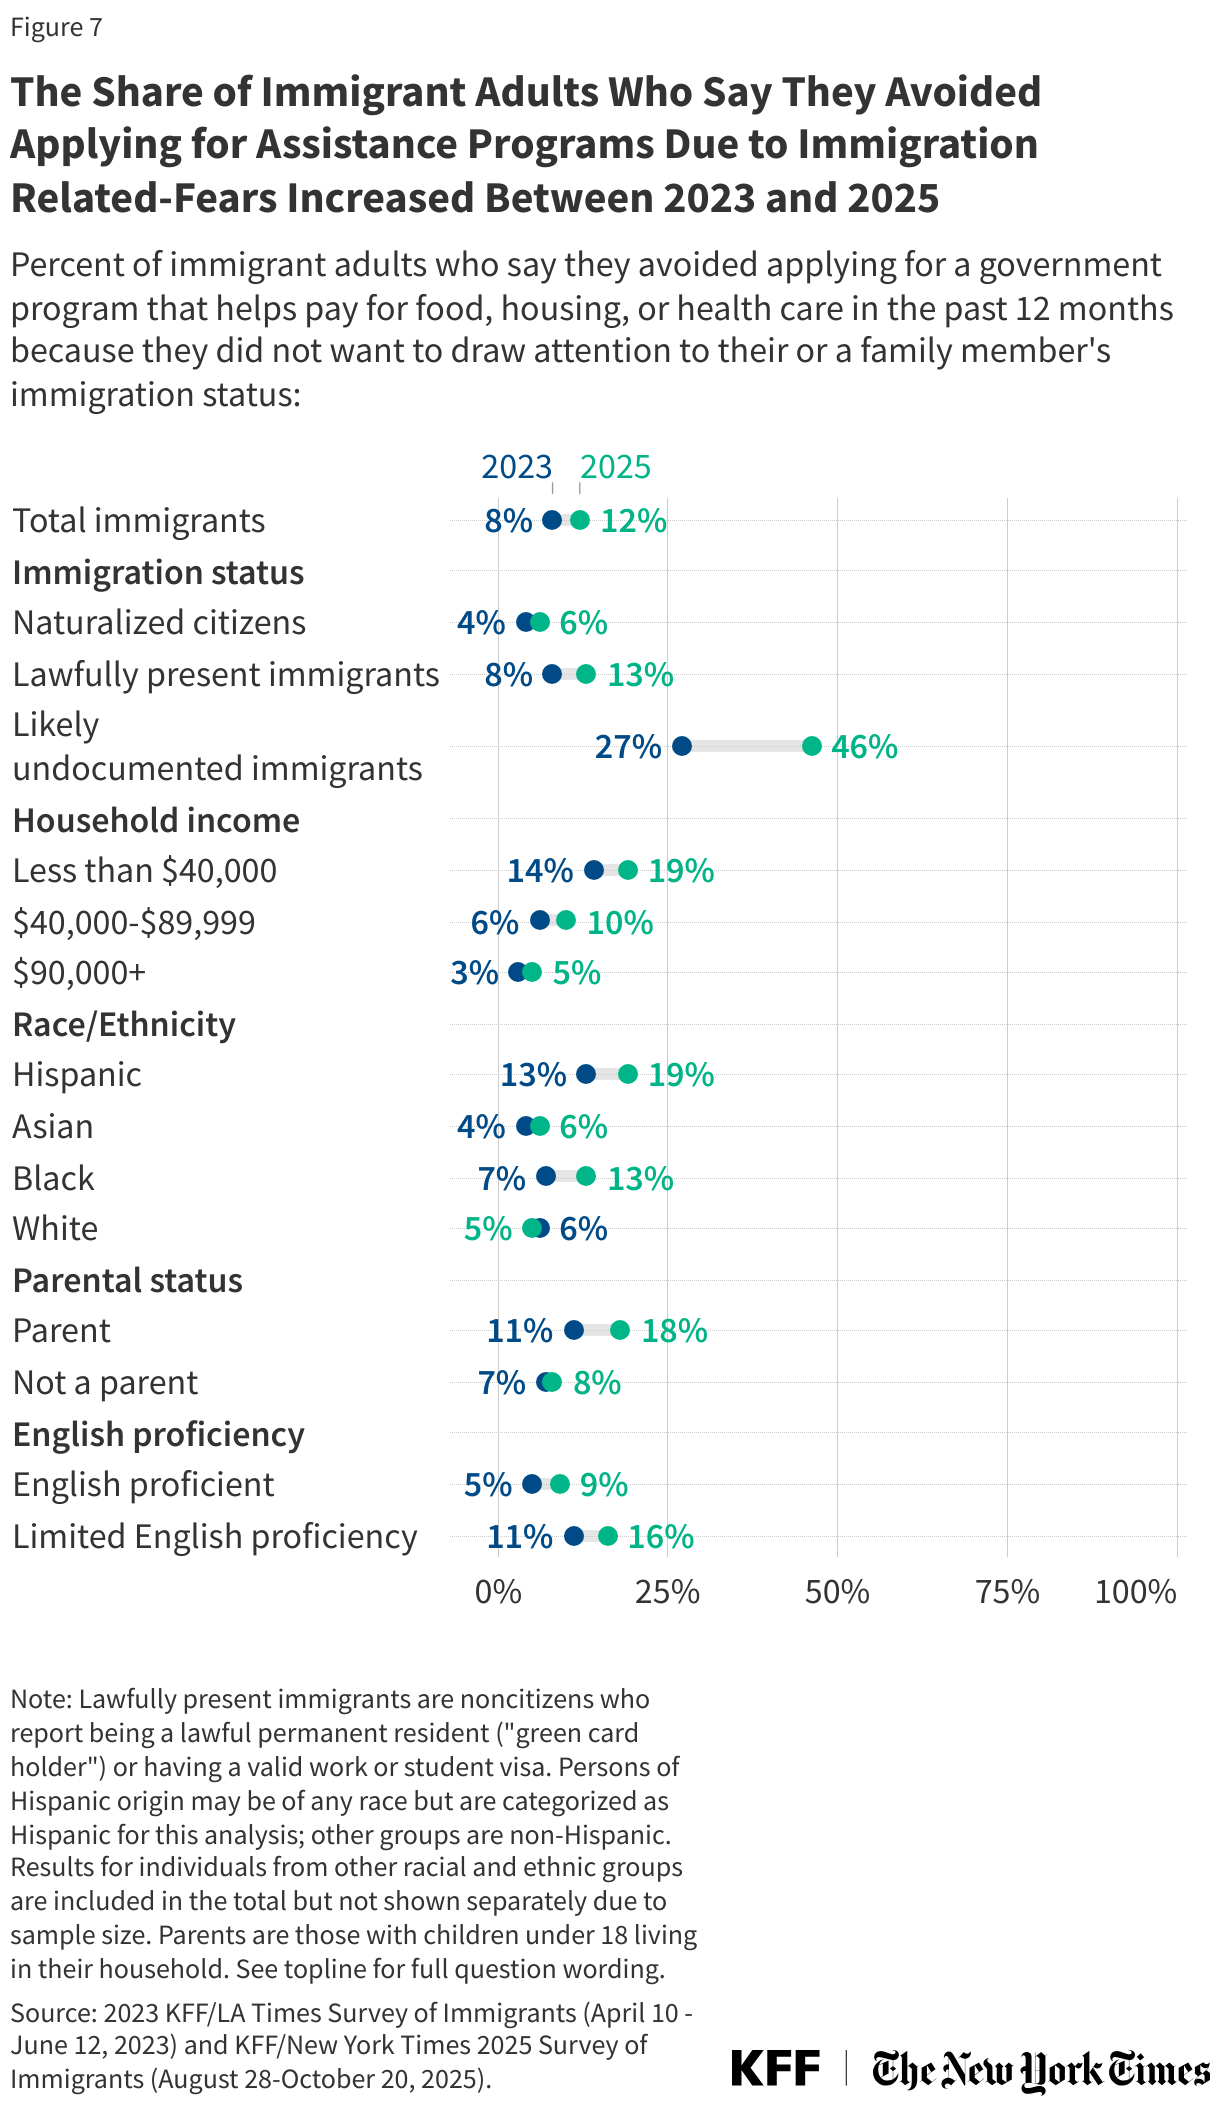
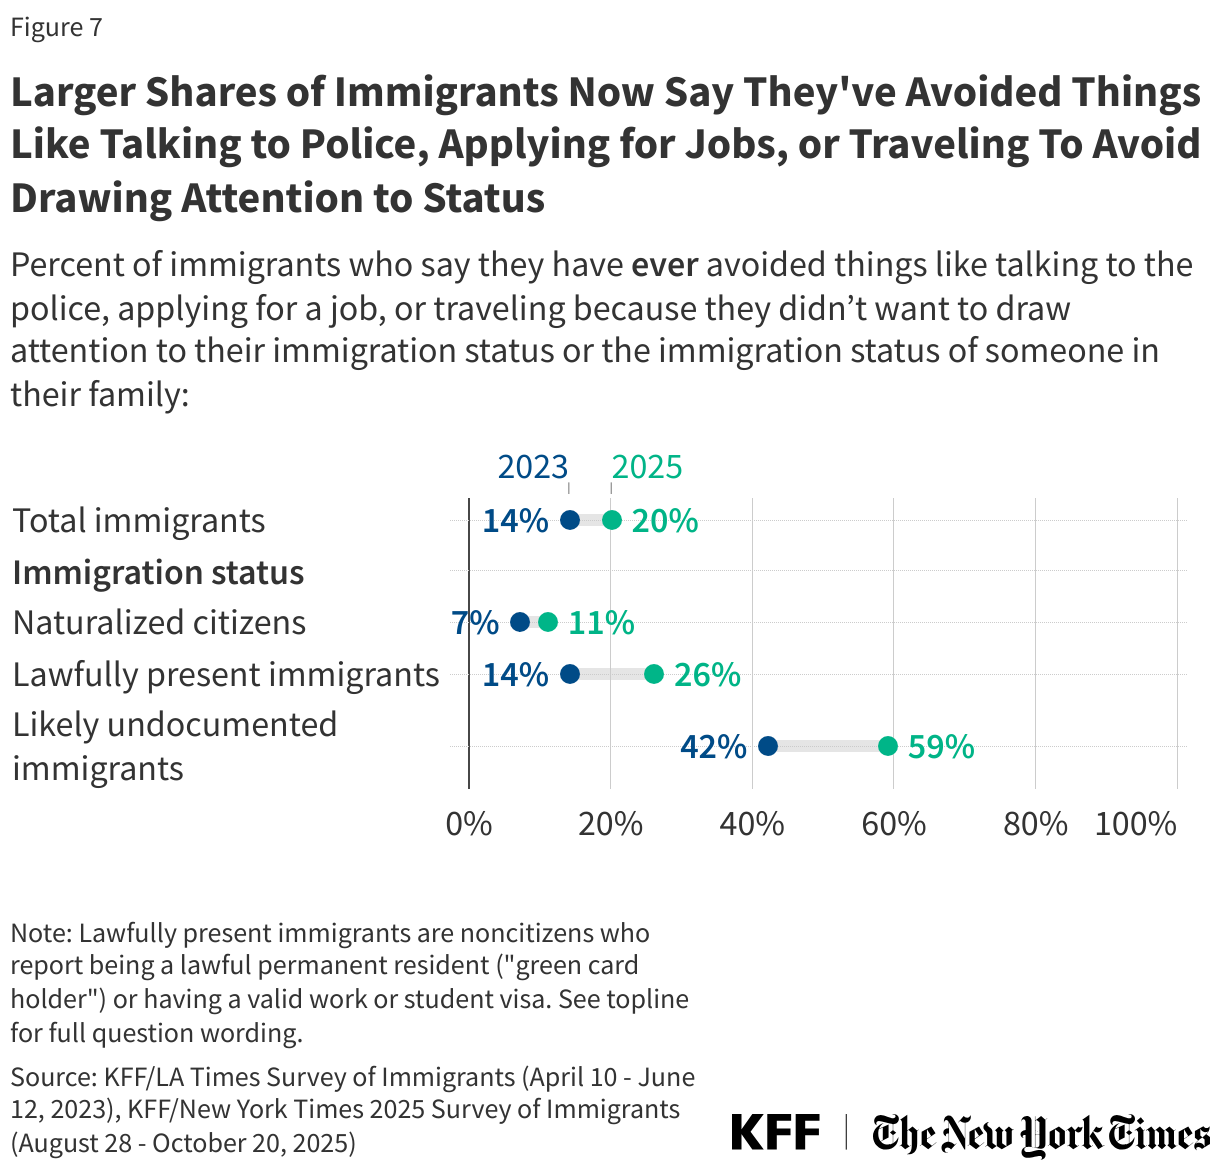
Across immigration statuses, larger shares of immigrants now than in 2023 say they have avoided things like talking to the police, applying for a job, or traveling due to their or a family member’s immigration status. One in five (20%) immigrants overall say they have ever avoided these things, rising to about six in ten (59%) likely undocumented immigrants, up from 14% and 42% respectively in 2023. Notably, one-quarter (26%) of lawfully present immigrants and one in ten (11%) naturalized citizens report avoiding these activities, both roughly double the shares who said so in 2023. Immigrants who personally know someone who has been arrested, detained or deported since January are especially likely to say they have ever avoided one of these activities compared to those who don’t know someone (44% vs. 14%).
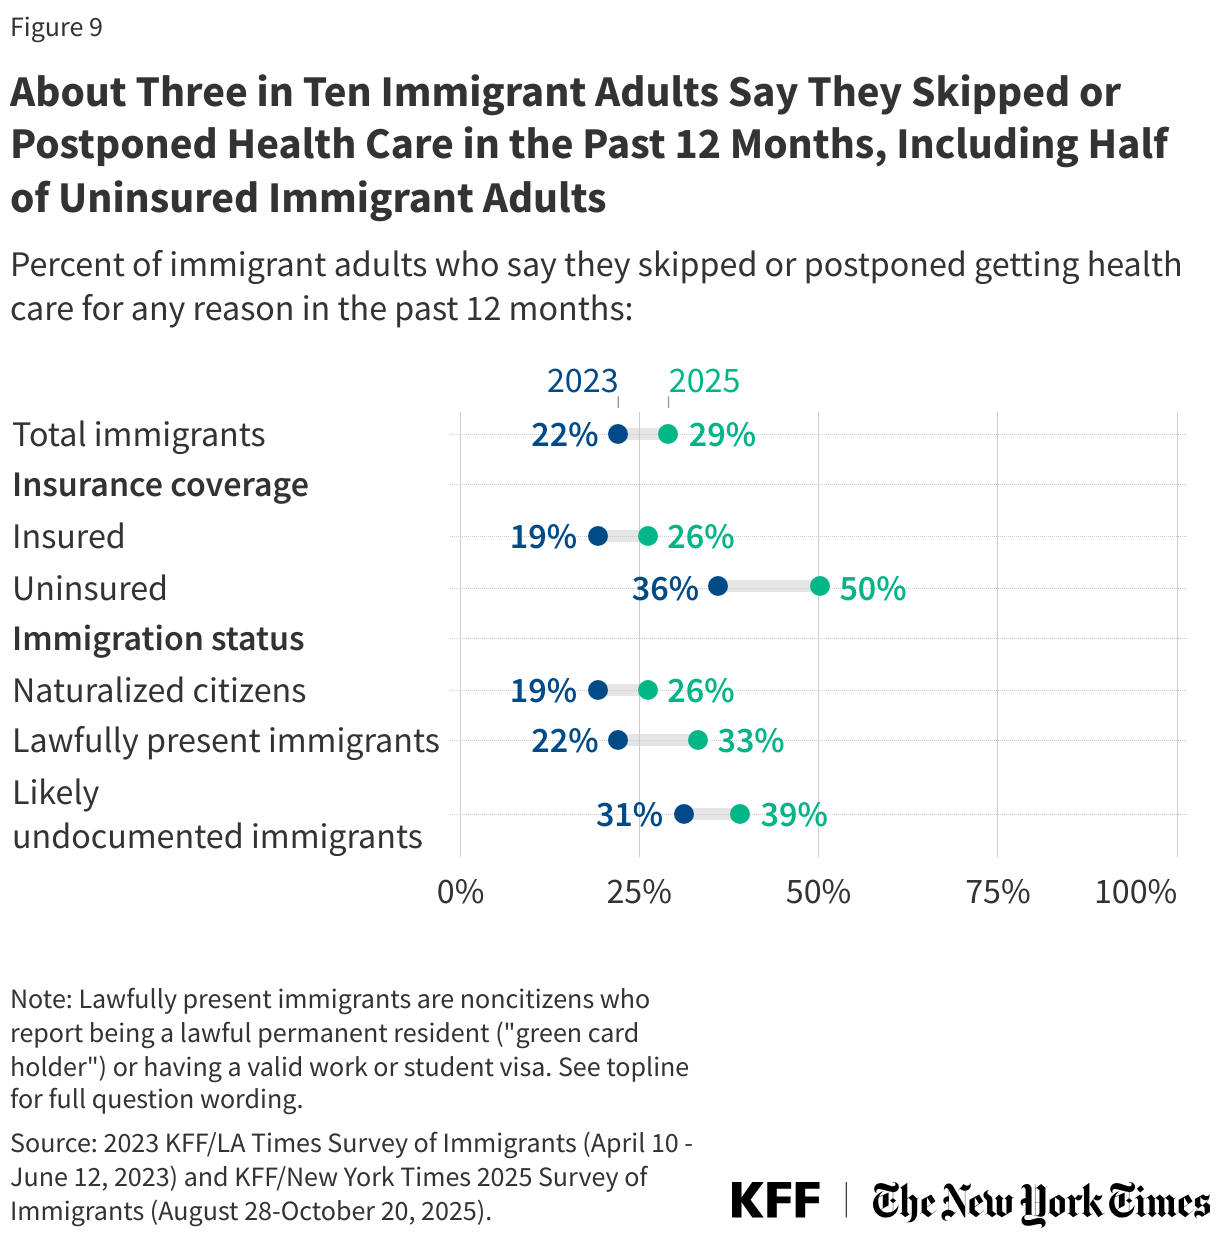
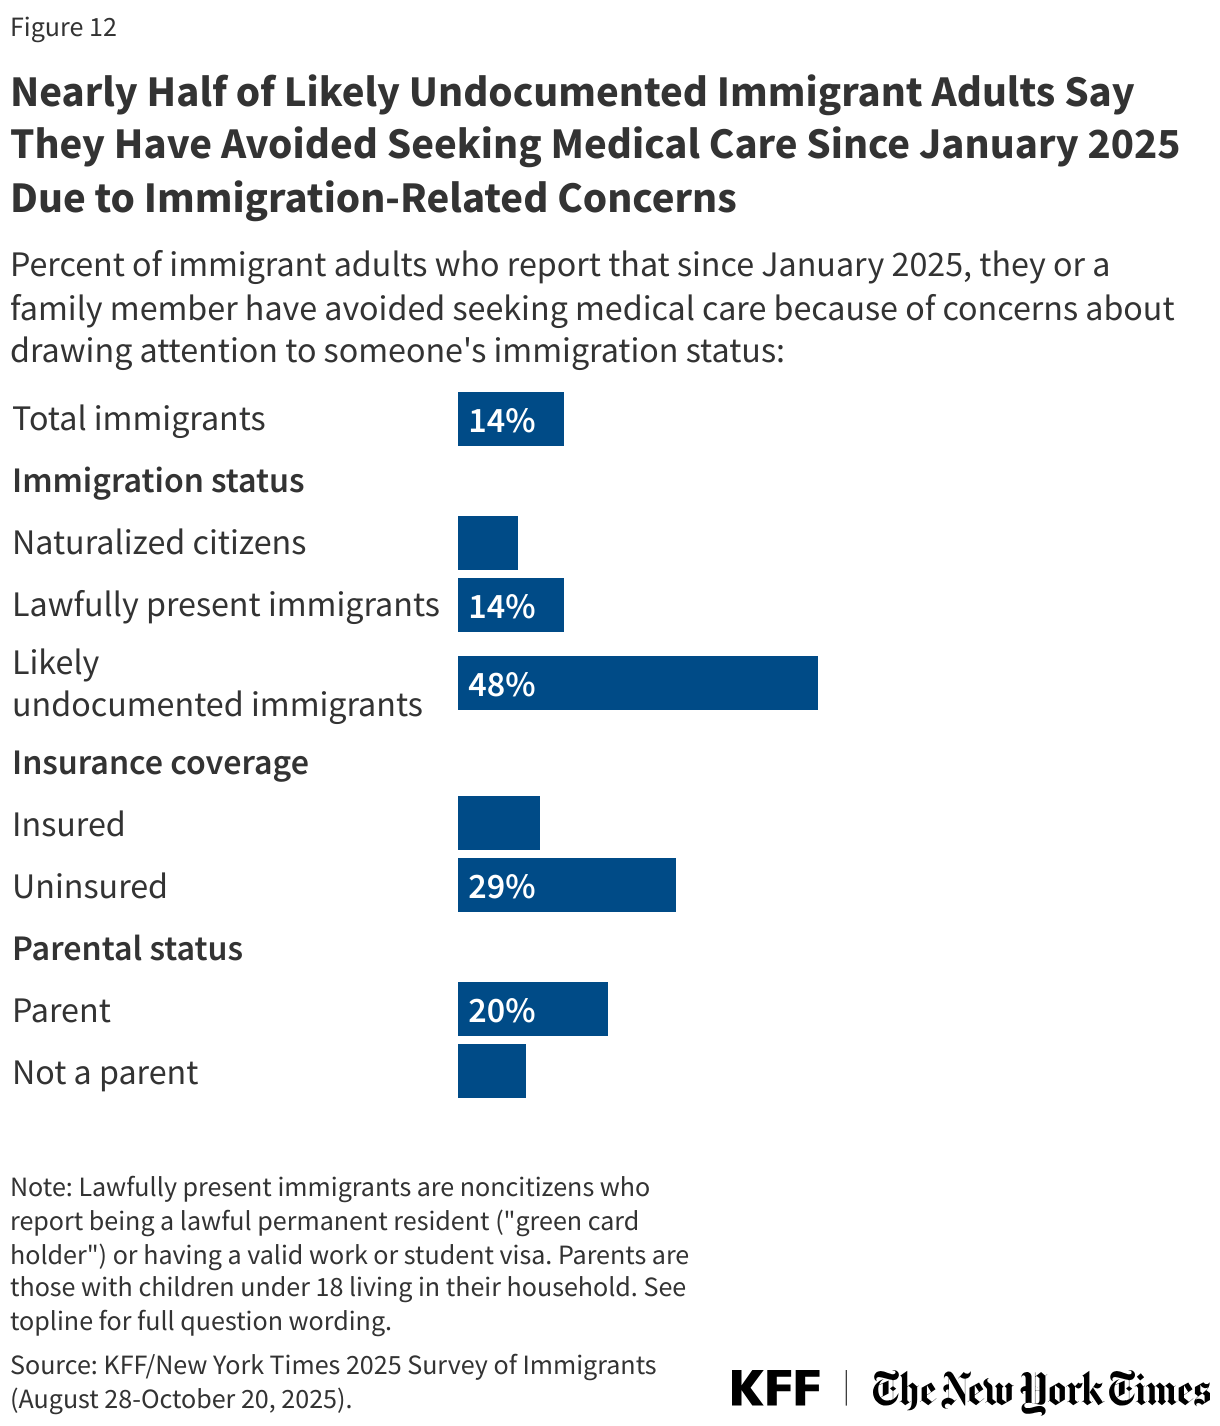
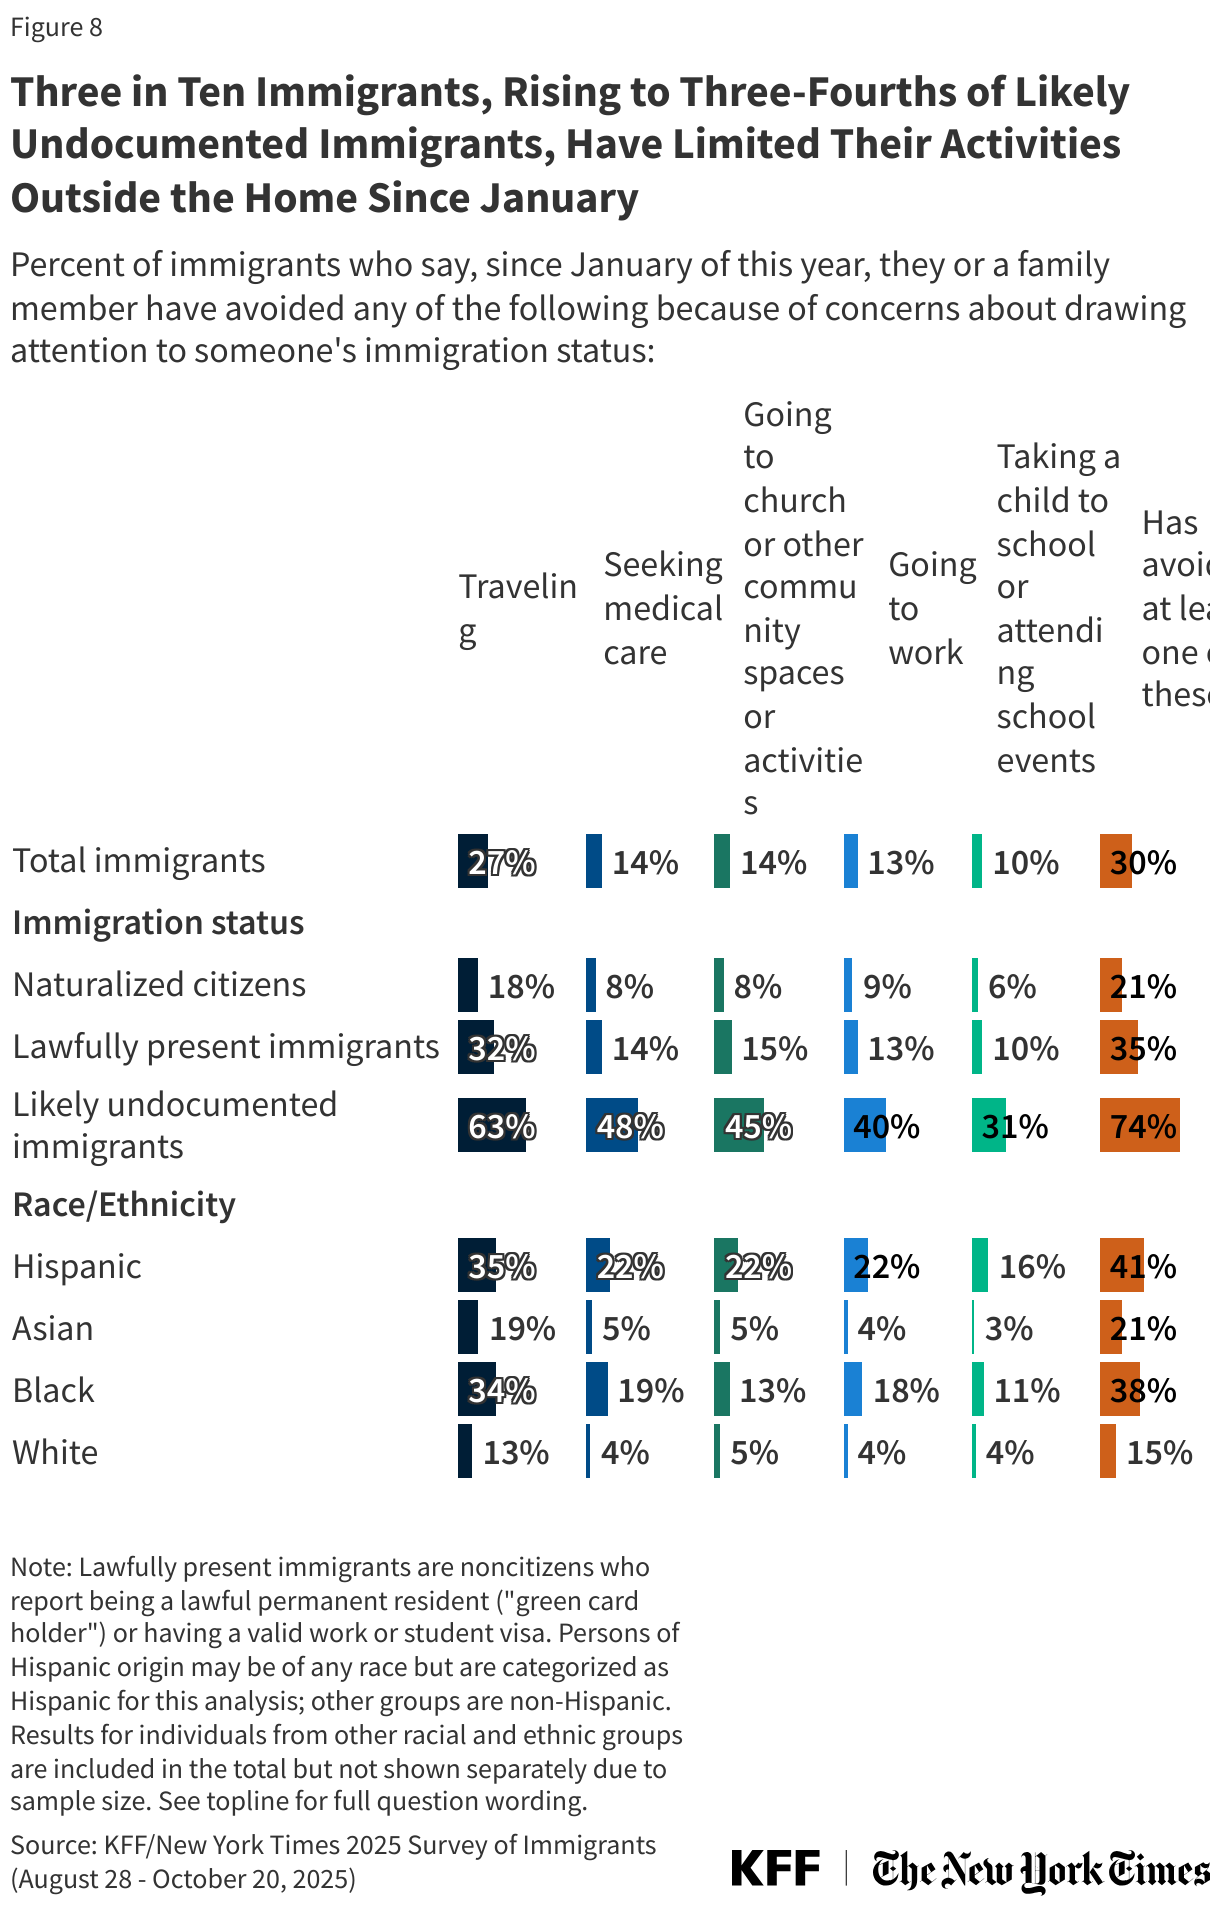
Three in ten (30%) immigrants overall, rising to three-quarters (74%) of likely undocumented immigrants, say they or a family member have limited their participation in activities outside the home since January due to concerns about drawing attention to someone’s immigration status. This includes about three in ten immigrants who say they or a family member have avoided traveling (27%), one in seven who have avoided seeking health care (14%), going to church or community events (14%), or going to work (13%), and one in ten (10%) who report not taking their children to school or attending school events. Among likely undocumented immigrants, six in ten (63%) say they or a family member have avoided traveling since January, about half (48%) say they have avoided seeking medical care, and four in ten (40%) report not going to work because of immigration-related concerns. In addition, about one in five (21%) naturalized citizens and one-third (35%) of lawfully present immigrants say they or a family member have avoided activities outside the home due to concerns about immigration status.
Hispanic immigrants are more likely than immigrants of other backgrounds to report avoiding these activities, with about four in ten (41%) saying they have avoided at least one. Immigrants’ avoidance of activities outside the home are likely driven in part by heightened immigration enforcement activities, such as ICE (Immigration and Customs Enforcement) raids in workplaces, as well as policy changes that have allowed immigration enforcement activity in previously protected areas including places of worship, schools, and health care facilities and to allow ICE to pursue arrests without a warrant.
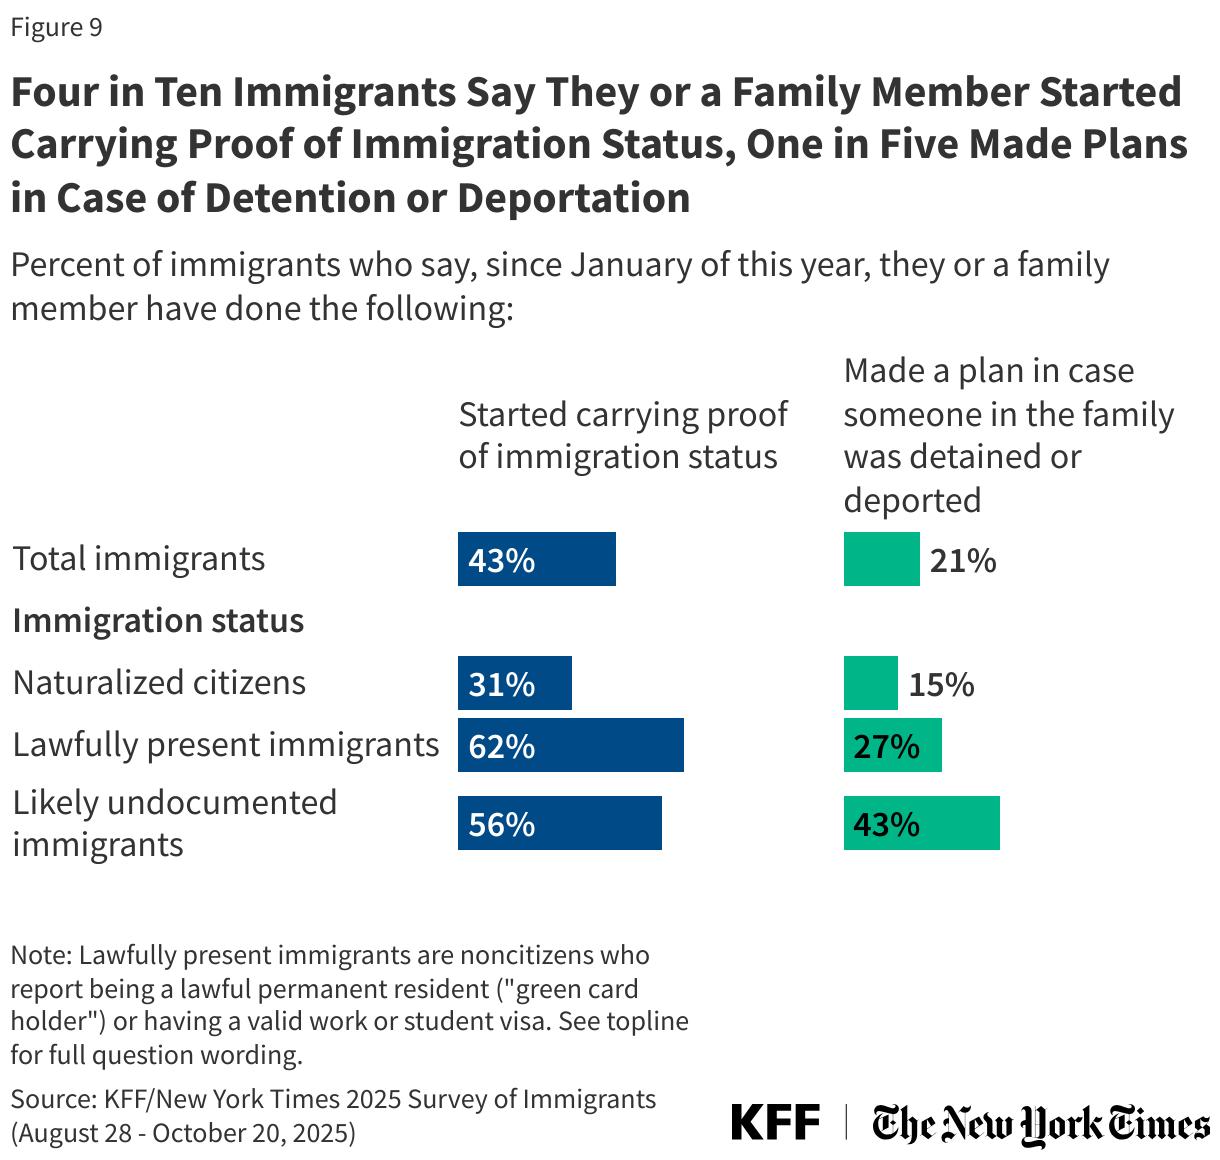
Some immigrants also report taking precautionary measures such as carrying proof of status (43%) or making family plans in case of detention or deportation (21%). Notably, six in ten (62%) lawfully present immigrants and three in ten (31%) naturalized citizens say they have started carrying proof of immigration status since January and about one in four (27%) lawfully present immigrants say they have made a plan in case someone in the family was detained or deported.
Views of the Trump Administration’s Immigration Policies and Enforcement
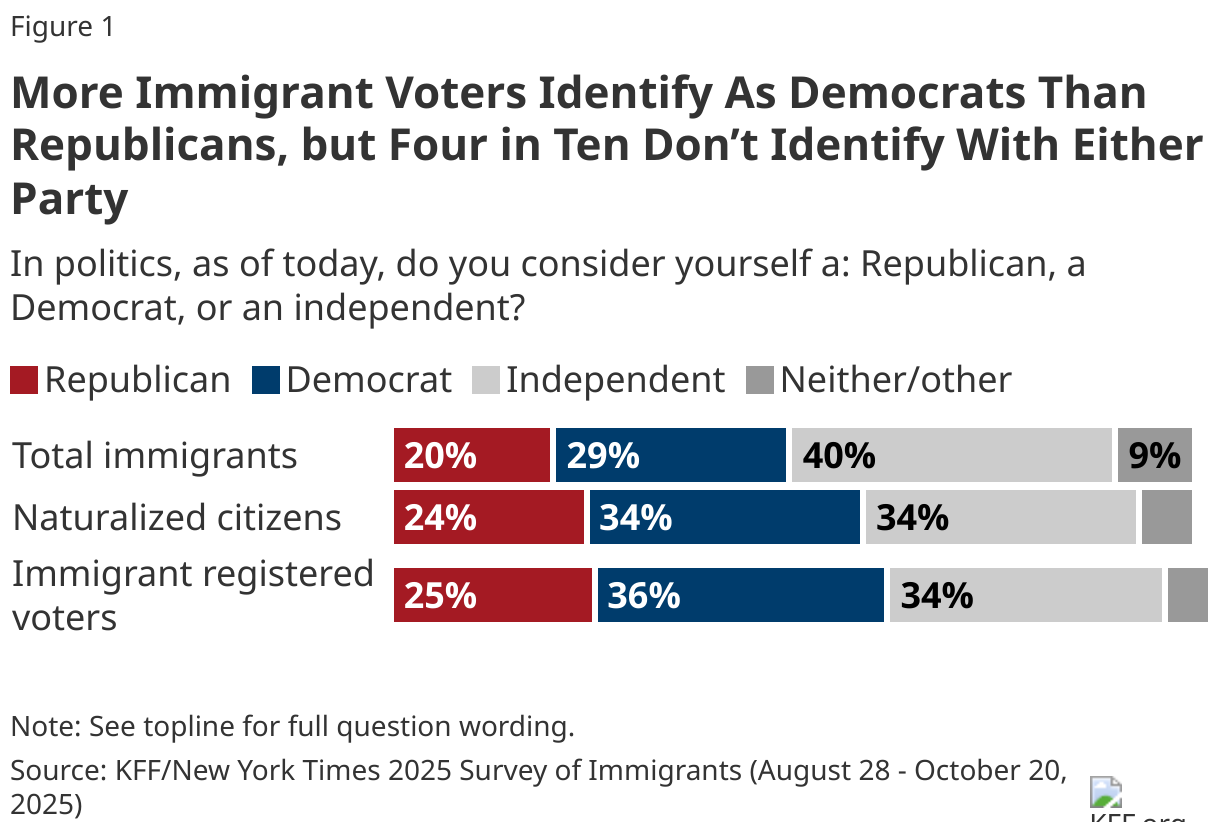
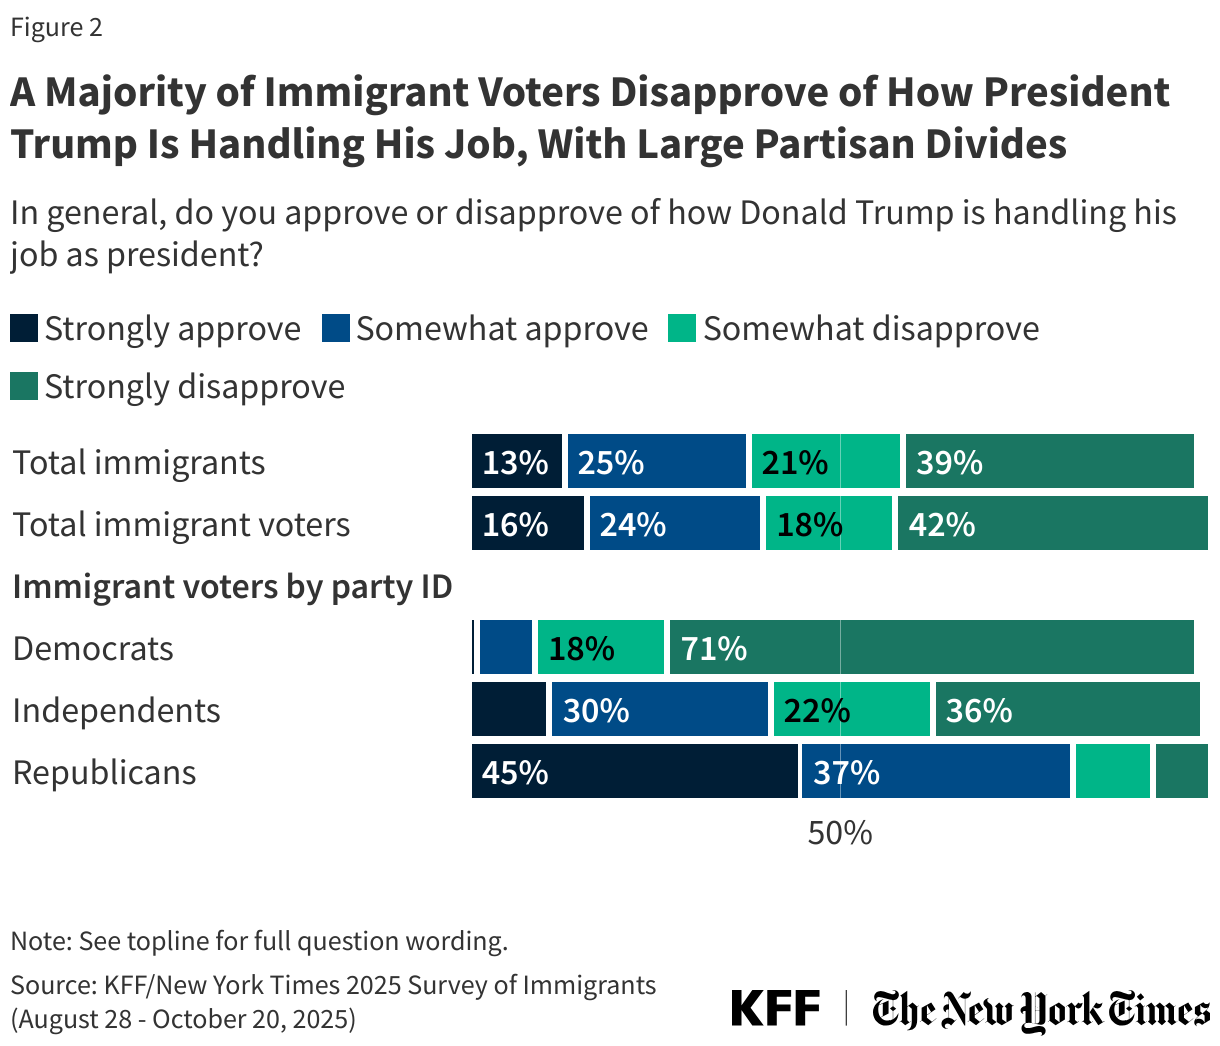
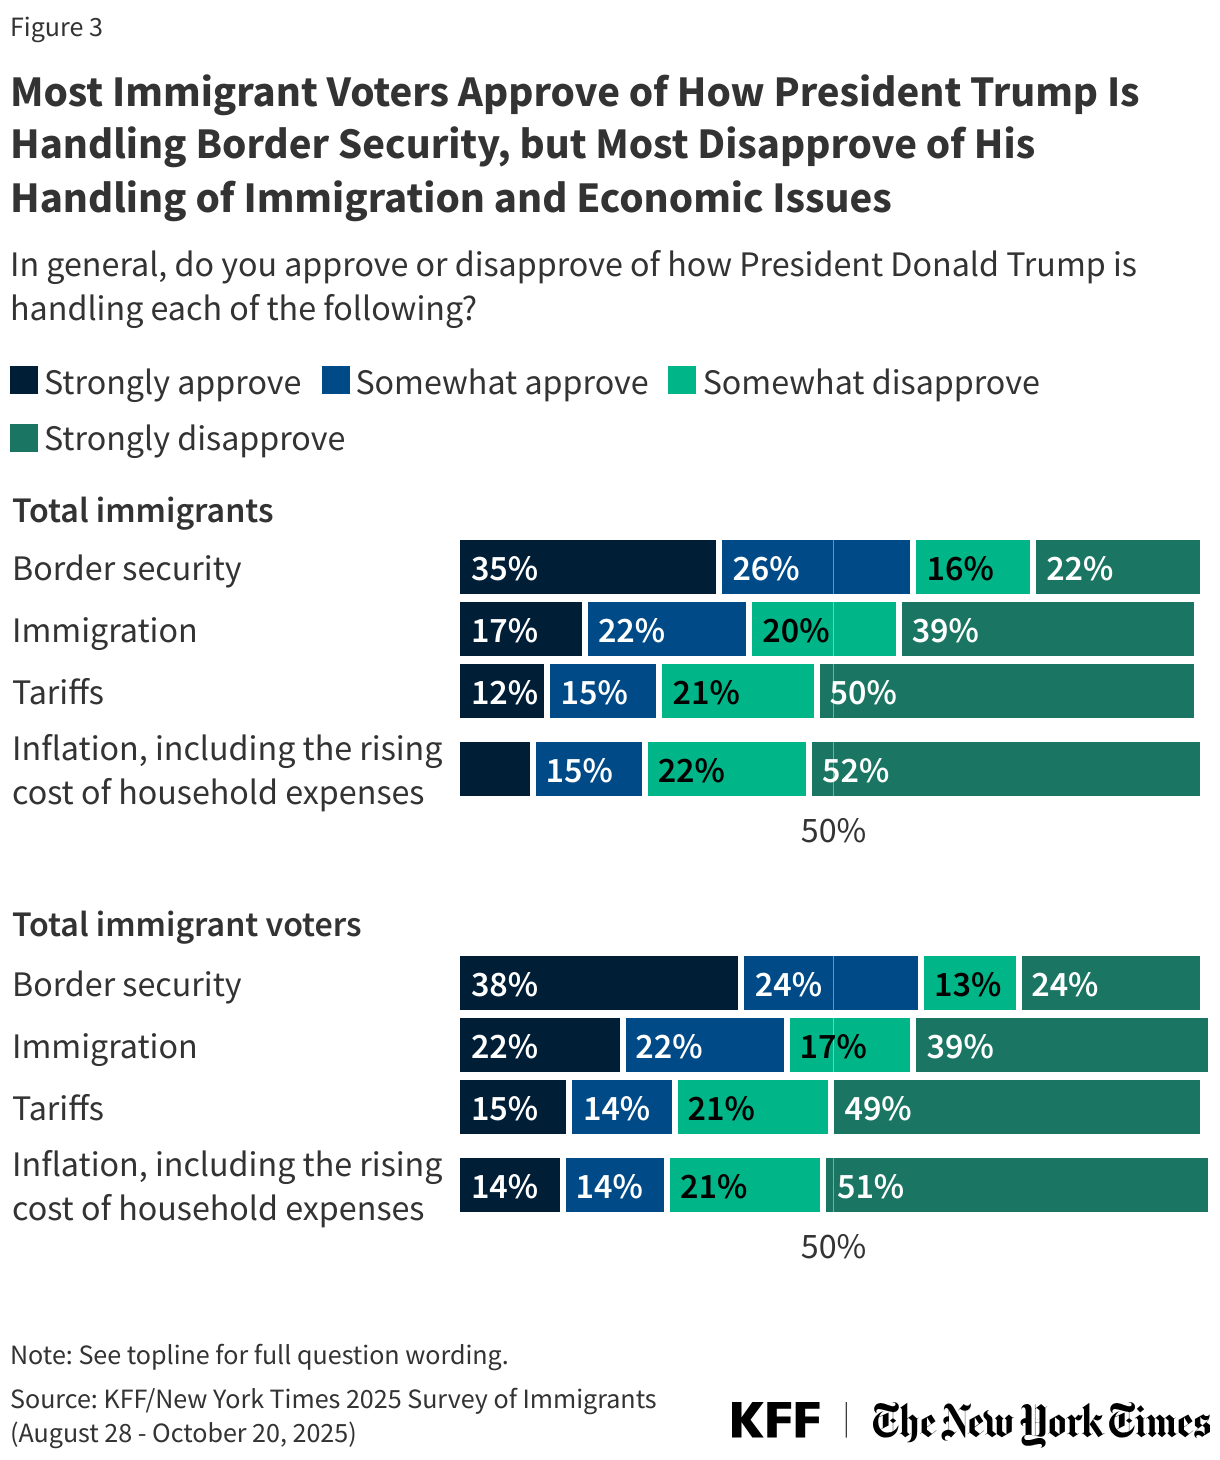
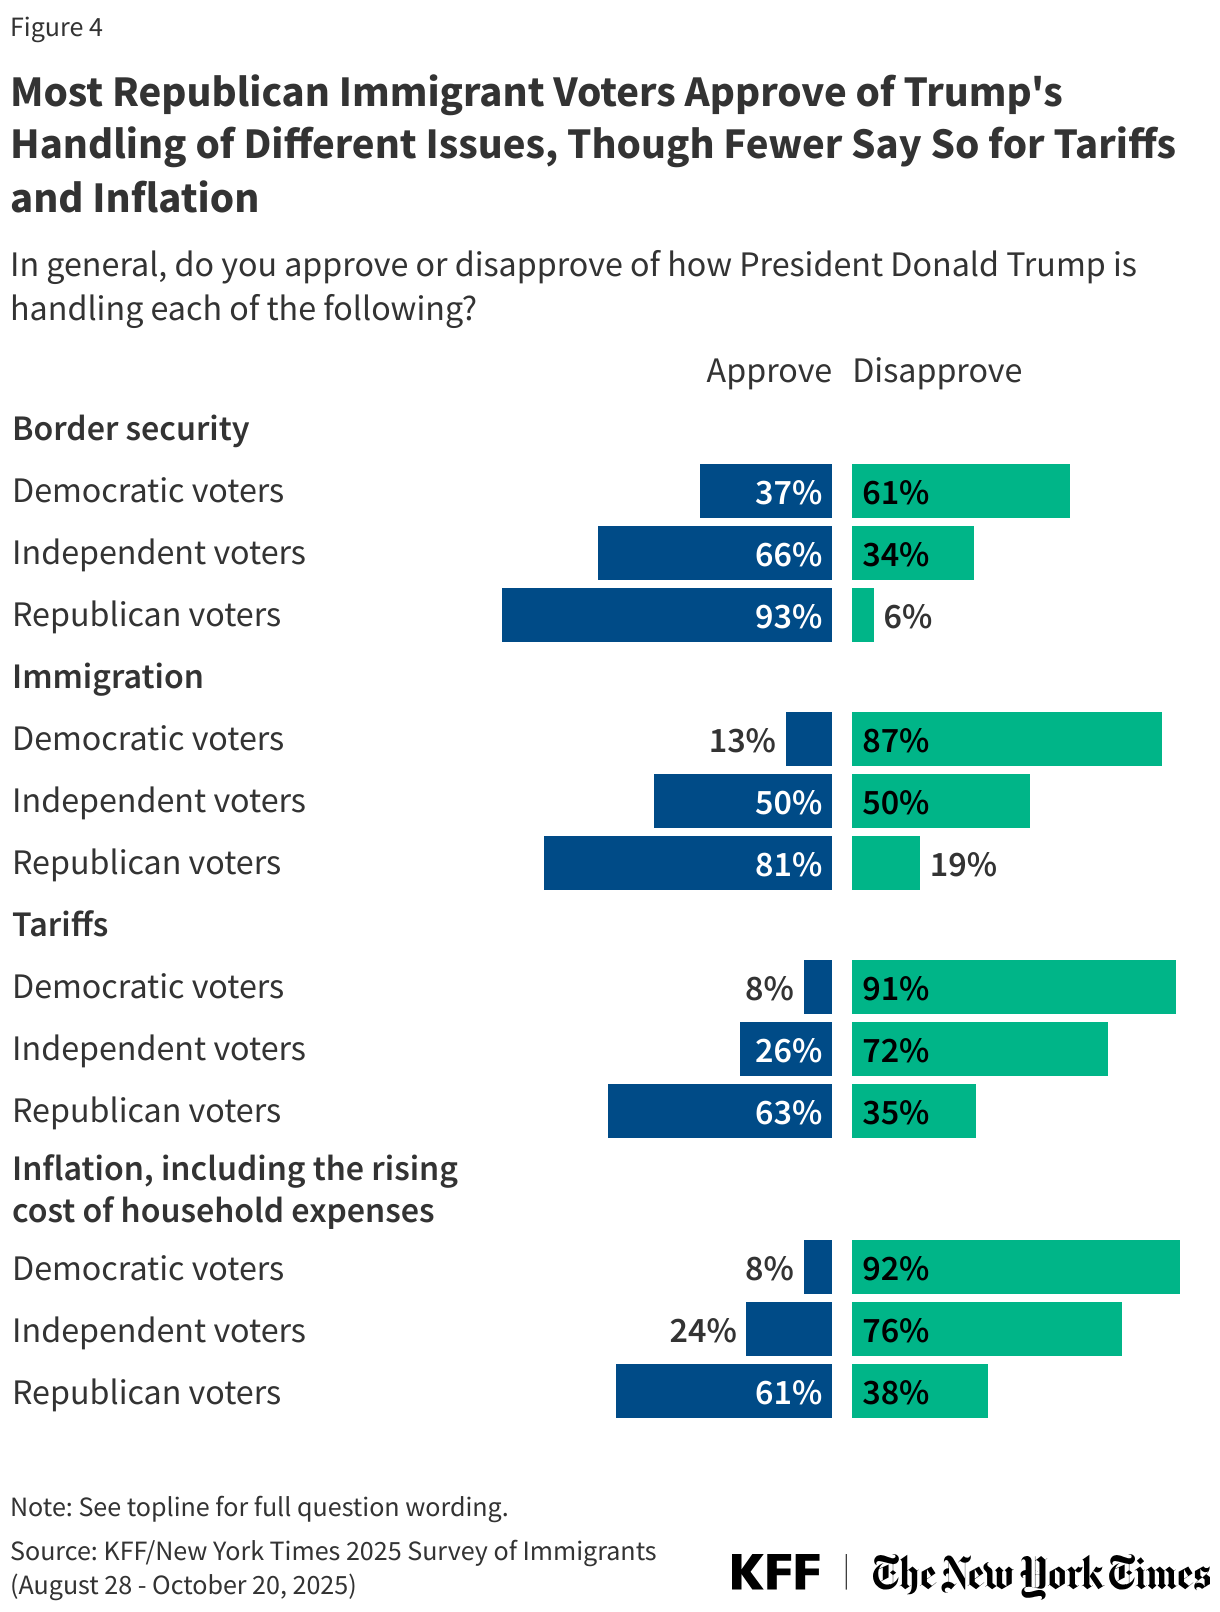
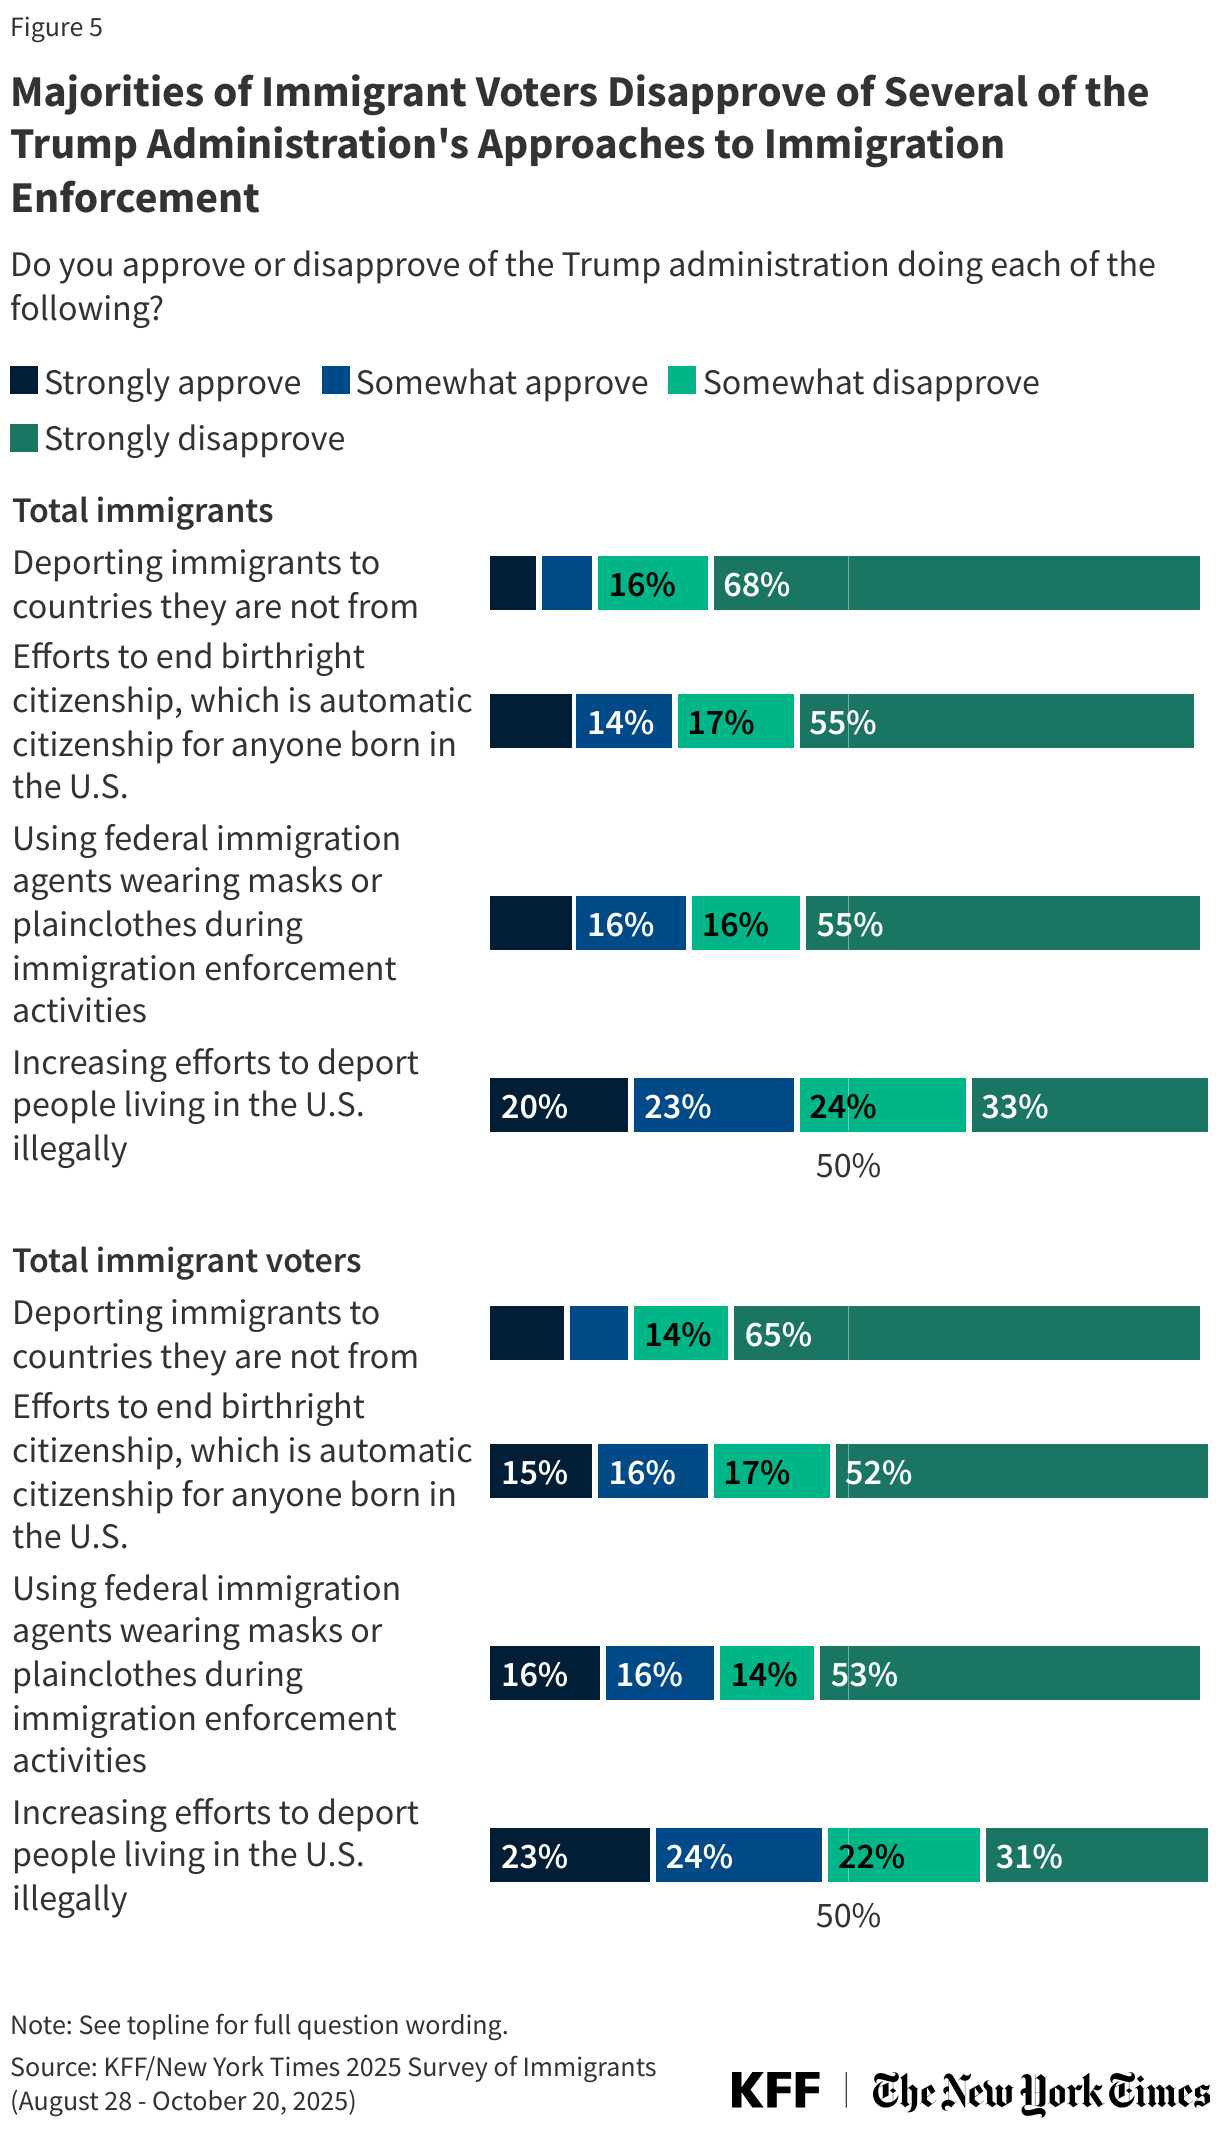
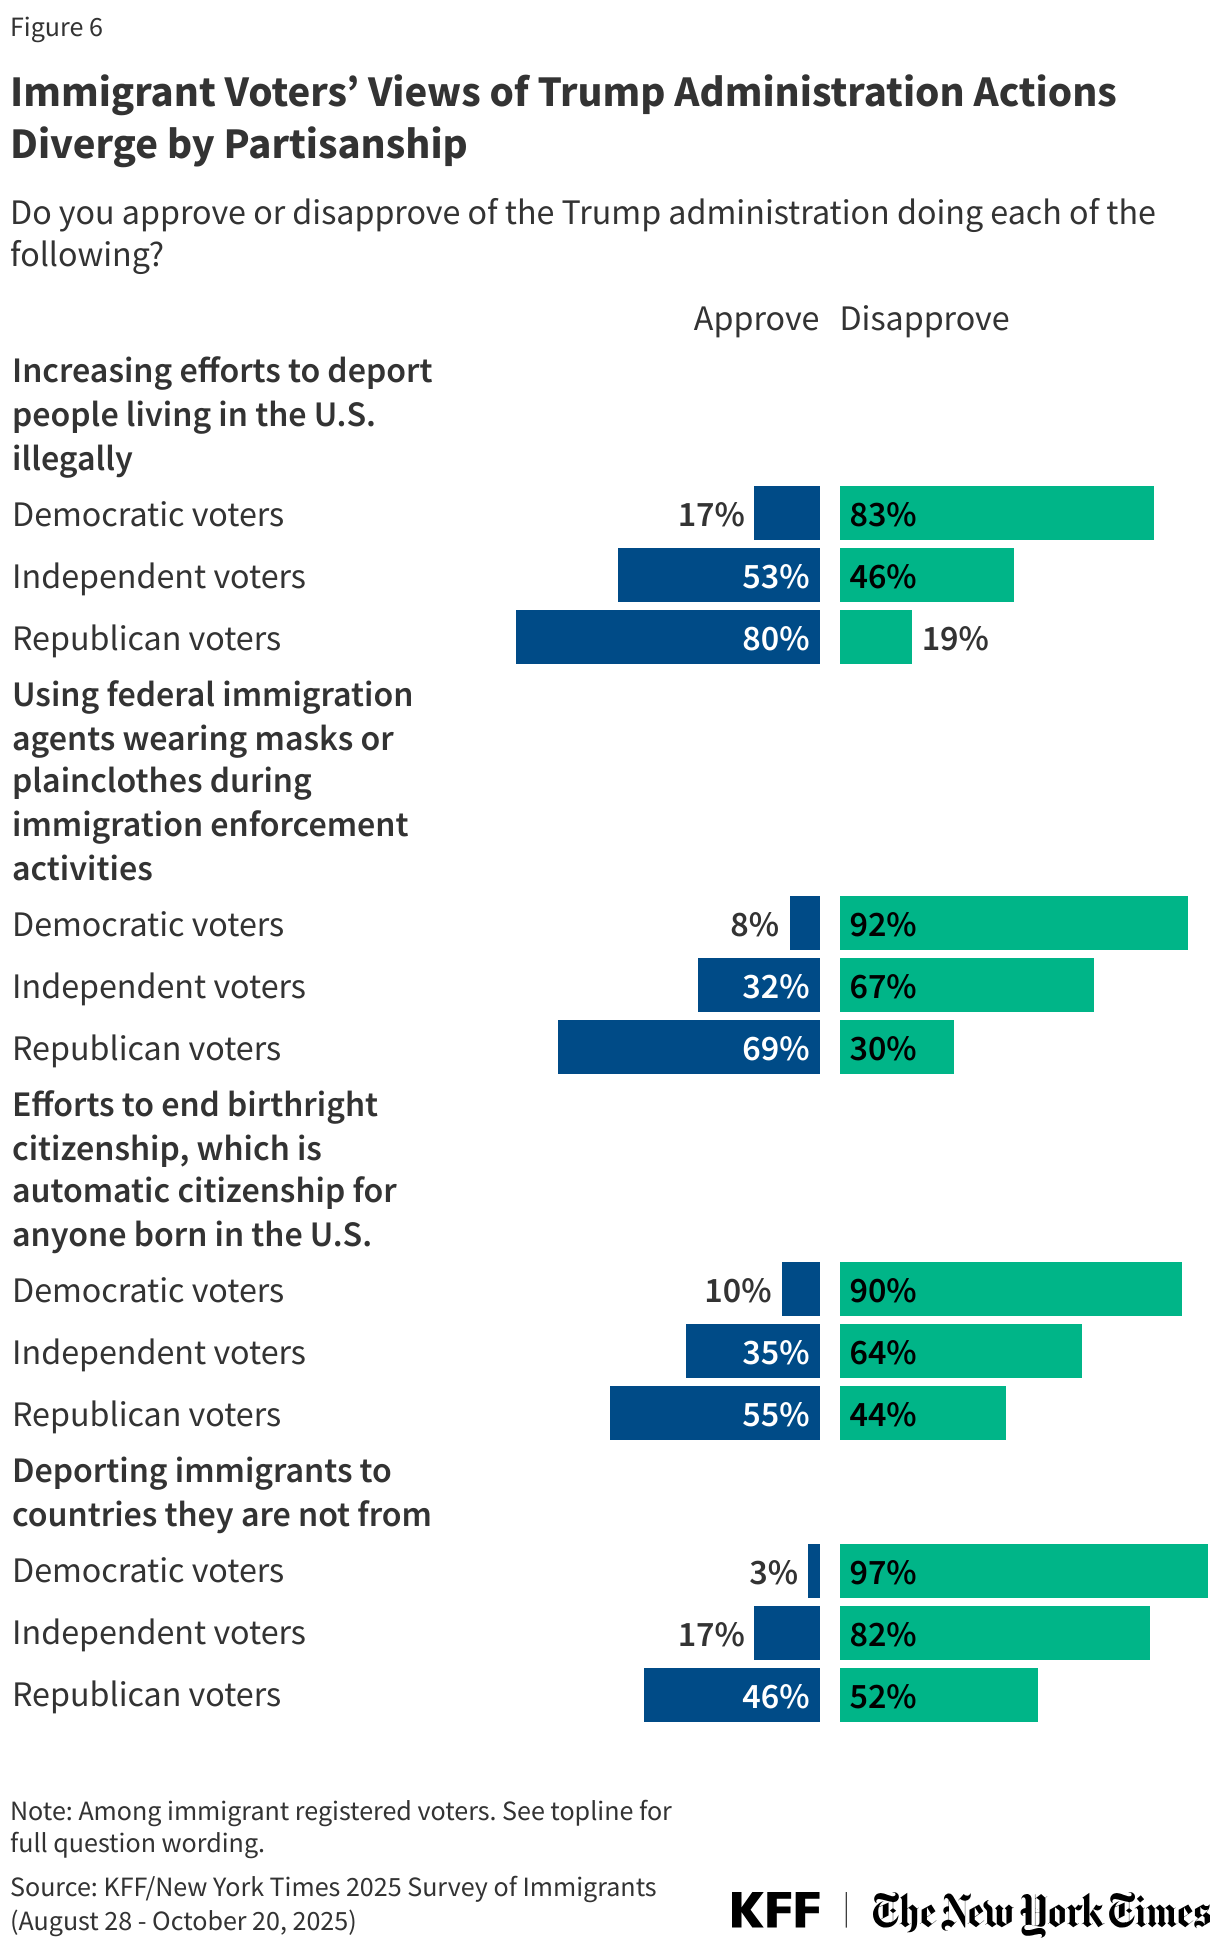
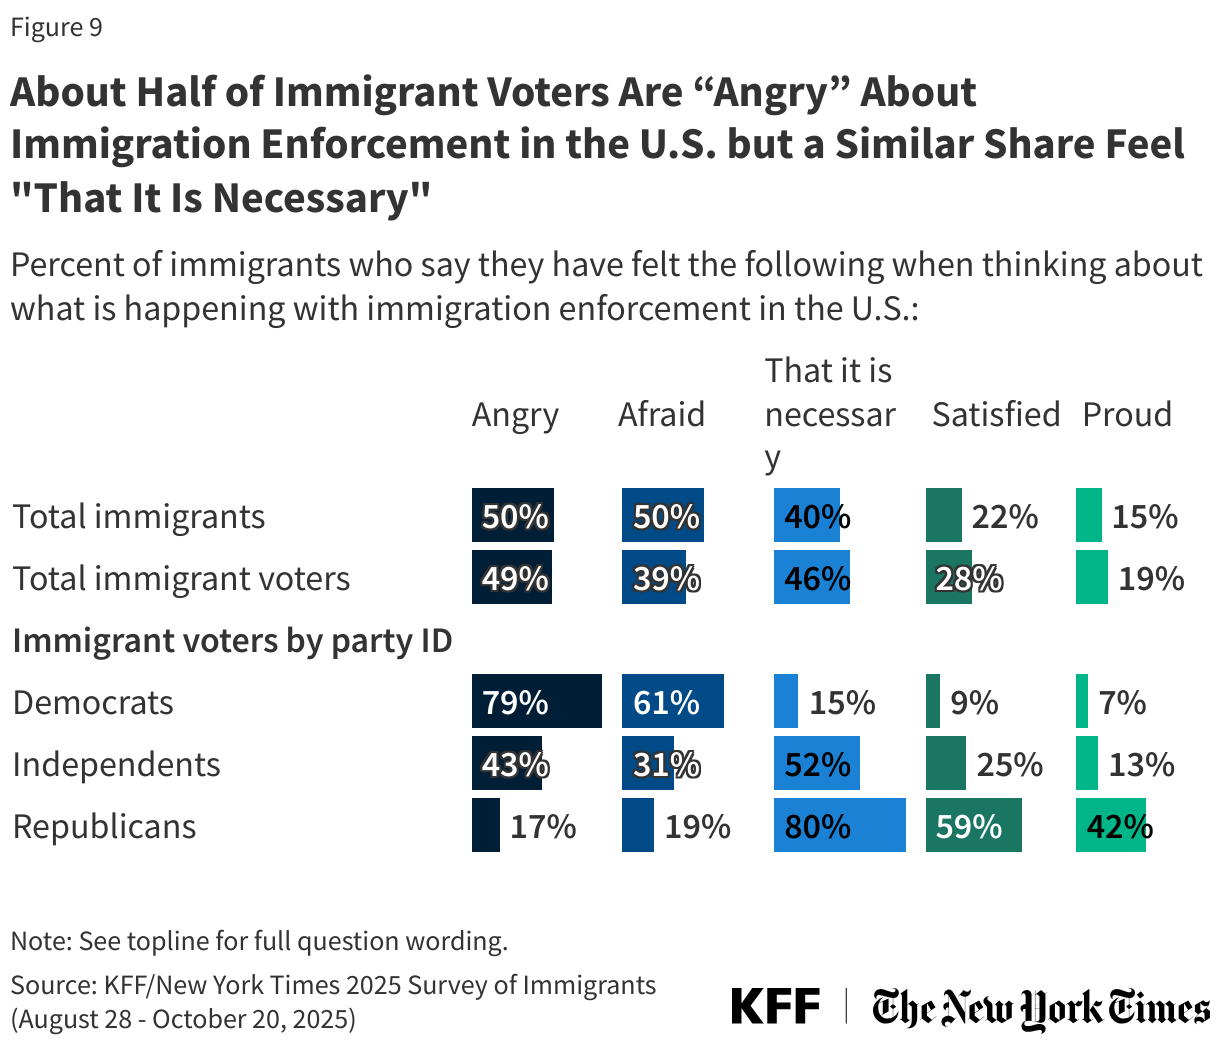
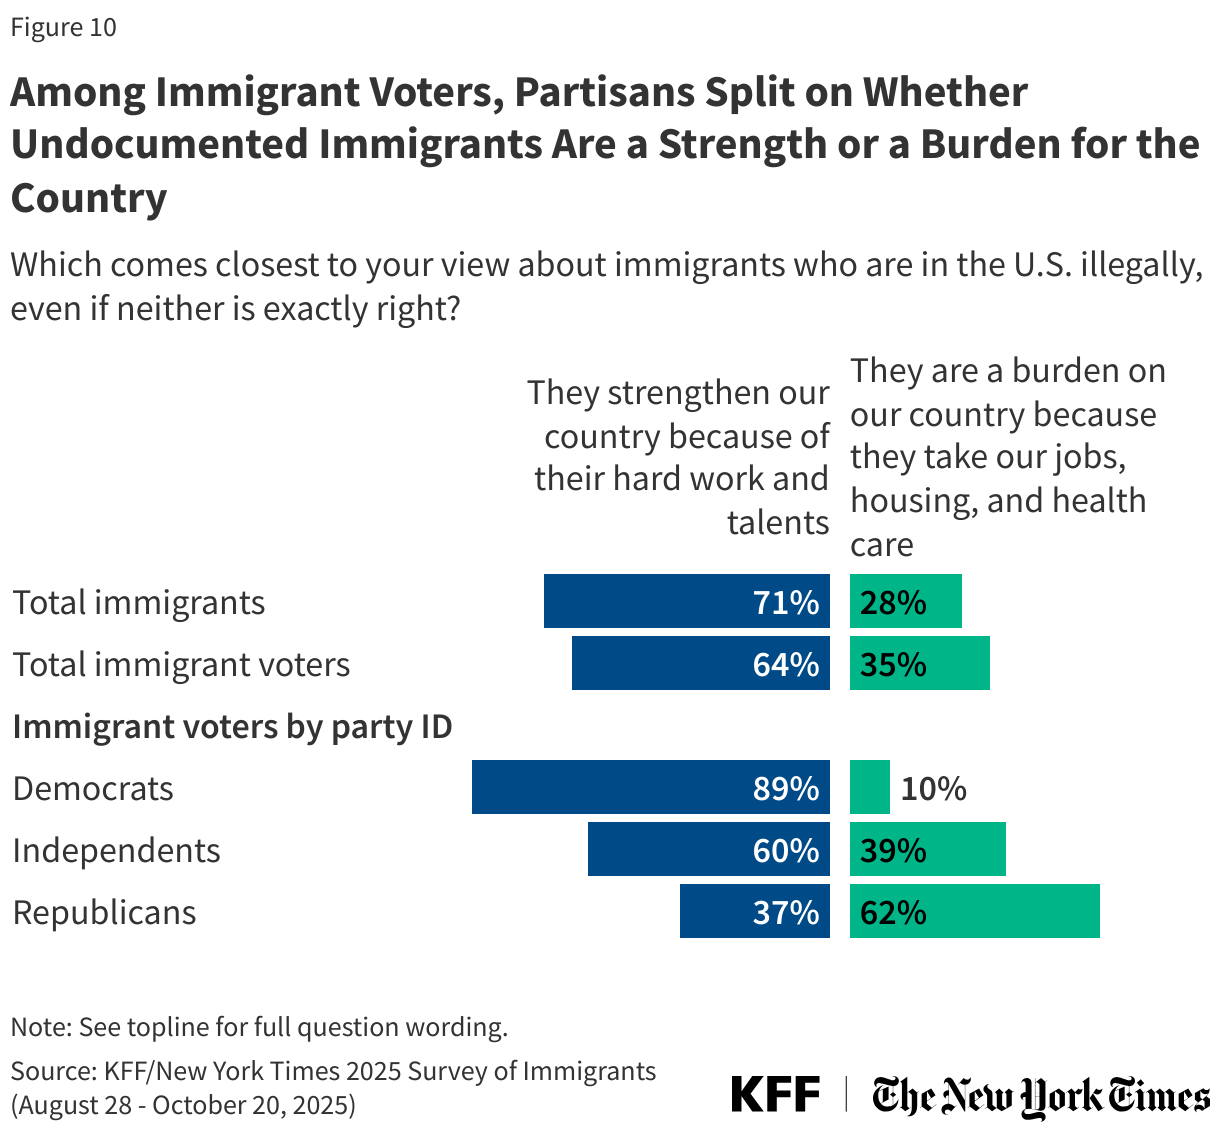
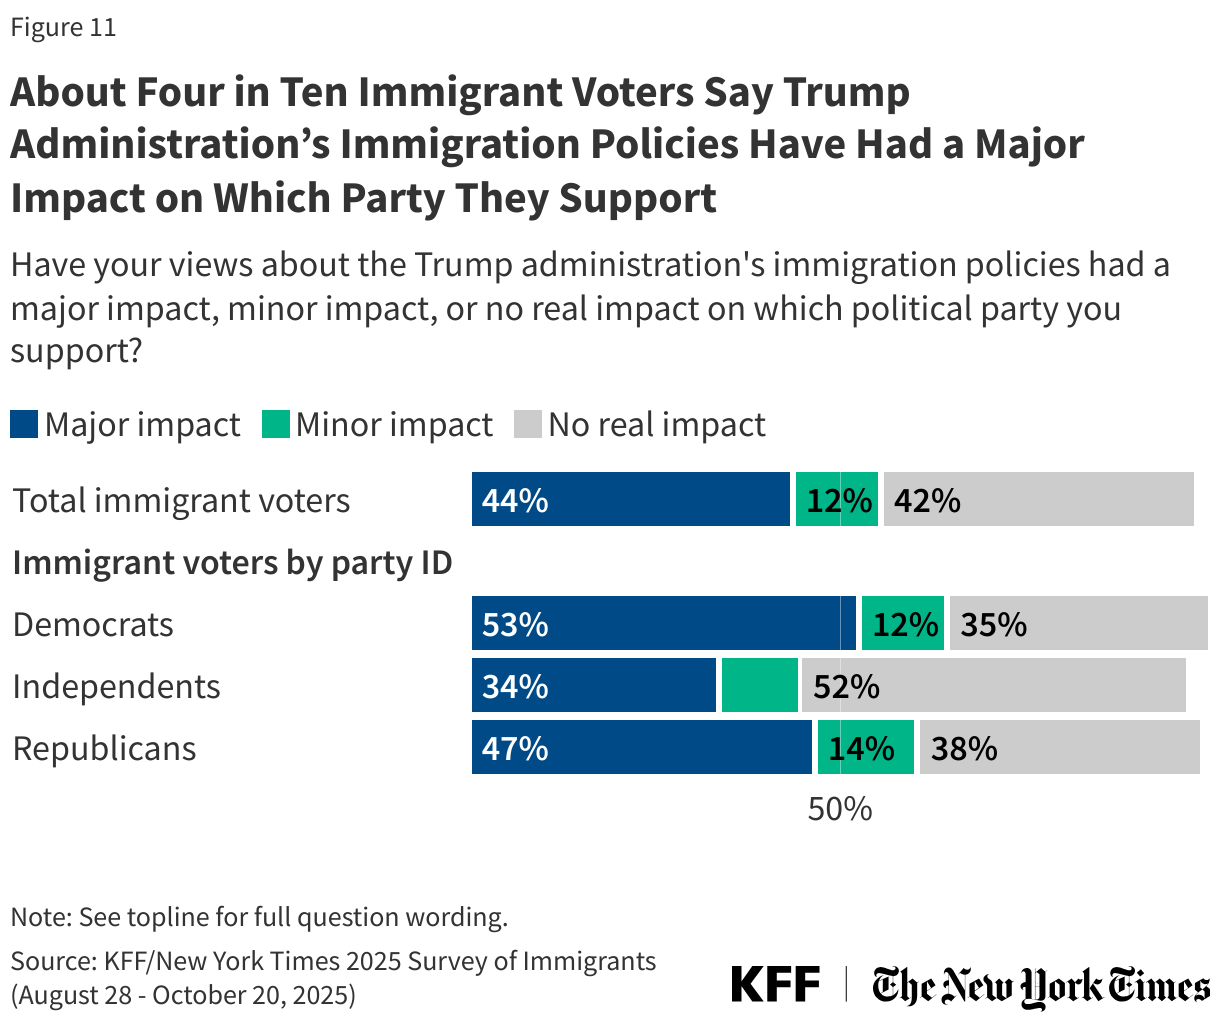
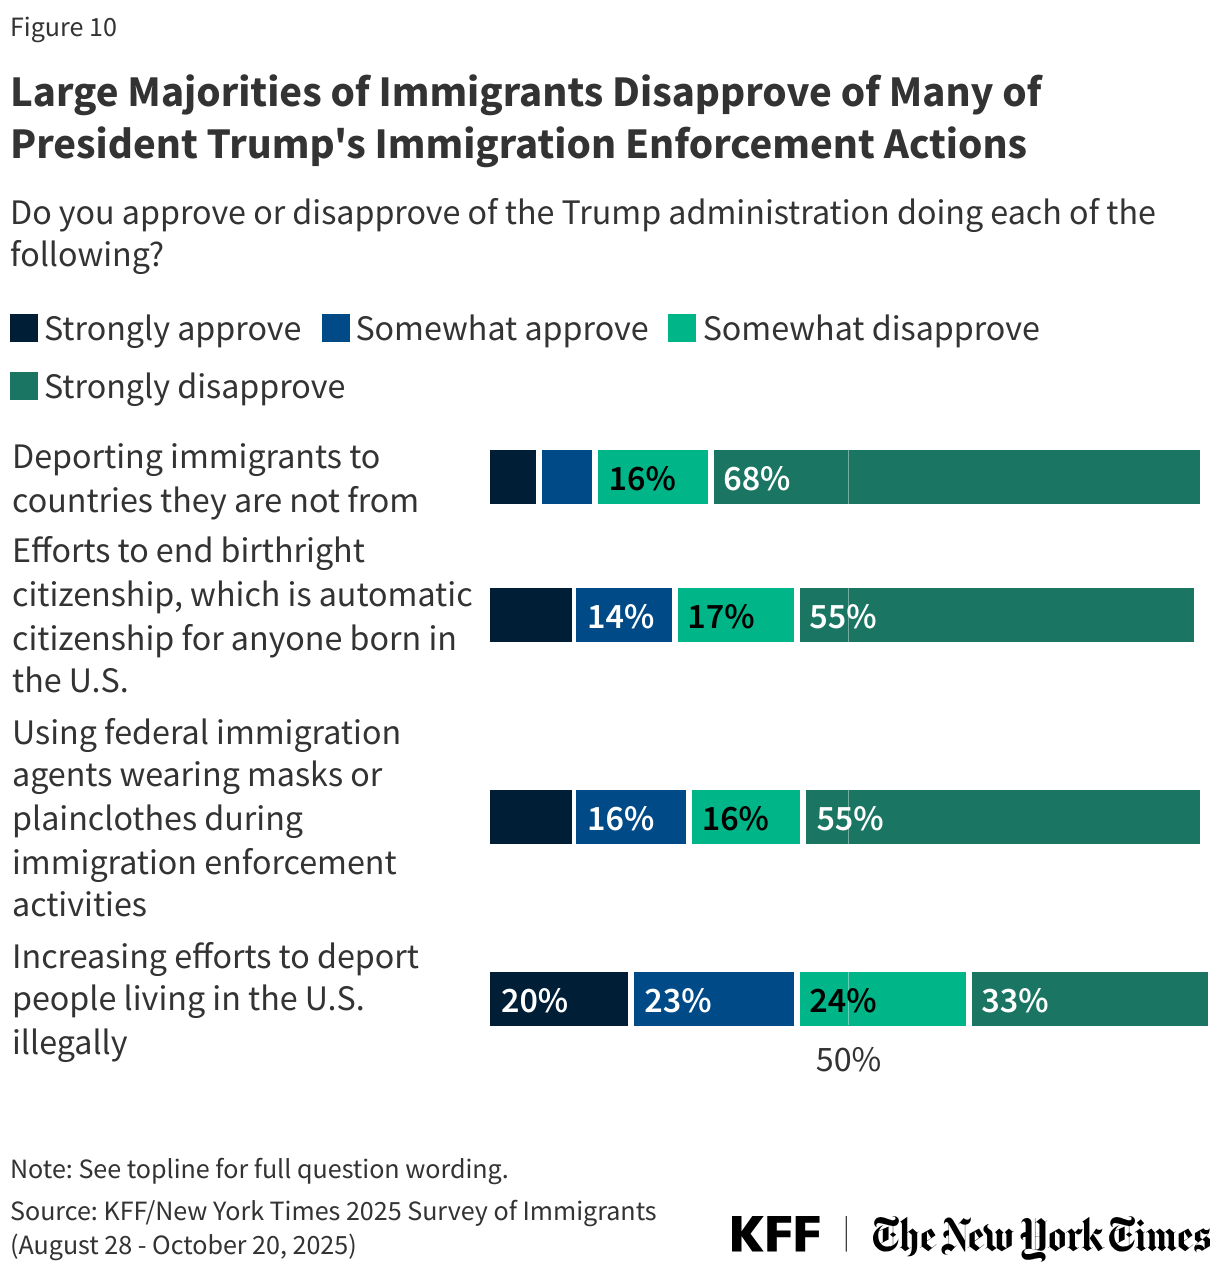
Large majorities of immigrants disapprove of the Trump administration deporting immigrants to countries they are not from (83%), efforts to end birthright citizenship (73%) and federal immigration agents wearing masks or plainclothes during immigration enforcement activities (71%). Fewer, though still a majority (57%), disapprove of the administration increasing efforts to deport more people living in the U.S. illegally. Views of the Trump administration’s policies diverge sharply by partisanship; for more, see the companion report focused on immigrant voters.
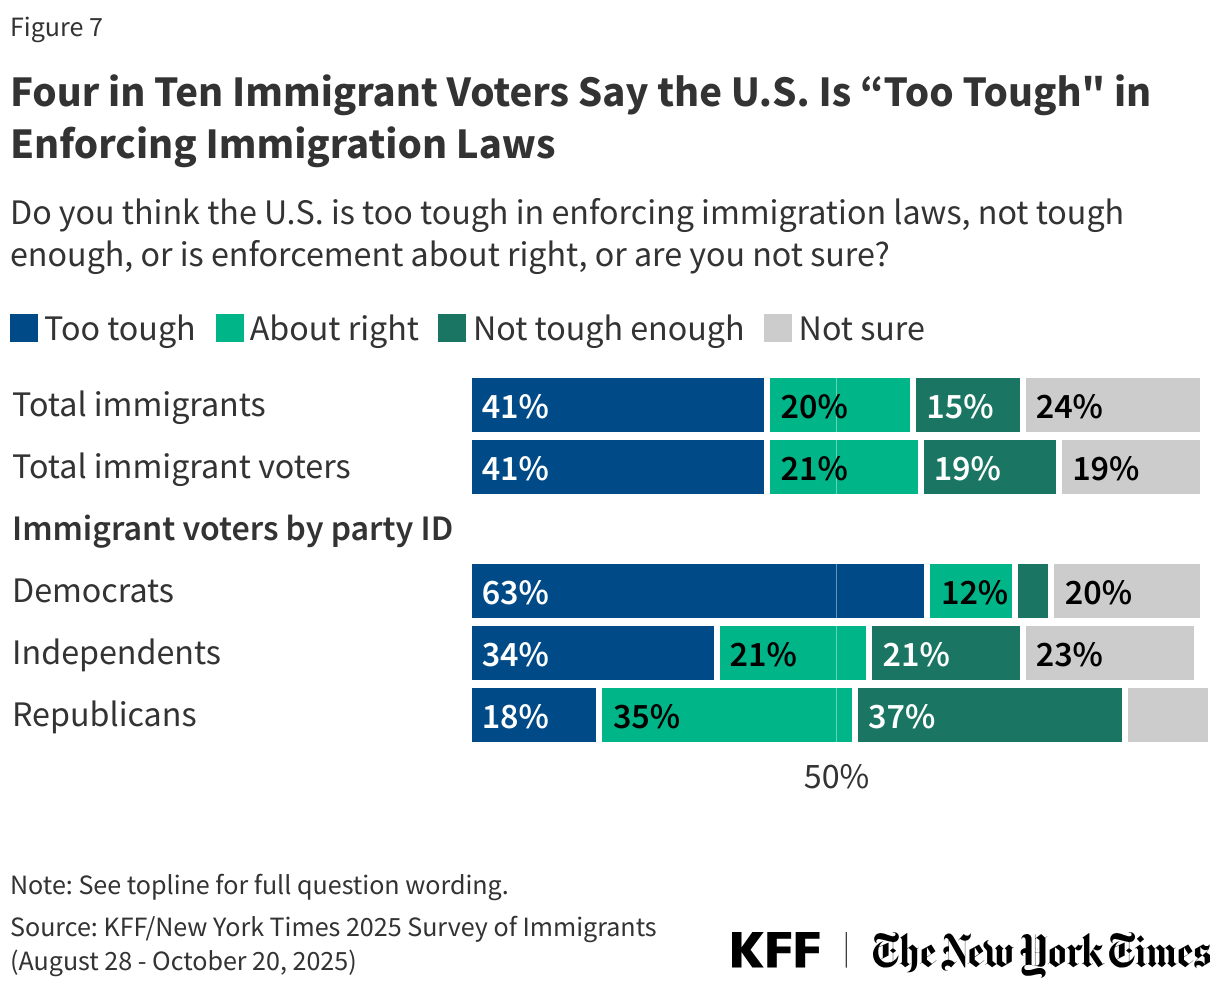
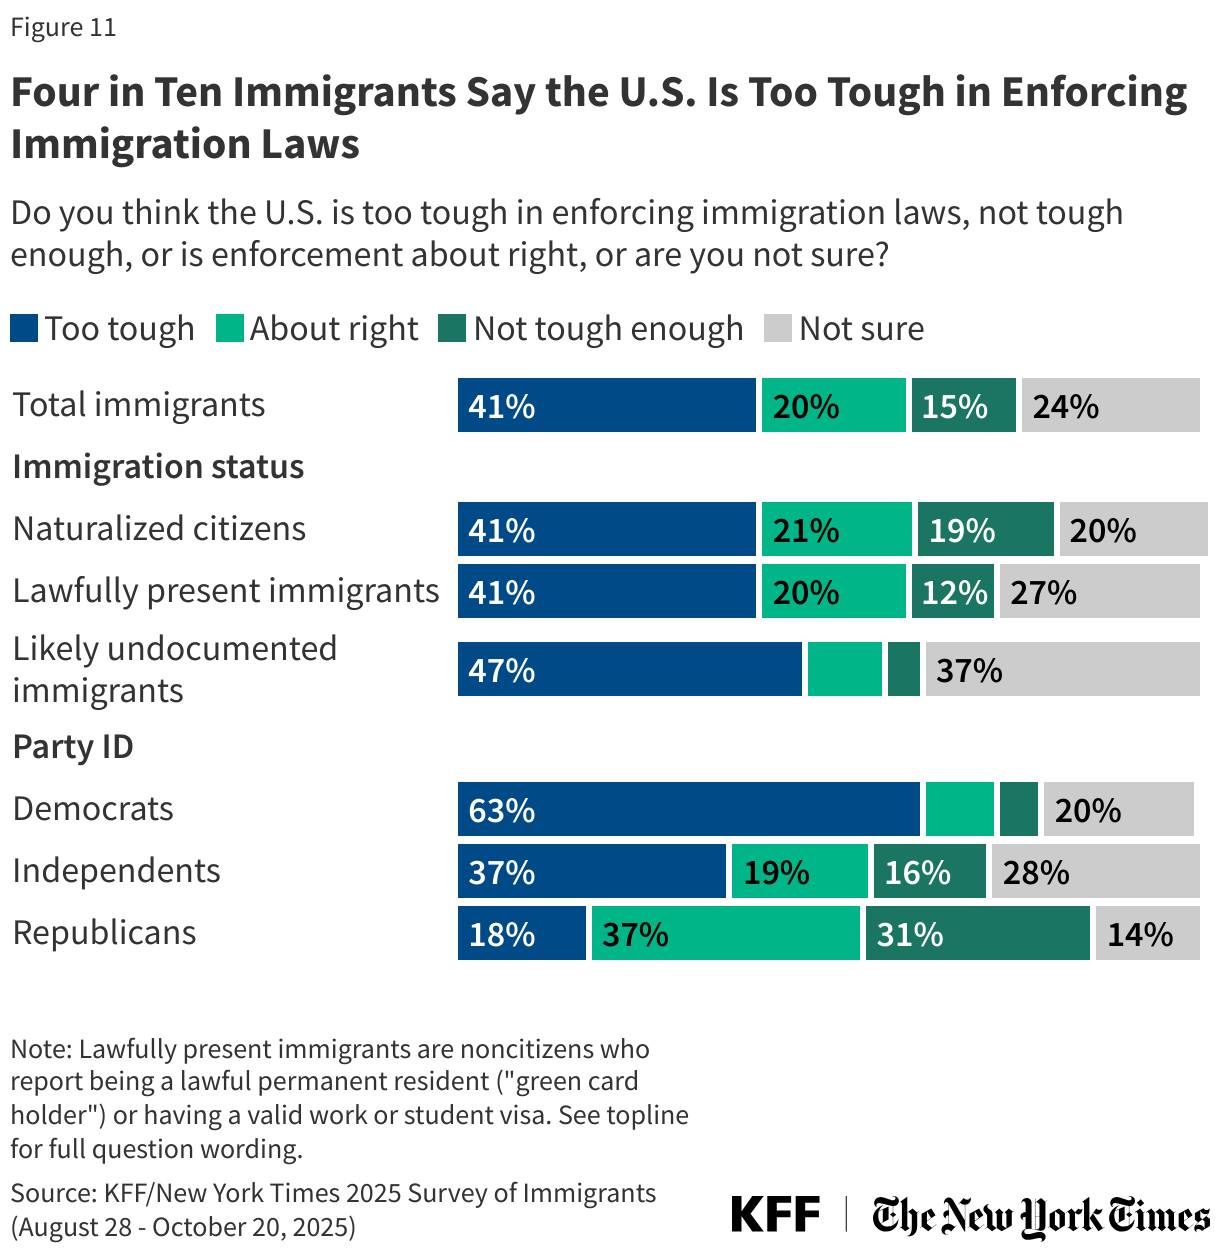
About four in ten (41%) immigrants now say the U.S. is too tough in enforcing immigration laws, more than double the share who said so in 2023 (19%). In 2025, one in five (20%) say enforcement is “about right” and one in six (15%) say it is “not tough enough.” A further one in four (24%) say they are “not sure.” About half of likely undocumented immigrants (47%) say the U.S. is too tough in enforcing immigration laws, as do at least four in ten naturalized citizens (41%) and lawfully present immigrants (41%).
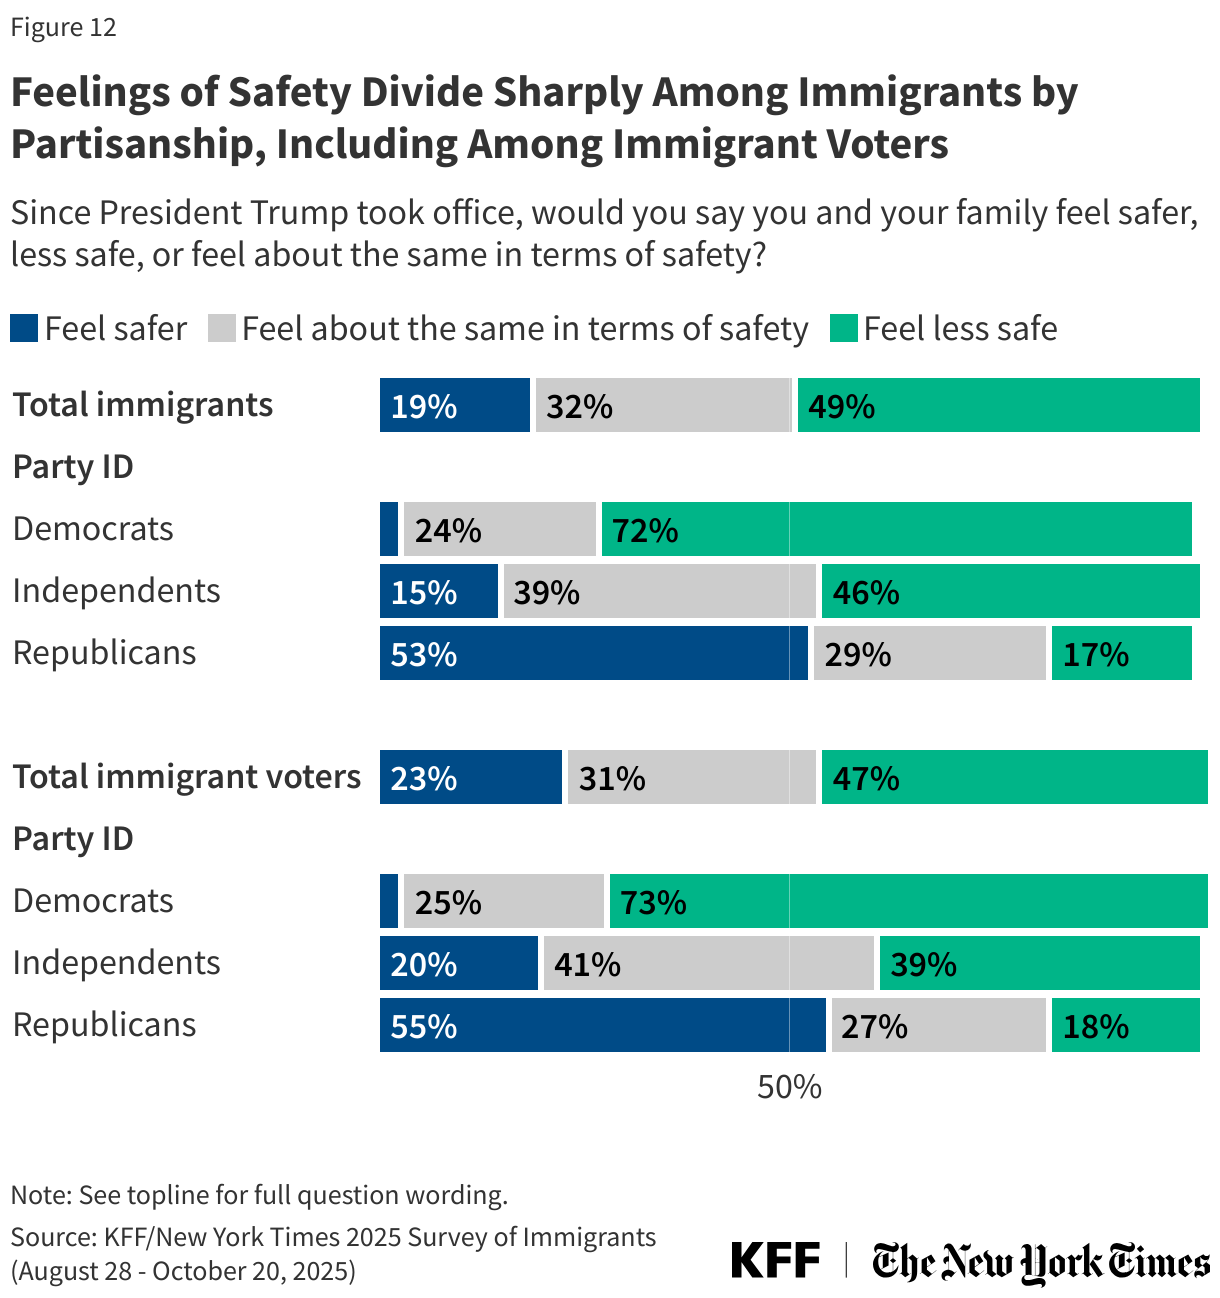
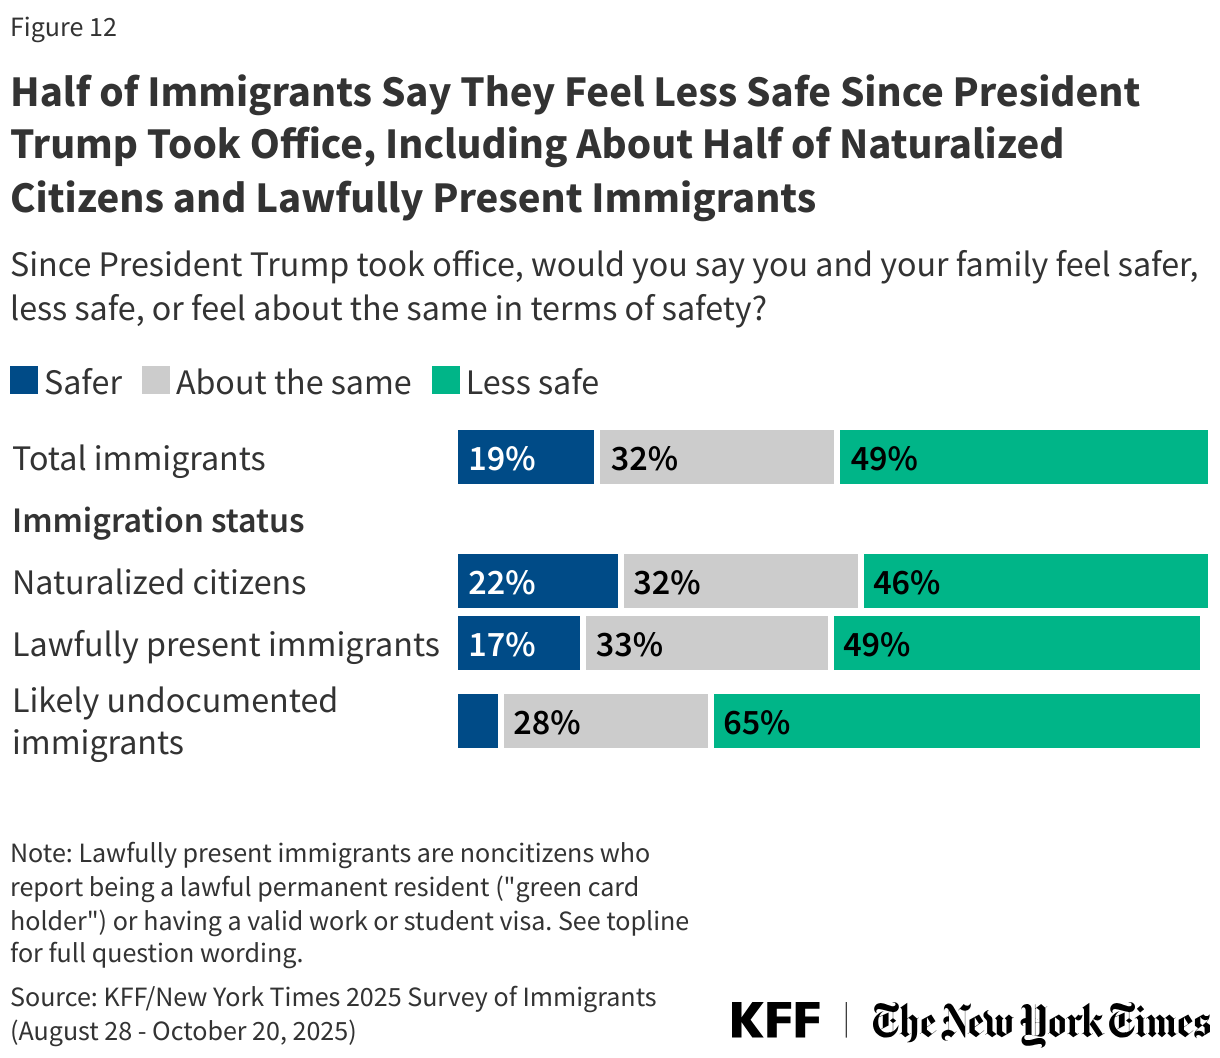
About half of immigrants, including about half of naturalized citizens and lawfully present immigrants, say they and their families feel “less safe” since President Trump took office. Overall, about three in ten (32%) immigrants say they and their family feel “about the same in terms of safety,” while 19% report feeling “safer” since President Trump took office. Likely undocumented immigrants report the highest concerns, with two-thirds saying they feel “less safe” since President Trump took office.
About one-third (35%) of immigrants say the Trump administration’s activities have had a negative impact on them and their family, including six in ten (60%) likely undocumented immigrants and about four in ten (38%) of those who are lawfully present. About half (53%) immigrants overall say immigration enforcement has not affected their family while about one in ten (11%) report a “positive impact.” Four in ten (40%) immigrant parents also say their family has been negatively affected.
In Their Own Words: How Immigrants Have Been Impacted by the Trump Administration’s Immigration Enforcement Activities
Among those who said negative impact:
“Friends and family around us who are legally in the US. are getting deported without due process.” —20-year-old Japanese immigrant in New Jersey
“Trump's immigration enforcement activities have made it difficult to afford basic necessities such as food and water. Due to his tariff placements, the cost of living has risen significantly within the last 5 years which is impacts my family since we cross the border to Mexico to afford basic necessities that are unaffordable in the United States. My family fears the possibilities of not being able to return home in the United States because of racial prejudice rather than the local Mexican cartel getting into a firefight.” —50-year-old Mexican immigrant man in Texas
“Even being a lawful permanent resident who has never been arrested, I fear traveling out of the country” —35-year-old Jamaican immigrant woman in New Jersey
“My family, friends, and colleagues are worried, stressed, and scared every single time we step out of our homes as we don't want to be the next family to be deported. Although we are naturalized citizens and have been for years, we have seen and read that innocent immigrants with no history of delinquency are also being deported just because of where they were born. Whether that is true or not, we are all frightened and stressed because of all this.” —40-year-old Nicaraguan immigrant woman in Illinois
“Mr. Trump have made things difficult for immigrants. USCIS has even made it tougher to be able to obtain a citizenship by introducing more rules and regulation to in fact, the ones who have been legally living in United States on permanent status for long time.” —46-year-old Pakistani immigrant man in Illinois
“Now, we must carry our passports on our bodies when we step out of the house. Never did that before.” —50-year-old Korean immigrant woman in California
“…For years, we have held on to the hope that gaining U.S. citizenship would open the doors to stability, opportunity, and a sense of belonging. However, the reality has been far more difficult than we imagined. Even after achieving citizenship, many of us continue to face systemic barriers — from limited access to good jobs and affordable housing to complex social and economic challenges that make it hard to truly feel at home. Instead of the brighter future we hoped for, many of us live in uncertainty and fear. … While we are grateful to be here, we also struggle with the feeling that America has yet to become the home we dreamed it would be.” —27-year-old Tanzanian immigrant man in Iowa
Among those who said positive impact:
“They are making our country safer by sending away illegals, especially ones with the criminal background.” —44-year-old Estonian immigrant woman in Virgina
“We feel better and safer knowing that illegal immigrants, especially those with criminal background, have been drastically reduced.” —87-year-old Filipino immigrant man in Texas
“Every country wants people to come to their country legally. We came here fairly and legally. Everyone should come here legally as well.” —61-year-old Indian immigrant woman in California
“Paying less taxes to help illegals with housing, medical needs, and food services, is crucial to my survival so that I can take better care of myself and afford to live. Paying less for insurance because so many illegals don't bother to, will also be good for my finances.” —67-year-old Portuguese immigrant woman in Arizona
Note: Responses are lightly edited for length and spelling, but reflect respondents' own language and do not represent the views of KFF.
Economic Concerns Under the Second Trump Administration
Beyond their concerns about immigration enforcement, about half (48%) of immigrants across immigration status say it has been harder for them and their families to earn a living since January. A further four in ten (40%) say there has been “no change,” while about one in ten (12%) say it has been easier to earn a living since January. While substantial shares across immigration status and race and ethnicity say it has been harder to earn a living since January, likely undocumented immigrants (62%), immigrants who live in low-income households (those earning less than $40,000 annually, 58%), Hispanic immigrants (55%), and immigrant parents (52%) are most likely to say this.
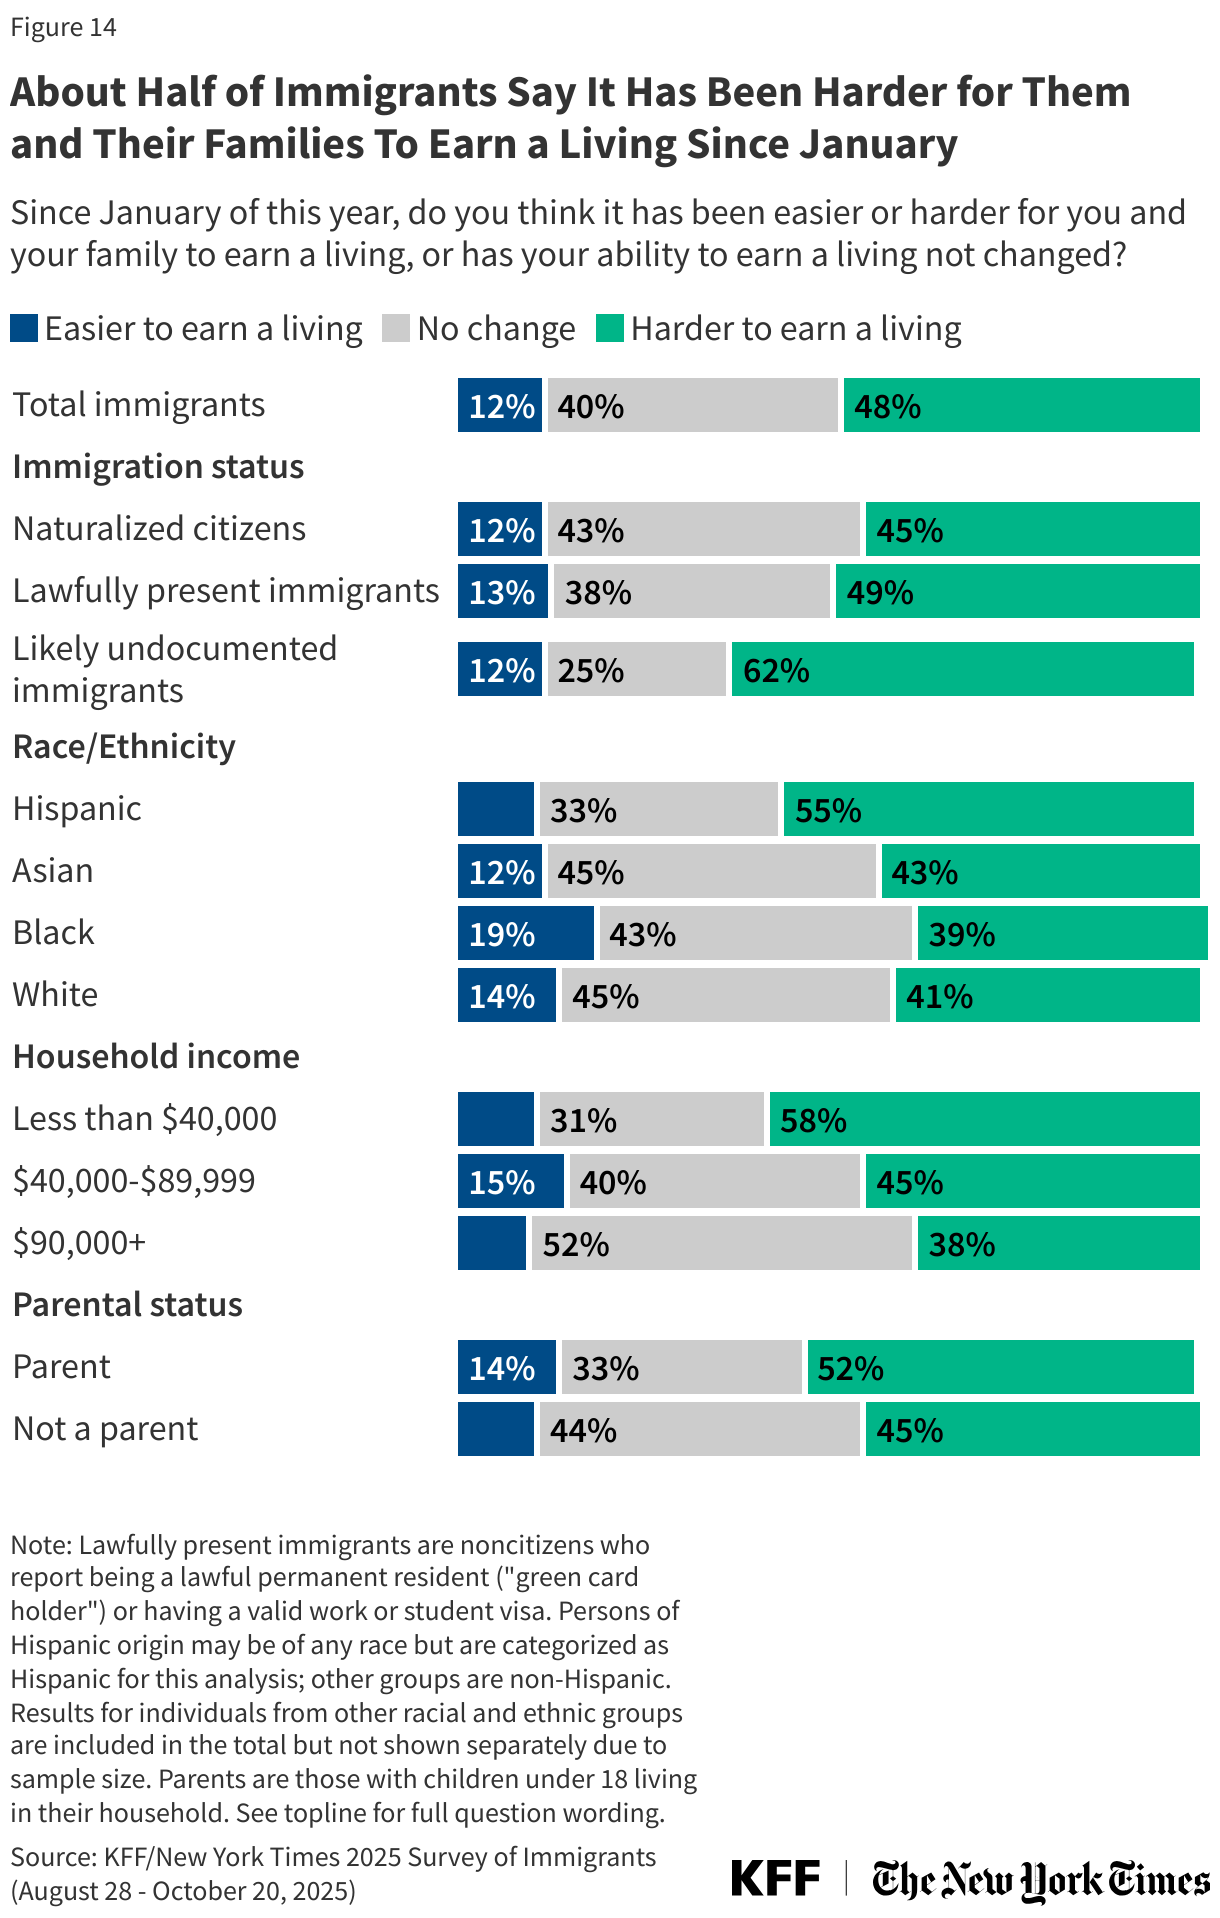
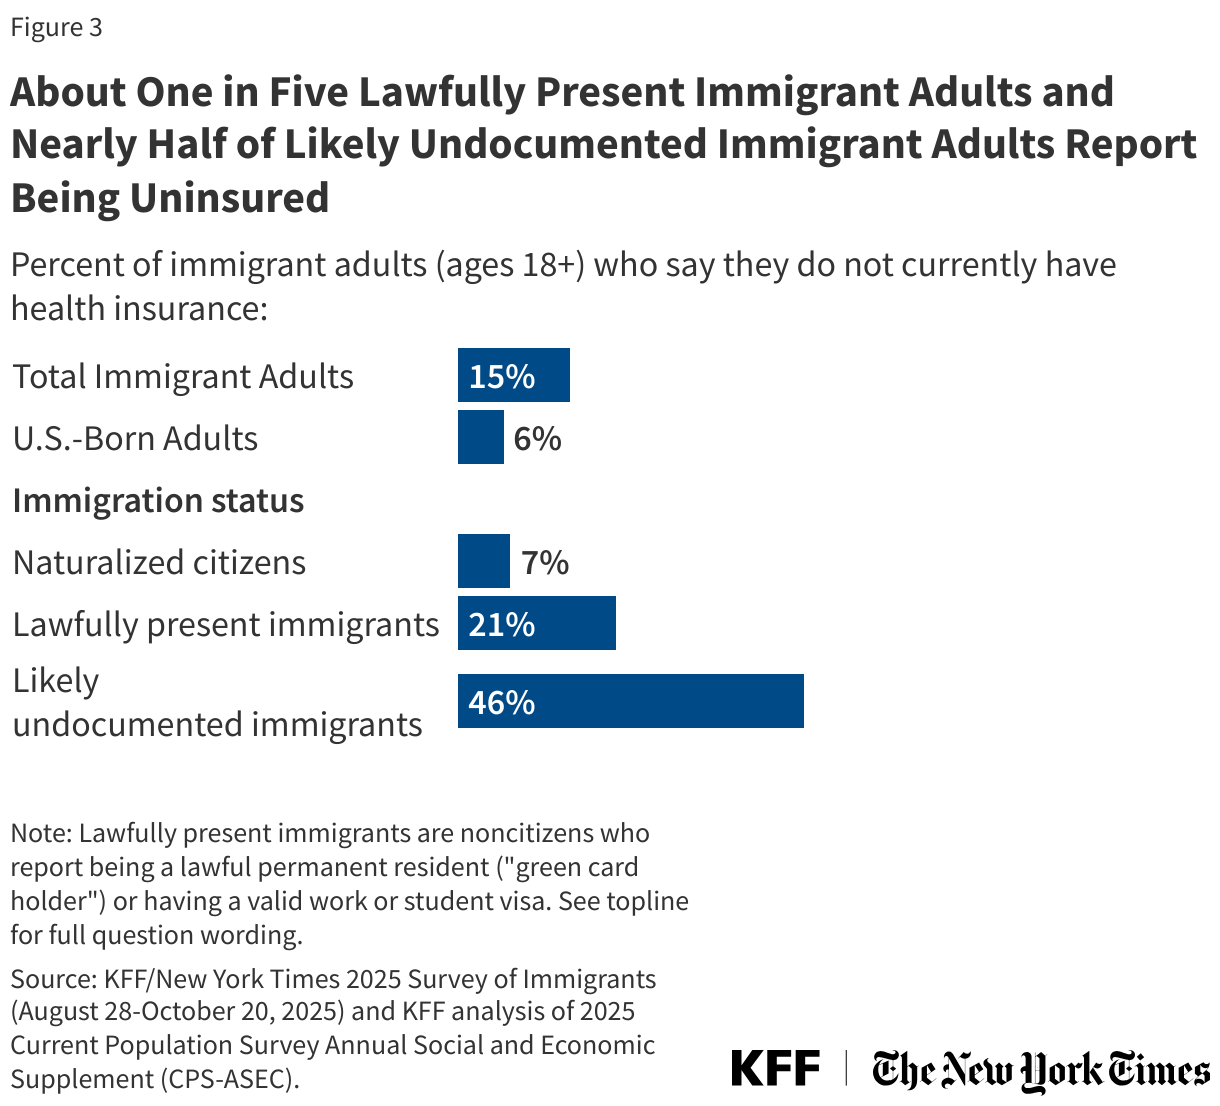
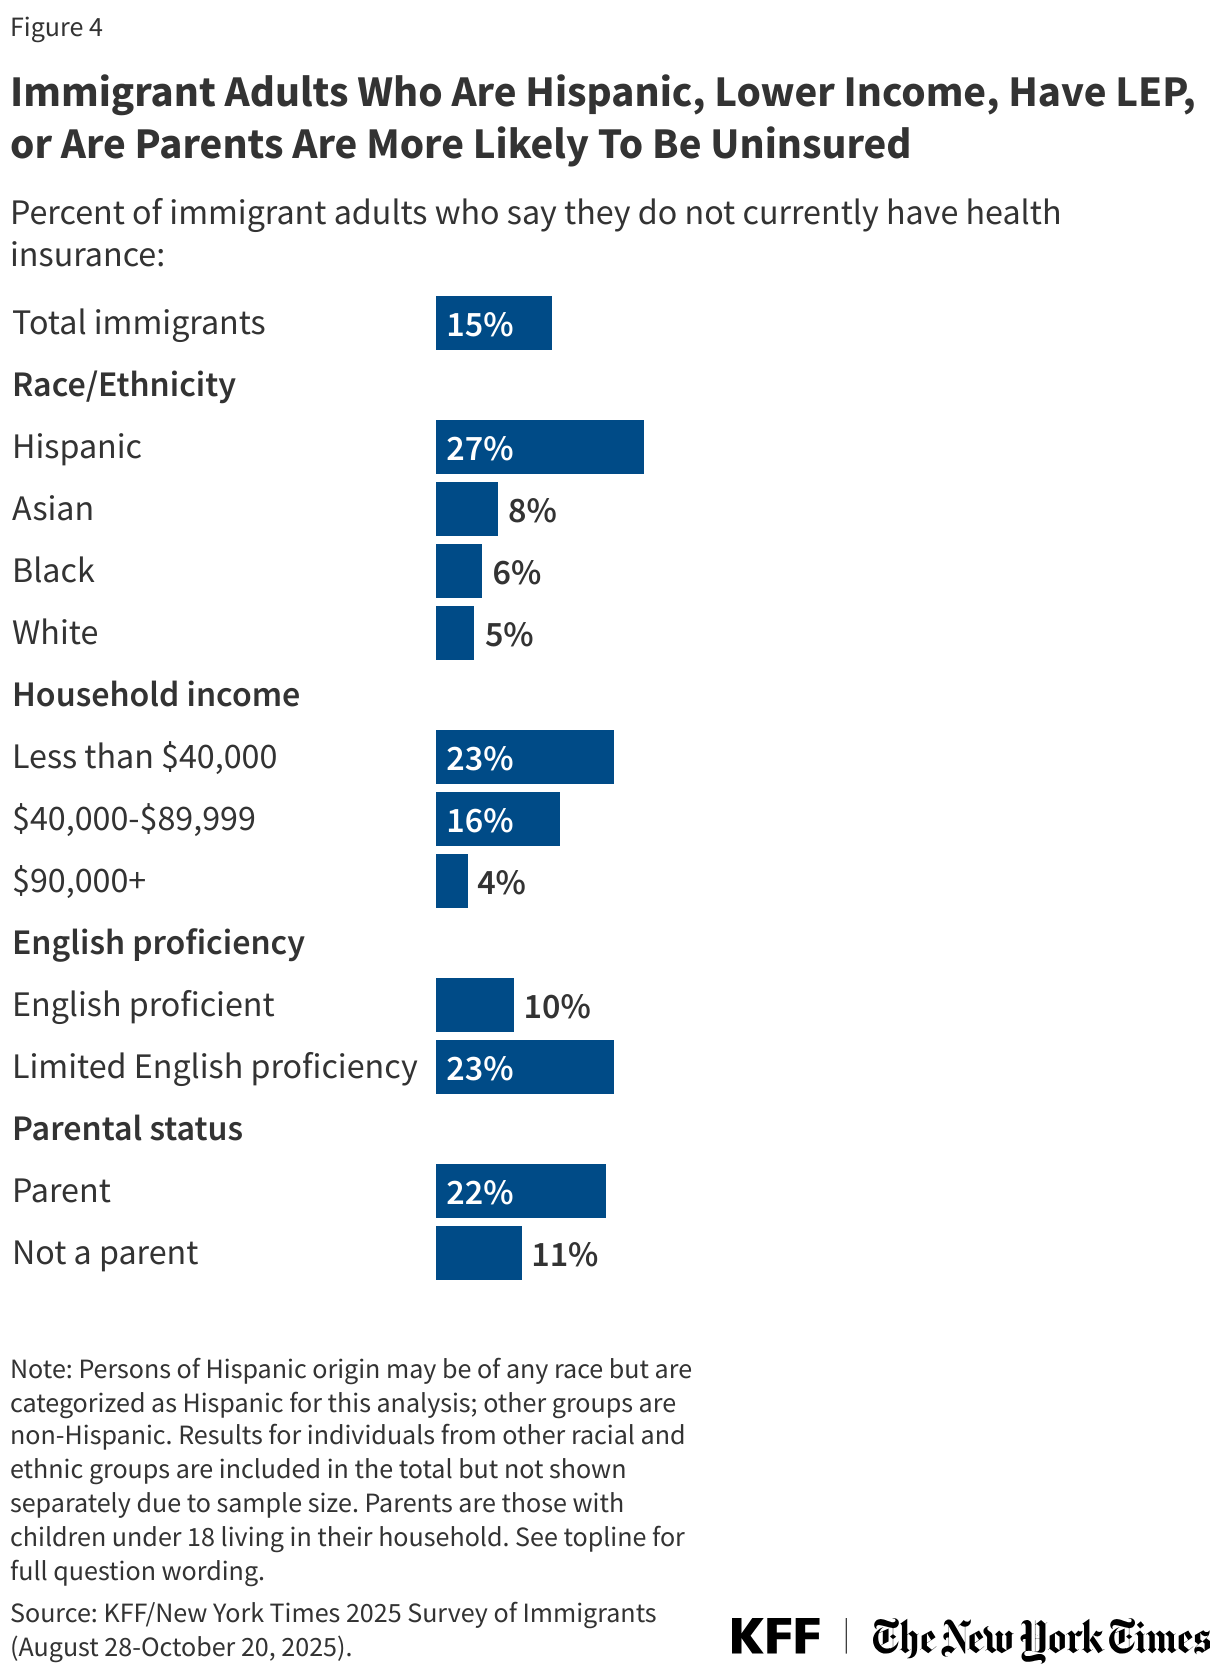
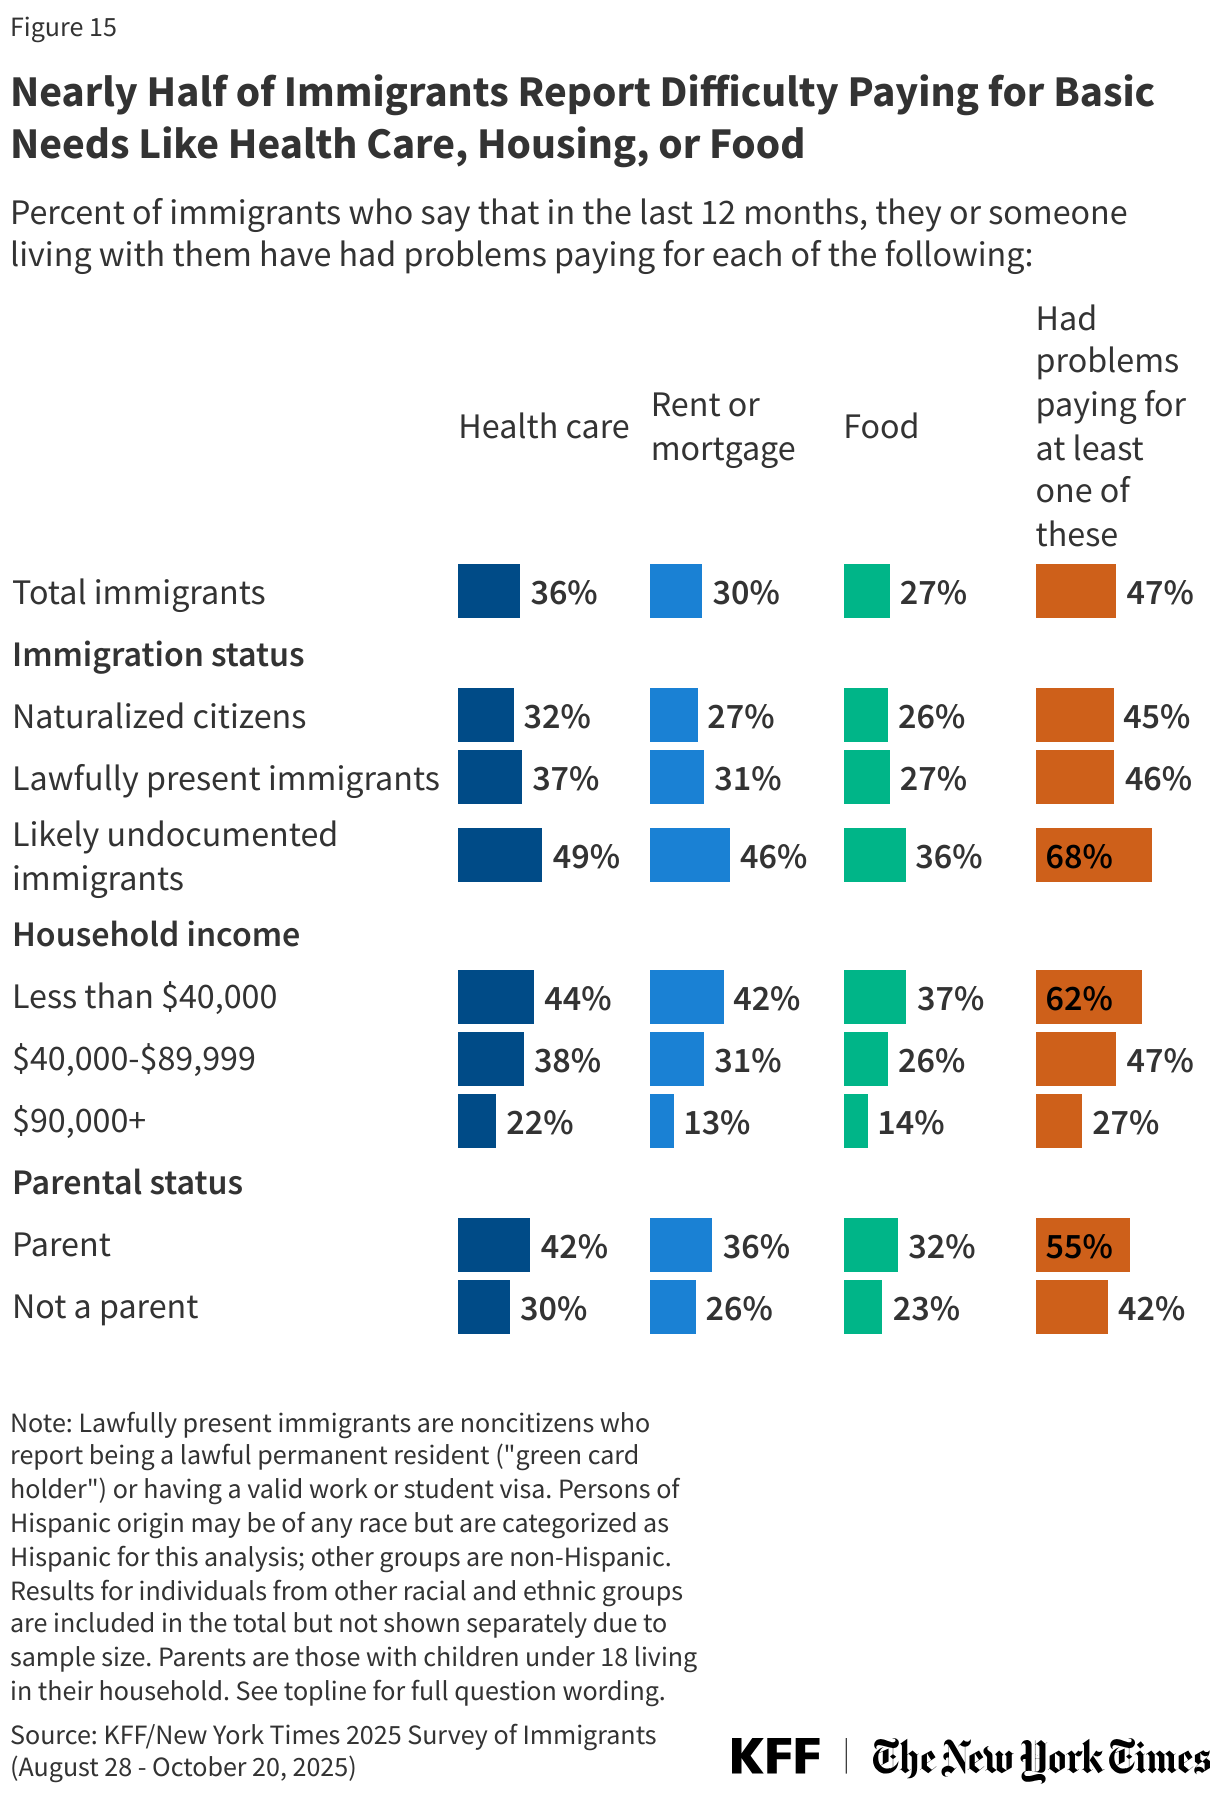
About half (47%) of immigrants report difficulty paying for basic needs like food, housing, or health care in the past 12 months, up from about three in ten (31%) who said the same in 2023. Large shares of immigrants say their household has had problems paying for at least one of the following necessities in the past 12 months: health care (36%), their rent or mortgage (30%), or food (27%). Seven in ten (68%) likely undocumented immigrants and six in ten (62%) of those living in households earning less than $40,000 annually and more than half (55%) of immigrant parents report problems paying for at least one of these necessities since January.
Views on the U.S. as a Good Place for Immigrants and Their Families
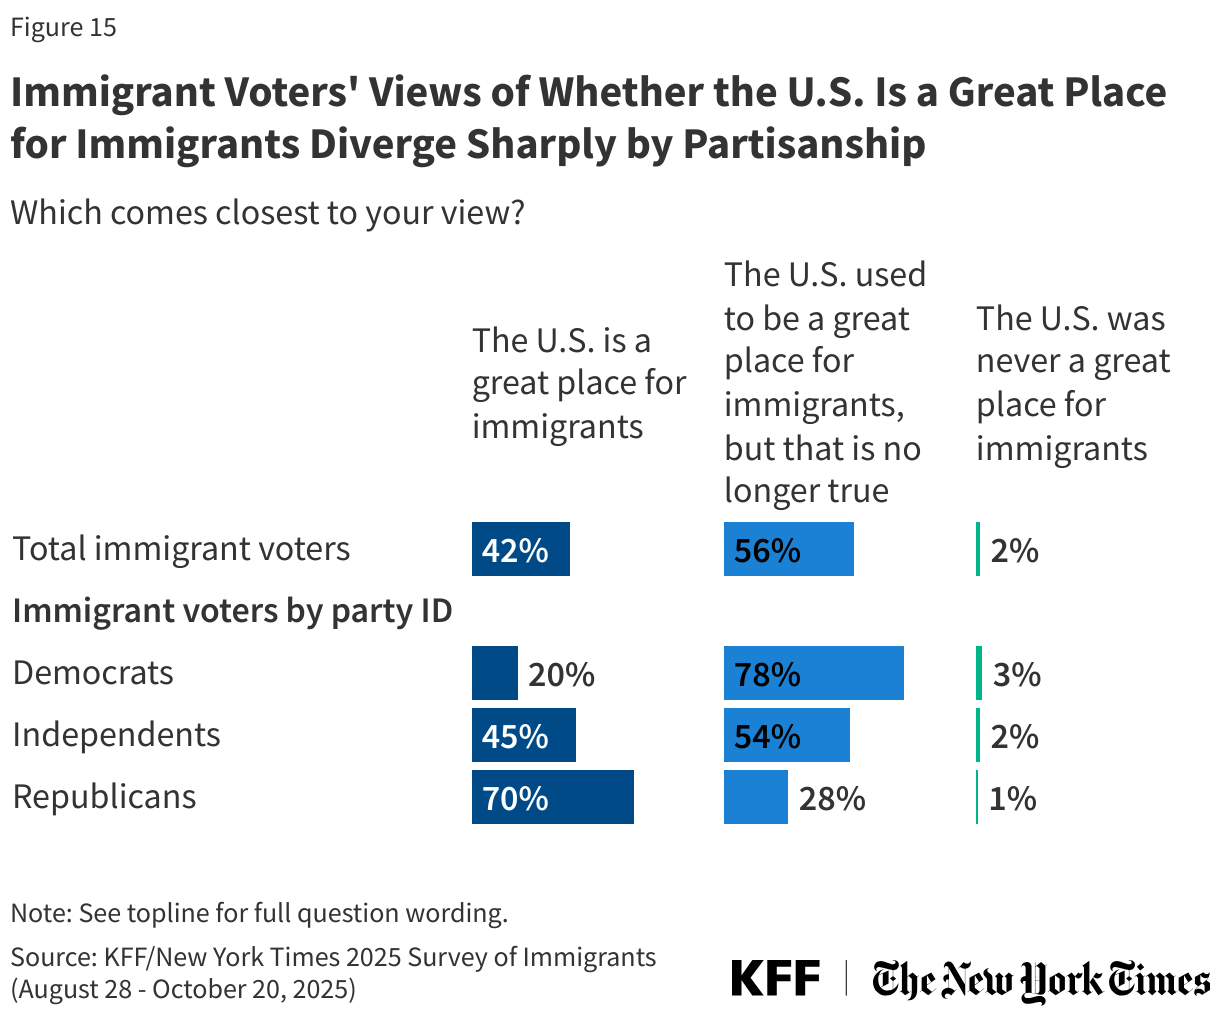
Most immigrants say the U.S. is no longer a good place for immigrants. Six in ten (60%) immigrants say “the U.S. used to be a great place for immigrants, but that is no longer true,” about one-third (36%) say “the U.S. is a great place for immigrants,” and just 4% say “the U.S. was never a great place for immigrants.” This varies greatly by partisanship; most immigrants who are Democrats (80%) and independents (61%) say the U.S. used to be a great place for immigrants, but that is no longer true, while most Republican immigrants (66%) say the U.S. is a great place for immigrants. For more information on the political views of immigrant voters see a companion report focused on immigrants’ political views. While naturalized citizens are more likely than noncitizen immigrants to view the U.S. as a great place for immigrants, a majority (56%) of naturalized citizens say the U.S. is no longer such a place.
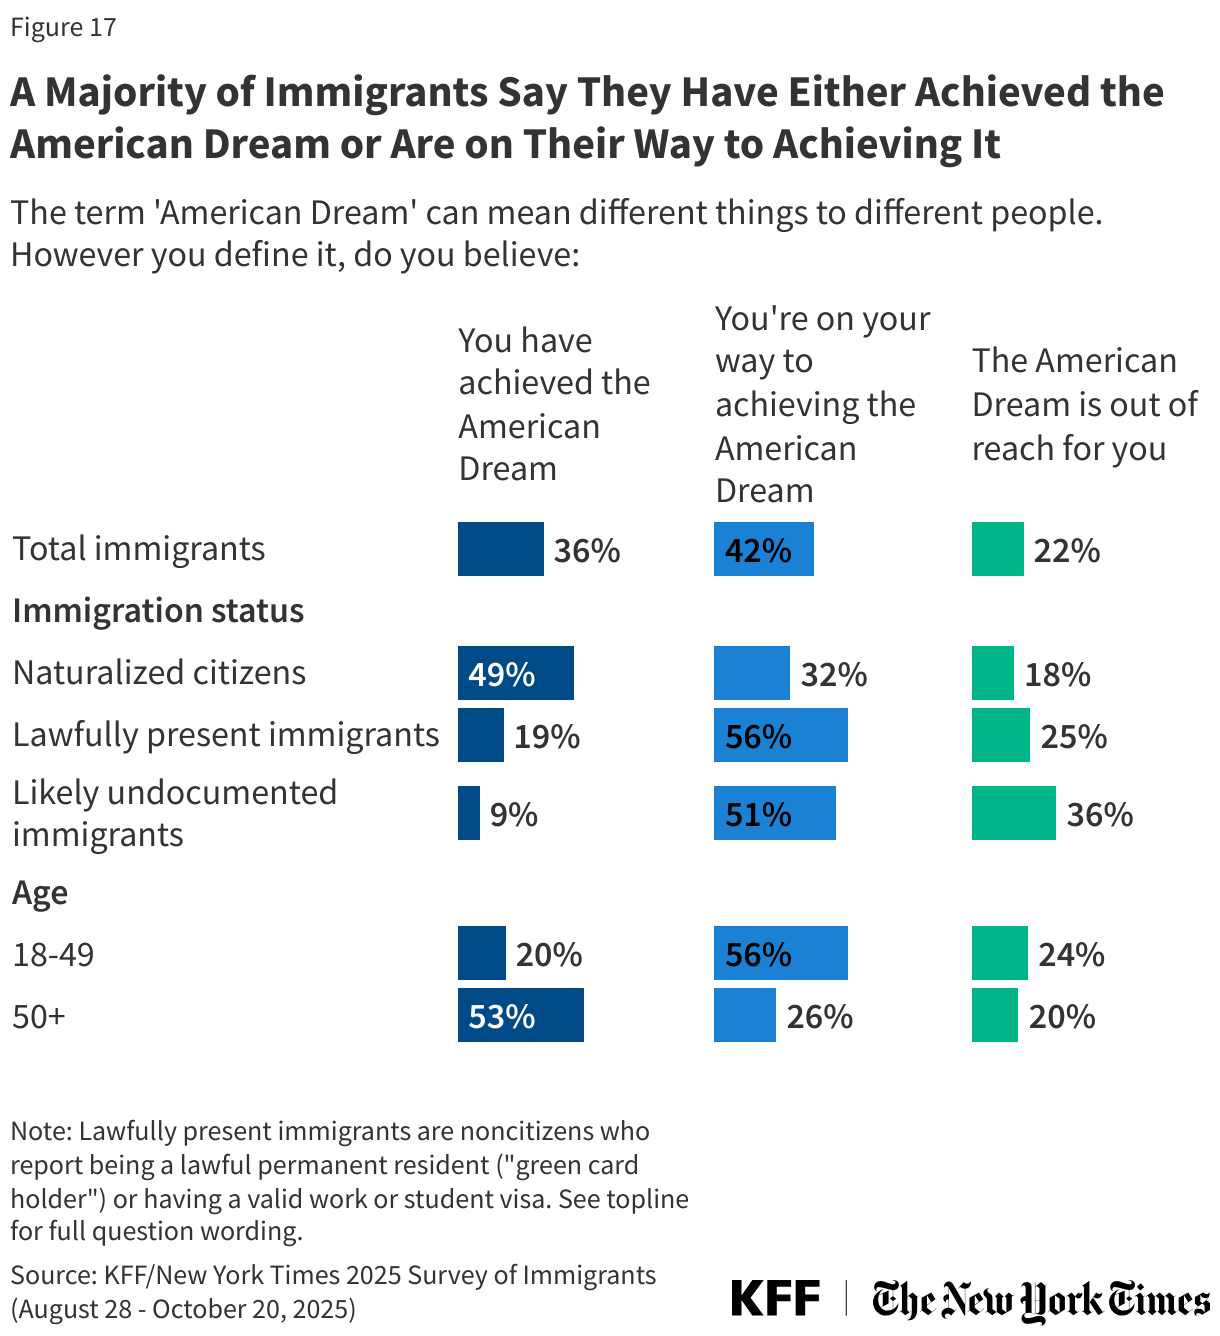
Despite these mixed views on whether the U.S. is a great place for immigrants, a majority of immigrants believe they have either already achieved the “American Dream” (36%) or that they are on their way to achieving it (42%). Half (49%) of naturalized citizens say they have already achieved the American Dream, compared to just one in five (19%) lawfully present immigrants and one in ten (9%) likely undocumented immigrants. Notably, about one-third (36%) of likely undocumented immigrants say the American Dream is completely out of reach for them. Immigrants’ views on the American Dream also vary by age. About half of immigrants ages 50 and older (53%) say they have already achieved the American Dream, compared to about one in five (20%) of immigrants between ages 18 and 49.
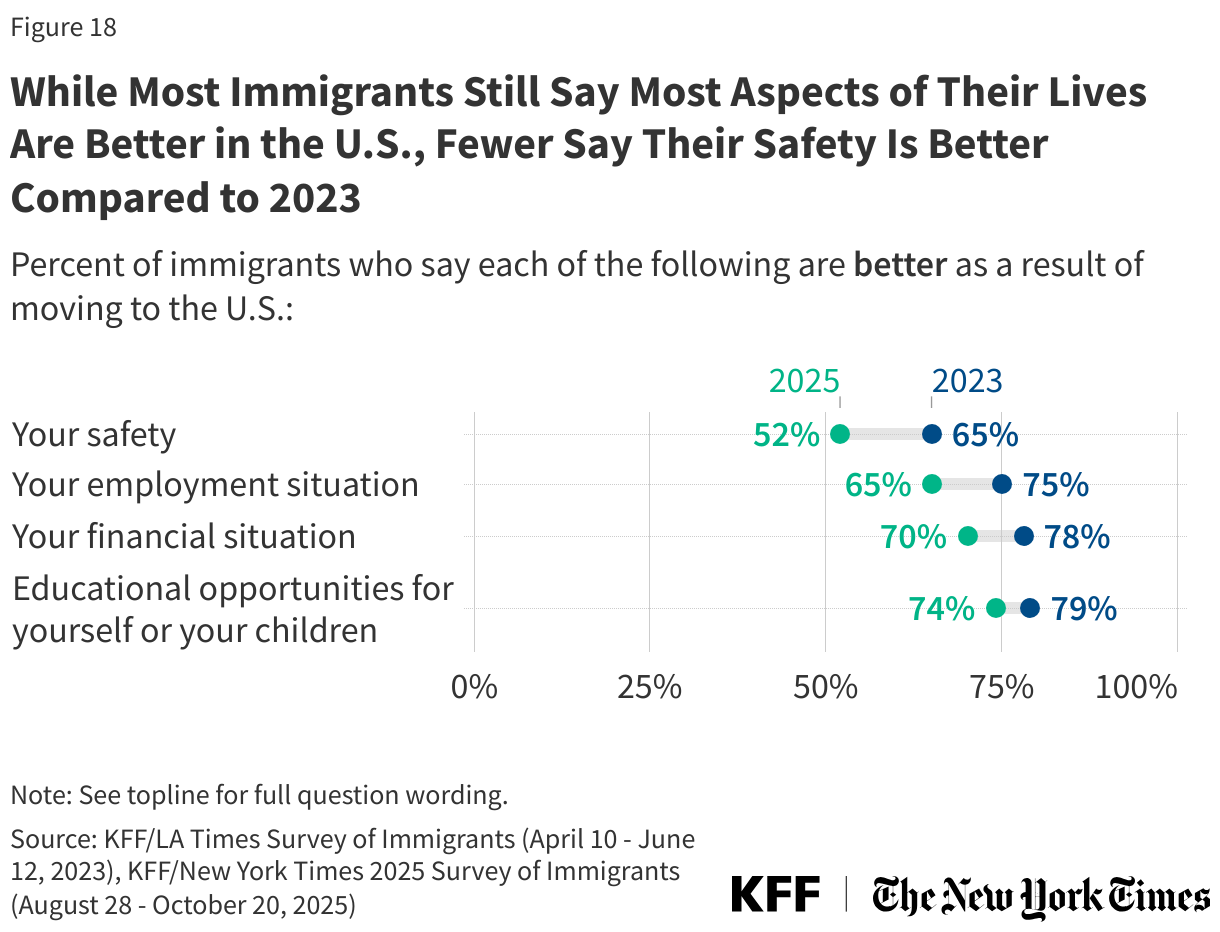
While most immigrants say many aspects of their lives are “better” as a result of moving to the U.S., fewer immigrants now say they feel safer in the U.S. than said so in 2023. About two-thirds or more immigrants say the educational opportunities for themselves or their children (74%), their financial situation (70%), and their employment situation (65%) are better as a result of moving to the U.S. About half (52%) of immigrants overall now say their safety is better as a result of moving to the U.S. compared to about two-thirds who said the same in 2023. This drop in perception of safety has occurred among immigrants across immigration statuses.
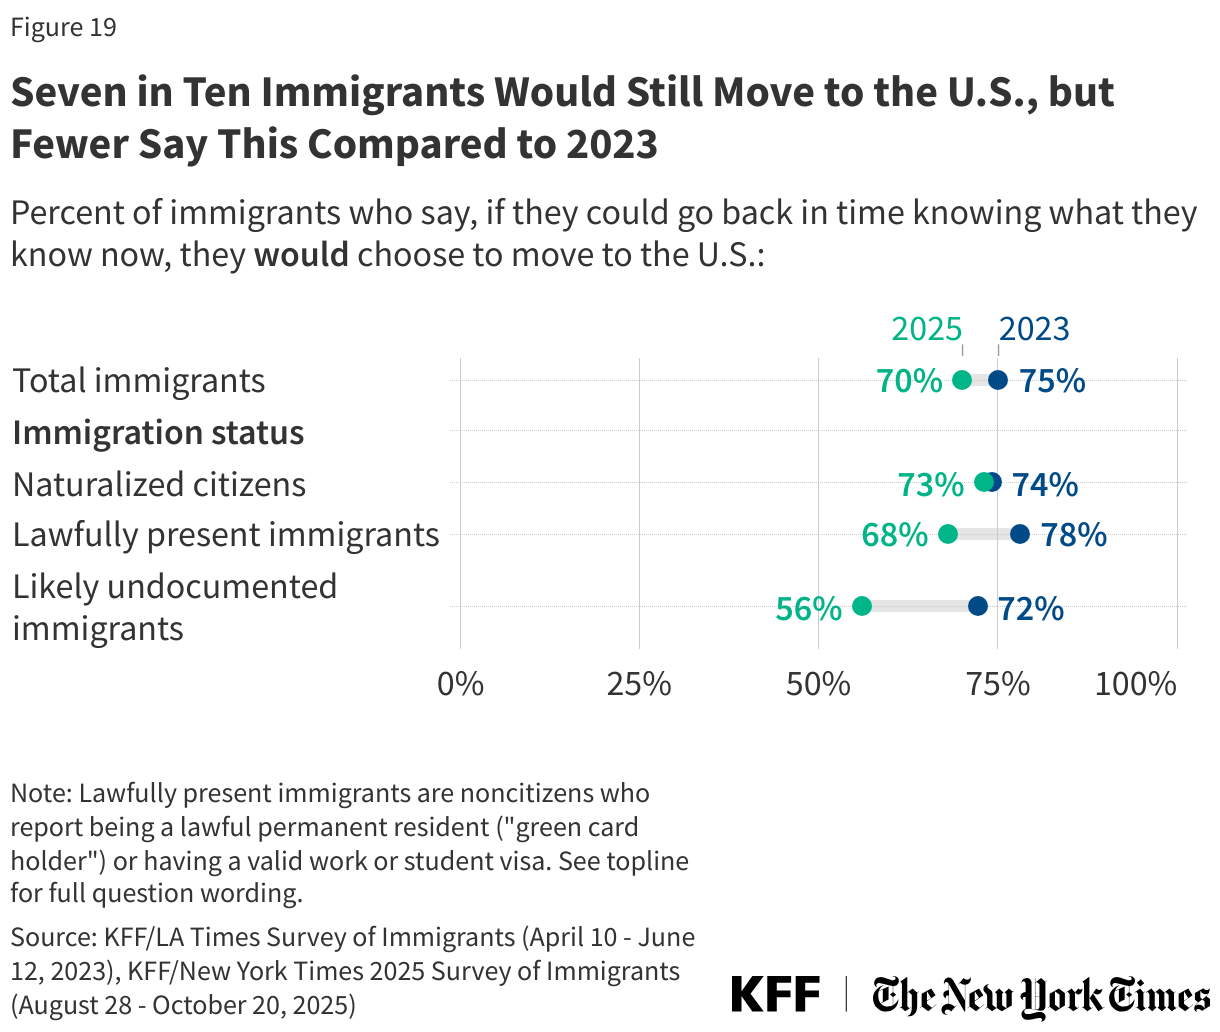
Most immigrants say they would choose to move to the U.S. again if they could go back in time, though fewer noncitizen immigrants say this now than in 2023. When asked what they would do if they could go back in time, knowing what they know now, seven in ten (70%) immigrants say they would still choose to move to the U.S., including majorities across race, ethnicity, and immigration status. One in ten (9%) say they would not choose to move to the U.S. if they could go back in time, and one in five (21%) say they are not sure. While a majority of immigrants say they would still move to the U.S., this share dropped 16 percentage points among likely undocumented immigrants (from 72% to 56%) and 10 percentage points since 2023 among lawfully present immigrants (from 78% to 68%).