5 Key Facts About Medicaid Coverage for People With Intellectual and Developmental Disabilities (I/DD)

Published: Sep 22, 2025

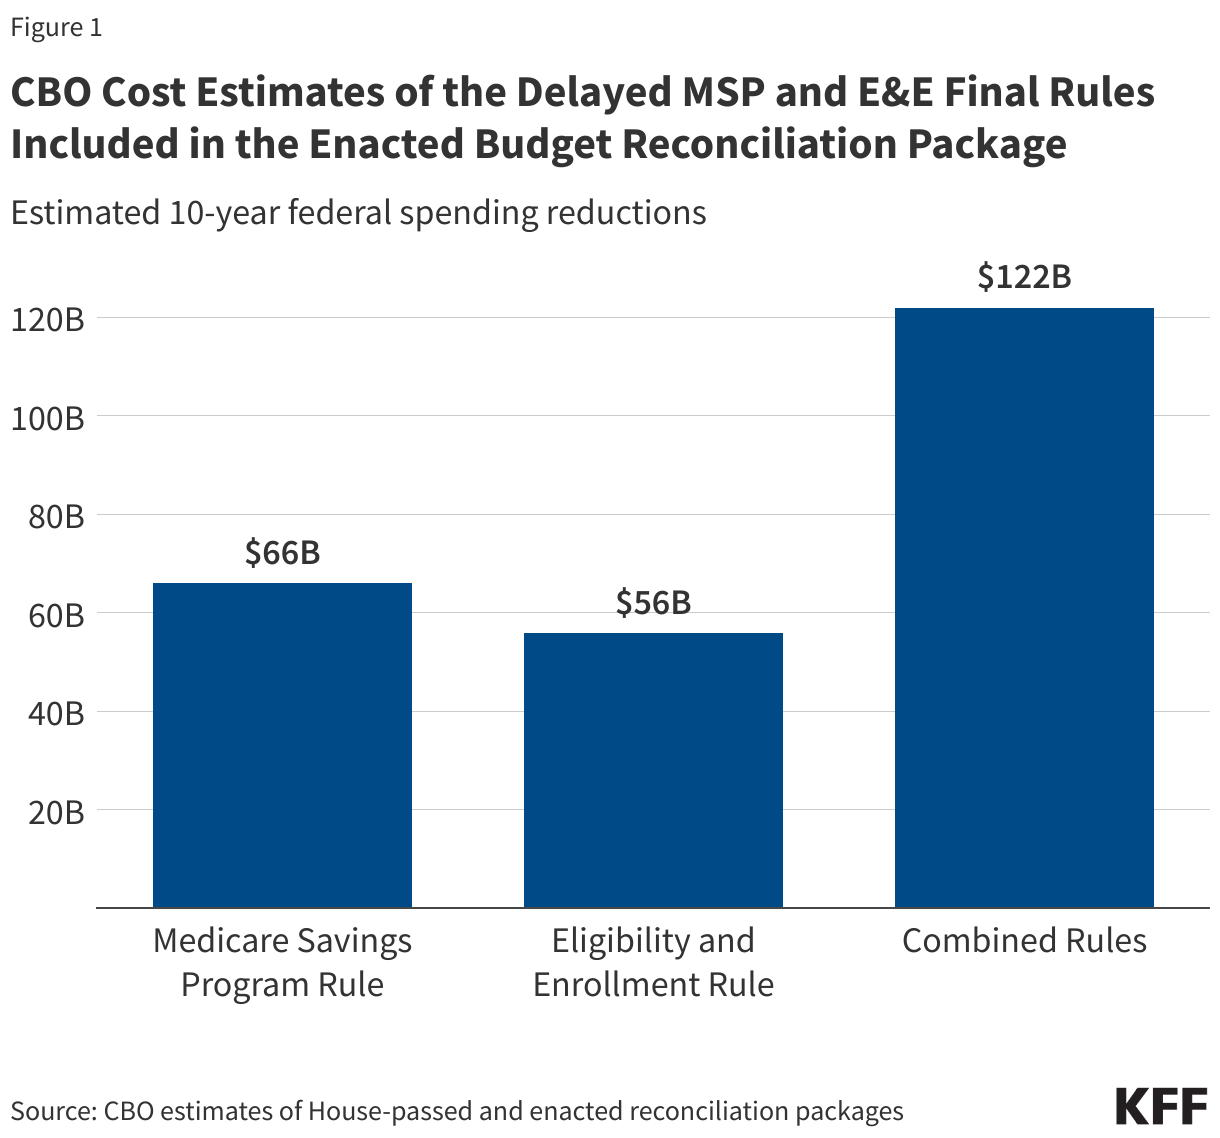
President Trump signed into law a budget reconciliation package that made major reductions in federal health care spending to offset part of the costs of extending expiring tax cuts. The Congressional Budget Office’s (CBO) latest cost estimate shows that the reconciliation package would reduce federal Medicaid spending over a decade by an estimated $911 billion and increase the number of uninsured people by 10 million, with three quarters of the change stemming from cuts to Medicaid. These reductions could have implications for people with intellectual and developmental disabilities (I/DD) as people with I/DD disproportionately rely on Medicaid.

I/DD include various disabilities such as intellectual disabilities, autism, developmental delays, and learning disabilities. These disabilities are usually present at birth or manifest during childhood and affect the trajectory of the individual’s physical, intellectual, and/or emotional development. Loss of Medicaid coverage or benefits poses unique challenges for people with I/DD, many of whom live on fixed incomes, face barriers to employment and accessing private health coverage, and have high health care needs and spending. People with I/DD are distinct from many other populations who need long-term care as they rely on a broad range of services and supports across the lifespan, while most others who use long-term care often develop care needs later in life. These needs can include assistance with activities of daily living (such as bathing and dressing) and instrumental activities of daily living (such as shopping or cooking), employment-related services, positive behavior supports, and supervision when completing tasks.

According to estimates by the National Council on Disability (NCD), there are at least eight million people in the U.S that have I/DD, though that is likely an underestimate. Other estimates of total number of people in the U.S with I/DD range widely, from eight million to sixteen million people. It is difficult to estimate the exact number because there is no current survey that asks a nationally representative population whether they have an I/DD. The estimated prevalence of I/DD is higher among children than among adults in the U.S., with the NCD noting that about 4% of U.S. children and 2% of U.S. adults have an I/DD (though these rates are much lower than the rate of I/DD in the National Health Interview Survey, which are closer to 14% among U.S. children).

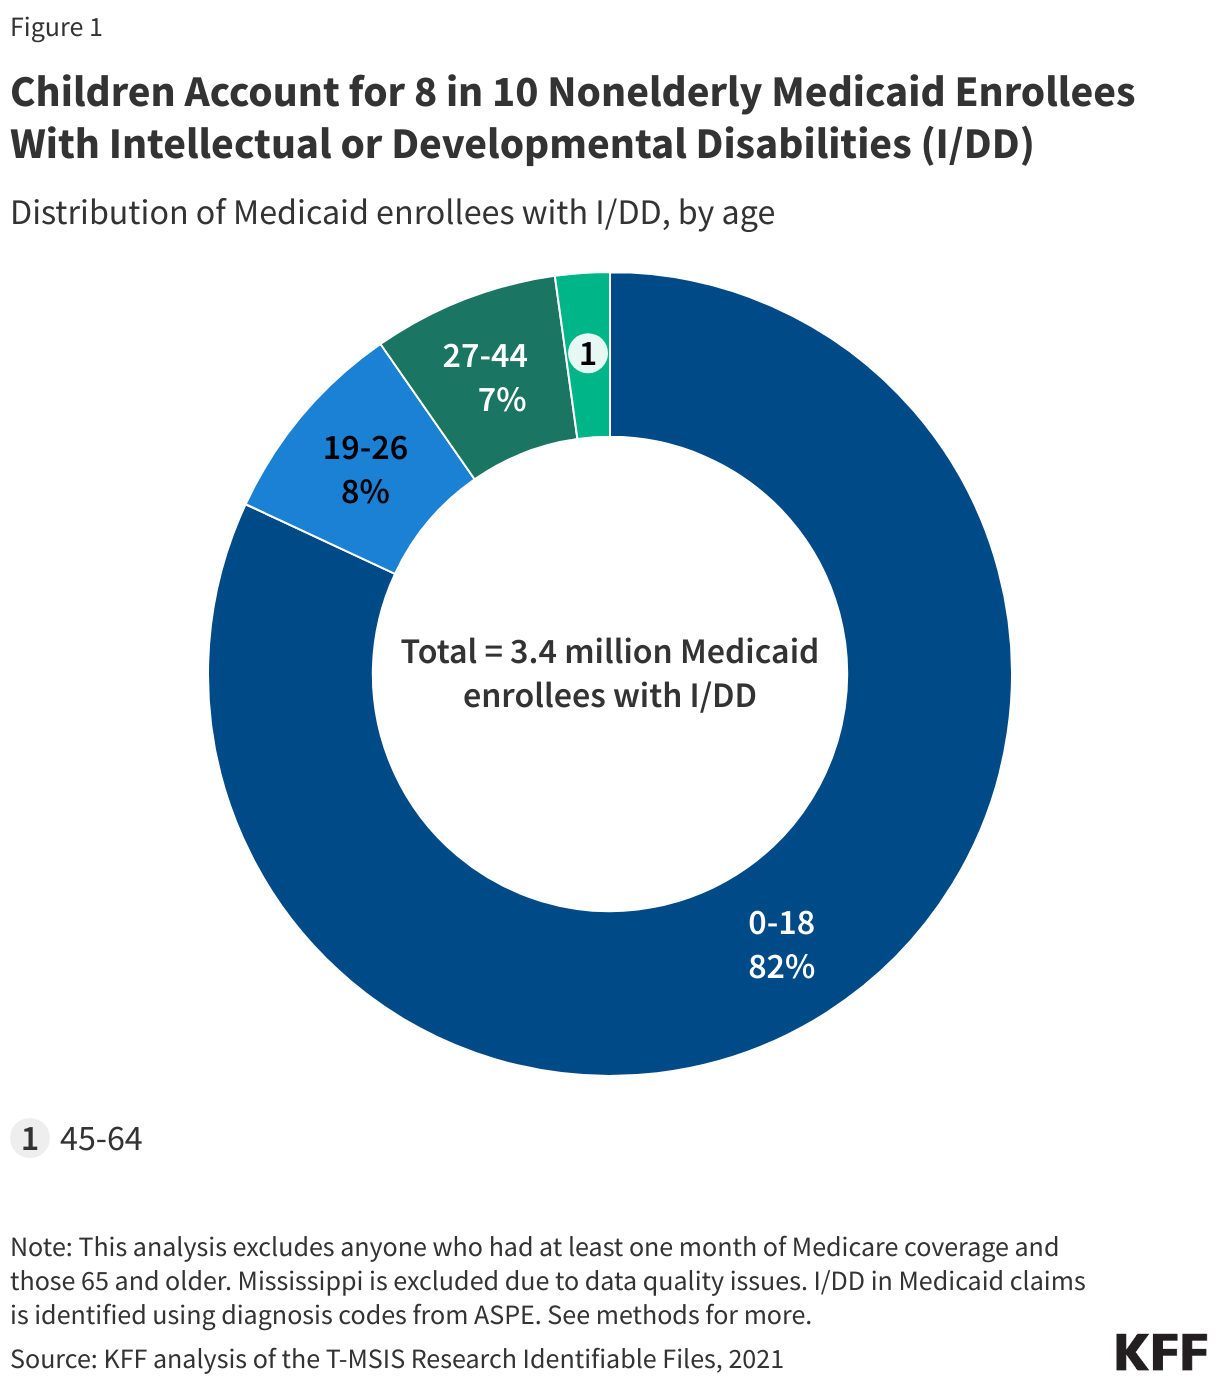
1. Children account for 8 in 10 nonelderly Medicaid enrollees with intellectual or developmental disabilities.

In 2021, there were 3.4 million Medicaid enrollees under age 65 with I/DD, 82% of whom were children under 19 (Figure 1). Medicaid offers additional benefits to children with I/DD beyond what is available to children enrolled in private health insurance and often what is available to adult Medicaid enrollees. This makes Medicaid a key source of coverage for children with I/DD. Under the Early and Periodic Screening, Diagnostic and Treatment (EPSDT), states must provide children with screening for health and developmental problems and with all services needed to diagnose and treat their health conditions, regardless of whether the services are covered for adults or if they are otherwise not covered by the state. States also offer an array of additional optional benefits for people with I/DD through Medicaid waivers, including private duty nursing, specialized therapies, home/vehicle modifications, and more. Those benefits are generally not covered by private insurance.

Interactive DataWrapper Embed

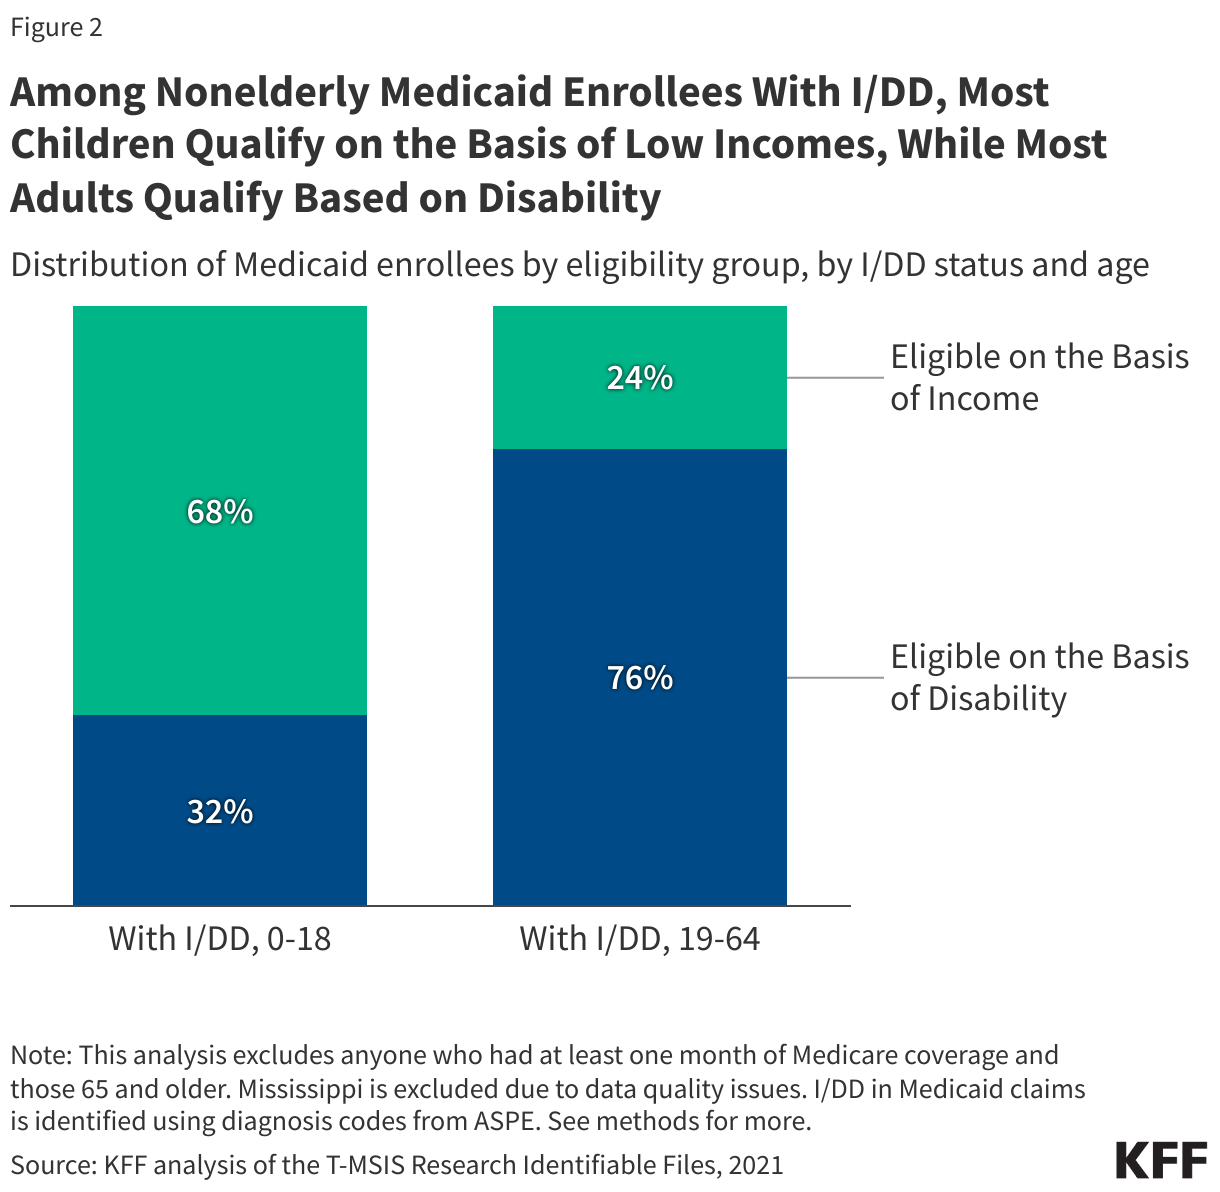
2. Among nonelderly Medicaid enrollees with I/DD, most children qualify on the basis of low incomes, while most adults qualify based on disability.

Over two-thirds (68%) of children with I/DD qualify for Medicaid on the basis of low income alone, compared with fewer than one in four nonelderly adults with I/DD (24%). The remaining 32% of children and 76% of nonelderly adults with I/DD qualify on the basis of disability. Qualifying on the basis of disability requires demonstration of limited income, limited savings, and meeting disability requirements. Beyond requiring additional information from applicants, KFF’s survey of states on their eligibility practices has shown that qualifying on the basis of disability tends to have more cumbersome application and renewal processes. Both children and nonelderly adults with I/DD are more likely to qualify for Medicaid through a disability-related pathway than are children and nonelderly adults without I/DD (among whom only 9% qualify for Medicaid on the basis of disability, data not shown).

Child eligibility remains the highest for all income-based eligibility pathways, with a median eligibility level of 255% FPL, or $67,957 for a family of three. This is a key reason why most children with I/DD are eligible on the basis of income while most adults under age 65 are not. In general, children with disabilities are eligible for all of the pathways available to nonelderly adults with disabilities, though eligibility criteria may differ between children and nonelderly adults and be less restrictive for children. The ACA expansion pathway was created to provide coverage to low-income adults under age 65 without requiring another eligibility factor like disability. This pathway has helped some nonelderly adults with I/DD maintain access to services which are only covered through Medicaid programs, such as long-term care. However, some provisions in the reconciliation package target those enrolled through the ACA expansion, putting this coverage at risk.

Many state Medicaid agencies set their age cut-offs for child pathways between 19 and 21, but children with special health care needs, including I/DD, often need the care that the Medicaid program provides throughout their lifetime. As people transition out of child Medicaid eligibility, they often encounter barriers to maintaining coverage because of the lower adult income eligibility levels. Among those who continue to qualify for Medicaid, they may lose access to benefits that are particularly critical for children with I/DD and only available through the EPSDT benefit (which is only available for people under age 21 in all states). Families of children with special health care needs who are aging out of child benefits report that there is frequently a lack of clear information available to them and that they are often unprepared for the transition. 

Interactive DataWrapper Embed

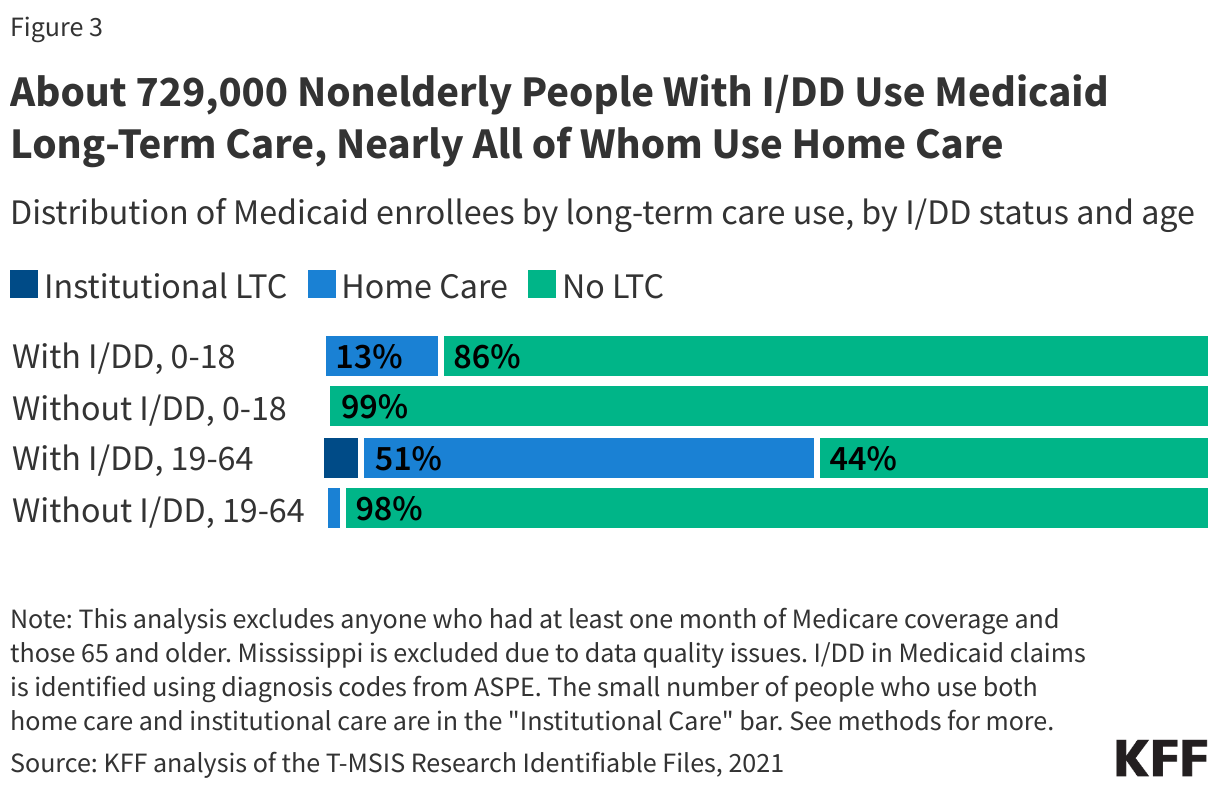
3. About 729,000 nonelderly people with I/DD use Medicaid long-term care, nearly all (700,000) of whom use home care.

Over one in ten child enrollees with I/DD and over half of nonelderly adult enrollees with I/DD use long-term care, nearly all of which is home care. Medicaid is the primary payer for long-term care in the U.S, and most people who use Medicaid long-term care use home care. Medicaid home care can be offered through either the Medicaid state plan or as part of a specialized waiver. Nearly all states (48) provide Medicaid home care through waivers that offer benefits specifically targeted to people with I/DD. These waivers may provide a range of services including supported employment; equipment, technology, and modifications; home-based services; day services; non-medical transportation; round-the-clock-services; personal care services; and home-delivered meals. Some home care waivers for children are age-limited and end after they turn 21 (or younger). While some waivers define transition of care services and transition plans, many do not. Some states may offer similar waivers for adults, though benefits may differ and enrollment may not be guaranteed due to limited availability of waiver slots. In Medicaid home care, many people “self-direct” their services, allowing them to provide payments to family caregivers in some cases. Beyond paying for their caregiving, Medicaid supports family caregivers with services such as training, support groups, and respite care (which is paid care that allows family caregivers to take a break from their normal responsibilities). 

Very few Medicaid enrollees with I/DD use long-term care in institutional settings such as nursing facilities or intermediate care facilities. Nursing facility care is a required Medicaid benefit, in contrast with home care, which is provided at state option. Care at intermediate care facilities (a type of institutional care that is often targeted towards people with I/DD) is also optional for states to provide, but all states offer it. Most people with I/DD using institutional long-term care are in intermediate care facilities (data not shown).

Interactive DataWrapper Embed

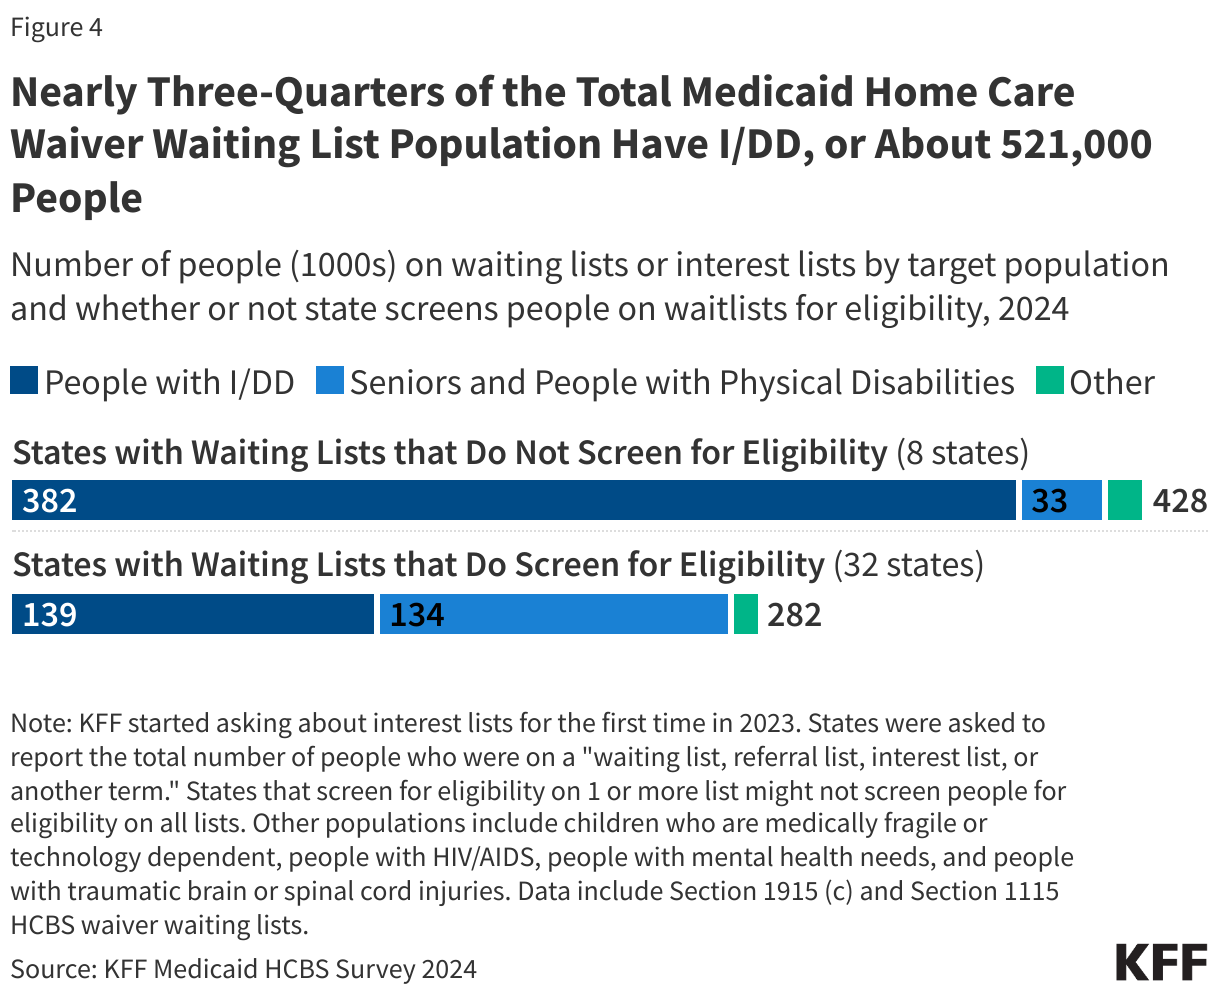
4. Nearly three-quarters of the total Medicaid home care waiver waiting list population have I/DD, or about 521,000 people.

A state’s ability to cap the number of people enrolled in home care waivers can result in waiting lists when the number of people seeking services exceeds the number of waiver slots available. Waiting lists provide an indication of people who may need services they are not receiving, but they are an incomplete measure of unmet need because they don’t include people with unmet needs in states that do not cover the applicable services (and therefore, have no waiting list) or people who are in the waiver but not receiving services because there are too few providers available. Waiting lists reflect the populations a state chooses to serve, the services it decides to provide, the resources it commits, and the availability of workers to provide services. People with I/DD comprise almost three-quarters (73%) of the total home care waiver waiting list population, and reflect a higher share of people in states that do not screen for waiver eligibility before placing someone on a waiting list (89% in in the eight states that do not screen for eligibility and 49% in the 32 states that do screen for eligibility).

Interactive DataWrapper Embed

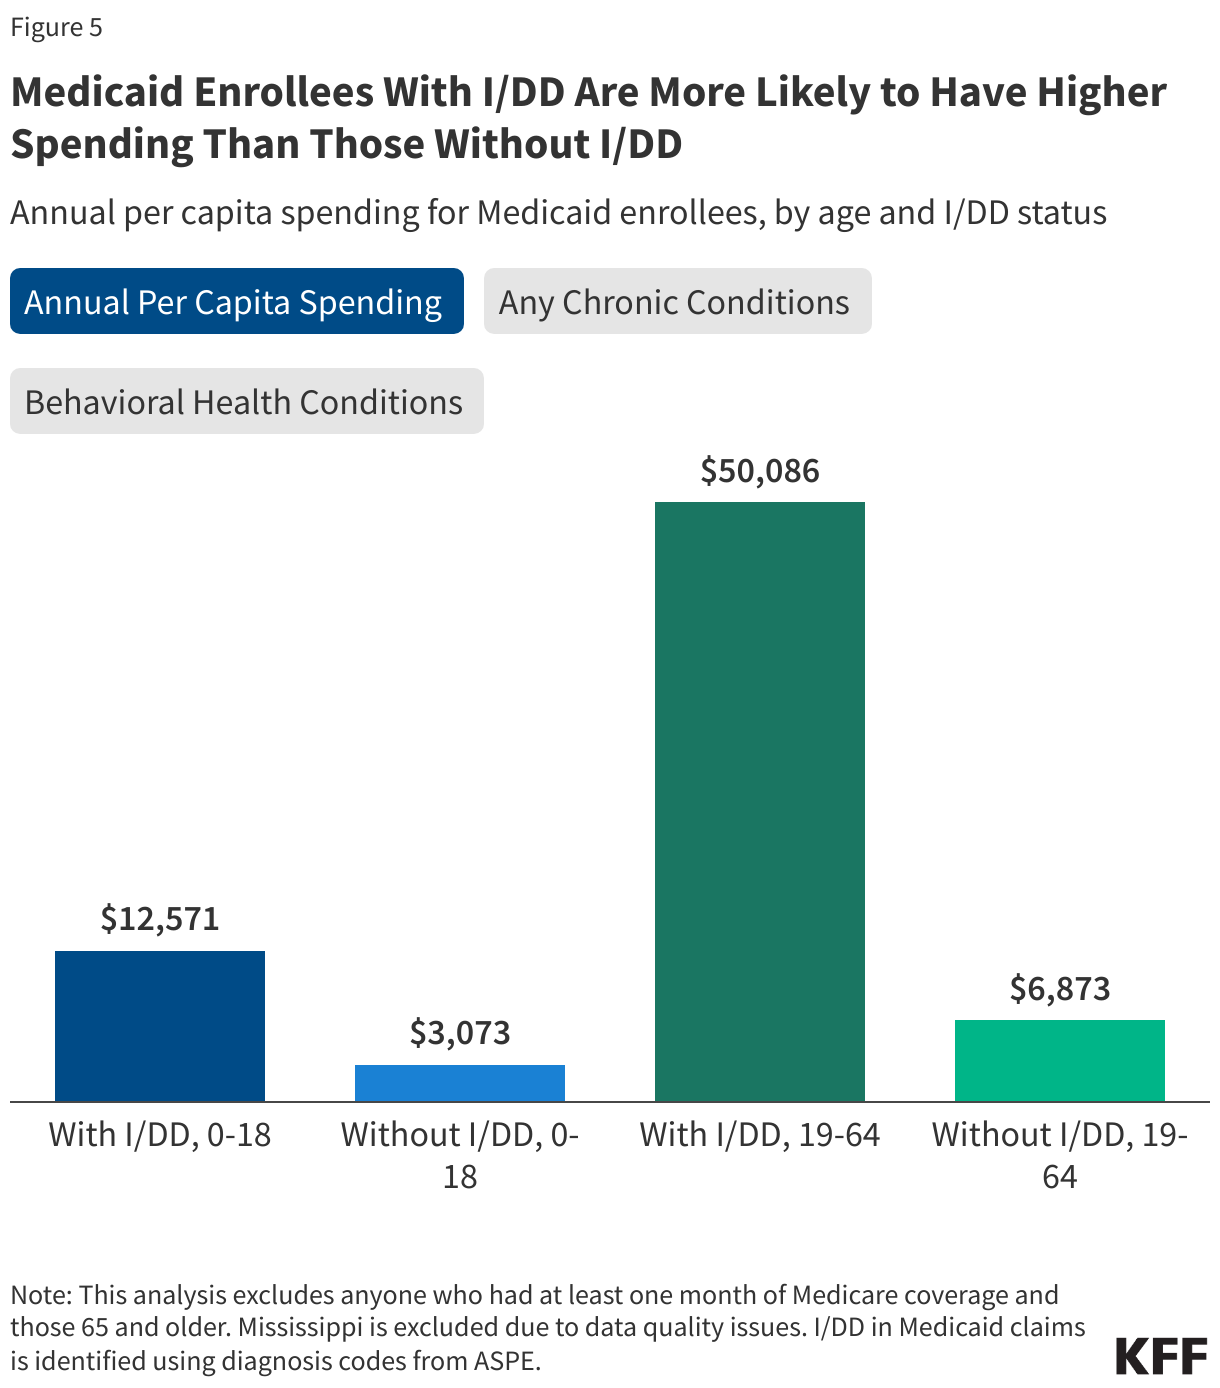
5. Medicaid enrollees with I/DD incur higher Medicaid costs and have higher rates of chronic conditions than those without I/DD.

Medicaid spending for people with I/DD is disproportionately high. Among Medicaid enrollees under 19, Medicaid spends, on average, about four times more annually on those with I/DD when compared to those without I/DD ($12,571 vs $3,073). Similarly, among Medicaid enrollees 19-64 years old, those with I/DD have spending seven times higher than those without I/DD ($50,086 vs. $6,873). With an unprecedented reduction in federal Medicaid spending, states will face pressure to reduce Medicaid costs and may look at approaches to reduce spending among high-cost populations, such as those with I/DD. States may also face pressure to restrict eligibility criteria for optional eligibility groups or reduce coverage of optional benefits such as home care, both of which could disproportionately affect people with I/DD.

The higher spending among those with I/DD reflects both greater use of long-term care and overall, more health care use on account of other chronic conditions. Medicaid enrollees under 12 with I/DD are nearly twice as likely to have another chronic condition as those without I/DD (19% vs. 11%) (Figure 5). Similarly, those ages 12-18 with I/DD are also more likely to have chronic conditions than those without I/DD (51% vs. 29%). This group is also over twice as likely to be diagnosed with a behavioral health condition, such as those related to mental health and substance use disorders (37% vs 17%).Enrollees ages 19-64 with I/DD are also more likely to have a chronic condition as those without I/DD (67% vs. 42%); twice as likely to be diagnosed with a behavioral health condition (46% vs. 23%); and twelve times as likely to be diagnosed with a physical health condition (24% vs 2%) (data not shown).

Interactive DataWrapper Embed

Methods

Data Sources: This analysis uses two different data sources:

  • Figure 1-3, 5: These figures use 2021 T-MSIS Research Identifiable Files including the inpatient (IP), long-term care (LT), and other services (OT) claims files merged with the demographic-eligibility (DE) files from the Chronic Condition Warehouse (CCW).
  • Figure 4: This figure uses data from KFF’s 2024 HCBS Survey. See KFF’s brief on waiting lists for more information on these data.

Identifying I/DD in Medicaid Claims Data: I/DD diagnoses were identified using a list of ICD-9 and ICD-10 diagnosis codes provided by the Assistant Secretary for Planning and Evaluation (ASPE). This list of codes categorizes I/DD conditions under six groups: intellectual disabilities, developmental delays/disabilities, learning disabilities, autism spectrum disorders, cerebral palsy, and spina bifida. A complete list of diagnosis codes and categorizations that were used for this analysis are available upon request. For more information on the ASPE methods, please reference their report.

Enrollee Inclusion Criteria in Medicaid Claims Data:  All T-MSIS figures exclude enrollees 65 and older and those who had at least one month of Medicare coverage. These enrollees were excluded from these calculations since they may not have had sufficient claims in T-MSIS to accurately identify chronic conditions such as I/DD.  

Identifying Medicaid Long-Term Care Use (Figure 3): KFF categorized claims using the type-of-service code from the first line claim, which was applied to the header claim in a merged dataset. KFF included all people with at least one month of Medicaid enrollment who were using the following types of long-term care: institutional care (care provided in a nursing facility or intermediate care facility) and home care (home health, personal care, 1915(c) waiver, 1115 waiver, and “other” home care).The small number of people using both types of long-term care were included in “institutional care”. For more information, see KFF’s brief on the number of people using Medicaid long-term care.

Defining Chronic Conditions in Medicaid Claims Data (Figure 5): This analysis used the CCW algorithm for identifying chronic conditions (updated in 2020), excluding its definition for mental illness, which was pulled from a different source. This analysis also included in its definition of chronic conditions substance use disorder, mental illness, obesity, HIV, and hepatitis C. For enrollees ages 0-11, behavioral health conditions (specifically, substance use disorder and mental illness) are not included as these codes have not been validated for children by the algorithm used to create the diagnosis flags.


The Impact of H.R. 1 on Two Medicaid Eligibility Rules

Published: Sep 22, 2025

On July 4, 2025, President Trump signed into law the 2025 budget reconciliation bill, formerly known as the One Big Beautiful Bill Act, that makes significant changes to Medicaid eligibility and financing. The Congressional Budget Office estimates the law will cut federal Medicaid spending by $911 billion over 10 years and will increase the number of people who are uninsured by 10 million in 2034.

One source of the law’s Medicaid cuts is a 10-year moratorium on implementation or enforcement of provisions in two rules finalized by the Biden administration that would have reduced administrative burdens to make it easier for people to enroll in and maintain Medicaid and CHIP coverage (See Box 1). In effect, the law delays or pauses implementation of many provisions in the two rules until October 2034. To ease the administrative burden on states, the implementation dates for the changes in the rules spanned a three-year period, with some provisions taking effect in 2024 or 2025 and others with implementation dates in 2026 and 2027. Some provisions are excluded from the 10-year delay, including those that have already taken effect.

Box 1: Medicaid Eligibility Rules

The Medicare Savings Program (MSP) rule , finalized in September 2023, aims to reduce barriers to enrollment of Medicare beneficiaries with low incomes in the Medicare Savings Programs (MSPs), through which Medicaid pays Medicare premiums, and in most cases, cost sharing. Among other changes, the rule requires states to automatically enroll Medicare beneficiaries with Supplemental Security Income (SSI) into the MSPs and more closely aligns the MSP application to the application for Medicare’s Part D prescription drug Low-Income Subsidy (LIS). 

The second rule, the Eligibility and Enrollment (E&E) rule, was finalized in April 2024 and seeks to more broadly streamline application, enrollment, and renewal processes in Medicaid. It requires states to simplify eligibility and reduce barriers to enrollment for certain individuals, aligns renewal policies for individuals who qualify on the basis of modified adjusted gross income (MAGI) and those who qualify on the basis of being age 65 or older or having a disability (referred to as non-MAGI groups), facilitates transitions between Medicaid, separate Children’s Health Insurance Programs (CHIP) and the Basic Health Plan (BHP), and reduces barriers to children’s coverage in CHIP.

While the provisions in the final rules involve numerous technical changes to eligibility, enrollment, and renewal policies, collectively, they aim to streamline complex processes that make it difficult for individuals to enroll in Medicaid and CHIP coverage and maintain that coverage, and, therefore, would increase projected enrollment over time. The delay in implementing provisions in these final rules along with other provisions in the law, such as new work and reporting requirements and more frequent eligibility determinations for individuals enrolled in the Affordable Care Act’s (ACA) Medicaid expansion, will increase administrative barriers (or red tape) to Medicaid and CHIP that are projected to result in fewer people enrolling in coverage and many people losing coverage. While some of the people who lose coverage from these changes are no longer eligible, it is expected that most of the projected enrollment declines will be among people who are eligible.

While the law prohibits the Secretary of the Department of Health and Human Services (HHS) from implementing or enforcing provisions subject to the delay until October 1, 2034, it does not prohibit states from implementing the changes. In some cases, states have already made the changes required by the rules, either in anticipation of implementation of the new requirements or as part of other efforts to streamline or simplify processes. Whether states maintain or rollback the changes they are no longer required to keep in place will influence how much the budget reconciliation law’s delay affects Medicaid coverage and federal spending.

This issue brief describes the impact of delaying key provisions from those rules on federal Medicaid spending and coverage; and identifies which provisions across both rules are not delayed and which are. Where available, it also indicates how many states have already implemented provisions that are now delayed. 

Estimated Impact on Federal Medicaid Spending and Coverage

The Congressional Budget Office (CBO) estimates that delaying certain provisions in the two rules will reduce federal spending by $122 billion over ten years and increase the number of people without health insurance by 400,000 in 2034. Delaying provisions is projected to save the federal government $66 billion from the MSP rule and $56 billion from the E&E rule over ten years. These combined reductions in federal spending represent about 12% of the total reductions in federal Medicaid spending from the law. CBO estimates that the delayed provisions will increase the number of people without health insurance by 400,000 in the year 2034, but the impact on the number of people enrolled in Medicaid will be higher. Some Medicare beneficiaries who are eligible for MSP and would have enrolled in Medicaid because of provisions in the MSP rule will not enroll in Medicaid. However, these individuals will retain their Medicare coverage and will not become uninsured. Although CBO did not provide a detailed analysis of the impact on Medicaid enrollment, an earlier analysis of the House-passed version of the bill showed that 1.3 million fewer “dual eligible individuals” (people who are enrolled in both Medicaid and Medicare) would be enrolled in Medicaid in 2034. Because of differences in the version of the bill passed by the House and the final enacted law, the drop in the number of dual eligible individuals may be lower.

CBO Cost Estimates of the Delayed MSP and E&E Final Rules Included in the Enacted Budget Reconciliation Package

Medicare Savings Program Rule 

Changes to Implementation of Provisions in the Medicare Savings Program Final Rule Included in the 2025 Tax and Spending Budget Reconciliation Law

Provisions That are not Delayed

The only provision in the MSP rule that is not delayed took effect October 1, 2024 and requires all states to automatically enroll Supplemental Security Income (SSI) recipients into the Qualified Medicare Beneficiary (QMB) Medicare Savings Program (MSP) (Table 1). SSI provides monthly payments to older adults and people with disabilities who are unable to work and have limited income and resources. The Medicare Savings Programs provide Medicaid coverage of Medicare premiums, and in most cases, cost sharing to low-income Medicare beneficiaries. The QMB program is one of the four types of Medicare Savings Programs, and pays for Part A and B premiums, deductibles, coinsurance, and copayments. Medicare beneficiaries are eligible for the QMB program if their monthly income is below the FPL ($1,304 per month for an individual and $1,763 per month for a couple in 2025) and if their assets are below the resource limit ($9,660 for individuals and $14,470 for couples in 2025). 

The rule notes that because the income and resource eligibility criteria for the QMB group exceeds those for SSI, individuals who qualify for SSI will always meet the requirements for QMB eligibility. The automatic enrollment of SSI recipients into the QMB program increases enrollment among eligible people by allowing them to avoid the administrative burden of separate eligibility processes. 

Provisions That are Delayed

The law delays several provisions that would facilitate MSP enrollment using the Medicare Part D Low-Income Subsidy (LIS) data. The Medicare Part D Low-Income Subsidy (LIS) is a program that helps Medicare beneficiaries pay for prescription drugs. To increase participation in LIS, people who enroll in an MSP are automatically enrolled in LIS, but not all people in LIS are automatically enrolled in an MSP. The Medicare Improvements for Patients and Providers Act of 2008 requires the Social Security Administration (SSA) to send LIS applications to states and for states to treat those data (e.g., “LIS data”) as an application for the MSPs, but not all states do so.

The rule strengthens the requirement for states to treat LIS data as an application for the MSPs by establishing clear steps for states to take upon receiving the data from the SSA and prohibiting states from requiring a separate application for MSP. The rule also requires states to provide LIS applicants with information about the availability of full Medicaid benefits and the opportunity to apply for those benefits.

The law delays provisions that encourage states to use the Medicare Part D LIS definitions of financial eligibility. A barrier for states in using LIS data to initiate an application to the MSPs is that the two programs have different methods for measuring income and financial resources. For example, the MSPs include certain types of income and assets that are excluded from the LIS definition and that can be cumbersome for applicants to document. States also often use different definitions of family size when calculating income eligibility for MSP purposes than those used for LIS eligibility. 

The rule encourages states to align LIS and MSP eligibility criteria by requiring states to use the LIS definition of family size (unless the state definition is more generous) and by creating incentives for states to adopt the definitions of financial eligibility used in the LIS program. States that elect to keep their methods for defining financial eligibility rather than using the LIS criteria, will be required to accept applicants’ self-reported information for any income and assets that are not included with the LIS application. States must enroll in the MSP all applicants whose self-reported financial information meets state eligibility criteria unless they have data that are incompatible with the self-reported information. When states require additional information from applicants, they will be required to take a more active role in helping applicants find the information, such as contacting financial or fiduciary institutions on behalf of applicants.

The law pauses a provision that requires Qualified Medicare Beneficiary (QMB) coverage to begin earlier for certain Medicare beneficiaries who do not qualify for free Part A premiums through their own earnings or those of a spouse, parent, or child, and must pay the Medicare Part A premium. Currently, some people who do not qualify for premium-free Part A may have to pay the premium out-of-pocket before QMB coverage begins and may be unable to qualify for QMB coverage if they are unable to afford the premium (ranging from $285 or $518 per month in 2025 depending on people’s work history). This occurs for people who did not enroll in Part A when they first became eligible for Medicare and live in states that do not have a “buy-in” agreement with the federal government. A “buy-in” agreement allows states to enroll eligible people directly into Medicare on a year-round basis and pay their monthly premiums. In states without such agreements, people may only enroll in Part A during the annual general enrollment period between January 1 and March 31. Under the rule, states will be required to start QMB coverage and payment of Part A premiums for eligible applicants after the SSA receives a conditional application for Part A, so applicants will not have to pay premiums prior to gaining coverage. 

Medicaid, CHIP, and Basic Health Plan Eligibility and Enrollment Rule 

Changes to the Implementation of Certain Provisions in the Medicaid and CHIP Eligibility and Enrollment Final Rule Included in the 2025 Tax and Spending Budget Reconciliation Law

Provisions That are not Delayed

The rule eliminates barriers to CHIP coverage for children, including lockout periods for nonpayment of premiums, waiting periods, and annual or lifetime limits on coverage, effective June 2025. Prior to the rule, states had the option to lock children out of coverage in separate CHIP programs for nonpayment of premiums by preventing reenrollment for a specific period. States were also allowed to impose waiting periods in separate CHIP programs that required children to be uninsured for a certain period of time, usually 90 days, before enrolling in CHIP coverage, and could impose annual and lifetime dollar limits on CHIP benefits. The rule prohibits coverage lockout periods for nonpayment of premiums, waiting periods, and any dollar limits on CHIP benefits.

The rule also seeks to improve transitions between Medicaid and separate CHIP programs to reduce gaps in coverage for children. Without coordination between Medicaid and CHIP programs, children whose family income or circumstances change and must transition from one program to another are at risk of experiencing delays in enrollment in the other program or gaps in coverage during the transition. As of June 2024, Medicaid and CHIP agencies are required to accept eligibility determinations from the other program and provide a joint eligibility notice to reduce confusion for families whose children are moving from one program to the other. 

Another enrollment simplification policy in the rule that has taken effect is ending the requirement that applicants apply for other benefits as a condition of Medicaid eligibility. Under previous policy, states were required to evaluate individuals’ available income and resources for other benefits they may qualify for, such as annuities or pensions before determining eligibility for Medicaid. The rule removes the requirement for enrollees/applicants to apply for other benefits that do not impact an individual’s eligibility for Medicaid or CHIP. The rule redefines available income and resources to only include resources the individual is in immediate control of. 

The rule also reduces burdens for applicants by limiting requests for documentation to verify assets. When determining Medicaid eligibility, states are required to check available data sources for income information and must apply a reasonable compatibility standard, which specifies the acceptable level of variance between an individual’s self-reported income and the income information returned from available data sources before requesting additional documentation from an individual. While these rules apply to income verification, the requirements for verifying assets were less clear. The rule clarifies that states must use available data sources to verify assets for applicants subject to an asset test, which includes most people who apply on the basis of age or disability. States must also apply a reasonable compatibility standard when verifying assets. If asset information provided by an individual is reasonably compatible with information returned through an asset verification system, the state may not request further documentation from the individual. 

The rule allows states to permit applicants for medically needy coverage to prospectively deduct new types of medical expenses. People may qualify through a medically needy pathway if their income is higher than permitted under a different pathway but lower than the medically needy limit, or if they “spend down” to the medically needy limit by deducting health care expenses from their income. Previously, individuals applying through the medically needy pathway could only prospectively deduct medical expenses for institutional care. The rule allows individuals who are not in institutional settings to deduct prospective medical expenses, such as home care and prescription drugs, when applying for Medicaid coverage through the medically needy pathway.

To enhance program integrity, the rule updates requirements for how and how long states must maintain case records. Outdated regulations that do not specify what information from case records state must maintain have led to inconsistencies in recordkeeping across states and have contributed procedural payment errors captured in CMS’ annual Payment Error Rate Measure (PERM) rates because of insufficient documentation. The rule specifies that states must maintain records for all eligibility determinations in an electronic format, clarifies what information must be contained in the records, and requires that records be kept for a minimum of three years. These provisions take effect in June 2027 and were the only provisions in the rule that were not subject to the delay in implementation even though they had not yet been implemented.

Provisions Subject to the Moratorium on Implementation

The law pauses implementation of provisions that align renewal policies for individuals eligible through MAGI and non-MAGI pathways. The ACA created consistent, streamlined application and renewal policies for individuals who qualify for Medicaid based on modified adjusted gross income (“MAGI”); however, these policies were not extended to “non-MAGI” enrollees who qualify for Medicaid based on old age or disability. The rule requires states to extend the streamlined MAGI procedures to non-MAGI individuals. These include eliminating in-person interviews as part of eligibility determinations, requiring states to renew coverage no more frequently than every 12 months, requiring that non-MAGI applications and forms be accepted through the same modalities as MAGI applications and forms, and requiring states to send pre-populated renewal forms to non-MAGI enrollees whose ongoing eligibility cannot be confirmed through available data sources. As of January 2025, all states have stopped in person interviews, 47 states offer applications and forms to non-MAGI applicants in all the same modalities as forms sent to MAGI applicants, and 37 states send pre-populated renewal forms to non-MAGI enrollees. 

Provisions to clarify state and enrollee requirements when changes in enrollee circumstances occur were also paused. States are required to redetermine eligibility when reported or identified changes in circumstances may affect an individual’s eligibility. If information is needed from the individual to complete a redetermination, states are required to give enrollees a minimum of 10 days to respond to these requests. Unlike individuals who lose coverage at their regularly scheduled renewal, individuals disenrolled for failure to provide additional information relating to a change in circumstance are not given a 90-day reconsideration period during which they can submit information confirming ongoing eligibility and have their coverage reinstated.

The rule updates and clarifies steps states must take in responding to changes in circumstances. It specifies that if a state identifies a change in circumstance that may affect an enrollee’s eligibility, the state must first attempt to verify the change with available data. If there is not sufficient data to verify the change, the state must contact the enrollee and request additional information and must provide the enrollee with at least 30 calendar days to respond to the request. The rule also requires states to provide a 90-day reconsideration period if an enrollee is disenrolled for failure to provide the requested information. As of January 2025, 7 of the 15 states that conduct periodic data checks to identify changes in circumstances already provide at least 30 calendar days for enrollees to respond to requests for additional information. 

The law delays implementation of updates to state performance and timeliness standards for eligibility determinations at application that apply these standards to eligibility redeterminations at renewal and following changes in circumstances. Current rules require states to develop performance and timeliness standards for determining eligibility at application. States are required to complete eligibility determinations at application within 90 days for people applying on the basis of disability and 45 days for all other applicants. The rule extends the performance and timeliness standards to eligibility redeterminations at regularly scheduled renewals and following identification of changes in circumstances.

Other provisions that are delayed include more efficient data matching, required state processes to respond to returned mail, and clarification of continued benefits during renewal periods. The rule simplifies eligibility verification by allowing for verification of citizenship with a State vital statistics agency or DHS SAVE to be considered evidence of citizenship that does not require additional documentation. When a state receives returned mail with no forwarding address, the rule establishes a three-step process where the state must check reliable sources for updated address information; if updated information is unavailable, take additional steps to confirm the enrollee’s address using modalities other than mail; and if unable to contact the enrollee, move the enrollee to a fee-for-service delivery system, suspend coverage, or terminate coverage. The rule clarifies that states must provide continued enrollment and benefits to enrollees during a review if the state fails to make a timely eligibility redetermination.

State and Federal Reproductive Rights and Abortion Litigation Tracker

Last updated on

The Supreme Court’s Dobbs ruling, overturning Roe v. Wade, returned the decision to restrict or protect abortion to states. In many states, abortion providers and advocates are challenging state abortion bans contending that the bans violate the state constitution or another state law. The state litigation tracker presents up-to-date information on the ongoing litigation challenging state abortion policy.

In addition, since the Dobbs decision, new questions have arisen regarding the intersection of federal and state authority when it impacts access to abortion and contraception. Litigation has been brought in federal court to resolve some of these questions. The federal litigation tracker presents up-to-date information on the litigation in federal courts that involves access to contraception and abortion.

Litigation Involving Reproductive Health and Rights in the Federal Courts, as of February 15, 2023

Part-Time Workers Have Less Access to Employer-Based Coverage Than Full-Time Workers 

Key Characteristics of the Part-Time Workforce

Published: Sep 19, 2025

Overview

Employer-sponsored health insurance (ESI) is the primary source of health coverage for working non-elderly adults, but adults working part time (fewer than 35 hours per week) have less access to these benefits than their full-time counterparts. Among non-elderly adults employed by public or private employers (excluding the self-employed), 18.5 million, or 14% of adult workers, work part time. This report examines the characteristics of part-time workers and their access to employer-sponsored health benefits.  

Part-time workers—particularly those living in households without a full-time worker—are less likely to be offered health coverage and less likely to be enrolled in an employer plan, either through their own employer or as a dependent on someone else’s plan. Part-time workers who do not have employer coverage may be eligible for Medicaid or for subsidized coverage in the Affordable Care Act (ACA) Marketplaces. However, recent cuts in these coverage programs included in the Republican tax and spending law, as well as the potential expiration of enhanced Marketplace tax credits, will make it harder for individuals who may not have access to an affordable, job-based plan to find coverage. 

Who are Part-Time Workers? 

Workers cite a wide range of reasons for usually working part-time. Some of the most common include enrollment in school or a training program (30%); family or personal obligations, including childcare obligations (26%); and having a job where full-time work is less than 35 hours per week (19%). Smaller shares report working part time because they are unable to find full-time work (7%) or due to illness, health, or medical limitations (4%).  

Generally, part-time workers can be broken into two categories: those working part time for economic reasons (such as inability to find work or seasonal declines in demand), and those working part time for non-economic reasons (such as medical limitations, childcare responsibilities, family or personal obligations, retirement, or jobs where full-time work is less than 35 hours per week). For this analysis, workers enrolled in school or training programs are treated as a separate category due to their large share of the part time workforce. The analysis focuses on non-elderly adult workers who usually work part time; it excludes full-time workers who happened to be working part time at the time of the survey. 

On average, part-time workers are younger than full-time workers (35 years old vs. 41 years old) and are more likely to be women (66% vs. 46%). More than half (52%) of part-time workers earned a high school diploma (or equivalent) as their highest level of education. Compared to full-time workers, part-time workers are less likely to have earned a bachelor’s degree (27% vs 44%), or a postgraduate degree such as a master’s or doctorate degree (9% vs 16%). 

Part Time Workers are Less Likely Than Full Time Workers to Have a Bachelors or Post Graduate Degree

Part-time workers are more likely than full-time workers to have household incomes below twice the federal poverty level (30% vs. 13%), which is about $30,120 for a single person and $62,400 for a family of four. At the same time, part-time workers are not a homogeneous group; many live in households with higher incomes. Specifically, 42% of part-time workers have household incomes above 400% of the federal poverty level (about $124,800 for a family of four), and 24% have incomes above 600% of the poverty level (about $187,200 for a family of four). 

Where do Part-Time Workers Work? 

About one in three part-time workers (33%) are employed in service occupations. More specifically, the most common occupations are food preparation and food service-related roles (15%), followed by office and administrative support (13%), sales (12%), transportation and material moving (9%), and education, training, and library occupations (9%). The most common jobs among part-time workers are cashier, waiter, retail salesperson, and personal care aide. 

Among the major industry categories, 31% of part-time workers are employed in education, health care, or social assistance; 21% work in the arts, entertainment, recreation, or food services industry; and 17% are in wholesale and retail trade. The most common industries for part-time workers overall are restaurants and other food services; elementary and secondary schools; colleges, universities, and professional schools; hospitals (excluding facilities specifically for psychiatric and substance abuse); and supermarkets or other grocery stores. 

What Share of Part-Time Workers Have a Full-Time Worker in the Household? 

Sixty-five percent of part-time workers live in a household with a full-time adult worker. Those living with a full-time worker are much less likely to have a household income below 200% of the federal poverty level compared to those without at least one full-time worker in their household (18% vs. 52%). 

Part Time Workers Are More Likely Than Full Time Workers to Have a Family Income Less than Twice the Poverty Level

What is the Health Insurance Coverage of Part-Time Workers ?

Compared to full-time workers, part-time workers are less likely to have employer-based health coverage, either through their own workplace or as a dependent on another plan. They are also less likely to work for an employer that offers health coverage to any of their employees. If a part-time worker is working for an employer that offers coverage, they are less likely to be eligible to enroll in that coverage. 

Fifty-four percent of part-time workers have employer-based health coverage, compared to 78% of full-time workers. Notably, part-time workers living in a household without a full-time worker are much less likely to have employer-based coverage (36%) than those in households with at least one full-time worker (63%). Only 19% of part-time workers have employer-based coverage from their own jobs, compared to 62% of full-time workers. 

Part Time Workers Are More Likely to be Covered by Employer Insurance if They Have a Full Time Worker in the Household

Overall, part-time workers are more likely to be uninsured than their full-time counterparts (13% vs 9%). Among part-time workers, those living in a household without a full-time worker are more likely to be uninsured (17%) than those living with a full-time worker (11%). Part-time workers are also more likely to be covered by Medicaid (21%) or Direct-Purchase (12%) than full-time workers (7% and 6% respectively). Direct purchase coverage would primarily be through the ACA marketplaces and typically comes with a tax credit to subsidize the premium, scaled with income. 

Part Time Workers Are Less Likely to be Covered by a Job-Based Plan, and More Likely to be Uninsured

Offers and take-up of employer-based coverage 

One of the reasons part-time workers are less likely to have health coverage through their job is that they are less likely to work for employers who offer health benefits. Specifically, only 60% of part-time workers work for an employer that offers health insurance, compared to 84% for full-time workers.  

Among part-time workers who do work for an employer offering health benefits, just 64% are eligible to take up the coverage. For those who work for an employer offering coverage but are not eligible to enroll:

  •  84% do not work enough hours per week or weeks per year to qualify,
  •  8% are contract or temporary employees,
  •  and 5% have not worked for their employer long enough to become eligible. 

Under the ACA’s shared responsibility mandate, if employers with at least 50 full-time equivalent employees do not offer minimum essential coverage to 95% of their full-time employees and their dependent children, they are taxed. However, employers are not required to offer coverage to part- time workers. 

Part Time Workers Are Less Likely Than Full Time Workers to be Offered Coverage by Their Employer

Of the 60% of part-time workers that work for an employer that offers health insurance, only 64% are actually eligible for coverage at their job. Overall, 19% of part-time workers are covered by their own employer. Among those part-time employees who are eligible but do not take up coverage offered at work, 68% cite having other coverage as the reason for not enrolling, while 28% find the coverage too expensive. 

Only 6 in 10 Part Time Workers Are Eligible for Coverage Offered at Their Job, Compared to Almost All Full Time Workers

Part-time workers—especially those living in households without a full-time worker—tend to have lower incomes and are less likely to be covered by a job-based health plan. Even when coverage is offered, many part-time workers cite cost as a reason for not enrolling. These workers may struggle to afford the premiums required to enroll in the plan, or the cost-sharing required by the plan when they go to use services. While, overall, those with employer-sponsored plans spend an average of 3.9% of their income on premiums and cost-sharing, the financial burden is much higher for lower-income households. Fifteen percent of workers have household incomes below 200% of the federal poverty level. 

Employer-sponsored insurance remains the linchpin of coverage for non-elderly working adults, but workers with lower incomes or part-time schedules are significantly less likely to have access to this type of insurance. For part-time workers who are either ineligible for or cannot afford job-based coverage, upcoming federal policy changes may further limit their options. Changes to Medicaid and the Affordable Care Act in the Republican tax and spending package — formerly known as the “One Big Beautiful Bill”— are projected to result in 10 million more people becoming uninsured by 2034. Furthermore, if the enhanced premium tax credits that reduce the cost of ACA Marketplace coverage for many enrollees are not extended beyond 2025, an additional 4.2 million people are expected to lose coverage. 

Some employers have taken steps to make coverage more accessible for low-wage workers. In 2024, 14% of firms with 200 or more employees offered a plan with reduced benefits and low premium contributions specifically designed to be affordable for low-wage workers. Additionally, some firms provide voluntary benefits to part-time workers outside of their standard health plans. These benefits may include financial assistance for hospitalization or specialized services such as telehealth. In 2024, 3% of small firms and 14% of large firms that did not offer standard coverage to part-time workers offered a voluntary benefit. Despite these efforts, access to employer-sponsored health benefits remains a significant challenge for many part-time workers. 

Premium Payments if Enhanced Premium Tax Credits Expire

Published: Sep 19, 2025

Enhanced premium tax credits (ePTCs), first introduced as part of the American Rescue Plan Act in 2021, have made ACA Marketplace coverage more affordable for the millions of enrollees that receive them. Enhanced tax credits have lowered the share of household income ACA Marketplace enrollees are expected to contribute out-of-pocket toward the premium payment for a benchmark silver plan. For those already eligible for premium subsidies, ePTCs have increased the total amount of tax credits the enrollee receives, while middle-income enrollees making above 400% of poverty ($62,600 for an individual enrolled in coverage for plan year 2026) have become newly eligible for the tax credits. The ePTCs were extended until the end of 2025 by the Inflation Reduction Act.

This data note compares how the out-of-pocket portion of premiums would differ if the ePTCs expire, or become extended, for select scenarios. (To produce your own estimate of how premium payments would differ compared to if the enhanced tax credits become unavailable, KFF provides an interactive tool where users are able to input their desired geography, income, and family size).  

Premium Payments Would Increase for Subsidized Marketplace Enrollees Without Enhanced Premium Tax Credits (ePTC)

If enhanced premium tax credits expire, subsidized ACA Marketplace enrollees can expect their out-of-pocket premium payments to rise substantially. For example, a 27-year-old making $35,000 (224% of poverty) would pay $1,033 annually for a benchmark silver plan in 2026 with the ePTCs. Without the enhanced tax credits, however, they will pay $2,615 – a $1,582 (153%) increase.

With the enhanced tax credits in place, Marketplace enrollees making between 100%-150% of the federal poverty level are eligible for a fully subsidized benchmark plan. Prior to the availability of the ePTCs, enrollees making just above the poverty level were expected to contribute about 2% of their household income towards a benchmark plan. If the enhanced tax credits expire, low-income enrollees who are currently paying $0 for a benchmark plan will have to start paying for coverage again. For example, a 35-year-old couple earning $30,000 can expect to start paying $1,107 annually for a Marketplace benchmark plan.

What happens if premiums rise substantially in 2026?

There are two ways of thinking about premiums in the ACA Marketplaces. First, there is the net premium, which is what the enrollee pays out-of-pocket after taking into account their tax credit. Second, there is the gross premium, which is the amount the insurance company charges (part of which is paid by the federal government and part of which is paid by the enrollee). The expiration of the enhanced premium tax credits will affect the net premium directly (as enrollees receive less financial assistance) and it will also indirectly affect the gross premium insurers charge.

A KFF analysis of rates (gross premiums) proposed by Marketplace insurers for the 2026 plan year found that insurers are requesting a median increase of 18% in their rates. Insurers cited several reasons for these rate increases, including that they anticipate that some healthier members will leave the ACA Marketplaces once their net (or, out-of-pocket) premium payments increase if the ePTCs expire. This results in an enrollee base that is less healthy and more expensive, on average. Insurers say that rates are rising by about 4 percentage points more than they otherwise would, due to the expiration of the enhanced premium tax credit.

If enhanced premium tax credits expire, enrollees with incomes between the poverty level and four times the poverty level will continue to be eligible for financial assistance – they will just receive a smaller tax credit than they currently do. As shown in the examples above, these enrollees will pay significantly more for their monthly premium, but they will still pay a certain percent of their income for the benchmark silver plan. In other words, the increase in their monthly premium will primarily be a result of a smaller tax credit — the amount subsidized enrollees pay is largely shielded from increases in the amount insurance companies charge.

However, if enhanced premium tax credits expire, people with incomes over four times the poverty level will no longer be eligible for any financial assistance. Because their monthly payments will no longer be tied to a certain percentage of their income, these enrollees will not only lose financial assistance but will also be exposed to any increase in underlying gross premiums. With the enhanced tax credits, middle-income enrollees making above 400% of poverty currently have their out-of-pocket premium payments for a benchmark plan capped at 8.5% of their income. However, if the ePTCs are not renewed, these enrollees will experience a “double whammy” – losing their eligibility for Marketplace premium tax credits and facing the annual increases in the cost of a Marketplace plan.

Enrollees Making Above 400% of Poverty Will Lose All Financial Assistance Without Enhanced Premium Tax Credits

On average, a 55-year-old couple making $85,000 is currently receiving $13,567 in premium tax credits annually, covering 65% of the total cost of a benchmark plan. If the ePTCs expire, this couple would lose financial assistance and pay the full annual cost of $20,792, assuming premiums stay the same. However, if the gross premium grows at a rate of 18% into 2026, the 55-year-old couple can expect their net (out-of-pocket) premium payments to more than triple if ePTCs expire, increasing by $17,310 (240%), from $7,225 to $24,535 annually for the same plan.

How do Trump Administration Regulations Affect Premium Payments?

The maximum household required contribution for a benchmark ACA Marketplace plan is indexed annually to adjust for growth in premiums relative to income. Since the introduction of enhanced premium tax credits, new (and more generous) required contribution levels for premiums were implemented without annual adjustment.

As the ePTCs are set to expire, the IRS has released the required contributions for 2026. The Trump administration introduced changes in the calculation of required contribution through the Marketplace Integrity and Affordability rule earlier this year. Compared to the indexing methodology in place previously, the maximum out-of-pocket contribution for benchmark premiums for those that receive premium tax credits has increased as a share of income.

Prior estimates indicated that in 2024, out-of-pocket premium payments among subsidized enrollees would have been over 75% higher without the enhanced tax credits. Enrollees could expect to pay even more in 2026, on average, due to annual increases in the average costs of premium and IRS changes to the contribution requirements.

Methods

Premium data for 2025 is used in table 1 as rates for 2026 have not yet been finalized. Premium data for 2025 were obtained from Centers for Medicare and Medicaid Services (CMS), insurer rate filings, and information directly received or collected by KFF researchers from state exchanges or insurance departments. To isolate the effect on premiums without enhanced tax credits in table 1, the maximum required contribution was calculated using the federal poverty threshold for 2025, comparing the applicable percentage under the IRA to what is expected for 2026. In figure 1, the 2025 scenario reports values using required contribution and poverty guidelines in place for plan year 2025. An additional 18%  increase is applied in the 2026 (without enhanced tax credit) scenario to model annual increases in premiums.

News Release

Dave A. Chokshi Joins KFF Board of Trustees

Published: Sep 18, 2025

San Francisco – KFF announced today that Dr. Dave Ashok Chokshi, a practicing physician and health leader, has joined KFF’s Board of Trustees.

 Dr. Chokshi is a physician at Bellevue Hospital as well as Sternberg Family Professor of Leadership at the City College of New York. From 2020 to 2022, he served as the 43rd Health Commissioner of New York City, where he led the city’s response to the COVID-19 pandemic, including its historic campaign to vaccinate over six million New Yorkers. 

“Dr. Chokshi is a tremendous addition to KFF and our board as we confront new and unprecedented challenges in health policy and public health,” said Dr. Drew Altman, KFF’s President and CEO.

 “There could not be a more vital moment for the work of KFF,” said Dr. Chokshi. “I have long admired KFF’s focus on how policy affects people, and its unwavering pursuit of truth through data, research, and journalism. I am honored to join the Board and excited to contribute to this essential mission.” 

 Dr. Chokshi also serves as chair of the Common Health Coalition, a nonpartisan, not-for-profit organization dedicated to strengthening partnership across healthcare and public health. He is also co-chair of the Health and Political Economy Project.

Dr. Chokshi’s prior experience includes appointment as the inaugural Chief Population Health Officer at NYC Health + Hospitals (H+H), the largest public healthcare system in the nation, where he also served as CEO of the H+H Accountable Care Organization. Dr. Chokshi has practiced primary care internal medicine at Bellevue Hospital since 2014, and his current clinical practice focuses on people experiencing homelessness.

 In addition to KFF, he is currently a board member for Community Solutions, Rock Health, and Yuvo Health.

KFF’s Board of Trustees is chaired by former U.S. Senator Olympia Snowe and its 13 members have deep backgrounds in public service, academia, nonprofit organizations, health care, and the media.
Board members serve up to two five-year terms. Additional information about KFF’s board can be found here.

Key Global Health Positions and Officials in the U.S. Government

Published: Sep 18, 2025

This tracker is updated periodically and currently reflects major positions known to be filled or likely to be retained thus far in the second Trump administration (other key roles will be added as filled). Some of the officials noted in this tracker may be on administrative leave and not performing the duties of their roles under direction from the Trump administration.

PositionOfficial
WHITE HOUSE/EXECUTIVE OFFICE OF THE PRESIDENT
National Security Advisor/Assistant to the President for National Security Affairs, National Security Council (NSC)Marco Rubio
Director, Office of National AIDS Policy (ONAP)Vacant
Director, Office of Management and Budget (OMB)Russ Vought
U.S. Trade Representative, Office of the United States Trade Representative (USTR)Jamieson Greer
Director, Office of Science and Technology Policy (OSTP)Michael Kratsios
Director, Office of Pandemic Preparedness and Response Policy (OPPR)Vacant
DEPARTMENT OF STATE
Secretary of StateMarco Rubio
Permanent U.S. Representative to the United Nations, U.S. Mission to the United NationsMike Waltz (Designate)
Dorothy Shea
Senior Official, Under Secretary for Foreign Assistance, Humanitarian Affairs and Religious FreedomJeremy Lewin
Senior Bureau Official and Acting Global AIDS Coordinator, Bureau of Global Health Security and DiplomacyJeffrey Graham
Principal Deputy Coordinator for PEPFAR, Bureau of Global Health Security and DiplomacyRebecca Bunnell
Senior Advisor for Global Health Security and Diplomacy, Bureau of Global Health Security and DiplomacyBrad Smith
Senior Bureau Official, Bureau of Democracy, Human Rights, and LaborJacob McGee
Senior Bureau Official, Bureau of Population, Refugees, and MigrationSpencer Chretien
Principal Deputy Director, Office of Global Women’s IssuesKatrina Fotovat
Senior Bureau Official, Bureau of International Organization AffairsMcCoy Pitt
Assistant Secretary of State for Oceans and International Environmental and Scientific Affairs (OES)John Thompson
DEPARTMENT OF HEALTH AND HUMAN SERVICES (HHS)
SecretaryRobert F. Kennedy Jr. 
Assistant Secretary for Global Affairs, Office of Global Affairs (OGA)Vacant
Assistant Secretary for HealthDorothy Fink
Surgeon GeneralCasey Means (Designate)
Principal Deputy Assistant Secretary for Preparedness and Response, Office of the Assistant Secretary for Preparedness and Response (ASPR)John Knox
Director, Center for the Biomedical Advanced Research and Development Authority (BARDA), ASPRGary Disbrow
HHS/CENTERS FOR DISEASE CONTROL AND PREVENTION (CDC)
DirectorJim O’Neill
Director, Office of Readiness and ResponseHenry Walke
Director, Washington OfficeJeff Reczek
Director, Global Health Center (GHC)Paige Alexandra Armstrong
Director, Division of Global Health Protection, GHCBenjamin Park
Director, Division of Global HIV and TB, GHCHank Tomlinson
Director, Global Immunization Division, GHCJohn Vertefeuille
Director, Division of Parasitic Diseases and Malaria, National Center for Emerging and Zoonotic Infectious Diseases (NCEZID)Simon Agolory
Director, Influenza Division, National Center for Immunization and Respiratory Diseases (NCIRD)Vivien Dugan
HHS/NATIONAL INSTITUTES OF HEALTH (NIH)
DirectorJay Bhattacharya
Director, National Institute of Allergy and Infectious Diseases (NIAID)Jeffrey Taubenberger
Director, Office of Global Research, NIAIDJoyelle Dominique
Director, Division of AIDS, NIAIDCarl Dieffenbach
Director, Division of Microbiology and Infectious Diseases (DMID), NIAIDJohn Beigel
Director, Vaccine Research Center, NIAIDTed Pierson
Director, Office of AIDS Research (OAR); NIH Associate Director for AIDS ResearchGeri Donenberg
Director, Fogarty International Center (FIC); NIH Associate Director for International ResearchPeter Kilmarx
Director, Center for Global Health, Office of the Director, National Cancer InstituteSatish Gopal
Director, Office of Global Health, Office of the Director, National Institute of Child Health and Human DevelopmentVesna Kutlesic
Director, Center for Global Mental Health Research, National Institute of Mental HealthLeonardo Cubillos
HHS/FOOD & DRUG ADMINISTRATION (FDA)
CommissionerMarty Makary
Deputy Commissioner for Policy, Legislation, and International AffairsGrace Graham
Associate Commissioner for Global Policy and StrategyMark Abdoo
HHS/HEALTH RESOURCES AND SERVICES ADMINISTRATION (HRSA)
AdministratorThomas Engels
Associate Administrator, Bureau of HIV/AIDSHeather Hauck
Director, Office of Global Health, Office of Special Health InitiativesMelissa Ryan Kemburu
DEPARTMENT OF DEFENSE (DoD)
SecretaryPete Hegseth
Assistant Secretary of Defense for Health Affairs, Personnel and Readiness (P&R)Keith Bass (Designate)
Steve Ferrara
Commander, Naval Medical Research Command (NMRC)Eric Welsh
Director, DoD HIV/AIDS Prevention Program (DHAPP)Brad Hale
Commander, Walter Reed Army Institute of Research (WRAIR)Brianna Perata
Director, U.S. Military HIV Research Program (MHRP)Julie Ake
Chief, Armed Forces Health Surveillance Division (AFHSD)Richard Langton
Chief, Global Emerging Infections Surveillance (GEIS), AFHSDVacant
OTHER AGENCIES AND DEPARTMENTS
Peace Corps*: DirectorPaul Shea
Council of the Inspectors General on Integrity and Efficiency*: Chair, Pandemic Response Accountability CommitteeMichael Horowitz
Council of the Inspectors General on Integrity and Efficiency*: Executive Director, Pandemic Response Accountability CommitteeKenneth Dieffenbach
Department of Agriculture (USDA): SecretaryBrooke Rollins
Environmental Protection Agency (EPA)*: Assistant Administrator for International and Tribal AffairsVacant
Department of Homeland Security (DHS): Chief Medical OfficerDev Jani
Notes: Acting officials in italics. Officials who the White House has signaled it intends to nominate or who are formally awaiting Senate confirmation are noted as “Designate.” tbd means to be determined. As of September 5, 2025. Also see NIH/FIC, Global Health Initiatives at NIH, available at: https://www.fic.nih.gov/Global/Global-Health-NIH/Pages/institute-center-ics-global-health.aspx.

What Could the Health-Related Provisions in the Reconciliation Law Mean for Older Adults?

Published: Sep 17, 2025

Editorial Note: This brief was updated on September 17, 2025 to reflect language in the final bill enacted July 4, 2025.

On July 4, President Trump signed into law the budget reconciliation bill, previously known as “One Big Beautiful Bill Act.” The law includes several policy changes that could have significant implications for the health and health coverage of older Americans ages 50 and older, including those who are covered by Medicare.

The reconciliation law as enacted includes an estimated $911 billion in federal Medicaid spending cuts over the next 10 years, including several provisions expected to increase costs or eliminate coverage for Medicaid beneficiaries. Collectively, these provisions could affect the 22 million people ages 50 and older with coverage under the Medicaid program by reducing the number of people with Medicaid and reducing access to health and long-term care services for people who remain enrolled in the program. The reconciliation bill also includes changes that are expected to reduce the number of people with ACA Marketplace coverage, including among individuals between the ages of 50 and 64.

According to KFF’s Health Tracking Poll conducted in July of 2025 less than half (42%) of older adults have a favorable view of the just-passed tax and budget law, including 39% of people ages 50-64 and 44% of adults ages 65 and older, with far stronger support among older adults who are Republicans (83%) than those who are independents (25%) or Democrats (3%). (See Figure 1 below).

Opinions About the GOP's So-Called "One Big Beautiful Bill" Recently Signed Into Law Are Highly Partisan Among Older Adults

Below are seven health-related provisions to watch as provisions of the 2025 budget reconciliation law are implemented.

1. New Medicaid Work Requirements. The largest source of federal Medicaid spending cuts will come from new work requirements that will be imposed on the Medicaid expansion population. The Congressional Budget Office (CBO) estimates that the work requirements would reduce Medicaid spending by $326 billion and cause nearly 5 million people to become uninsured.

The new law requires adults ages 50-64 to meet new work and reporting requirements if they are enrolled through the ACA expansion. Most Medicaid enrollees ages 50-64 are working or could be exempt from the work requirements because of a disability or caregiving responsibility, but they will still need to comply with reporting requirements, putting them at risk of risk losing Medicaid coverage. According to a new KFF analysis, fewer than half of adults ages 50-64 would meet the work requirements through either employment or school, compared with 72% of adults ages 19-27 and 66% of adults ages 27-49.

2. Changes to ACA Marketplaces. An estimated 5.5 million adults ages 55 to 64 get health insurance from ACA Marketplaces in 2025. The law makes changes to the ACA Marketplaces that will increase the number of people who are uninsured, including older people ages 50-64. Combined with the Trump administration Marketplace integrity rules, the law will shorten the open enrollment period, impose new documentation and pre-enrollment verification of eligibility requirements, and make other changes that would affect enrollment. Overall, the outcome will be loss of health insurance coverage for as many as 3 million people by 2034, including older adults.

Further, because the law does not extend enhanced ACA premium tax credits for Marketplace coverage that are set to expire at the end of 2025, an additional 4.2 million people (including older adults) are estimated to lose coverage by 2034. Without enhanced premium tax credits, Marketplace enrollees with incomes over four times poverty will lose subsidy eligibility and those with incomes between 100% and 400% of poverty will receive a smaller tax credit.

Over half of individual market enrollees with incomes above four-times the poverty threshold are between the ages of 50 and 64, which means that older adults will be disproportionately affected if the premium tax credits are not extended beyond this year. Furthermore, the loss of premium tax credits for those over 400% of poverty means that group will bear the full cost of any premium increases on top of the loss of financial assistance. Premiums are expected to increase by about 18% in 2026.

Health insurance premiums are higher for people in their 50s and early 60s than for younger adults choosing the same plan in the same area. If the enhanced premium tax credits expire, Marketplace enrollees currently receiving a subsidy could face higher costs to enroll, particularly if their incomes are about or above 400% of poverty. For example, according to the KFF calculator, a 59-year-old single widow living in Jackson, Missouri earning $63,000 (just above 400% of the poverty level) would pay $5,355 for her silver Marketplace plan in 2026 if Congress acts to extend the enhanced premium tax credits before the end of this year. But if Congress does not extend the enhanced premium tax credits, she could pay more than twice the amount—$14,213 in premiums a year—or 22.9% of her income for the same health insurance policy. It’s not hard to see why she and others like her might give up their Marketplace plans, given the cost relative to their income.

3. Placing a Moratorium on Implementation of the Medicare Savings Program and Medicaid Eligibility and Enrollment Rules. Older adults are also at risk of losing coverage due to provisions in the law that impose a moratorium on implementation of most provisions in two Biden-era rules that were intended to streamline the enrollment process for Medicaid, especially for older adults and people with disabilities. The fourth largest source of federal reductions in Medicaid spending stems from these two provisions, which are collectively estimated to reduce federal Medicaid spending by $122 billion.

Both rules aimed to reduce barriers to enrolling in and maintaining Medicaid coverage. They were expected to disproportionately affect enrollment among older adults and people with disabilities because they included specific requirements related to streamlining Medicaid enrollment among Medicare beneficiaries, and to facilitating smoother enrollment for people who are eligible for Medicaid because they have a disability, are ages 65 and older, or use long-term care.

Earlier CBO analysis showed that delaying implementation of these rules would mean that 1.3 million fewer Medicare beneficiaries would also have Medicaid coverage in 2034. That number may be lower under the law as enacted based on the Senate’s changes to the legislation, because CBO’s estimates of the savings associated with the provisions decreased from $167 billion prior to those changes to $122 billion for the law as enacted. A separate KFF analysis shows that the loss of these Medicaid benefits would result in a someone with an income of $967 per month paying $185 per month in Medicare premiums, or about 20% of income, without accounting for other non-trivial out-of-pocket costs, including Medicare cost-sharing requirements and the loss of Medicaid benefits.

4. Reducing Spending for Long-Term Care Services.The reconciliation law could also reduce federal funds for nursing facilities and would likely lead to reductions in spending for other long-term care services. The law will reduce federal Medicaid spending by $23 billion over 10 years by prohibiting implementation of a Biden Administration rule on nursing facility staffing. The rule had aimed to help address long-standing concerns about inadequate staffing and the quality of care, but the law locks into place a federal judge’s ruling to overturn key elements of the rule.

The reconciliation law could also reduce Medicaid funds available to nursing facilities through a moratorium on provider taxes (in place for nursing facilities in 46 states) and new limits on some payments to nursing facilities (known as state-directed payments). Savings from provisions affecting provider taxes and state-directed payments account for $340 billion in reduced federal Medicaid spending over 10 years, although they would also affect hospitals and other providers. KFF estimates that at least 29 states would have to reduce existing state-directed payments to hospitals or nursing facilities under the enacted legislation.

If experience from the past is a guide, substantial cuts to federal Medicaid spending could lead to reduced spending on home care, which includes long-term care provided in people’s homes and the community (and is sometimes referred to as home- and community-based services or HCBS). During the last major reduction in federal spending, all states reduced spending on home care by serving fewer people (40 states) or by benefits or cutting payment rates (for long-term care providers) (47 states). As a significant source of Medicaid spending comprised of optional services for which there are already waiting lists, home care may be especially vulnerable.

5. Ending Medicare Eligibility for Previously Eligible People with Lawful Immigrant Status. Under current law, undocumented immigrants are not eligible for Medicare. Medicare coverage is restricted to people who are citizens or permanent legal residents. The 2025 budget reconciliation law prevents defined groups of individuals who are lawfully present in the U.S. from becoming eligible for Medicare benefits and terminates Medicare coverage for currently eligible beneficiaries who are not U.S. citizens, green card holders, certain Cuban-Haitian entrants, and people residing under the Compacts of Free Association no less than 18 months from enactment. Individuals affected by this provision and their employers would continue to be required to pay Medicare payroll taxes. This is the first time that Congress has eliminated Medicare coverage from previously eligible legally residing individuals. According to CBO, the provision will save $5.1 billion over 10 years, and result in 0.1 million Medicare beneficiaries losing their Medicare coverage as of 2034.

6. Adding Work Requirements and Cutting Federal Spending for Supplemental Nutritional Assistance Program (SNAP). The reconciliation law reduces federal spending for SNAP by about $186 billion. Reductions of this magnitude, coupled with work requirements, are likely to affect the health of older adults, particularly given the strong ties between health and nutrition. As noted above, work requirements, even with exemptions, pose administrative hurdles for older adults that put them at risk for losing SNAP benefits. An estimated 9.2 million Medicare beneficiaries received SNAP benefits to help cover the costs of food and groceries in 2022, according to a KFF analysis. The SNAP work requirements may particularly exacerbate financial challenges for older Medicaid enrollees ages 50 and older who are two and a half times more likely to experience food insecurity than other older adults not enrolled in Medicaid (28% compared to 10%).

7. Modifying the Medicare Drug Price Negotiation Program to Delay or Exempt Certain High-Spending Drugs from Negotiation. Under the Medicare Drug Price Negotiation Program, the federal government is required to negotiate with drug companies for the price of some high-spending drugs that have been on the market for several years without competition, with the goal of lowering Medicare drug spending and helping to reduce out-of-pocket costs for people with Medicare. The law that created the negotiation program exempted drugs from negotiation if they were designated and approved for only one rare disease or condition (known as orphan drugs).

The reconciliation law exempts orphan drugs from Medicare drug price negotiation if they are approved for two or more rare diseases or conditions, not just a single rare disease. It also delays the timeframe for Medicare price negotiations for orphan drugs that are subsequently approved for non-orphan indications. These changes have the effect of delaying the negotiating process for some drugs, while exempting others from negotiations altogether, which is projected to diminish savings to Medicare from the negotiation program.

The changes are expected to have an immediate impact on which drugs are selected for Medicare price negotiation in 2026, including, for example, likely delaying the selection of the cancer drug Keytruda by a year. In 2023, Medicare and the 70,000 beneficiaries who used Keytruda spent a total of $5.6 billion on this drug alone, with annual out-of-pocket liability averaging around $15,000. By exempting or delaying price negotiation for Keytruda and other orphan drugs, the reconciliation law is likely to lead to higher out-of-pocket costs for beneficiaries who take these drugs relative to what they would have paid if a lower, Medicare-negotiated price was available.

This work was supported in part by the John A. Hartford Foundation. KFF maintains full editorial control over all of its policy analysis, polling, and journalism activities.

Which PEPFAR Investments Drive HIV Outcomes? Informing PEPFAR Transition and Scale-Down

Authors: Moaven Razavi, Collins Gaba, Jennifer Kates, and Allyala Nandakumar
Published: Sep 17, 2025

Overview

As PEPFAR faces increased pressure to transition and scale down, understanding which of its investments most effectively drive HIV outcomes can help inform future directions. This analysis examines PEPFAR spending and HIV viral suppression rates in 22 countries from 2018–2023, looking at spending in three areas: (1) core-services; (2) targeted/stand-alone programs; and (3) non-service delivery/institutional strengthening. Overall, it finds that targeted program spending, which accounts for the smallest share of PEPFAR spending, was associated with the biggest improvement in viral suppression, followed by spending on core-services. Further, targeted programs appear to be most important for “last-mile” gains (in countries closer to sustained epidemic control) while core-services appear to be most important in countries where HIV outcomes remain below optimal levels and are lower income. By contrast, spending on non-service delivery was negatively associated with viral suppression, suggesting diminishing returns at this point in PEPFAR’s trajectory. These findings provide new information about how future PEPFAR investments could best be tailored to support transition while maintaining HIV outcomes. Additional research on the relationship between specific activities within each spending category and HIV outcomes could further aid these efforts. Finally, it is important to note that despite the strength of the analytic model, it is possible that other factors may be contributing to the results.

Introduction

The Trump administration’s foreign aid review and related actions have resulted in significant changes to PEPFAR, the U.S. global HIV/AIDS program. These actions have included reductions in PEPFAR programming and steps to accelerate the scale-down of the program at a more rapid pace. Although PEPFAR had been working to develop transition plans, Congress and other stakeholders had been increasingly encouraging the program to develop more ambitious timelines for transitioning responsibility to countries. Still, how such planning is pursued, including which services are transitioned and when, can affect HIV outcomes and the sustainability of the HIV response. To help inform current discussions, this analysis examines the relationship between bilateral PEPFAR spending and HIV viral suppression rates in 22 PEPFAR countries between 2018 and 2023. The outcome measure – the share of people with HIV on treatment who are virally suppressed (to undetectable levels) – is used because viral suppression supports individual health and those who are virally suppressed cannot transmit HIV to their partner. The analysis looks at the association between viral suppression by country and year and PEPFAR spending in three areas (also see Table 1):

(1) core-services (e.g., commodities, supplies, health care work force);

(2) targeted/stand-alone programs (e.g., for key and vulnerable populations, including the DREAMS program and services for orphans and vulnerable children, and community-based testing); and

(3) non-service delivery/institutional strengthening (e.g., technical assistance, training, data collection)

It further stratifies countries into lower and higher achievement groups (based on a composite measure of the share of people with HIV who know their status, the share who know their status and are on treatment, and the share on treatment who are virally suppressed) and lower and higher income groups (based on GDP per capita) to better understand where different types of investments may be most needed. The first stratification reflects countries’ current performance and potential to improve HIV outcomes, while the second highlights their financial capacity to sustain HIV efforts independently.  Importantly, findings here represent PEPFAR’s 2018-2023 period and may not reflect the relationship between investments and HIV outcomes earlier on in the program. They also may not be directly applicable to the current period, given the pause in activities and terminations of many PEPFAR projects as part of the administration’s foreign aid review. Still, they can serve to provide an indication of where future investments could promote stronger outcomes.

Findings

  • The share of people with HIV on treatment who were virally suppressed increased in all but two countries over the period. Viral suppression went up, on average, by 8 percentage points and increased in 20 of the 22 countries between 2018 and 2023. Increases ranged between 2 and 23 percentage points, depending on the country. Decreases occurred in Ethiopia (-1 percentage point) and the Dominican Republic (-6). See Appendix Table.
  • Across the 22 countries analyzed, bilateral PEPFAR spending averaged $3.7 billion per year, during the 2018 to 2023 period.  Spending fluctuated somewhat and was highest in 2019 and lowest in 2020. It was $275 million lower in 2023 compared to 2018 and spending declined in 14 of the 22 countries. See Figure 1.
  • Spending on non-service delivery accounted for the largest category of PEPFAR spending, followed by core-services and then targeted programs. Spending on non-service delivery averaged $1.76 billion per year in the 22 countries and accounted for 47% of spending over the period. Core-services averaged $1.40 billion per year (38%). Targeted programs accounted for the smallest share of spending (15%), averaging $560.7 million per year. See Figure 2.
  • Declines in spending between 2018 and 2023 were driven entirely by non-service delivery. Non-service delivery spending declined by $714 million overall and fell in 19 of the 22 countries. By contrast, spending on core-services and targeted programs increased between the two periods (by $250.3 million and $188.8 million, respectively) and in most countries (17 and 19, respectively). See Appendix Table.    
  • The results of the model indicate that despite accounting for just 15% of PEPFAR spending, targeted programs were associated with the greatest improvement in viral suppression. Between 2018 and 2023, viral suppression increased by 0.11 percentage points, on average, for every $1 million spent on targeted programs. This translates into a one percentage point increase in viral suppression for every $9.3 million spent in a country.
  • This association was strongest in countries closer to epidemic control, suggesting their importance for “last mile” gains. Targeted spending was associated with twice the gain in viral suppression (a 0.21 percentage point increase) in the high achieving country group (those closer to sustained epidemic control), compared to .011 percentage points for all countries. There was no significant association in the lower achieving country group. Significant improvement was found in both lower (0.19) and higher (0.17) income country groups. These findings suggest that targeted investments may be most important for “last mile” gains (those needed to fully reach and sustain epidemic control), regardless of country income. See Table 2.
  • Core-services spending was also associated with improvement in viral suppression, although of a lesser magnitude. Overall, core-services spending was associated with a .05 percentage point increase in viral suppression, on average, for every $1 million spent. This translates into a 1 percentage point increase in viral suppression for every $20 million spent in a country.
  • In addition, spending on core-services was only associated with viral suppression improvement in lower achieving and lower income country groups. Viral suppression increased in both lower achieving (0.08) and lower income (0.09) country groups. There was no significant association in higher achieving and higher income countries. This suggests that core-services investments yield the biggest returns in countries still needing to make more progress towards sustained epidemic control and those more likely to be in need of external financial assistance.
  • By contrast, spending on non-service delivery, the largest category of spending, was associated with a reduction in viral suppression. Every $1 million spent on non-service delivery was associated with a .06 percentage point decrease in viral suppression. This was true regardless of country progress toward epidemic control or income. This finding suggests that spending in this area, which likely contributed to scale-up earlier on in PEPFAR’s evolution, may now have diminishing returns when it comes to HIV outcomes. While some spending on non-service delivery (such as for surveillance and other monitoring efforts) may aid in transitioning PEPFAR programming to country governments, this analysis suggests that reductions can be made without sacrificing program outcomes.

Implications

These findings support prior analyses that point to the importance of tailoring transition efforts to country-specific factors, including epidemiology and income. Approaches that are responsive to these factors are likely to be more effective than uniform strategies. More specifically, the findings suggest that targeted, stand-alone investments – those focused on specific populations – are associated with the strongest improvement in viral suppression, particularly for “last mile” gains, those needed to fully reach and sustain epidemic control. For example, spending an additional $9.3 million on targeted programs is predicted to increase the share of people with HIV on treatment who are virally suppressed by one percentage point; spending $100 million would increase viral suppression by 11 percentage points. On the other hand, a $100 million cut would decrease viral suppression by the same magnitude. Targeted programs, which represent a relatively small share of PEPFAR spending, are also those least likely to be assumed by country governments, highlighting the potential ongoing role for PEPFAR in this area. Core-services investments were associated with somewhat smaller improvements, and these were concentrated in lower-income countries and those further away from sustained epidemic control.  By contrast, non-core investments appear to have diminishing returns at this point in PEPFAR’s trajectory. This suggests opportunities to adjust spending in this area, while recognizing that some non-core activities, such as monitoring and support for transition processes, may still be useful in the near term.

There are some limitations to these findings. The results reflect average effects across countries and do not capture within-country variation. Additional country-level analyses could provide a more nuanced approach to transition, as could further disaggregation of activities within each spending category to provide a more complete picture of the specific types of investments most closely associated with improvements in HIV outcomes. It is also the case that PEPFAR investments in all three categories are not necessarily independent of one another. For example, the success of targeted program investments is also likely predicated on delivery of core services, particularly commodities for HIV treatment and prevention. In addition, despite the strength of the analytic model, which included controls for country income and health service coverage (a proxy for the strength of a health system strength), it is possible that other factors may be contributing to the results. It is also possible that these findings may not be directly applicable to the current PEPFAR environment given the pause in activities and terminations of many PEPFAR projects as part of the foreign aid review.  Despite these limitations, the findings contribute to the evidence base on how different types of PEPFAR spending align with progress toward epidemic control and may help inform decisions about future allocation, including potential re-allocations, and transition planning.

Methods

We obtained data on bilateral PEPFAR expenditures by country over the 2018-2023 time period from PEPFAR’s program expenditure database which includes data for 33 operating units (26 countries and 7 regions). We excluded four countries (Cameroon, India, South Sudan and Vietnam) due to poor data availability across HIV outcome indicators and excluded the 7 regions. Our final dataset included 22 countries (Angola, Botswana, Burundi, Côte d’Ivoire, DRC, Dominican Republic, Eswatini, Ethiopia, Haiti, Kenya, Lesotho, Malawi, Mozambique, Namibia, Nigeria, Rwanda, South Africa, Tanzania, Uganda, Ukraine, Zambia, and Zimbabwe) containing 132 country/year observations over the period.

Spending was divided into three, broad categories (see Table 1 for further details):
(1) core-services (e.g., commodities, supplies, health care work force);
(2) targeted/stand-alone programs (e.g., for key and vulnerable populations, including the DREAMS program and services for orphans and vulnerable children, and community-based testing); and
(3) non-service delivery/institutional strengthening (e.g., technical assistance, training, data collection)

Our main outcome of interest was the share of people living with HIV who were on HIV treatment and were virally suppressed. These data were obtained from UNAIDS. While this was the dependent variable we modeled, we used other HIV outcome data from UNAIDS to generate composite scores to allow us to create country strata based on progress toward sustained epidemic control for further analysis. The composite scores included the share of people living with HIV who were aware of their HIV status, the share on treatment, and the share virally suppressed. The score was generated by giving equal weight to each of the three outcomes and was based solely on data from the latest year, 2023. Countries below the median were assigned to the lower achievement stratum, while countries above the median were assigned to the higher achievement stratum.  We also divided countries into two strata based on income, using GDP per capita (current international $) for the most recent year, 2023. Countries below the median were categorized as lower-income and those above the median as higher-income. For observations with a few missing outcome values, the missing data were generated using linear interpolation.

We ran five models with PEPFAR financial data expressed in USD millions and the dependent variable expressed as a percentage. Model 1 included all 22 countries over the 2018-2023 period (for a total of 132 observations). Models 2 and 3 divided countries into two strata based on composite scores of the three HIV outcomes (resulting in 11 countries in each stratum, each with 66 observations). Models 4 and 5 divided countries into the two economic group strata based on GDP per capita. Our models included controls for GDP per capita, PPP (current international $) and the WHO Service Coverage Index, which measures coverage of essential health services and serves as a proxy for health system strength, for the median year (2021).

To analyze the panel data, we tested both fixed and random effects models. Fixed effects models control for all time-invariant differences between countries. Random effects models control for unobserved heterogeneity. The Hausman test was used to determine that the random effects model was the preferred specification for the data.

PEPFAR Spending Category Definitions
Estimated Percentage Point Change in Viral Suppression by PEPFAR Spending Category, 2018-2023 (standard errors in parentheses)
Estimate Additional Spending Needed to Raise Viral Suppression by 1 Percentage Point (in USD millions)
PEPFAR Spending by Category, 2018-2023 (in USD billions)
Share of PEPFAR Spending by Category, 2018-2023

Appendix

Appendix Table # 1
PEPFAR Spending by Category and Percent Virally Suppressed, 2018 and 2023
CountryTargetedCoreNon-CoreTotalTargetedCoreNon-CoreTotal% Virally Suppressed
 2018202320182023
Angola$3,841,633$478,898$8,471,700$12,792,231$438,279$0$3,765,634$4,203,91355.078.0
Botswana$9,188,688$12,759,114$24,870,282$46,818,084$17,646,565$5,389,744$22,789,597$45,825,90797.099.0
Burundi$1,801,767$1,874,579$11,335,090$15,011,436$3,600,810$6,158,745$10,631,531$20,391,08687.389.0
Cote d’Ivoire$17,303,080$22,024,735$71,241,076$110,568,891$26,935,252$28,148,513$28,998,007$84,081,77277.088.0
DRC$10,523,645$15,373,773$29,605,903$55,503,321$9,611,968$45,223,754$31,965,084$86,800,80573.389.0
Dominican Republic$3,656,850$786,187$5,196,748$9,639,785$4,501,686$4,829,020$9,829,188$19,159,89493.087.0
Eswatini$11,172,727$11,275,208$33,105,932$55,553,867$17,866,238$14,758,439$28,178,327$60,803,00493.099.0
Ethiopia$19,499,477$17,495,821$103,477,386$140,472,684$20,097,637$19,334,925$44,500,139$83,932,70190.089.0
Haiti$14,181,119$34,372,263$51,749,891$100,303,273$14,611,550$30,106,447$43,048,408$87,766,40577.085.0
Kenya$56,591,156$146,132,514$234,030,849$436,754,519$63,807,040$120,456,513$112,541,769$296,805,32190.097.0
Lesotho$10,462,376$20,843,626$31,703,237$63,009,239$14,050,868$21,140,546$26,020,807$61,212,22193.099.0
Malawi$14,321,280$23,050,062$84,731,219$122,102,561$31,084,406$52,502,078$68,613,196$152,199,68089.095.0
Mozambique$32,009,703$103,055,070$240,274,822$375,339,595$39,102,228$149,534,500$166,514,020$355,150,74876.190.0
Namibia$5,860,629$10,539,001$40,584,784$56,984,415$19,372,076$15,965,548$31,591,075$66,928,69982.499.0
Nigeria$47,420,855$136,018,210$171,857,733$355,296,799$67,789,733$158,063,694$122,508,397$348,361,82482.996.0
Rwanda$8,942,243$42,042,538$16,625,175$67,609,956$13,038,878$25,660,903$17,576,226$56,276,00792.099.0
South Africa$53,379,111$142,389,246$257,463,135$453,231,491$85,711,833$178,734,528$124,817,074$389,263,43688.091.0
Tanzania$64,427,213$88,685,437$266,269,079$419,381,729$60,038,096$155,506,898$200,291,101$415,836,09580.097.0
Uganda$42,291,465$144,480,428$211,712,274$398,484,167$49,130,305$147,510,953$152,084,226$348,725,48488.094.0
Ukraine$3,968,162$9,741,849$18,967,369$32,677,380$8,752,342$12,800,280$14,803,193$36,355,81593.098.0
Zambia$31,912,365$160,009,043$177,411,909$369,333,318$53,606,148$174,679,809$133,148,050$361,434,00789.297.0
Zimbabwe$21,706,311$43,324,946$73,841,291$138,872,548$52,470,392$70,552,100$56,255,761$179,278,25384.096.0
Notes: PEPFAR spending represents bilateral spending only. Viral suppression is percent of people with HIV on antiretroviral treatment who are virally suppressed.   
Sources: PEPFAR’s program expenditure database; UNAIDS 2024 HIV estimates.

Moaven Razavi, Collins Gaba, and Allyala Nandakumar are with Boston University. Jen Kates is with KFF. The authors would like to acknowledge assistance provided by William Crown and Deborah Stenoien from Boston University.

News Release

New KFF-Washington Post Survey Explores Parents’ Trust In, and Confusion About, Childhood Vaccines as the Trump Administration Revamps Federal Policies

Most Parents Remain Confident in Routine Childhood Vaccines and Support School Mandates, But Are Less Certain About Seasonal Flu and COVID Vaccines; 1 in 4 MAGA Republicans Say They Have Delayed or Skipped a Child’s Vaccine

Published: Sep 15, 2025

A new KFF-Washington Post partnership survey of parents explores their experiences with and views about vaccines for their children, including a look into how they make decisions related to vaccines and where they are uncertain or confused about their safety.

The poll comes as the Trump administration’s Health and Human Services Secretary Robert F. Kennedy Jr. continues to question the childhood vaccine schedule and to raise doubts about vaccine safety and effectiveness. Based on interviews with more than 2,700 parents, including more than 1,000 parents with children under age 6 who have had to make decisions about vaccines in the post-COVID era, the survey’s findings will be featured in a series of Washington Post stories and KFF reports analyzing the survey data.

The survey reveals large majorities of parents view long-standing childhood vaccines such as the ones to prevent measles, mumps, and rubella (MMR) and polio as safe and important, but are less confident in seasonal vaccines for flu and especially COVID-19.

While most parents say they keep their children up to date on recommended childhood vaccines, about one in six (16%) say that they have delayed or skipped at least one vaccine for their children (other than those for flu and COVID-19). Those most likely to report delaying or skipping vaccines include Republican parents (22%), especially those who identify with President Trump’s “Make America Great Again” movement (25%), parents under age 35 (19%), and those who homeschool their child (46%).

Among parents who delayed or skipped some vaccines for their children, the most common reasons include concerns about side effects, a lack of trust in vaccine safety, and a belief that not all recommend vaccines are necessary.

This is the 37th survey in the KFF-Post partnership dating back to 1995 that combines survey research with in-depth journalism. The Post today published its overview of the results, while KFF published a report breaking down the data. The Post plans to publish additional stories drawing on the survey results.

Key themes from the survey include:

Most favor school vaccine requirements. A large majority (81%) of parents say that public schools should require students to get the measles and polio vaccines, with exceptions for medical and religious reasons. Among all parents, 8% say that they had requested an exemption to vaccine requirements so a child could attend school or daycare.

Many are uncertain about false claims. When asked about several false claims about vaccines and measles, relatively few parents believe the untrue statements, but larger shares are uncertain what to believe. One example: While relatively few (9%) parents believe the false claim that the MMR vaccine can cause autism in children, nearly half (48%) say they don’t know enough to say.

Views of parents with children diagnosed with autism spectrum disorder. Parents of children with autism spectrum disorder are somewhat more likely than other parents to believe the false claim that vaccines cause autism (16% vs. 9%).

Confidence in federal health agencies is shaky. Fewer than one in six (14%) parents say they have “a lot” of confidence in government health agencies like the Centers for Disease Control and Prevention (CDC) and the Food and Drug Administration to ensure the safety and effectiveness of vaccines, while half say they have only a little confidence (29%) or none at all (22%). Confidence is even lower in the agencies’ abilities to make decisions based on science rather than the views of agency officials or to act independently without interference from outside interests. A quarter (26%) of parents overall say that the CDC recommends too many vaccines.

Many parents are unsure about impact of federal vaccine policy changes. Few parents (11%) say they’ve heard “a lot” about Secretary Kennedy’s changes to federal vaccine policy. When asked about the changes’ impact, most say either that they don’t know or that the changes won’t make of a difference on safety, access, and industry influence.

The survey also examines parents’ views of the safety testing for vaccines, the number of recommended vaccines, and experiences with the human papillomavirus (HPV) vaccine.

METHODOLOGY INFO:

The KFF/Washington Post Survey of Parents includes interviews with a nationally representative sample of 2,716 parents or legal guardians of children under age 18 in the U.S. The survey was conducted between July 18-August 4, 2025, online, in English and Spanish, using the Ipsos KnowledgePanel. The margin of sampling error including the design effect for total sample of parents is plus or minus 2 percentage points. For results based on other subgroups, the margin of sampling error may be higher.