KFF designs, conducts and analyzes original public opinion and survey research on Americans’ attitudes, knowledge, and experiences with the health care system to help amplify the public’s voice in major national debates.
KFF’s Kaiser Health News and “This American Life” Team Up for a Chilling Account of the Threats and Menace Upending the Lives of Local Health Officials
In the course of the pandemic, health officers have become the face of local government authority. And, in turn, many have become targets for the rage and resentment of some of the same loose-knit militia and white nationalist groups that stormed the U.S. Capitol in January, smashing windows, bloodying officers and savagely chanting “Hang Mike Pence.”
Kaiser Health News joined forces with the iconic public radio team at This American Life to chronicle this disturbing trend through the lens of California’s Santa Cruz County. The county, though widely viewed as liberal and progressive, saw an escalating succession of threats, capped by the cold-blooded killing of a sheriff’s deputy, that have upended the lives of health leaders trying to navigate the covid response.
KHN senior correspondent Anna Maria Barry-Jester tells the story of Dr. Gail Newel, Santa Cruz County’s health officer, and her boss, Mimi Hall, the county’s health services director, who have soldiered on as legitimate debate over their covid-related public health orders has devolved into vitriol and sinister intimidation. Their daily routines now incorporate security patrols, surveillance cameras and, in some cases, personal firearms.
They are public servants who no longer feel safe in public.
This is KHN’s first collaboration with This American Life. It follows similar partnerships with the investigative public radio team at Reveal and St. Louis Public Radio.
Listen to the This American Life audio story, entitled “The Herd,” here. And read KHN’s companion digitalstory here.
About KFF and KHN
KHN (Kaiser Health News) is a national newsroom that produces in-depth journalism about health issues. Together with Policy Analysis and Polling, KHN is one of the three major operating programs at KFF (Kaiser Family Foundation). KFF is an endowed nonprofit organization providing information on health issues to the nation.
About This American Life
This American Life is an award-winning weekly public radio program and podcast hosted by Ira Glass. It is heard by 2 million listeners each week on over 500 public radio stations in the U.S., with another 2.8 million people downloading each episode as a podcast. The show is produced in collaboration with WBEZ Chicago and delivered to stations by PRX, Public Radio Exchange.
The KFF COVID-19 Vaccine Monitor is an ongoing research project tracking the public’s attitudes and experiences with COVID-19 vaccinations. Using a combination of surveys and qualitative research, this project tracks the dynamic nature of public opinion as vaccine development and distribution unfold, including vaccine confidence and acceptance, information needs, trusted messengers and messages, as well as the public’s experiences with vaccination.
Overview
There has been little research on how essential workers not employed in the health care sector have been impacted by the pandemic and their views on and experiences with COVID-19 vaccines. According to estimates from the latest KFF COVID-19 Vaccine Monitor, these workers make up about three in ten of the total U.S. adult population. These workers are those whose work requires them to work outside of the home during the pandemic, and many of them perform crucial jobs that Americans depend on, such as factory or warehouse work, delivery drivers, construction jobs, school and childcare center workers, retail jobs such as grocery and hardware store clerks among other jobs.
This analysis of the March KFF COVID-19 Vaccine Monitor examines the attitudes of those who identify as essential workers working outside their homes in non-health care settings. Despite many states prioritizing these workers during their vaccine rollouts, when compared to other employed adults these types of essential workers are less eager to get the vaccine right away, and a larger share express opposition to employer mandated vaccination.
Who ARE ESSENTIAL WORKERS?
For this analysis, essential workers are classified as anyone who self-identifies as being required to work full time or part time outside their home during the coronavirus outbreak. This analysis excludes essential workers employed in health care settings, a group discussed in the KFF/Washington Post Frontline Health Care Worker Survey. Essential workers in non-health care settings report working in a variety of different types of jobs including office jobs (16%), factories and warehouses (15%), delivery or transportation jobs (10%), retail (10%), schools and childcare centers (7%), construction (7%), and food service (6%). The remaining essential workers are employed in other settings such as house cleaners, landscapers, plumbers, and home maintenance workers (4%), or working at farm, garden, or agricultural sites (2%).
Compared to employed adults working from their homes, those identifying as essential workers are disproportionately male (63% vs. 52%), of Hispanic ethnicity (22% vs. 13%), and have less than a college degree (74% vs. 41%). Four in ten (39%) in this group also identify as either Republican or Republican-leaning independents compared to about a quarter (26%) of other employed adults.
About one-third (34%) of essential workers say they know someone who has died from the coronavirus and 64% know someone who tested positive for the disease. Another 13% of essential workers report that they themselves tested positive for the coronavirus (compared to 6% of adults employed in non-essential jobs).
Attitudes Towards COVID-19 Vaccination
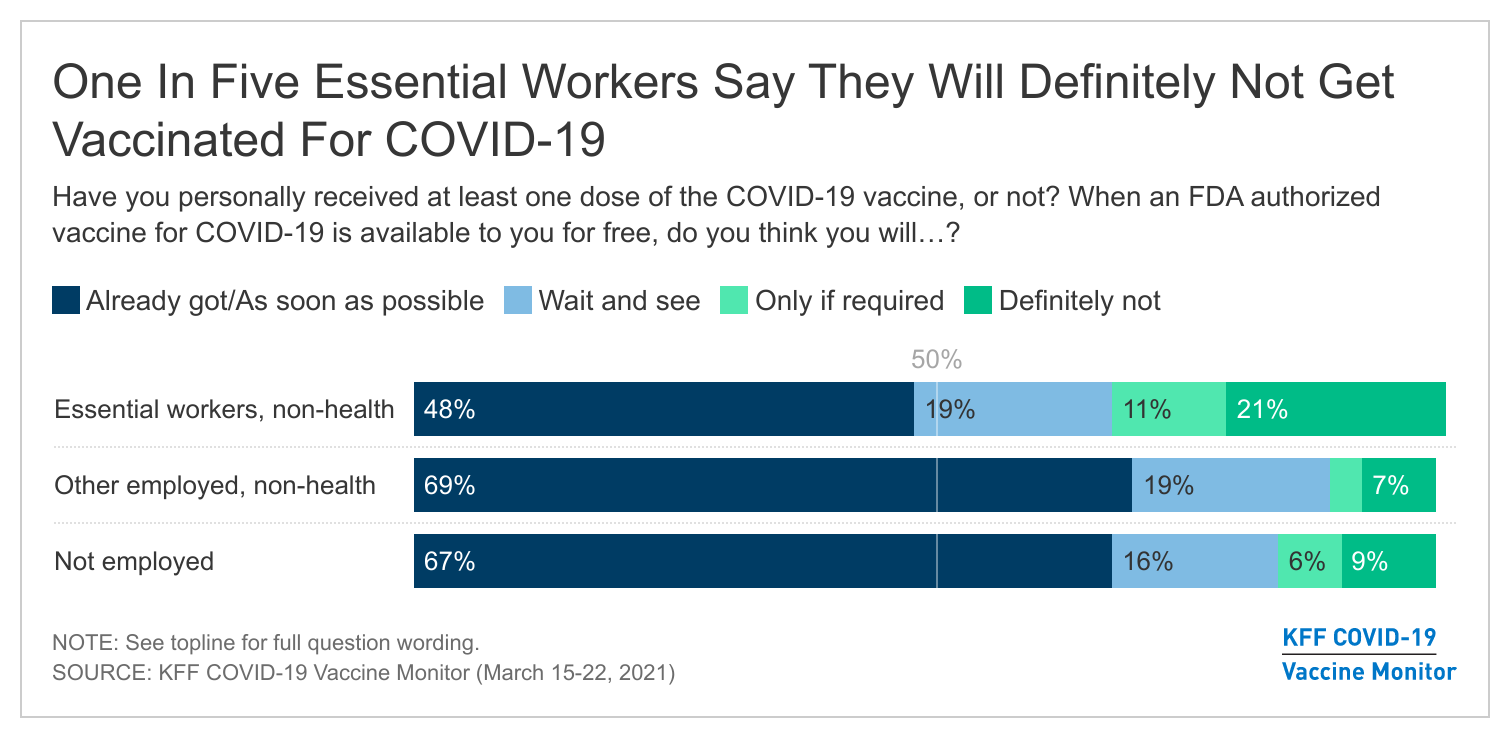
As of mid-March, roughly half (48%) of essential workers say they have already received at least one dose of the COVID-19 vaccine or will get a vaccine as soon as they can. This is a lower share than the nearly 7 in 10 workers employed in other professions (69%) and among adults without jobs (67%), despite the fact that most states prioritized these populations early during vaccine distribution.
About one in five essential workers (19%) say they will “wait and see” how the vaccine is working for others before getting vaccinated themselves, the same share as among those who are employed in non-essential jobs. However, essential workers are more likely than those who are doing their jobs from home to say they will get the vaccine “only if required” (11% vs. 3%) or that they will “definitely not” get vaccinated (21% vs. 7%).
Differences between demographic groups among essential workers
As with the public overall, partisanship plays a role in vaccination intentions among essential workers. Four in ten (40%) of Republican and Republican-leaning essential workers say they will “definitely not” get vaccinated, compared to just 5% of Democratic-leaning essential workers who say the same. Three-fourths (74%) of Democratic or Democratic-leaning essential workers say they’ve already been vaccinated or will get the vaccine as soon as possible compared to about three in ten (29%) Republican or Republican-leaning essential workers. By race and ethnicity, opposition to the vaccine is highest among White essential workers, with about a quarter (26%) saying they will definitely not get the vaccine compared to 7% of Black and 11% of Hispanic essential workers.
Similarly, essential workers’ opinions about the coronavirus vaccine show deep divides by education. Essential workers without college degrees are less likely than college graduates to say they have already gotten the vaccine or will get it as soon as they can. Among those with less than a college degree, 42% say they have already gotten the vaccine or will do so as soon as possible compared to two-thirds (66%) of those with a college education. Across income levels, roughly half (Household income under $40K: 47%, $40K-$89.9K: 48%, $90K+: 47%) of essential workers had already received a vaccine or plan to get one as soon as they can.
Although there are divides among essential workers in their attitudes towards the vaccine by party, race, and education, the demographics of essential workers cannot fully account for the lower enthusiasm for the vaccine among essential workers. A statistical analysis using the technique of multiple regression shows that even after controlling for demographic factors such as party, age, gender, education, race, income, ideology, and experience with contracting the coronavirus, essential workers remain more likely than non-essential workers to say they will “definitely not” get the vaccine. However, this analysis shows among these factors, the strongest predictors of vaccine intentions are party identification and political ideology.
VACCINE CONCERNS, ELIGIBILITY AND INFORMATION ABOUT WHERE TO BE VACCINATED
Among those who are not yet vaccinated and do not plan to get the vaccine as soon as they can, two-thirds (66%) are concerned about the possibility of experiencing serious side effects from the vaccine. In addition, essential workers express several work-related concerns about the COVID-19 vaccine. Majorities of these workers are very or somewhat concerned that they will be required to get vaccinated even if they don’t want to (63%), and about half (53%) are concerned they may have to miss work if they experience side effects from the vaccine.
This analysis also finds that substantial shares of essential workers are not sure where they can be vaccinated or aren’t sure whether they are currently eligible to receive the vaccine. Among unvaccinated essential workers, roughly 3 in 10 (31%) say they do not have enough information about where they will be able to get a vaccine and nearly 4 in 10 (39%) are not sure whether they are currently eligible to receive the vaccine in their state.
Among essential workers, education and income sharply divide understanding of where to get a coronavirus vaccine. Over one-third (37%) of unvaccinated essential workers without a college degree and 7% of college educated workers say they do not know where to get a COVID-19 vaccine. Among lower income essential workers (those with household incomes under $40,000), 45% say they do not have enough information about where they will be able to get a vaccine, compared to one quarter among those with incomes $40,000 and over.
As with knowledge of where to get a vaccine, uncertainty about current eligibility shows stark divides by education, ethnicity, and income. Unvaccinated essential workers without a college education express greater uncertainty about whether they are currently eligible to receive a vaccine, with 44% of essential workers without college educations saying they do not know whether they are eligible compared to 16% of college educated essential workers. Hispanic essential workers who are unvaccinated are also more likely to express doubt about whether they are eligible to receive a vaccine: half (53%) of unvaccinated Hispanic workers do not know whether they are eligible compared to three in ten (31%) unvaccinated White essential workers. A higher share of low-income essential workers are not sure whether they are eligible to receive the vaccine than essential workers with higher incomes; a 58% majority of those with household incomes under $40,000 are not sure whether they are eligible, compared to three in ten (30%) essential workers in households earning $40,000 or more. Uncertainty about vaccine eligibility may be mitigated moving forward now that all people ages 16 and older are eligible to receive a vaccine nationwide as of April 19.
Employer policies THAT MIGHT INCREASE VACCINATION UPTAKE
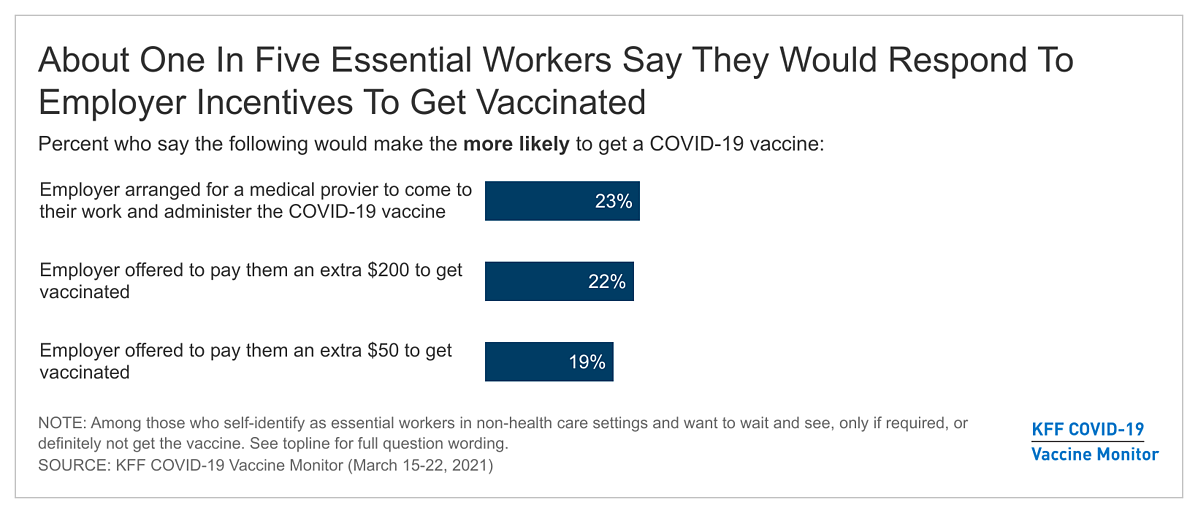
The latest COVID-19 Vaccine Monitor tested several policies that employers could implement to increase vaccination uptake among their workers. The hypothetical policies tested may be helpful to convert some unvaccinated essential workers to getting vaccinated. For example, roughly one-quarter (23%) of essential workers who are not convinced to get vaccinated right away say they would be more likely to get the vaccine if a medical provider came to their work to administer the shot.
Financial incentives also may convince some essential workers to get the vaccine. About one in five (19%) non-health essential workers who are not yet convinced to get the vaccine as soon as possible say they would be more likely to get the vaccine if their employer offered them $50 to get it, a share that increased slightly to 22% if the incentive was raised to $200.
EMPLOYER MANDATED VACCINATION
A 57% majority of non-health care essential workers say employers should not be allowed to require certain employees to get vaccinated for COVID-19. Opposition among essential workers is higher than among non-essential workers (42%) and those who are not currently employed (36%). Currently, employers can mandate vaccinations for their employees except under specific circumstances that conflict with federal law. However, a number of states have pending legislation that address vaccine mandates which may limit employer mandated vaccination on a state-by-state basis.
Views on employer mandates are divided along partisan lines among essential workers as they are among the general public. Nearly 8 in 10 (79%) Republican and Republican leaning essential workers oppose employer required vaccinations while about two-thirds (65%) of Democratic leaning workers support such mandates.
Methodology
This KFF COVID-19 Vaccine Monitor was designed and analyzed by public opinion researchers at the Kaiser Family Foundation (KFF). The survey was conducted March 15-22, 2021, among a nationally representative random digit dial telephone sample of 1,862 adults ages 18 and older (including interviews from 476 Hispanic adults and 490 non-Hispanic Black adults), living in the United States, including Alaska and Hawaii (note: persons without a telephone could not be included in the random selection process). Phone numbers used for this study were randomly generated from cell phone and landline sampling frames, with an overlapping frame design, and disproportionate stratification aimed at reaching Hispanic and non-Hispanic Black respondents. Stratification was based on incidence of the race/ethnicity subgroups within each frame. Specifically, the cell phone frame was stratified as: (1) High Hispanic: Cell phone numbers associated with rate centers from counties where at least 35% of the population is Hispanic; (2) High Black: Cell phone numbers associated with remaining rate centers from counties where at least 35% of the population is non-Hispanic Black; (3) Else: numbers from all remaining rate centers. The landline frame was stratified as: (1) High Black: landline exchanges associated with Census block groups where at least 35% of the population is Black; (2) Else: all remaining landline exchanges. The sample also included 190 respondents reached by calling back respondents that had previously completed an interview on the KFF Health Tracking Poll at least nine months ago. Another 402 interviews were completed with respondents who had previously completed an interview on the SSRS Omnibus poll (and other RDD polls) and identified as Hispanic (n = 178; including 63 in Spanish) or non-Hispanic Black (n=224). Computer-assisted telephone interviews conducted by landline (356) and cell phone (1,506, including 1,093 who had no landline telephone) were carried out in English and Spanish by SSRS of Glen Mills, PA. To efficiently obtain a sample of lower-income and non-White respondents, the sample also included an oversample of prepaid (pay-as-you-go) telephone numbers (25% of the cell phone sample consisted of prepaid numbers) Both the random digit dial landline and cell phone samples were provided by Marketing Systems Group (MSG). For the landline sample, respondents were selected by asking for the youngest adult male or female currently at home based on a random rotation. If no one of that gender was available, interviewers asked to speak with the youngest adult of the opposite gender. For the cell phone sample, interviews were conducted with the adult who answered the phone. KFF paid for all costs associated with the survey.
The combined landline and cell phone sample was weighted to balance the sample demographics to match estimates for the national population using data from the Census Bureau’s 2019 U.S. American Community Survey (ACS), on sex, age, education, race, Hispanic origin, and region, within race-groups, along with data from the 2010 Census on population density. The sample was also weighted to match current patterns of telephone use using data from the January- June 2020 National Health Interview Survey and to adjust for non-response bias, predominantly in the callback sample frames, on health insurance coverage, registered voter status, age, and reported vaccination rates (based on the non-callback RDD sample). The weight takes into account the fact that respondents with both a landline and cell phone have a higher probability of selection in the combined sample and also adjusts for the household size for the landline sample, and design modifications, namely, the oversampling of prepaid cell phones and likelihood of non-response for the re-contacted sample. All statistical tests of significance account for the effect of weighting.
The margin of sampling error including the design effect for the full sample is plus or minus 3 percentage points. Numbers of respondents and margins of sampling error for key subgroups are shown in the table below. For results based on other subgroups, the margin of sampling error may be higher. Sample sizes and margins of sampling error for other subgroups are available by request. Note that sampling error is only one of many potential sources of error in this or any other public opinion poll. Kaiser Family Foundation public opinion and survey research is a charter member of the Transparency Initiative of the American Association for Public Opinion Research.
This work was supported in part by grants from the Chan Zuckerberg Initiative DAF (an advised fund of Silicon Valley Community Foundation), the Ford Foundation, and the Molina Family Foundation. We value our funders. KFF maintains full editorial control over all of its policy analysis, polling, and journalism activities.
There has been little research on how essential workers not employed in the health care sector have been impacted by the pandemic and their views on and experiences with COVID-19 vaccines. The latest KFF COVID-19 Vaccine Monitor report finds that this group of workers – roughly 3 in 10 of all adults who have been required to work outside their homes during the pandemic – are less enthusiastic about getting vaccinated than other adults.
As of mid-March, nearly half (48%) of non-health care essential workers said they had received at least one dose of the COVID-19 vaccine or will get a vaccine as soon as they can – fewer than the share among those who work from home (69%) and among adults who aren’t working (67%). Non-health care essential workers are also more likely than those who work from home to say they will get the vaccine “only if required” (11% vs. 3%) or that they will “definitely not” get vaccinated (21% vs. 7%).
These differences in enthusiasm in part reflect the underlying demographics of the two groups.
Compared to employed adults working from their homes, those identifying as essential workers are less likely to have a college degree (26% vs. 59%) and are more likely to identify as Republican or Republican-leaning independents (39% vs. 26%). People without a college degree and those who are or lean Republican in general are more likely to be resistant to getting a vaccine than their counterparts, though even after accounting for these and other demographic factors, essential workers are more likely than other adults to say they won’t get vaccinated.
Among essential workers who are not already vaccinated or planning to do so as soon as possible, two thirds (66%) say they worry about experiencing serious side effects, and about half (53%) are concerned they may have to miss work if they experience side effects from the vaccine.
The analysis finds employers could encourage some of these workers to get a vaccine through incentives. About 1 in 5 say they would be more likely to get vaccinated if their employer arranged for a health care provider to administer the vaccine at work (23%), or if their employer offered to pay them an extra $50 (19%) or $200 (22%) to get vaccinated.
Overall, most non-health care essential workers (57%) say that employers should not be allowed to require their workers to get vaccinated, compared to 42% of workers employed in other types of non-healthcare jobs.
The issue divides along partisan lines. Among non-health essential workers, those who identify as Republican or lean that way overwhelmingly say employers should not be allowed to mandate their workers get vaccinated (79%), while two thirds (65%) of Democrats and Democratic leaners say they should be able to do so.
Designed and analyzed by public opinion researchers at KFF, the KFF Vaccine Monitor survey was conducted from March 15-22 among a nationally representative random digit dial telephone sample of 1,862 adults, including oversamples of adults who are Black (490) or Hispanic (476). Interviews were conducted in English and Spanish by landline (356) and cell phone (1,506). The margin of sampling error is plus or minus 6 percentage points for results based on the sample of 477 essential workers. For results based on subgroups, the margin of sampling error may be higher.
The KFF COVID-19 Vaccine Monitor is an ongoing research project tracking the public’s attitudes and experiences with COVID-19 vaccinations. Using a combination of surveys and qualitative research, this project tracks the dynamic nature of public opinion as vaccine development and distribution unfold, including vaccine confidence and acceptance, information needs, trusted messengers and messages, as well as the public’s experiences with vaccination.
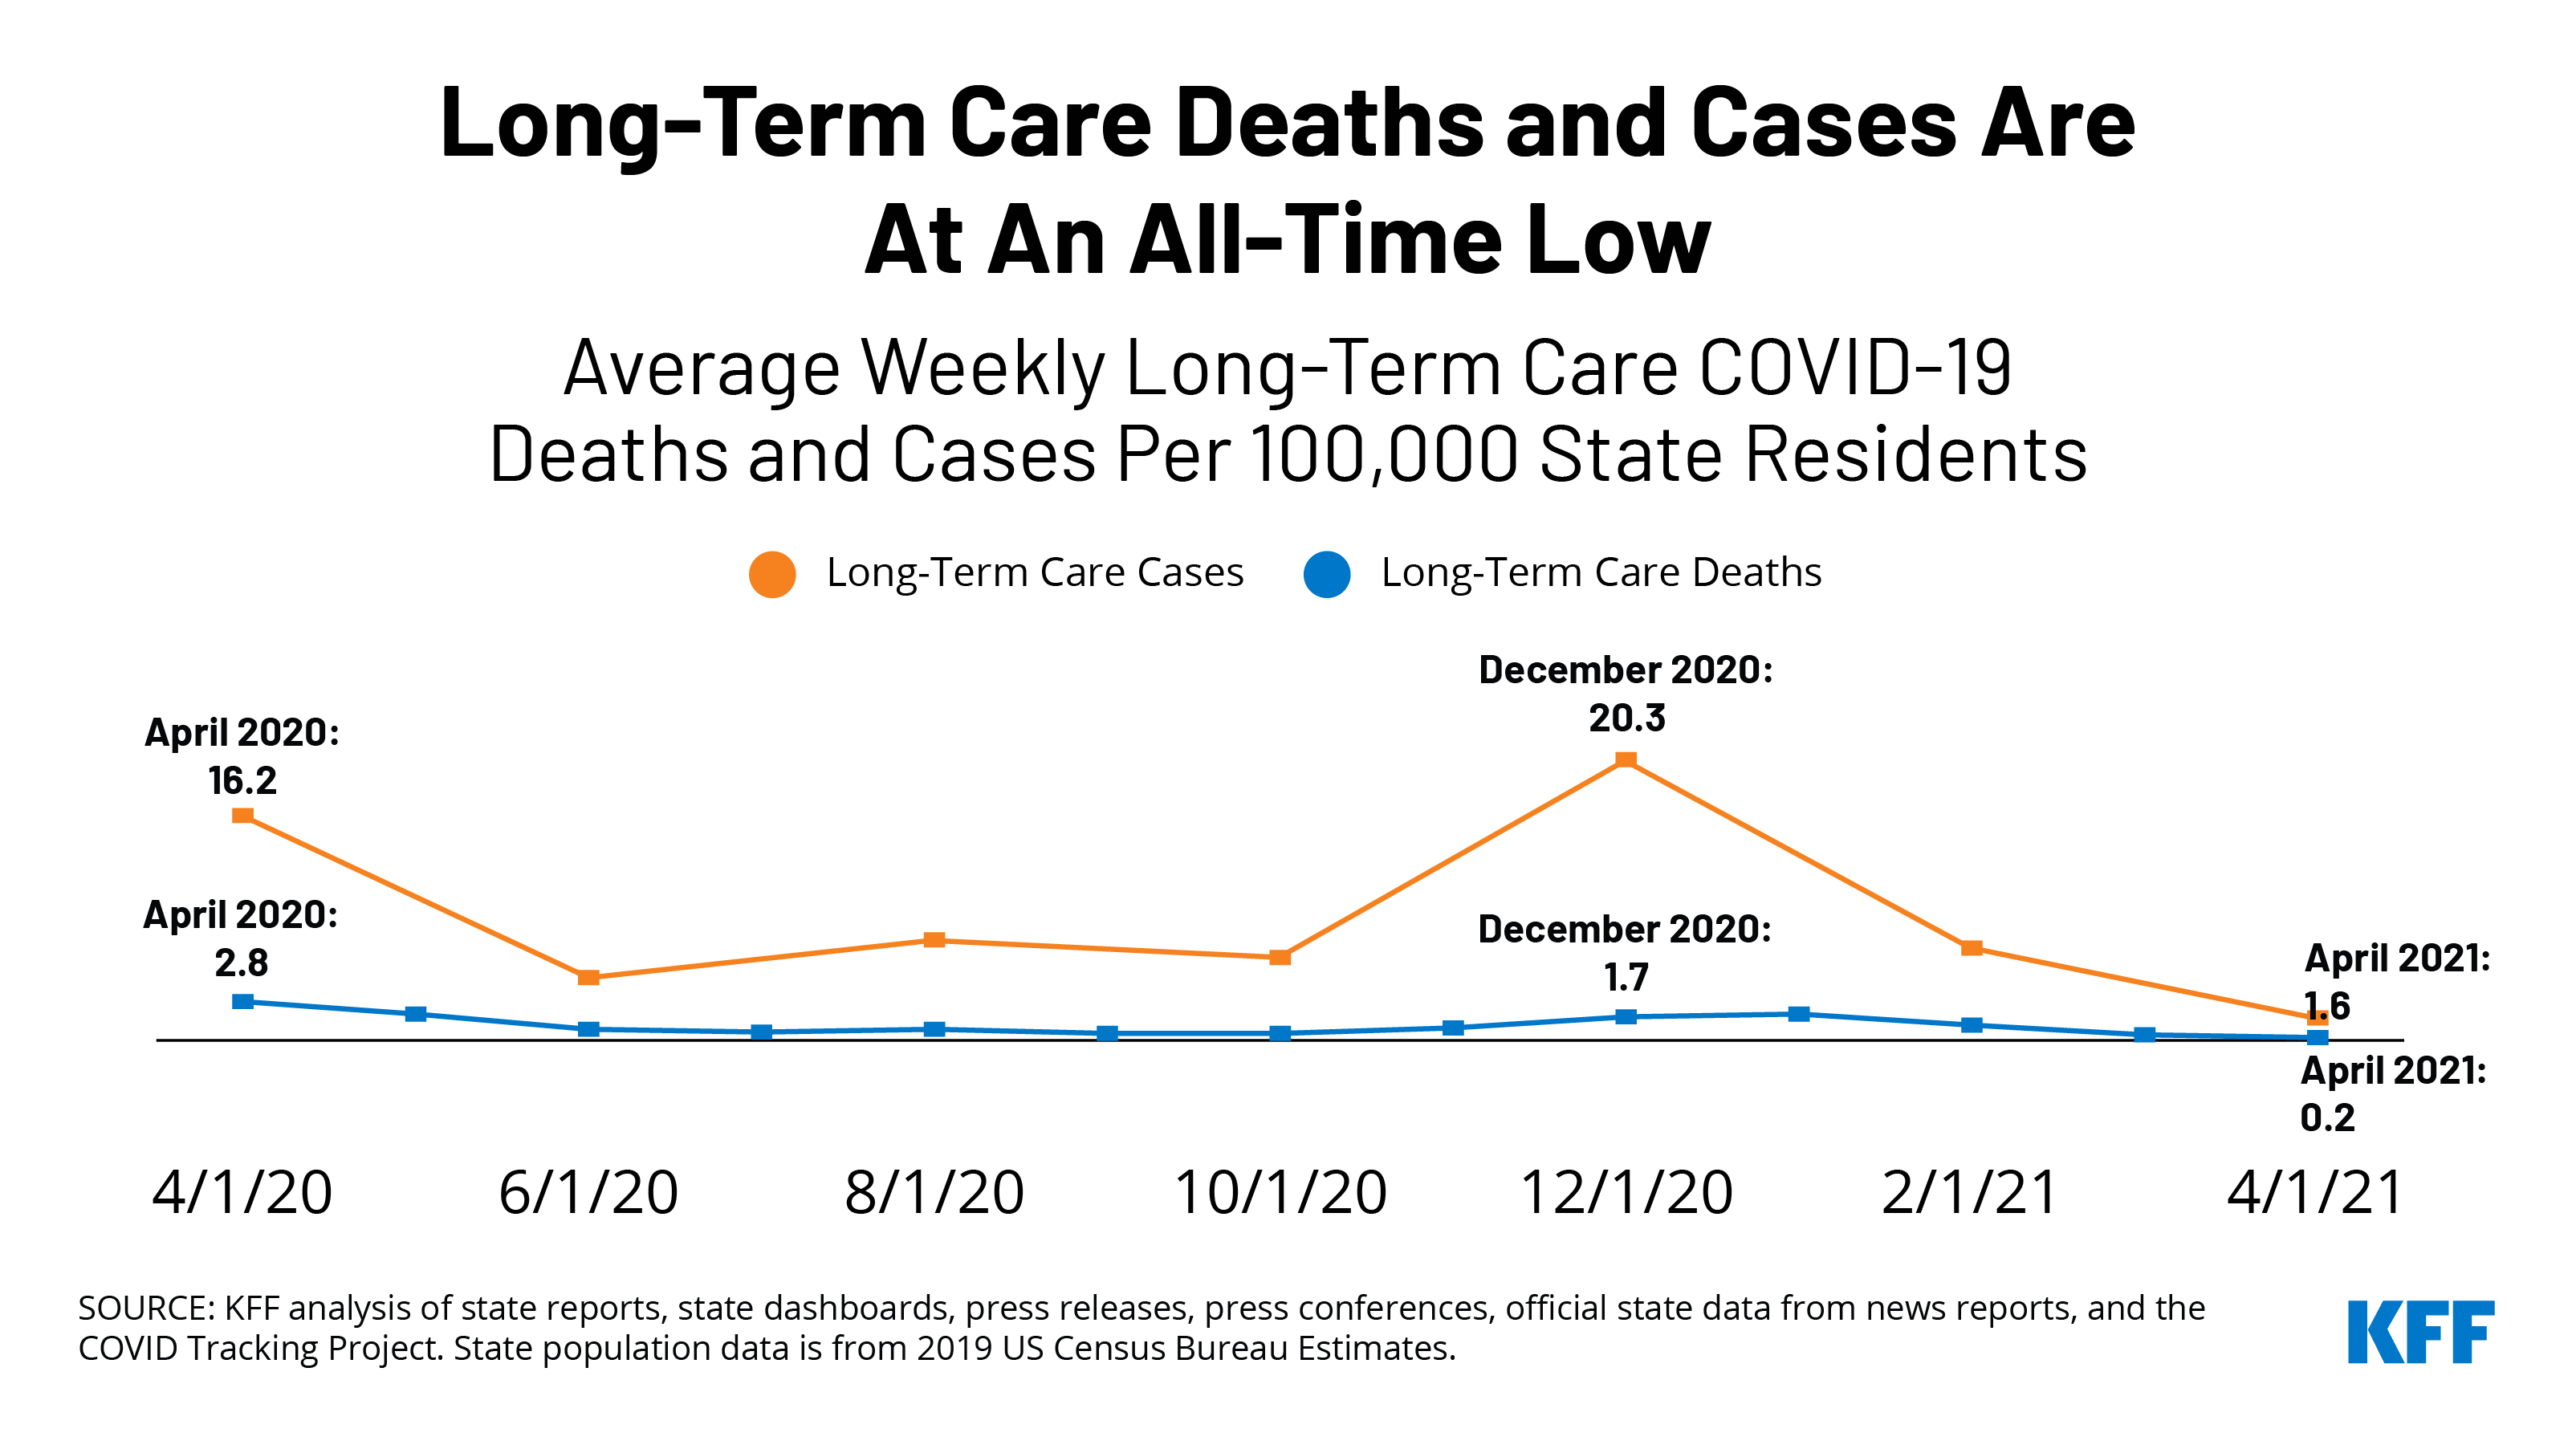
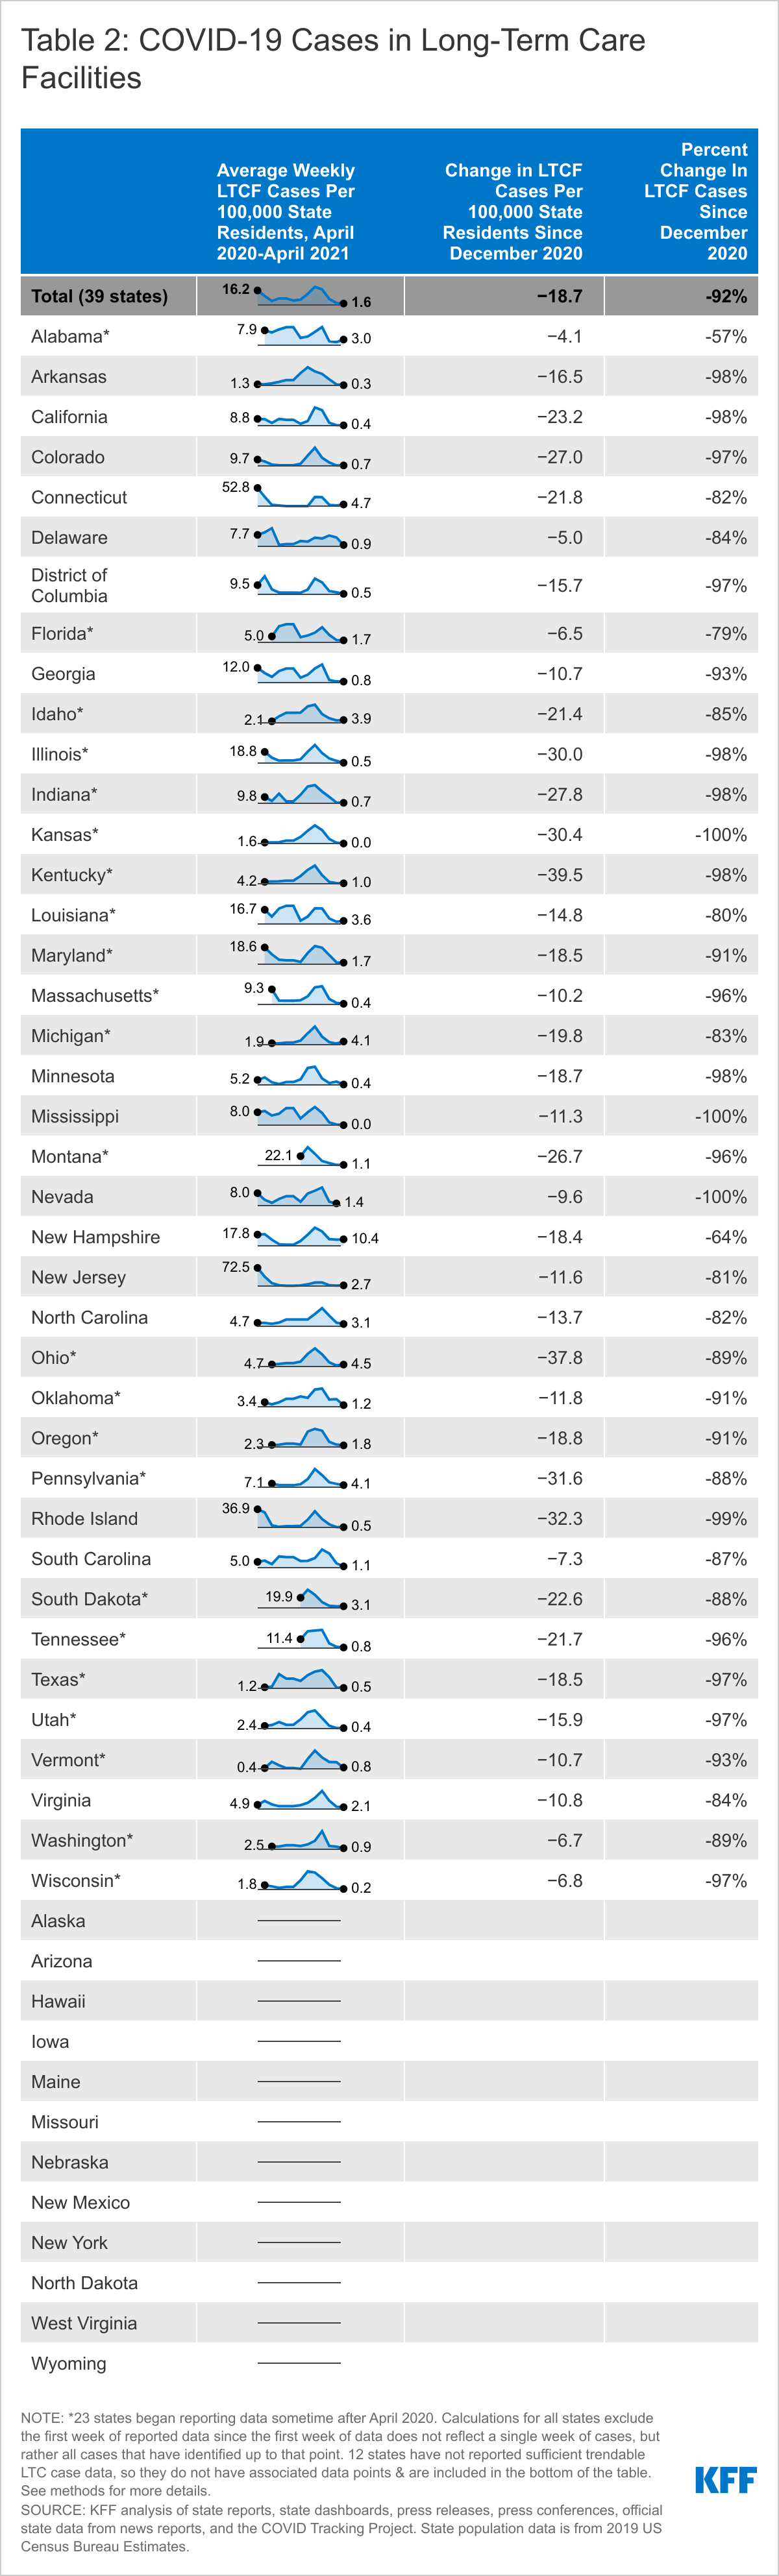
COVID-19 deaths and cases among residents and staff of long-term care facilities have fallen dramatically since vaccinations began in December, with deaths declining by nearly 89 percent and cases declining by nearly 92 percent as of April 2021, according to a new KFF analysis.
COVID-19 deaths in long-term care settings fell from 1.7 deaths per 100,000 state residents in December to just 0.2 deaths per 100,000 state residents in April, an all-time low, the analysis finds.
By mid-April, about a third (34%) of all COVID-19 deaths were in long-term care facilities, down from a peak of nearly half (49%) in June 2020 and 42 percent around the time that long-term care residents and staff began receiving vaccines in late December.
Similarly, average new weekly cases in long-term care facilities were just 1.6 per 100,000 state residents in April, also an all-time low, compared to a peak of 20.3 in December 2020 across the 39 states (38 states plus DC) for which trend data is available.
Not all the news is good. Eight states experienced a rise in COVID-19 cases in long-term care facilities between March and April 2021. The increases ranged from a 6 percent uptick in New Hampshire to a more than 150 percent jump in Connecticut and Michigan. Such increases may be reflective of increased COVID-19 cases and community spread in such states overall, often attributed to rising infections among younger people due to “pandemic fatigue.”
No states reported increases in both cases and deaths in long-term care settings between March and April, so it remains to be seen whether recent increases in cases in a few states will lead to increases in deaths.
For more data and analyses about COVID-19 and long-term care settings, visit kff.org.
Since December 2020, the US has fully vaccinated over 1.4 million residents in long-term care facilities (LTCF) and over 1 million LTCF staff. Since then, weekly deaths in nursing homes have continued to fall, much of which has been attributed to the high rates of vaccination among nursing home residents. LTCFs include a range of facilities, including nursing homes, assisted living facilities, and other congregate care facilities for people with disabilities or older adults. This data note looks at state-reported LTCF data from 41 states plus Washington DC to assess what has happened to new deaths and cases in LTCFs in the four months since vaccinations began on December 21st, 2020. We also examine how recent changes in deaths and cases in LTCFs have shifted the nature of the pandemic outside of LTCFs. Data in this analysis is as of the week of April 11th, 2021. See methods for more details.
COVID-19 Deaths in Long-Term Care Facilities
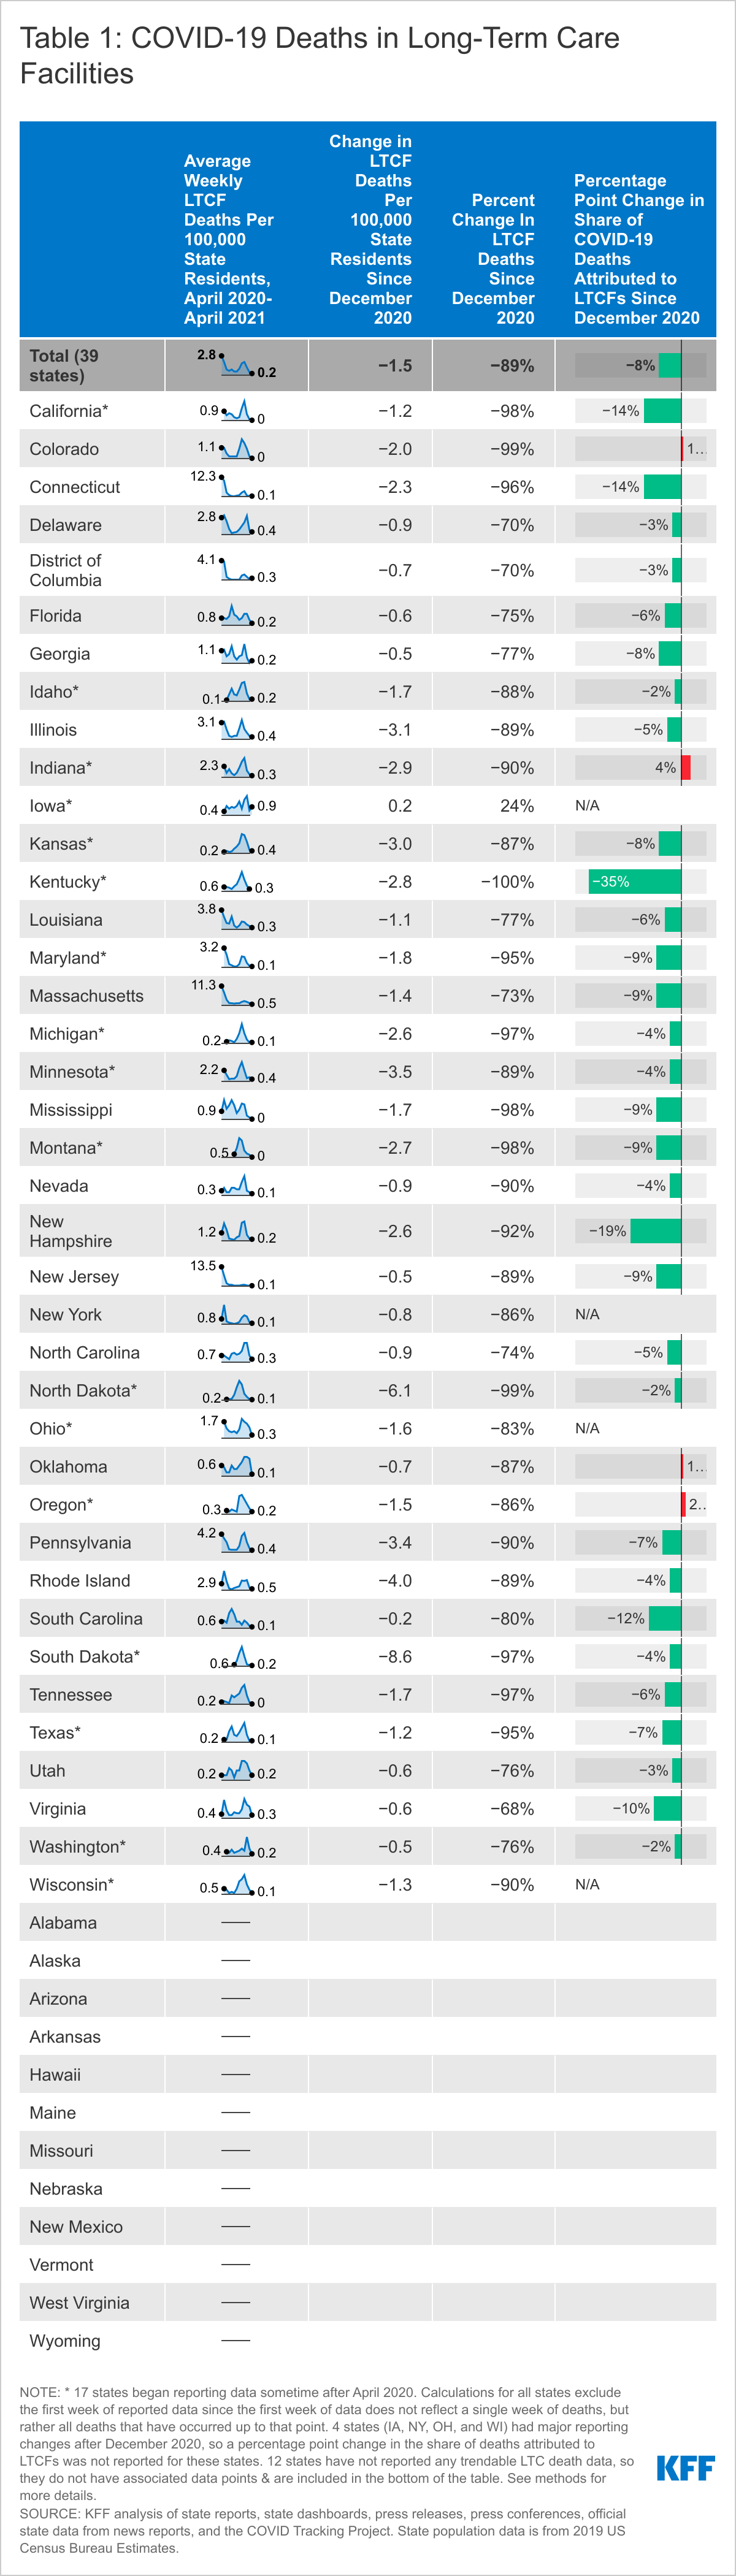
Of the 39 states (38 states plus DC) for which we can trend COVID-19 deaths in LTCFs, 21 states reported an all-time low death rate in April 2021. Five states reported zero LTCF deaths per 100,000 state residents in April 2021, a rounded value that represents a very small number of LTCF deaths in those states (Table 1 and Appendix Table 1). Across all states analyzed, LTCF deaths per 100,000 state residents hit an all-time low of 0.2 deaths per 100,000 state residents in April 2021, a steep decrease from the peak of 2.8 deaths per 100,000 US residents in April 2020 and a rate of 1.9 per 100,000 as vaccinations were being rolled out in January 2021. California, Colorado, Mississippi, Tennessee, and Montana reported zero LTCF deaths per 100,000 state residents in April 2021. This is a rounded value that represents a small number of LTCF deaths in those states. Of the 17 states that did not report the lowest number of LTCFs deaths per 100,000 in April 2021 over the course of the pandemic, 13 reported the lowest rate in April since vaccinations began in December 2020. These 17 states reported an average rate of 2.1 deaths per 100,000 in January 2021, which declined to 0.3 deaths per 100,000 in April 2021. See Appendix Table 1 for detailed data.
Since vaccinations began in mid-December 2020, the number of COVID-19 deaths in LTCFs across all states in this analysis has declined by 89% as of April 2021, from 1.7 deaths per 100,000 state residents to 0.2 deaths per 100,000 state residents (Table 1 and Appendix Table 1). Percent decline is calculated by taking the difference between average weekly deaths in December 2020 and average weekly deaths in April 2021 and dividing that difference by the average weekly deaths in December 2020. Among the 39 states for which we can trend COVID-19 deaths between December 2020 and April 2021, 38 states reported a decline in deaths per 100,000 state residents, ranging from a decline of 68% in Virginia to 100% in Kentucky, with an average drop of 84%. Iowa was the only state that reported higher average weekly LTCF deaths in April 2021 than December 2020 (24% increase). It is possible that this number reflects unknown reporting changes or data reconciliation, especially because the trend in Iowa has been unstable, with increases and decreases reported since October 2020. Notably, Iowa’s LTCF deaths per 100,000 was lower in April 2021 than January and February 2021.
Both nationally and in most states, the share of deaths attributed to LTCFs has dropped since the start of vaccinations in December 2020 (Table 1), indicating a faster decline in death rates in LTCFs than in the community. To a large extent, deaths due to COVID-19 have been concentrated in LTCFs throughout the pandemic.Previous analysis indicates that the share of COVID-19 deaths attributed to LTCFs peaked in June 2020, when about 49% of all COVID-19 deaths in the US were in LTCFs. Since then, the share of deaths attributed to LTCFs dropped slowly to 42% for the week of December 20th, 2020, when LTCF residents began receiving vaccines. By mid-April, 2021, LTCFs accounted for 34% of total, cumulative COVID-19 deaths, an eight-percentage point drop since the start of vaccinations. This pattern held in most states. However, four states reported a higher share of deaths in LTCFs in April 2021 compared to December 2020 (CO, IN, OK, OR). Increases in these states were modest, ranging from one to four percentage points, reflecting a slightly faster decrease in community deaths than LTCF deaths.
COVID-19 Cases in Long-Term Care Facilities
Similar to LTCF deaths, average new weekly cases in LTCFs hit an all-time low in April 2021, with two states (Kansas and Mississippi) reporting zero new LTCF cases per 100,000 state residents that month (Table 2 and Appendix Table 2). Across the 39 states (38 states plus DC) included in this analysis, average new weekly cases in LTCFs were just 1.6 per 100,000 in April 2021, compared to a peak of 20.3 in December 2020. Of the 39 states, 28 states reported the lowest average weekly new case rate in April 2021 since the start of the pandemic. Of the remaining 11 states, 3 reported the lowest average weekly rate in April 2021 since vaccinations began in December 2020. See Appendix Table 2 for detailed data.
New cases in LTCFs dropped by 92% between December 2020 and April 2021, a pattern that is reflected in state-level data as well (Table 2 and Appendix Table 2). Nearly all states (36 of 39 states) included in the analysis reported a greater than 80% drop in LTCF cases in this time period. The remaining three states reported a drop of greater than 50%.
Reflecting a potentially troubling trend of increasing community spread, eightstates reported increases in LTCF cases from March to April 2021 (Table 2 and Appendix Table 2). These increases ranged from a 6% increase in New Hampshire to over 150% in Connecticut and Michigan. The other five states that saw increases from March to April 2021 were Idaho (9%), Louisiana (31%), New Jersey (36%), Ohio (78%), and Alabama (81%). These increases may be a result of increased cases in the state overall, which has been attributed to rising infections among younger people due to “pandemic fatigue” and the rise of the B.1.1.7 variant. Research suggests a strong connection between increased cases in the community and increased cases in LTCFs. None of the states reported both an increase in LTCF cases and deaths between March and April 2021, so it remains to be seen whether these increased LTCF cases will lead to increased LTCF deaths.
Methods
This analysis is based on data as of the week of April 11th, 2021 from 41 states plus Washington DC, for a total of 42 states. The remaining nine states were excluded because they do not directly report data on cases and deaths in long-term care facilities, their data is sourced from sporadically released media reports, or there were data quality or availability issues in trending data over time.
For example, some states have periodically reconciled their data, leading to large jumps that reflect reporting and data quality rather than actual cases or deaths.
Within the 42 states included in this analysis, we were able to trend long-term care cases in 38 states plus DC and deaths in 38 states plus DC. We included states for which we could reliably trend at least six months of data, using the earliest reliable period reported in the state as the starting point for that state’s trend.
States vary in which facilities they include in LTCF reporting and whether they include residents and staff in case and death counts. For all states, we trended the subset of facilities and populations that provide the longest reliable trend line. For example, our data for Delaware excludes staff cases because that data was not reported consistently; in Michigan, this analysis excludes cases and deaths in Adult Foster Care facilities since these cases and deaths were only added for recent weeks. For this reason, this analysis should not be used to identify state-level or national data on total long-term care cases and deaths. The most recent data on total cases and deaths in long-term care facilities can be located here. See below for details on how each indicator in the Tables and Appendix were calculated.
Average Weekly Long-Term Care Deaths/Cases Per 100,000 State Residents:
These data represent trends in long-term care deaths and cases in states overtime in the context of total state population. Total state population data is from 2019 estimates from the US Census Bureau. The first week of available long-term care data for each state was not included in this analysis since the first week of data does not reflect a single week of deaths and cases, but rather all deaths and cases that have occurred up to that point. New deaths and cases were calculated for each week thereafter, and then averaged for all of the weeks within the month. Weeks where states reported large increases or any decreases due to reporting changes or data reconciliation were not included in the calculations of monthly averages. These average new deaths and cases were converted to represent deaths and cases per 100,000 state residents to allow for easier comparison across states. Totals for each table were calculated by dividing total new deaths and new cases per month by the total state populations for the states represented in each month of data and converting values to represent totals per 100,000 state residents.
Change in Average Weekly LTCF Deaths/Cases Per 100,000 State Residents Since December 2020:
The change in LTCF deaths and cases per 100,000 state residents since December 2020 was calculated by taking the difference between the new LTCF deaths/cases in April 2021 and December 2020.
Percent Change In LTCF Deaths/Cases Since December 2020:
Percent change is calculated by taking the difference between average weekly deaths in December 2020 and average weekly deaths in April 2021 and dividing that difference by the average weekly deaths in December 2020.
Percentage Point Change in Share of COVID-19 Deaths Attributed to LTCFs Since December 2020:
This value was calculated by calculating the share of deaths attributed to long-term care facilities the week of December 20th, 2020 and subtracting this from the share of deaths attributed to long-term care facilities the week of April 11th, 2021. Shares of deaths were calculated by dividing total long-term care COVID-19 deaths by total COVID-19 deaths in the state at that time. Total deaths for each time period was pulled from KFF COVID tracker. This indicator is not calculated for Iowa, New York, Ohio, or Wisconsin since those states had major increases or decreases in reported deaths after December 20th, 2020. Any changes in the share of deaths between December 2020 and April 2021 would have been impacted by these major reporting changes and would not have accurately reflected the pandemic’s evolving impact on long-term care facilities.
This analysis relies on state-reported data instead of federal data since federal data does not include non-nursing home settings. COVID-19 has disproportionately impacted all types of long-term care settings, such as assisted living facilities and group homes. Thus, the state-reported data is more likely to capture the full burden of deaths in long-term care facilities. Additionally, federal data cannot be trended from March-May 2020, and therefore misses early months of the pandemic when there were outbreaks in LTCFs.
A new KFF issue brief explores several potential policy options that would help close the Affordable Care Act’s “coverage gap,” including providing further new incentives for states to expand Medicaid, creating a new “public option” or extending ACA Marketplace premium subsidies to low-income people who don’t currently qualify for federal help.
At stake is affordable health coverage for 2.2 million uninsured people with incomes below the federal poverty level ($12,880 annually for an individual in 2021), who currently do not qualify for either their state’s Medicaid program or federal premium subsidies in the ACA marketplace. As of April 2021, 12 states have not adopted the ACA’s Medicaid expansion to provide coverage to adults with incomes through 138% of poverty.
President Biden proposed the public option approach during the 2020 campaign and is expected to soon release his American Families Plan proposal that could include a provision to address the coverage gap.
The KFF brief also explores the challenges and budgetary cost considerations of the potential options to expand coverage, all of which are likely to increase federal spending and could require offsets through other proposals that produce savings.
As of April 2021, 12 states have not adopted the Affordable Care Act (ACA) provision to expand Medicaid to adults with incomes through 138% of poverty. In these states, 2.2 million uninsured people with incomes under poverty fall in the “coverage gap” and do not qualify for either Medicaid or premium subsidies in the ACA marketplace (See Appendix Table). An additional 1.8 million uninsured adults in these states are currently eligible for marketplace coverage (because their incomes are between 100% and 138% of poverty level) but would be eligible for Medicaid if their state expanded.
The federal government covers 90% of the cost of Medicaid coverage for adults covered through the ACA expansion, a higher share than it does for other Medicaid enrollees. The American Rescue Plan Act (ARPA) enacted in March 2021 includes an additional temporary fiscal incentive for states to newly implement the ACA Medicaid expansion, and KFF analysis shows that all non-expansion states would actually save money for two years by newly expanding. The incentive would be available for two years following expansion, but there is no time limit for states to take up the option. It is unclear which states, if any, may take advantage of the new option, which has prompted discussion about whether further steps could be taken to guarantee coverage to people in the gap in President Biden’s forthcoming American Families Plan.
President Biden proposed during the campaign that a public option insurance plan would be broadly available and automatically enroll people in the coverage gap, but such a plan would be difficult to pass in a closely divided Congress. This issue brief examines some of the other options policymakers may consider to extend coverage to people in the gap, including increased fiscal incentives for states, a narrower public option, and making people with incomes below the poverty level eligible for enhanced ACA premium subsidies.
What are leading options to provide coverage for people in the coverage gap?
Add More Financial Incentives for Medicaid Expansion
Additional incentives for non-expansion states generally include increases to the expansion match rate or other broader fiscal incentives for expansion states. In addition to the APRA, which included a two-year, 5-percentage point increase in the federal matching rate for traditional (non-ACA) enrollees, policies could increase the expansion match rate. For example, the policy could allow new expansion states to receive the three years of 100% federal matching dollars, as was available to states that had implemented in 2014, or could increase the current expansion match rate (e.g., to 95%) more broadly to all expansion states (new and current expansion states). Alternatively, policies could provide additional financial incentives for all expansion states that increase the opportunity cost of not expanding (e.g., an increase in the traditional match rate) or could create financial disincentives to not expanding (e.g., a decrease in the traditional match rate or limits on disproportionate share hospital payments (DSH) or uncompensated pool funds).
Policies to encourage non-expansion states to cover people in the coverage gap build on the existing Medicaid infrastructure in those states. As with other states that have adopted the expansion, expansion builds on existing Medicaid provider networks, health plans, and eligibility systems, as well as existing mechanisms to draw down federal funds for coverage. Coverage offered through Medicaid is designed to be affordable for people with low incomes. Medicaid generally prohibits premiums and deductibles and limits cost-sharing to nominal amounts, which differs from coverage provided in the Marketplace or other coverage. In addition, there is no open enrollment period for Medicaid, so individuals can enroll at any time, and eligibility is based on monthly income (not projected annual income). Individuals are eligible for Medicaid even if they have an offer of employer coverage, and unlike marketplace coverage, there is no reconciliation at the end of the year to align benefits with actual income.
These options still rely on state action to adopt the expansion. There are already substantial financial incentives for states to expand Medicaid under the ACA; some states have not acted on them largely due to politics or ideology, so it is unclear if additional incentives will impel them to act. Providing additional funding that would benefit only non-expansion states could also create equity issues in federal funds flowing to states that already expanded. For some policies, the legal limits of the federal government’s ability to leverage Medicaid funds to states as an incentive to adopt the ACA expansion is unclear.
Create a Broad or Narrow Public Option
Instead of relying on Medicaid, federal policy makers could create a new public option that would be available broadly or more narrowly targeted for the people in the coverage gap. President Biden campaigned on a “public option,” a new federal public health insurance option, that would be available to all people eligible for marketplace coverage, people with employer coverage, and people who would otherwise be eligible for Medicaid in non-expansion states. For the last group (the coverage gap population), enrollment would be automatic, fully funded by the federal government, premium-free and provide the full scope of Medicaid benefits. Under the Biden campaign proposal, states that have expanded could move Medicaid expansion enrollees into the public option, with a maintenance-of-effort payment from the states. Instead of a broad public option, a narrower option to provide coverage specifically for people in the coverage gap could be developed.
A public option would not depend on states to expand coverage and could be tailored to people with low incomes, but creating a new federal coverage option presents some political, administrative and implementation challenges. Creating a broad or narrow public option would require an infrastructure to set up and administer a new federal health insurance program. For example, it requires resources to set up the plan, set rates, administer or contract with plans to administer benefits, and establish and conduct eligibility and enrollment processes. Even if the new public option plan were administered in conjunction with an existing federal health program (such as Medicare or the Federal Employees Health Benefits Program), there would be a number of design choices, such as whether and how the public option would conform with state insurance regulations; set payment rates for providers and prices for prescription drugs; and enroll providers or contract with health plans. Different choices would have implications for costs, access, and affordability. A broad public option has the potential to deliver coverage at a lower cost than in private insurance by restraining health care prices, but that would also be strongly opposed by the health care industry.
Setting up a narrow public option plan targeted to cover 2.2 million nationwide would still require many policy design choices and could be administratively complex, especially for a relatively small population nationwide. The guarantee of coverage for people with incomes below poverty at full federal cost would almost certainly mean that none of the current non-expansion states would choose to expand in the future. While a maintenance of effort requirement on current expansion states could theoretically prevent current expansion states from dropping the Medicaid expansion and shifting costs to the federal government, such a requirement could be difficult to sustain politically and could face legal challenges. This inequity across states could potentially be addressed through fiscal carrots provided to expansion states, but that would also increase federal costs. Given the limited scope of coverage, a narrow public option would likely be less disruptive to the health care industry than a broad public option.
Expand Eligibility for Marketplace Premium Subsidies
Policy makers could consider an option to extend financial assistance for coverage by extending Marketplace premium subsidies to people in the coverage gap. Under current law, individuals below poverty are generally not eligible for premium subsidies to purchase coverage in the ACA marketplace, with the only exception being authorized immigrants who are ineligible for Medicaid because they have been in the U.S. fewer than five years. One approach to covering people in the coverage gap would be to make them eligible for marketplace premium subsidies. Under the American Rescue Plan – which enhanced ACA premium subsidies for two years – people with incomes below 150% of the poverty level are eligible for a 100% premium subsidy for the second lowest cost silver plan. They are also eligible for cost-sharing reductions that provide them with coverage that has an actuarial value of 94%. This means that, on average, they are responsible for deductibles and copays equal to 6% of their health spending. The average deductible in these reduced cost-sharing plans in 2021 is $149, with an average out-of-pocket limit of $1,189. A policy to cover people in the coverage gap could reduce cost-sharing further for people with income below poverty, comparable to the nominal cost-sharing in Medicaid. It also would be theoretically possible to provide wrap-around benefits for services like nonemergency medical transportation (NEMT) that are covered by Medicaid but not covered in the Marketplace, but there is currently no mechanism for doing so.
Similar to other options, expansion of marketplace subsidies does not depend on state action, but there a number of design challenges for policy makers to consider. A policy to extend marketplace subsidies would expand coverage by building on the existing marketplace structure, which would reduce administrative complexity and could be accomplished relatively quickly and easily. However, there could be some challenges to this structure for people below poverty, depending on how the policy is designed, which would take time to implement.
Unless further cost-sharing reductions and benefit enhancements were included, marketplace plans would have significantly higher cost-sharing and less comprehensive benefits than Medicaid. While provider networks in Medicaid may be more limited than typical employer insurance plans, in some parts of the country the networks in marketplace plans can be even more restrictive. As an entitlement program, Medicaid provides beneficiaries with broader legal protections for accessing care than enrollees in private insurance plans. Unlike Medicaid, eligibility for marketplace premium subsidies is reconciled for the year after the fact based on actual income. Such a reconciliation could be waived for people with incomes below poverty – including the need to file a tax return — but eligibility still requires estimating annual income rather than current income as in Medicaid.
There is some precedent for providing coverage to Medicaid enrollees through the marketplace. For example, in Arkansas, the state buys marketplace coverage for Medicaid expansion enrollees; the state also pays the premium and other cost sharing amounts and provides wrap around coverage. Extending marketplace subsidies to people in the coverage gap raises all of the same potential inequities across states as a public option.
What are the cost considerations for these options?
All options to expand coverage are likely to increase federal spending and could require offsets through other proposals that produce savings. In addition to the specific structure of the policy, cost considerations include:
Distribution of state and federal costs: Cost for Medicaid are shared by states and the federal government, while costs for marketplace subsidies and a public option would be borne entirely by the federal government (and the individual covered, for any premiums or out of pocket costs). Thus, policies that rely on Medicaid may cost less to the federal government, depending on how much of a fiscal incentive might be provided to non-expansion states to encourage them to expand, as well as to current expansion states.
Relative costs of Medicaid versus private coverage: In addition, Medicaid costs per person may be lower than private insurance primarily due to provider payment rates. Coverage costs (for both Medicaid and marketplace coverage) may also vary by state as health care costs and markets vary. For example, premiums in marketplace plans tend to be higher in rural areas with little competition among hospital and plans. The federal government may also face costs if a new option creates an incentive for a current expansion state to drop coverage, leading the federal government to lose the state share of financing. For coverage options that use a new public option, the difference between Medicare rates and private coverage or Medicaid coverage is also a factor.
Enrollment: Lastly, government costs depend in large part on take-up and enrollment in the new option. If there are no adjustments for higher out of pocket costs, enrollment in coverage options through the marketplace could be relatively lower than other approaches. Additionally, enrollment likely depends on outreach, if open enrollment periods apply to the group that could be eligible for Medicaid, and how incomes is counted (monthly or over the course of the year).
What to watch?
Existing and new research continue to show that expanding eligibility for health coverage to people with low incomes reduces the uninsured rate, improves access to and utilization of care, reduces uncompensated care costs, improves affordability of care, and reduces racial and ethnic disparities in coverage. The pandemic has highlighted the importance of access to coverage and challenges with accessing care for uninsured people. President Biden is expected to release the American Families Plan in the near future, which may include proposals to address coverage for people in the coverage gap. Congress may also consider proposals as part of a budget reconciliation bill. In the meantime, some states may move forward with expansion efforts and take advantage of existing incentives under the ARPA, and there are efforts to get expansion on the ballot in Mississippi and South Dakota and other states considering expansion in their legislative sessions. Understanding the tradeoffs that different approaches have for government cost, administrative feasibility, and affordability for low-income people will be helpful in assessing policies as details of specific proposals are released. While alternative approaches to Medicaid expansion could be more expensive for the federal government and offer fewer protections for beneficiaries, they could also guarantee coverage for low-income people now in states that may not choose to expand for many years or at all.
Appendix Table
Uninsured Adults in Non-Expansion States Who Would Be Eligible forMedicaid if Their States Expanded, by Current Eligibility for Coverage, 2019
State
In the Coverage Gap
May Be Eligible for Marketplace Coverage
(<100% FPL)
(100%-138% FPL**)
All States Not Expanding Medicaid
2,188,000
1,800,000
Alabama
127,000
77,000
Florida
415,000
375,000
Georgia
269,000
184,000
Kansas
45,000
37,000
Mississippi
102,000
64,000
North Carolina
212,000
161,000
South Carolina
105,000
84,000
South Dakota
16,000
11,000
Tennessee
118,000
108,000
Texas
771,000
662,000
Wisconsin*
0
30,000
Wyoming
7,000
8,000
NOTES: * Wisconsin provides Medicaid eligibility to adults up the poverty level under a Medicaid waiver. As a result, there is no one in the coverage gap in Wisconsin. ** The “100%-138% FPL” category presented here uses a Marketplace eligibility determination for the lower bound (100% FPL) and a Medicaid eligibility determination for the upper bound (138% FPL) in order to appropriately isolate individuals within the range of potential Medicaid expansions but also with sufficient resources to avoid the coverage gap.
SOURCE: KFF analysis based on 2020 Medicaid eligibility levels and 2019 American Community Survey.
Community health centers are a national network of safety net primary care providers and are a major source of care for many low-income populations and people of color. They have partnered with state and local governments, and more recently, the federal government, to provide vaccines in their communities.
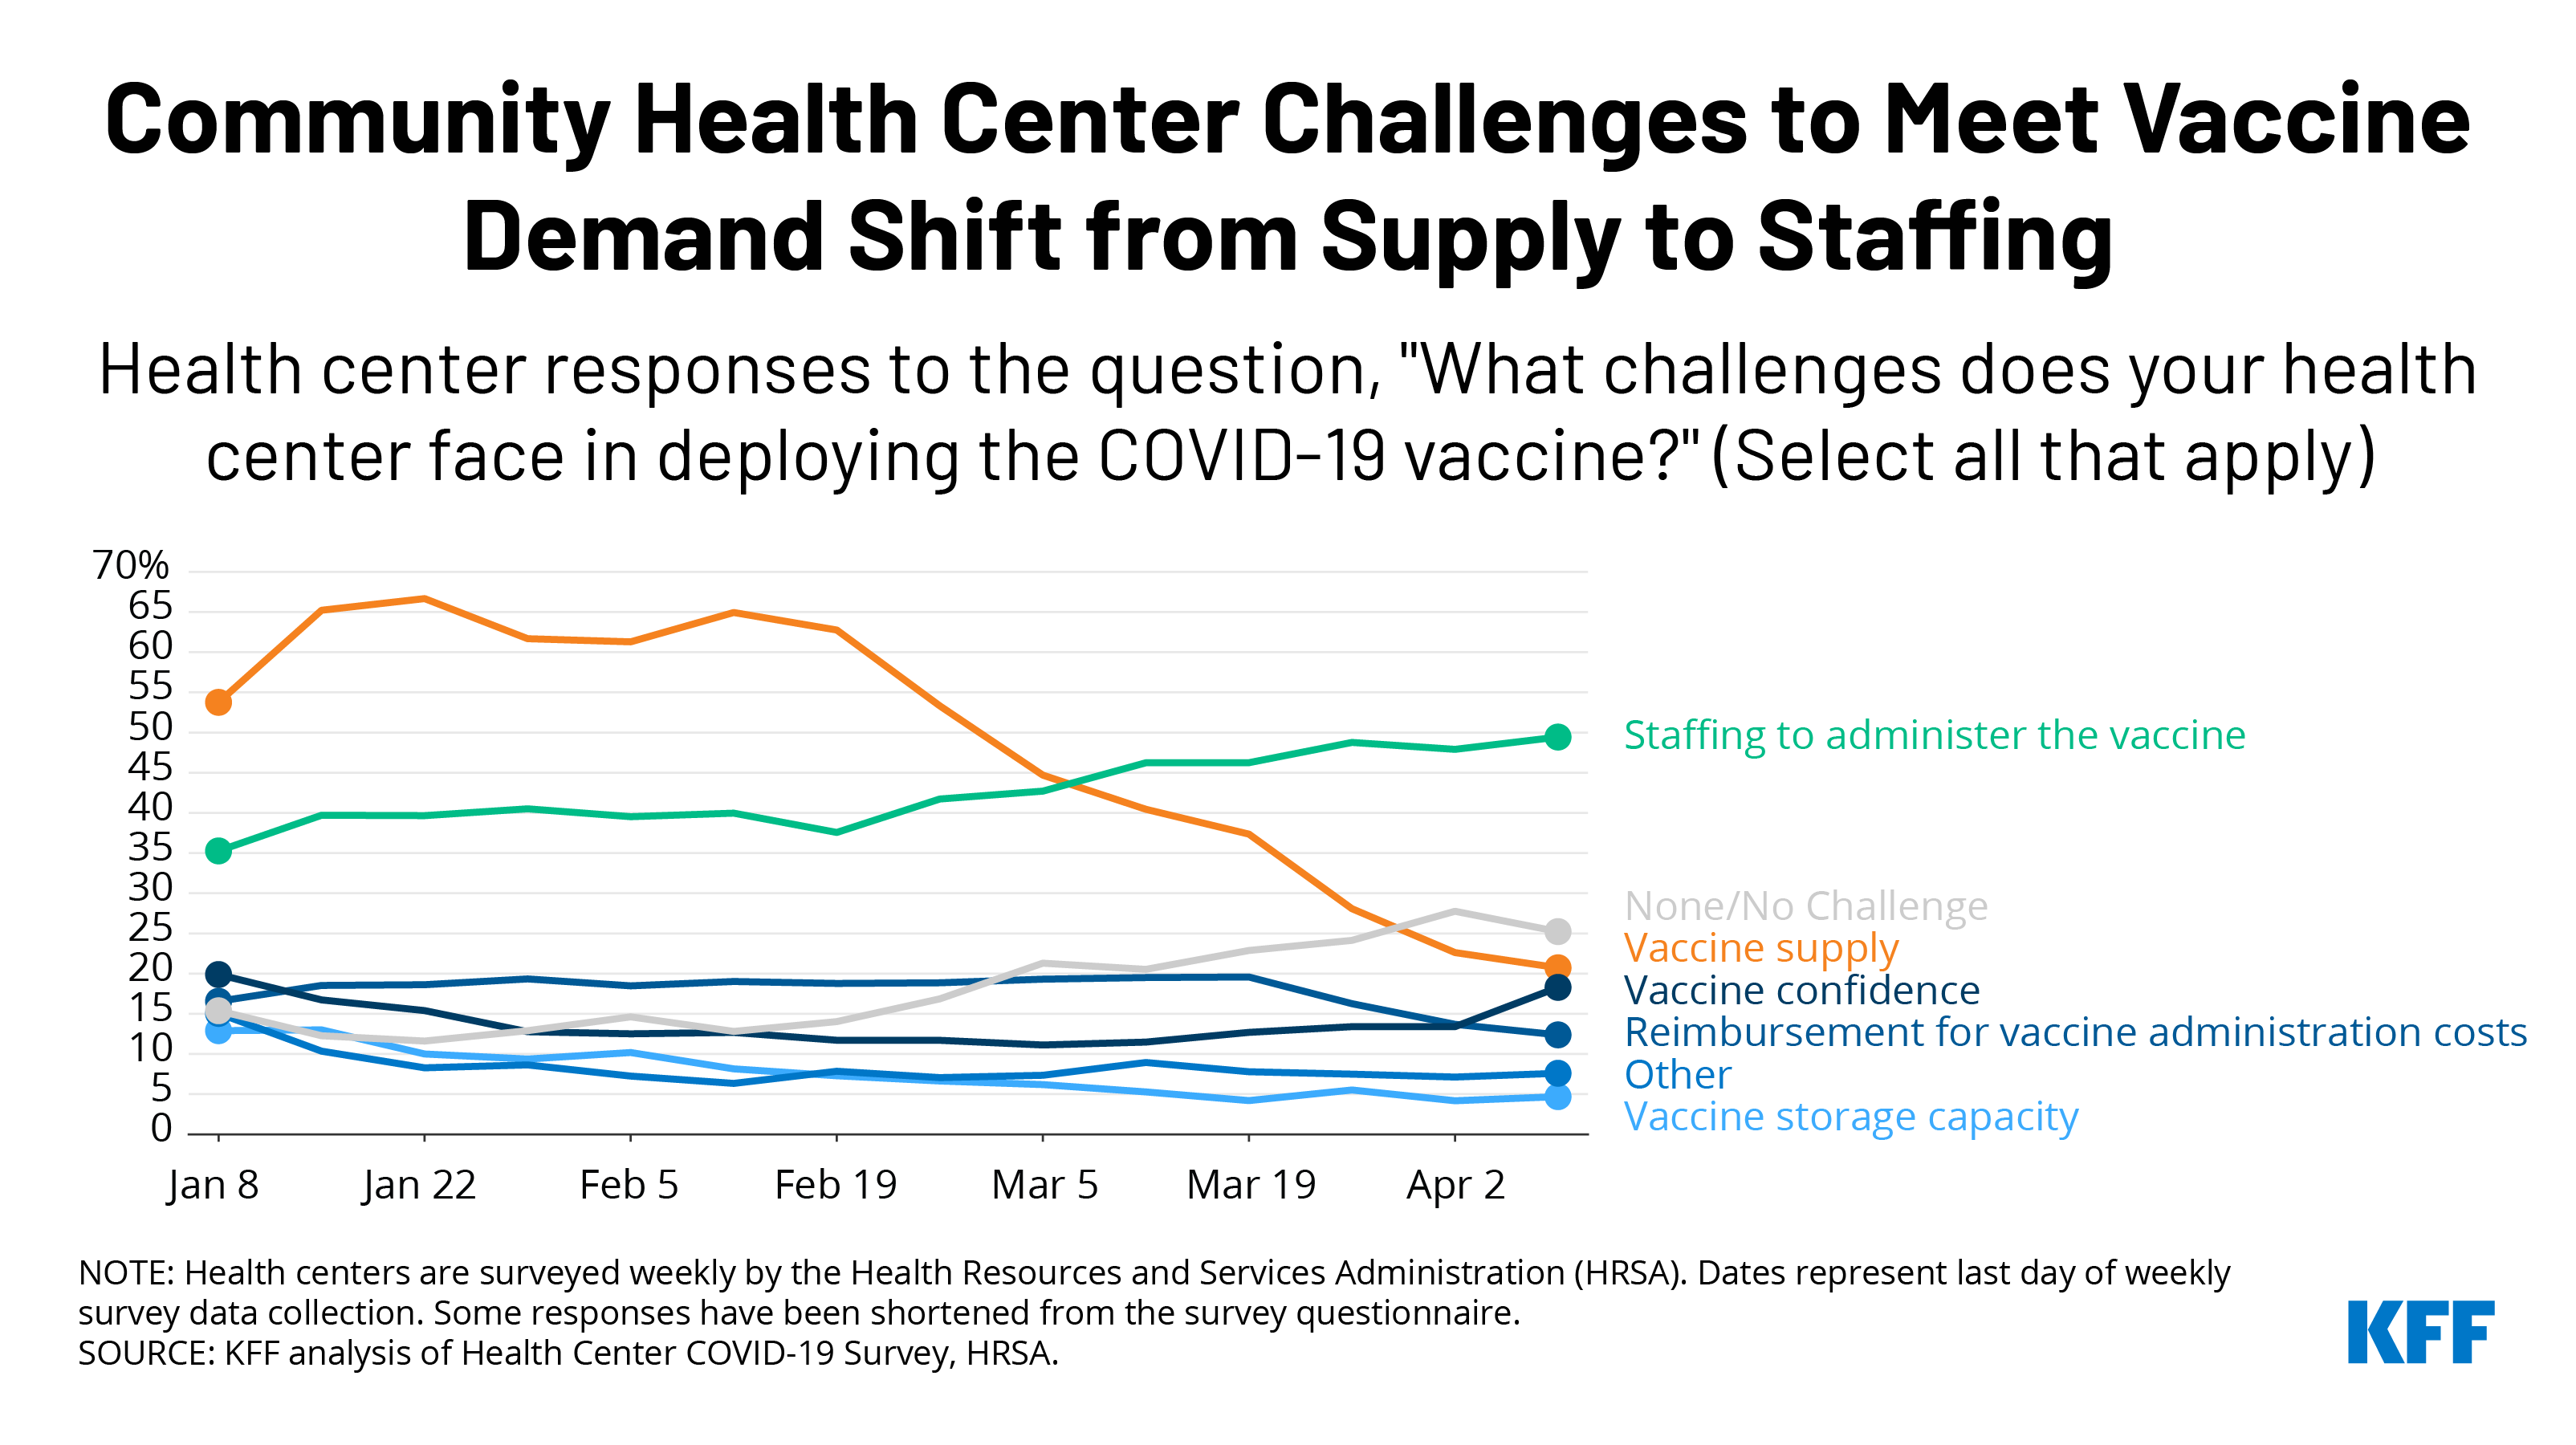
Recent data show that health centers are less likely than in the past to report vaccine supply as the most common challenge in deploying the COVID-19 vaccines, while they are more likely to report staffing challenges. In January 2021, as many as two-thirds of health centers (67%) reported that vaccine supply was a challenge in administering the vaccine, but that number began steadily declining in late February. By early April, it had dropped to 21% of health centers. Meanwhile, staffing is a growing challenge and has become the most commonly reported problem among health centers, with nearly half (49%) of those surveyed citing it as a challenge.
These trends likely indicate that many health centers are starting to operate at full capacity to meet the demand for vaccinations. Along with the increasing vaccine supply nationally, health centers’ vaccine supply has also been bolstered by the partnership with the Biden administration. As of early April, health centers had received more than 3.5 million doses through the federal vaccine program, in addition to allotments from state and local jurisdictions, which appear to make up the majority of doses administered by health centers so far. Now that all states have opened eligibility requirements to all adults over age 16 (as of April 19), demand for the vaccine is likely to increase as well.
The ability of health centers to address growing staffing challenges will be important to reaching more underserved and hard-to-reach populations. Health centers, particularly the early participants in the federal vaccine partnership, serve larger shares of agricultural workers, people experiencing homelessness, residents of public housing, and those with limited English proficiency. Reaching these populations may require strategies such as using mobile vans to bring vaccines into neighborhoods and work sites and conducting community-based outreach that will further stretch limited staff resources. Given health centers’ role in facilitating equitable access to the COVID-19 vaccine, increasing the number of health centers able to operate at full capacity will be important to reach underserved communities in greater numbers and advance equity on a larger scale.
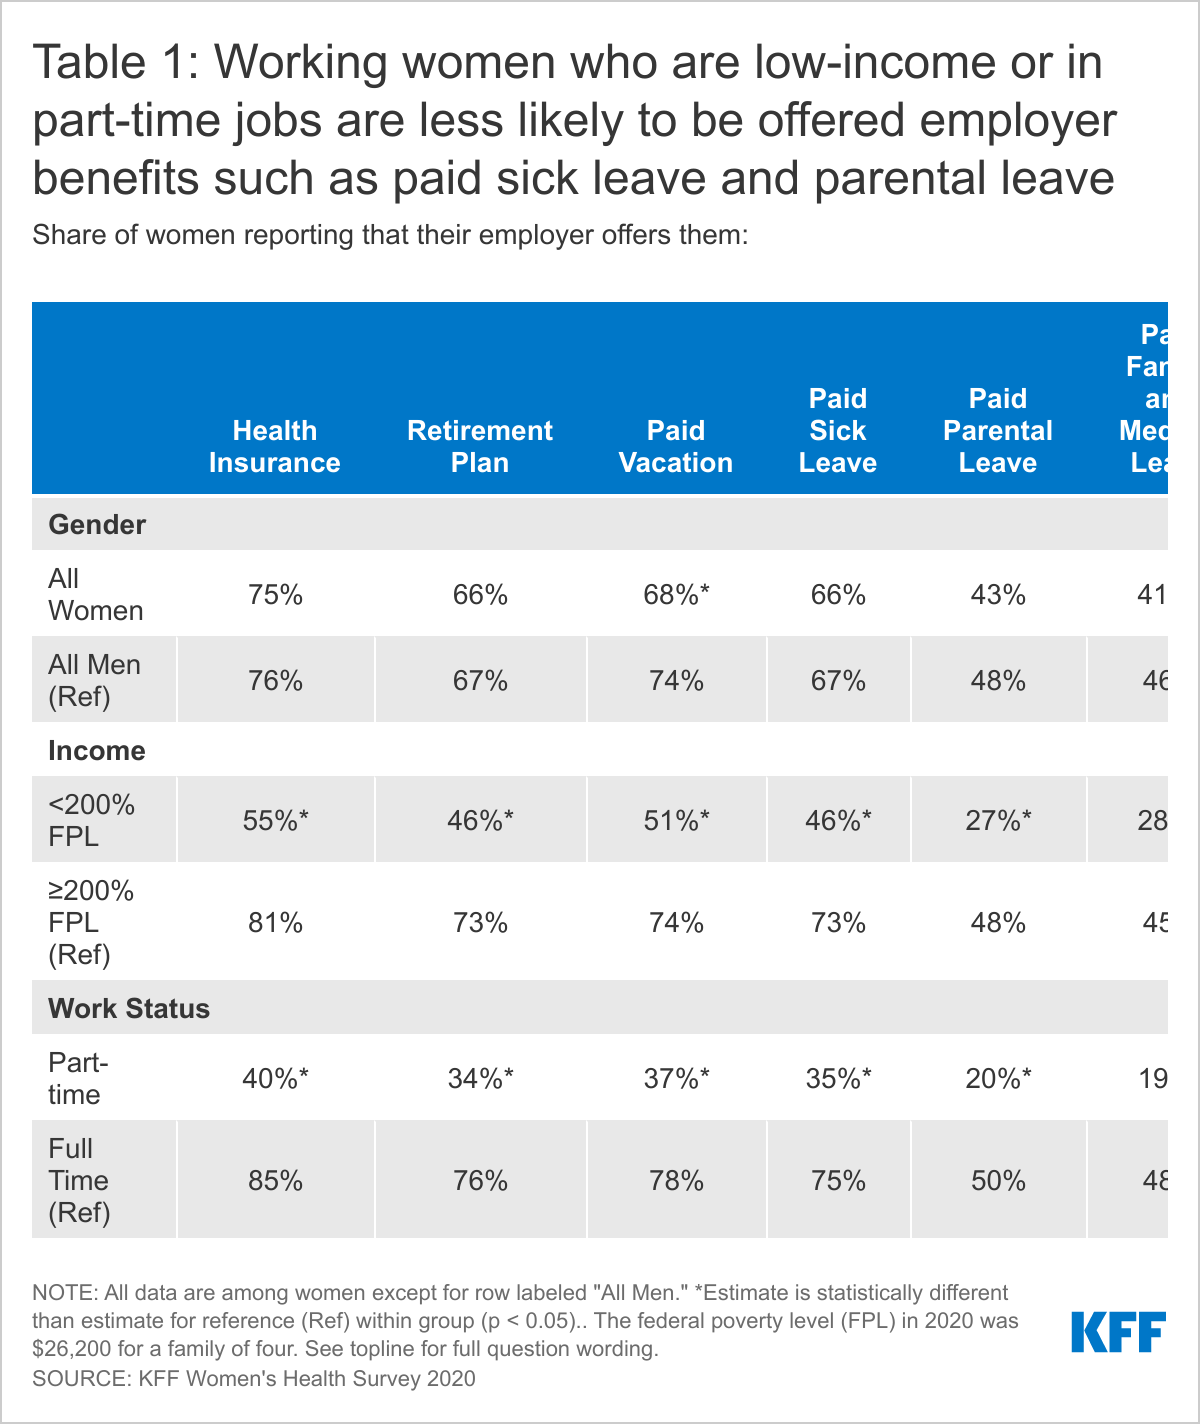
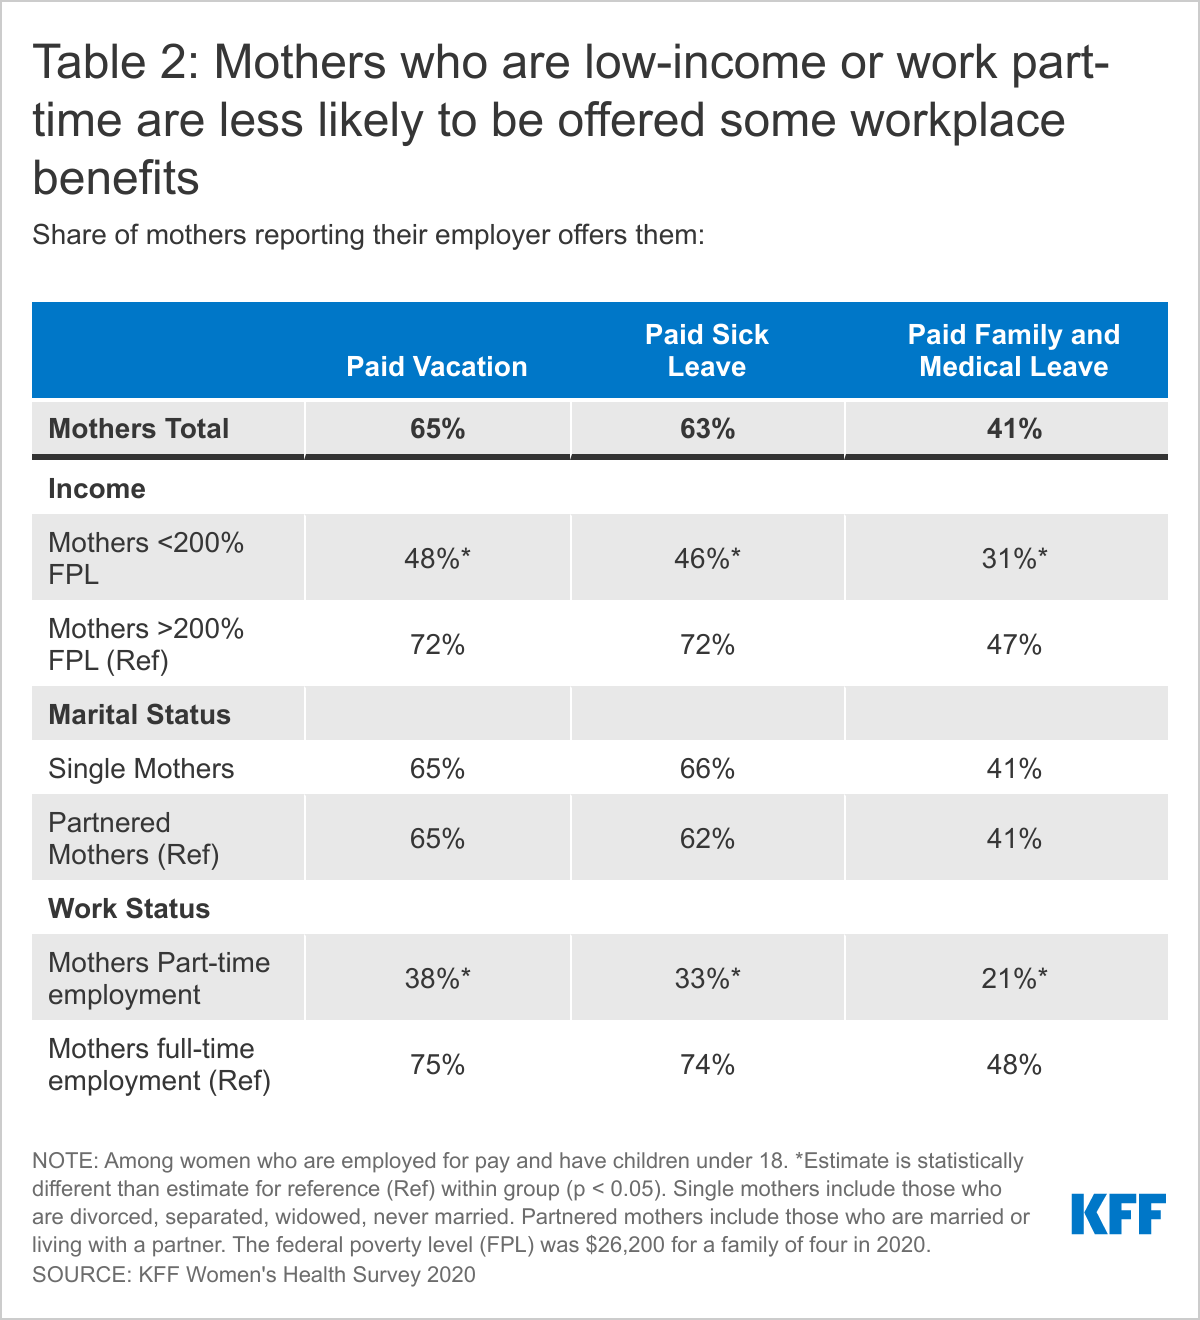
About two-thirds of women who work for pay say that their employer offers them paid sick leave (66%), paid vacation (68%) and a retirement plan (66%), and just over four in ten report that they are offered paid parental leave or paid family and medical leave.
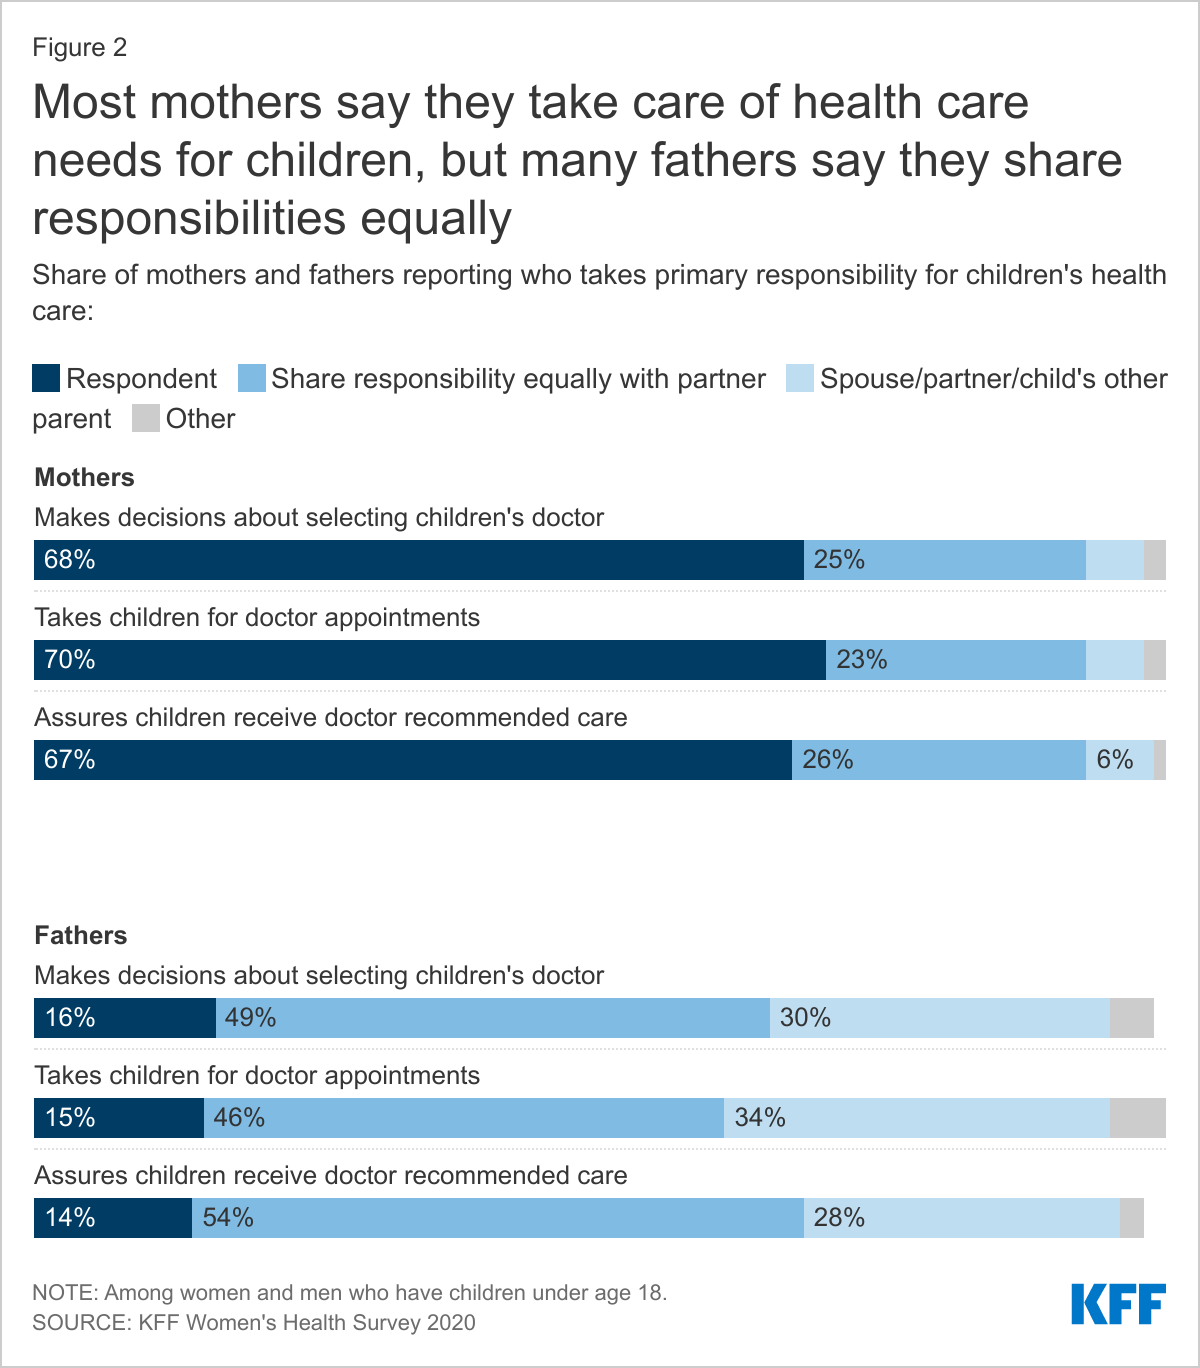
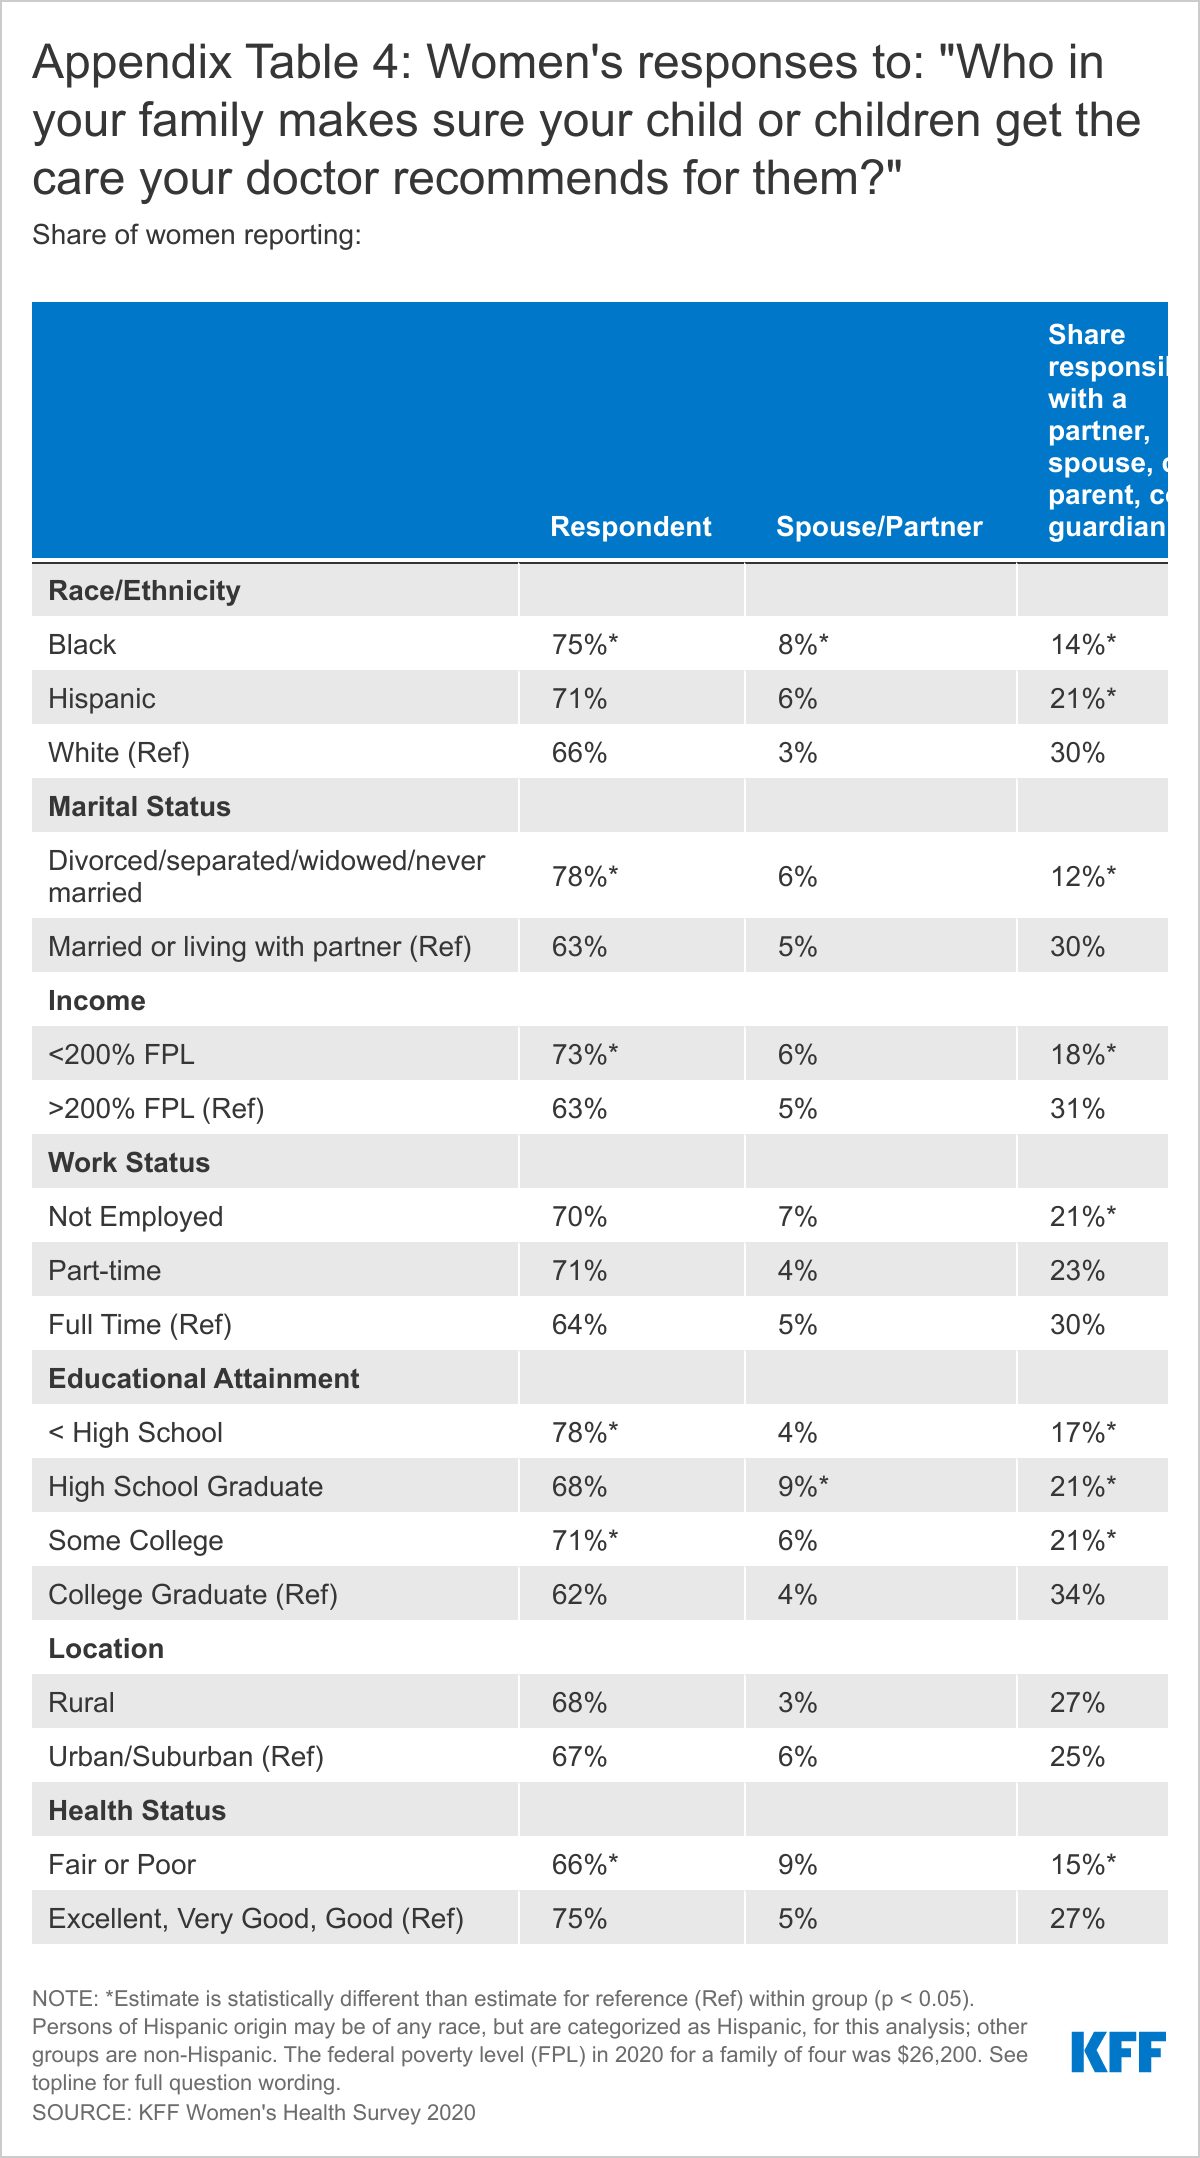
Among women with school age children, more than six in ten report that they are the ones who usually take charge of health care responsibilities such as choosing their children’s provider (68%), taking them to appointments (70%), and following through with recommended care (67%). Fathers are more likely than mothers to say they share responsibility for these tasks equally with a partner.
Among employed parents, mothers are more likely than fathers to report they care for children when they are sick and cannot attend school. Nearly half (46%) of mothers say they are not paid when they take time off to care for children who cannot go to school.
Mothers who are low-income or in part-time jobs are more likely than those with higher incomes and full-time jobs to report missing work when their children are sick and less likely to have paid sick leave benefits.
Introduction
The persistent challenges that working mothers face in balancing family and work responsibilities came into clear focus during the COVID pandemic. These challenges were intensified by a huge increase in caregiving needs, a shift to homeschooling, a dearth of childcare options, and widespread social isolation. Many women who were considered essential workers did not have the opportunity to work from home and many, particularly women of color, also bore the impact of a sharp rise in unemployment that was exacerbated by decades of structural racism. For many working women, economic security is intertwined with health issues, including workplace benefits such as insurance coverage, paid sick leave, and paid family leave. It is also related to women’s roles as mothers and primary managers of their children’s health care.
This brief provides new data from the KFF Women’s Health Survey, a nationally representative survey of 3,661 women and 1,144 men ages 18-64 (Methodology) conducted November 19, 2020 – December 17, 2020. Among several topics related to women’s health and well-being, we asked respondents about employment and family health care needs. In this brief, we highlight how workplace benefits and caring for children’s health care differ by gender and among different subpopulations of women.
Workplace Benefits
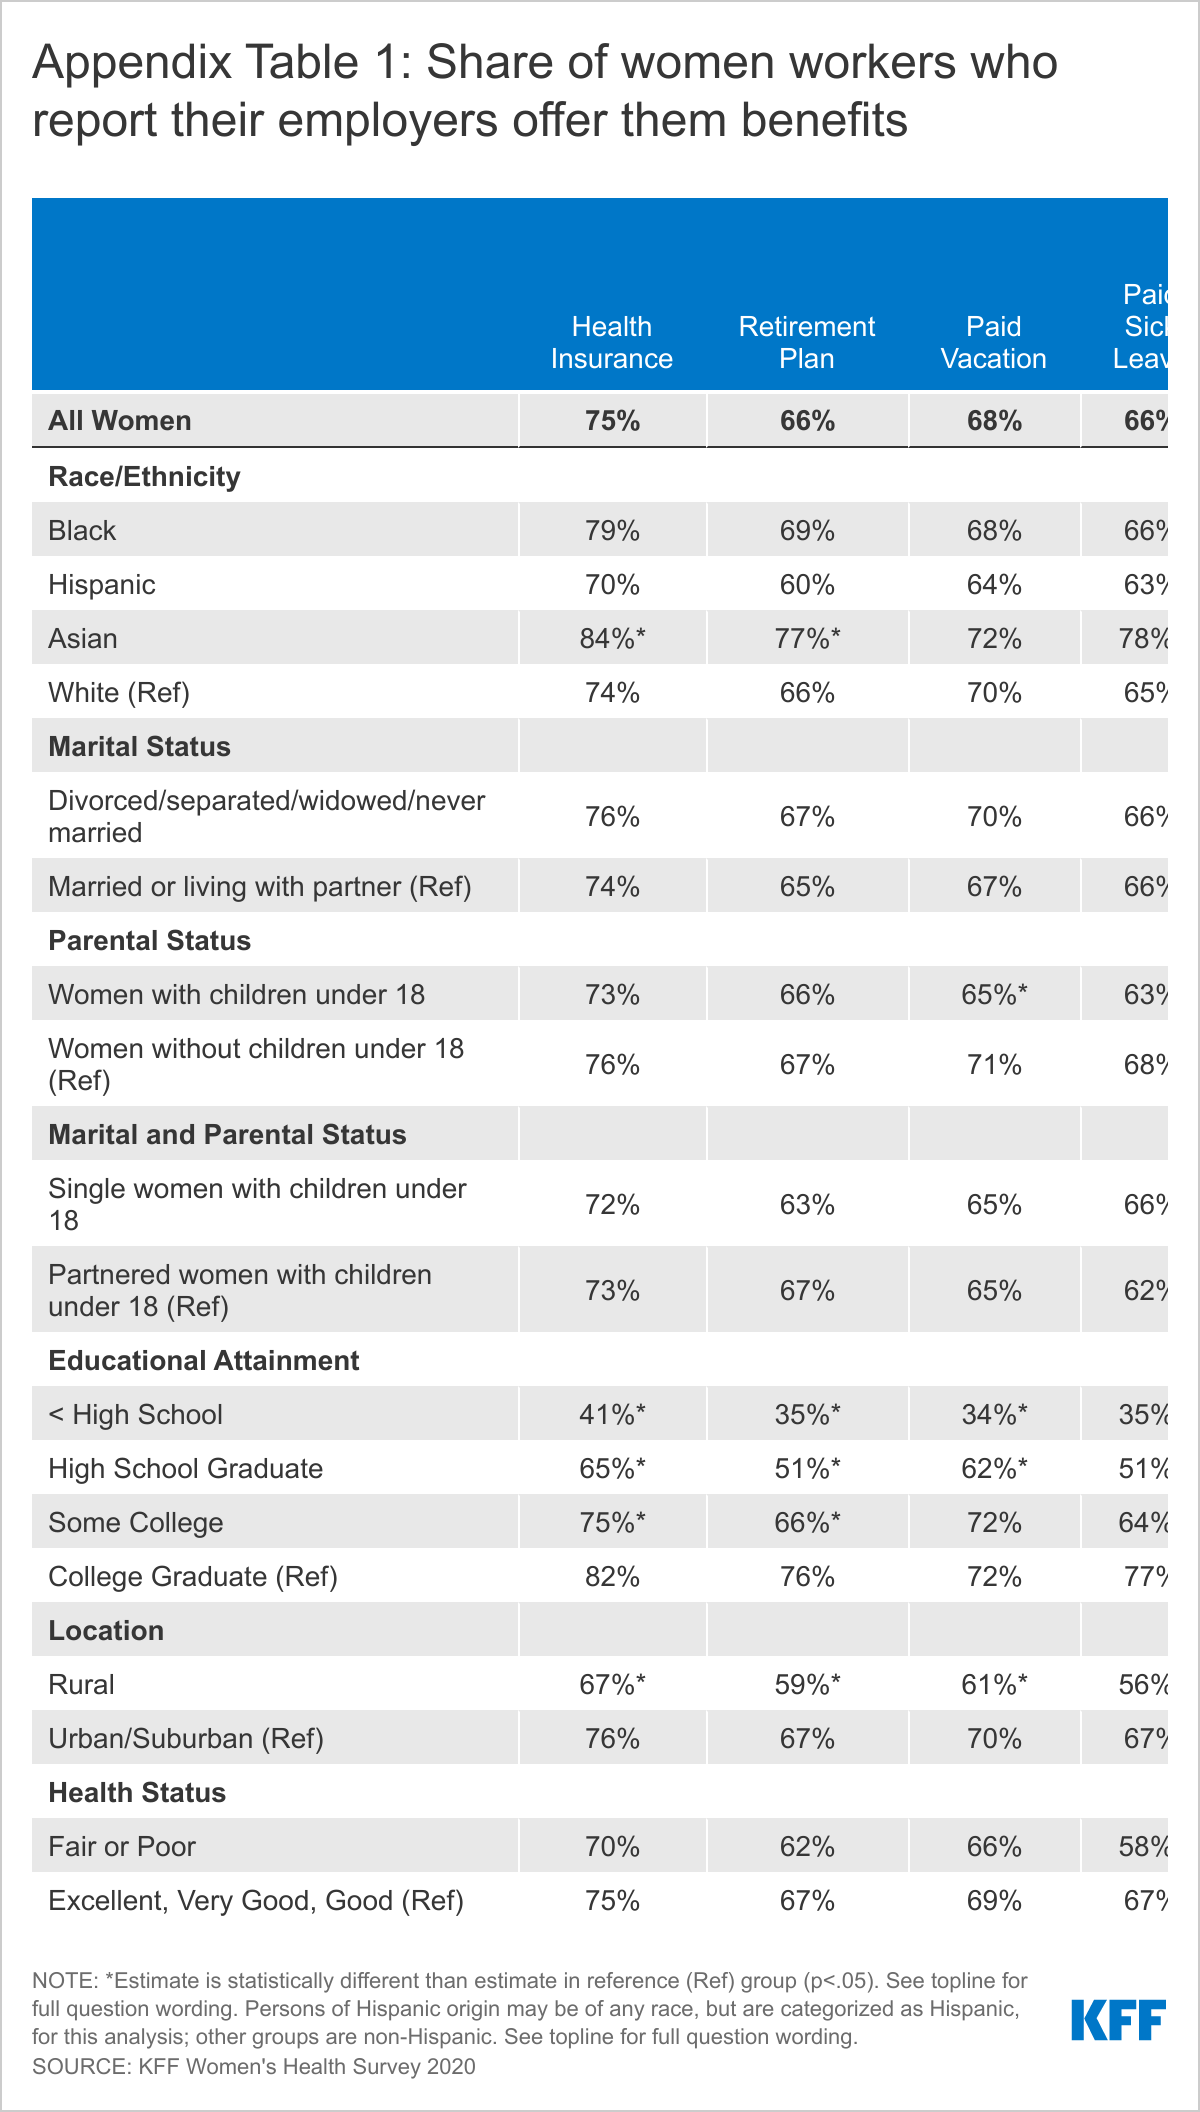
The majority of women who are employed for pay say their employer offers them health insurance, paid sick leave, paid vacation, and a retirement plan. Most, however, are not offered paid parental leave or family and medical leave. Three in four employed women (75%) say their employers offer health insurance (Table 1). About two-thirds report that their employer offers them paid sick leave (66%), paid vacation (68%) and a retirement plan (66%). However, most report that they are not offered paid parental leave or paid family and medical leave. Just over four in ten women workers say they are offered these benefits.
Men report receiving most of these same benefits in similar rates, except that a higher share of men report they are offered paid vacation (74%) and paid family and medical leave (46%). Across the board, low-income women and those with part-time employment are less likely to be offered any of these benefits compared to their higher income and full-time counterparts.
There are also consistent gaps in workplace benefits by educational attainment and geography with lower rates among women in rural areas compared to urban and suburban areas. Among women of color, Asian women report the highest offer rates of several benefits, including health insurance, paid vacation, paid sick leave, and paid parental leave (AppendixTable1).
Awareness of Paid Parental Leave
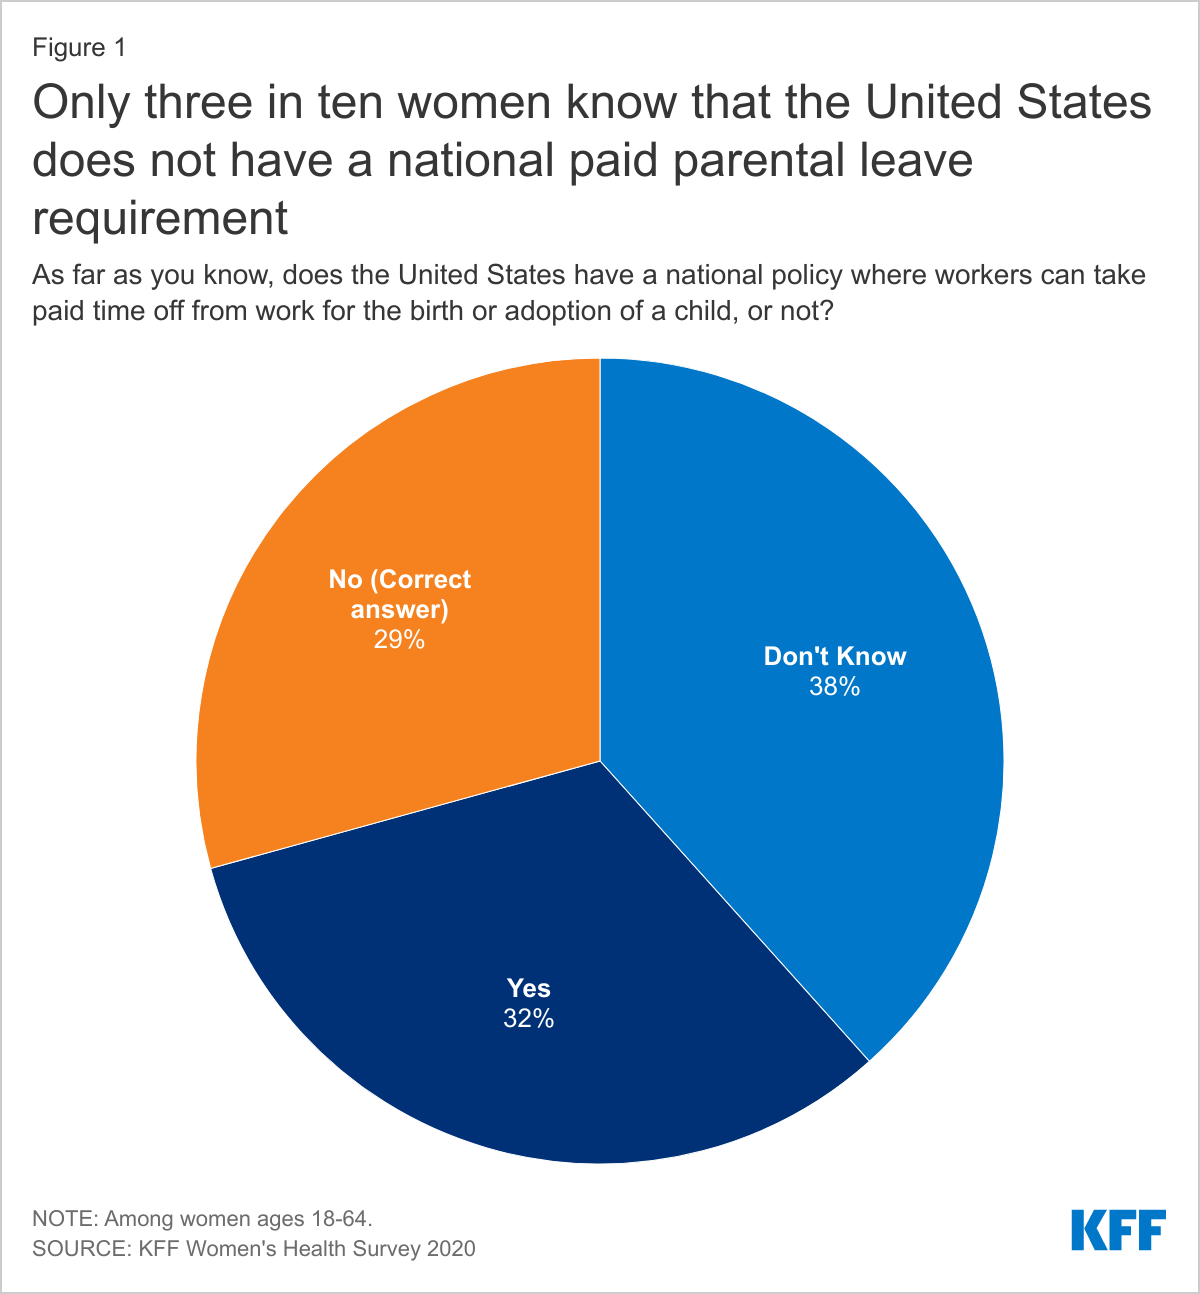
Unlike most high-income countries, there is no federal requirement for employers to offer paid leave to workers after the birth or adoption of a child in the US, although this benefit is required in a few states. The federal Family and Medical Leave Act (FMLA) requires some employers to provide unpaid leave as well as job protection to eligible employees who take time off for the arrival of a child or to care for ill family members, but does not require employers to pay for this time. Despite the fact that few employers offer parental leave to their workers, only three in ten women (29%) are aware that the US does not have a national requirement to provide paid parental leave to workers. About a third of women think (erroneously) that there is a national paid parental leave policy and almost four in ten say that they do not know if there is one (Figure 1). People may not know about the lack of a benefit unless they try to use it and realize they don’t have one.
Parental Roles for Children’s Health
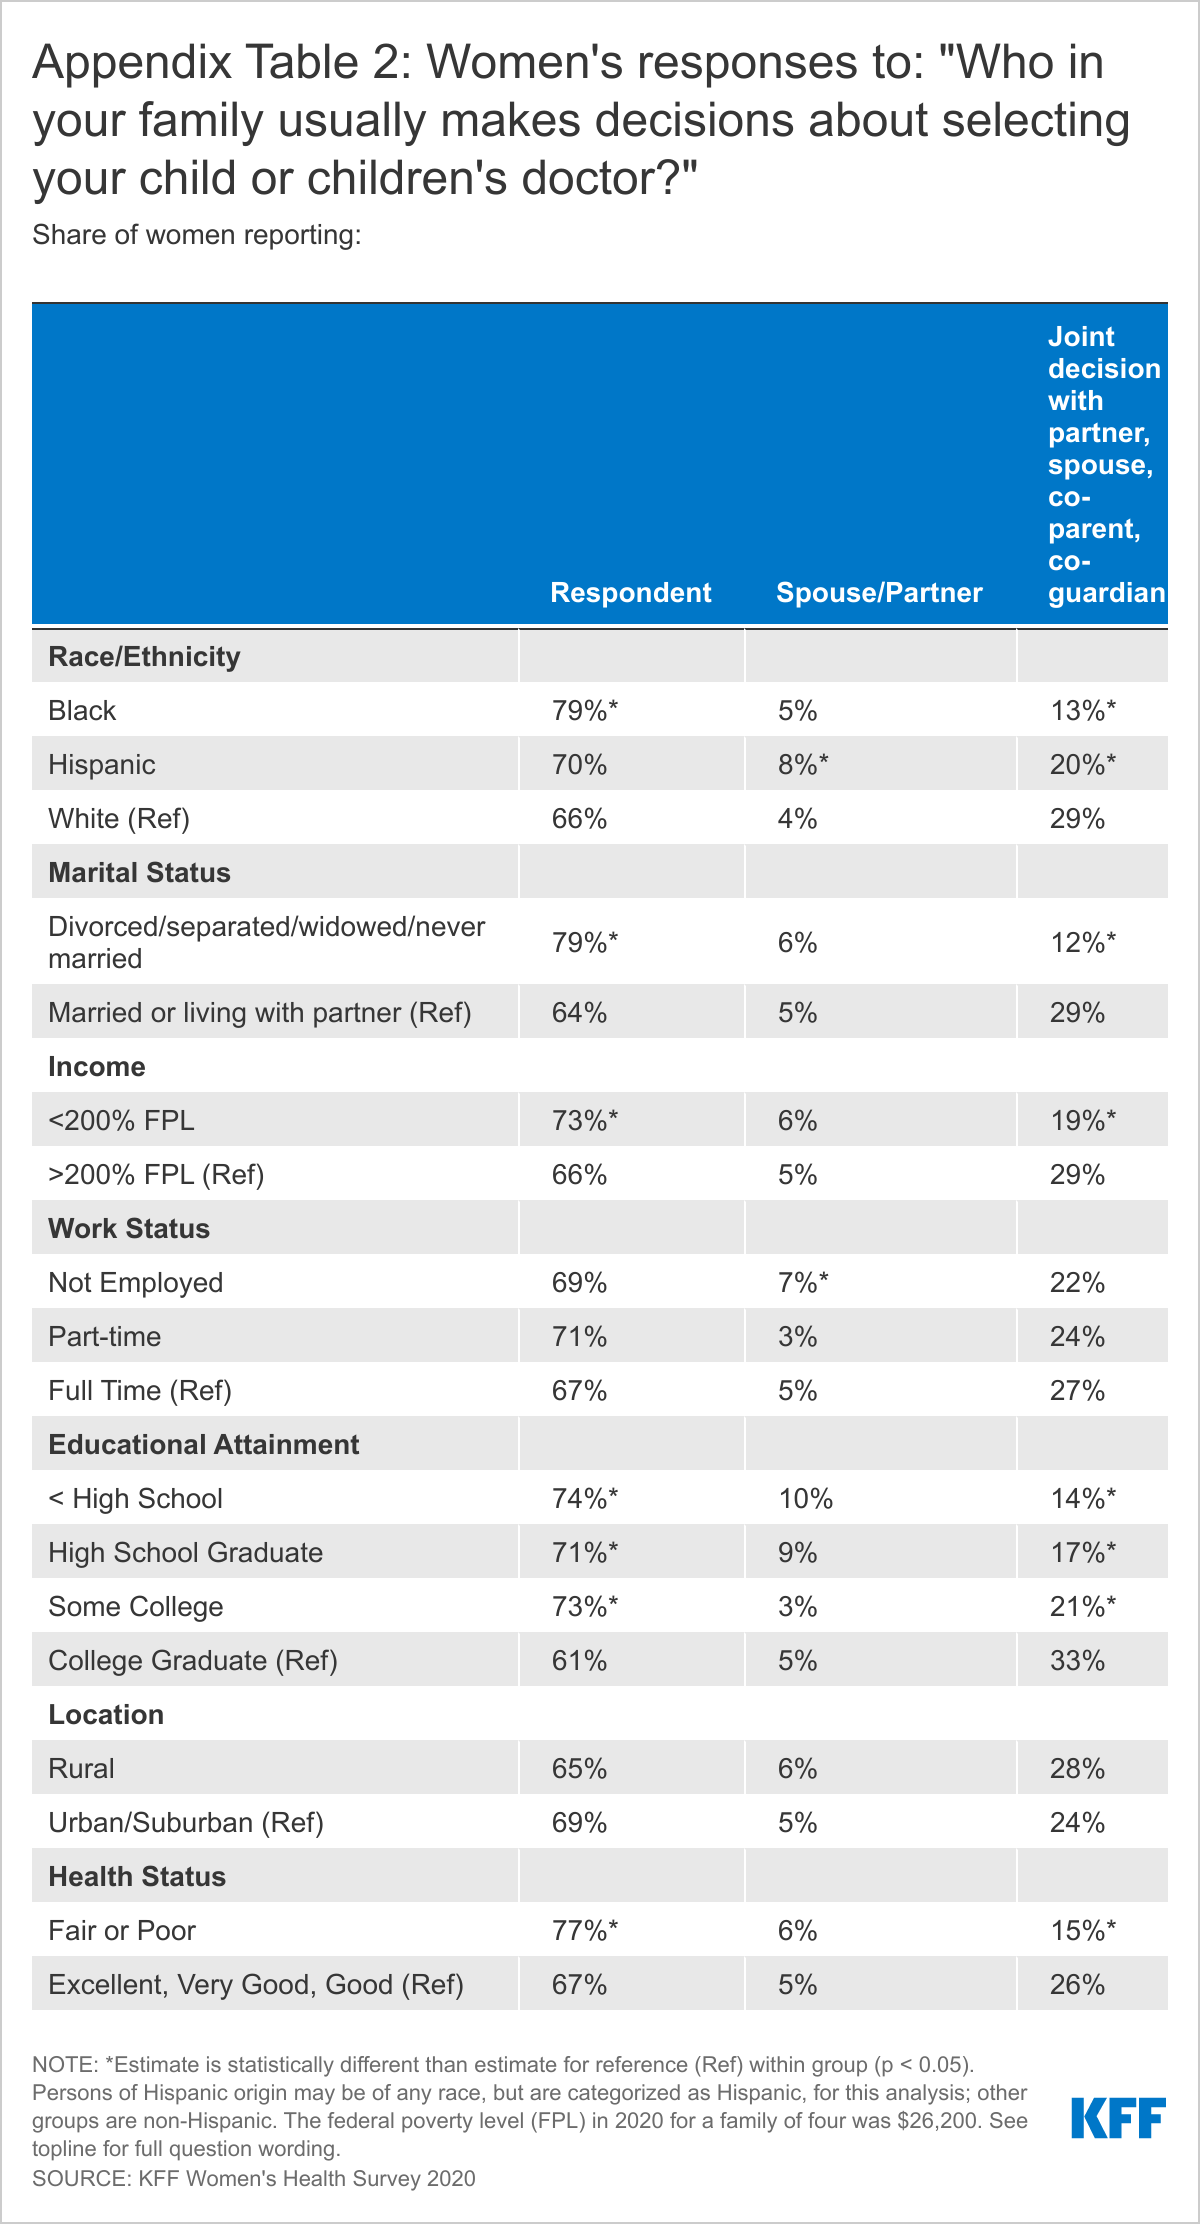
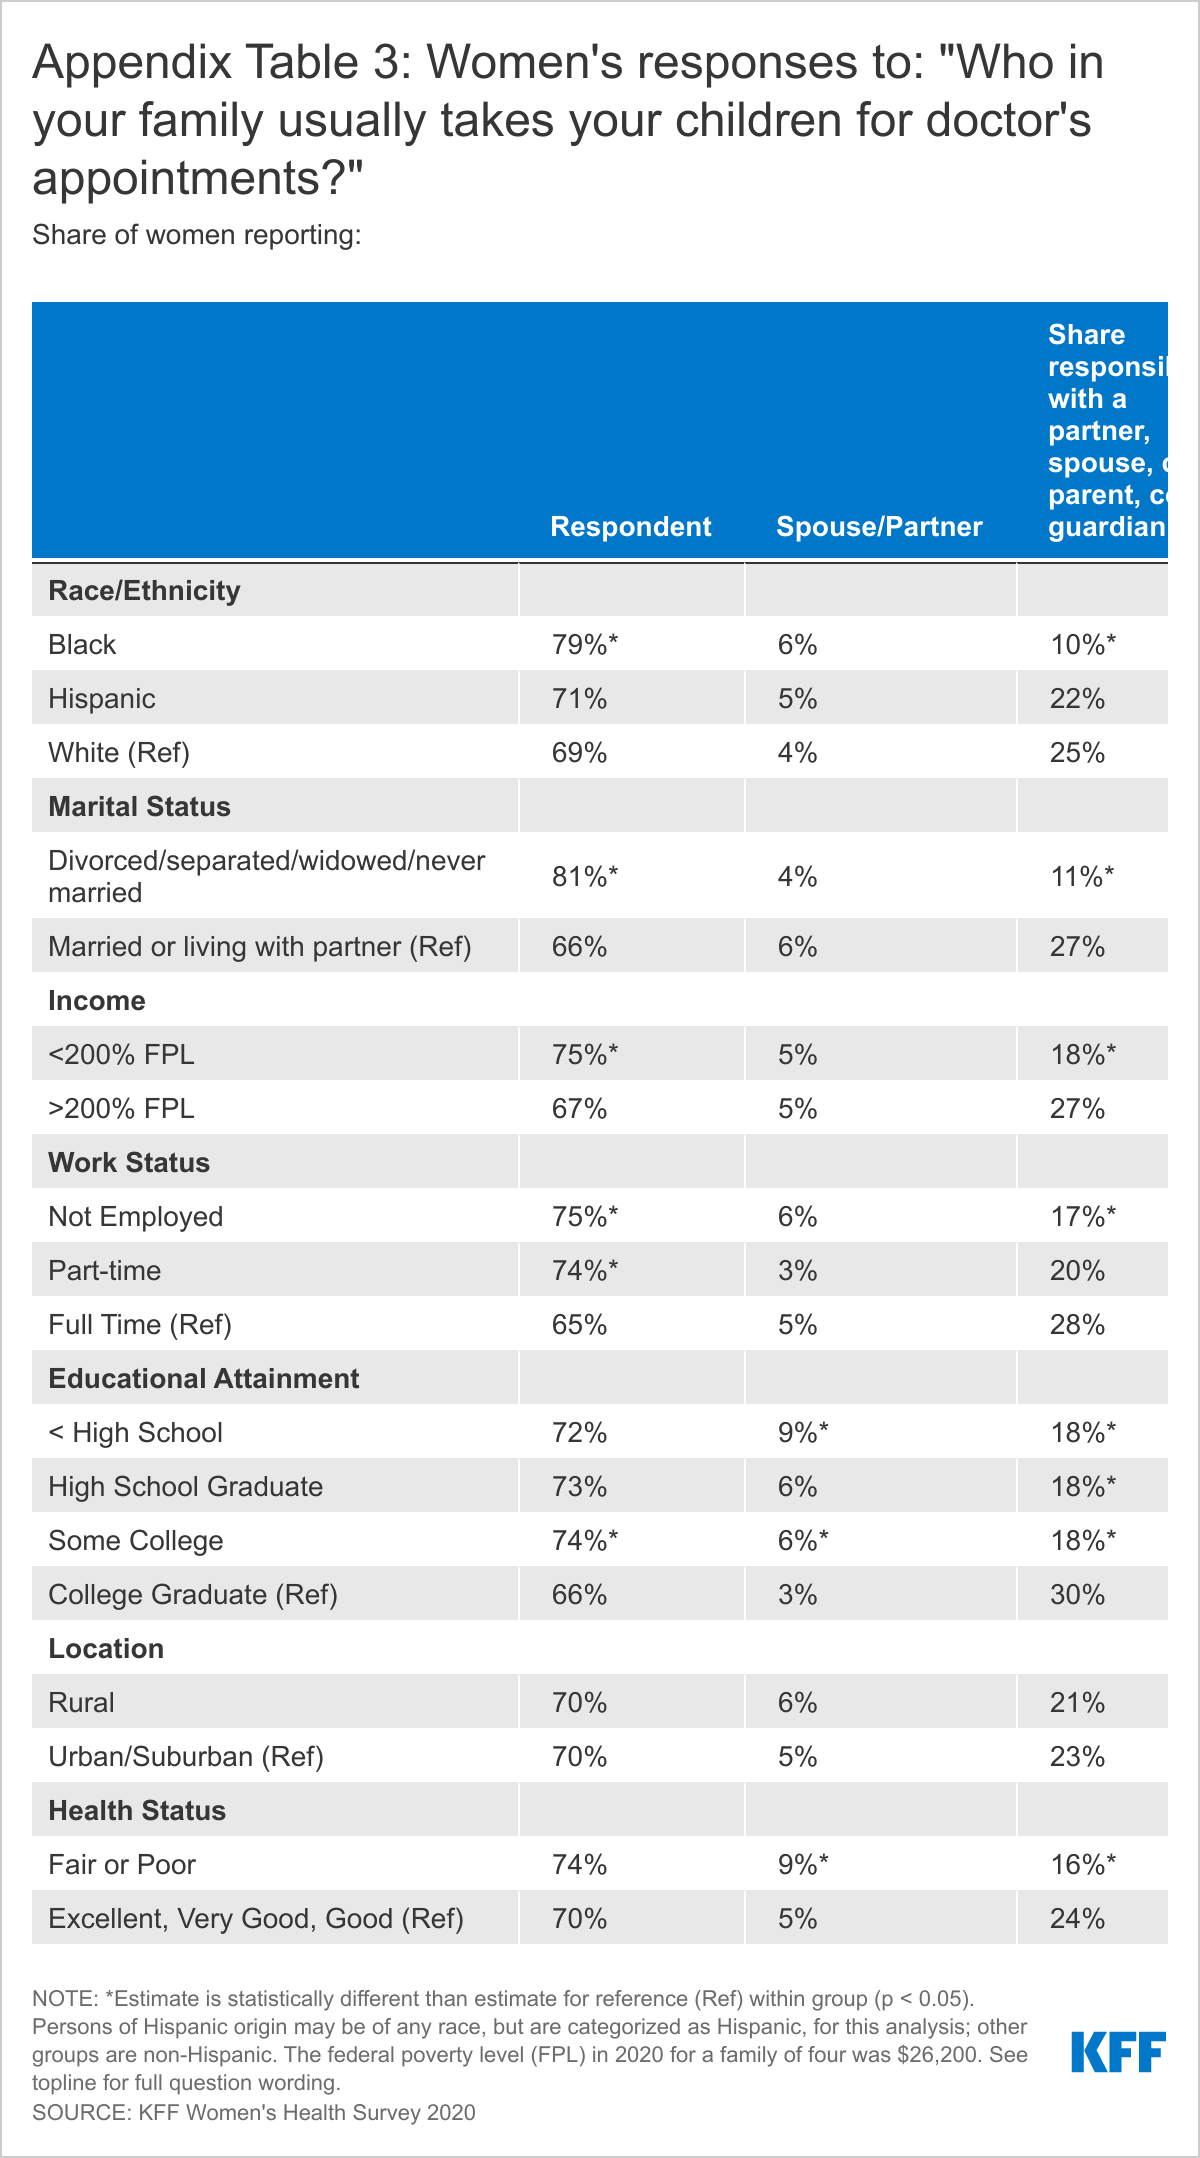
Mothers and fathers have very different perspectives about who takes the lead in managing family health. In most households, women say they are the managers of their families’ health care needs, with fathers playing a lesser role. Many fathers, however, say they share responsibility with a partner jointly. Among women with children under 18, more than six in ten report that they are the ones who usually take charge of health care responsibilities such as choosing their children’s provider (68%), taking them to appointments (70%), and following through with recommended care (67%), compared to less than a fifth of fathers who report they take care of these tasks (Figure 2). Mothers and fathers differ somewhat on their assessment of their involvement in children’s health care. While fathers are more likely to report that their partners take care of their children’s health needs than themselves, they are also more likely than mothers to report that it is a joint responsibility. About half of fathers say they share health care responsibilities equally with a partner or other parent, compared to about a quarter of mothers.
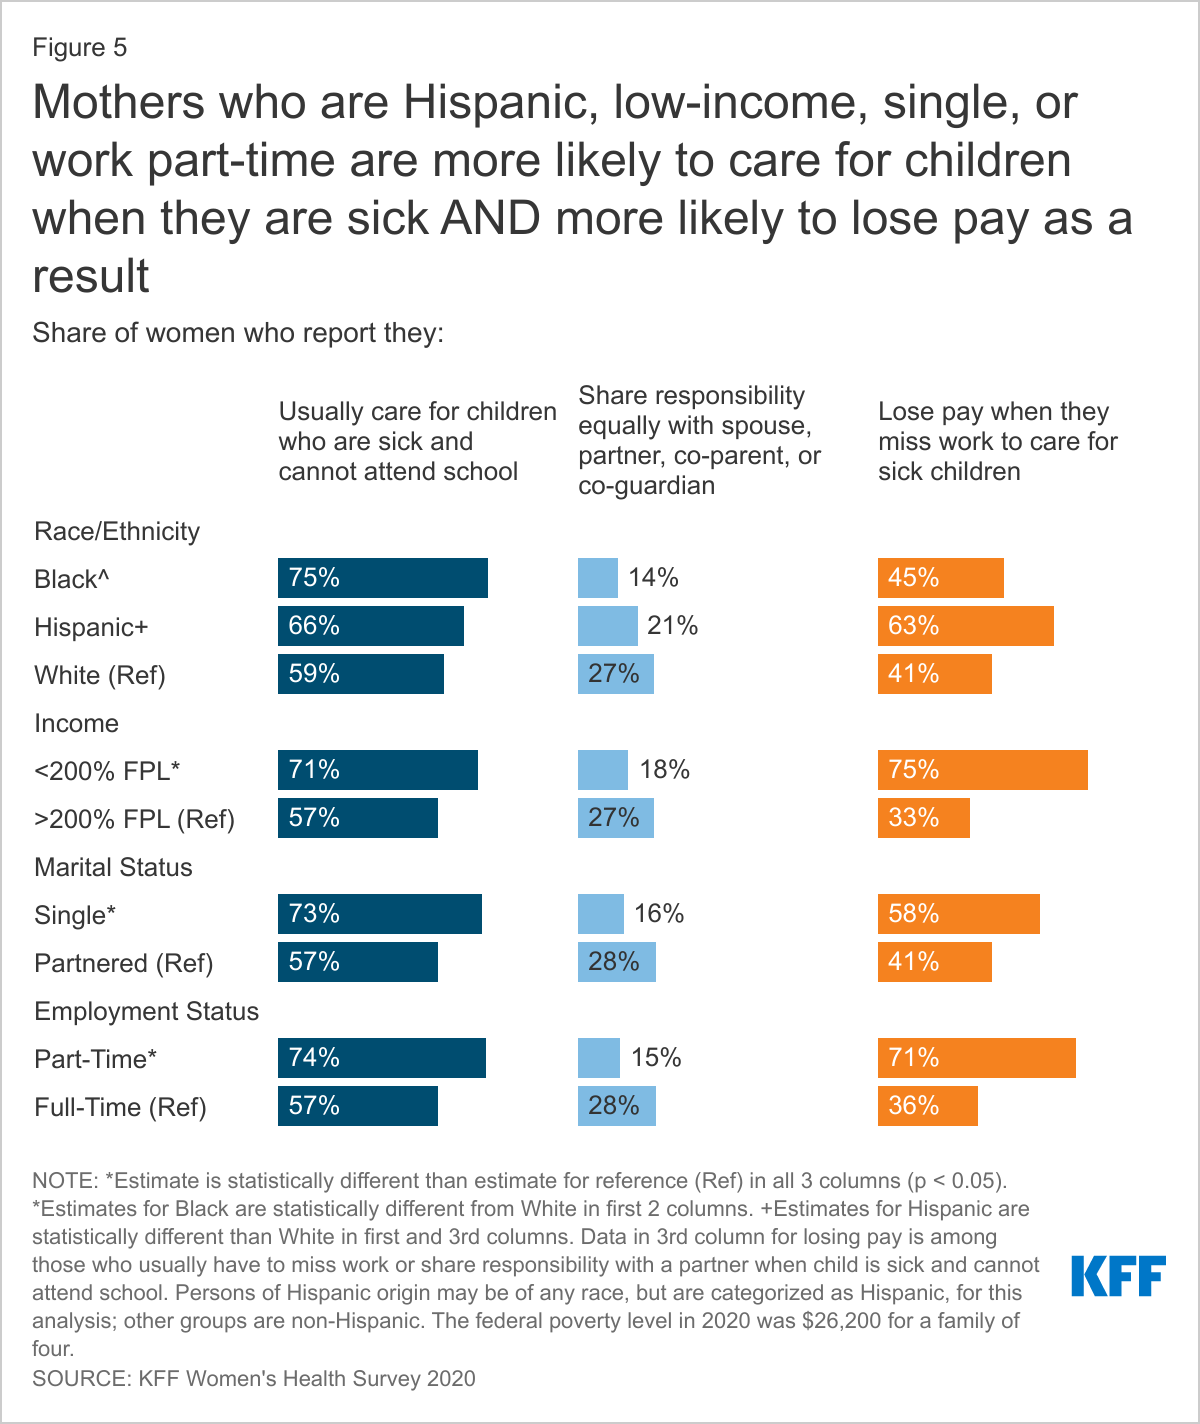
There are some variations in children’s health care responsibilities between groups of women by race/ethnicity, income, marital status, and education level (Appendix Tables 2, 3, 4). Black women are more likely to say that they attend to children’s health care needs and are less likely to share the work with a partner compared to White women. Single mothers and low-income mothers are also more likely than partnered and higher income mothers to say that they are typically responsible for managing their children’s health care.
Impact of Children’s Health Needs on Working Parents
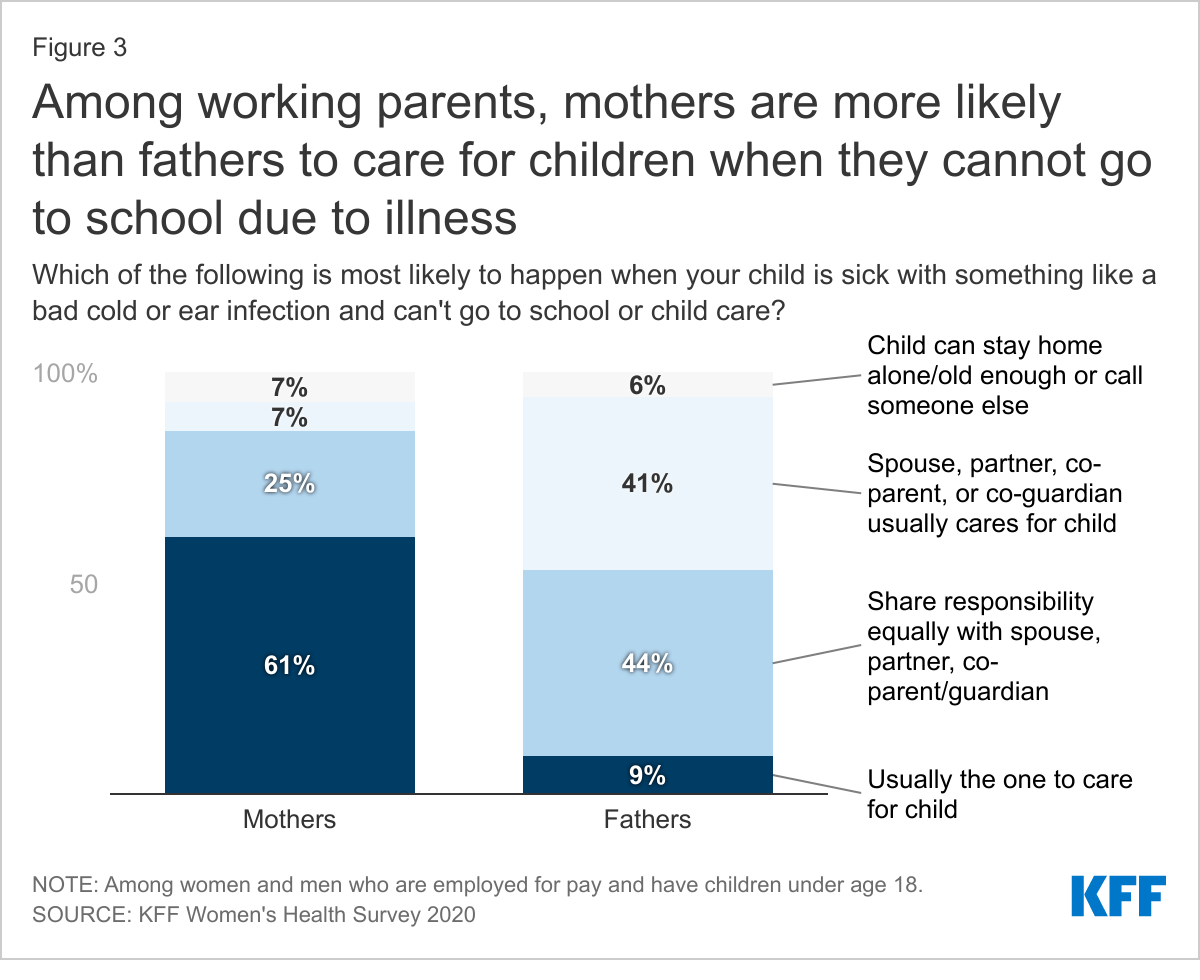
Among working parents, mothers report they are more likely than fathers to care for children when they are sick and cannot attend school. Six in ten working mothers (61%) say they are usually the one to take care of children who are sick and cannot got to school, more than six times the share of working fathers (9%) who say this is the case (Figure 3). However, this is another topic where men are more likely to say that they share in the work equally. A quarter of mothers and 45% fathers say they share responsibility for this jointly.
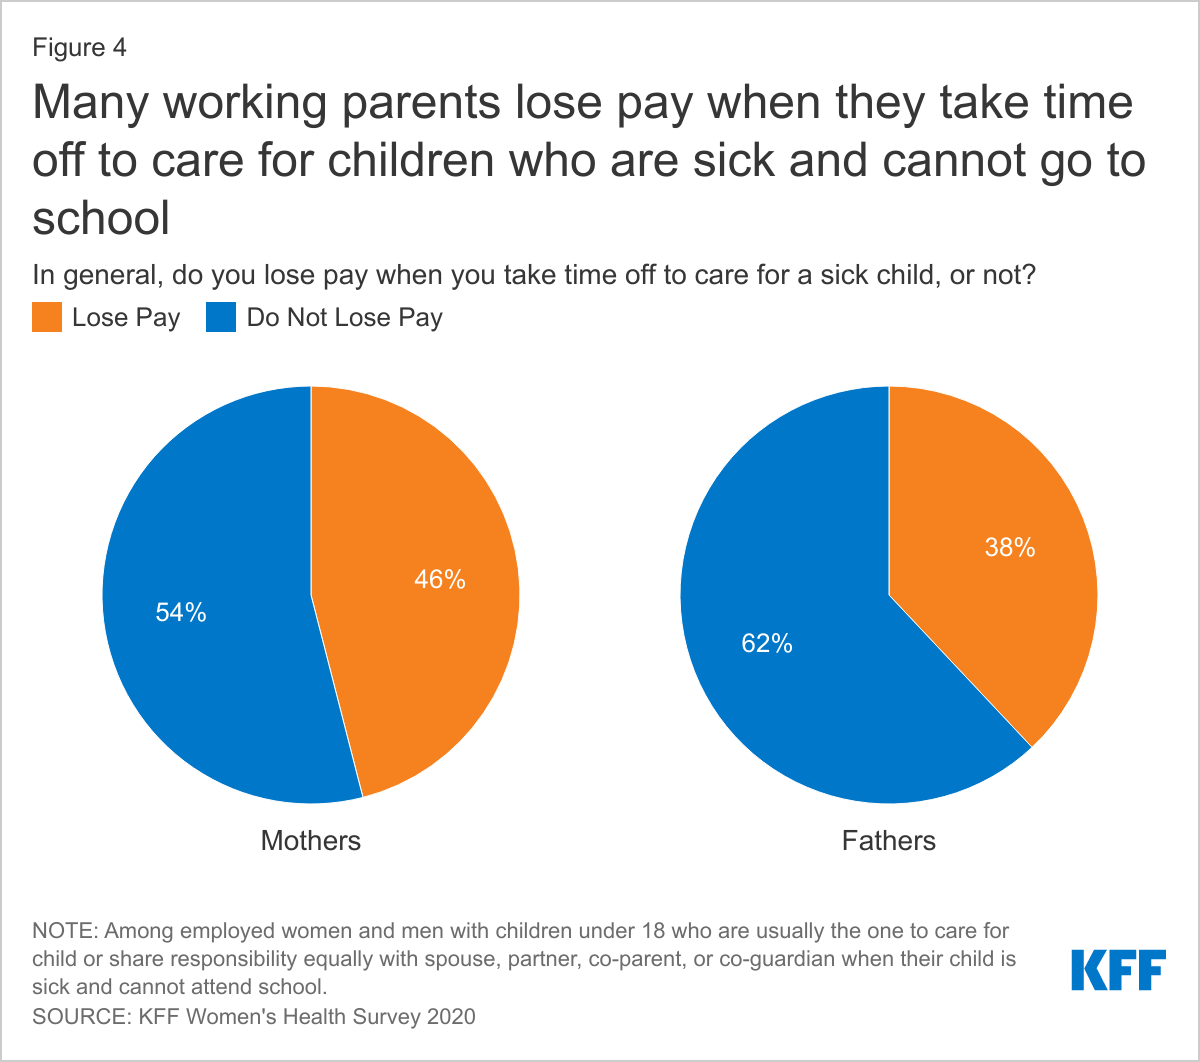
Caring for children’s health can have tangible economic consequences for parents, but especially for women. When mothers care for children because they are sick and cannot go to school, 46% are not paid for time off, as is the case for 38% of men (Figure 4). Considering that nearly one-fifth of children miss at least three school days a year due to illness or injury, missing work to care for sick kids is a common occurrence with negative economic implications for many employed parents. Furthermore, as schools re-open, there could be a rise in parents missing work to stay home with children due to COVID concerns.
Mothers in part-time jobs, those who are low-income, and who are single parents are more likely to report they are the ones to care for children when they are sick compared to their full-time, higher income, and partnered counterparts. Low-income mothers who must miss work when their child is sick are also far more likely to lose pay (75%) compared to higher income mothers (33%) (Figure 5). Additionally, there is a large disparity in workplace benefits, with offer rates of paid sick leave and paid vacation significantly lower among mothers who are low-income or part-time employees (Table 2).
Conclusion
Women now comprise at least half of the nation’s workforce, yet median earnings for women are 81% of men’s earnings, a gap that has persisted for years and is even larger for women of color. Roughly seven in ten women with children under age 18 are in the labor force, but can face challenges without access to paid parental leave. The United States remains one of the few industrialized nations that does not require paid leave for major health events, such as the birth or adoption of a child, to care for an aging relative, or for routine sick leave that most workers will need at some point. For many women, even a month of leave after childbirth is unaffordable and unattainable without paid time off. Additionally, missing work when their children are sick, including with COVID-19, has an economic cost, as nearly half are not paid when they take a sick day.
Women continue to be the primary health care managers for their families, although some share the work for children’s health care with partners, and perceptions of responsibility for caregiving differ substantially between mothers and fathers. Mothers will play a significant role in the nation’s pandemic recovery, as they are likely to take the lead on getting kids vaccinated once vaccines are available for children. This survey finds that many working women, particularly those with lower incomes or in part-time jobs, do not have workplace protections such as paid sick days or paid family leave. This past year, this gap has been amplified by the lack of in person education for school aged children and childcare closures, along with an unparalleled national health crisis that has disproportionately affected low-income communities of color across the nation. While federal policymakers have addressed some of these gaps through the various federal COVID relief laws passed by Congress, these measures are restricted to certain industries and employer sizes, and time-limited. For some women, the system is largely working. But, for many others, including those who are in low-wage jobs or work part-time hours, the financial consequences of taking time off to care for their children can force them to make difficult tradeoffs between their financial wellbeing or their families’ health.
Methodology
The 2020 KFF Women’s Health Survey was designed and analyzed by researchers at the Kaiser Family Foundation (KFF) of a representative sample of 4,805 adults, ages 18-64 years old (3,661 women and 1,144 men). The survey was conducted online and telephone using AmeriSpeak®, the probability-based panel of NORC at the University of Chicago. U.S. households are recruited for participation using address-based sampling methodology and initial invitations for participation are sent by mail, telephone, and in-person interviews. Interviews were conducted in English and Spanish online (4,636) and via the telephone (169). Our previous Women's Health Surveys were conducted exclusively by telephone, so trend data are not included in our 2020 survey. Interviews for this survey were conducted between November 19 and December 17, 2020, among adults living in the United States. KFF paid for all costs associated with the survey.
The sample for this study was stratified by age, race/ethnicity, education, and gender as well as disproportionate stratification aimed at reaching uninsured women, women who identify as LGBT, Asian women, and women 18-49 years old. The sampling also took into consideration differential survey completion rates by demographic groups so that the set of panel members with a completed interview for a study is a representative sample of the target population. This survey includes people who self-identified as 'female' or 'male’ regardless of their sex at birth. While our goal was to be as inclusive as possible, we were not able to obtain a large enough sample to support a separate questionnaire that addresses the unique health concerns and experiences of non-binary or gender-fluid people to include them in this survey. We recognize that additional study is needed to better understand the health and access issues faced by non-binary people.
A series of data quality checks were run and cases determined to be poor-quality, as defined by surveys with a length of interview of less than 33% of the mean length of interview and with high levels of question refusal (>50%) were removed from the final data (n=96). Weighting involved multiple stages. First, the sample was weighted to match estimates for the national population from the 2020 Current Population Survey on age, gender, census division, race/ethnicity, and education. The second round of weights adjusted for the study’s sampling design. All statistical tests of significance account for the effect of weighting.
The margin of sampling error including the design effect for the full sample of women is plus or minus 2 percentage points. Numbers of respondents and margins of sampling error for key subgroups are shown in the table below. For results based on other subgroups, the margin of sampling error may be higher. Sample sizes and margins of sampling error for other subgroups are available by request. Note that sampling error is only one of many potential sources of error in this or any other public opinion poll.
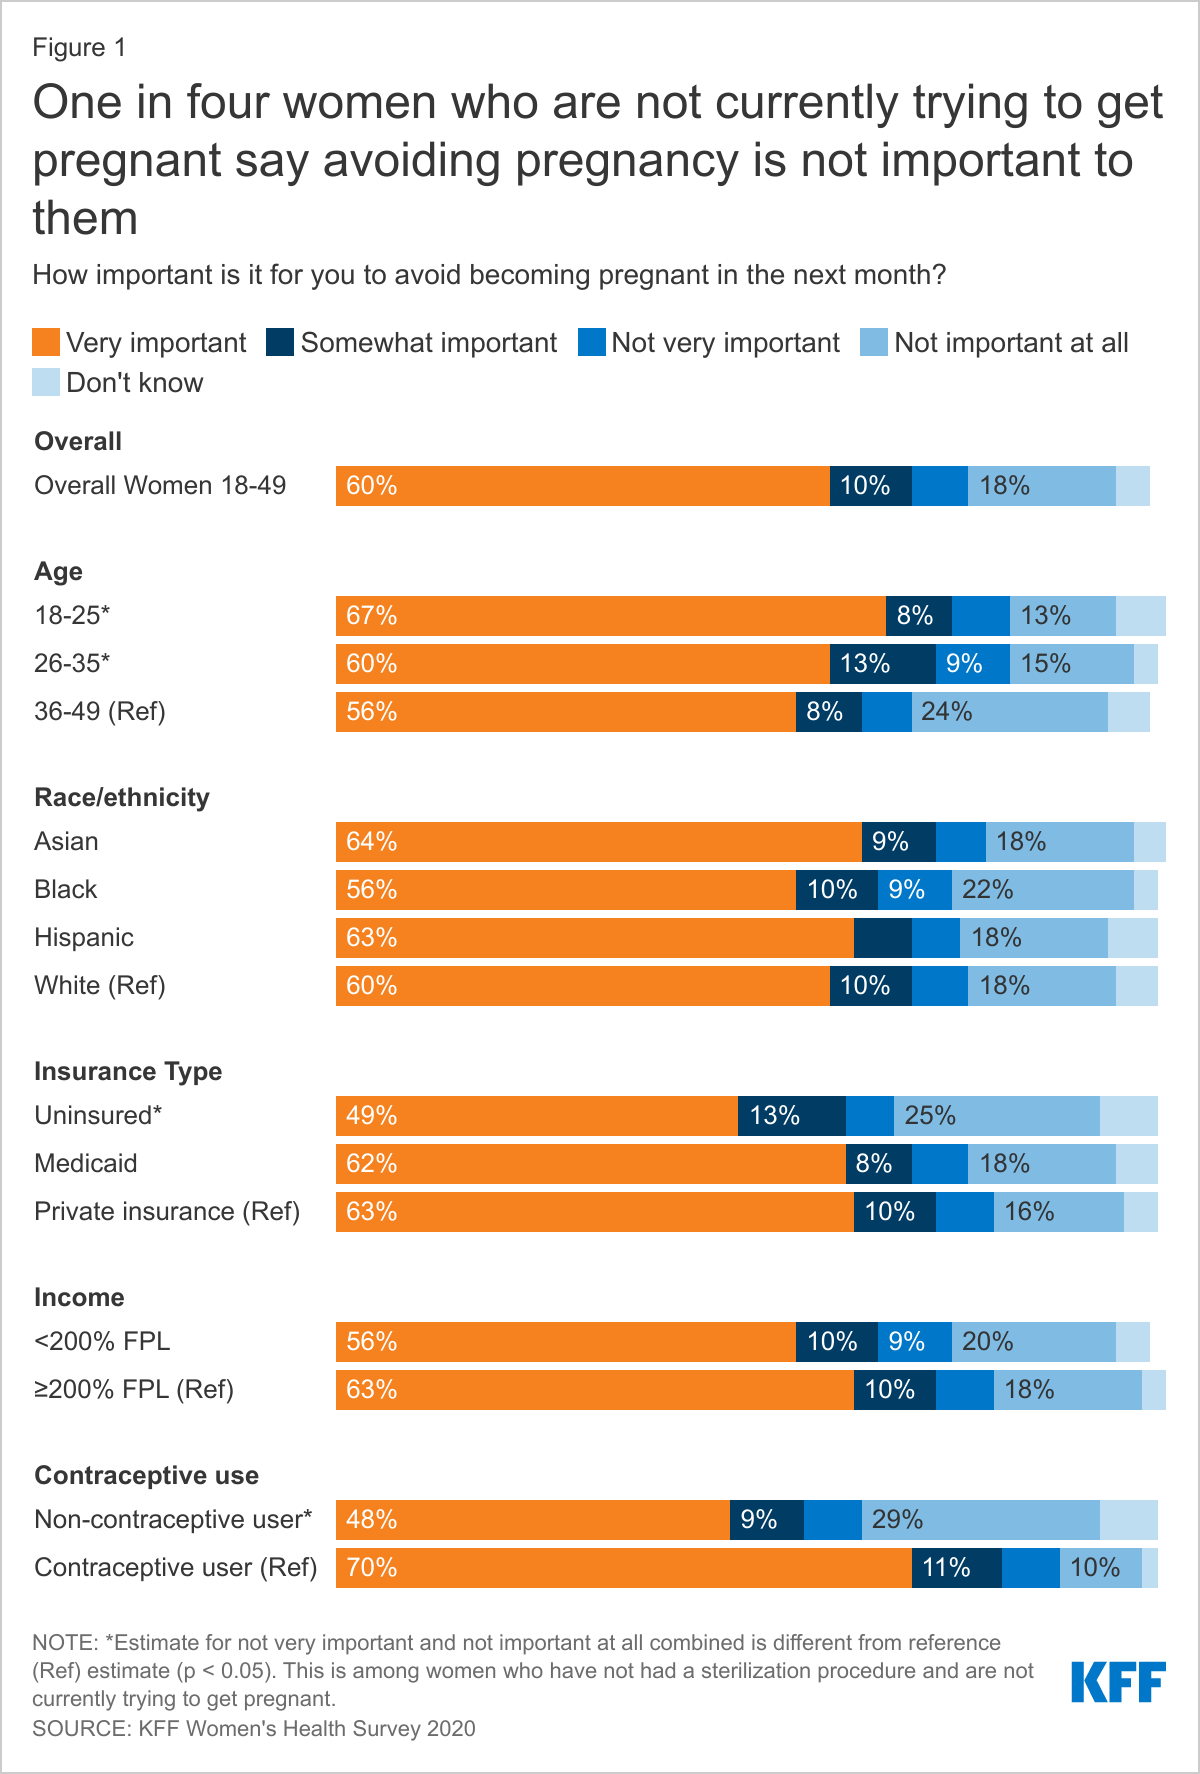
Six in ten (60%) women aged 18 to 49 years say it is very important to avoid becoming pregnant in the next month; one in four women (25%) say avoiding pregnancy is not a priority. One in seven (14%) sexually active women report they are not using any form of contraception and the leading reason is concern and dislike of side effects.
More than four in ten (44%) women have been worried they were pregnant when they did not want to be and the main reason was because they did not use birth control.
Oral contraceptives and condoms are the leading forms of reversible contraception women use, and almost a quarter say they use an intrauterine device (IUD).
Most women (72%) use more than one type of contraception in their lifetime and on average, women use 3.4 different contraceptive methods throughout their lifetime.
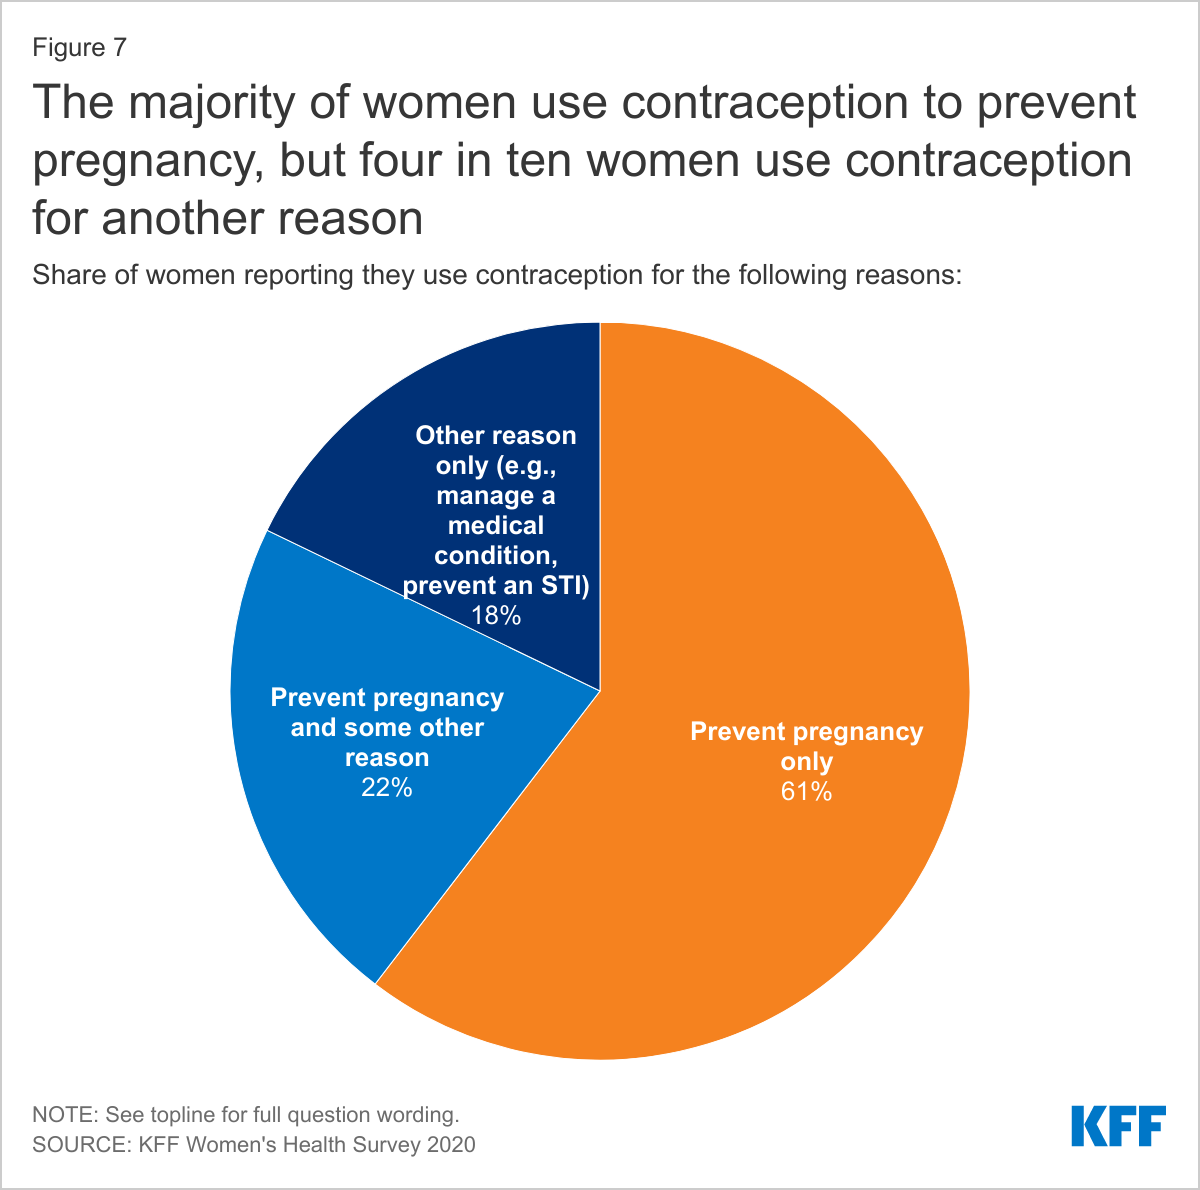
Nearly one in five women (18%) use contraception solely for a reason not related to preventing pregnancy such as managing a medical condition or preventing STIs.
Contraceptive Coverage
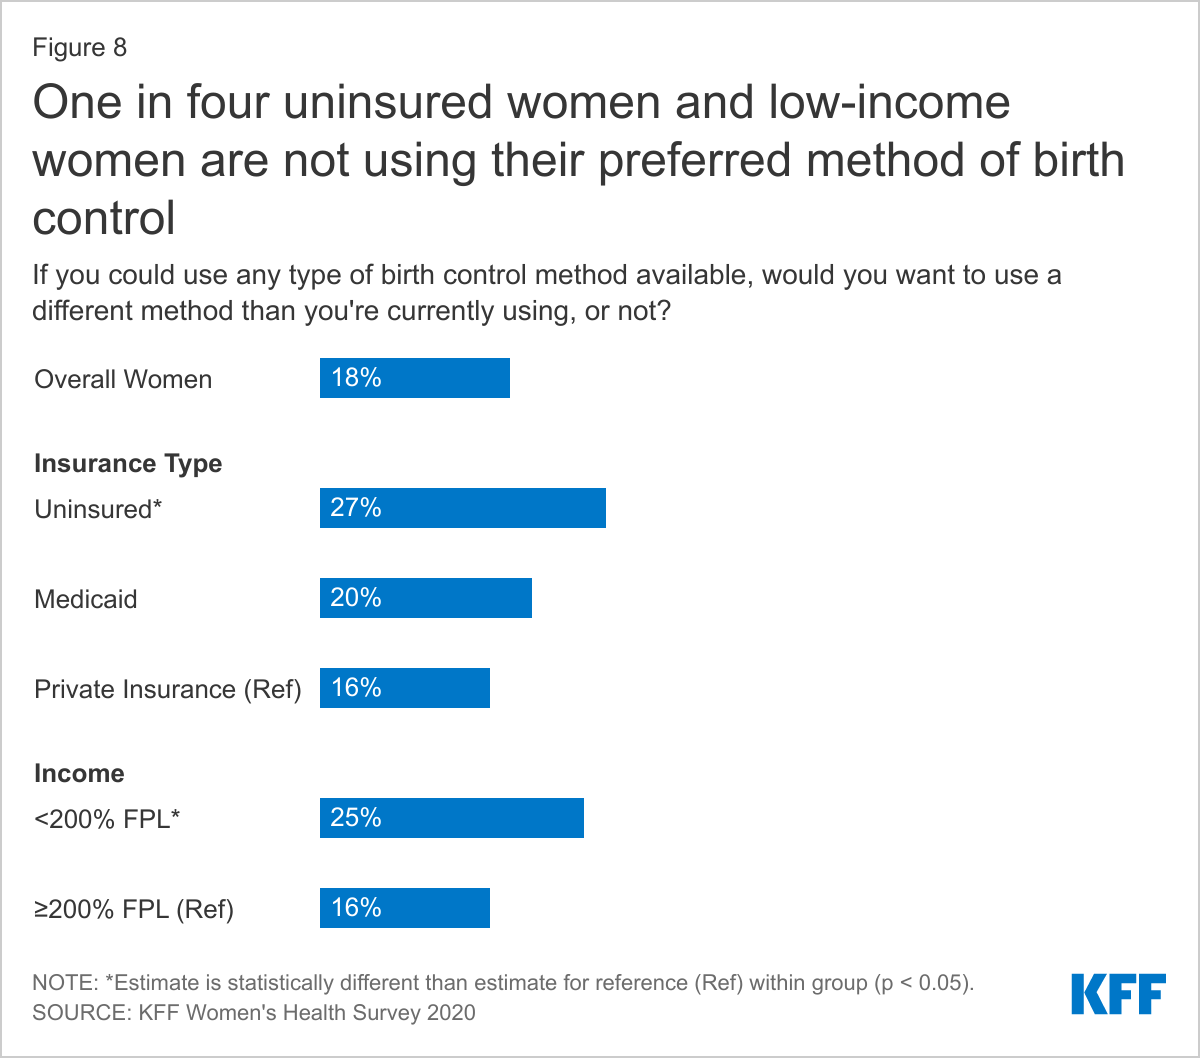
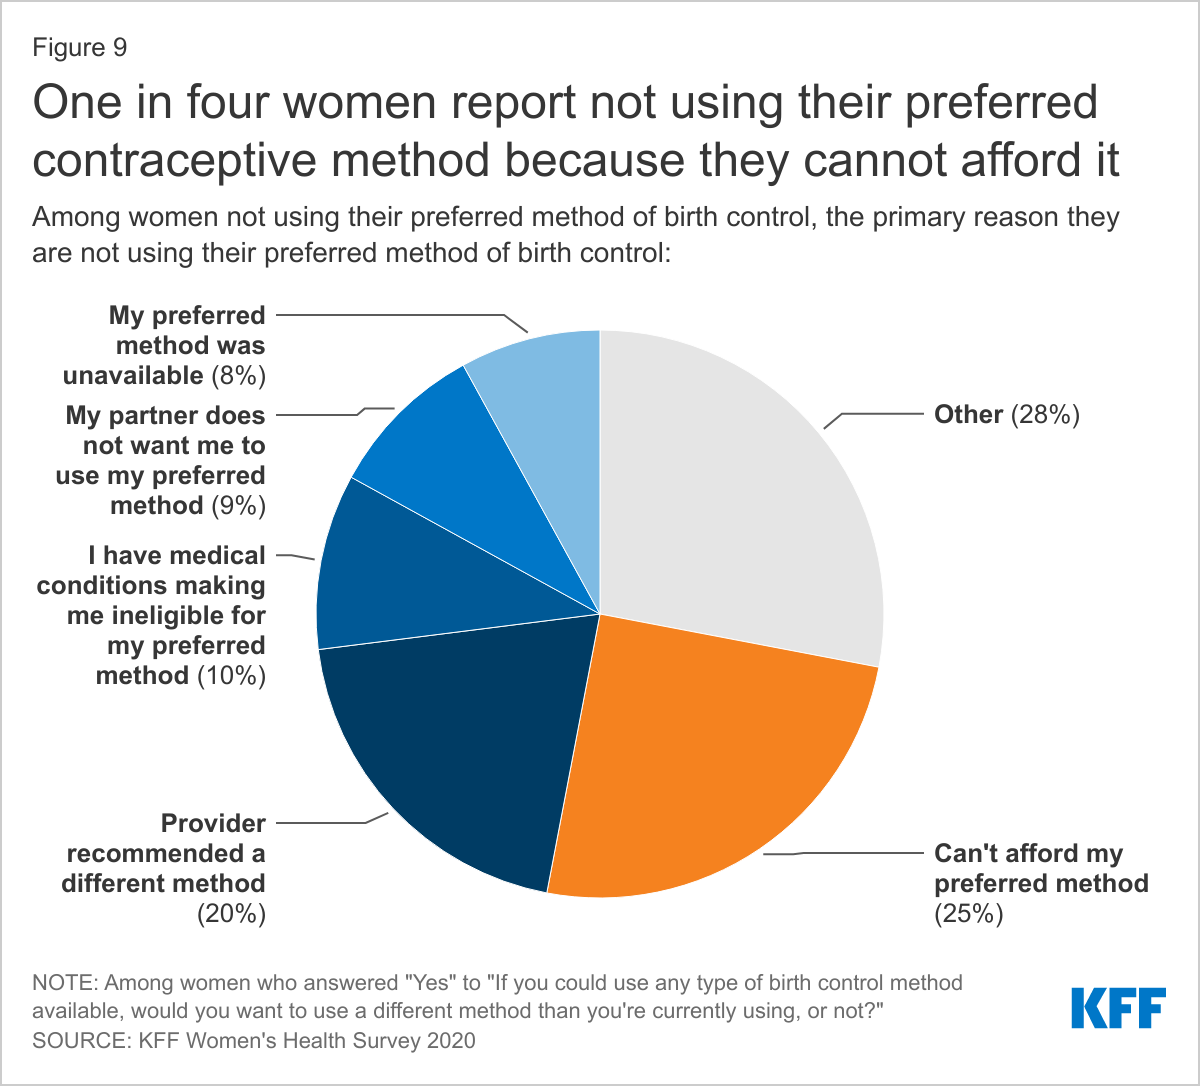
One in five women (18%) are not using their preferred method of contraception and a quarter (25%) say it is because they can’t afford it.
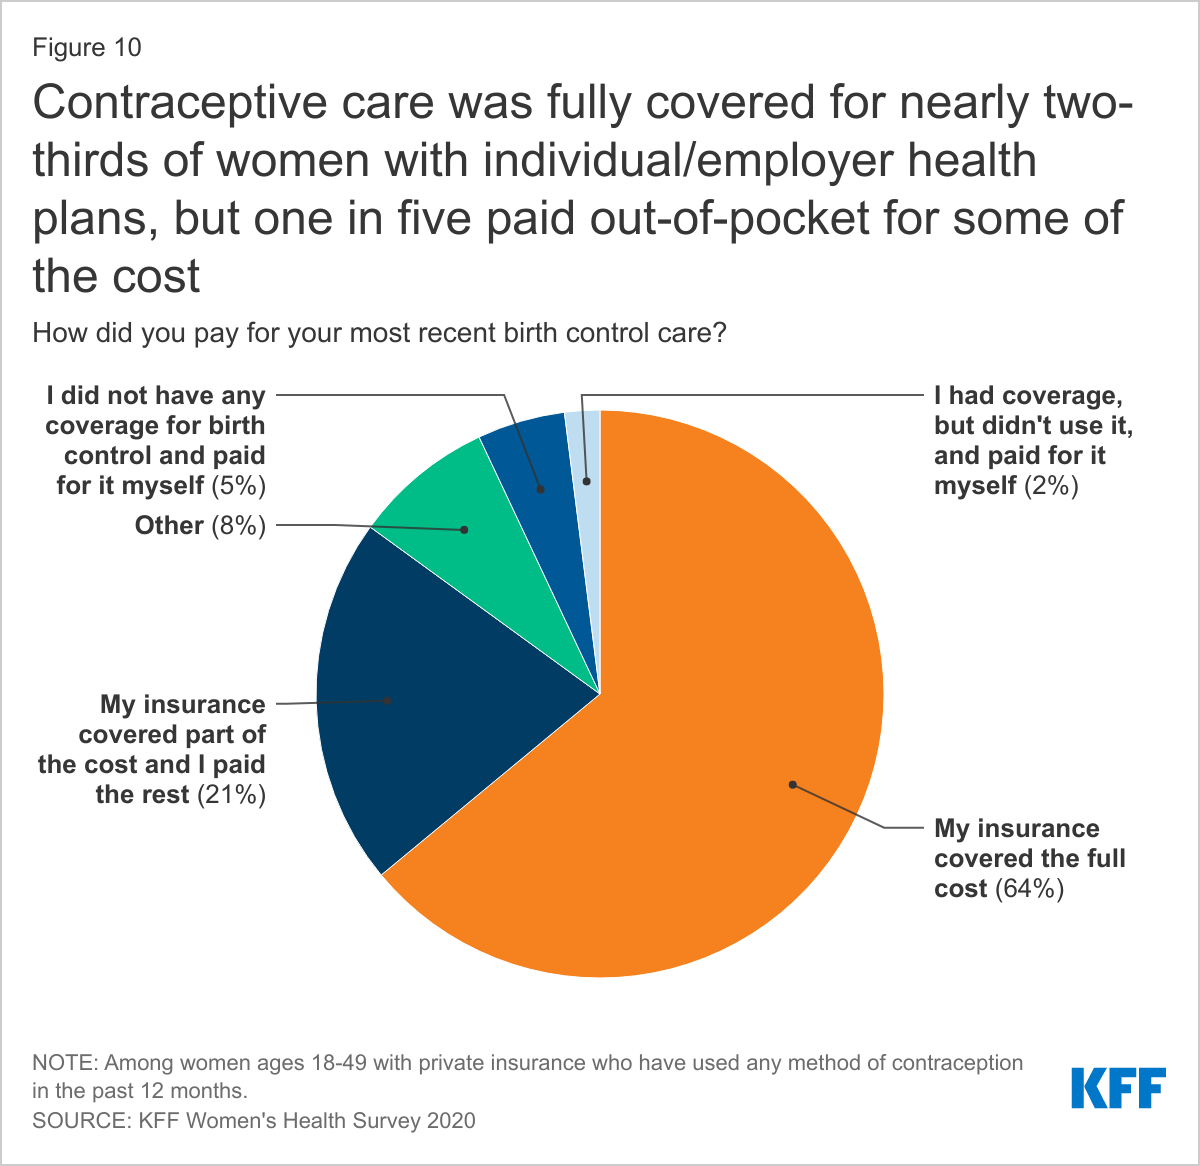
Almost two-thirds of privately insured women have full contraceptive coverage through their plans where all FDA-approved contraceptive methods and contraceptive counseling and education are covered without cost-sharing, but one in five women (21%) with private insurance are still paying some out-of-pocket costs for their contraceptive care.
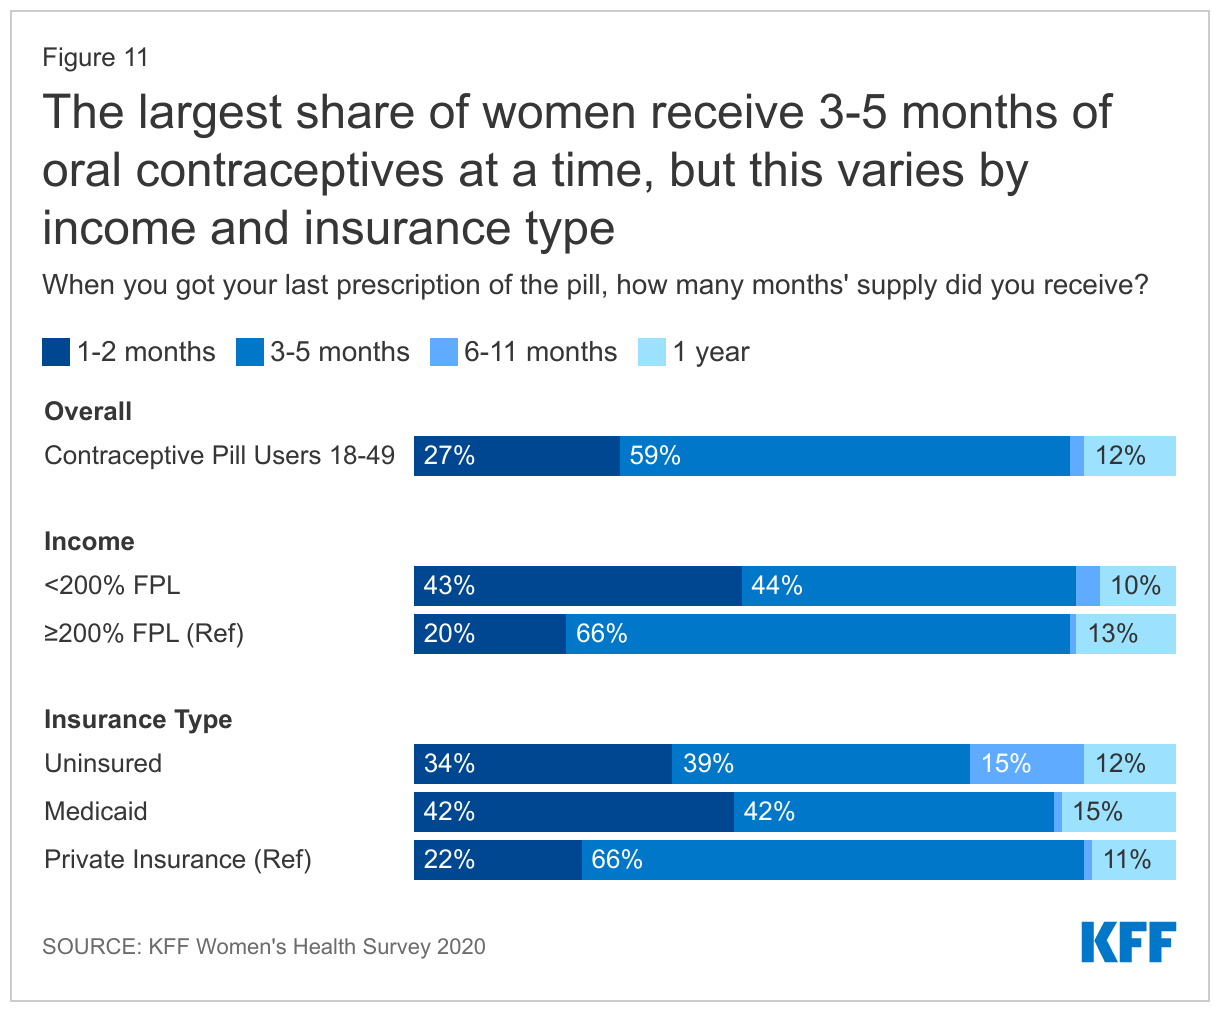
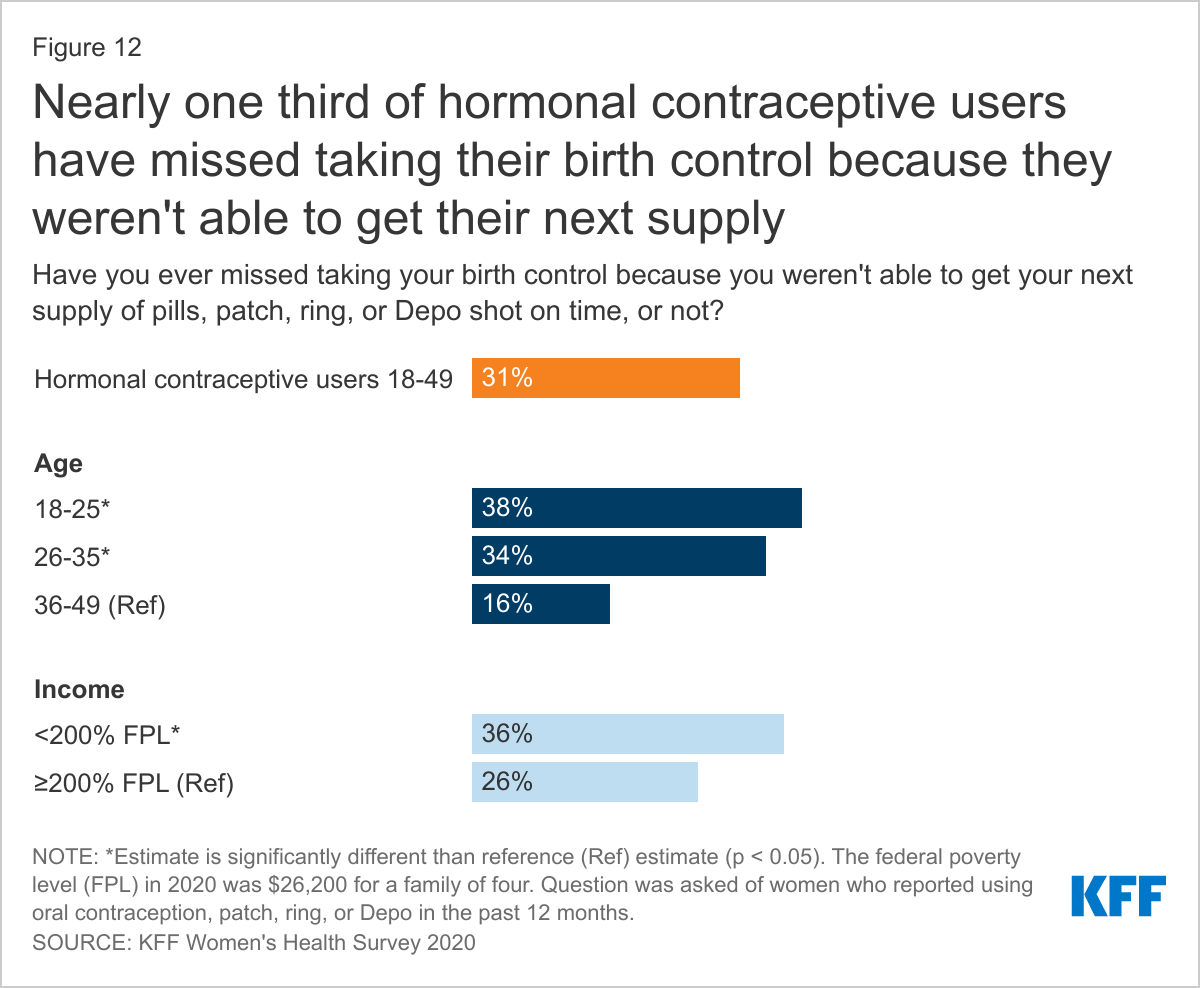
Nearly one-third (31%) of oral contraceptive users say they have missed taking their birth control because they were not able to get their next supply in time.
Access to Quality Sexual and Reproductive Health Care
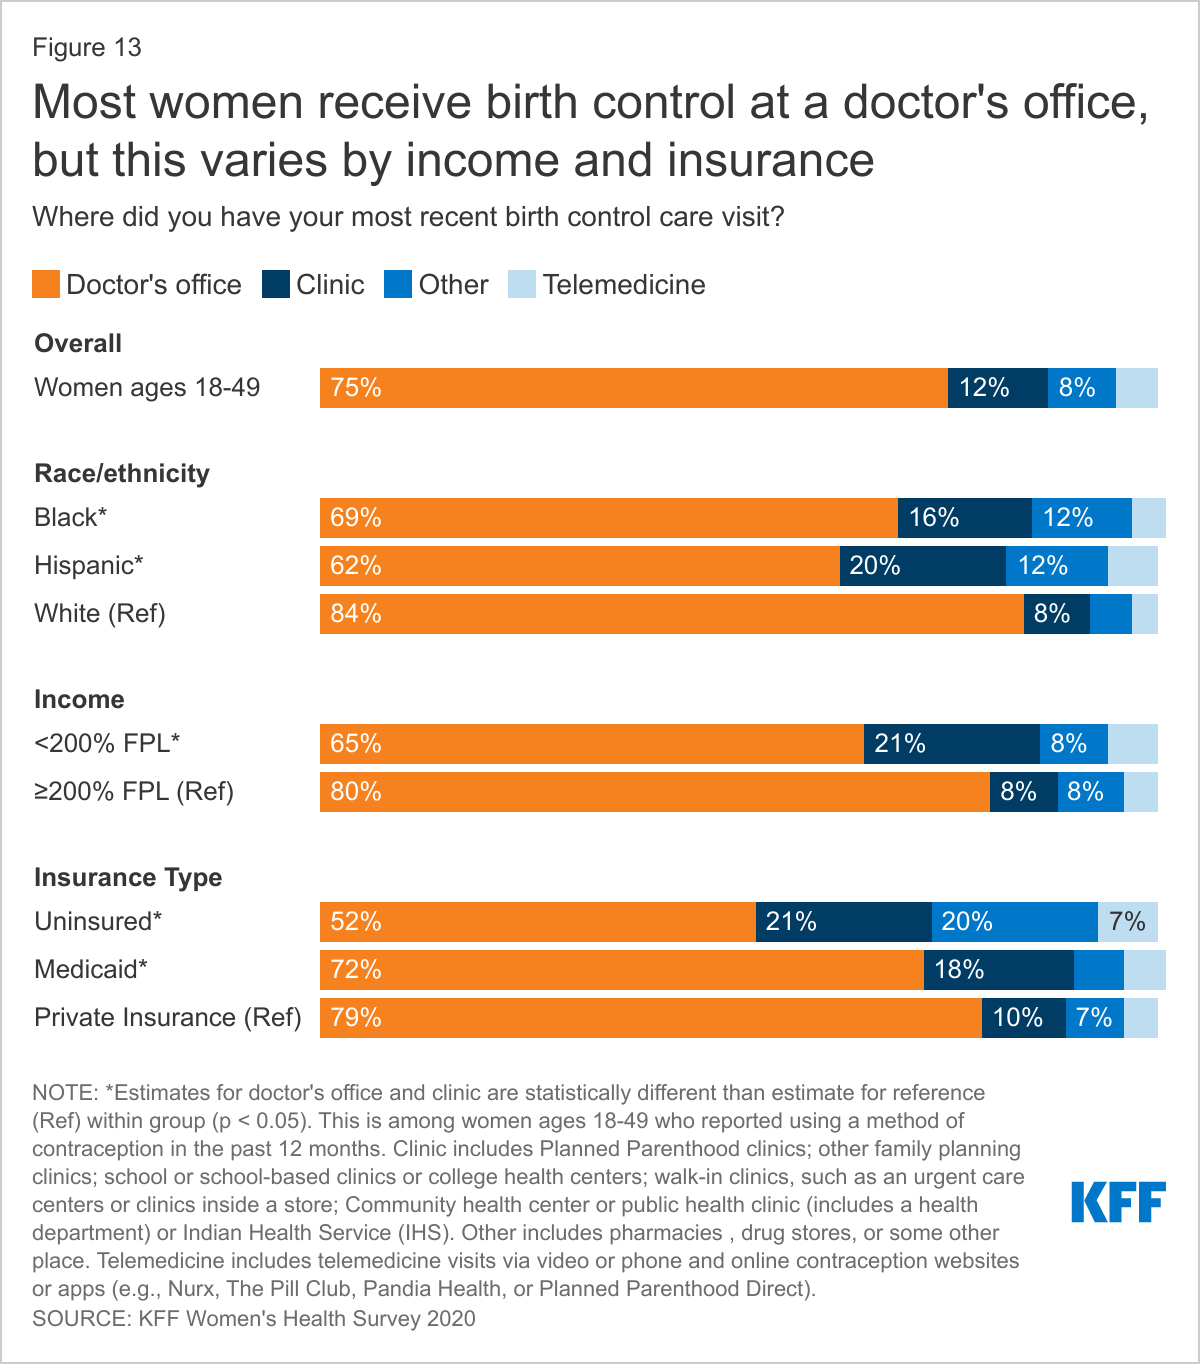
Publicly funded clinics provide contraceptive care for one in five low-income and uninsured women (21%). The majority of women rely on office-based providers for their birth control.
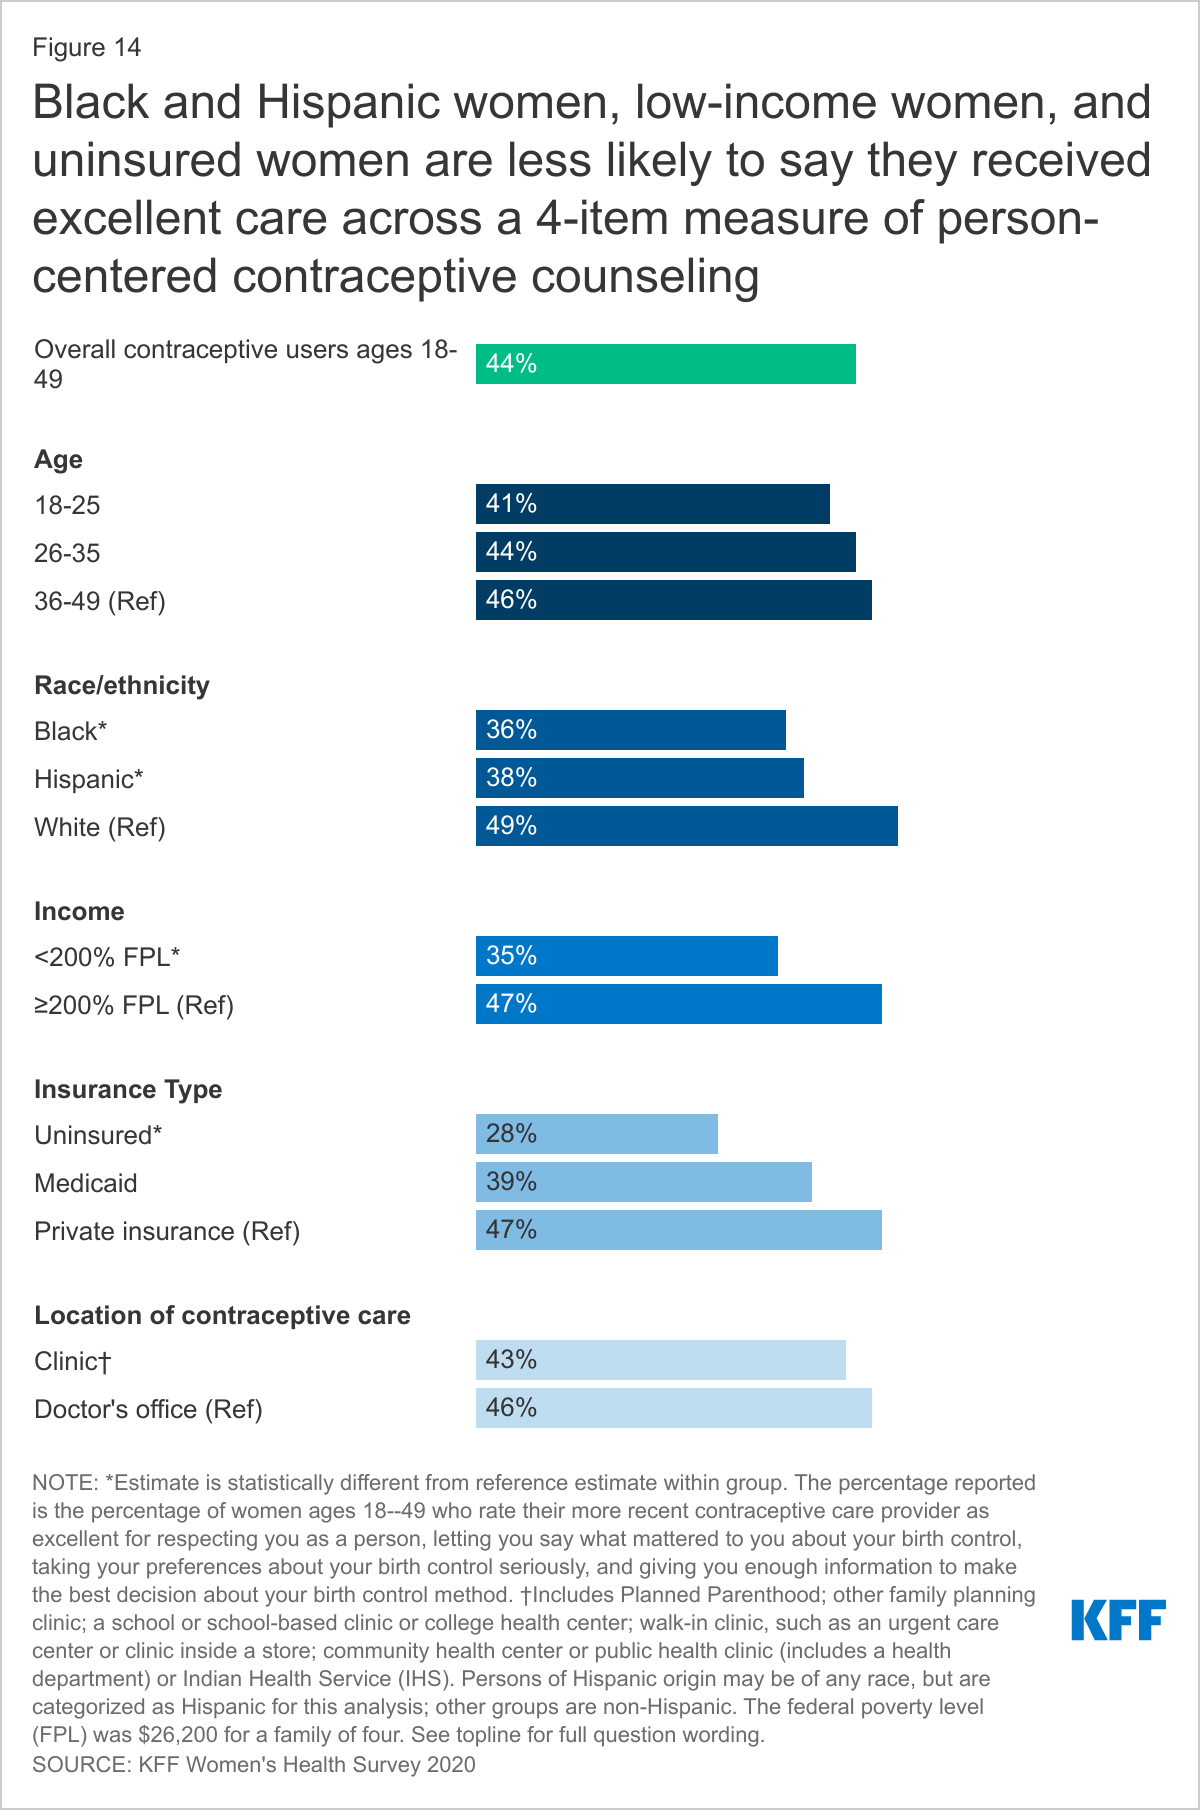
Four in ten women (44%) rate their provider’s contraceptive counseling as excellent, but the share rating counseling as excellent is lower among Black (36%) and Hispanic (38%) women, as well as low-income (35%) and uninsured (28%) women.
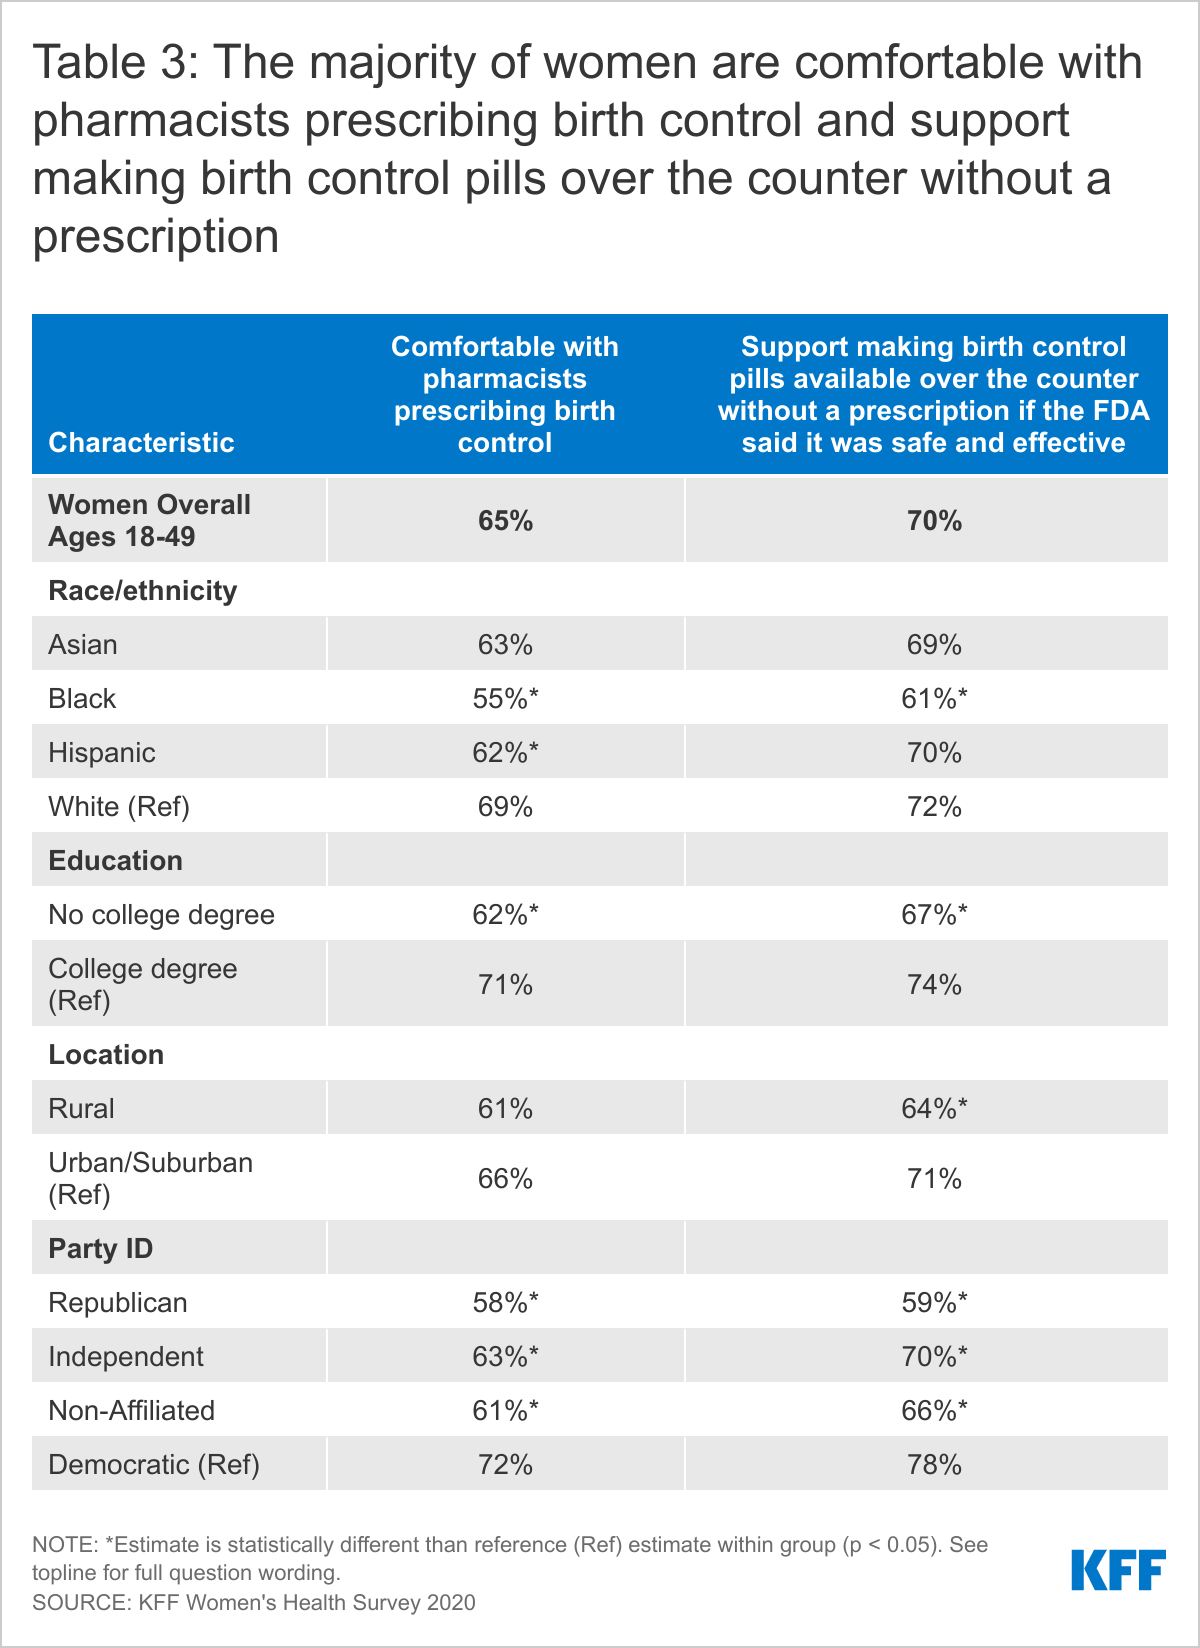
The majority of reproductive-aged women (65%) are comfortable with pharmacists prescribing birth control and support making birth control available over the counter without a prescription (70%).
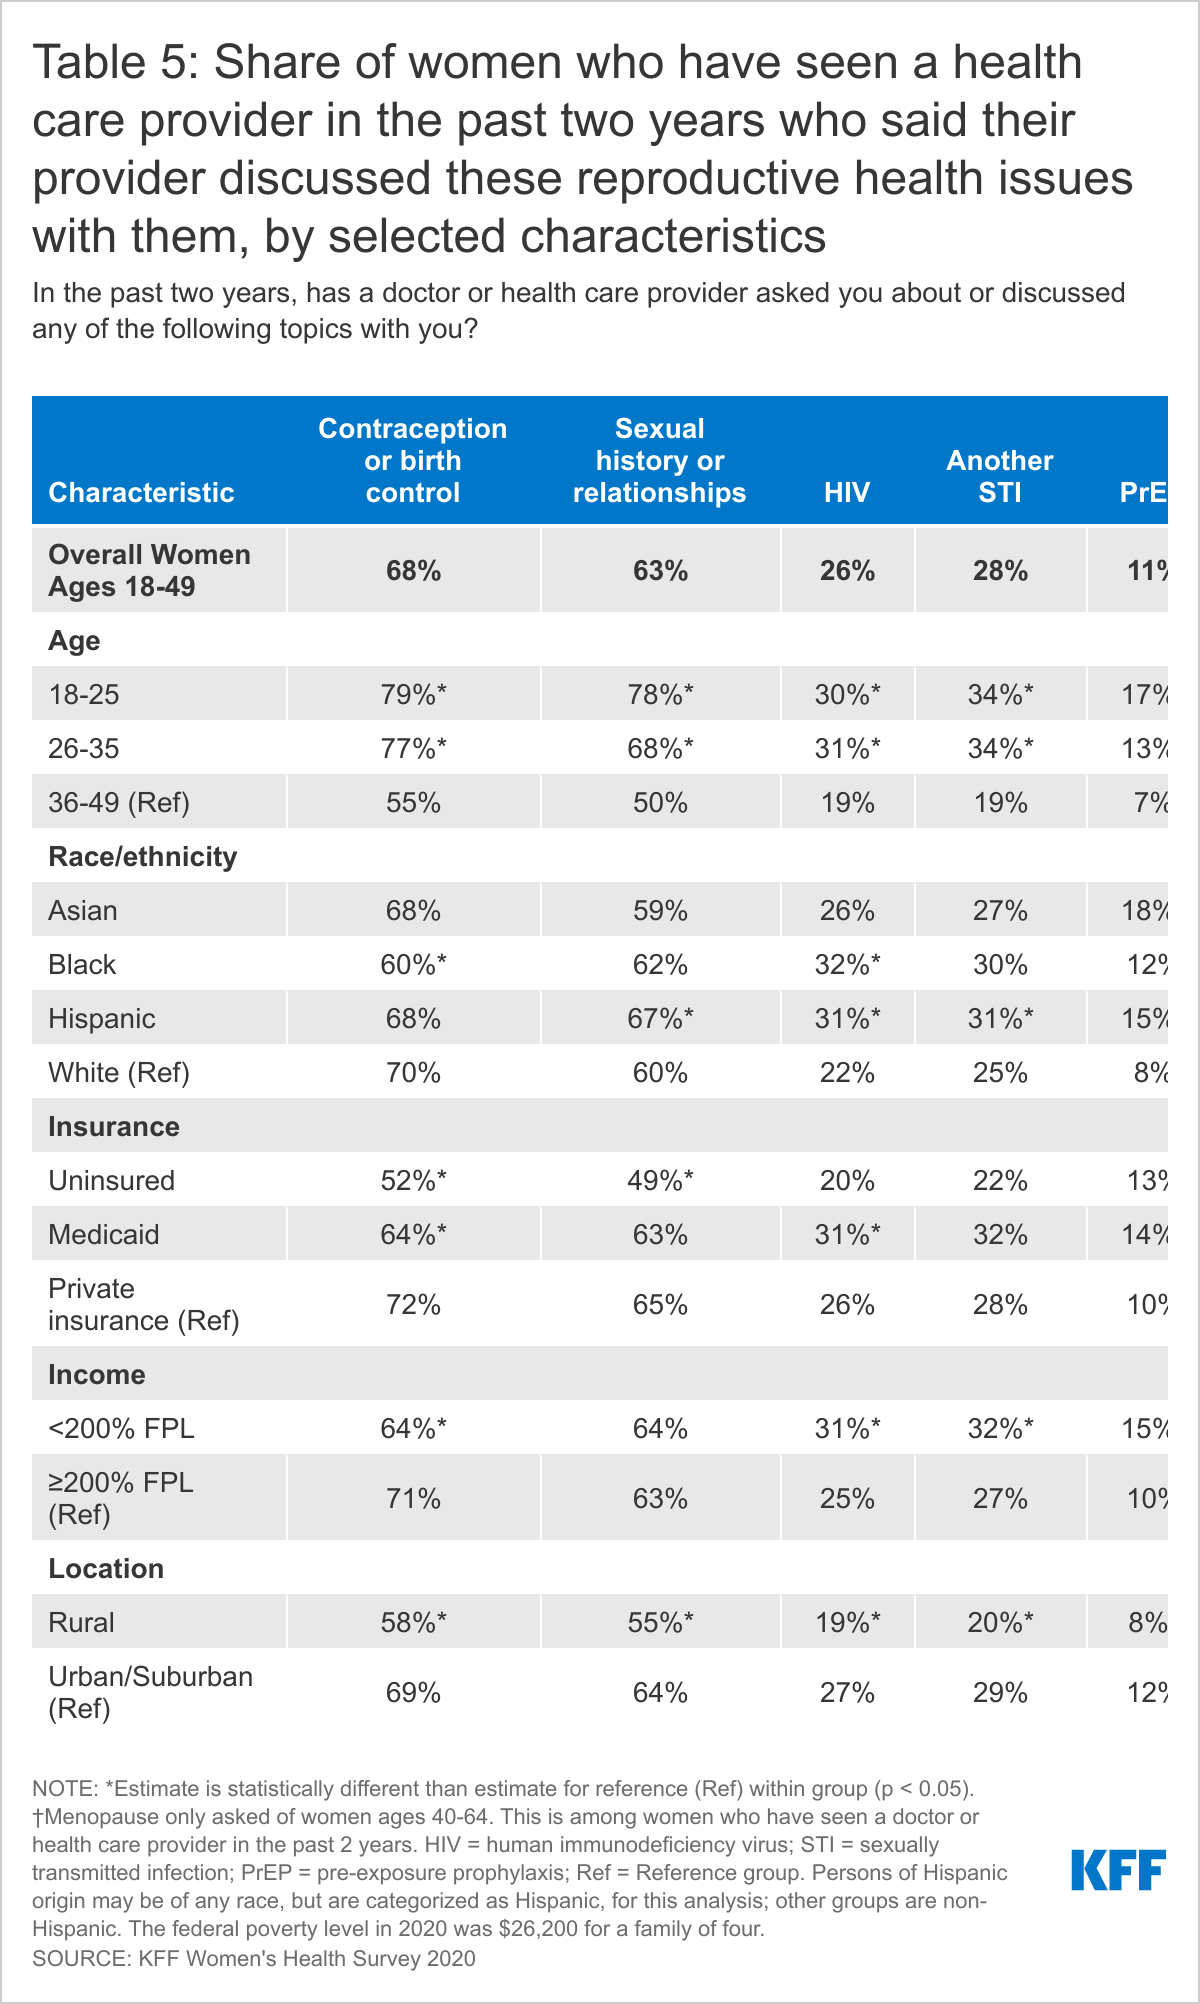
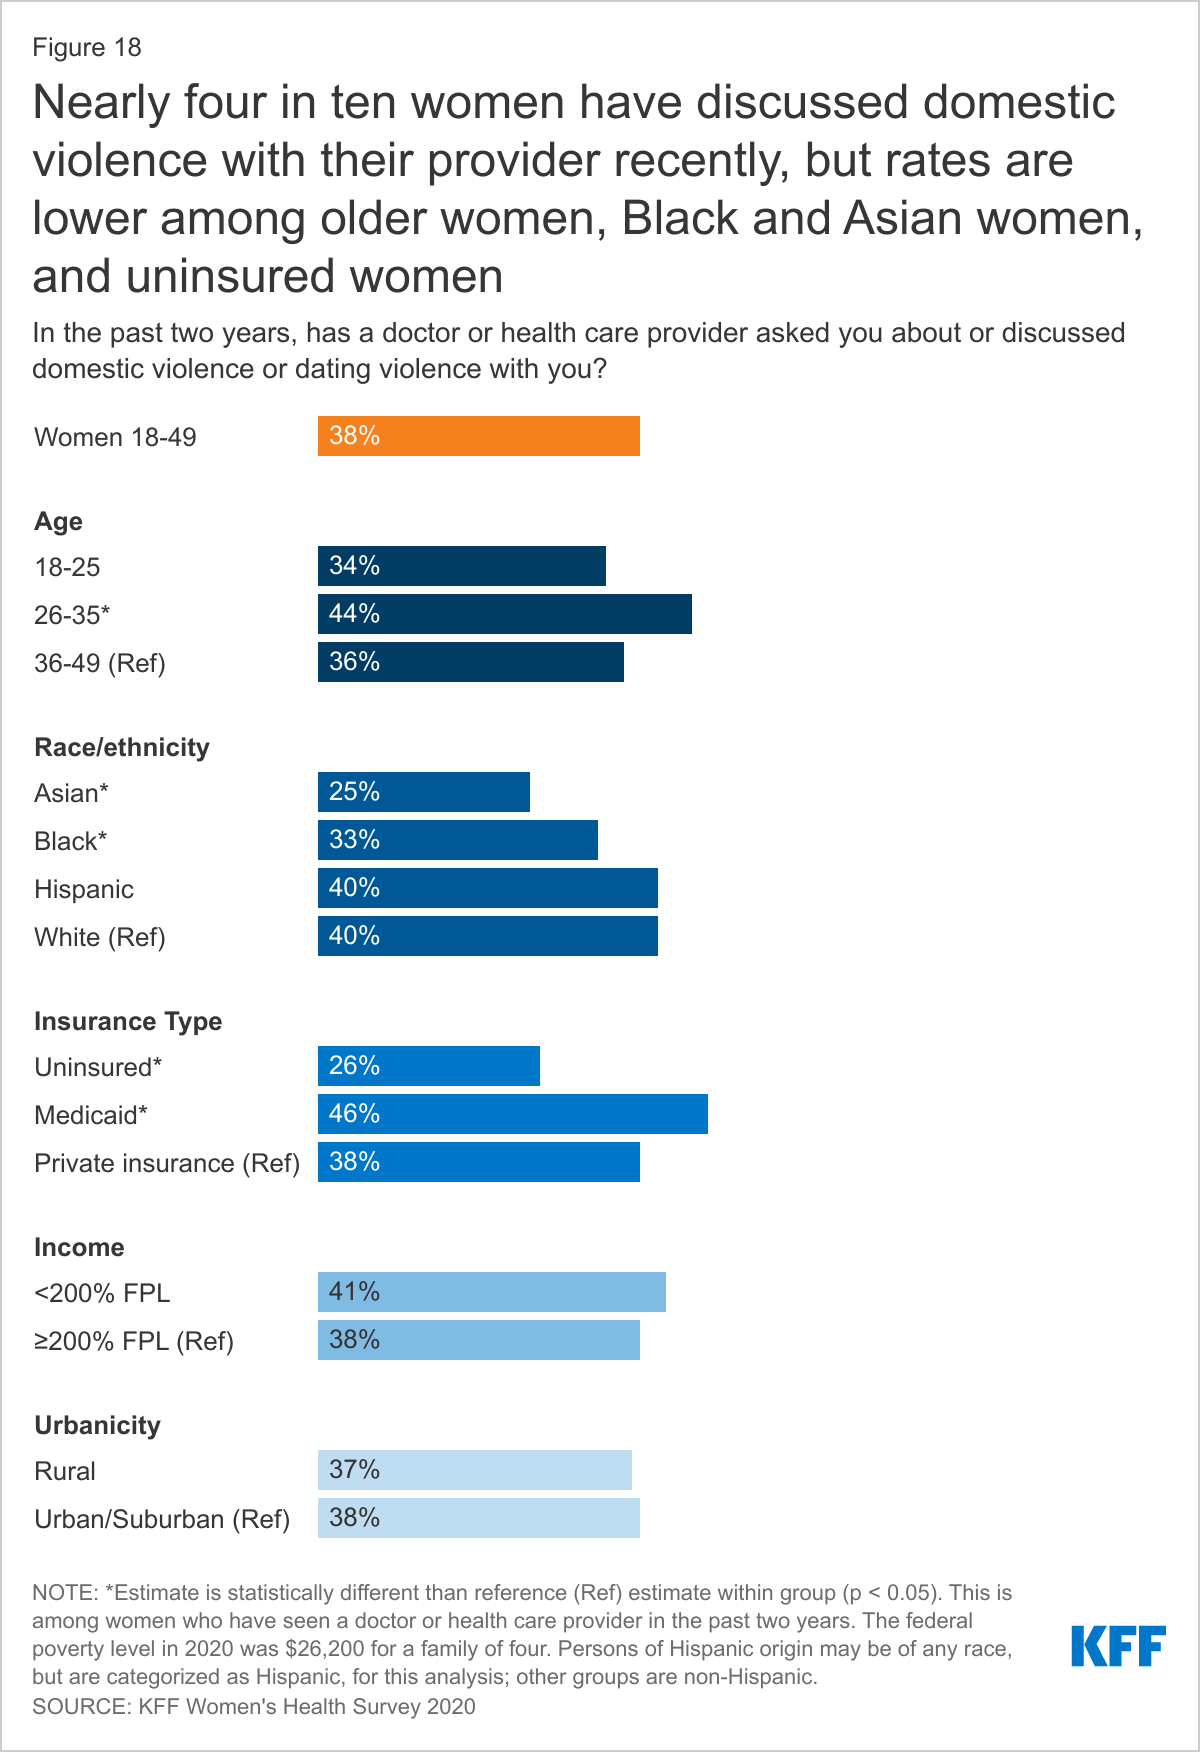
Most reproductive-aged women have discussed contraception with their providers (68%), but a much smaller shared were asked about sexually transmitted infections (26%-28%) and domestic violence (38%). Only about 1 in 10 (11%) of women of reproductive age say they have discussed HIV pre-exposure prophylaxis (PrEP) with their provider.
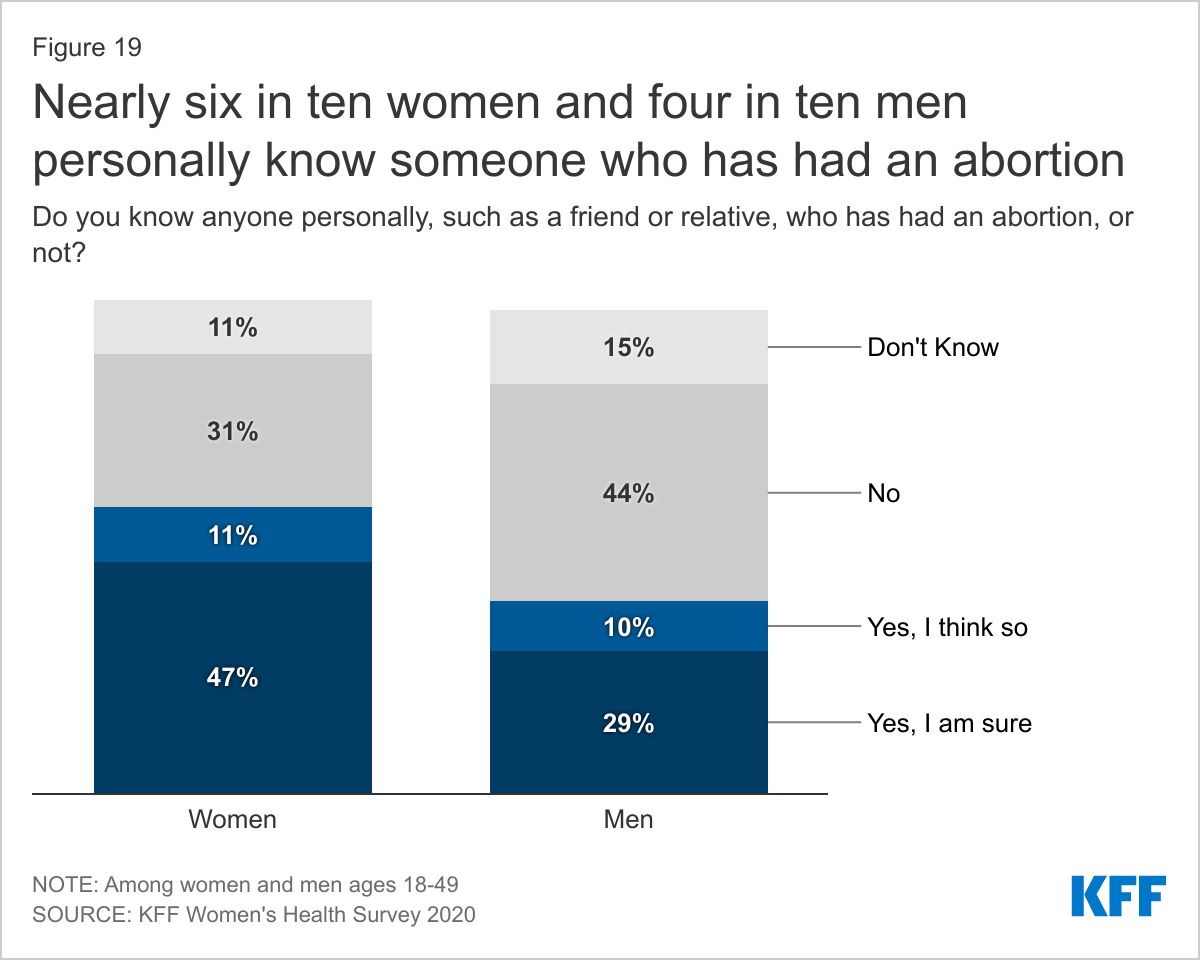
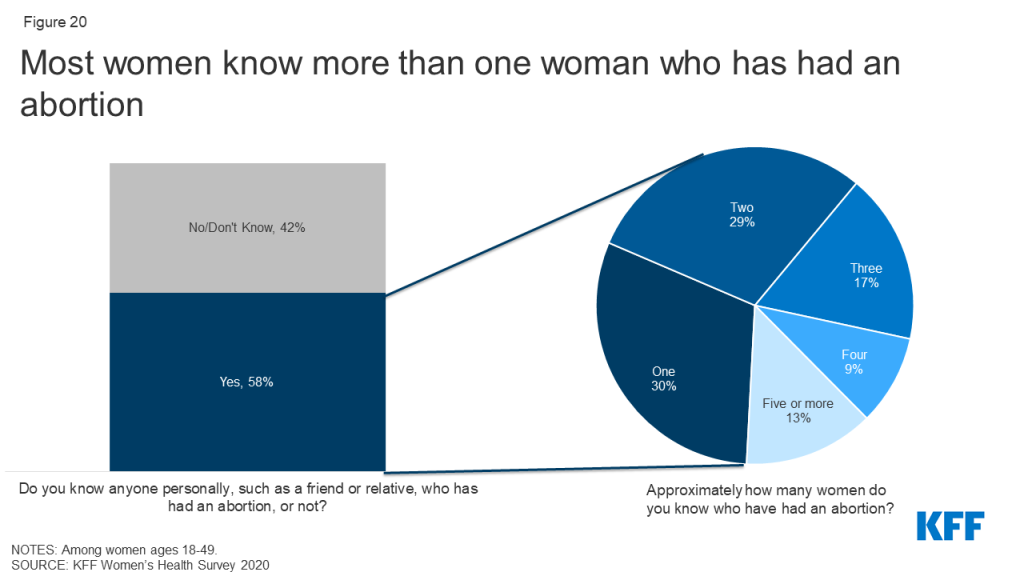
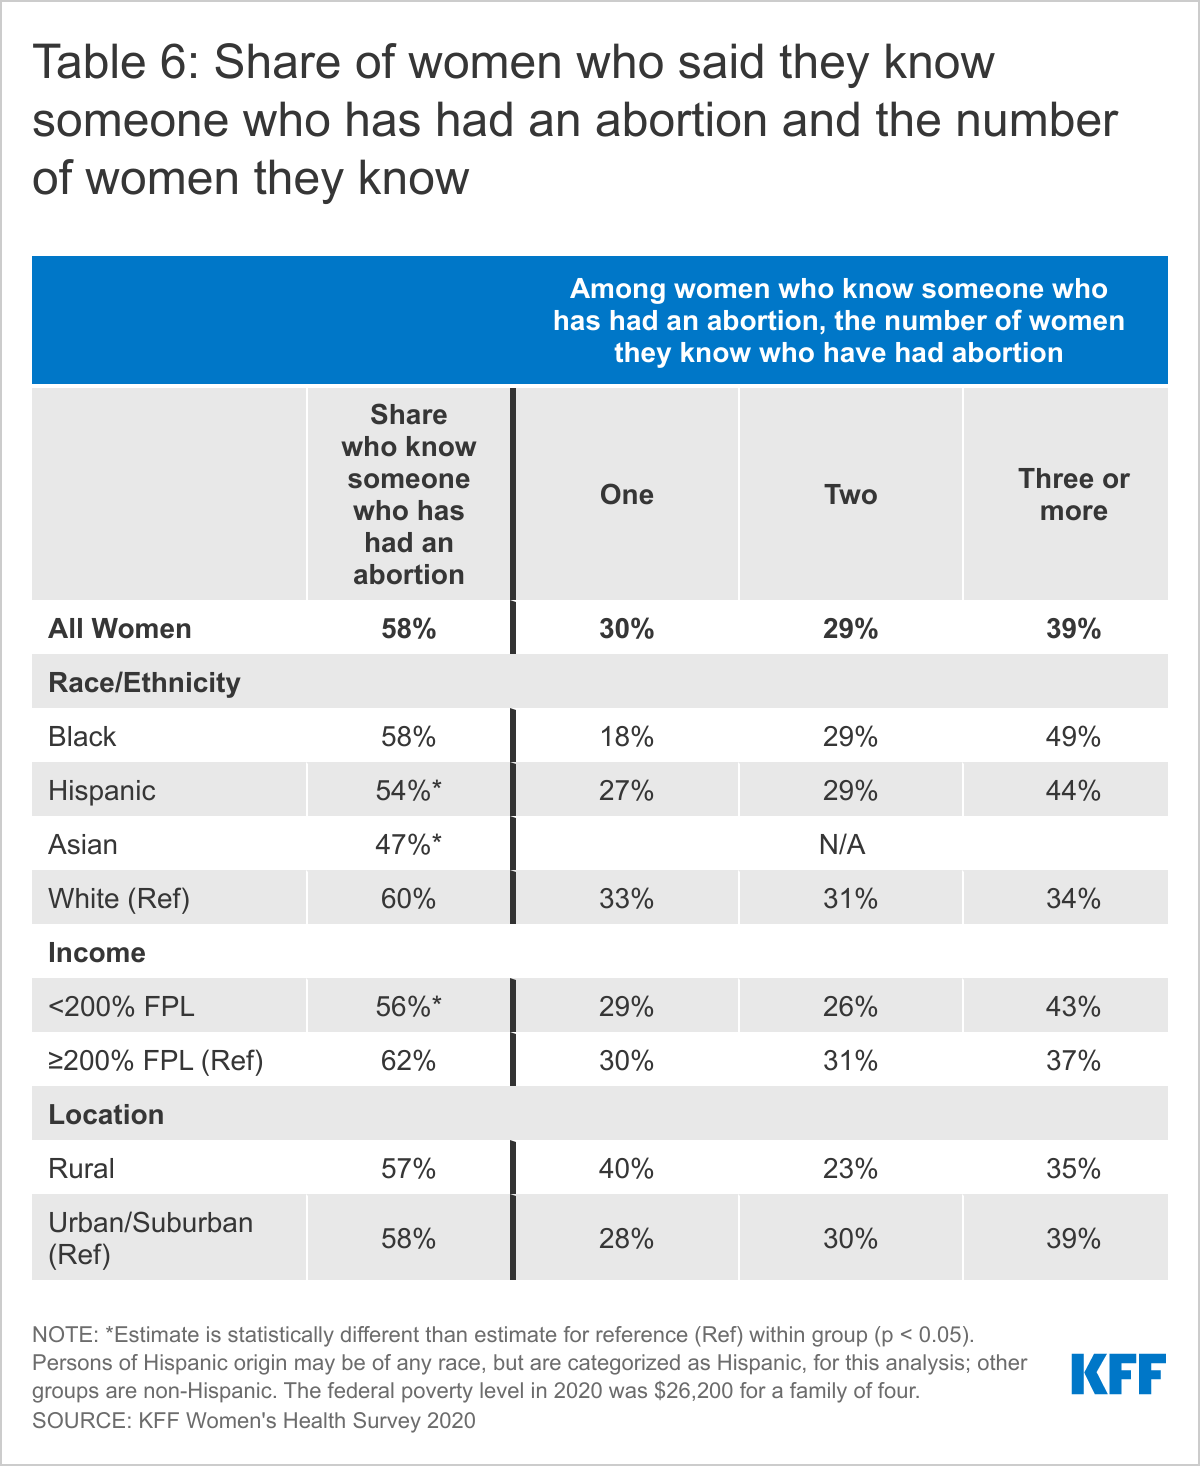
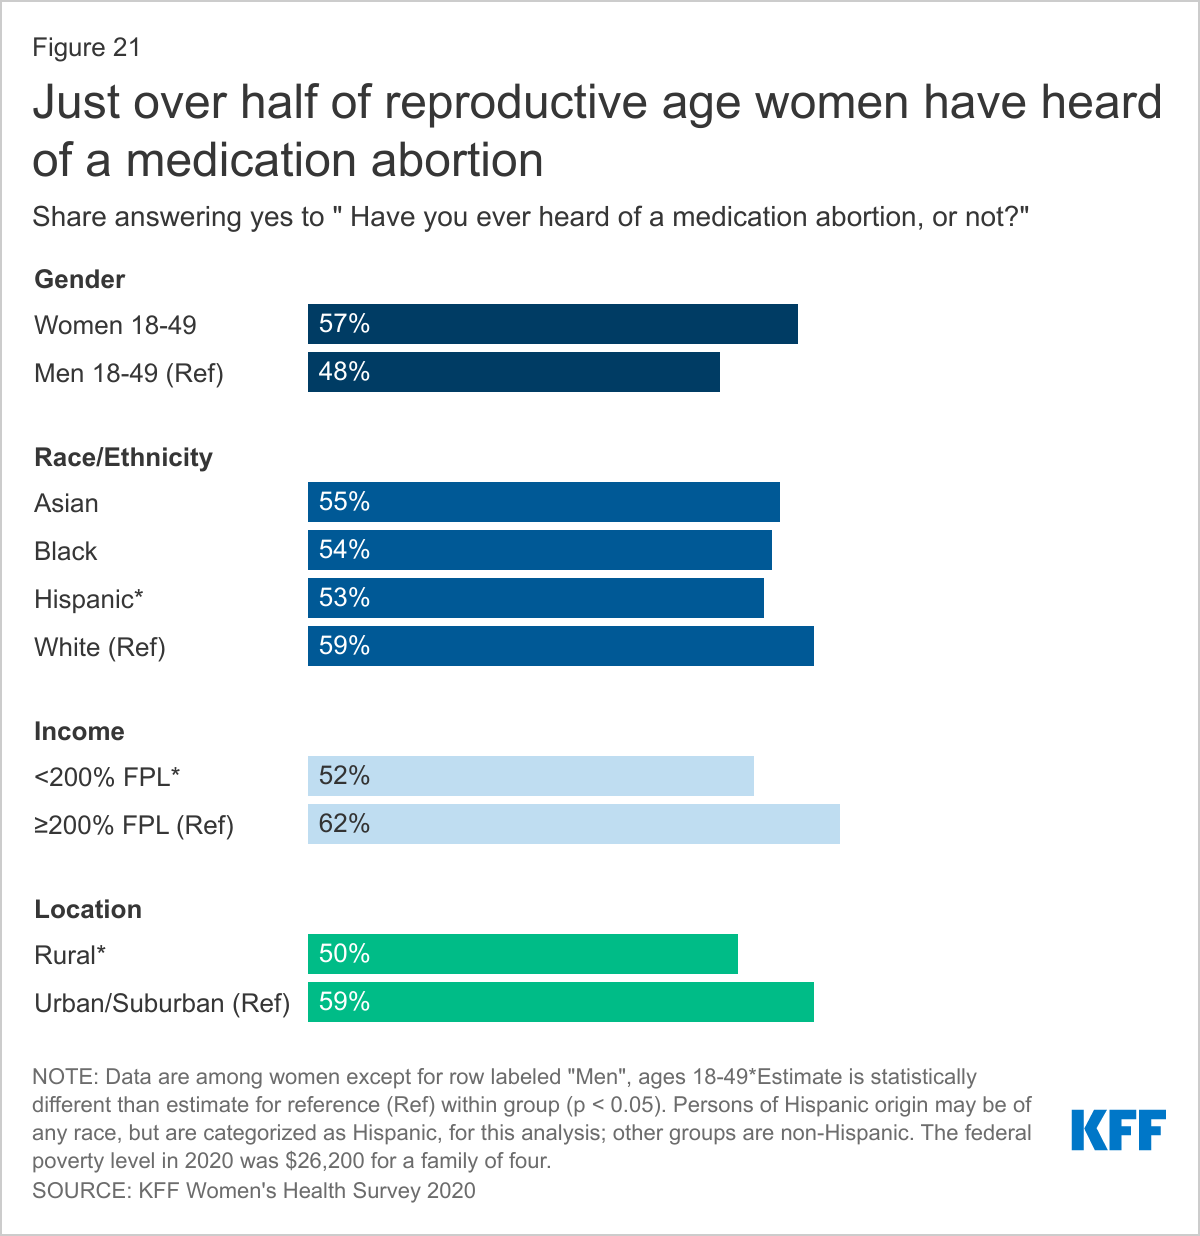
Most reproductive-aged women (58%) know someone who has had an abortion with 68% of those women knowing more than one person and just over half of women have heard of a medication abortion (57%).
Introduction
Sexual and reproductive health is an integral part of women’s overall health. Access to these services is shaped by a broad range of factors including coverage and affordability, national and state policies, availability of care, health provider characteristics, as well as individual preferences and experiences. For many women, the Affordable Care Act (ACA) improved access to sexual and reproductive health care by expanding pathways to Medicaid eligibility and making private insurance more affordable. The ACA also required private health insurance plans to cover many recommended preventive services without any patient cost-sharing, such as sexually transmitted infection counseling and screening and all 18 FDA-approved contraceptive methods. While the ACA has expanded sexual and reproductive health care, state and federal policy actions in recent years have resulted in more limited access to comprehensive sexual and reproductive health care, including abortion referrals and services, particularly for women who depend on publicly supported health care providers and clinics.
Access in the past year has also been undoubtedly affected by the COVID-19 pandemic, which has forced providers to find ways to make contraceptive and STI services available via telehealth or through minimal contact, like no-test medication abortions. There is increasing interest in expanding efforts to allow pharmacists to prescribe birth control, gain FDA approval for over-the-counter oral contraception without a prescription, and expanding access to contraception through smartphone apps or online platforms that no longer require a visit to a brick-and-mortar clinic or doctor’s office.
While the system is undergoing constant change, the perspectives and experiences of women in obtaining sexual and reproductive health care can help to shape the next generation of policies and programs. This brief provides a window into some of those voices and perspectives by presenting selected findings from the 2020 KFF Women’s Health Survey, a nationally representative survey of women conducted in November/December of 2020 (Methodology). The survey covered a wide range of topics related to women’s coverage, use, access, and experiences with the health care system. This brief presents survey findings on coverage and use of reproductive and sexual health services among different subgroups of 2,695 women ages 18 to 49.
Use of Contraceptives
WHILE MOST REPRODUCTIVE AGE WOMEN SAY IT IS IMPORTANT TO THEM TO PREVENT PREGNANCY, ONE IN FOUR WOMEN SAY AVOIDING PREGNANCY IS NOT A PRIORITY.
Among women ages 18-49 who are not currently trying to get pregnant, the majority say it is very important (60%) or somewhat important (10%) for them to avoid becoming pregnant in the next month, but a quarter of women (25%) say it is not very important or not important at all (Figure 1). More than half (57%) of women who are not using contraception say that it is very important or somewhat important for them to avoid pregnancy compared to 81% of women using contraception. These data speak to the fact that even though women are not necessarily trying to get pregnant, they may be open to having a pregnancy and may not want to use contraception.
WOMEN ARE NEARLY TWICE AS LIKELY TO HAVE BEEN CONCERNED ABOUT AN UNWANTED PREGNANCY COMPARED TO MEN.
Over four in ten (44%) women have thought they were pregnant when they did not want to be, compared to one in four (27%) men who said this with regard to a partner (Figure 2). Nearly half (47%) of women and over half of men (57%) said it was because they did not use birth control. About a quarter of women (23%) and men (27%) said they or their partner had missed a pill or they had used their birth control incorrectly, 19% of women and 16% of men said their birth control failed like a condom breaking, and 18% of women and 22% of men weren’t sure the contraceptive method they were using worked.
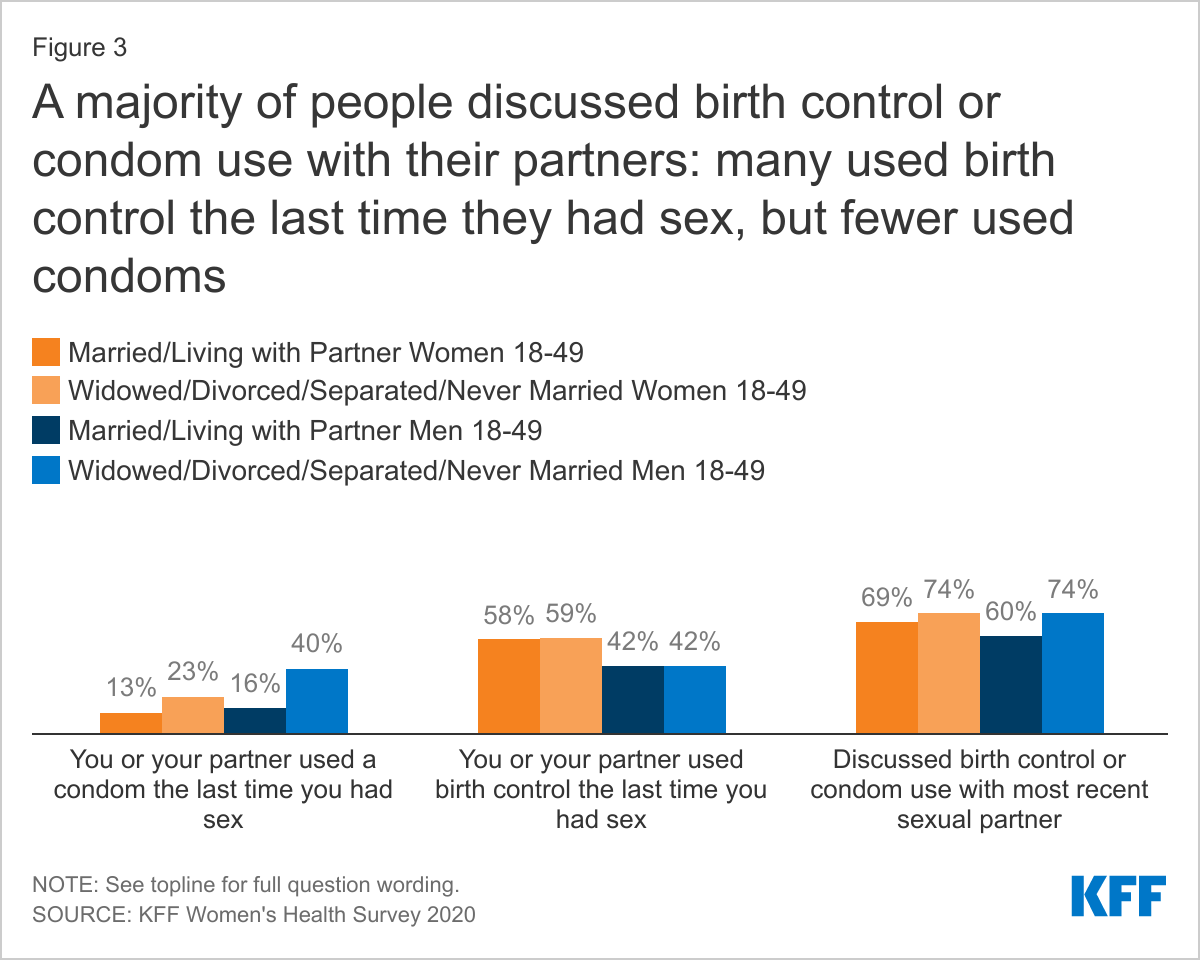
A MINORITY OF WOMEN AND MEN USED CONDOMS THE LAST TIME THEY HAD SEX.
Six in ten sexually active women report using a method of contraception the last time they had sex compared to four in ten men, regardless of current partner status (Figure 3). Condom use at last sex was lower. Overall, 16% of women say their partner used a condom the last time they had sex, and 26% of men report using a condom. This differed significantly by whether someone was married or living with their partner compared to not. Condoms are not only used as contraceptives but are effective in reducing the risk of transmission of sexually transmitted infections. Men who are married or living with a partner are 2.5 times more likely to use a condom than men who are widowed, divorced, separated, or never married (40% vs. 16%). Thirteen percent of women who are married or living with a partner say their partner used a condom the last time they had sex compared to 23% of women who are widowed, divorced, separated, or never married. When asked if they had discussed birth control or condom use with their most recent sexual partner, the majority of men and women, regardless of partner status, said they had discussed with their partner.
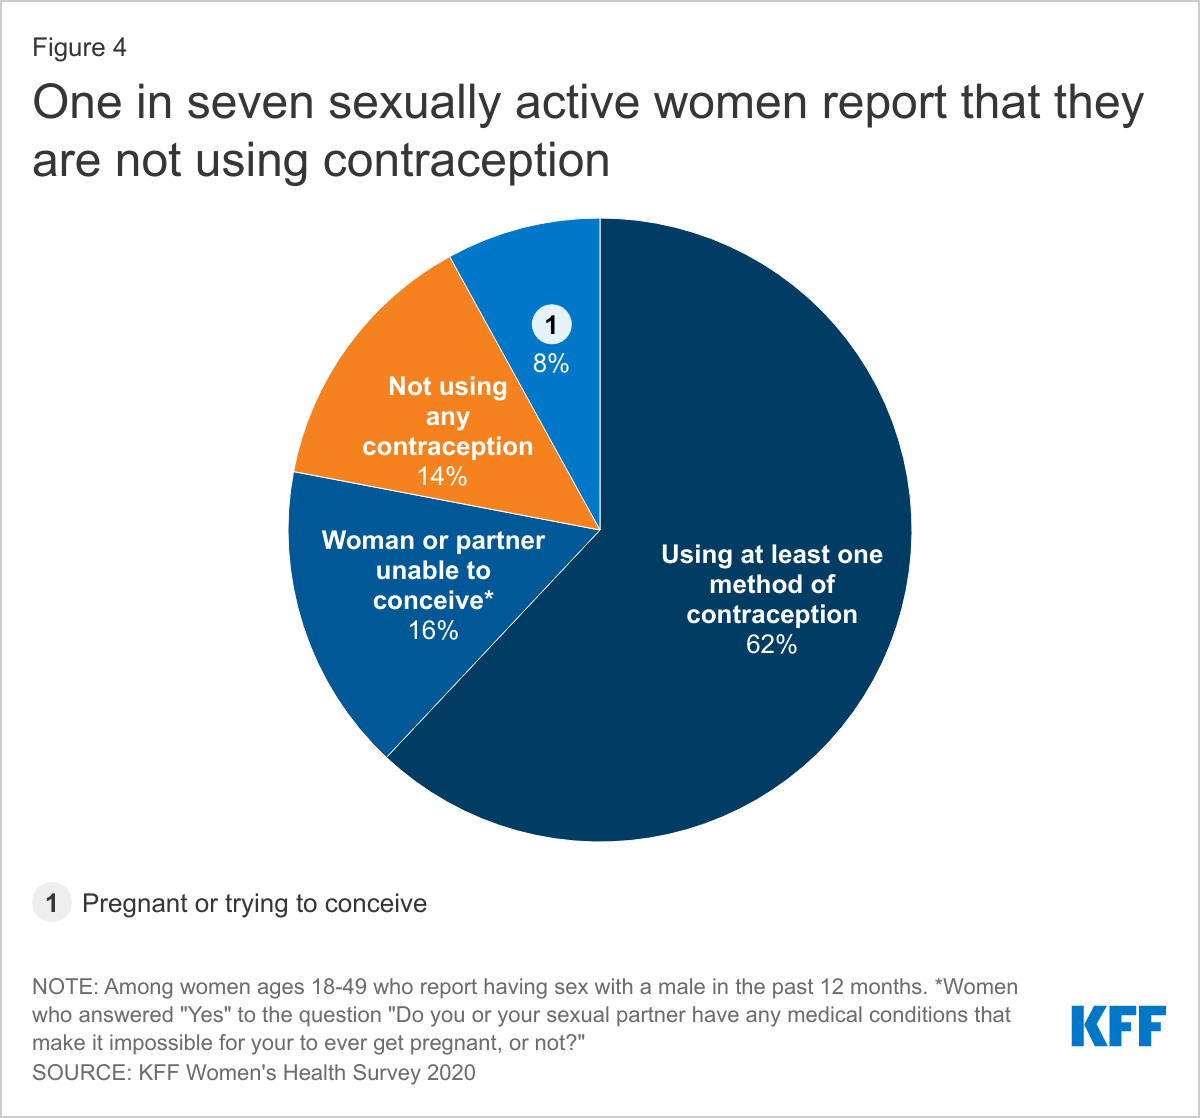
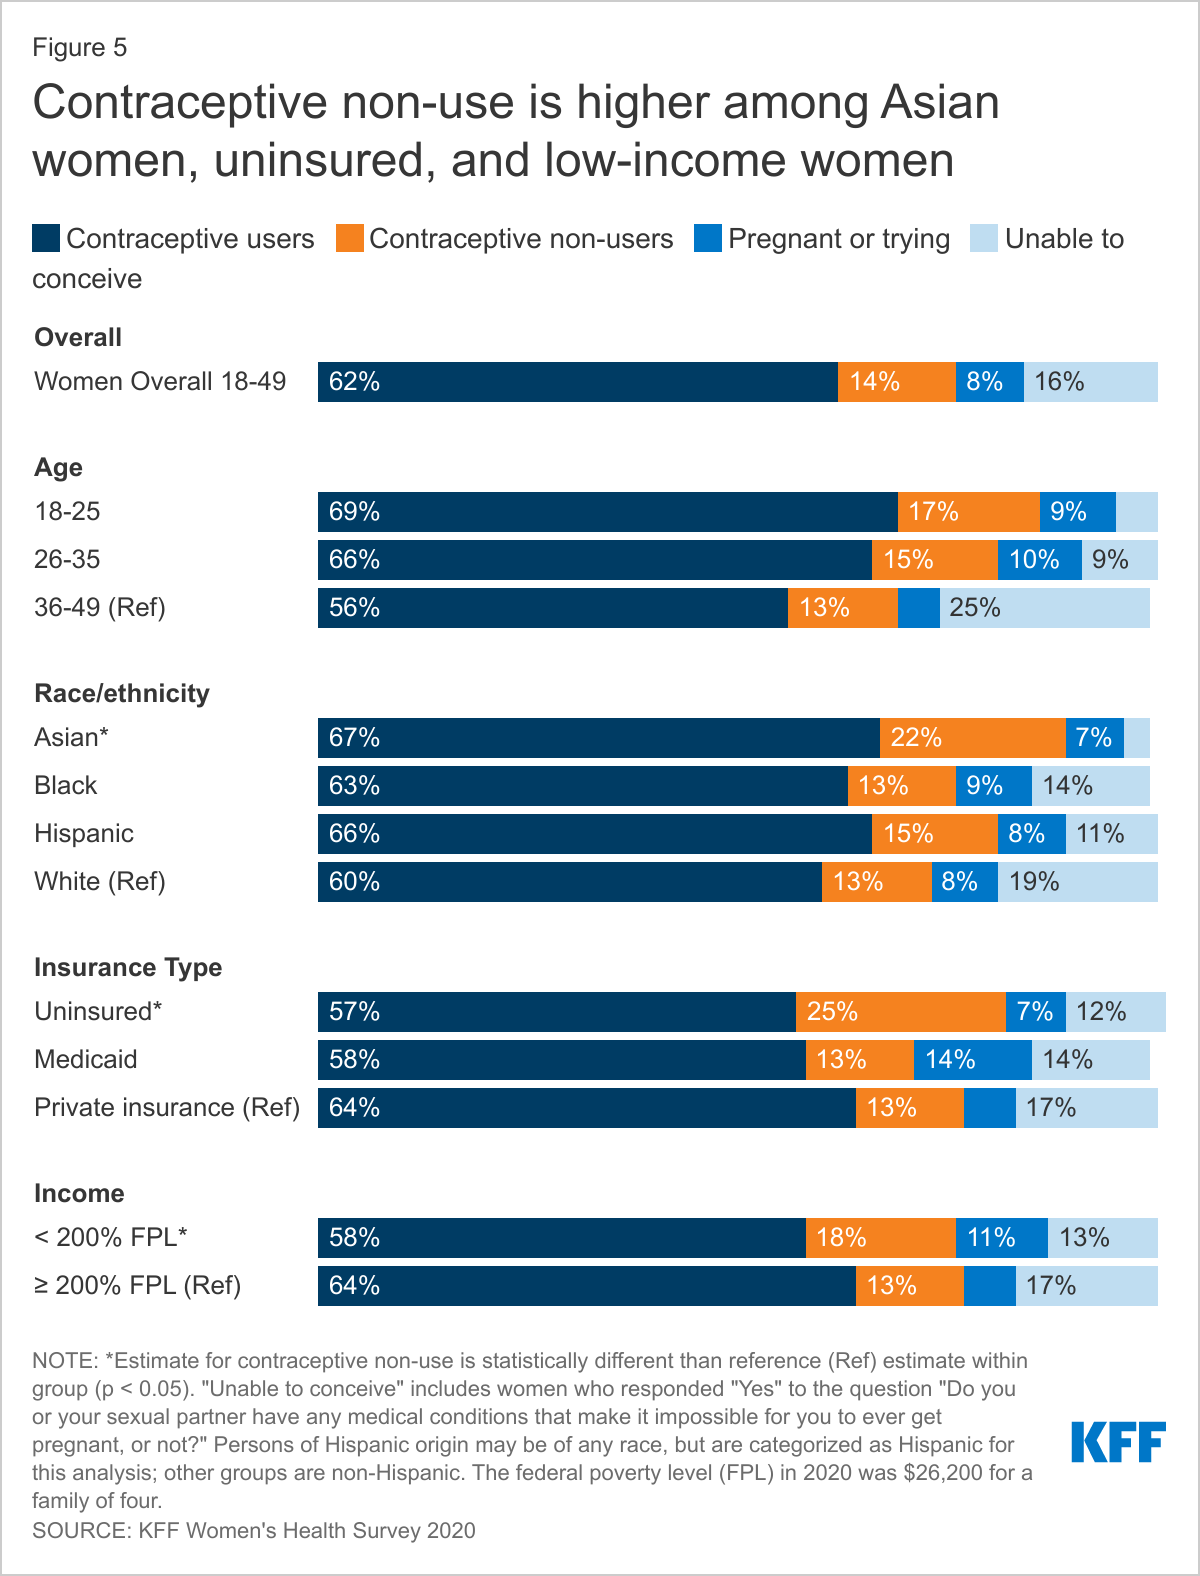
ONE IN SEVEN SEXUALLY ACTIVE WOMEN DO NOT USE CONTRACEPTION. CONTRACEPTIVE NON-USE IS HIGHER AMONG ASIAN WOMEN AND WOMEN WHO ARE UNINSURED OR LOW-INCOME.
Over six in ten sexually active women of reproductive age report using at least one method of contraception in the past 12 months, while one in seven (14%) report that they did not use contraception and are not trying to conceive (Figure 4). One in four (25%) uninsured women report not using contraception compared to 13% of women with Medicaid and private insurance. Similarly, almost a quarter of sexually active Asian women report not using contraception compared to 13% of Black and White women and 15% of Hispanic women, while a lower share of Asian women report they or their partner are unable to conceive (3% vs. 11% of Hispanic women, 14% of Black women, and 19% of White women). Low-income women are also more likely to report not using contraception compared to higher-income women (18% vs. 13%) (Figure 5).
.
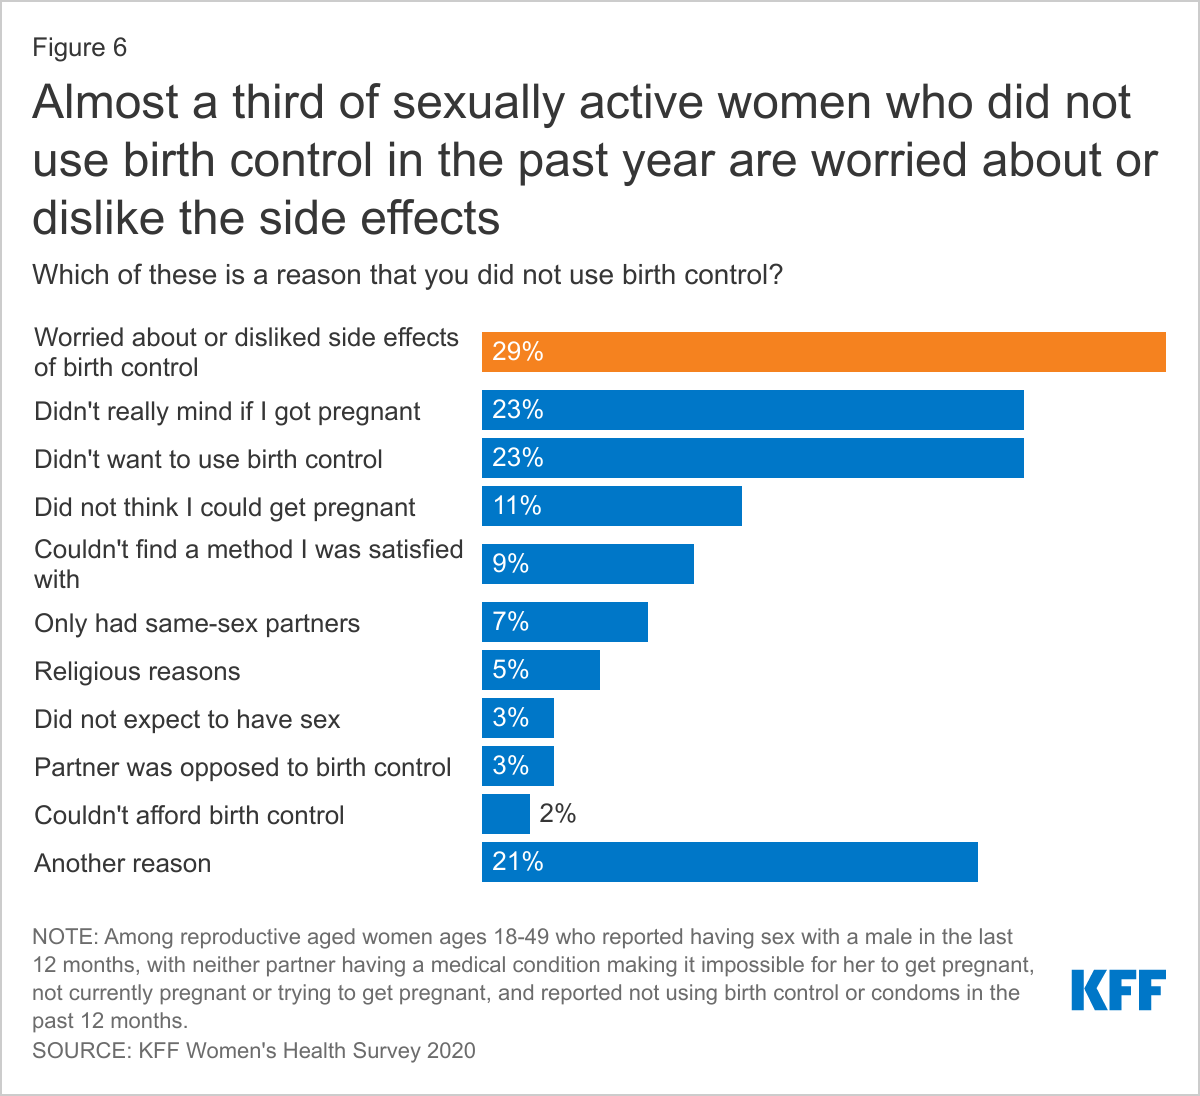
When asked about the reason for not using birth control, the number one reason was being worried about or disliking the side effects of birth control (29%), followed by not minding if they got pregnant (23%) and not wanting to use birth control (23%) (Figure 6). Over 1 in 5 women cited another reason that was not included in the survey.
CONDOMS, ORAL CONTRACEPTION, AND IUDS ARE THE MOST COMMONLY USED FORMS OF CONTRACEPTION.
Reproductive-aged women were most likely to have used male condoms in the past 12 months (39%), followed by oral contraceptives (37%), and IUDs (23%) (Table 1). Compared to all women of reproductive age, younger women ages 18-35 were more likely to have used oral contraceptives (50% vs. 37%), the contraceptive patch (4% vs. 2%), a contraceptive implant (11% vs. 7%), male condoms (47% vs. 39%), and emergency contraception (15% vs. 9%). Women ages 26-35 were more likely to use fertility awareness-based methods (11%) compared to all women of reproductive age (8%). Women ages 36-49 were most likely to have used an IUD in the past 12 months (28%) compared to all women of reproductive age (23%).
MOST WOMEN USE MORE THAN ONE CONTRACEPTIVE METHOD IN THEIR LIFETIME.
Eighty-seven percent of women report using contraception at some point in their lifetime and on average, women report using 3.4 methods of contraception throughout their lifetime. Seven in ten women (70%) ages 18-64 say they have used oral contraceptives, including a larger share of women ages 36-64. Male condoms were the second most frequently used contraceptive among women ages 18-64 (66%). Younger women ages 18-35 have higher shares that have used implants and emergency contraception compared to women overall (Table 2). Nearly three-fourths of women (72%) have used more than one type of contraception in their lifetime, four in ten women have used more than two types of contraception in their lifetime (42%), and one in five women have used more than three types of contraception in their lifetime (22%). Contraceptive switching is common and it is important that women have access to the full range of contraceptive methods without cost-sharing, so they can find the contraceptive method that works best for them if they want to use contraception. Also, women’s contraceptive needs can change over their reproductive lifespan, what works when they are in their twenties may not be what is best for them in their thirties or forties. Shared-decision making with a provider can allow a patient to communicate their values and preferences for contraception and the provider can share their medical knowledge to help the patient find a contraceptive method that is most consistent with their preferences.
NEARLY ONE IN FIVE WOMEN USE CONTRACEPTION FOR A REASON NOT RELATED TO PREVENTING PREGNANCY.
While many women have used more than one contraceptive in their lifetime, they also use contraception for more than just preventing pregnancy. Over six in 10 women (61%) say they use contraception only to prevent pregnancy (Figure 7). Over one in five (22%) women use contraception to prevent pregnancy and some other reason. Nearly one in five women (18%) use contraception solely for a reason not related to preventing pregnancy such as managing a medical condition or preventing STIs.
ONE IN FOUR UNINSURED AND LOW-INCOME WOMEN ARE NOT USING THEIR PREFERRED CONTRACEPTIVE METHOD.
While many women try and use multiple contraceptive methods throughout their lives for various reasons, nearly one in five women (18%) say they are not currently using their preferred method of birth control (Figure 8). This share is higher among uninsured and low-income women who may not have affordable access to the full range of contraceptive methods or be aware of public programs that provide those services. The primary reason women say they are not using their preferred method of contraception is because they cannot afford it (Figure 9). The goal of publicly supported programs like Title X and Medicaid is to provide access to family planning services to individuals who need family planning services but may not be able to afford services because of lack of insurance or low income. Most Title X clinics provide the full range of contraceptive methods to their uninsured and low-income clients. The fact that such a sizable share of women still report affordability barriers to care may speak to the role of public programs and the need for outreach to expand awareness of and access to sexual and reproductive health care services to low-income and uninsured women.
.
Among women who are not using their preferred method, one in five women (20%) say it is because their provider recommended a different method. There is increasing consensus about the importance of high-quality, client-centered contraceptive counseling to ensure that provider care is respectful of, and responsive to, individual patient preferences, needs, and values and importantly, that the patient guides all clinical decisions. Ensuring that patients have autonomy in their contraceptive decision-making is of high value and leads to greater satisfaction with their care and continued use of their method of choice.
Contraceptive Coverage
ONE IN FIVE WOMEN STILL REPORTS PAYING OUT-OF-POCKET FOR CONTRACEPTIVE CARE NEARLY 10 YEARS AFTER THE ACA WENT INTO EFFECT.
The ACA requires that most private plans cover contraceptive services which include patient education and counseling for contraceptive services and all of the 18 FDA- approved methods of contraception without cost-sharing. This provision has drastically reduced cost-sharing for contraception among women with employer or individual insurance plans. The majority of privately insured women report that their insurance covers the full cost of their contraceptive care (64%), but one in five (21%) women say their insurance only covered part of the cost and they paid the rest (Figure 10). There are a number of reasons that women could be responsible for some or all of those payments. For example, a woman could be using a brand-name contraceptive that is not in her plan’s formulary or she is unaware of or not offered a generic alternative. Some women paying out-of-pocket could also be receiving care out-of-network or still be enrolled in a grandfathered health insurance plan (which is exempt from the requirement). Some 13% of covered workers are enrolled in a grandfathered plan in 2019. An unknown number of women are also either employed by or dependents of a worker employed by an organization that has a religious objection to contraception. Those employers are not obligated to provide no-cost contraceptive coverage to their employees. Only 5% of women said they have had problems getting their insurance to pay for a prescribed birth control, such as an IUD, implant, injection, patch, pill, or ring.
In recent years, there has been a move to expand the supply of contraceptives dispensed to women since some women miss their pill (and are at risk of an unplanned or unwanted pregnancy) because they have run out of their supply. The majority of women ages 18-49 (59%) who used oral contraceptives in the past 12 months, received 3-5 months’ supply (Figure 11). However, twice as many low-income women compared to women with incomes ≥ 200% FPL only received 1–2-month supply (43% vs. 20%). Women with Medicaid also received a 1–2 months' supply at twice the rate of women with private insurance (42% vs. 22%). A much larger share of uninsured women (15%) reported receiving 6-11 months of supply compared to women with Medicaid and private insurance (1%). Laws have been passed in at least 17 states and DC that require coverage for 12 months of oral contraceptives to allow women continuous contraceptive coverage for at least a year. However, these laws typically only apply to fully insured plans. Many Medicaid programs can and do limit supply of hormonal contraception to 1-3 month periods; self-funded employer plans are also permitted to do this. Shorter supplies can result in women missing their pills due to delays in receiving their next supply.
Nearly one-third (31%) of hormonal contraceptive users say they have missed taking their birth control because they were not able to get their next supply of pills. This share is higher among younger women ages 18-25 and 26-35 compared to women ages 36-49 (38% and 34% vs. 16%) and among low-income women <200% FPL compared to women with incomes ≥200% FPL (36% vs. 26%) (Figure 12).
Access to Quality Sexual and Reproductive Health Care
THE MAJORITY OF WOMEN GET THEIR CONTRACEPTIVE CARE FROM OFFICE-BASED PHYSICIANS FOLLOWED BY CLINICS.
Three in four reproductive-age women who use contraception report receiving it from a doctor’s office (Figure 13). Many women, particularly about one-fifth of those who are Hispanic (20%), low-income (21%), covered by Medicaid (18%), or uninsured (21%), also use clinics such as federally qualified health centers (FQHC) or freestanding family planning clinics such as Planned Parenthood. Notably, about one in five women who are uninsured said they obtained their most recent contraception at another site, such as a pharmacy or drugstore. And, while there has been growing interest in telehealth, just 5% of women reported that they obtained contraception via a phone or video visit, website, or app.
LESS THAN HALF OF WOMEN REPORT RECEIVING THE HIGHEST QUALITY PERSON-CENTERED COUNSELING.
Women’s interactions with providers play an important role in the quality of their contraceptive care. While there has been a lot of emphasis on access to the most effective methods, there is also growing interest in ensuring that patient-provider relationships are patient-centered and support patient decision making. Approximately four in ten women (44%) rate their most recent contraceptive care provider as “excellent” on all four items of person-centered contraceptive counseling (Figure 14): respecting them as a person, letting them say what mattered to them about their birth control method, taking their preferences about their birth control seriously, and giving them enough information to make the best decision about their birth control. It is particularly concerning that Black, Hispanic, low-income, and uninsured women are less likely to receive this level of high-quality client-centered care. There is a long history of poor reproductive health care for these same groups. It is important to note that there were no significant differences by the type of setting in which the counseling was received, signaling that these groups may be receiving less client-centered care because of their race/ethnicity, income, or insurance regardless of the setting.
Currently, prescription contraceptives require a visit with a clinician in most states. In recent years though, there have been efforts to expand the availability of contraceptives through different avenues, including allowing pharmacists to prescribe and provide some hormonal methods and, applications to the FDA to make oral contraceptive pills (OCPs) available over-the-counter (OTC) without a prescription. Our survey finds that most women are in favor of these changes (Table 3). These approaches appear to be attractive to the majority of reproductive-age women: two-thirds (65%) say they are comfortable with pharmacists prescribing contraceptives and 70% support making pills available OTC if the FDA says it is safe and effective. There are differences in acceptability between different subgroups of women with higher levels of acceptability found among White women, women with a college degree, women living in urban/suburban areas, and Democratic women.
ONE-THIRD OF 18-25 YEAR OLD WOMEN HAVE NEVER SEEN A DOCTOR OR NURSE FOR A GYNECOLOGICAL EXAM. PRIVATELY INSURED WOMEN WERE THE MOST LIKELY TO HAVE A HAD A GYN VISIT IN THE PAST 12 MONTHS AND UNINSURED THE LEAST LIKELY.
Nearly three in four reproductive age women report that they have had a gynecological exam in the past three years (Figure 15). However, that is the case for only half of uninsured women (49%). More than one in ten uninsured women (14%) say that they have never had a gynecological exam, higher than the share of privately insured women (8%). Receipt of gynecological exam increases with age. While 30% of women ages 18-25 say they have never had an exam, that share drops to 4% among women ages 26-35. A gynecological exam usually includes cervical and breast cancer screening, education, and counseling that can prevent future negative health outcomes.
Screening Tests
ASIAN, UNINSURED AND RURAL WOMEN WERE THE LEAST LIKELY TO REPORT HAVING A PAP TEST WITHIN THE PAST TWO YEARS.
A number of federal bodies and professional organizations recommend that women receive sexual health screening tests. These tests are covered without any out-of-pocket charges for women with private insurance and under Medicaid expansion per the ACA’s preventive services requirement. The USPSTF recommends that women receive a Pap smear at least every three years beginning at age 21 depending on their personal risk factors for developing cervical cancer. More than two-thirds (68%) of women ages 21-49 say they have received one in the past two years. However, that is the case for only half of uninsured women (50%) (Figure 16). Pap testing rates are higher among Black women (79%) and lower among Asian women (58%), compared to women who are White (68%). Women who live in rural areas are also less likely than those living in urban areas to have had a Pap test in the prior two years. Many rural communities suffer from a dearth of reproductive health care providers, which may contribute to the lower rates of screening.
DESPITE RECOMMENDATIONS FOR ROUTINE STI AND HIV TESTING, FEW WOMEN HAD HAD A RECENT TEST.
One in four women (26%) report they had an HIV test in the past 2 years and one in three women (33%) who had a recent provider visit say they have had a test for an STI other than HIV in the past two years (Table 4). Knowing one’s status is important for receiving early treatment and preventing transmission to sexual partners. STI and HIV tests are covered without cost-sharing in private plans under the ACA’s preventive services coverage requirements and are typically covered by Medicaid programs. Screening rates are higher among women who are younger and low-income, as well as Black and Hispanic women compared to White women.
However, the actual screening rate is likely lower than the share of women who report being tested, as some assume (erroneously) that STI and HIV tests are routine components of a clinical visit. About one-quarter of women who said they were tested for HIV (26%) recently were under the impression that it is routine, which is not the case (Figure 17). This is also true for about a quarter of women who said they had been tested for other STIs (23%). This may cause women to believe they do not have HIV or another STI when in fact they have not actually been tested.
Figure 17: A Quarter of Women Who Say They Were Tested for HIV Were Under the Impression it is A Routine Part of An Exam
Sexual and Reproductive Health Counseling and Education
An important part of the gynecological exam and well-woman visit is counseling and education around sexual and reproductive health care, including discussions around contraception, sexual history or relationships, and sexually transmitted infections (STIs). The ACA also covers contraceptive counseling, as well as HIV and STI counseling without cost-sharing.
WOMEN ARE MUCH MORE LIKELY TO HAVE DISCUSSIONS WITH PROVIDERS ABOUT CONTRACEPTION THAN ABOUT STIs, HIV OR PrEP.
Among these sexual and reproductive health topics, the largest share of women ages 18-49 say they have been asked about or discussed contraception with their provider in the past two years (68%) (Table 5). Black women were significantly less likely to have discussed contraception with their provider compared to White women (60% vs. 70%). The majority of women (63%) also say they have discussed their sexual history with a provider.
Less than one-third of women of reproductive age say they were asked by a provider about HIV or another STI (26% and 28%, respectively). Women with Medicaid were more likely to have a discussion with their provider about HIV (31%) compared to women with private insurance (26%). A larger share of Black (32%) and Hispanic (31%) women were also asked about HIV compared to White women (22%). STI rates continue to rise, with younger women and Black and Hispanic women being disproportionately affected. STI counseling for all people of reproductive age is recommended to help individuals reduce their risk for STI transmission.
Only about 1 in 10 (11%) women of reproductive age say they have discussed HIV pre-exposure prophylaxis (PrEP) with their provider and this was higher among Asian (18%) and Hispanic (15%) women compared to White women (8%). Women with Medicaid (14%) were more likely to discuss PrEP compared to women with private insurance (10%) and low-income women (15%) compared to women with incomes ≥ 200% FPL (10%).
Across all the sexual and reproductive health topics, younger women ages 18-35 compared to women ages 36-49 and women living in urban areas compared to rural areas were more likely to be asked about these topics or discuss them with their doctor or health care provider. Roughly one-third of women ages 40-64 (32%) say a provider has discussed menopause with them recently.
FEW WOMEN ARE SCREENED FOR INTIMATE PARTNER VIOLENCE, DESPITE THE PRESENCE OF RECOMMENDATIONS FROM THE US PREVENTIVE SERVICES TASKFORCE AND THE WOMEN’S PREVENTIVE SERVICES INITIATIVE FOR SCREENING.
Another important topic that the US Preventive Services Task Force recommends providers to screen women of reproductive age for is intimate partner violence (IPV). However, only 38% of women ages 18-49 say a provider has asked them about domestic violence or dating violence in the past two years (Figure 18). This is higher among women ages 26-35 (44%) compared to women ages 36-49 (36%) and women with Medicaid (46%) compared to women with private insurance (38%). However, only 1 in 4 (26%) uninsured women were asked about it. Smaller shares of Asian women (25%) and Black women (33%) report discussing IPV compared to 40% of White women. There were no statistical differences by income and location.
Abortion
A HIGHER SHARE OF WOMEN THAN MEN SAY THEY PERSONALLY KNOW SOMEONE WHO HAS HAD AN ABORTION.
Abortion services are a significant component of sexual and reproductive health care, given that one in four women have had an abortion, making it a relatively common health care service. Nearly six in ten women (58%) and four in ten men (39%) say that they know somebody who has had an abortion (Figure 19). Of that group, most (68%) know more than one woman who has had an abortion (Figure 20). Rates are higher among those who are older, higher income, higher educational attainment (Table 6). Most know one or two women who have had an abortion and on average, women know 2.8 women and men know 2.5 women who have had an abortion.
Figure 20: Most women know more than one woman who has had an abortion
KNOWLEDGE OF MEDICATION ABORTION IS STILL RELATIVELY LOW. ROUGHLY HALF OF WOMEN AND MEN HAVE HEARD OF MEDICATION ABORTION EVEN THOUGH IT WAS APPROVED BY THE FDA 20 YEARS AGO.
Medication abortion is a pregnancy termination protocol that can be used up to the first 10 weeks of pregnancy that involves taking two different drugs, Mifepristone and Misoprostol. It has been available in the United States for more than 20 years and now accounts for approximately half of all early abortions. However, there are many restrictions on its availability, including an FDA REMS requirement, bans on telemedicine, and requirements for in-person counseling visits and other tests that are not medically recommended for safety. The COVID-19 pandemic has brought many of these restrictions to the forefront as providers have tried to implement no-test and telehealth medication abortion protocols that allow women to pick up medication abortion pills or have them mailed directly to their home with phone or video follow-up without requiring any testing or pre-abortion ultrasounds.
Over half of reproductive-aged women (57%) and almost half of men (48%) say that they have heard of medication abortion (Figure 21). Rates are lower though among Hispanic women, those with lower incomes, and those living in rural areas.
Conclusion
Sexual and reproductive health is multi-faceted and an integral part of a person’s overall health. In recent years, state and federal policies have had a major impact on access to sexual and reproductive health care across the nation, in some cases limiting access and in other broadening availability of care. The Affordable Care Act (ACA) enabled more women to obtain sexual and reproductive health care by expanding access to Medicaid and private insurance coverage and strengthening the scope of that coverage. While it made several preventive sexual and reproductive health services and counseling available without cost-sharing, many women are still saying that affordability is a barrier to contraceptive care, are not using the contraceptive of their choice, and are not getting the recommended levels of preventive sexual and reproductive health care services to which they are entitled under federal law.
Federal support for the family planning safety-net, the types of clinics that may participate in federal programs like Medicaid and Title X as well as state choices regarding Medicaid expansion all have an effect on the ability of low-income and uninsured women to gain access to reproductive care. While the COVID-19 pandemic has challenged providers to find new ways to make contraceptives, STI services, and in some cases abortion care, available via telehealth, it has brought the long-standing structural inequities in the health system into stark focus. Understanding how women use reproductive and sexual health care and the challenges they face could help leaders at the federal, state, and community level make such care more accessible and equitable.
Methodology
The 2020 KFF Women’s Health Survey was designed and analyzed by researchers at the Kaiser Family Foundation (KFF) of a representative sample of 4,805 adults, ages 18-64 years old (3,661 women and 1,144 men). The survey was conducted online and telephone using AmeriSpeak®, the probability-based panel of NORC at the University of Chicago. U.S. households are recruited for participation using address-based sampling methodology and initial invitations for participation are sent by mail, telephone, and in-person interviews. Interviews were conducted in English and Spanish online (4,636) and via the telephone (169). Our previous Women's Health Surveys were conducted exclusively by telephone, so trend data are not included in our 2020 survey. Interviews for this survey were conducted between November 19 and December 17, 2020, among adults living in the United States. KFF paid for all costs associated with the survey.
The sample for this study was stratified by age, race/ethnicity, education, and gender as well as disproportionate stratification aimed at reaching uninsured women, women who identify as LGBT, Asian women, and women 18-49 years old. The sampling also took into consideration differential survey completion rates by demographic groups so that the set of panel members with a completed interview for a study is a representative sample of the target population. This survey includes people who self-identified as 'female' or 'male’ regardless of their sex at birth. While our goal was to be as inclusive as possible, we were not able to obtain a large enough sample to support a separate questionnaire that addresses the unique health concerns and experiences of non-binary or gender-fluid people to include them in this survey. We recognize that additional study is needed to better understand the health and access issues faced by non-binary people.
A series of data quality checks were run and cases determined to be poor-quality, as defined by surveys with a length of interview of less than 33% of the mean length of interview and with high levels of question refusal (>50%) were removed from the final data (n=96). Weighting involved multiple stages. First, the sample was weighted to match estimates for the national population from the 2020 Current Population Survey on age, gender, census division, race/ethnicity, and education. The second round of weights adjusted for the study’s sampling design. All statistical tests of significance account for the effect of weighting.
The margin of sampling error including the design effect for the full sample of women is plus or minus 2 percentage points. Numbers of respondents and margins of sampling error for key subgroups are shown in the table below. For results based on other subgroups, the margin of sampling error may be higher. Sample sizes and margins of sampling error for other subgroups are available by request. Note that sampling error is only one of many potential sources of error in this or any other public opinion poll.