Women’s Health Care Utilization and Costs: Findings from the 2020 KFF Women’s Health Survey

Published: Apr 21, 2021

Issue Brief

Key Takeaways

Health Status

  • Large shares of lower-income women and women with Medicaid report being in fair or poor health. One in five Black (20%) and Hispanic (19%) women report being in fair or poor health compared to 12% of White women and 9% of Asian women.  
  • Six in ten (61%) women ages 50-64 and almost half of White women (48%) and women with Medicaid (47%) report having a chronic health condition that requires regular monitoring, medical care, or medication.

Health Care Utilization

  • More than nine in ten (93%) women have seen a doctor or health care provider in the past two years, but a smaller share has had a general check-up or well-woman visit (73%).
  • One in ten (10%) women with an ongoing health condition do not have a regular doctor or health care provider.
  • Most women obtain their care at doctors’ offices, but many uninsured women, those with Medicaid, and Black and Hispanic women visit health centers or clinics. 
  • Nearly half (46%) of women who usually visit a health center or clinic for their care go to a walk-in clinic such as an urgent care facility or clinic inside a store or pharmacy. One-third (34%) visit a community health center or health department.
  • Women with Medicaid coverage are more likely than women with employer-sponsored insurance to report experiencing health insurance coverage limitations. Nearly three in ten women with Medicaid (29%) and individual insurance (28%) say a doctor they wanted to see was not covered by their plan, compared to 15% of women with employer-sponsored insurance.

Health Care Experiences

  • Among women who have been to the doctor in the past two years (93%), uninsured women (55%) are significantly less likely to have discussed mental health issues with their health care provider than women with health insurance (70%). Black (61%) and Asian (60%) women are less likely to have had this discussion with their provider than White women (72%).
  • Among people who have visited a doctor in the past two years, women are more likely than men to say a health care provider has dismissed their concerns (21% vs. 12%) or didn’t believe they were telling the truth (10% vs. 7%). One in three (30%) women who had a negative provider experience say they were treated this way because of their age and one in five (20%) say it was because of their gender. Nearly four in ten (38%) Black women say they were treated this way because of their race/ethnicity.

Health Care Costs

  • One in four (24%) women report having had problems paying medical bills in the past 12 months, over half (57%) of whom say this was due, at least in part, to the COVID-19 pandemic.
  • Among women experiencing problems with medical bills in the past year, nearly half (48%) have had difficulty paying for basic necessities like food, heat, or housing because of the bills, as have six in ten (61%) low-income women.

Introduction

Women’s access to health care depends greatly on the availability of high-quality providers in their communities as well as their own knowledge about maintaining their health through routine checkups, screenings, and provider counseling. Social determinants of health, structural racism, and experiences with health care providers shape health outcomes and health equity.

While the Affordable Care Act (ACA) expanded pathways to affordable coverage to millions of women, coverage and affordability barriers persist for many. Women with health insurance may experience difficulty affording health care. Many insured women face health care costs in the form of cost sharing or balance billing resulting from receiving care from an out-of-network provider or hospital, which can also impact their financial well-being. The ACA contains provisions aimed at alleviating some of the financial barriers to health care access; however, many women still face challenges with health care costs and medical bills, particularly those who are uninsured or low-income.

This brief presents findings from the 2020 KFF Women’s Health Survey on women’s use of health care services, costs, and experiences accessing health care. The 2020 survey is a nationally representative survey of 3,661 women ages 18 to 64, conducted between November 19 and December 17, 2020. See the Methodology section for more details.

Health Status and Use of Prescription Medications

The majority of women ages 18-64 report being in good or excellent health, but higher shares of older and lower-income women, as well as Black and Hispanic women and those with Medicaid, report being in poorer health.

Most women (85%) rate their health as excellent, very good, or good; however, 15% of women describe their health as fair or poor, similar to other national estimates.1  As women age, they are more likely to rate their health as fair or poor (Figure 1). Nearly one in four (24%) low-income women, women with Medicaid (24%), and uninsured women (21%) rate their health as fair or poor.2  Black (20%) and Hispanic (19%) women are more likely than White (12%) and Asian (9%) women to report being in fair or poor health.3 

One in five Black women and one in four low-income women describe their health as fair or poor

Many women are managing chronic conditions or living with disabilities that impact daily life.

Just under half of women (44%) report that they have a chronic health condition that requires regular monitoring, medical care, or medication (Figure 2). This rate increases steadily with age, from about one in four (24%) women ages 18-25 to six in ten (61%) women ages 55-64. Almost half of White (48%) and Black (45%) women report having a chronic health condition compared to just over one-third of Hispanic (35%) and Asian (34%) women. Insured women with Medicaid coverage (47%) and private coverage (45%) report higher rates of chronic health conditions requiring regular maintenance than do uninsured women (31%).

Six in ten women ages 50-64 have a chronic health condition that needs to be monitored regularly

Fifteen percent of women report having a disability or chronic disease that keeps them from participating fully in work, school, housework, or other activities (Figure 3). Women with Medicaid (29%), low-income women (24%), and older women (21%) are more likely than their counterparts to report having a disability or chronic disease.

Three in ten women with Medicaid have a disability or chronic disease

More than half of women are taking at least one prescription medication on a regular basis.

Women may take prescription medications to treat or manage chronic conditions and acute illnesses or to prevent pregnancy. More than half (57%) of women report taking at least one prescription medicine on a regular basis, including oral contraceptives (Figure 4). Prescription medication use increases with age, with about four in ten (42%) women ages 18-49 taking at least one on a regular basis compared to about seven in ten (72%) women ages 50-64. Women in poorer health (71%) are more likely than women in better health (55%) to report taking a prescription medication regularly.4  Low-income women (52%) are less likely than women with higher incomes (61%) to take a prescription medication regularly and uninsured women (36%) are less likely than insured women (60%). White women (63%) are more likely than Asian (47%), Hispanic (48%), and Black (51%) women to take a prescription medication.

Over half of women take a prescription medication, increasing with age

Health Care Utilization

Sites of Care

Most women obtain their care at doctors’ offices, but clinics are common sites of care for underserved communities, particularly for uninsured women and those with Medicaid.

Eighty-four percent of women report that they have a place they usually go when they are sick or need advice about their health. Eight in ten (81%) women with a usual place of care report that they obtain their care at a doctor’s office (Figure 5). Seventeen percent obtain care at a clinic, such as a health center, urgent care clinic, or clinic inside a store or pharmacy. A very small share (2%) cites the emergency room as their usual site of care and 1% go to some other place.

Eight in ten women usually go to a doctor's office for their health care

The share of women with private health insurance (85%), higher-income women (85%), and White (84%) and Asian (85%) women who visit a doctor’s office is higher than those of their counterparts (Figure 6). Approximately one-quarter of women with Medicaid (23%) and one in three (30%) uninsured women usually visit a health center, urgent care clinic, or clinic inside a store or pharmacy. Hispanic (21%) and Black (22%) women are more likely to visit one of these clinics than White (14%) women or Asian (11) women.

Most women visit a doctor's office when they need health care, but a large share of uninsured women go to health centers or clinics

Among women who obtain care at a health center or clinic, more than half of women with private insurance visit a walk-in clinic while uninsured women and women with Medicaid are more likely to visit a community or public health center for care.

Among women who usually visit a clinic, almost half (46%) use a walk-in clinic such as an urgent care center clinic inside a store or pharmacy (Figure 7). These clinics are often staffed by advanced practice clinicians and treat minor illnesses and injuries and provide some preventive care. Women with employer-sponsored insurance (59%) are far likelier to use one of these clinics than are women with individual insurance (30%) or Medicaid coverage (37%) and uninsured women (35%) (Table 1). About one-third (34%) of women who usually visit a health clinic go to a community health center or health department. Community health centers and health departments are common among women with Medicaid (46%) and uninsured women (41%), Hispanic (47%) and Black women (41%), and low-income women (47%).

Walk-in clinics are the most common place of care for women who typically visit a health center or clinic
Table 1: Community and public health centers are common sites of care for low-income women and women of color

Sources of Care

While the vast majority of women have a regular provider they turn to for routine care, only half of uninsured women have a usual source of care.

Having a usual source of health care is associated with increased use of preventive care and better health outcomes. Seventy-nine percent of women have a regular doctor or health care provider they see when they are sick or need routine care. The likelihood of having a regular provider increases with age (Figure 8). Women who live in a state that expanded Medicaid are more likely to have a usual source of care than women in states that have not expanded Medicaid (82% vs. 74%). Fewer uninsured (51%) and low-income (74%) women report having a usual source of care than their counterparts. Hispanic women (76%) are less likely than White women (81%) to have a usual source of care. Ten percent of women with an ongoing health condition do not have a regular doctor or health care provider (data not shown in figure).

While most women have a usual source of care, there is substantial variation by sociodemographic factors

Nearly three-quarters (73%) of women with a regular doctor or health care provider describe their primary provider as a family medicine or internal medicine doctor (Figure 9). Fourteen percent of women with a regular provider go to an advanced practice clinician such as a nurse practitioner or physician assistant, and 7% see an OBGYN.

Most women with a usual source of care describe their primary provider as a family medicine or internal medicine doctor

About three-quarters (77%) of women with private insurance and low-income women report having a family or internal medicine doctor as their primary provider (Table 2). Women who live in rural areas are more likely than women in urban/suburban areas to say their primary provider is an advanced practice clinician (21% vs. 12%). OBGYNs are the primary type of provider for more uninsured (12%) than insured (7%) women and Black women (12%) than White women (6%) (data not shown in table).

Table 2. The type of provider women visit for health care varies by sociodemographic characteristics

Health Insurance

Many insured women report that their plan didn’t always cover all their needed medical care, or that it paid less than they expected.

One in five women (20%) with health insurance report that a doctor they wanted to see was not covered by their plan (out-of-network) and 14% said their plan would not cover a test or scan their doctor recommended (Table 3). More than one in five insured women (23%) said their plan would not cover a prescription medication, or charged high cost sharing for it, and one in ten (10%) said their plan stopped covering a medication they were taking. Nearly one-quarter (24%) of women with health insurance (through either individual or employer plans or Medicaid) reported that their plan did not cover a medical bill for services they thought were covered, or that it paid less for that service than they expected. About one-quarter (23%) of these women said this was due to the provider being out-of-network, 43% believed it was for some other reason, and one-third (33%) said they did not know why this happened.

Some of these problems vary by type of insurance coverage. For example, one in four (25%) women with employer-sponsored insurance say their plan didn’t cover medical care they thought was covered, or paid less than expected, compared to 15% of women with Medicaid. Women with Medicaid (29%) or individual market coverage (28%) are nearly twice as likely as women with employer-sponsored insurance (15%) to report that a particular doctor they wanted to see not covered by their plan. Nearly twice as many women with Medicaid (14%) as with private insurance (8%) reported their plan stopped covering a prescription medication they were taking.

Table 3. More women with individual health insurance or Medicaid say their preferred doctor was not covered by their plan than women with employer-sponsored insurance

General Check-ups and Provider-Patient Counseling

While most women have visited a doctor in the past two years and had a check-up, rates are lower among younger women and uninsured women.

Regular provider visits give women an opportunity to talk with clinicians about a broad range of issues, including preventing illness, the role of lifestyle factors on health, and management of chronic illnesses. Under the ACA, most health plans must cover at least one annual check-up or well-woman visit, which can include assessments of diet and physical activity, preconception care, and cancer screenings. The majority of women have seen a medical provider in the past two years, but fewer have had a well-woman visit or general check-up.

More than nine in ten (93%) women have seen a doctor or health care provider in the past two years (Table 4). However, fewer young women ages 18-25 (88%), uninsured women (75%), and low-income women (89%) have visited a doctor than the average.

About three-quarters of women (73%) have had a general check-up or “well-woman visit” in the past two years. However, uninsured women (41%), low-income women (64%), and women in poorer health (66%) are less likely to have had a recent checkup. Hispanic women (67%) are less likely than White women (76%) to have had a check-up in the past two years.

Table 4. A quarter of uninsured women have not seen a doctor or health care provider in the past 2 years and less than half have had a check-up

More than half (51%) of women who have had a check-up or well-woman in the past two years report that they went to a general practice or internal medicine doctor for their visit (Table 5). About two-thirds (35%) went to an OBGYN. Older women ages 50-64 (62%) are more likely to visit a general practice doctor than younger women ages 18-25 (44%), while younger women (42%) are more likely to visit an OBGYN than older women (22%). About one in ten (11%) women who have had a check-up in the past two years report that they saw a nurse practitioner or physician assistant for their visit; this share is higher among women ages 50-64 (13%) than women ages 18-35 (7%).

Table 5. More women see a family or internal medicine doctor for check-ups or well-woman visits, but a large share of younger women see an OBGYN

Overall, women have more connections to the health care system than men. Higher shares of women than men report having a usual source of care and a visit to a health provider in the past two years.

Women are slightly more likely than men to report having a regular place of care (84% vs. 80%) and a regular doctor or provider (79% vs. 75%) (Table 6). Ninety-three percent of women have visited a health care provider in the past two years and 73% have had a check-up, compared to 88% and 69% of men, respectively. Even within genders, there are differences by age, with older people more likely than younger people to report having each of these regular connections. For example, nine in ten (90%) women ages 50-64 have a regular doctor or health care provider compared to three-quarters (74%) of women ages 18-49. For men, nine in ten (90%) men ages 50-64 have a regular doctor or provider compared to seven in ten (69%) men ages 50-64.

Table 6. Women have more connections to the health care system than men, with variation by age

Most women report that they have spoken with a health care provider about health behaviors such as diet, exercise, and nutrition as well as smoking and alcohol or drug use.

Counseling on health-related behaviors such as diet, smoking, and alcohol use is an important component of women’s primary care. More than three in four (77%) women who have seen a provider in the past two years report their provider asking about or discussing diet, exercise, and nutrition with them.

Slightly fewer (72%) have discussed smoking and approximately two-thirds (67%) have discussed alcohol or drug use with a provider in the past two years. Older women ages 50-64 (81%), higher-income women (81%), and those with private insurance (80%) are more likely than their counterparts to have discussed diet, exercise, and nutrition with their provider. Younger women ages 18-49 are more likely than older women ages 50-64 to have discussed smoking (75% vs. 68%) or alcohol or drug use (71% vs. 60%). Across the board, insured women have higher rates of counseling on these issues than uninsured women (Table 7).5 

Table 7. The majority of women have recently discussed diet, exercise, nutrition, smoking, and alcohol or drug use with their health care provider, but fewer uninsured women have been asked about these topics

Smaller shares of Asian and Black women than White women report that a provider has asked about or discussed mental health issues such as anxiety and depression with them.

Most plans must cover treatment for mental health care and other medical conditions equally. Depression and anxiety affect a higher share of women than men over their lifetimes. The U.S. Preventive Services Task Force (USPSTF) recommends women receive depression screenings, though it does not have a recommendation for frequency. The Women’s Preventive Services Initiative (WPSI) now recommends that women and teens also receive anxiety screenings. The ACA requires health plans to cover both of these screenings without cost sharing.

Among women who have seen a health care provider in the past two years, nearly seven in ten (69%) report that their provider asked about or discussed mental health issues, such as anxiety or depression (Figure 10). More White women (72%) than Black (61%) and Asian (60%) women are asked about mental health issues. Younger women and women covered by Medicaid (76%) are more likely than their counterparts to have discussed mental health issues with their provider. Women with health insurance (70%) and those in poorer health (76%) are more likely than uninsured women (55%) and women in better health (67%) to have had this discussion with their health care provider.

Older women, Asian and Black women, and uninsured women are less likely to be asked about mental health issues  by their health care provider

Social Determinants of Health

Few women report that their health care providers have asked them about issues such as their ability to afford food, their housing situation, and access to reliable transportation.

In recent years, the social determinants of health have been recognized as critical factors that shape health outcomes. These factors include housing, transportation, nutrition, and financial well-being. Although there are no formal recommendations for routine screening for social determinants of health, there is increasing awareness among the medical community that better tools are needed to help target assistance to patients to improve health. Health care providers who ask their patients about these factors may be able to help connect patients who are experiencing challenges to local assistance and resources.

More than half of women who have visited a doctor in the past two years were asked about the kind of work they do while only 13% were asked about their access to reliable transportation or ability to afford food. Three in ten women with Medicaid were asked about their housing situation.

Over half (56%) of women who have seen their health care provider in the past two years report that their provider asked about what kind of work they do, with higher shares among women ages 26-35 (65%) and women with a college degree (67%) (Table 8). Two in ten (19%) women who have seen a health care provider in the past two years report having been asked about their housing situation, with higher shares among women with Medicaid coverage (30%) and low-income women (27%). Fewer women (13%) report that their provider asked them about their access to reliable transportation or their ability to afford food. Women with Medicaid or who are lower-income are more likely than their counterparts to have been asked about these two topics with their health care provider in the past two years.

Table 8. Few women say they have discussed their housing situation, transportation access, and ability to afford food with their health care provider

Screening Tests

Use of preventive services can lead to early identification of conditions when they are more responsive to medical interventions. This is especially true for certain types of cancers and cardiovascular conditions. For example, the USPSTF recommends routine mammograms every two years for women ages 50-74 to identify breast cancer as well as colorectal cancer screenings for women ages 50-75, though the recommended frequency varies by type of screening test. These services are covered in full by most private plans under the ACA’s preventive services coverage requirements and by most state Medicaid programs.6 

Most women ages 50-64 say they have had a mammogram in the past two years; fewer have had a recent colon cancer screening.

Most (78%) women ages 50-64 have had a mammogram in the past two years (Figure 11). Insured women ages 50-64 (78%) are more likely than uninsured women (49%) to have had a mammogram in the past two years. Low-income women (66%) are less likely than higher-income women (79%) to have received a mammogram in the past two years. The survey found no statistically significant differences in mammogram screening rates by race/ethnicity.

Less than half (45%) of women ages 50-64 report having had a colon cancer screening in the past two years (Figure 12). Women with insurance (47%) are more likely than uninsured women (33%) to have had a colon cancer screening in the past two years. The survey did not find any statistically significant differences in recent colon cancer screening rates by race/ethnicity, insurance type, or income.

Uninsured and low-income women are less likely to have received a mammogram in the past 2 years
Less than half of women ages 50-64 have had a colon cancer screening in the past two years

Health Care Experiences

Negative experiences with the health care system can contribute to poorer health outcomes, distrust of the health care system, and health disparities. Two in ten women who have seen a health care provider in the past two years say that their provider dismissed their concerns and 13% report that their provider assumed something about them without asking. These shares are higher among younger women, women with Medicaid, and women in poorer health.

The impact of bias in health care, including implicit bias, has garnered increased attention in recent years and is recognized as having detrimental effects on women’s health. To gain greater insight into women's experiences with health care providers, our survey asked whether they had encountered any of four negative experiences when visiting their provider in the past two years.

Among women and men who have visited a health care provider in the past two years, 21% of women report that their doctor had dismissed their concerns, compared to 13% of men (Figure 13). Thirteen percent of women and 11% of men who have been to a doctor in the past two years say their doctor assumed something about them without asking. Ten percent of women who have visited a provider in the past two years have had a provider who didn’t believe they were telling the truth, compared to 7% of men. Nine percent of women and 7% of men report that a provider suggested they were personally to blame for a health problem. Women are more likely than men to have had at least one of these negative experiences with their provider in the past two years  (27% vs. 20%).

Women are more likely than men to say a health care provider dismissed their concerns or didn't believe they were telling the truth

Women who are younger, covered by Medicaid, or in poorer health are more likely than their counterparts to have had each of these four experiences with their provider in the past two years (Table 9). Hispanic (14%) and Black (13%) women are more likely than White women (9%) to say their doctor did not believe they were telling the truth. Thirteen percent of unemployed women who have visited a health care provider in the past two years report that their doctor did not believe they were telling the truth, compared to 8% of employed women. Nearly four in ten (38%) women ages 18-25 and women in poorer health have had at least one of these four experiences.

Table 9. One in three women in poorer health say their health care provider had dismissed their concerns and two in ten young women say their provider didn't believe they were telling the truth

Among women who have been treated in at least one of these ways, many say it was because of their age and/or gender. Black and Hispanic women are more likely than White women to say they were treated this way because of their race/ethnicity.

Among women who had at least one of these four types of experiences with their provider, 30% believe they were treated this way because of their age; 20% say it was because of their gender; 13% think it was because of their insurance type; 11% believe it was due to their race or ethnicity; 8% think it was because of their ability to pay, and 22% do not know (Figure 14). Notably, 32% of women who had one these negative experiences with their provider said that it happened for 'none of these reasons.'

Among women who have had one of these experiences with their provider in the past two years, younger women ages 18-25 (47%) and 26-35 (35%) are more likely than women ages 36-49 (17%) and 50-64 (24%) to say they experienced this because of their age. Women are almost twice as likely as men to say they were treated this way because of their gender (20% vs. 12%). Women with Medicaid are nearly four times more likely than women with private insurance to say they were treated this way because of the type of insurance they had (30% vs. 8%). Black women (38%) and Hispanic women (16%) are more likely than White women (2%) to say they were treated this way by their provider because of their race/ethnicity.7  Low-income women are almost three times more likely than higher-income women to say they experienced this treatment because of their ability to pay (14% vs. 5%).

Among women who have seen a provider in the past two years and experienced health care provider bias, three in ten say it was because of their age

Health Care Costs

Out-of-Pocket Costs for Preventive Care

When it comes to annual check-ups or well-woman visits, more than four in ten women report having at least some out-of-pocket costs associated with these preventive visits 

The ACA and most state Medicaid programs require plans to cover preventive health care without cost sharing (deductibles, coinsurance, and copayments). This includes an annual check-up or well-woman visit. Despite this requirement, many women still have at least some out-of-pocket expenses for their check-up or well-woman visit. Among women who have had a check-up or well-woman visit in the past two years, more than four in ten (43%) women report having to pay at least some out-of-pocket costs for their annual check-up or well-woman visit.

Nearly half (47%) of women with private insurance and one in five (20%) women with Medicaid had out-of-pocket spending for their check-ups or well-woman visits.

Among women with private insurance plans, most of which are prohibited from charging cost sharing for check-ups/well-woman visits and many preventive services, almost half (47%) report that they had out-of-pocket expenses for their check-up or well-woman visit (Figure 15). It is possible that some respondents may have mistaken another type of visit as a check-up or well-woman visit. There are several reasons why some women are still being exposed to cost sharing for these visits. While many preventive services are provided in the context of a check-up/well-woman visit, additional health services received during that visit, such as diagnostic tests or labs, may be subject to cost sharing. In addition, some women may be enrolled in a grandfathered health plan, which is not subject to the requirement to cover an annual check-up without cost sharing, though there are relatively few people still enrolled in one of these plans. Finally, the requirement to cover preventive care without cost sharing applies to care received in-network, so if a woman goes to an out-of-network provider for their check-up, they will likely be exposed to out-of-pocket costs.

While cost sharing is routine in the private insurance market, it is less common, though not prohibited, in the traditional Medicaid program. Women who are enrolled through the ACA’s Medicaid expansion option are entitled to no-cost preventive care. One in five women with Medicaid (20%), whether traditional or expansion, paid at least some out-of-pocket costs for their check-up. The requirement to cover an annual check-up is not applicable to those without health insurance. About two-thirds (64%) of uninsured women have incurred out-of-pocket costs for their visit. It should be noted that while this question asked about cost sharing for a check-up in the past two years, data on insurance coverage reflects coverage at the time the respondent completed the survey and may have changed during the prior two years.

Four in ten women report paying out-of-pocket for their annual check-up or well-woman visit

Medical Bills

While the ACA has helped alleviate some of the financial barriers to accessing health care, many women, including those with insurance, still report problems paying medical bills. Some women incur significant medical expenses because of an unexpected diagnosis such as cancer, or an illness or injury that limits their ability to work and earn income to pay off bills. Costly medical bills can also arise after receiving care from an out-of-network provider, commonly referred to as surprise medical bills.

One in four women report having had problems paying medical bills in the past year, with higher rates among uninsured women and women in poorer health.

Twenty-four percent of women report that they or a household family member has had problems paying medical bills in the past year. Problems paying medical bills are more common among women than men (17%). While more women with children (27%) report problems paying medical bills than do women without children (22%), the share of men with children (19%) and men without children (16%) that have problems paying medical bills is statistically similar.

Outstanding medical bills are more common among uninsured and lower-income women and those in poorer health (Figure 16). This includes nearly four in ten uninsured women (39%) and women in poorer health (38%), and one-third of low-income women (33%). About three in ten Black women (29%), women who live in states that did not expand Medicaid (29%), and those without a college degree (28%) also report having trouble paying medical bills in the past year.

One in four women have had problems paying their medical bills in the past 12 months

The financial turmoil many people have experienced because of the COVID-19 pandemic has compounded the challenges some women face in their ability to pay medical bills.

Among women who report having had problems paying medical bills in the past year, one-quarter (26%) say it was because of the coronavirus and its impact on their financial situation. This could be due to financial impacts from job loss or furlough, health-related consequences, or other reasons related to coronavirus. About four in ten (42%) women who have had problems paying medical bills in the past year say they were having problems paying medical bills before the pandemic and three in ten (31%) say it was a combination of both (Figure 17).

Over half of women who have had problems paying their medical bills in the past 12 months say it was at least in part because of the COVID-19 pandemic

Medical bills can have serious consequences for women’s financial well-being and ability to afford basic necessities.

Among women who report trouble paying medical bills in the past year, two-thirds (66%) had to set up a payment plan with a doctor or hospital and/or used up all or most of their savings (Figure 18). About six in ten (59%) have been contacted by a collection agency, nearly half (48%) have had difficulty paying for basic necessities like food, heat, or housing, and four in ten (40%) borrowed money from family or friends. These shares are similar between women and men.

Low-income women who have had problems paying medical bills in the past year are more likely than higher-income women to report having had difficulty paying for basic necessities such as food, heat, or housing (61% vs. 37%), having been contacted by a collection agency (64% vs. 58%), or borrowing money from family or friends (49% vs. 33%). Higher-income women with problems paying medical bills in the past year are more likely than low-income women to have set up a payment plan with a doctor or hospital (73% vs. 60%).

Six in ten low-income women have had difficulty paying for basic necessities like food, heat or housing because of medical bills

Conclusion

Women’s access to and use of health care services has an impact on their health outcomes. Most women report having a regular source of care and having had a recent doctor’s visit. However, connections to the delivery system are more tenuous for low-income and uninsured women, who are less likely to report a recent visit or regular place of care. The ACA prioritized prevention by requiring insurance plans to cover routine check-ups and several screening tests without any out-of-pocket costs. Most women report they have had a general check-up or well-woman visit in the past two years, but similar to other measures, rates are lower among low-income and uninsured women. While a large share of women receive provider counseling on health issues like nutrition, exercise, and alcohol or drug use, a small share report that a provider has asked them about or discussed their mental health in the past two years.

Health insurance coverage helps link women to care and reduces patients’ financial risks when they need routine care, get sick, or need to be hospitalized. However, even women with insurance report having problems using their insurance, such as receiving health care they thought was covered but wasn’t and not being able to see the doctor of their choice because the doctor was out-of-network.

Health care costs continue to be a challenge for a significant share of the population, with many women reporting they have had to pay cost sharing for a preventive care visit or that they have had trouble paying medical bills. This is particularly true for low-income and uninsured women. For many women, the COVID-19 pandemic has added to their health-related financial burdens.

Finally, the importance of the social determinants on health outcomes has gained recognition in recent years but it seems few providers are discussing important factors such as food insecurity and transportation challenges with their patients. Gender bias and racial discrimination in the health care system can contribute to health disparities and poorer health outcomes. Women are more likely than men to report having experienced some type of health care bias, particularly those who are in poorer health, younger, or low-income.

The COVID-19 pandemic has further exposed many of the long-standing weaknesses in the health care system that have disproportionately impacted women, especially those who are low-income, women of color, or who are uninsured. For many women, the ACA helped strengthen access to coverage and protected them from many out-of-pocket costs. However, there is still much that can be done to make health care and coverage more affordable, expand equitable access to care, improve the quality and content of that care, and address the bias and discrimination that many women still experience when they seek care.

Methodology

The 2020 KFF Women’s Health Survey was designed and analyzed by researchers at the Kaiser Family Foundation (KFF) of a representative sample of 4,805 adults, ages 18-64 years old (3,661 women and 1,144 men). The survey was conducted online and telephone using AmeriSpeak®, the probability-based panel of NORC at the University of Chicago. U.S. households are recruited for participation using address-based sampling methodology and initial invitations for participation are sent by mail, telephone, and in-person interviews. Interviews were conducted in English and Spanish online (4,636) and via the telephone (169). Our previous Women's Health Surveys were conducted exclusively by telephone, so trend data are not included in our 2020 survey. Interviews for this survey were conducted between November 19 and December 17, 2020, among adults living in the United States. KFF paid for all costs associated with the survey.

The sample for this study was stratified by age, race/ethnicity, education, and gender as well as disproportionate stratification aimed at reaching uninsured women, women who identify as LGBT, Asian women, and women 18-49 years old. The sampling also took into consideration differential survey completion rates by demographic groups so that the set of panel members with a completed interview for a study is a representative sample of the target population. This survey includes people who self-identified as 'female' or 'male’ regardless of their sex at birth. While our goal was to be as inclusive as possible, we were not able to obtain a large enough sample to support a separate questionnaire that addresses the unique health concerns and experiences of non-binary or gender-fluid people to include them in this survey. We recognize that additional study is needed to better understand the health and access issues faced by non-binary people.

A series of data quality checks were run and cases determined to be poor-quality, as defined by surveys with a length of interview of less than 33% of the mean length of interview and with high levels of question refusal (>50%) were removed from the final data (n=96). Weighting involved multiple stages. First, the sample was weighted to match estimates for the national population from the 2020 Current Population Survey on age, gender, census division, race/ethnicity, and education. The second round of weights adjusted for the study’s sampling design. All statistical tests of significance account for the effect of weighting.

The margin of sampling error including the design effect for the full sample of women is plus or minus 2 percentage points. Numbers of respondents and margins of sampling error for key subgroups are shown in the table below. For results based on other subgroups, the margin of sampling error may be higher. Sample sizes and margins of sampling error for other subgroups are available by request. Note that sampling error is only one of many potential sources of error in this or any other public opinion poll.

GroupN (unweighted)M.O.S.E
Men Ages 18-641,144+/- 4 percentage points
Women Ages 18-643,661+/- 2 percentage points
Women Ages 18-492,695+/- 2 percentage points
White Women Ages 18-641,813+/- 3 percentage points
Black Women Ages 18-64603+/- 5 percentage points
Hispanic Women Ages 18-64801+/- 5 percentage points
Asian Women Ages 18-64246+/- 8 percentage points
LGB Women Ages 18-64392+/- 7 percentage points
Heterosexual Women Ages 18-643,239+/- 2 percentage points
Women < 200% FPL1,471+/- 3 percentage points
Women ≥200% FPL1,943+/- 3 percentage points

Endnotes

  1. This survey includes women ages 18-64. Hereafter, we use the word u2018womenu2019 to refer to women ages 18-64 unless otherwise indicated. ↩︎
  2. This survey defines low-income as household income under 200% of the federal poverty level (FPL); higher-income is 200% or more of the FPL. The FPL for a family of four in 2020 was $26,200. ↩︎
  3. Persons of Hispanic origin may be of any race; other groups are non-Hispanic. ↩︎
  4. Those in poorer health describe their health as fair or poor and those in better health describe their health as good, very good, or excellent health. ↩︎
  5. For survey data on sexual and reproductive health-related counseling, including contraception and sexual history, see the Sexual and Reproductive Health Services section. ↩︎
  6. For survey data on preventive sexual and reproductive health-related screenings such as pap smears and STI and HIV testing, see the Sexual and Reproductive Health Services section. ↩︎
  7. Not sufficient data to report on Asian women. Caution should be used when comparing race/ethnicity data here as there are few observations for White women. ↩︎

Supply vs Demand: When Will the Scales Tip on COVID-19 Vaccination in the U.S?

Published: Apr 20, 2021

For months, the main challenge with COVID-19 vaccine roll-out in the U.S. was that demand greatly outstripped supply. Indeed, limited supply, coupled with restricted eligibility in many parts of the country, meant that most people couldn’t get vaccinated if they wanted to. Now, with supply having increased significantly and eligibility fully open to adults in all states as of April 19, the main question has become, when will supply outstrip demand? While timing may differ by state, we estimate that across the U.S. as a whole we will likely reach a tipping point on vaccine enthusiasm in the next 2 to 4 weeks. Once this happens, efforts to encourage vaccination will become much harder, presenting a challenge to reaching the levels of herd immunity that are expected to be needed.

Our polls, and others, have shown that the share of adults who have either received one vaccine dose or want to get vaccinated as soon as they can has continually increased. As of March 21, it was 61% (up from 55% the month before). This increase reflects a shift from those saying they want to “wait and see” into the vaccine enthusiasm group. In fact, the share saying they want to “wait and see” has consistently fallen, as more people become enthusiastic about getting vaccinated.

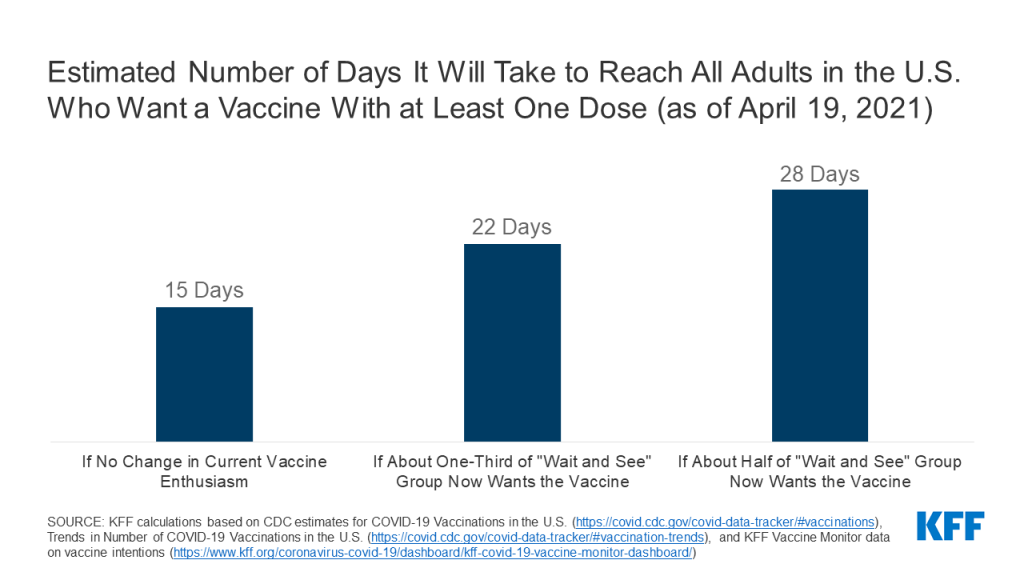
If we use 61% as a current “outer edge” of vaccine enthusiasm, it translates into about 157 million adults. The latest data from the CDC indicate that almost 131 million adults (or 50.7% of all adults), had received at least one vaccine dose as of April 19. That leaves an additional 27 million adults to go before we hit up against the “enthusiasm limit”. At the current rate of first doses administered per day (using a 7-day rolling average, as of April 13) – or approximately, 1.7 million per day – we would reach the tipping point in about 15 days.  Of course if the pace of vaccination picks up, it could be sooner.  However, if those who say they want to get vaccinated right away face challenges in accessing vaccination, it could take longer.

Estimated Number of Days It Will Take to Reach All Adults in the U.S. Who Want a Vaccine With at Least One Dose (as of April 19, 2021)​

We also know that, over time, people have moved from the “wait and see” group to the vaccine enthusiasm group, suggesting that the 61% may be a floor, not a ceiling.  If about a third of the “wait and see” group moves into the enthusiasm group (comparable to what happened last month), the “outer edge” of vaccine enthusiasm would increase to 170 million people (or 66% of all adults); at the current rate of vaccine doses administered per day, it would take 22 days to reach the point at which supply outstrips demand.  If half of the “wait and see” group move, it would take about 28 days to reach the tipping point.

Thus, on average across the country, it appears we are quite close to the tipping point where demand for rather than supply of vaccines is our primary challenge. Federal, state, and local officials, and the private sector, will face the challenge of having to figure out how to increase willingness to get vaccinated among those still on the fence, and ideally among the one-fifth of adults who have consistently said they would not get vaccinated or would do so only if required. Now that supply has increased and eligibility has expanded, it will take a concerted effort to reach a sufficient level of vaccination for herd immunity, and to do so in a way that achieves equity goals as well.

News Release

Analysis Finds That a Relatively Small Number of Drugs Account for the Majority of Medicare Prescription Drug Spending

Published: Apr 19, 2021

A new KFF analysis finds that a relatively small share of drugs, mainly those without generic or biosimilar competitors, accounted for a disproportionate share of prescription drug spending in Medicare in 2019. This finding suggests that recent proposals that focus on prices for a limited number of high-cost drugs could achieve significant savings.

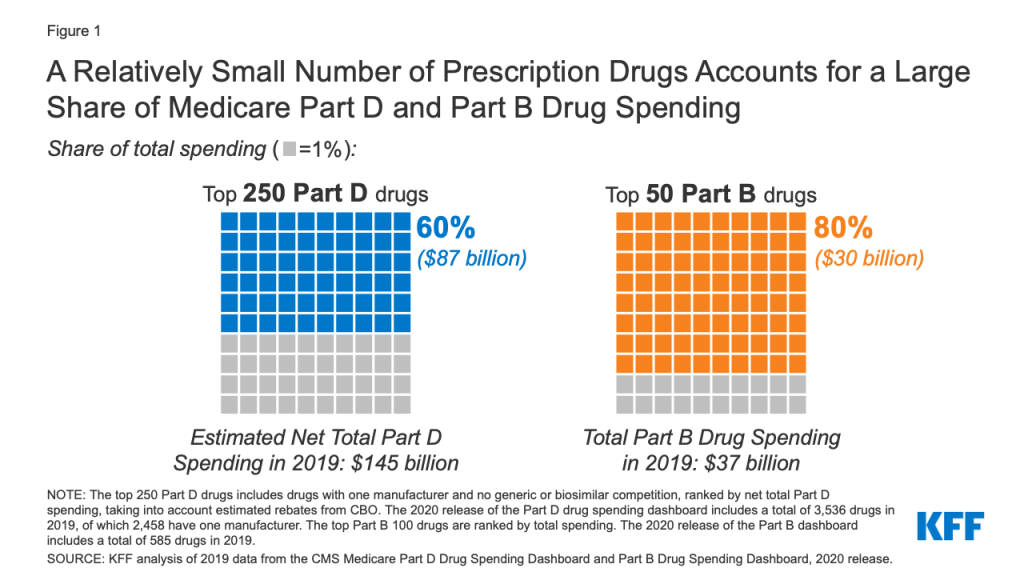
The 250 top-selling drugs in Medicare Part D with one manufacturer and no generic or biosimilar competition – or roughly 7 percent of the more than 3,500 Part D covered drugs — accounted for 60 percent of the net total Part D spending of $145 billion in 2019, the analysis finds. Part D is Medicare’s voluntary benefit that covers retail prescription drugs for 46 million enrollees in 2020.

Similarly in Medicare Part B, the top 50 covered drugs – or 8.5 percent of all Part B covered drugs — accounted for 80 percent of total Part B drug spending of $37 billion in 2019. Medicare Part B pays for prescription drugs administered by physicians and other providers in outpatient settings for conditions such as cancer and rheumatoid arthritis.

The findings inform ongoing policy debates about policies to rein in prescription drug prices, such as proposals to allow the government to negotiate drug prices (Part D) or peg payments to international prices (Part B), if such changes were applied to a limited number of drugs. Focusing drug price negotiation or reference pricing on a subset of high-priced drugs could leave some savings on the table, but might also be a more efficient use of administrative resources.

For more data and analyses related to Medicare and prescription drugs, visit kff.org.

Relatively Few Drugs Account for a Large Share of Medicare Prescription Drug Spending

Published: Apr 19, 2021

Note: An updated analysis with more recent data is available here

Policymakers are once again focusing attention on proposals to lower prescription drug costs. During the previous session of Congress, the House passed legislation (H.R. 3) to allow the federal government to negotiate drug prices for Medicare Part D, Medicare’s outpatient prescription drug benefit, and private insurers. Under H.R. 3, the HHS Secretary would negotiate prices for up to 250 brand-name drugs lacking generic or biosimilar competition with the highest net spending. In contrast, other drug price negotiation proposals placed no limit on the number of covered drugs subject to negotiation. In a similar vein, the Trump administration issued a final rule to establish a model through the CMS Innovation Center  that would base Medicare’s payment for the 50 highest-spending Part B drugs (i.e., drugs administered by physicians in outpatient settings) on the lowest price paid by certain other similar countries. (In light of pending litigation, the Biden Administration has stated that it will not implement this model without further rulemaking.)

These drug pricing proposals raise the question of whether limiting the number of drugs subject to government price negotiation or international reference pricing might leave substantial savings on the table, even if this approach is more administratively feasible than subjecting all drugs to negotiation or reference pricing. This analysis provides context for this question by measuring the share of total Medicare Part D and Part B drug spending accounted for by top-selling drugs covered under each part. For this analyses, we ranked drugs by total spending in 2019, based on data from the Centers for Medicare & Medicaid Services’ Medicare Part D and Part B drug spending dashboards. For Part D, we calculated estimates of net total spending, taking into account average rebates reported by the Congressional Budget Office. (See Data and Methods for details.)

Takeaways

Our analysis finds that a relatively small number and share of drugs accounted for a disproportionate share of Medicare Part B and Part D prescription drug spending in 2019 (Figure 1).

  • The 250 top-selling drugs in Medicare Part D with one manufacturer and no generic or biosimilar competition (7% of all Part D covered drugs) accounted for 60% of net total Part D spending.
  • The top 50 drugs covered under Medicare Part B (8.5% of all Part B covered drugs) accounted for 80% of total Part B drug spending.
Figure 1: A Relatively Small Number of Prescription Drugs Accounts for a Large Share of Medicare Part D and Part B Drug Spending

Medicare Part D

In 2019, Medicare Part D covered more than 3,500 prescription drug products, with total spending of $183 billion, not accounting for rebates. Because drug-specific rebate data are not publicly available, we applied average rebates from a CBO analysis of prices for top-selling brand-name drugs to derive an estimate of net Medicare Part D spending of $145 billion in 2019. For specialty drugs (which we identified as drugs with prices at or above $670 per claim, based on the amount of the Part D specialty tier threshold ]in 2019), we applied a rebate of 12%, and for non-specialty brand-name drugs, we applied a rebate of 47%. We assumed no rebate for lower-cost generic drugs.

Our analysis shows that Part D drug spending is concentrated among a relatively small number of drugs with only one manufacturer and no generic or biosimilar competition.

  • The top-selling 250 drugs with one manufacturer and no generic or biosimilar competitors accounted for 60% of net total Part D spending in 2019 (Figure 1). In contrast, the remaining 2,208 drugs with one manufacturer accounted for 13% of net total Part D spending in 2019, and all other covered Part D drugs (1,078) accounted for 27% of net total spending.
  • The average net cost per claim across the top 250 drugs with one manufacturer and no generic or biosimilar competitors was substantially higher than the average net cost per claim of other covered Part D drugs. For the top 250 drugs, the average net cost per claim was $5,750, more than twice as much as the average net cost per claim for the remaining 2,208 drugs with one manufacturer ($2,555), and more than 13 times greater than the average net cost per claim for all other covered Part D drugs ($422) (primarily generic drugs).
  • The 10 top-selling Part D covered drugs with no generic or biosimilar competition in 2019 accounted for 0.3% of all covered products but 16% of net total Part D spending that year (Figure 2). These 10 top-selling drugs include three cancer medications, four diabetes medications, two anticoagulants, and one rheumatoid arthritis treatment (Table 1). Our estimate of net total spending on each of these drugs ranged from around $1 billion to $4 billion in 2019, based on average rebates for specialty and non-specialty brand drugs derived from CBO’s analysis.

Medicare Part B

Medicare Part B covers prescription drugs administered by physicians and other providers in outpatient settings. Part B covers a substantially smaller number of drugs than Part D – fewer than 600 drug products in 2019, with total spending of $37 billion – but many Part B covered drugs are relatively costly medications. As is the case under Part D, drug spending under Part B is highly concentrated among a handful of medications:

  • The top 50 drugs ranked by total spending accounted for 80% of total Medicare Part B drug spending in 2019, while the top 100 drugs accounted for 93% of the total (Figure 3). In contrast, the remaining 485 covered Part B drugs accounted for only 7% of total Part B drug spending in 2019.
  • The top 10 Part B covered drugs in 2019 accounted for 2% of all covered products but 43% of total Part B drug spending that year. The top 10 drugs include four cancer medications, two medications for macular degeneration, two rheumatoid arthritis treatments, one osteoporosis drug, and one bone marrow stimulant. Total spending on these drugs ranged from $2.9 billion for Eylea, a treatment for macular degeneration, to $0.9 billion for Remicade, a treatment for rheumatoid arthritis (Table 2)

Conclusion

Some recent proposals to lower prescription drug prices have limited the number of drugs subject to price negotiation and international reference pricing. This analysis shows that Medicare Part D and Part B spending is highly concentrated among a relatively small share of covered drugs, mainly those without generic or biosimilar competitors. Focusing drug price negotiation or reference pricing on a subset of drugs that account for a disproportionate share of spending would be an efficient use of administrative resources, though it would also leave some potential savings on the table. In considering whether to broaden these proposals to focus on all prescription drugs, policymakers may want to consider whether doing so would achieve sufficient savings to justify the added administrative burden and associated costs.

This work was supported in part by Arnold Ventures.We value our funders. KFF maintains full editorial control over all of its policy analysis, polling, and journalism activities.

Methods

This analysis is based on 2019 data from the Centers for Medicare & Medicaid Services (CMS) Medicare Part B and Part D Drug Spending Dashboards. For Part B, the data includes spending for beneficiaries in traditional Medicare but not Medicare Advantage, because claims data are not available for beneficiaries in Medicare Advantage plans. For Part D, the data includes spending for beneficiaries in both traditional Medicare and Medicare Advantage who are enrolled in Medicare Part D plans.

Drug spending metrics for Part B drugs presented in the dashboard represent the full value of the product, including the Medicare payment and beneficiary liability. Medicare reimbursement for most Part B drugs is 106% of the Average Sales Price (ASP) which is the average price to all non-federal purchasers in the United States and includes volume discounts, prompt pay discounts, cash discounts, free goods that are contingent on any purchase requirement, chargebacks (other than chargebacks for 340B discounts), and rebates (other than rebates under the Medicaid drug rebate program). For Part B covered drugs, beneficiaries are liable for 20% coinsurance.

For this analysis, we sorted the list of drugs in the Part B dashboard in 2019 (n=585) by total spending, calculated the percent of total spending accounted for by each drug, and summed across the top 10, 25, 50, and 100 drugs ranked by total spending. Because Part B spending reported in the dashboard reflects the actual Medicare payment, no adjustment for rebates was necessary.

Drug spending metrics for Part D drugs presented in the CMS dashboard are based on the gross drug cost, which represents total spending for the prescription claim, including Medicare, plan, and beneficiary payments. The Part D spending metrics do not reflect manufacturer rebates or other price concessions, because CMS is prohibited from publicly disclosing such information. In order to base our analysis on net drug spending, we incorporated average rebate estimates from an analysis of brand-name drug prices conducted by the Congressional Budget Office of Part D spending data. Based on CBO’s analysis of the difference between average retail and net prices for top-selling drugs, specialty drug rebates average 12% and non-specialty brand drug rebates average 47%. We applied the 12% rebate to gross drug spending amounts for drugs with average cost per claim above $670 (the threshold for inclusion of a drug on a Part D plan specialty tier in 2019), and the 47% rebate to gross drug spending amounts for all other drugs with one or two manufacturers where the brand name and generic name in the drug spending dashboard were not the same (which we interpreted as indicating a generic drug, along with multiple manufacturers). For drugs with three or more manufacturers, which generally corresponds to generic medications, we applied no rebate. Lack of publicly-available drug-specific rebate data limits our ability to further refine these estimates of net spending. While our estimates of net spending and the specific shares accounted for by different subsets of drugs would vary somewhat if we assumed different rebate amounts, the top-line finding – that a small number and share of drugs accounts for a large share of total spending – would not change.

We then sorted the list of drugs in the Part D dashboard in 2019 (n=3,536) by net total spending (after adjusting for estimated rebates as described above) and number of manufacturers, sorting out drugs with one manufacturer that had no generic or biosimilar competitors, and calculated the percent of net total spending accounted for by each drug, summing across the top 10, 50, 100, and 250 drugs with one manufacturer and no generic or biosimilar competition ranked by net total spending. For the subsets of the top 250 drugs, all other drugs with one manufacturer, and all other covered Part D drugs, we also calculated the average net spending per claim based on the average spending per claim metric presented in the dashboard.

Poll Finding

KFF COVID-19 Vaccine Monitor: What We’ve Learned

Authors: Liz Hamel and Mollyann Brodie
Published: Apr 16, 2021

The KFF COVID-19 Vaccine Monitor is an ongoing research project tracking the public’s attitudes and experiences with COVID-19 vaccinations. Using a combination of surveys and qualitative research, this project tracks the dynamic nature of public opinion as vaccine development and distribution unfold, including vaccine confidence and acceptance, information needs, trusted messengers and messages, as well as the public’s experiences with vaccination.

KFF launched the COVID-19 Vaccine Monitor in December 2020 to track the dynamic nature of the U.S. public’s attitudes and experiences with COVID-19 vaccination as distribution efforts unfold across the country. As many states have opened up eligibility to everyone ages 16 and over and the remainder of states are poised to do so soon, this brief summarizes some of the key findings and themes from this research based on interviews with more than 11,000 adults across the nation to date.

Key takeaways

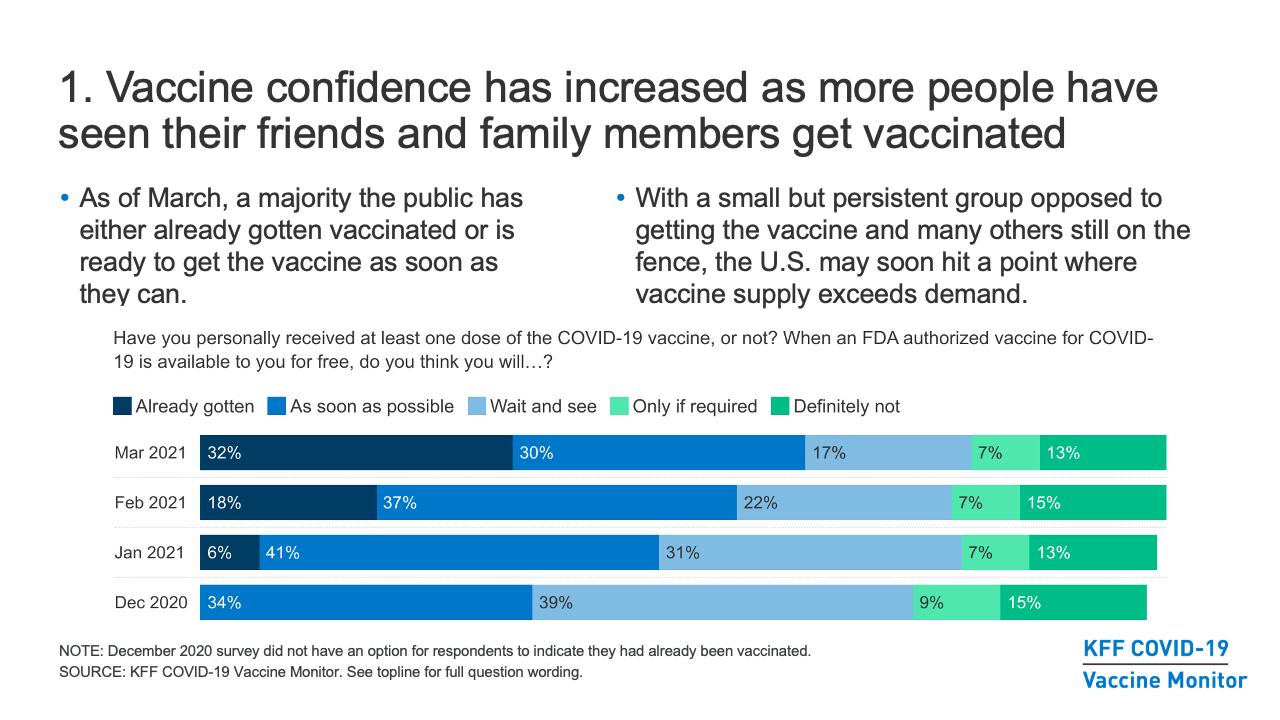
  • Broadly, the COVID-19 Vaccine Monitor has found that vaccine confidence in the U.S. has increased as more and more people have seen their friends and family members get vaccinated, and now a majority of the public has either already gotten vaccinated or is ready to get the vaccine as soon as they can. Yet with a small but persistent group opposed to getting the vaccine and many others still on the fence, the U.S. may soon hit a point where vaccine supply exceeds demand, a situation that is already the case in certain communities.
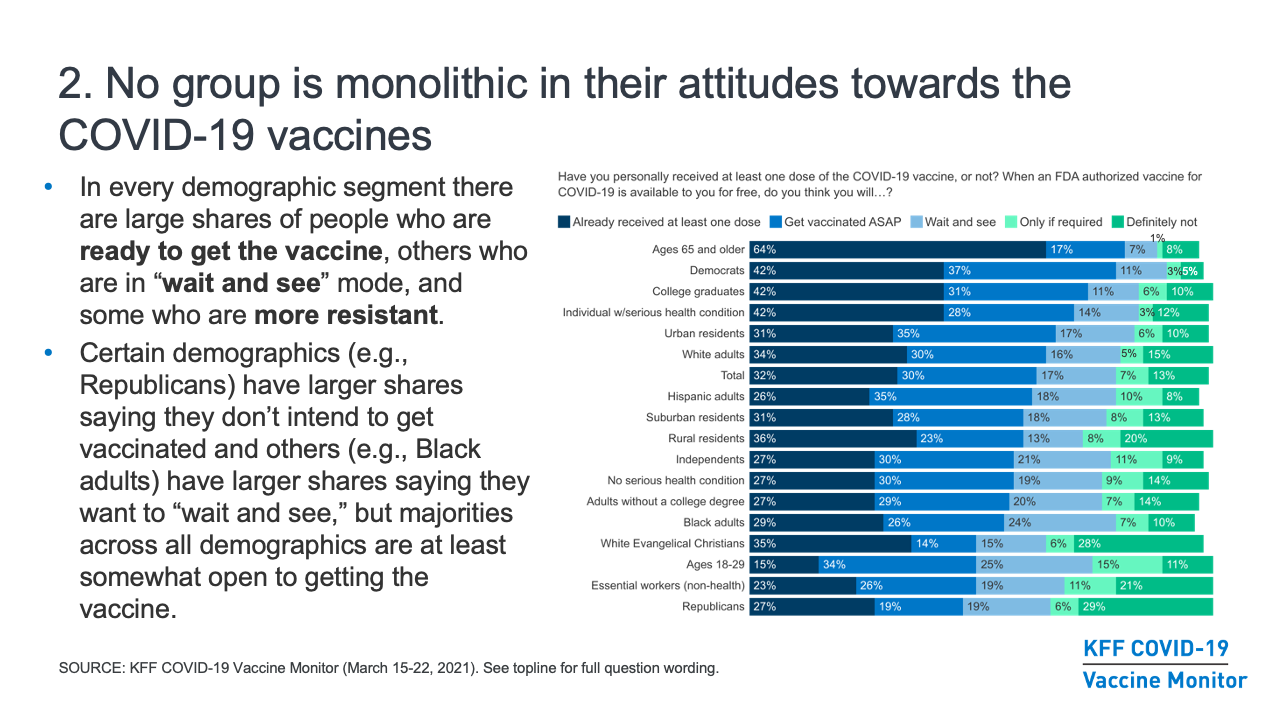
  • While some media narratives have focused on which groups are most “vaccine hesitant,” our research finds that no group is monolithic in their vaccine attitudes, and in every demographic segment there are large shares of people who are ready to get the vaccine, others who are in “wait and see” mode, and some who are more resistant. Even though certain demographics (for example, Republicans) have a higher share than other groups saying they don’t intend to get vaccinated and others (for example, Black adults) have a higher share saying they want to “wait and see,” we’ve found that majorities across all demographic groups are at least somewhat open to getting the vaccine.
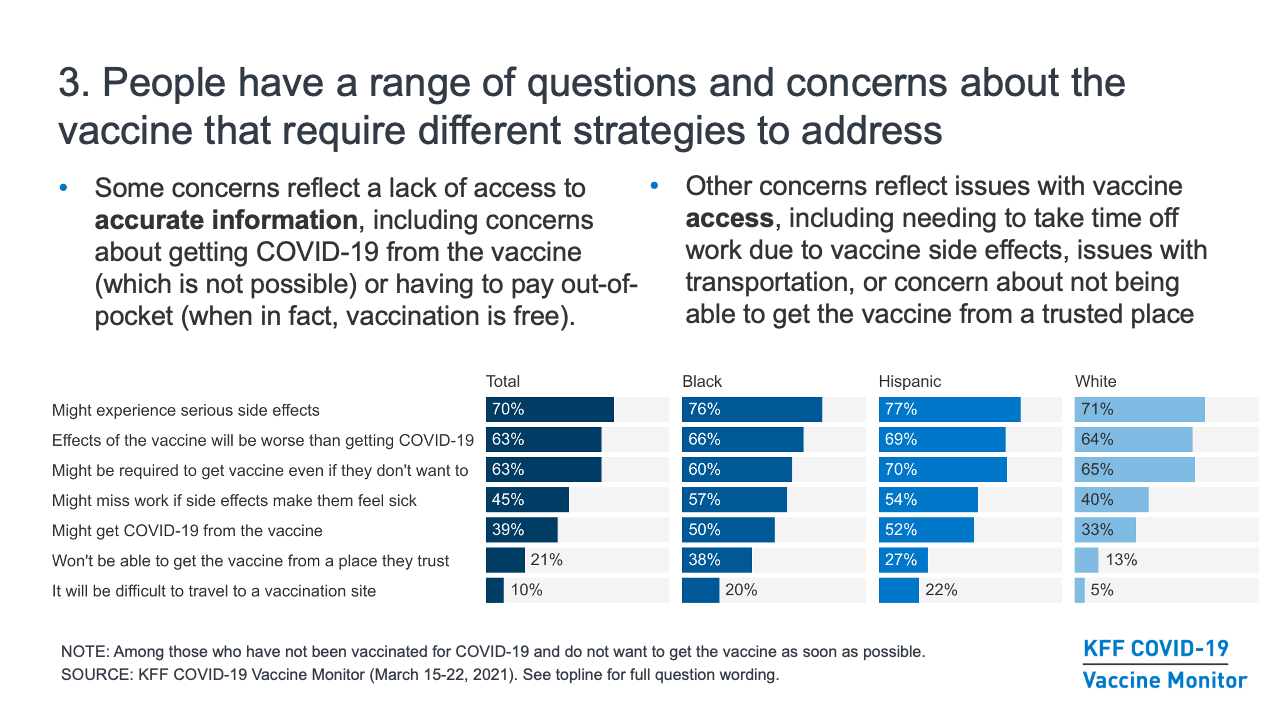
  • Those who are not ready to get vaccinated for COVID-19 right away have a range of questions and concerns about the vaccine that require different strategies to address. The top concern across groups has been the potential side effects of the vaccine, including a substantial share who are worried about missing work due to side effects. Other concerns reflect a lack of access to accurate information; for example, many are concerned that they might get COVID-19 from the vaccine (which is not possible) or that they will have to pay out-of-pocket costs to get vaccinated (when in fact, vaccination is free). And other concerns reflect issues with vaccine access, including needing to take time off work to get vaccinated, issues with transportation, or concern about not being able to get the vaccine from a trusted place. Rather than a single messaging strategy, these concerns point to the need for a combination of information, outreach, and policies to both bolster confidence in COVID-19 vaccines and make vaccination accessible across communities.
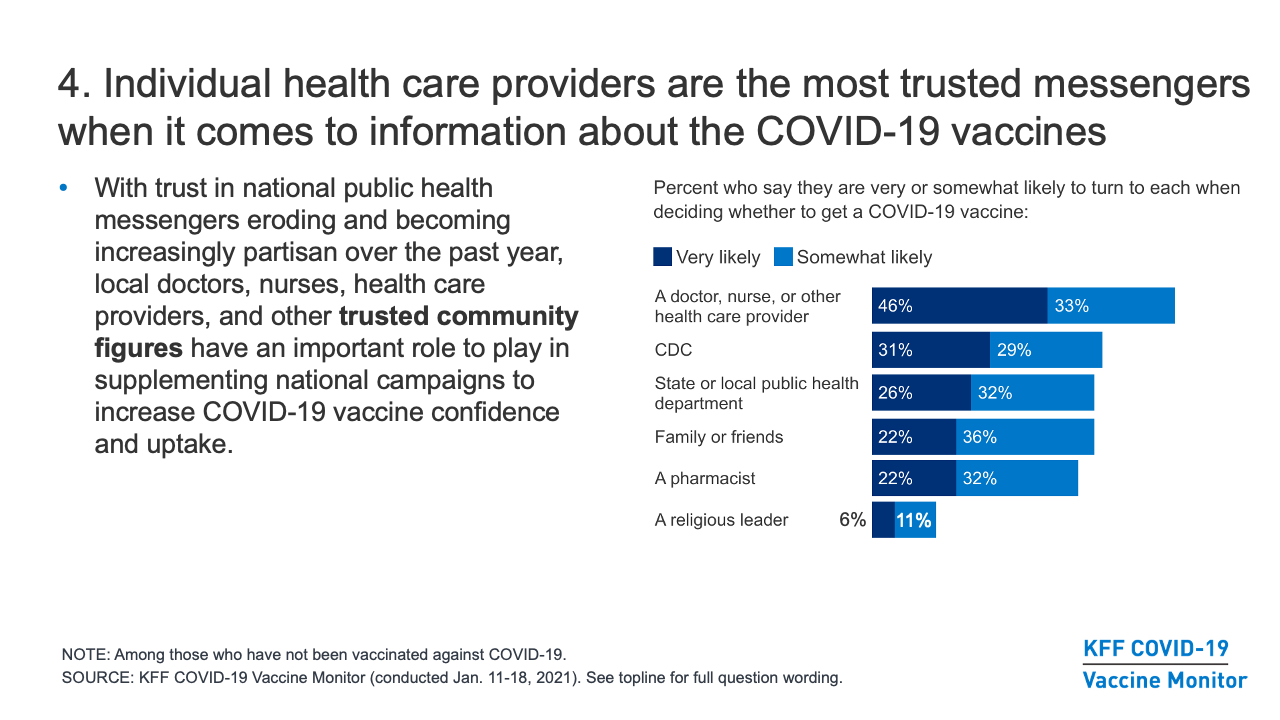
  • Individual health care providers are the most trusted messengers when it comes to information about the COVID-19 vaccines. With trust in national public health messengers eroding and becoming increasingly partisan over the past year, local doctors, nurses, health care providers, and other trusted community figures have an important role to play in supplementing any national campaigns to increase COVID-19 vaccine confidence and uptake.
  • It is too early to know what effect the recent announcement about the pause in distribution of the Johnson & Johnson vaccine will have on COVID-19 vaccine confidence. Prior to this announcement, our research found that the one-shot vaccine was an appealing option for a large share of those in the “wait and see” group. However, the potential side effects of the vaccine are a top concern for those who have not yet been vaccinated, so if the public perceives blood clots as a potential side effect (regardless of whether a link is proven), this news does have the potential to increase concerns about getting the Johnson & Johnson vaccine. In the meantime, messages about the effectiveness of the existing vaccine options at preventing serious illness and death from COVID-19 are likely to be the most effective at bolstering confidence among those who are on the fence about getting the vaccine.
  • The share of the public that is eager to get the COVID-19 vaccine has been increasing over time, including across subgroups by race/ethnicity, partisanship, and urbanicity. As of March, six in ten adults said they had already gotten at least one dose of the vaccine (32%) or would get it as soon as it was available to them (30%), a share that has increased steadily since December, when 34% said they would get the vaccine as soon as possible. The share saying they want to “wait a while and see how it’s working for others” before getting vaccinated themselves declined steadily from 39% in December to 17% in March. Where we have not yet seen much movement is in the shares saying they definitely won’t get the vaccine (13% in March) or will do so only if required for work, school, or other activities (7%).
  • People at higher risk for serious complications and death from COVID-19 tend to be more enthusiastic about getting the vaccine. For example, in March, 82% of adults ages 65 and older and 70% of individuals with a serious health condition say they’ve already been vaccinated or will get the vaccine as soon as they can, compared to smaller shares of younger adults and those without serious health conditions. This at least partially reflects early access these groups had to the vaccine compared to others, but also the fact that larger shares of younger and healthier adults say they want to wait and see, will get the vaccine only if required, or will definitely not get vaccinated.
  • While enthusiasm for getting the vaccine increased dramatically among Black adults between February and March (from 41% to 55% saying they’d already gotten vaccinated or intended to do so as soon as possible), Black adults remain somewhat more likely than White adults to say they want to “wait and see” (24% vs. 16%). In earlier months, Hispanic adults were also somewhat more likely to say they wanted to “wait and see,” but by March the share among Hispanic adults decreased to 18%.
  • Education is also a dividing factor in vaccination intentions, with college-educated adults more likely than those without college degrees to say they’ve already gotten vaccinated or will do so as soon as they can (73% vs. 56% in March).
  • Vaccination intentions have also divided along party lines since December, reflecting the broader partisan dialogue about the pandemic over the past year. About eight in ten Democrats (79%) are eager to get the vaccine or say they have done so already, compared to nearly six in ten independents (57%) and just under half of Republicans (46%). About three in ten Republicans (29%) say they will “definitely not” get vaccinated, a share that has not changed substantially over time.
  • In addition, 28% of White Evangelical Christians say they will definitely not get the vaccine, reflecting the fact that two-thirds (66%) of this group either identifies as Republican or leans towards the Republican party. One in five rural residents also say they will definitely not get vaccinated, about twice the share as in urban areas, a gap largely explained by the concentration of Republicans and White Evangelical Christians who live there.

Challenges and opportunities that cross demographic groups

Concerns and messages

  • The potential side effects and the newness of the vaccine seem to be driving a lot of the concern among people who have not yet been vaccinated. Among the 37% of adults in March who were not yet convinced to get the vaccine as soon as possible, seven in ten said they were concerned they might experience serious side effects from the vaccine, and over six in ten were concerned the effects of the vaccine might be worse than getting COVID-19. In addition, when those who say they will definitely not get the vaccine are asked to state their main reason in their own words, the most common response is that the vaccine is too new and/or that not enough is known about the long-term effects.
  • Different groups respond to messaging and information at different levels, but of the messages we’ve tested, emphasizing the effectiveness of the vaccine at preventing serious illness and death is the most effective across groups (two-thirds of those in the “wait and see” group and four in ten in the “only if required” group say they’d be more likely to get vaccinated after hearing the vaccines are nearly 100% effective at preventing hospitalizations and death from COVID-19).
  • The “wait and see” group is an important target for outreach and messaging, since they express some concerns about getting vaccinated, but will likely be much easier to convert from vaccine-hesitant to vaccine-acceptant than those who say they will “definitely not” get the vaccine or will get it “only if required” to do so. Other messages/information that are effective at persuading many in the “wait and see group” include that scientists have been working on the technology used in the new COVID-19 vaccines for 20 years; that more than 100,000 people from diverse backgrounds took part in the vaccine trials; that the vast majority of doctors who have been offered the vaccine have taken it; and that there is no cost to get the vaccine.
  • Separate from concerns about the effects of the vaccine itself, about six in ten of those who are not yet convinced to get the vaccine right away are concerned that they might be required to get the vaccine even if they don’t want to.

Information and misinformation

  • Reaching people with information about how to access vaccines is an ongoing challenge. As of March, many people say they still don’t have enough information about when (46%) and where (33%) they’ll be able to get the vaccine, and three in ten are not sure if they are currently eligible in their state (rising to four in ten among Hispanics, young adults, and those with lower incomes).
  • Many are unaware of some basic facts about the vaccines and how they work. As of January, 34% of all those who had not been vaccinated had heard and believed or were unsure about several common “myths” about the vaccine (that it contains the live virus that causes COVID-19, that it causes infertility, or that one must pay out-of-pocket to get vaccinated), rising to 41% among the “wait and see” group and 53% among those who say they will “definitely not” get vaccinated. Around four in ten of those who are not yet convinced to get the vaccine right away (rising to half among Black and Hispanic adults) are concerned that they might get COVID-19 from the vaccine.
  • Health care providers are the top source people say they will turn to for information when making decisions about whether to get vaccinated (79%, far outranking other sources in January). However, just one-quarter of those who had not yet been vaccinated said they have asked a provider about the vaccine as of February. Regardless of the sources they trust or say they will turn to, the media is a more prominent source where people are actually getting information. Asked where they have gotten information about the vaccine in recent weeks, cable (43%), network (41%), and local TV news (40%) are top sources, along with family and friends (40%). However, social media, most notably Facebook, is among the most prominent sources of information for those who want to “wait and see” about the vaccine (37%) as well as those who say they “definitely won’t” get vaccinated (40%).

Vaccine access and experiences

  • While most of those who were vaccinated as of February say they were able to find or schedule a vaccine appointment on their own, about four in ten say someone else helped them, including larger shares of those with lower incomes and without college degrees. Among those who believe they are eligible but had not yet been vaccinated as of March, about a third have tried to schedule a vaccination appointment including 16% who did so successfully and 17% who say they tried but were unable to make an appointment.
  • Making access to vaccines more convenient may improve uptake among some groups. Among the “wait and see” group, half say they’d be more likely to get vaccinated if their doctor offered it during a routine appointment, and four in ten of those with jobs say they’d be more likely to get it if their employer arranged for them to get vaccinated at work. Employer incentives could also play a role (38% of the employed “wait and see” say they’ be more likely to get vaccinated if their employer paid them $200), as could airline travel requirements (almost half in both the “wait and see” and “only if required” groups say they’d be more likely to get vaccinated if it was required to fly).

Challenges and opportunities for key subgroups

Despite the demographic differences in vaccination intentions noted above, no group is monolithic in their attitudes towards the COVID-19 vaccines. In each demographic group, there are many who are eager to get the vaccine right away and some who say they won’t get it under any circumstances. Importantly, across all the groups we’ve analyzed, a large majority is at least somewhat open to getting the vaccine and no more than one-third say they will “definitely not” get it. Still, our in-depth survey work has revealed some insights that may be helpful for those looking to understand vaccine attitudes and increase confidence in specific populations, and those are outlined in the sections below.

Black and Hispanic adults

  • Concern about getting sick with COVID-19 is high among Black and Hispanic adults who want to wait and see before getting vaccinated, but concern about experiencing serious side effects of the vaccine is also high. Given this, messages focused on protecting individuals and families from illness, while also acknowledging and/or addressing concerns about serious side effects may be most successful.
  • People express a range of other concerns about the vaccine that can be addressed with better access to information and policies that make it easier for people to get the vaccine from trusted places, and many of these concerns are expressed at higher rates among people of color. In particular, among those who are not convinced to get the vaccine as soon as possible, at least half of Black and Hispanic adults are concerned that they might get COVID from the vaccine or that they might have to miss work if they have side effects. Addressing these misperceptions in conversations and outreach may be helpful.
  • For Black adults in particular, reluctance to get vaccinated may be related to mistrust of the health care system that reflects both historical mistreatment and personal experiences with racism and discrimination. In fact, 38% of Black adults and 27% of Hispanic adults who are not yet convinced to get the vaccine are worried they won’t be able to get it from a place they trust.
  • Black and Hispanic adults say they will turn to a wide range of information sources when making vaccine-related decisions, including individual health care providers, pharmacists, friends and family, and government health agencies. While religious leaders rank lower on the list of overall sources of information, among those who want to “wait and see,” Black adults (35%) and Hispanic adults (28%) are more likely than white adults (14%) to say they’ll turn to them for information, indicating a possible effective messenger to reach some the Black and Hispanic communities.

Republicans

  • While about a third of Republicans say they will “definitely not” get the vaccine or will get it “only if required,” another 19% are in “wait and see” mode and may be receptive to messages and information aimed at increasing vaccine uptake. However, even within the “wait and see” group, partisan differences emerge that suggest different messaging strategies will be required. For example, two-thirds (67%) of Republicans and Republican-leaning independents in the “wait and see” group view vaccination as a personal choice, and half (51%) believe the seriousness of COVID-19 is being exaggerated in the news, according to the January Monitor. This suggests that messages focused on helping people make the right choice to protect their own health are more likely to resonate with Republican audiences than those that emphasize the seriousness of the pandemic or the need to get vaccinated for the collective good.
  • Government sources of information (including the CDC and state and local health departments) are less trusted by Republicans than by Democrats in the “wait and see” group, so individual health care providers, pharmacists, and friends and family are a better conduit for messaging/information to Republicans.
  • Republicans – who tend to be particularly concerned about personal liberty – are more likely to be concerned about being required to get vaccinated against their will. Among those who are not convinced to get vaccinated right away, a larger share of Republicans (71%) compared to independents (57%) and Democrats (53%) say they are concerned that they might be required to get the vaccine even if they don’t want to.
  • Two-thirds (66%) of White Evangelical Protestants identify as Republicans or independents who lean toward the Republican Party, so there is a lot of overlap between their attitudes toward the COVID-19 vaccine and the attitudes of Republicans in general.

Rural residents

  • In a large survey of over 1,000 adults living in rural areas, we found signs of strong early uptake and access to vaccines in rural areas. A slightly larger share of adults in rural areas compared to urban and suburban areas reported having received at least one dose of the vaccine (39% vs. 31%), and an additional 16% of rural residents want to get the vaccine as soon as they can. In addition, most adults living in rural areas feel their community has enough vaccination locations and vaccine supply to serve local residents. However, Black adults living in rural areas are less likely than White or Hispanic adults to say their community has adequate supply of these things.
  • While one in five rural residents say they will “definitely not” get vaccinated, this is largely due to the disproportionate share of Republicans and White Evangelical Christians living in these areas. The concerns that rural residents have about the vaccine and the messages that resonate most to convince them to get vaccinated mirror the concerns and effective messages for the public at large.

The “definitely nots”

  • Those who say they will “definitely not” get the vaccine (13% of the overall public) have a very different view of the overall pandemic compared to the rest of the population. For example, 75% of this group believes the seriousness of coronavirus has been exaggerated by the media (compared to 32% of the public overall), and 82% are not worried about themselves or a family member getting sick from COVID-19 (compared to 50% of the public overall).
  • This group not only views the vaccine differently, but they also hold different views on other protective measures. For example, 96% of those in the “definitely not” group say getting vaccinated for COVID-19 is a personal choice rather than part of everyone’s responsibility to protect others (compared to 46% of the public overall who say this), and 65% believe that wearing a mask does not prevent the spread of coronavirus (compared with 20% of the public overall).
  • This group is highly distrustful of government sources of information; 83% say they trust the U.S. government “not too much” or “not at all” to look out for the interests of people like them, and 71% say they do not trust the CDC for reliable information about COVID-19 vaccines.
  • Of the messages and incentives we’ve tested to see what might make people more likely to get the vaccine, none are effective at moving more than a very small share of the “definitely not” group. For example, fewer than one in ten among this group say they’d be more likely to get vaccinated after hearing the vaccines are nearly 100% effective at preventing hospitalization and death from COVID-19 or that scientists have been working on the technology used in the vaccines for 20 years. A similarly small share say they’d be more likely to get vaccinated if airlines required it or if it was offered to them during a routine medical visit.

Frontline health care workers

  • A KFF/Washington Post survey of frontline health care workers, including those who work in various functions such as treating patients, performing administrative duties, or assisting with patient’s daily activities and housekeeping, found that half (52%) of all frontline health workers reported receiving at least one dose of a COVID-19 vaccine as of early March and another one in five (19%) had scheduled or were planning to receive the vaccine. Another nearly one in five (18%) said they did not plan to get vaccinated and 12% had not made up their mind.
  • As among the general public, COVID-19 vaccination intention among health care workers divides by race/ethnicity and education, as well as by work location and type of job duties. For example, while the large majority of those working in hospitals have been gotten the vaccine or intend to do so, almost half of those working in patients’ homes say they won’t get vaccinated or are undecided. And among physicians (and nurses with graduate degrees), nearly nine in ten report either already being vaccinated or plan to get a vaccine.
  • Health care employers have a role to play in making sure their employees can get vaccinated. The share of health care workers who were offered a COVID-19 vaccine from their employer was much lower among those working in patients’ homes compared to those working hospitals and other settings.
  • The potential side effects of the vaccine – a top concern among the public – are also a top concern for health care workers who have not yet been vaccinated; 82% say worry about possible side effects is a major factor in their decision about whether to get vaccinated.
News Release

Vaccine Monitor: What We’ve Learned

Published: Apr 16, 2021

With nearly all states poised to allow anyone at least 16 years old to get a COVID-19 vaccine, this week’s announcement pausing the distribution of the Johnson & Johnson vaccine to investigate a rare side effect is raising questions about whether and how it will affect the public’s eagerness to get vaccinated.

A new report summarizes key insights about vaccine confidence, messages and messengers from the KFF COVID-19 Vaccine Monitor project, which has interviewed more than 11,000 adults nationally since December to track the public’s shifting attitudes and experiences with COVID-19 vaccinations.

Among its key takeaways:

  • Among those who are not ready to get a COVID-19 vaccination right away, their top concern consistently has been the potential side effects, including many who worry they will have to miss work due to side effects. The news about the Johnson & Johnson vaccine could heighten those worries for people on the fence about getting vaccinated.
  • Prior to the pause in the Johnson & Johnson vaccine, it was an appealing option for a large share of those in the “wait and see” group because it requires only a single shot, while the other available vaccines (Moderna and Pfizer) require two shots several weeks apart.
  • Some people’s concerns about vaccination are based on lack of access to accurate information. For example, many are concerned that they might get COVID-19 from a vaccine, which is not possible, or that they will have to pay out-of-pocket even though the COVID-19 vaccinations are free.
  • No group is monolithic in their vaccine attitudes. While some demographics such as Republicans have a higher share saying they don’t intend to get vaccinated, and others such as Black adults have a higher share saying they want to “wait and see,” majorities across all demographic groups are at least somewhat open to getting a vaccine.
  • Individual health care providers are the most trusted messengers when it comes to information about the COVID-19 vaccines.

Available through the Monitor’s online dashboard, the report looks at common messages and messengers that apply across demographic groups, as well as challenges and opportunities related to the views of specific groups such as Black and Hispanic adults, Republicans, rural residents, frontline health workers and those who say they will “definitely not” get vaccinated.

The KFF COVID-19 Vaccine Monitor is an ongoing research project tracking the public’s attitudes and experiences with COVID-19 vaccinations. Using a combination of surveys and qualitative research, this project tracks the dynamic nature of public opinion as vaccine development and distribution unfolds, including vaccine confidence and acceptance, trusted messengers and messages, as well as the public’s experiences with vaccination.

Key Questions about COVID-19 Vaccine Passports and the U.S.

Published: Apr 15, 2021

As COVID-19 vaccination rolls out in parts of the world, many countries have started to implement or are considering the use of COVID-19 “vaccine passports” – paper or digital forms certifying that a person has been vaccinated against COVID-19 – for purposes of international travel. In addition, some countries are using them for domestic travel and/or access to certain establishments, activities, and events. Such certifications are separate from but related to the issue of vaccine mandates. Where COVID-19 vaccines are mandated, there will be a need to certify vaccine status, and a vaccine passport is a potential tool for that purpose.

The U.S. government is exploring COVID-19 vaccine certifications for use internationally and domestically. The administration has said that a vaccine passport may be required in the future for international travelers entering the U.S., but it will not impose a federal requirement for domestic purposes. However, it is working with the private sector to develop standards around such certifications. Within the U.S., states are landing on different sides of what has quickly become a partisan issue with several states moving to implement passports while others have come out strongly against the idea.

This brief provides an overview of what vaccine passports are, how they are being used, and identifies a number of outstanding policy issues facing the U.S. in both the international and domestic contexts.

What are COVID-19 Vaccine Passports?

A vaccine passport is a paper or digital form certifying that a person has been vaccinated against a particular disease. There is a long history of the use of vaccine certifications for international travel, with many countries currently requiring travelers to present proof of yellow fever vaccination to enter, for example. A COVID-19 vaccine certification for international travel could be used by governments in a number of ways, such as allowing an individual to move across borders more freely by potentially bypassing travel restrictions like testing or quarantine requirements upon arrival. In addition, vaccine passports may be used for domestic purposes, such as to permit individuals access to certain businesses, locations or activities within countries.

Where are COVID-19 Vaccine Passports Being Used Now?

Several countries have already begun to use COVID-19 vaccine passports, with wide variation in policies and implementation. Israel began issuing ‘green passes’ in February 2021 to their vaccinated citizens to allow for less restricted internal movement and access to businesses such as to gyms or theaters. Other countries, such as China and Bahrain, have begun issuing digital vaccine passports to their vaccinated citizens to equip them to travel internationally. Lastly, in several countries, including Georgia, Estonia, Poland, and Seychelles, proof of COVID-19 vaccination allows incoming travelers to avoid certain travel restrictions, such as testing or quarantining. Numerous other countries are considering the use of COVID-19 vaccine passports, either for internal or international movement, including the United Kingdom, Malaysia, Singapore, Greece, Denmark, the EU, and the U.S.

Multiple international organizations have already launched efforts to set standards and coordinate the design and implementation of vaccine passports for international travel, including the World Health Organization, World Economic Forum, International Chamber of Commerce, and the International Air Travel Association. The WHO is undertaking this effort as part of its mandate under the International Health Regulations (IHR) to coordinate among member states to provide a public health response to the international spread of diseases; it is possible that COVID-19 vaccination could be included in an updated version of the IHR (at this time, yellow fever is the only disease listed in the IHR for which countries can require proof of vaccination as a condition of entry).

Will the U.S. Use COVID-19 Vaccine Passports?

There is likely to be growing demand for vaccine certifications for use in the U.S., for international travel as well as domestic purposes. Airlines and tourism groups have already called for vaccine certifications as a way to ease the process of pandemic-era travel; the CDC recently released guidance saying fully vaccinated individuals can resume non-essential travel safely within the U.S. and stating that fully vaccinated persons can consider international travel if they maintain recommended precautions. Federal officials have also indicated that vaccination may in the future be required for entry into the U.S. for incoming travelers; the U.S. currently requires all air passengers coming to the U.S. to have a negative COVID-19 test.1   Domestically, proof of vaccination may be required for entry into certain federal facilities in the U.S., including military bases and other federal buildings, and a number of U.S. companies and universities have already announced vaccinations will be required for their employees, students, and staff, which will require some kind of certification (see this recent KFF analysis for more discussion of vaccine mandates in the U.S.). Indeed, as stated at a recent meeting of the federal Office of the National Coordinator for Health Information Technology (ONC), “Proof of individual COVID-related health status is likely to be an important component of pandemic response” and “As more of the population becomes vaccinated, proof of immunization will likely become a major, if not the primary, form of health status validation”.

The Biden administration has made it clear it will not be the role of the federal government to issue vaccine passports or to collect and store individuals’ vaccination data at the federal level, but the government is taking on a coordination role and working with many of the international and domestic vaccine passport initiatives being developed by other parties. For example, President Biden issued an Executive Order directing the State Department to work with the World Health Organization, the International Civil Aviation Organization, the International Air Transport Association, foreign governments and others to establish international travel standards. Further, the order directs the Secretaries of the State Department, Department of Health and Human Services, and Department of Homeland Security, in coordination with relevant international organizations, to assess the feasibility of linking vaccination status with digital certificates for international travel. On the domestic side, the Administration is working with a number of privately-led vaccine passport initiatives already underway, to develop guidelines and address issues such as accessibility, privacy, and other access barriers. There are at least 17 such U.S.-based initiatives involving companies and institutions including Microsoft, IBM, MasterCard, the Mayo Clinic, and MIT. So far, these efforts remain in the development stage and none of these organizations has yet launched a vaccine passport for widespread use in the U.S. In the absence of a widely used vaccine passport system, the Centers for Disease Control and Prevention (CDC) “vaccination report card”, which is issued to each vaccinated individual, is being used as proof of vaccination in many cases for access to some activities and facilities. However, these cards can be falsified and lack a digital counterpart, upping the stakes on the need to develop standards and implement security measures.

Individual states are landing on different sides of the issue. Several have launched or are actively exploring the use vaccine certificates with New York being the first state to introduce a COVID-19 vaccine certification pass that would allow individuals to certify their vaccination status in order to access certain social activities. Other states, including Hawaii, are considering similar efforts. At the same time, several governors have come out strongly against vaccine passports, with some issuing executive orders banning their use, as has been done in Florida and Texas, or supporting legislation to prevent them, as in Tennessee. In the absence of a federally issued or sanctioned vaccine passport, and no nationwide private sector initiative yet being adopted, the U.S. may see more state or local level certification initiatives, which may or may not be coordinated across jurisdictions.

What are Key Implementation Issues to Consider?

There are a host of challenges and questions surrounding the design and use of vaccine passports, including issues of equity and access, a lack of uniform standards, and privacy and security.

Equity and access: There have already been significant equity challenges in vaccine roll out and access. Globally, most people in low and middle income countries (LMICs) do not have access to COVID-19 vaccines and may not until 2023 or later, and within the U.S. our analyses show that Black and Hispanic people have been vaccinated at lower rates than White people, and that high poverty and uninsured rates are associated with lower vaccination rates in many U.S. counties. In addition, non-citizen immigrants in the U.S. who, while eligible for free COVID-19 vaccination, may be reluctant to access the vaccine and/or to sign up for a vaccine passport that would require sharing of personal or other information with authorities. Further, it is still an ongoing question as to how populations that are either ineligible or unable to receive the COVID-19 vaccine, such as children under the age of 16, people with medical exceptions and those with religious objections, will be included in a COVID-19 vaccine passport system. Lastly, the process to sign up for a vaccine passport itself may present additional access issues, particularly for some groups. Given these inequities, some have cited concerns that proof of vaccination as a condition to access certain activities, such as travel or specific venues, has the potential to be discriminatory. For this reason, the World Health Organization’s Emergency Committee on the COVID-19 Pandemic officially cautioned countries against the use of requiring COVID-19 vaccine passports for international travel at this time, stating that COVID-19 vaccination should not exempt individuals from other risk-reduction measures while traveling and noting that vaccination as a requirement to travel would inequitably impact individuals in LMICs. Likewise, a coalition of travel organizations recently expressed concerns about imposing a travel-related vaccine requirement, recommending that vaccinated individuals be exempt from international testing requirements but that vaccination not be a “prerequisite to travel.” The EU, in its proposal for a Digital Green Certificate, has said that to ensure freedom of movement with the EU, it would include COVID-19 test certificates and certificates for those who have recovered from COVID-19 as part of its plan, in addition to certification of vaccination. New York state’s Excelsior Pass also allows for the use of a negative COVID-19 test (instead of vaccine certification).

Mutual recognition of passports: Countries that have begun or are considering issuing COVID-19 vaccine passports will need to establish agreements with other countries in order to have these passports recognized for international travel. Already, some of the initial passport proposals demonstrate limitations in this regard. For example, the EU’s proposal would allow for any vaccinated EU citizen to travel freely across all EU member states2 , but not outside of the EU. Israel has signed an agreement with Cyprus and Greece to allow for international travel, while Malaysia and Singapore are considering an agreement for reciprocal recognition. The U.S. has not yet weighed in on an international standard or indicated what form of passport the government would accept for international arrivals, though such standards are being discussed and developed but have yet to be applied. This has created confusion, and a fragmented approach across countries so far. It is also likely to be an issue within the U.S. as different jurisdictions take varying approaches.

Lack of uniform digital standards: Related to the issue of mutual recognition is that of digital standards. Currently, there is no standardized guidance related to the design of COVID-19 vaccine passports, including any standards for issues such as data privacy or interoperability. One report has identified at least 12 issues that will require international guidance in order to create a universally recognized COVID-19 vaccine passport system. The WHO’s Smart Vaccination Certificate Working Group is currently working to provide such international guidance and standards. The group released its first round of guidance addressing several digital standards issues, including interoperability and minimum data standards, in March 2021. A complete set of recommendations in expected in June 2021, though in the meantime, countries are moving ahead with individual efforts. Within the U.S., the interoperability of individual organization or jurisdiction passport efforts also presents a domestic challenge.

Diverse vaccine authorization and approval landscape: Across countries, different combinations of vaccines have been authorized and administered. Some of the vaccines used in one country may not be recognized or accepted by another country, raising questions about whether and how to certify different vaccines across this landscape for purposes of a vaccine passport. For example, Iceland has stated that only vaccines approved for use by the European Medicines Agency or the WHO will be recognized in order to waive certain screening and quarantine requirements for incoming travelers, which would exclude persons who have been vaccinated with the Russian Sputnik V vaccine or one of the Chinese-developed COVID-19 vaccines. Similarly, the EU’s Digital Green Certificate proposal would also only include vaccines that have received EU-wide authorization. So far, the U.S. has not stated which vaccines it might accept for the purposes of a vaccine passport.

Scientific considerations: The WHO has stated there is a need for further scientific investigation into COVID-19 vaccine products to understand in more detail the extent vaccines reduce transmission, and the strength and duration of immunity provided. For example, Israel’s green passes are only valid for six months starting the week after vaccination, to take into consideration the potential for waning immunity over time. COVID-19 passports may need to consider each vaccine product’s unique immunity profile when issuing certification of vaccine-induced immunity over a certain period of time, a process which becomes even more complicated in the presence of variants with unknown effects on vaccine effectiveness.

Privacy and security: Among the concerns raised in the lack of uniform digital standards and COVID-19 vaccine passports is the issue of privacy and data security. Combining and storing individuals’ vaccination data in a centralized database could expose this information to data breaches and raises questions about oversight and control of that data. In fact, some vulnerabilities have already been detected in COVID-19 vaccine passports under development. Individuals and organizations are less likely to want to participate if these concerns about security and privacy are not adequately addressed.

Conclusion

There are a large number of as-yet uncoordinated efforts underway already to develop vaccine passports. It is not yet clear if or when the U.S. might adopt a vaccine passport standard for cross-border travel or for domestic purposes, and what form such a credential will take or what restrictions it might place on individuals. It is likely that attention to, and calls for, vaccine passports for both international and domestic use will increase over time, as more people are vaccinated and governments and employers seek to find ways to balance public health concerns while also easing a return to some level of normalcy. However, there a number of significant issues to consider related to the design, use, and ethics of vaccine passports, and many questions about how they can and should be implemented in the U.S. and elsewhere.

  1. For incoming travel to the U.S., individuals are currently required to either provide proof of a negative COVID-19 test within three days of departure or proof of recovery within the last 90 days. As of April 13, vaccination status does not exempt incoming travelers from these requirements. ↩︎
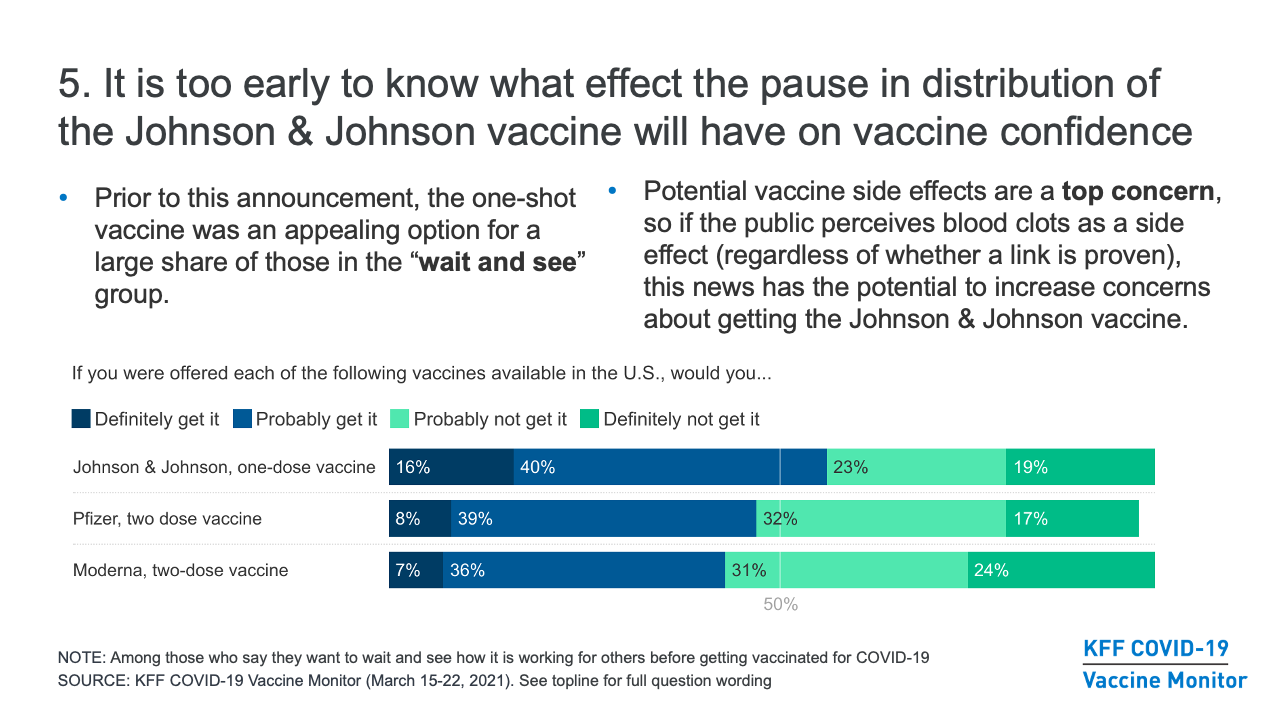
  2. The proposal would also allow Iceland, Liechtenstein, Norway, and Switzerland to opt-in to the program. ↩︎
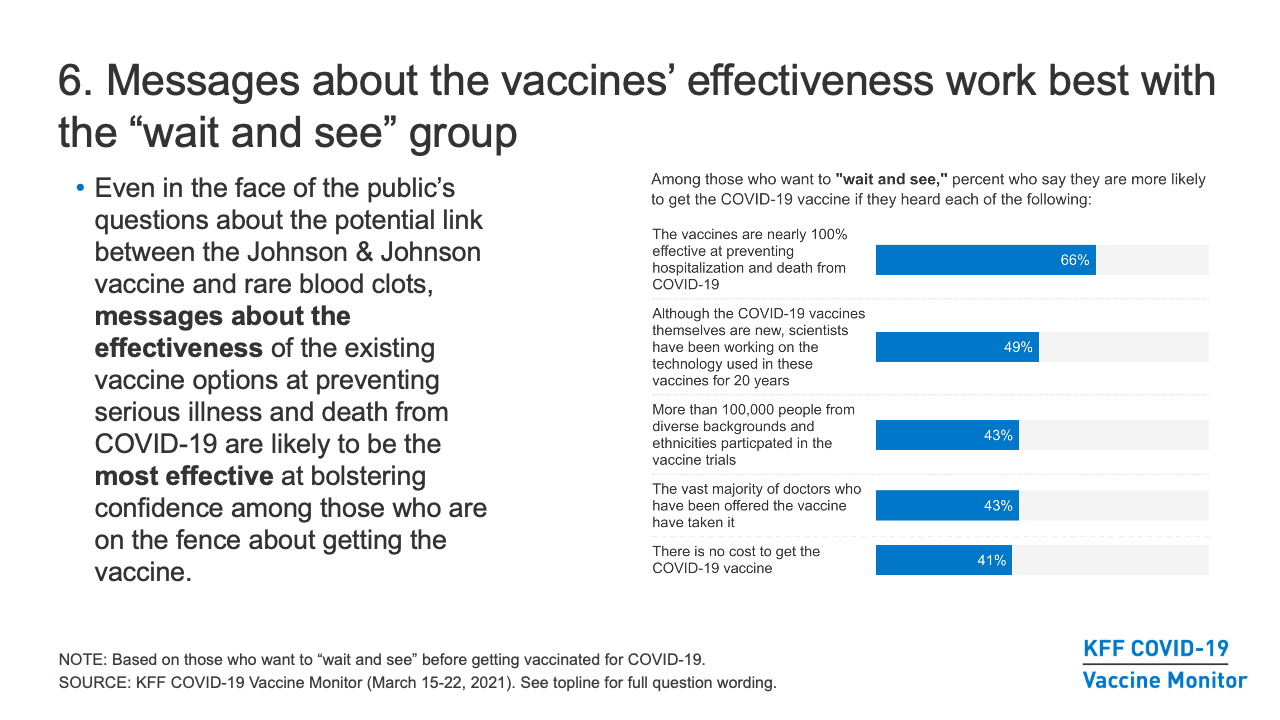
News Release

Vaccine Passports: What We Know and What to Consider

Published: Apr 15, 2021

Around the country and in parts of the world, COVID-19 vaccination efforts continue to grow, leaving people wondering about vaccine requirements and ways to certify vaccine status. “Vaccine passports,” a paper or digital form certifying that a person has been vaccinated, have garnered increased interest in recent months, especially as countries roll out plans to reopen international and domestic travel. A new issue brief takes a closer look at what vaccine passports are, how other countries are using them, and what implementation issues to consider.

Several countries have already begun using COVID-19 vaccine passports, with policies varying across countries. For example, several countries are beginning to require proof of vaccination for incoming travelers to avoid testing or quarantining; many other countries, including the U.S., are considering implementing similar travel requirements. In the U.S., airlines have already called for vaccine certifications as an option for domestic and international travel.

The Biden administration stated it will not be the role of the federal government to issue COVID-19 vaccine passports, however individual states are exploring vaccine passport options. New York is the first state to introduce vaccine certification to access certain social activities, with other states expressing interest in doing so. Alternatively, several governors have strongly discouraged vaccine passports, with states such as Florida and Texas issuing executive orders banning the use of vaccine passports.

There are a number of implementation issues to consider surrounding vaccine passports, from equity and access to lack of uniform digital standards. The brief covers key challenges and questions about vaccine passports within the U.S. and globally.

It is likely that calls for vaccine passports will grow over time as vaccine efforts increase. Still, it remains unclear if or when the U.S. might adopt standards for a vaccine passport system for both domestic and international travel, and how extensive the use of these certifications will be.

During Pandemic, Higher Premature Excess Deaths in U.S. Compared to Peer Countries Partly Driven by Racial Disparities

Authors: Daniel McDermott, Krutika Amin, Cynthia Cox, Chelsea Rice, and Hanna Dingel
Published: Apr 14, 2021

A new brief from the Peterson-Kaiser Health System Tracker looks at how the pandemic affected the excess mortality rate in 2020 and estimates how many potential years of life were lost. “Excess deaths” represent the number of deaths beyond what is expected in a typical year. “Premature” excess death measure accounts for age at excess death to estimate potential years of life lost up to age 75 over a typical year, using the OECD methodology. Overall, the U.S. had more than 500,000 excess deaths in 2020 compared to prior years, losing an estimated 3.6 million potential years of life.

Relative to similarly wealthy countries, the U.S. had the highest overall premature excess mortality rate in 2020 with 1,171 excess potential years of life lost per 100,000 people (compared to an average of 126 excess potential years of life lost per 100,000 people in comparable countries). Among excess deaths in 2020, the average person lost 14 years of life in the U.S. compared to an average of 8 years in peer countries before the age of 75.

The higher premature excess death rate in the U.S. compared to peer nations was driven in part due to racial disparities. People of color under age 75 were more likely to have died in the U.S. during the pandemic in 2020 than white non-elderly individuals, as shown in the chart below. Among people under the age of 75, American Indian and Alaska Native, Black, Native Hawaiian and Other Pacific Islander, and Hispanic people had over 3 times the premature excess death rate in the U.S. in 2020 than the rate among White and Asian people. Of the potential years of life lost in the U.S., 30% were among Black people and another 31% were among Hispanic people, disproportionate to their share of the U.S. population.

The higher premature excess mortality rate among people of color in the U.S., and in the U.S. as a whole compared to similar countries, is likely due in part to higher COVID-19 risk factor rates and broader racial inequities. For more data and discussion of the gaps in premature excess mortality within the U.S. and among peer countries, please visit the Peterson-Kaiser Health System Tracker.

Source

COVID-19 Pandemic-Related Excess Mortality and Potential Years of Life Lost in the U.S. and Peer Countries

Poll Finding

Mental Health Impact of the COVID-19 Pandemic: An Update

Published: Apr 14, 2021

Findings

Introduction

The coronavirus pandemic in the U.S. and the changes in the daily lives of Americans that ensued have taken a toll on people’s mental health and created new barriers for those seeking mental health care. Stress and worry about contracting the virus, coupled with job losses, loss of childcare, as well as the devastating loss of loved ones due to COVID-19 are just a few ways in which the pandemic may be having an effect on mental health. Previous KFF analysis of the Census Bureau’s Household Pulse Survey from earlier this year shows the economic downturn has led to mental health issues and increased substance abuse in the U.S.. The analysis also found school closures and lack of childcare had an even larger impact on parents with children in their home under the age of 18 who either have transitioned to working from home during the pandemic or have been required to go into work throughout the pandemic. This analysis from the March KFF COVID-19 Vaccine Monitor finds that those hardest hit by the mental health impacts of the coronavirus pandemic have been younger people and women, including mothers.

Who Is Experiencing Mental Health Impacts?

In the first few months of the coronavirus pandemic, the share of U.S. adults who said worry and stress related to the coronavirus was having a negative impact on their mental health increased from about one-third (32%) in March 2020 to roughly half (53%) in July 2020. With the end of the pandemic in sight as millions of Americans are getting vaccinated against the disease, the mental health impact seems to have leveled off. The March 2021 KFF COVID-19 Vaccine Monitor finds that about half of adults (47%) continue to report negative mental health impacts related to worry or stress from the pandemic.

Younger adults and women, including mothers with children under 18 years old in their households, are among the most likely to report that stress and worry related to coronavirus has had a negative impact on their mental health. Nearly half of Black adults (49%), White adults (48%), and about four in ten Hispanic adults (43%) say the coronavirus has had a negative impact on their mental health, including three in ten Black adults (31%) and one-fourth of White (23%) and Hispanic (25%) adults who say it has had a “major impact”. Smaller shares of adults ages 65 and older and men (including fathers with children in the home) say they have experienced mental health impact from the coronavirus. It is notable that some previous studies have shown that men, older adults, and Black adults may be less likely to report mental health difficulty and more likely to face challenges accessing mental health care.

More than half of women overall (55%) report a negative impact on their mental health related to the coronavirus pandemic, compared to about four in ten men (38%) who report the same. While a larger share of women across age groups under age 65 report a negative impact on their mental health, the youngest group of men and women are most likely to report negative mental health impacts, compared to their older counterparts. Nearly seven in ten women ages 18 to 29 (69%) report a negative impact on their mental health.

Direct experience with COVID-19 has a role in reported mental health impacts of the pandemic. The March 2021 KFF COVID-19 Vaccine Monitor finds one in four (24%) U.S. adults report having a close friend or family member who has died of complications related to COVID-19. An additional 12% say they have someone less directly connected to them who has died, and about six in ten (63%) say they do not know anyone who has died of COVID-19.

Among those with the closest connections to a COVID-19 related death (having a close friend or family member who died), three in ten say stress related to coronavirus has had a “major impact” on their mental health. Smaller shares of those who do not know anyone who has died from complications related to COVID-19 say their mental health has been impacted in a major way (23%). Half of those who know someone close who has died, or indirectly, say their mental health has been impacted in at least a minor way (53% each), while more than four in ten who have not had a personal experience with knowing someone who has died say the same (44%).

Worries About Getting Sick

One potential contributor to negative mental health impacts may be the fear of contracting COVID-19 or having a family member get sick from the disease. When asked how worried they are they or someone in their family will get sick from COVID-19, some of the same groups that are most likely to report negative mental health impacts are also the most likely to report being worried, including women, and younger adults.

A relationship between worry and self-reported mental health impacts is also evident. Among those who say they are either “very worried” or “somewhat worried” they or a family member will get sick from coronavirus, six in ten (61%) say worry or stress has had a negative impact on their mental health. This is compared to two-thirds of those who say they are either “not too worried” or “not at all” worried about their family getting sick who say that stress has not negatively impacted their mental health regarding the pandemic.

Access To Mental Health Care In The Pandemic

Many adults who reported worsened mental health due the pandemic also report forgoing mental health treatment. About one third (32%) of those who reported a negative impact on their mental health (representing 15% of all adults) say there was a time in the past year where they thought they might need mental health services or medication but did not get them. Nearly half of mothers (46%) who report a negative mental health impact due to the pandemic (27% of all mothers) say they did not get mental health care that they needed. In addition, about one in five adults under age 50, Black adults and women say they have experienced worsened mental health due to the pandemic and have not gotten mental health services or medication they thought they might need.

Access to providers and affordability appear to be the biggest barriers for those who felt they needed mental health care because of the pandemic but did not receive them. One in four adults who did not get the mental health care say the main reason why was because they could not find a provider (24%) or could not afford the cost (23%). An additional one in five (18%) say they were too busy or could not get the time off work to receive treatment. One in ten say they had problems with insurance covering their treatment while 5% said they were afraid or embarrassed to seek treatment.

Methodology

This KFF COVID-19 Vaccine Monitor was designed and analyzed by public opinion researchers at the Kaiser Family Foundation (KFF). The survey was conducted March 15-22, 2021, among a nationally representative random digit dial telephone sample of 1,862 adults ages 18 and older (including interviews from 476 Hispanic adults and 490 non-Hispanic Black adults), living in the United States, including Alaska and Hawaii (note: persons without a telephone could not be included in the random selection process). Phone numbers used for this study were randomly generated from cell phone and landline sampling frames, with an overlapping frame design, and disproportionate stratification aimed at reaching Hispanic and non-Hispanic Black respondents. Stratification was based on incidence of the race/ethnicity subgroups within each frame. Specifically, the cell phone frame was stratified as: (1) High Hispanic: Cell phone numbers associated with rate centers from counties where at least 35% of the population is Hispanic; (2) High Black: Cell phone numbers associated with remaining rate centers from counties where at least 35% of the population is non-Hispanic Black; (3) Else: numbers from all remaining rate centers. The landline frame was stratified as: (1) High Black: landline exchanges associated with Census block groups where at least 35% of the population is Black; (2) Else: all remaining landline exchanges. The sample also included 190 respondents reached by calling back respondents that had previously completed an interview on the KFF Health Tracking Poll at least nine months ago. Another 402 interviews were completed with respondents who had previously completed an interview on the SSRS Omnibus poll (and other RDD polls) and identified as Hispanic (n = 178; including 63 in Spanish) or non-Hispanic Black (n=224). Computer-assisted telephone interviews conducted by landline (356) and cell phone (1,506, including 1,093 who had no landline telephone) were carried out in English and Spanish by SSRS of Glen Mills, PA. To efficiently obtain a sample of lower-income and non-White respondents, the sample also included an oversample of prepaid (pay-as-you-go) telephone numbers (25% of the cell phone sample consisted of prepaid numbers) Both the random digit dial landline and cell phone samples were provided by Marketing Systems Group (MSG). For the landline sample, respondents were selected by asking for the youngest adult male or female currently at home based on a random rotation. If no one of that gender was available, interviewers asked to speak with the youngest adult of the opposite gender. For the cell phone sample, interviews were conducted with the adult who answered the phone. KFF paid for all costs associated with the survey.

The combined landline and cell phone sample was weighted to balance the sample demographics to match estimates for the national population using data from the Census Bureau’s 2019 U.S. American Community Survey (ACS), on sex, age, education, race, Hispanic origin, and region, within race-groups, along with data from the 2010 Census on population density. The sample was also weighted to match current patterns of telephone use using data from the January- June 2020 National Health Interview Survey and to adjust for non-response bias, predominantly in the callback sample frames, on health insurance coverage, registered voter status, age, and reported vaccination rates (based on the non-callback RDD sample). The weight takes into account the fact that respondents with both a landline and cell phone have a higher probability of selection in the combined sample and also adjusts for the household size for the landline sample, and design modifications, namely, the oversampling of prepaid cell phones and likelihood of non-response for the re-contacted sample. All statistical tests of significance account for the effect of weighting.

The margin of sampling error including the design effect for the full sample is plus or minus 3 percentage points. Numbers of respondents and margins of sampling error for key subgroups are shown in the table below. For results based on other subgroups, the margin of sampling error may be higher. Sample sizes and margins of sampling error for other subgroups are available by request. Note that sampling error is only one of many potential sources of error in this or any other public opinion poll. Kaiser Family Foundation public opinion and survey research is a charter member of the Transparency Initiative of the American Association for Public Opinion Research.

This work was supported in part by grants from the Chan Zuckerberg Initiative DAF (an advised fund of Silicon Valley Community Foundation), the Ford Foundation, and the Molina Family Foundation. We value our funders. KFF maintains full editorial control over all of its policy analysis, polling, and journalism activities.

GroupN (unweighted)M.O.S.E.
Total1,862± 3 percentage points
Race/Ethnicity
White, non-Hispanic760± 4 percentage points
Black, non-Hispanic490± 6 percentage points
Hispanic476± 6 percentage points
Gender
Women834± 5 percentage points
Men1,013± 4 percentage points
Age
18-29 years old266± 8 percentage points
30-49 years old511± 6 percentage points
50-64 years old523± 6 percentage points
65 and older554± 6 percentage points