How Do Prescription Drug Costs in the United States Compare to Other Countries?

Published: Feb 8, 2022

In 2019, the U.S. spent more than $1,000 per person on prescribed medicines, an amount higher than any peer nation. This chart collection examines what we know about prescription drug spending and use in the U.S. and comparably large and wealthy countries, using data from the Organization for Economic Cooperation and Development (OECD).

News Release

Medication Abortion Via Telehealth: What You Need to Know About State Regulations

Published: Feb 7, 2022

With the country waiting on the Supreme Court’s decision on Dobbs v. Jackson Women’s Health Organization, the case that could overturn Roe v. Wade, many are looking towards telehealth as an alternative to expand access to medication abortion. A new KFF issue brief explains the newly revised Food and Drug Administration (FDA) policy on medication abortion and the differential impact this could have on states by assessing the intersection of federal policy regarding dispensing medication abortion pills with state laws regulating the provision of abortion services.

Prior to the COVID-19 pandemic, dispensing medication abortion via telehealth was limited by a FDA requirement which allowed only certified clinicians to dispense mifepristone, the medication abortion pill, at a health care setting. After temporarily suspending the enforcement of the requirement during the pandemic public health emergency, the FDA permanently lifted the requirement on December 16, 2021.  While this change will likely expand access to medication abortion in some states, many states have other policies that will still restrict medication abortion via telehealth.

The new brief reviews state requirements and regulations that affect the availability of medication abortion via telehealth, including which states have directly banned telehealth abortions already. To learn more about the latest news on abortion, visit www.kff.org/womens-health-policy/.

HIV Policy Alignment with International Standards in PEPFAR Countries

Authors: Alicia Carbaugh, Anna Rouw, and Jennifer Kates
Published: Feb 7, 2022

Introduction

Key Findings

  • Adoption of evidence-based guidelines, laws, and policies is important for improving HIV-related health outcomes. While PEPFAR’s primary focus is on HIV service delivery, it also aims to create conditions within countries that can contribute to successful implementation of HIV programs, which includes helping to foster policy environments through both operational guidance and diplomacy.
  • We examined the policy environments in PEPFAR countries to assess alignment with international HIV-related standards, looking at four main categories (clinical care and treatment, testing and prevention, structural, and health systems). We also compared PEPFAR countries to other low- and middle-income countries (LMICs).
  • Overall, we find that PEPFAR countries have stronger policy alignment than other LMICs – PEPFAR countries as a group have adopted 60% of recommended policies, compared with 48% among other LMICs, and PEPFAR countries have higher alignment scores than other LMICs in three of the four categories.
  • Policy alignment was particularly strong, including relative to other LMICs, in areas in which PEPFAR directly focuses and supports. PEPFAR countries scored highest (81%) in the area of clinical care and treatment, which includes policies related to early treatment initiation, treatment regimens, and viral load testing, and scored 20 percentage points higher than other LMICs. While the overall score on testing and prevention was lower than that of clinical care and treatment, there was still a large differential compared to other LMICs (57% compared to 37%). Scores were lowest and similar for both groups on policies and laws related to structural factors, such as HIV-related non-criminalization policies.
  • Policy alignment across PEPFAR countries varies substantially – overall policy adoption scores range from 33% in Trinidad & Tobago to 82% in South Africa and there is also variation within each main category – for instance, while no PEPFAR country has adopted policies related to drug use non-criminalization (structural), all 53 PEPFAR countries have fully aligned viral load testing policies (clinical care and treatment) with international standards.
  • While PEPFAR countries scored higher than other LMICs overall, a significant share of recommended policies have yet to be adopted in PEPFAR countries, particularly in the area of structural barriers, which may be the most difficult to affect at the country level, given that they often require national legal changes and/or reach beyond HIV. Going forward, these findings may serve as a baseline for targeting and assessing future PEPFAR efforts as the program seeks to further improve HIV outcomes in the countries within which it works.

Introduction

The U.S. government’s President’s Emergency Plan for AIDS Relief (PEPFAR), the world’s largest commitment by any nation to address a single disease, has played a significant role in addressing HIV/AIDS in the hardest-hit countries around the world and is credited with helping to shift the trajectory of the epidemic.1  While most of PEPFAR’s efforts are focused on providing services to those with and at risk for HIV, PEPFAR also aims to create conditions that can contribute to the successful implementation of HIV programs. 2 ,3 ,4  This includes working to foster the adoption of normative, evidence-based guidance and policies developed by international bodies aimed at improving HIV-related health outcomes.5 ,6 ,7 

Through its operational guidance and direct diplomatic engagement,8  PEPFAR has worked to encourage and in some cases require that country programs adopt certain policies, such as new antiretroviral treatment guidelines; differentiated service delivery9  – including multi-month dispensing of antiretrovirals (ARVs) to reduce the need for frequent refills, which has become particularly important to ensure continuity of treatment during COVID-19; and the removal of user fees that can serve as obstacles to HIV service access; as well as increase domestic budgets for HIV.10 ,11 ,12 ,13 ,14  PEPFAR also has emphasized the importance of addressing stigma and a human rights approach, particularly for reaching key populations that some societies have historically shunned.15 ,16 ,17 ,18  As a result, the program has been found to have played an important role in helping to shape the HIV policy environments in the countries in which it operates.19 ,20 ,21 ,22 ,23 ,24 

We sought to assess policy alignment with international HIV standards in PEPFAR countries. We included PEPFAR countries that were required to develop Country or Regional Operating Plans (COPs or ROPs), which are used for approval of funding and serve as annual strategic plans for U.S. HIV/AIDS efforts in host countries in 2020.25 ,26 ,27  In addition to assessing how PEPFAR COP/ROP countries align with international standards, we also compared this group to other LMICs.28 ,29 

Because we looked only at a point-in-time snapshot, findings cannot necessarily be attributed to PEPFAR. Rather, they may serve as a baseline for targeting and assessing future PEPFAR efforts, as the program seeks to further improve HIV outcomes in the countries within which it works. It is possible that policies may have changed in PEPFAR countries since we completed the analysis. For instance, according to a presentation by PEPFAR headquarters staff to stakeholders on August 2, 2021, numerous PEPFAR countries have been making modifications to their polices or guidelines related to multi-month dispensing of antiretrovirals during the COVID-19 pandemic.30 

Methods31 ,32 

We analyzed data from the HIV Policy Lab, a joint project of Georgetown University’s O’Neill Institute and other academic, civil society, and multilateral partners, with the support of PEPFAR, which compiles and measures the HIV-related policies of the 194 World Health Organization (WHO) member states against international normative guidance. The policies that the HIV Policy Lab uses as benchmarks are those recommended by internationally-recognized authorities, including the WHO, UNAIDS, the U.N. Development Programme, the Global Commission on HIV and the Law, and others based on current science and evidence and aimed at improving HIV-related outcomes. The HIV Policy Lab database uses information reported by governments through the National Commitments and Policy Instrument (NCPI) housed on UNAIDS’ Laws and Policies Analytics platform,33  and collects additional data from official countries sources, reports from U.N. member states, and other partner organizations.

We used the most recent year of data available (through 2020) on policies by country to assess their status in 53 PEPFAR countries required to submit a COP and ROP in 2020, and 85 other LMICs that either did not receive PEPFAR support (82 countries) or received some U.S. HIV support, but were not required to submit a COP or ROP in 2020 (3 countries).34 ,35 ,36  We included the full set of 33 indicators – along with more than 30 sub-indicators – across the four categories that the HIV Policy Lab tracks: clinical care and treatment; testing and prevention; health systems; and structural barriers (see Table 1 and the Appendix; more detailed explanations of each indicator can be found in the HIV Policy Lab’s Codebook).

For each indicator where data are available, the HIV Policy Lab assigns points based on adoption status – “Adopted” (1 point), “Partially Adopted” (0.5), and “Not Adopted” (0). For indicators with sub-indicators, the HIV Policy Lab assigns a full point if all sub-indicators are adopted, a half point (0.5) if some are adopted, and 0 if none are adopted. The points for all indicators are added to obtain a raw score for each country. Adoption percentages are calculated by dividing the raw scores by the total possible scores; indicators for which there are no data available are excluded. Scores for groups (e.g., PEPFAR countries, regions) were calculated by averaging country scores at the overall- and category-level. Scores presented in the text are for the main indicators unless otherwise noted. Countries without data were excluded.

Our analysis is based on data downloaded on December 7, 2021.

Table 1: Policy Indicators Included in Analysis, by Category
Clinical Care and TreatmentTesting and PreventionHealth SystemsStructural
Treatment InitiationSelf-testingTask ShiftingSame-sex Sex Non-Criminalization
Same-day Treatment StartPartner Notification/Index TestingHealthcare FinancingSex Work Non-Criminalization
Treatment RegimenCompulsory TestingUniversal Health CoverageDrug Use Non-Criminalization
Differentiated Service DeliveryAge Restrictions on Testing & TreatmentUser FeesHIV Exposure Non-Criminalization
Viral Load TestingPrEPAccess to Medicines (TRIPS)Non-discrimination Protections
Pediatric Diagnosis & TreatmentHarm ReductionUnique Identifiers with Data ProtectionsNational Human Rights Institutions
Migrant Access to HealthcareComprehensive Sexuality EducationData SharingConstitutional Right to Health
Tuberculosis DiagnosisPrisoners PreventionGirls Education
Gender-based Violence
Civil Society

Findings

PEPFAR countries, as a group, have greater policy alignment, than other LMICs.

  • Overall, PEPFAR countries have an average adoption score of 60% for the recommended policies, compared to 48% for other LMICs. Policy adoption scores in PEPFAR countries range from 33% in Trinidad & Tobago to a high of 82% in South Africa (see Figure 1).
  • PEPFAR countries score higher on three of the four policy categories tracked, with an average score 22 percentage points greater than that of other LMICs for clinical care and treatment indicators; 16 percentage points higher for testing and prevention indicators; and 10 points higher for health systems indicators. The score for the fourth category — structural indicators – was similar to that of other LMICs (see Figure 2).
Overall HIV Policy Adoption Scores by PEPFAR Country

PEPFAR countries have the strongest policy alignment in the area of clinical care and treatment and the weakest on structural indicators.

  • On average, PEPFAR countries have an adoption score of 83% for policies related to clinical care and treatment (see Figure 2), ranging from a low of 31% (Nicaragua) to a high of 100% in eight countries (Eswatini, Ethiopia, Haiti, Malawi, Papua New Guinea, South Sudan, Uganda, and Zimbabwe).
  • For testing and prevention indicators, PEPFAR countries have an average adoption score of 53%, ranging from 0% (Trinidad and Tobago) to 94% (Nigeria).
  • PEPFAR countries scored an average of 60% for health systems indicators, ranging from 14% (Laos) to 93% in three countries (Eswatini, South Africa, and Thailand).
  • PEPFAR countries have the weakest alignment for policies related to structural indicators (47%), with Lesotho scoring the lowest in this category at 11%, and Rwanda and South Africa scoring the highest at 70%.
Average HIV Policy Adoption Scores of PEPFAR v. Other LMICs by Policy Category

Clinical Care and Treatment

  • All PEPFAR countries in this analysis (53) have fully adopted viral load testing policies aligned with international standards (whether a national policy is in place to monitor viral load in people with HIV at least once a year). This was the only indicator among the 33 for which 100% of countries have fully aligned policies. Treatment initiation policies (whether a national policy is in place that states that people with HIV, regardless of CD4 count, are eligible to start treatment) followed closely with 52 of the 53 PEPFAR countries fully adopting.
  • Differentiated service delivery (DSD) policies (whether national policy allows for differentiated HIV treatment services such as multi-month dispensing and community antiretroviral therapy) had the smallest share of PEPFAR countries fully adopting – 15 of the 53 PEPFAR countries, although an additional 36 had adopted some DSD policies.

Testing and Prevention

  • Adoption of prevention policies is greatest for comprehensive sexuality education (whether national policies require curriculum that meets international standards be taught in primary and secondary schools), with 42 PEPFAR countries fully adopting (out of 52 with available data).
  • Policies related to HIV prevention among prisoners (whether national policy stipulates that prevention tools, such as condoms, lubricants, and syringe access/exchange programs available to prisoners) were the least likely to be aligned, with just two countries (Kyrgyzstan and Tajikistan) fully adopting policies aligned with international standards (out of 52 with available data), although an additional 13 had adopted some policies in this area.

Health Systems

  • Within this category, PEPFAR countries are most aligned on policies related to unique identifiers with data protections (whether the country utilizes unique identifiers for continuity of care across multiple facilities and has legally-enforceable data privacy protections) – 33 of 53 PEPFAR countries have policies fully aligned with international standards and an additional 17 countries had some national policy related to patient data protection.
  • More than half of PEPFAR countries (27 of 52 with available data) have fully aligned policies related to user fees (whether national policy stipulates that public primary care and HIV services are available without user fees) and an additional 20 have adopted some policies in this area.
  • PEPFAR countries are least likely to be aligned on policies related to universal health coverage of HIV treatment and PrEP (whether national health coverage includes medications for HIV treatment and PrEP) – 11 PEPFAR countries (out of 51 with available data) have fully aligned policies with international standards, with an additional 22 having adopted some policies related to universal health coverage of HIV treatment and PrEP.

Structural

  • PEPFAR countries have the strongest alignment on policies related to gender-based violence – an indicator that assesses whether or not countries have laws that explicitly address domestic violence with enforceable penalties (42 of 53 countries).
  • On the other end of the spectrum, no PEPFAR country has adopted policies related to drug use non-criminalization (whether national policy avoids criminalizing personal possession of drugs). Additionally, only three of 53 PEPFAR countries have policies related to sex work non-criminalization (whether national policy avoids criminalizing the buying, selling, and organizing of sex work) that are fully aligned with international standards (Haiti, Honduras, and Panama).
Percentage of Countries that Have Fully Adopted Indicator by PEPFAR Status

Discussion

While no PEPFAR country has fully aligned its laws and policies with international standards, this analysis shows that they have, on average, greater alignment than other LMICs and this differential is greatest in areas in which PEPFAR focuses most of its direct support, such as treatment and testing policies. As noted above, PEPFAR has actively worked toward changing local policies in countries, principally with regard to the adoption of treatment guidelines, the removal of user fees for HIV services, and the implementation of differentiated service delivery strategies, such as the multi-month dispensing of antiretrovirals – which has become critically important during the COVID-19 pandemic – and increasing domestic budgets for HIV. Further, PEPFAR has played a role in spotlighting the need for countries to address HIV among some of the most vulnerable populations, which have been historically shunned by some countries. At the same time, as this analysis demonstrates, there is still a significant share of recommended policies that have yet to be adopted in PEPFAR countries, particularly in the area of structural barriers, such as policies related to non-discrimination of marginalized groups and decriminalization of activities including sex work and drug use, which may be the most difficult to affect at the country level given that they often require national legal changes and/or reach beyond HIV.

While the data included in this analysis do not measure the extent or quality of implementation, policy adoption can be viewed as a step in the direction of evidence-based practices and indicate a country’s commitment to addressing HIV and creating a foundation that can facilitate and optimize HIV/AIDS efforts. This is especially important in PEPFAR countries, which include those that have been hardest hit by the HIV/AIDS epidemic. Indeed, PEPFAR’s most recent draft guidance to COP and ROP countries for 2022 places an even greater premium on policy change, including requiring country programs to either ensure change in some areas as a condition of receiving funding, or submit a detailed description of existing barriers and proposed plan to be able to meet these requirements.

Looking ahead, there are important questions surrounding PEPFAR’s role, beyond service delivery, in countries, especially as the program awaits the confirmation of a new coordinator, is expected to release a new five-year strategy, and is due for reauthorization in two years, all of which could provide openings for strengthening PEPFAR even further. The findings presented here, while not necessarily attributable to PEPFAR, may serve as a baseline for targeting and assessing future PEPFAR efforts, as the program seeks to further improve HIV outcomes in the countries within which it works and policymakers consider PEPFAR’s next phase.

Appendix

Appendix 1: Policy Indicators and Sub-Indicators Included in Analysis, by Category
CategoryNameIndicator or Sub-Indicator
Clinical care and treatmentTreatment initiationIndicator
Same-day treatment startIndicator
Treatment regimenIndicator
Differentiated service deliveryIndicator
Differentiated service delivery – Community ART distributionSub-indicator
Differentiated service delivery – Clinical visit frequencySub-indicator
Differentiated service delivery – Multi-month dispensingSub-indicator
Viral load testingIndicator
Pediatric diagnosis and treatmentIndicator
Pediatric diagnosis and treatment – Pediatric diagnosisSub-indicator
Pediatric diagnosis and treatment – Pediatric treatmentSub-indicator
Migrants’ access to health careIndicator
Migrants’ access to health care – Primary health careSub-indicator
Migrants’ access to health care – HIV health careSub-indicator
Tuberculosis diagnosticsIndicator
Testing and preventionSelf-testingIndicator
Partner notification/Index testingIndicator
Partner notification/Index testing – Index testingSub-indicator
Partner notification/Index testing – Confidentiality in index testingSub-indicator
Compulsory testingIndicator
Age restrictions on testing and treatmentIndicator
PrEPIndicator
PrEP – PolicySub-indicator
PrEP – Regulatory approvalSub-indicator
Harm reductionIndicator
Harm reduction – Harm reduction strategySub-indicator
Harm reduction – Syringe non-criminalizationSub-indicator
Comprehensive sexuality educationIndicator
Prisoner preventionIndicator
Prisoner prevention – CondomsSub-indicator
Prisoner prevention – Needle and syringe exchange programSub-indicator
Health systemsTask shiftingIndicator
Health financingIndicator
Health financing – BudgetSub-indicator
Health financing – Tax revenueSub-indicator
Universal health coverageIndicator
Universal health coverage – ARVsSub-indicator
Universal health coverage – PrEPSub-indicator
User feesIndicator
User fees – Primary careSub-indicator
User fees – HIV servicesSub-indicator
Access to medicines (TRIPS)Indicator
Access to medicines (TRIPS) – IncorporationSub-indicator
Access to medicines (TRIPS) – UseSub-indicator
Unique identifiers with data protectionsIndicator
Unique identifiers with data protections – Unique identifiers useSub-indicator
Unique identifiers with data protections – Data protectionsSub-indicator
Data sharingIndicator
Data sharing – DisaggregationSub-indicator
Data sharing - FrequencySub-indicator
StructuralSame-sex sex non-criminalizationIndicator
Same-sex sex non-criminalization – LawsSub-indicator
Same-sex sex non-criminalization – ArrestsSub-indicator
Sex work non-criminalizationIndicator
Drug use non-criminalizationIndicator
HIV exposure non-criminalizationIndicator
HIV exposure non-criminalization – LawsSub-indicator
HIV exposure non-criminalization – ArrestsSub-indicator
Non-discrimination protectionsIndicator
Non-discrimination protections – Sexual orientationSub-indicator
Non-discrimination protections – Gender identitySub-indicator
Non-discrimination protections – HIV statusSub-indicator
National human rights institutionsIndicator
Constitutional right to healthIndicator
Girls’ educationIndicator
Civil societyIndicator
Civil society – Social contractingSub-indicator
Civil society - FreedomSub-indicator
NOTE: Please see the HIV Policy Lab codebook for indicator and sub-indicator definitions.

Endnotes

  1. For more information on PEPFAR, see KFF’s The U.S. President’s Emergency Plan for AIDS Relief (PEPFAR) fact sheet. ↩︎
  2. U.S. Department of State, PEPFAR 2021 Country and Regional Operational Plan (COP/ROP) Guidance for All PEPFAR Countries, updated February 2021, accessed: https://www.state.gov/wp-content/uploads/2021/02/PEPFAR-COP21-Guidance-Final.pdf. ↩︎
  3. U.S. Department of State, PEPFAR 2021 Annual Report to Congress, February 2021, accessed: https://www.state.gov/wp-content/uploads/2021/02/PEPFAR2021AnnualReporttoCongress.pdf. ↩︎
  4. U.S. Department of State, Strategy for Accelerating HIV/AIDS Epidemic Control (2017-2020), September 2017, accessed: https://www.state.gov/wp-content/uploads/2019/08/PEPFAR-Strategy-for-Accelerating-HIVAIDS-Epidemic-Control-2017-2020.pdf. ↩︎
  5. U.S. Department of State, PEPFAR 2021 Country and Regional Operational Plan (COP/ROP) Guidance for All PEPFAR Countries, updated February 2021, accessed: https://www.state.gov/wp-content/uploads/2021/02/PEPFAR-COP21-Guidance-Final.pdf. ↩︎
  6. U.S. Department of State, PEPFAR 2021 Annual Report to Congress, February 2021, accessed: https://www.state.gov/wp-content/uploads/2021/02/PEPFAR2021AnnualReporttoCongress.pdf. ↩︎
  7. Specific examples of normative, evidence-based guidance and policies developed by international bodies include the WHO’s Consolidated guidelines on HIV prevention, testing, treatment, service delivery and monitoring: recommendations for a public health approach (see: https://www.who.int/publications/i/item/9789240031593) and Key Considerations for Differentiated ART Delivery for Specific Populations jointly produced by the WHO, U.S. Centers for Disease Control and Prevention, PEPFAR, USAID, and the International AIDS Society (see: https://www.who.int/publications/i/item/WHO-HIV-2017.34), among others. All guidelines and policies that the HIV Policy Lab uses as benchmarks with which to assess countries are included in their codebook (see: https://hivpolicylab.org/codebook). ↩︎
  8. PEPFAR is administered through the Office of the U.S. Global AIDS Coordinator and Health Diplomacy within the U.S. Department of State, led by a Senate-confirmed coordinator with the rank of ambassador, and is housed within U.S. diplomatic missions under the oversight of the U.S. ambassador in country. ↩︎
  9. For more information on differentiated service delivery, see https://www.differentiatedservicedelivery.org/. ↩︎
  10. U.S. Department of State, PEPFAR 2021 Country and Regional Operational Plan (COP/ROP) Guidance for All PEPFAR Countries, updated February 2021, accessed: https://www.state.gov/wp-content/uploads/2021/02/PEPFAR-COP21-Guidance-Final.pdf. ↩︎
  11. U.S. Department of State, PEPFAR 2021 Annual Report to Congress, February 2021, accessed: https://www.state.gov/wp-content/uploads/2021/02/PEPFAR2021AnnualReporttoCongress.pdf. ↩︎
  12. U.S. Department of State, U.S. Embassy and Consulate in Nigeria. “U.S. Urges Removal of User-fees for People Living with HIV,” October 2019, accessed: https://ng.usembassy.gov/u-s-urges-removal-of-user-fees-for-people-living-with-hiv/. ↩︎
  13. Ahonkhai AA, et al. “The impact of user fees on uptake of HIV services and adherence to HIV treatment: Findings from a large HIV program in Nigeria,” PLOS ONE, September 2020, accessed: https://journals.plos.org/plosone/article?id=10.1371/journal.pone.0238720. ↩︎
  14. USAID, “Sustainable Financing: Controlling the HIV/AIDS Epidemic Through Shared Responsibility,” webpage, accessed: https://www.usaid.gov/global-health/health-areas/hiv-and-aids/technical-areas/sustainable-financing-initiative (August 5, 2021). ↩︎
  15. U.S. Department of State, Strategy for Accelerating HIV/AIDS Epidemic Control (2017-2020), September 2017, accessed: https://www.state.gov/wp-content/uploads/2019/08/PEPFAR-Strategy-for-Accelerating-HIVAIDS-Epidemic-Control-2017-2020.pdf. ↩︎
  16. U.S. Department of State, PEPFAR 2021 Country and Regional Operational Plan (COP/ROP) Guidance for All PEPFAR Countries, updated February 2021, accessed: https://www.state.gov/wp-content/uploads/2021/02/PEPFAR-COP21-Guidance-Final.pdf. ↩︎
  17. U.S. Department of State, “Statement from Ambassador Deborah Birx, M.D., U.S. Global AIDS Coordinator, on the Principles of PEPFAR's Public Health Approach,” April 2014, accessed: https://web.archive.org/web/20150905071637/http:/www.pepfar.gov/press/releases/2014/224738.htm. ↩︎
  18. U.S. Department of State, Draft PEPFAR COP 2022 Guidance. ↩︎
  19. Institute of Medicine, Evaluation of PEPFAR, February 2013, accessed: https://www.nap.edu/catalog/18256/evaluation-of-pepfar. ↩︎
  20. O’Neill Institute for National and Global Health Law at Georgetown University Law Center, Reorganization and the Future of PEPFAR; Implications of State and USAID Reform, 2018. ↩︎
  21. Kolker J. “A Diplomat’s Perspective on Use of Science and Evidence in Implementing PEPFAR,” Science and Diplomacy, April 2018, accessed: https://www.sciencediplomacy.org/article/2018/kolker-pepfar. ↩︎
  22. Daschle T, Frist B, Building Prosperity, Stability, and Security Through Strategic Health Diplomacy: A Study of 15 Years of PEPFAR, Bipartisan Policy Center, 2018, accessed: https://bipartisanpolicy.org/wp-content/uploads/2019/03/Building-Prosperity-Stability-and-Security-Through-Strategic-Health-Diplomacy-A-Study-of-15-Years-of-PEPFAR.pdf. ↩︎
  23. Collins C et al, “Four Principles for Expanding PEPFAR’s Role as a Vital Force in U.S. Health Diplomacy Abroad,” Health Affairs, July 2012, accessed: https://www.healthaffairs.org/doi/10.1377/hlthaff.2012.0204. ↩︎
  24. Daschle T, Frist B, The Case for Strategic Health Diplomacy: A Study of PEPFAR, 2015, Bipartisan Policy Center, November 2015, accessed: https://bipartisanpolicy.org/wp-content/uploads/2019/03/BPC_Strategic-Health-November-2015.pdf. ↩︎
  25. The COP/ROP documents serve as annual strategic plans for U.S. HIV/AIDS efforts in host countries, as well as serve as the basis for the approval of U.S. funding. Each COP focuses on PEPFAR’s efforts in one county in most cases, whereas the ROPs focus on a group of countries. Most, but not all, COP countries receive a greater level of investment than ROP countries. ↩︎
  26. PEPFAR’s 2020 Country Operational Plan Guidance for all PEPFAR Countries includes a list of 55 countries that were required to submit a COP or ROP that year. This list served as the basis for our “PEPFAR countries” group. Two countries on this list (Barbados and Suriname) were excluded from our analysis following communication with staff in the Office of the Global AIDS Coordinator that confirmed that direct bilateral support had been discontinued to those countries in recent years. ↩︎
  27. U.S. Department of State, PEPFAR 2021 Country and Regional Operational Plan (COP/ROP) Guidance for All PEPFAR Countries, updated February 2021, accessed: https://www.state.gov/wp-content/uploads/2021/02/PEPFAR-COP21-Guidance-Final.pdf. ↩︎
  28. According to the U.S. government database www.foreignassistance.gov, three countries that were not required to develop a COP or ROP received some HIV funding in FY 2020 – Colombia, Peru, and Venezuela. These countries were not included in the PEPFAR group. ↩︎
  29. Only low- and middle-income countries, as defined by the World Bank (https://datahelpdesk.worldbank.org/knowledgebase/articles/906519-world-bank-country-and-lending-groups) were included in this analysis, with the exception of two high-income countries (Panama and Trinidad and Tobago) that receive PEPFAR support and were required to submit a ROP in 2020. ↩︎
  30. U.S. Department of State, “PEPFAR Update – Stakeholder Townhall,” presentation delivered on August 2, 2012. ↩︎
  31. O’Neill Institute for National and Global Health Law at Georgetown University Law Center, HIV Policy Lab, accessed: https://hivpolicylab.org/. ↩︎
  32. Kavanagh M, et al, “Understanding and comparing HIV-related law and policy environments: cross-national data and accountability for the global AIDS response,” BMJ Global Health, 2020, accessed: https://gh.bmj.com/content/5/9/e003695. ↩︎
  33. UNAIDS, Laws and Policies Analytics, web platform, accessed: http://lawsandpolicies.unaids.org/. ↩︎
  34. PEPFAR’s 2020 Country Operational Plan Guidance for all PEPFAR Countries includes a list of 55 countries that were required to submit a COP or ROP that year. This list served as the basis for our “PEPFAR countries” group. Two countries on this list (Barbados and Suriname) were excluded from our analysis following communication with staff in the Office of the Global AIDS Coordinator that confirmed that direct bilateral support had been discontinued to those countries in recent years. ↩︎
  35. According to the U.S. government database www.foreignassistance.gov, three countries that were not required to develop a COP or ROP received some HIV funding in FY 2020 – Colombia, Peru, and Venezuela. These countries were not included in the PEPFAR group. ↩︎
  36. Only low- and middle-income countries, as defined by the World Bank (see: https://datahelpdesk.worldbank.org/knowledgebase/articles/906519-world-bank-country-and-lending-groups), were included in this analysis, with the exception of two high-income countries (Panama and Trinidad and Tobago) that receive PEPFAR support and were required to submit a ROP in 2020. ↩︎

Economic Impact of COVID-19 on PEPFAR Countries

Published: Feb 7, 2022

Issue Brief

Key Facts

  • The toll the COVID-19 pandemic has exacted on the global economy has been significant, with the International Monetary Fund (IMF) estimating that median global GDP dropped by 3.9% from 2019 to 2020, making it the worst economic downturn since the Great Depression. While the global economy was estimated to have recovered in 2021, recovery has been uneven and disparities in vaccine access and coverage could threaten improvement in much of the world.
  • Among other priorities, the White House’s U.S. COVID-19 Global Response and Recovery Framework seeks to bolster the economies of countries that have suffered due to the pandemic. This will be especially important in countries where the U.S. has major investments in other health areas, such as PEPFAR, the U.S. global HIV program. The economic impacts of COVID-19 on the HIV response could be as consequential as the direct health impacts, and as such, may significantly affect U.S. efforts in these countries. To inform such efforts, we examined the current and projected economic impact of COVID-19 in 53 PEPFAR countries.
  • Overall, we find that in the majority of PEPFAR countries, GDP fell in 2020, the year the pandemic emerged, compared to 2019. In 11 countries, the contraction was greater than 10%. While PEPFAR countries experienced less of a median GDP drop than the global economy overall in 2020 (1.9% compared to 3.9%), they generally fared worse than their economic and regional peers.
  • While the global economy was estimated to have recovered in 2021, this was not the case in PEPFAR countries. While almost all PEPFAR countries were estimated to have experienced some GDP growth in 2021, the projected growth, at least through 2024, remains below pre-pandemic projections (10-13% below). By contrast, the current projections of global GDP exceed the pre-pandemic projections. In addition, the challenges facing the global economy are likely to continue, particularly in low and middle-income countries, as the strong rebound in 2021 is expected to decelerate in 2022.
  • Finally, there is significant uncertainty facing economic recovery in PEPFAR countries, which will be highly dependent on the future course of the COVID-19 pandemic, economic relief efforts, and vaccine roll-out. Currently, in 30 of the 53 PEPFAR countries, less than a third of the population has received at least one vaccine dose and only 10 are on track to meet global COVID-19 vaccine targets this year.

Introduction

The toll the COVID-19 pandemic has exacted on the global economy has been significant, with the International Monetary Fund (IMF) estimating that global median GDP dropped by 3.9% from 2019 to 2020, making it the worst downturn since the Great Depression. Last year, in 2021, as countries started to reopen and vaccines became available, the global economy was estimated to grow, though still below pre-pandemic projections, and recovery has been uneven across countries and regions. In addition, the IMF has warned that vaccine access is the economic recovery “fault line”, as some countries look to resume normal activity and others continue to face new waves of infections and rising deaths. Indeed, vaccine coverage in low-income countries is well below all others and, at current rates, many are unlikely to reach global vaccine targets.

The White House U.S. COVID-19 Global Response and Recovery Framework includes an objective to “bolster economies and other critical systems under stress due to COVID-19 to prevent backsliding and enable recovery.” This will be especially important in countries where the U.S. has major investments in other health areas, such as PEPFAR, the U.S. global HIV/AIDS program. Because HIV is also an infectious disease, but one without a vaccine or cure, the economic impacts of COVID-19 on the HIV response could be as consequential as and exacerbate the direct health impacts.

This brief examines the current and projected economic impact of COVID-19 in PEPFAR countries. We used data from the International Monetary Fund’s (IMF) World Economic Outlook (WEO),1  on GDP and GDP growth projections2  for 53 countries3  that were required by PEPFAR to submit a Country Operational Plan or Regional Operational Plan (COP/ROP) in FY 2020.4  We also compared the IMF’s WEO pre-pandemic and current data projections to better understand the estimated economic impact. Pre-pandemic projections were taken from the October 2019 WEO database, and current data projections were taken from the October 2021 WEO database. The appendix contains WEO 2019-2021 GDP growth data, as of October 2021 for all 53 PEPFAR countries as well as the world median aggregate.

Key Findings

Economic Impact of COVID-19 in 2020

Almost all PEPFAR countries experienced GDP contractions in 2020 compared to 2019, and many fared worse than their economic and regional peers. Still, as a group, PEPFAR countries experienced less of a contraction than the global economy in 2020.

  • 32 of the 53 PEPFAR countries (60%) were estimated to have experienced contractions in GDP in 2020. In 11 countries, the contraction was greater than 10%. Of the top five countries with the largest estimated contractions, three were in Sub-Saharan Africa (Angola, Zambia, and Namibia); the other 2 (Brazil and Panama) were in the Western Hemisphere. The contractions ranged from -0.04% (Nicaragua) to -30.9% (Angola) (see Figure 1).
  • 21 PEPFAR countries experienced positive GDP growth in 2020 (see Figure 1), although in 11 of these countries, growth was lower than in 2019 (see Appendix 1).
  • Compared to the global economy, PEPFAR countries as a group experienced less of a contraction in 2020 (1.9% median drop in PEPFAR countries compared to a 3.9% median drop globally) (see Figure 1), though compared to their economic and regional peers, PEPFAR countries generally lagged behind non-PEPFAR countries (see Figure 2).
Real GDP Change (Percent Change in GDP from Previous Year) in 2020, by PEPFAR Country
Median Change in GDP in 2020 for PEPFAR Countries vs. Non-PEPFAR Countries, by Income-Level

Economic Impact in 2021 and Beyond

While almost all PEPFAR countries were estimated to see GDP grow in 2021, growth remains below pre-pandemic projections, in contrast to the global economy overall which is estimated to have fully recovered. In addition, there is future uncertainty.

  • Almost all PEPFAR countries (49 countries or 92%) were estimated to have experienced some economic recovery in 2021, with higher GDP growth compared to 2020 (see Figure 3). Of the top five with the largest estimated GDP growth in 2021, two were in the Western Hemisphere (Haiti and Guyana); the other three were in Sub-Saharan Africa (Lesotho, South Africa, and Angola). GDP growth ranged from 0.06% (Rwanda) to 39% (Haiti) (see Figure 4). On the other hand, negative growth, or contractions, occurred for Ethiopia, Myanmar, and South Sudan.
  • Still, projected GDP of the 53 PEPFAR countries, as a group, is expected to remain below pre-pandemic projections, at least through 2024 (at 10-13% lower than the pre-pandemic outlook) (see Figure 5), as it does for 34 of the 53 countries.
  • By contrast, global GDP5  is not only estimated to have returned to its pre-pandemic projections in 2021, it is projected to exceed these as of 2022 and beyond. This largely reflects the strong and rebounding economies in high-income countries which have greater access to vaccines and a larger share of their populations vaccinated.6  And even though LMICs7  as a group are still projected to see lower GDP growth than their pre-pandemic projections (2-4% lower through 2024), they are anticipated to outperform PEPFAR countries over this period (see Figure 5). In addition, following the strong rebound in 2021, global economic growth is likely to decelerate putting further pressures on the recovery in low and middle-income countries.8 
  • Future recovery in PEPFAR countries is uncertain and highly dependent on the future course of the COVID-19 pandemic, economic relief efforts, and, ultimately, vaccine roll-out. Currently, in 30 of the 53 PEPFAR countries, less than a third of the population has received at least one vaccine dose and only 10 PEPFAR countries (18%) are on target to reach the WHO goal of 70% vaccine coverage by mid-2022 (see Figure 6).9 
Real GDP Change (Percent Change in GDP from Previous Year) in 2020 and 2021, by PEPFAR Country
Real GDP Change (Percent Change in GDP from Previous Year) in 2021, by PEPFAR Country
Comparison of GDP Projections for PEPFAR Countries, Pre-pandemic vs. Current
Share of Population with at Least One Vaccine Dose and PEPFAR Countries Projected to Reach World Health Organization COVID-19 Vaccination Coverage Goals

Looking Ahead

It is clear that COVID-19 has set back economic progress worldwide and in PEPFAR countries. While PEPFAR countries, most of which are LMICs, did not appear to be as hard hit economically in the first year of the pandemic compared to the global economy, their current economic outlook is worse and recovery is slower compared to pre-pandemic estimates. This reflects several factors, including the challenges faced by many low-income countries, compared to hic-income counterparts, in providing fiscal relief to address the domestic effects of COVID-19 as well as the variation in the severity of pandemic-related disruptions and now, vaccine access. Moreover, this situation is unstable. Several PEPFAR countries are experiencing a significant increase in COVID-19 cases due to the emergence of the Omicron variant, and most are on the other side of the “vaccine fault line”, not expected to obtain significant vaccine access until well into this next year or beyond. The ongoing effects of COVID-19 and the fluidity of the global environment make it difficult to predict what the ultimate impact will be on PEPFAR countries’ economies and their HIV responses in the future. Recent PEPFAR data also show that economic problems are worse in countries with high HIV prevalence.10  This combination of factors may have particular implications for the U.S. role in supporting the HIV response, including the extent to which the U.S. seeks to provide broader economic relief or additional health funding to PEPFAR countries and/or focus additional efforts on their vaccine roll-out, some of which has already been piloted in select PEPFAR countries.11 

Appendix

Appendix 1: Real GDP Change (Percent Change from Previous Year), Country Groupings and PEPFAR Countries

Endnotes

  1. International Monetary Fund (IMF), World Economic Outlook, October 2021. ↩︎
  2. GDP growth represents annual percentage change calculated using current prices in U.S. dollars. ↩︎
  3. While 55 countries are included in the COP FY20 Guidance, activities in two of these countries – Barbados and Suriname—were discontinued over the past several years; as such, these countries are not included in the analysis. ↩︎
  4. PEPFAR, PEPFAR 2020 Country Operational Plan Guidance for all PEPFAR Countries. ↩︎
  5. Global estimate includes data for 196 countries and territories. ↩︎
  6. KFF, KFF Global COVID-19 Vaccine Coverage Tool: Current and Projected Coverage, Accessed December 13, 2021. ↩︎
  7. LMICs estimate includes data for 81 low- and lower-middle-income countries and territories. ↩︎
  8. World Bank, Global Growth to Slow through 2023, Adding to Risk of ‘Hard Landing’ in Developing Economies, January 2022. ↩︎
  9. KFF, KFF Global COVID-19 Vaccine Coverage Tool: Current and Projected Coverage, Accessed December 13, 2021. ↩︎
  10. PEPFAR, PEPFAR 2022 Country Operational Plan Draft Guidance for all PEPFAR-Supported Countries. ↩︎
  11. Global AIDS Policy Partnership (GAPP), The Power of PEPFAR event slides, December 7, 2021, accessed: https://www.youtube.com/watch?app=desktop&v=Ywlcxk6FqHs&ab_channel=GlobalAIDSPolicyPartnership. ↩︎

Tracking The Pandemic’s Effects On Health Outcomes, Costs, And Access To Care

Authors: Keanan Lane, Cynthia Cox, Krutika Amin, Nicky Tettamanti, Emma Wager, and Jared Ortaliza
Published: Feb 4, 2022

In this Health Affairs GrantWatch article, experts at KFF and the Peterson Center on Healthcare summarize findings from analyses on the KFF-Peterson Health System Tracker related to COVID-19 pandemic’s impact, including significant disruptions to longstanding trends in health outcomes, spending, and access to care. The article also looks ahead to 2022.

Network Adequacy Standards and Enforcement

Author: Karen Pollitz
Published: Feb 4, 2022

The Affordable Care Act (ACA) requires qualified health plans (QHPs) offered through the Marketplace to ensure a sufficient choice of providers and provide information to enrollees and prospective enrollees on the availability of in-network and out-of-network providers. Health plan networks are a key factor determining whether patients can actually get needed care, as claims for out-of-network services may be denied altogether or covered at a reduced rate.

Insurers can design provider networks to control utilization and reduce costs, and there are signs that “shrinkflation” (the practice of reducing the size of a product while maintaining its sticker price) may be taking place in the marketplace today.  Describing recent trends in the marketplace, the Centers for Medicare and Medicaid Services (CMS) notes

“the proliferation of narrower networks … presents a number of potential consumer protection concerns including whether a narrow network has sufficient capacity to serve plan enrollees, or whether providers may be too geographically dispersed to be reasonably accessible.”

Studies find nearly 8 in 10 QHPs are health maintenance organizations (HMO) or exclusive provider organizations (EPO); both types of plans have closed networks, meaning nonemergency care from out-of-network providers generally is not covered. And many QHP provider networks are narrow. One study reviewing 2017 QHP physician networks found 21% of plans included less than one-fourth of available providers, while another 20% included fewer than 40% of available providers. Another study of 2017 QHP hospital networks found 21% of plans included fewer than one-third of available hospitals, and a further 28% of plans covered fewer than 70% of available hospitals. That study also observed that 29% of marketplace participants had only narrow network plans available.  By contrast, job-based plans tend to have more robust provider networks; only 6% of employers offering health benefits say their most popular plan network is narrow.

There is no national standard for network adequacy,1  and standards that are applied vary significantly across states and types of coverage.  Evaluation of health plan networks relies on plan provider directory data, which often have been found to be inaccurate or out of date.  There is no national standard for the accuracy of information in health plan provider network directories; a new federal law establishing national standards for private health plans has yet to be implemented. Finally, there also is no standard measure of network size or breadth, nor any way for consumers or regulators to easily discern differences in network size.

To date federal regulation and oversight of QHP provider networks has been limited. For the 2023 plan year, CMS has proposed new network adequacy standards through regulations and guidance. The agency has also proposed a pilot network transparency indicator.  This brief reviews background on federal network adequacy regulation, the availability of information about QHP networks, and options for strengthening oversight and enforcement.

Network Adequacy Regulation Overview

The federal government certifies QHPs offered in 30 federal marketplace states. Initially federal marketplace issuers were required to submit provider networks for CMS review and certain federal standards applied. Beginning with the 2018 plan year, the Trump Administration ended direct federal oversight of the adequacy of QHP networks, deferring to state oversight, accreditation by private organizations, or the issuer’s attestation.  A federal court subsequently ruled this change was arbitrary and capricious, and as a result, federal oversight is scheduled to resume for the 2023 plan year. The regulation of health plan network adequacy can involve the use of various quantitative standards, as well as other oversight activities.  Examples of quantitative standards include:

Time/distance standards – This type of standard is used to determine whether participating providers are geographically accessible to plan enrollees.  For marketplace plans beginning in 2023, CMS has proposed time/distance standards for various types of providers and facilities. (Table 1) At least 90 percent of enrollees must live within the maximum distance to at least one provider of each type.  For QHPs with tiered networks, only providers on the lowest cost-sharing tier would be counted.

Time/distance standards measure geographic proximity but not the breadth of a network. For example, in Cook County, Illinois – which measures approximately 60 miles north to south and 40 miles east to west, and where approximately 113,500 marketplace enrollees reside – a QHP network conceivably could satisfy this metric if it included just a handful of each of the provider and facility types shown in Table 1.

Table 1: Proposed Federal Marketplace Time/Distance Standards for Selected Specialties, 2023
Maximum Time and Distance Standards (minutes/miles) Per County Type
Specialty AreaLarge MetroMetroMicroRuralCounties with extreme access considerations
Primary Care10/515/1030/2040/3070/60
Cardiology20/1030/2050/3575/6095/85
Emergency Medicine20/1045/3080/6075/60110/100
Endocrinology30/1560/40100/75110/90145/130
General Surgery20/1030/2050/3575/6095/85
Infectious Disease30/1560/40100/75110/90145/130
Oncology (Med/Surg)20/1045/3060/4575/60110/100
Oncology (Radiology)30/1560/40100/75110/90145/130
Outpatient Clinical Behavioral Health10/515/1030/2040/3070/60
Rheumatology30/1560/40100/75110/90145/130
Acute Inpatient Hospitals20/1045/3080/6075/60110/100
Inpatient Behavioral Health Facility Services39/1570/45100/7590/75155/140
Urgent Care20/1045/3080/6075/60110/100
The full list of specialties and facilities for which proposed time/distance standards would apply and detail on county types is found in the CMS 2023 Draft Letters to Issuers in the Federally-facilitated Exchanges.

 As late as 2017, CMS applied time/distance standards in the federal marketplace.  Reviews took place during the annual certification process. During the 2016 certification process, CMS reports more than 90% of issuers passed for each of these metrics. Issuers failing to meet numeric standards could submit a “justification” explaining why its network provided reasonable access given the local availability of providers, or why offering the plan would nonetheless be in the interest of marketplace consumers.  CMS did not publish data on QHPs approved pursuant to justification or on the metrics plans failed to meet.

For Medicare Advantage (MA) plans, CMS applies time/distance standards similar to those proposed for the federal marketplace, though standards were reduced in 2020, for example, requiring that only 85% of enrollees in non-metro areas live within time/distance standards, and further reducing the standard in all counties for MA plans that include telehealth providers.

Network adequacy standards for Medicaid managed care plans2  differ by state.  In 2016, CMS required states to establish time and distance standards for specific types of providers, but the Trump Administration ended this requirement effective in December of 2020, instead allowing states to establish any type of quantitative network adequacy standard. CMS is currently developing a “comprehensive access strategy” across Medicaid fee-for-service and managed care delivery systems, with a notice of proposed rule-making planned for October 2022.

Minimum number of providers – Another standard establishes minimum provider-to-enrollee ratios.  Here again, standards vary, where they exist.  For example, in MA plan networks serving large metro areas, plans must contract with at least 1.67 primary care physicians per 1,000 beneficiaries.  Under MA rules, contracted providers must also be within the maximum time and distance of at least one beneficiary to count toward the minimum number. CMS does not require minimum ratios for Medicaid managed care plans, though this is one of the quantitative standards that states can adopt to comply with federal Medicaid managed care rules.  Where they have been adopted, these standards also vary (e.g. the minimum ratio of primary care providers to enrollees in Michigan, California, and Tennessee is 1:500, 1:2,000, and 1:2,500).

To date CMS has not applied a minimum provider ratio standard for the federal marketplace, nor has it proposed one for 2023.  A review of state network adequacy regulation found that 10 states (including 5 that use the federal marketplace today) established minimum provider-to-enrollee ratios; so such a standard could apply to some federal marketplace QHPs via state regulation.

Appointment wait-times – Another type of standard sets maximum appointment wait-times for certain types of services.  CMS has proposed this standard for 3 types of outpatient appointments shown in Table 2.  Issuers would attest that 90% of contracted providers meet the wait-time standard; CMS would conduct compliance reviews in response to complaints and random audits.  CMS has not proposed to create a complaints hotline for federal marketplace enrollees.

 Table 2: Proposed Appointment Wait Time Standard for Federal Marketplace Plans, 2023
Provider TypeAppointments must be available within:
Behavioral Health10 calendar days
Primary Care (routine)15 calendar days
Specialty Care (non-urgent)30 calendar days
Source: 2023 Draft Letter to Issuers in the Federally-facilitated Exchanges

Maximum appointment wait-times are another type of quantitative standard that state Medicaid programs can adopt to comply with federal requirements.  Many states have done so, though these also vary based on times and services. For example, state maximum appointment wait-time standard for routine primary care services can range from 10 to 45 days, routine specialty care from 10 to 60 days, and urgent appointments from 1 to 4 days.  Medicare Advantage plans are not currently required to meet appointment wait-time standards.

Essential community providers – In addition to other network standards, QHPs are required to contract with a minimum number of available essential community providers (ECP) in their service area. These include community health clinics, Ryan White providers, and other specified providers that serve predominately low-income and medically underserved individuals. In 2017 federal marketplace plans were required to contract with at least 30 percent of available ECPs; the Trump Administration reduced this threshold to 20% of available ECPs beginning in 2018.  For 2023, CMS has proposed to increase the threshold to 35% of available ECPs.

Other standards – CMS proposes to require QHPs to report data in 2023 on whether network providers offer telehealth services and seeks comment on whether and how telehealth availability might be incorporated into network adequacy standards.  The QHP rule proposes no new standards related to cultural and linguistic competency of network providers.  Under Medicaid managed care, state standards must address the capacity of providers to communicate with patients with limited English proficiency in their preferred language and to accommodate patients with disabilities.  Federal rules also require Medicaid managed care plan directories to indicate providers’ cultural and linguistic capabilities and the availability of skilled medical interpreters.

Finally as a condition of certification in the Exchange, QHP issuers must conduct an annual survey of enrollee experiences and report data to CMS.  The survey includes questions about timely access to care, patient/provider communication capacity, and patient ratings of their doctors and of the care provided.  Results inform a “star-rating” system for QHPs, and aggregated results are posted publicly.

Accuracy of Provider Network Directories

Regulators evaluate plans against quantitative network adequacy standards using network directory data, which often contain errors.  Plans offered on HealthCare.gov are required to include directory links showing providers’ location, contact information, specialty, and whether they are accepting new patients.  Issuers are required to update directories at least monthly. As part of its annual compliance review, CMS selects a small sample of issuers and reviews the machine-readable provider directory to verify accuracy. The most recent report found inaccuracies in all directories examined in 2020, with similar compliance problems observed in prior years.

Oversight of appointment wait-time standards also rely on directory data.  In a secret shopper study of California QHPs in 2015, 73% of calls to providers listed in network directories were unable to secure appointments.  Failures generally related to inaccurate phone numbers or addresses for listed providers, inaccurate specialty listings, or listed providers who were not actually in the network. Similarly, a 2014 review of Medicaid managed care plans conducted by the HHS Office of Inspector General found half of listed providers called could not offer appointments, most often because they were not practicing at the location listed in the directory or participating in the network at all.  A 2018 review of the accuracy of Medicare Advantage plan directories found nearly half (48.7%) contain inaccuracies.

Starting in 2022, the No Surprises Act requires all private health plans, including QHPs, to maintain accurate provider directories and requires providers to regularly update plans about any changes in their information. Plans must verify and update directories at least every 90 days and, on an ongoing basis, post any changes within 2 business days.  Plans are also required to apply in-network cost sharing for covered services provided by facilities or providers mistakenly listed as in-network. However, enforcement will be delayed because implementing regulations have not yet been published; CMS expects plans to make good faith efforts to comply with new requirements beginning in 2022.

Network Transparency

Even while meeting minimum standards, insurers can and do design provider networks of substantially different sizes. This year the average marketplace participant in HealthCare.gov states is offered 107 different plan options.  The only consumer tool for evaluating networks is to look up names of individual providers in each plan’s directory. There is no easy way to compare the size of networks overall.

In 2017, CMS piloted a “network transparency” measure in 3 states (Maine,3  Tennessee, and Texas) to indicate the relative breadth of a plan’s provider network compared to other QHPs in the same area.  For three categories of providers – hospitals, primary care providers, and pediatricians – CMS compares the number of providers in a QHP network to the total number participating in any of the QHP networks.  Comparisons are made on a county-basis.  Plan networks for each category are then labeled as “smaller,” “larger,” or “about the same” as other QHPs in the county.

For 2023, CMS has proposed modifications to this measure for QHPs in pilot states. The provider categories measured will be general acute care hospitals, adult primary care, and pediatric primary care.  The number participating in any QHP network in a county will be totaled for each category.  CMS will then label QHP networks based on threshold percentages.  Those containing fewer than 30% of providers participating in any of the QHP networks will be labeled as “Basic.”  Those containing 30-69% of available providers will be labeled “Standard,” and those containing 70% or more will be labeled as “Broad.”

This revised indicator still provides information only about the relative breadth of a network compared to other QHPs and is therefore not an absolute measure of network size.  For example, assume there are 50 general acute care hospitals in a large urban county and 3 QHP options are offered in that county.  Assume further that Plan-A has 10 general acute care hospitals participating in network; Plan-B has 15 hospitals (the 10 in A’s network and 5 others); and Plan-C has 20 hospitals (the 15 in B’s network and 5 others).  Under the proposed network transparency indicator, Plan A would be described as basic, Plan B standard, and Plan C broad.  Yet arguably all three plan networks are narrow, excluding at least 60% of the available area hospitals.

A Unique State Approach to Network Regulation and Transparency – The New Hampshire Insurance Department (NHID) developed a novel approach to assessing private health plan provider networks that highlights the actual breadth of plan networks, not just their relative breadth, by measuring the share of all available providers that participate in a health plan’s network.  Regulators determine the number of all available providers in a county by analyzing claims from the state’s all-payer claims data base (APCD), then count the share of available providers in each plan’s network.  Marketplace consumers can compare QHP hospital networks on the NHID site. The state also offers an interactive tool that consumers and group purchasers can use to compare hospital networks in state-regulated health plans.  Consumer-facing tools to compare other categories of provider networks have not yet been developed.

New Hampshire also categorizes providers based on their claims for key covered services that appear in the APCD. Regulators have identified core, common, and specialized services for each specialty. For example, to count a doctor as an adult primary care provider, the NHID counts those who have claims in the APCD for preventive and routine care provided to an adult.  Regulators then compare this provider list to health plan directory data to determine the number of participating primary care providers in each plan.  This approach, relying on APCD claims data, helps to correct for misclassification of specialties in provider directories and for other types of directory mistakes (e.g., continuing to list as participating a doctor who has actually retired or moved away, and so who no longer shows claims in the APCD).

The federal government does not currently have an all-payer claims database like New Hampshire to implement an approach like this. It does have a claims database of providers participating in Medicare, which includes nearly all available hospitals and physicians, although adjustments would be needed for pediatricians and other providers that participate less frequently in Medicare.

One Illustration

To explore the variation in network size and accessibility of information, we conducted a manual search of QHPs provider directories in the Houston, Texas area.  Directories for the benchmark silver plan and for the lowest cost silver plan offered by other issuers were examined.  Where it was clear that issuers offer multiple network options, these different networks were also included in the search.  Participating general acute care hospitals within 25 miles of Houston (zip code 77002) were counted, with results shown in Table 3.  The number participating in plans ranged from 9 to 42, with a total of 52 general acute care hospitals participating in at least one of the Houston-area QHP networks.  Table 3 also shows the current network transparency indicator displayed on HealthCare.gov today and shows what the proposed revised network transparency indicator would be, based on this search.

Finally, as a proxy measure for the total number of available general acute care hospitals in the Houston area, Table 3 also shows the number participating in the most popular health plan option offered to federal employees (the FEHBP Blue Cross standard plan), which includes 56 general acute care hospitals according to that plan’s online directory.

Marketplace consumers in the Houston area appear to have a choice of at least 11 different hospital provider networks.  In six of these networks (applicable to 125 of the 202 QHPs offered), at least 75% of available hospitals are not included.  Broader hospital networks are for sale in the Houston area marketplace, though these plans cost more.  Table 3 also shows that the added premium for a 45-year-old for a plan with a broader hospital network would cost $85-$157/month, an increment not covered by marketplace premium subsidies.

Table 3: Participating Hospitals in Marketplace Plans vs. FEHBP, Houston, TX, 2022
Issuer/ Network (total number of plans offered)Number of PAR Hospitals Shown in Directory *Percent of all QHP PAR hospitalsPercent of all available hospitalsCurrent Marketplace Network Transparency IndicatorProposed Marketplace Network Transparency IndicatorAdditional Monthly Premium for This Issuer’s Lowest Cost Silver Plan** (Age 45)
Oscar (66)917%16%SmallerBasic$85.14
Bright Health (28) (benchmark)1121%20%SmallerBasic0
Ambetter/Value (5)1121%20%SmallerBasic$19.88
Aetna-CVS Health (5)1325%23%About the sameBasic$76.50
Friday (8)1427%25%SmallerBasic$8.51
United Health Care (13)1427%25%About the sameBasic$63.64
BCBS-TX / MyBlue Health (3)1733%30%SmallerStandard$28.01
Molina (9)3058%54%About the sameStandard$85.89
Ambetter /Balance (46)3465%61%About the sameStandard$89.15
BCBS-TX / Blue Advantage (10)3669%64%About the sameStandard$156.59
Community Health Choice (9)42***81%75%About the sameBroad$57.47***
Total hospitals in all QHPs52
BCBS for Federal Employees56
* Participating hospitals were counted using provider directory links for HealthCare.gov plans displayed for zip code 77002 (within 25 miles), viewed on January 12-14, 2022.  Counts include only general acute cares hospitals, not rehab or psychiatric hospitals, freestanding emergency rooms, imaging centers, clinics, or other facilities that commonly display as “hospitals” in QHP provider directories.** This column compares the unsubsidized premium for each issuer’s lowest-cost silver plan for a 45-year-old to the unsubsidized premium for a 45-year-old for the benchmark plan (Bright HealthCare Super Silver 1), which is $423.63. Marketplace subsidies are tied to the cost of the benchmark plan. Consumers can also buy plans that cost more, but must pay 100% of the additional cost.*** The lowest cost silver plan offered by Community Health Choice indicates it has a “Limited Provider Network” which costs $535.58/month, or $57.47 more than the benchmark silver plan.  However, the provider directory for this plan is the same as that for all other plans offered by this insurer, none of which include “limited network” in the name. The next lowest cost silver plan offered by this insurer costs $111.95 more than the benchmark plan for a 45-year-old.  Also of note, the provider directory for this insurer indicates certain participating hospitals in its Silver Plan networks are not included in Bronze plan networks.

The current HealthCare.gov network transparency indicator offers a clue as to differences in network size, though the indicator provides limited information.  Hospital networks are either described as “about the same” or “smaller” when compared to each other.4  The proposed revised network transparency indicator, as applied to the results shown in Table 3, would label 6 of the 11 networks as “basic,” 4 as “standard,” and one as “broad.”

While this illustration looked only at general acute care hospitals, network transparency indicators could also report on inclusion of providers of specialized services for seriously and chronically ill patients.  For example, a 2016 KFF study of hospital networks in Medicare Advantage plans specifically examined the participation of National Cancer Institute (NCI)-designated cancer centers and found most MA plans in the Houston area did not include the University of Texas MD Anderson Cancer Center.  None of the Houston-area QHP directories included this cancer center in network, either, though it does participate in the FEP plan network.

Discussion

Insurers offer a range of network designs in marketplace plans, including some that may be exceedingly narrow.  What this means for patient access to care – and for continuity of care for consumers transitioning from other coverage to the marketplace – is not clear, nor is it measured.  Proposed new standards for 2023 set minimum standards for QHP provider networks, but these alone will not assure networks meet any minimum standard of breadth. Time-distance standards as proposed require at least 1 participating provider be in proximity to most enrollees, but do not assure a sufficient number will be available.  Appointment wait-time standards begin to measure actual access to care but have been proposed only for 3 types of routine care, not specialized or urgent care services.

Other aspects of network adequacy have not been incorporated into proposed standards, though public comment was requested on some issues. It remains to be seen whether QHP network standards will measure provider language and cultural competencies, or accessibility for people with disabilities, or access to specialized care for specified groups such as children, patients with chronic health conditions, or other underserved communities.

Differences in the breadth of health plan networks could be more clearly measured and described.  Because the marketplace primarily offers transitional coverage, it could help consumers to show which QHPs, if any, offer comparable networks to the plans they’re leaving, whether job-based plans left by workers during the “Great Resignation” or Medicaid managed care plans left by beneficiaries disenrolled as the public health emergency unwinds.

Better transparency measures can also inform oversight, helping regulators identify differences in provider networks and consider how to deploy other tools to understand how differences affect access to care. For example, data from QHP consumer experience surveys could highlight access concerns meriting further investigation.  ACA transparency data could also be enhanced and used in oversight to monitor differences in out-of-network claims for specific services or by specified groups of patients.  A complaints hotline for QHP shoppers and enrollees could alert regulators to potential problems, as could mid-year reviews.

Network adequacy is a key factor affecting patient access to care, yet it is challenging to operationalize. There is also an inherent trade-off with costs and affordability, as broader networks could increase premiums through higher prices and greater use of services.  Close monitoring and improved transparency may provide mechanisms to help evaluate standards and refine them over time.

  1. The National Association of Insurance Commissioners developed a Health Benefit Plan Network Access and Adequacy Model Act..  However, it includes no quantitative standards, and adoption by states has been limited. ↩︎
  2. Federal law requires Medicaid managed care plans to assure that they have capacity to serve expected enrollment in their service area and maintain a sufficient number, mix, and geographic distribution of providers. A Medicaid managed care plan must make covered services accessible to its enrollees to the same extent that such services are accessible to other state residents with Medicaid who are not enrolled with that plan. ↩︎
  3. Maine has since become a state-based marketplace. ↩︎
  4. The results in Table 3 show counts only of participating general acute care hospitals.  It is not clear whether CMS also counts other types of facilities in calculating the pilot network transparency indicator.  For example, using online directories to search general acute care hospitals, we found results often included other types of facilities including psychiatric hospitals, rehab facilities, addiction treatment facilities, freestanding emergency rooms, imaging centers, and clinics.  While we excluded all of these other types of facilities from our count, the CMS pilot might have classified facilities differently. ↩︎

Are Medicare Advantage Insurers Covering the Cost of At-Home COVID-19 Tests?

Published: Feb 3, 2022

In the wake of the COVID-19 Omicron variant wave that began in early December 2021, the Biden Administration has taken actions to increase testing capacity, including expanding access to at-home tests through neighborhood sites such as health centers and rural clinics and establishing a new federal government website and toll-free number where people can request four free at-home tests. In addition, the Administration is now requiring private insurers to cover the cost of up to 8 at-home COVID tests per enrollee per month, as of January 15, 2022, based on authorities granted by Congress under the Families First Coronavirus Response Act (FFCRA) and the Coronavirus Aid, Relief, and Economic Security (CARES) Act.

While this policy does not apply to Medicare, the Biden Administration recently announced that Medicare will cover the cost of up to 8 at-home COVID tests per month for Medicare beneficiaries with Part B, beginning in early spring. Currently, Medicare does not cover the cost of self-administered at-home tests, though it covers diagnostic lab testing for COVID-19 under Part B. Until Medicare coverage of at-home tests for all Medicare Part B enrollees begins, Medicare Advantage plans (offered by private insurers) have the option to cover at-home tests but are not required to do so.

To assess whether Medicare Advantage plans are covering the cost of at-home COVID tests, we reviewed the websites and spoke with customer service representatives of five of the largest Medicare Advantage insurers that together cover about two-thirds of all Medicare Advantage enrollees (based on 2021 enrollment) (Table 1). We conducted our analysis January 26-28, 2022. We also analyzed access to over-the-counter (OTC) benefits among Medicare Advantage enrollees in 2021, which are an option for coverage of at-home COVID tests in some but not all plans.

Table 1:  Coverage of At-Home COVID Tests Among Large Medicare Advantage Insurers

As of January 28, 4 of the 5 Medicare Advantage insurers that we examined are not reimbursing enrollees for at-home tests, with only one insurer, Kaiser Permanente, providing coverage of up to 8 at-home tests per month for both their Medicare and private enrollees.

  • 1 of the 5 insurers (Kaiser Permanente) will reimburse members for the cost of rapid antigen home tests.
  • 1 of the 5 insurers (UnitedHealthcare) states on their website that their “Medicare Advantage members are not eligible for reimbursement of OTC at-home COVID-19 tests purchased without a physician’s order” but that “most of UnitedHealthcare’s Medicare Advantage plans have an OTC benefit that can be used to get OTC at-home COVID-19 tests” (discussed below).
  • 3 of the 5 insurers (Humana, CVS Health, Cigna) state on their website that the new at-home testing reimbursement policy does not apply to people on Medicare.

Some Medicare Advantage enrollees may be able to get some coverage of at-home COVID tests through their OTC (over-the-counter) benefit.

  • In 2021, 79% of enrollees in individual Medicare Advantage plans (plans open for general enrollment) and 97% of enrollees in Medicare Advantage Special Needs Plans (SNPs) were enrolled in a plan with OTC benefits. Plans that offer an OTC benefit often provide a specified dollar amount toward the purchase of eligible OTC benefits, including non-prescription medications or other health care related items, such as first aid supplies – and that amount varies by plan.
  • UnitedHealthcare states that, for those enrollees in the insurer’s Medicare Advantage plans that offer an OTC benefit, this benefit can be used to cover the cost of at-home tests – although because the OTC benefit amount varies by plan, the number of tests that would be covered also varies. For example, some UnitedHealthcare plans cover up to $40 of OTC products per quarter, which would cover the cost of 3 COVID-19 tests every 3 months (based on the $12 reimbursement rate being used by private insurers). Other UHC plans have an OTC benefit of up to $100 per quarter, which would cover 8 tests every 3 months.
  • Currently, Humana, CVS Health, Kaiser Permanente, and Cigna are not extending their OTC benefit to the purchase of at-home tests. Enrollees in other Medicare Advantage plans that were not included in our analysis should check with their insurer about the availability of OTC benefits and whether this benefit can be used for the purchase of at-home tests.

CMS’s announcement to cover the cost at-home tests for all Medicare beneficiaries with Part B, including those in traditional Medicare and all Medicare Advantage enrollees, will expand more testing options to one of the groups most at-risk of COVID-19 hospitalizations and death, with adults 65 and older representing about three-fourths of all COVID-19 deaths. Until this coverage takes effect in early spring, in the absence of broad coverage through Medicare Advantage plans, many Medicare beneficiaries may have difficulty affording at-home COVID-19 tests.


FAQs on Medicare Coverage and Costs Related to COVID-19 Testing and Treatment

Published: Feb 3, 2022

More than 60 million people ages 65 and older and younger adults with long-term disabilities are covered by Medicare. Due to their older age and higher likelihood of having serious medical conditions than younger adults, virtually all Medicare beneficiaries are at greater risk of becoming seriously ill if they are infected with SARS-CoV-2, the coronavirus that causes COVID-19. COVID-19 is an infectious disease which currently has no cure, although several therapeutics and vaccines have been or are being developed. Diagnosis of COVID-19 is confirmed through testing, and treatment varies based on the severity of illness. According to data from the Centers for Medicare & Medicaid Services (CMS), through November 20, 2021, there have been over 6 million cases of COVID-19 among Medicare beneficiaries and 1.6 million hospitalizations.

These FAQs review current policies for Medicare coverage and costs associated with testing and treatment for COVID-19, including regulatory changes issued by CMS since the declaration of the public health emergency (first issued on January 31, 2020 and most recently renewed in January 2022), and legislative changes in three bills enacted since the start of the pandemic: the Coronavirus Preparedness and Response Supplemental Appropriations Act, 2020, enacted on March 6, 2020 (Public Law 116-123); the Families First Coronavirus Response Act, enacted on March 18, 2020 (Public Law 116-127); and the Coronavirus Aid, Relief, and Economic Security (CARES) Act, enacted on March 27, 2020 (Public Law 116-136).

Does Medicare cover testing for COVID-19?

In April 2022, the Biden Administration finalized an initiative providing for Medicare coverage of up to 8 at-home COVID tests per month for Medicare beneficiaries with Part B, including beneficiaries in traditional Medicare and Medicare Advantage. Under this new initiative, Medicare beneficiaries can get the tests at no cost from eligible pharmacies and other entities; they do not need to pay for the tests and submit for reimbursement. Medicare Advantage plans can also opt to cover the cost of at-home tests, but this is not required.

Medicare covers diagnostic lab testing for COVID-19 under Part B. Medicare covers medically necessary clinical diagnostic laboratory tests when a doctor or other health practitioner orders them. Under revised rules finalized on September 2, 2020, a beneficiary may receive Medicare coverage for one COVID-19 and related test without the order of a physician or other health practitioner, but then must receive a physician order for any further COVID-19 testing. Medicare also covers serology tests (antibody tests), that can determine whether an individual has been infected with SARS-CoV-2, the virus that causes COVID-19, and developed antibodies to the virus. Medicare Advantage plans are required to cover all Medicare Part A and Part B services, including lab tests for COVID-19.

How much do Medicare beneficiaries pay for COVID-19 testing?

Under the Biden Administration’s initiative for Medicare to cover the cost of up to 8 at-home COVID tests per month for Medicare beneficiaries with Part B, Medicare beneficiaries can get the tests at no cost through eligible pharmacies and other entities during the COVID-19 public health emergency. According to other actions announced by the Biden Administration in December 2021, beneficiaries can also access free at-home tests through neighborhood sites such as health centers and rural clinics and can request four free at-home tests through a federal government website.

Medicare beneficiaries who get a lab test for COVID-19 are not required to pay the Part B deductible or any coinsurance for this test, because clinical diagnostic laboratory tests are covered under traditional Medicare at no cost sharing. Beneficiaries will also not face cost sharing for the COVID-19 serology test, since it is considered to be a diagnostic laboratory test. (Under traditional Medicare, beneficiaries typically face a $233 deductible for Part B services and coinsurance of 20 percent.)

A provision in the Families First Coronavirus Response Act also eliminates beneficiary cost sharing for COVID-19 testing-related services, including the associated physician visit or other outpatient visit (such as hospital observation, E-visit, or emergency department services). A testing-related service is a medical visit furnished during the emergency period that results in ordering or administering the test. The law also eliminates cost sharing for Medicare Advantage enrollees for both the COVID-19 test and testing-related services and prohibits the use of prior authorization or other utilization management requirements for these services.

Does Medicare cover treatment for COVID-19?

Patients who get seriously ill from the virus may need a variety of inpatient and outpatient services. Medicare covers inpatient hospital stays, skilled nursing facility (SNF) stays, some home health visits, and hospice care under Part A. If an inpatient hospitalization is required for treatment of COVID-19, this treatment will be covered for Medicare beneficiaries, including beneficiaries in traditional Medicare and those in Medicare Advantage plans. This includes treatment with therapeutics, such as remdesivir, that are authorized or approved for use in patients hospitalized with COVID-19, for which hospitals are reimbursed a fixed amount that includes the cost of any medicines a patient receives during the inpatient stay, as well as costs associated with other treatments and services. Beneficiaries who need post-acute care following a hospitalization have coverage of SNF stays, but Medicare does not cover long-term services and supports, such as extended stays in a nursing home.

Medicare covers outpatient services, including physician visits, physician-administered and infusion drugs, emergency ambulance transportation, and emergency room visits, under Part B. Based on program instruction, Medicare covers monoclonal antibody infusions, including remdesivir, that are provided in outpatient settings and used to treat mild to moderate COVID-19, even if they are authorized for use by the U.S. Food and Drug Administration (FDA) under an emergency use authorization (EUA), prior to full FDA approval.

Two oral antiviral treatments for COVID-19 from Pfizer and Merck have been authorized for use by the FDA. These treatments will likely be covered under Medicare Part D once they are approved by the FDA; however, the definition of a Part D covered drug does not include drugs authorized for use by the FDA but not FDA-approved. CMS recently issued guidance to Part D plan sponsors, including both stand-alone drug plans and Medicare Advantage prescription drug plans, that provides them flexibilities to offer these oral antivirals to their enrollees and strongly encourages them to do so, though this is not a requirement. In the near term, access to these drugs may be quite limited based on limited supply, although the federal government has purchased millions of doses of these drugs and is distributing them to states.

How much do Medicare beneficiaries pay for COVID-19 treatment?

Beneficiaries who are admitted to a hospital for treatment of COVID-19 would be subject to the Medicare Part A deductible of $1,556 per benefit period in 2022. Part A also requires daily copayments for extended inpatient hospital and SNF stays. For extended hospital stays, beneficiaries would pay a $389 copayment per day (days 61-90) and $778 per day for lifetime reserve days. If a patient is required to be quarantined in the hospital, even if they no longer meet the need for acute inpatient care and would otherwise by discharged, they would not be required to pay an additional deductible for quarantine in a hospital. Traditional Medicare beneficiaries who need post-acute care following a hospitalization would face copayments of $194.50 per day for extended days in a SNF (days 21-100).

For outpatient services covered under Part B, there is a $233 deductible in 2022 and 20 percent coinsurance that applies to most services, including physician visits and emergency ambulance transportation. However, according to a recent CMS program instruction, for COVID-19 monoclonal antibody treatment specifically, an infused treatment provided in outpatient settings, Medicare beneficiaries will pay no cost sharing and the deductible does not apply.

While most traditional Medicare beneficiaries (90% in 2018) have supplemental coverage (such as Medigap, retiree health benefits, or Medicaid) that covers some or all of their cost-sharing requirements, 5.6 million beneficiaries lacked supplemental coverage in 2018, which places them at greater risk of incurring high medical expenses or foregoing medical care due to costs. Medicare does not have an out-of-pocket limit for services covered under Medicare Parts A and B.

Cost-sharing requirements for beneficiaries in Medicare Advantage plans vary across plans. Medicare Advantage plans often charge daily copayments for inpatient hospital stays, emergency room services, and ambulance transportation. Medicare Advantage enrollees can be expected to face varying costs for a hospital stay depending on the length of stay and their plan’s cost-sharing amounts. According to CMS guidance, Medicare Advantage plans may waive or reduce cost sharing for COVID-19-related treatments, and most Medicare Advantage insurers temporarily waived such costs, but many of those waivers have expired. Plans may also waive prior authorization requirements that would apply to services related to COVID-19.

Does Medicare cover vaccines and boosters for COVID-19 and how much do beneficiaries pay?

Medicare Part B covers certain preventive vaccines (influenza, pneumococcal, and Hepatitis B), and these vaccines are not subject to Part B coinsurance and the deductible. Medicare Part B also covers vaccines related to medically necessary treatment. For traditional Medicare beneficiaries who need these medically necessary vaccines, the Part B deductible and 20 percent coinsurance would apply.

Based on a provision in the CARES Act, a vaccine that is approved by the FDA for COVID-19 is covered by Medicare under Part B with no cost sharing for Medicare beneficiaries for the vaccine or its administration; this applies to beneficiaries in both traditional Medicare and Medicare Advantage plans. Although the CARES Act specifically provided for Medicare coverage at no cost for COVID-19 vaccines licensed by the U.S. Food and Drug Administration (FDA), CMS has issued regulations requiring no-cost Medicare coverage of COVID-19 vaccines that are also authorized for use under an emergency use authorization (EUA) but not yet licensed by the FDA. This policy of providing vaccines without cost sharing to Medicare beneficiaries also applies to booster doses.

To date, the FDA has issued EUAs for three COVID-19 vaccines from Pfizer-BioNTech, Moderna, and Janssen, as well as boosters for Pfizer and Moderna after completing a primary series of the vaccine.

What telehealth benefits are covered by Medicare, and how much do beneficiaries pay?

Based on waiver authority included in the Coronavirus Preparedness and Response Supplemental Appropriations Act (and as amended by the CARES Act) the HHS Secretary has waived certain restrictions on Medicare coverage of telehealth services for traditional Medicare beneficiaries during the coronavirus public health emergency. The waiver, effective for services starting on March 6, 2020, allows beneficiaries in any geographic area to receive telehealth services; allows beneficiaries to remain in their homes for telehealth visits reimbursed by Medicare; allows telehealth visits to be delivered via smartphone with real-time audio/video interactive capabilities in lieu of other equipment; and removes the requirement that providers of telehealth services have treated the beneficiary receiving these services in the last three years. A separate provision in the CARES Act allows federally qualified health centers and rural health clinics to provide telehealth services to Medicare beneficiaries during the COVID-19 emergency period. The Consolidated Appropriations Act of 2022 extended these flexibilities for 151 days beginning on the first day after the end of the public health emergency.

Telehealth services are not limited to COVID-19 related services, and can include regular office visits, mental health counseling, and preventive health screenings. During the emergency period, Medicare will also cover some evaluation and management and patient education services provided to patients via audio-only telephone. Based on changes in the Consolidated Appropriations Act of 2021, Medicare has permanently removed geographic restrictions for mental health and substance use services and permanently allows beneficiaries to receive those services at home. Medicare also now permanently covers audio-only visits for mental health and substance use services.

Separate from the time-limited expanded availability of telehealth services, traditional Medicare also covers brief, “virtual check-ins” via telephone or captured video image, and E-visits, for all beneficiaries, regardless of whether they reside in a rural area. These visits are more limited in scope than a full telehealth visit, and there is no originating site requirement.

Medicare covers all types of telehealth services under Part B, so beneficiaries in traditional Medicare who use these benefits are subject to the Part B deductible of $233 in 2022 and 20 percent coinsurance. However, the HHS Office of Inspector General is providing flexibility for providers to reduce or waive cost sharing for telehealth visits during the COVID-19 public health emergency.

Medicare Advantage plans can offer additional telehealth benefits not covered by traditional Medicare, including telehealth visits for beneficiaries provided to enrollees in their own homes, and services provided outside of rural areas. Medicare Advantage plans have flexibility to waive certain requirements regarding coverage and cost sharing in cases of disaster or emergency, such as the COVID-19 outbreak. In response to the coronavirus pandemic, CMS has advised plans that they may waive or reduce cost sharing for telehealth services, as long as plans do this uniformly for all similarly situated enrollees.

Can Medicare beneficiaries get extended supplies of medication?

The Department of Homeland Security recommends that, in advance of a pandemic, people ensure they have a continuous supply of regular prescription drugs. In light of the coronavirus pandemic, a provision in the CARES Act requires Part D plans (both stand-alone drug plans and Medicare Advantage drug plans) to provide up to a 90-day (3 month) supply of covered Part D drugs to enrollees who request it during the public health emergency. (Typically Medicare Part D plans place limits on the amount of medication people can receive at one time and the frequency with which patients can refill their medications.)

According to CMS, for drugs covered under Part B, Medicare and its contractors make decisions locally and on a case-by-case basis as to whether to provide and pay for a greater-than-30 day supply of drugs.

What happens if Medicare beneficiaries in private plans need to receive care from out-of-network providers?

Plans that provide Medicare-covered benefits to Medicare beneficiaries, including stand-alone prescription drug plans and Medicare Advantage plans, typically have provider networks and limit the ability of enrollees to receive Medicare-covered services from out-of-network providers, or charge enrollees more when they receive services from out-of-network providers or pharmacies. In light of the declaration of a public health emergency in response to the coronavirus pandemic, certain special requirements with regard to out-of-network services are in place. During the period of the declared emergency, Medicare Advantage plans are required to cover services at out-of-network facilities that participate in Medicare, and charge enrollees who are affected by the emergency and who receive care at out-of-network facilities no more than they would face if they had received care at an in-network facility.

Part D plan sponsors are also required to ensure that their enrollees have adequate access to covered Part D drugs at out-of-network pharmacies when enrollees cannot reasonably be expected to use in-network pharmacies. Part D plans may also relax restrictions they may have in place with regard to various methods of delivery, such as mail or home delivery, to ensure access to needed medications for enrollees who may be unable to get to a retail pharmacy.

In response to the national emergency declaration related to the coronavirus pandemic, CMS has waived the requirement for a 3-day prior hospitalization for coverage of a skilled nursing facility (SNF) for those Medicare beneficiaries who need to be transferred as a result of the effect of a disaster or emergency. For beneficiaries who may have recently exhausted their SNF benefits, the waiver from CMS authorizes renewed SNF coverage without first having to start a new benefit period.

Nursing home residents who have Medicare coverage and who need inpatient hospital care, or other Part A, B, or D covered services related to testing and treatment of coronavirus disease, are entitled to those benefits in the same manner that community residents with Medicare are.

Medicare establishes quality and safety standards for nursing facilities with Medicare beds, and has issued guidance to facilities to help curb the spread of coronavirus infections. In the early months of the COVID-19 pandemic, the guidance directed nursing homes to restrict visitation by all visitors and non-essential health care personnel (except in compassionate care situations such as end-of-life), cancel communal dining and other group activities, actively screen residents and staff for symptoms of COVID-19, and use personal protective equipment (PPE).

More recently, CMS has issued reopening recommendations and updated guidance addressing safety standards for visitation in nursing homes to accommodate both indoor and outdoor visitation. Nursing facilities are also required to report COVID-19 data to the Centers for Disease Control and Prevention (CDC), including data on infections and deaths, COVID-19 vaccine status of residents and staff and provide information to residents and their families. They are also required to conduct weekly testing of staff if they are located in states with a positivity rate of 5% or greater.

Of note, CMS guidances to nursing facilities and data reporting requirements do not apply to assisted living facilities, which are regulated by states. Analysis has shown considerable variation across states when it comes to regulations to protect against the spread of coronavirus infections in assisted living facilities, as well as COVID-19 data reporting requirements.

Despite Improvements, Racial and Ethnic Disparities in Cancer Mortality Rates Persist

Authors: Michelle Tong, Latoya Hill, and Samantha Artiga
Published: Feb 3, 2022

Overall cancer mortality rates have decreased for all racial and ethnic groups, with the largest decrease among Black people.

However, Black people continued to have the highest risk of cancer death (169 per 100,000 people), even as the difference in cancer mortality rates for Black and White people narrowed and White people had the highest rate of new cancers. This increased mortality risk among Black people partly reflects a later stage of disease at diagnosis, although Black patients additionally have lower stage-specific survival for most cancer types. Overall cancer mortality rates were lower for Hispanic, American Indian and Alaska Native, and Asian and Pacific Islander people.

Equity in cancer diagnostics, therapeutics, and clinical trials is one of the goals in a relaunched “Cancer Moonshot” announced by the Biden administration, which aims to reduce the age-adjusted cancer death rate by at least half in the next 25 years. While noting a sharp drop in cancer screenings during the COVID-19 pandemic, the President’s Cancer Panel this week also made recommendations on increasing equitable access to cancer screening.

Our new brief has more on racial disparities in cancer outcomes, screening, and treatment. You can watch our Feb. 3 panel discussion on equity in cancer care here.

Racial Disparities in Cancer Outcomes, Screening, and Treatment

Authors: Michelle Tong, Latoya Hill, and Samantha Artiga
Published: Feb 3, 2022

Summary

Except for during surges in COVID-19 cases, cancer is the second leading cause of death in the U.S in both men and women nationally, with the majority of cancer related-deaths being due to breast, prostate, lung, and colon cancers. Racial disparities in cancer incidence and outcomes are well-documented, with research showing that they are driven by a combination of structural, economic, and socioenvironmental inequities that are rooted in racism and discrimination, as well as genetic and hereditary factors that may be influenced by the environment. Despite significant advancements and improvements in cancer outcomes and treatment over time, disparities persist.

This brief provides an overview of recent data on cancer incidence and mortality, risk factors, screening, treatment, and outcomes by race and ethnicity. It is based on KFF analysis of United States Cancer Statistics cancer incidence and mortality data (latest available data as of 2018), 2020 Behavioral Risk Factor Surveillance System cancer screening data, and published research. Although this brief focuses on racial disparities in cancer, disparities also occur across other dimensions, including socioeconomic status, exposure to risk factors, geographic location, and receipt of preventive measures.

Overall cancer incidence rates decreased for all racial and ethnic groups between 2013 and 2018, with the largest decreases among American Indian and Alaska Native (AIAN) and Black people. This decrease eliminated a disparity in overall cancer incidence for Black people, although they still have the highest incidence rate for some cancer types. Black people have higher new cancer rates for prostate, and colon and rectum cancer compared to other groups and one of the highest rates of new breast cancers. Moreover, across all cancers and for each cancer type, there are differences within racial and ethnic groups, such as by gender, country of origin, and geographic location.

Cancer mortality rates have also declined across all racial and ethnic groups, with the largest decrease among Black people, but Black people continued to have the highest cancer mortality rate in 2018. As is the case for cancer incidence rates, racial and ethnic patterns of cancer mortality vary by cancer type. Black people have the highest mortality rate for most leading cancer types, including female breast, prostate, and colon and rectum cancer. The higher mortality rate among Black people partly reflects a later stage of disease at diagnosis among Black patients, although Black patients additionally have lower stage-specific survival for most cancer types.

Research shows that the overall rate of cancer screening is lower among Black, Hispanic, Asian, and AIAN populations compared to their White counterparts. However, screening patterns vary across screening types, and people of color are more likely than White people to receive certain types of cancer screening. Data suggest that the COVID-19 pandemic contributed to decreases or delays in cancer screening, which may have exacerbated disparities in cancer screening.

Despite mixed findings regarding cancer screening disparities, research suggests people of color receive later stage diagnoses for some types of cancer compared to their White counterparts. For certain cancers, disparities in stage of diagnosis despite comparable screening rates may be related to screening guidelines not accounting for earlier onset and increased age-specific cancer incidence for different groups, as well as disparities in quality of screening techniques and delays in diagnostic evaluation. Racial disparities in cancer care and treatment have also been identified, particularly for diagnostic and treatment delays, which contribute to worse survival outcomes.

Research suggests that cancer disparities are driven by a combination of inequities within and beyond the health system that are rooted in racism and discrimination. People of color are more likely than their White counterparts to be uninsured and to face other barriers to accessing health care that may limit access to cancer screening, care, and treatment. Beyond health coverage and access to care, discrimination and bias within the health care system and disparities in exposure to risk factors, due largely to underlying social and economic inequities, also drive cancer disparities. While socioeconomic and health care access factors are primary drivers of cancer disparities, research also suggests that hereditary risk and genetic determinants for specific cancer subtypes may explain a portion of disparities. Underrepresentation of people of color in the development of current screening guidelines and in oncology cancer trials may also contribute to disparities.

Overall, the data suggest that continued efforts within and beyond the health care system will be important to reduce ongoing racial disparities in cancer. Within the health care system, these may include efforts to reduce gaps in health insurance, increase access to care, and eliminate discrimination and bias in care and treatment. Beyond the health care system, it will also be important to address broader social and economic factors, including exposure to environmental risks and disparities in behavioral risks. Furthermore, there are ongoing discussions about reevaluating the implications of current cancer screening guidelines for disparities and whether to adjust guidelines or cancer screening approaches to account for higher prevalence and risk and earlier age of onset for certain cancers among different communities. Moving forward, increasing diversity among oncology clinical trials and within the health care workforce also will be important for addressing disparities in cancer care and treatment and ensuring that all people benefit from continued advancements in cancer treatment.

Cancer Incidence by Race and Ethnicity

Overall cancer incidence rates decreased for all racial and ethnic groups between 2013 and 2018, with the largest decreases among AIAN and Black people (Figure 1). This decrease eliminated a disparity in overall cancer incidence for Black people, who had the highest rate of new cancers in 2013 but had a similar cancer incidence rate as White people in 2018. Among the four leading types of cancer, rates of new lung and bronchus and colon and rectum cancer decreased across all racial and ethnic groups from 2013 to 2018. Rates of new prostate cancer cases decreased for Black, Hispanic, and AIAN people, while they remained fairly stable for White and Asian and Pacific Islander people over the period. The decreases narrowed disparities in colon and rectum and prostate cancer incidence rates for Black people over the period. New female breast cancer rates also decreased for AIAN and Black people, while there were small increases in the breast cancer incidence rate for other groups.

Age-Adjusted Rate of Cancer Incidence per 100,000 by Race/Ethnicity, 2013 and 2018

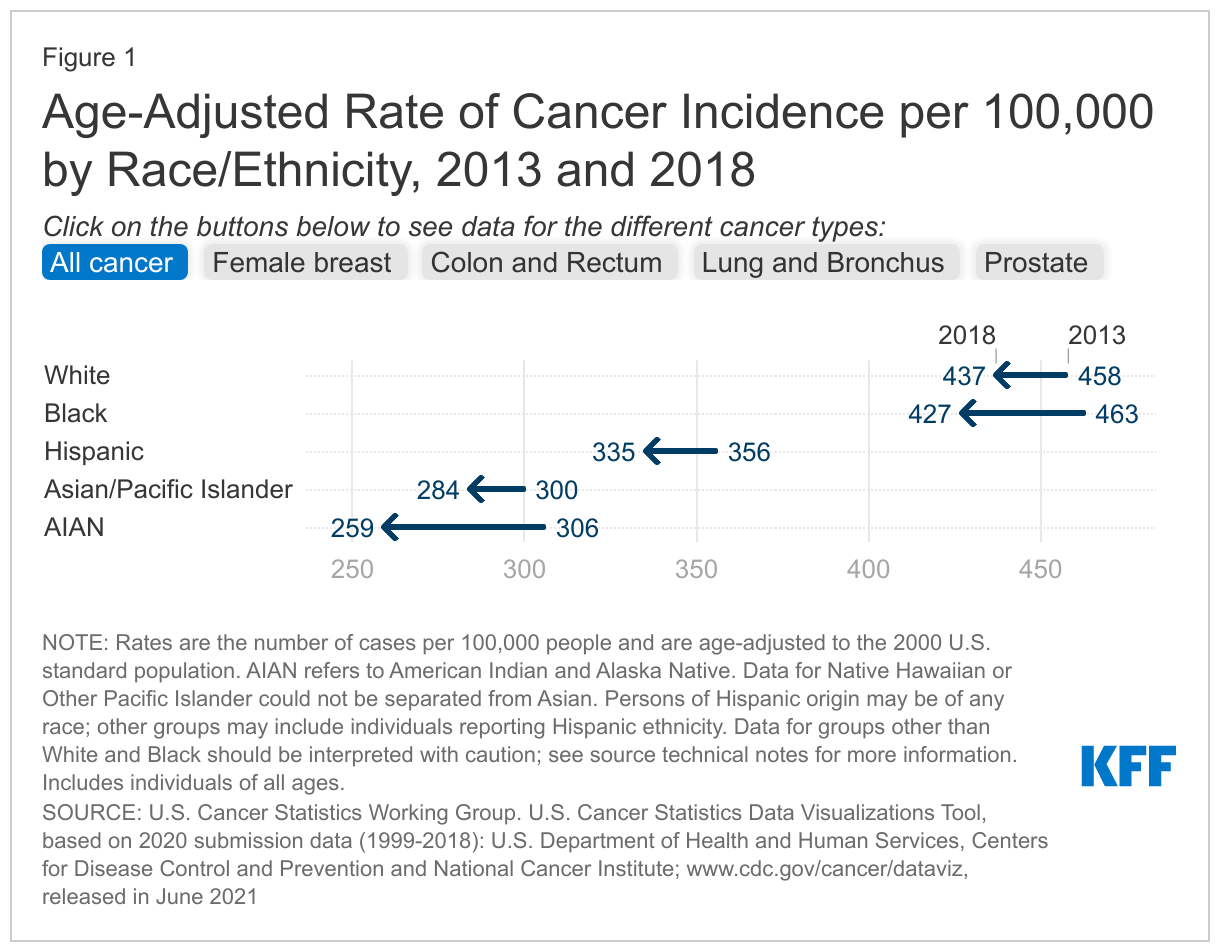
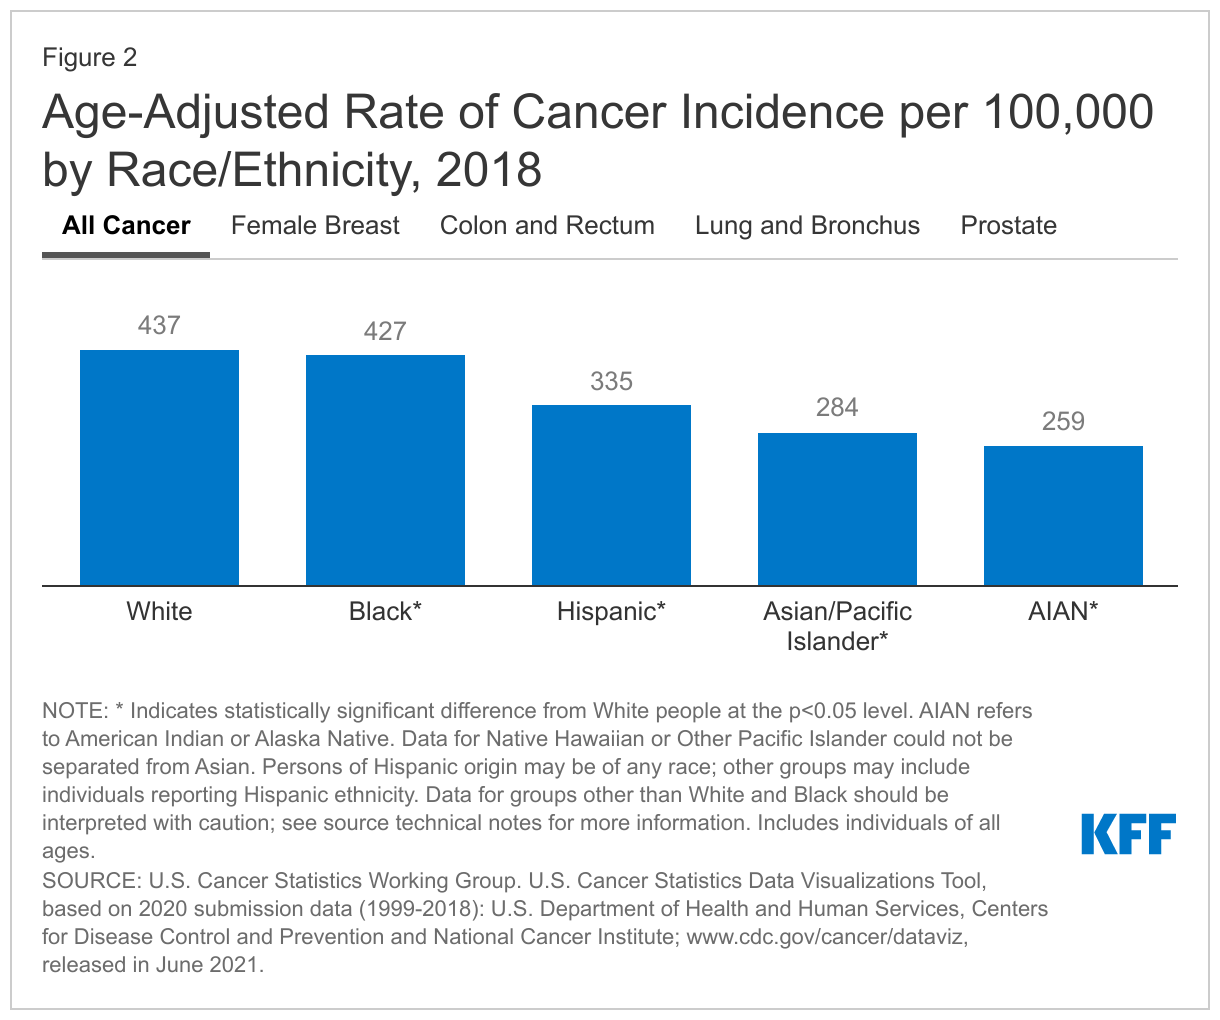
Overall, White and Black people have the highest rates of new cancers. Within the U.S., there were over 1.7 million new cancer cases reported in 2018, or 436 new cancer cases for every 100,000 people. White people had the highest rate of new cancers at 437 per 100,000 people, followed by Black people at 427 per 100,000 people, while cancer incidence rates were lower among Hispanic, Asian and Pacific Islander, and AIAN people. Although Asian and Pacific Islander (API) men and women have the lowest overall cancer incidence and mortality, they have among the highest liver and stomach cancer rates, roughly double the rates for White people.

Patterns of cancer incidence by race and ethnicity vary across cancer types. Female breast, prostate, lung and bronchus, and colon and rectum cancers had the highest rates of new cancers in 2018. Although White or Black people had the highest incident rates across these cancer types, patterns of incidence by race and ethnicity varied by type (Figure 2):

  • Female breast cancer. Like cancers overall, White people had the highest rate of new female breast cancers (128 per 100,000 females), followed by Black people (121 per 100,000 females). Other racial/ethnic groups had lower incidence rates, particularly AIAN people, whose new female breast cancer rate was roughly half the rate for White people at 65 per 100,000 females.
  • Prostate cancer. Black people had the highest rate of new prostate cancers at 164 per 100,000 males, followed by White people at 99 per 100,000 males and Hispanic people at 80 per 100,000 males. Asian and Pacific Islander and AIAN people were substantially less likely to have a new prostate cancer case, as their rates were more than three times lower than the rate for Black people.
  • Lung and bronchus cancer. Rates of new lung and bronchus cancer were similar for White and Black people at 55 and 54 per 100,000 people, respectively, while rates were lower for other groups and lowest for Hispanic people at 27 per 100,000.
  • Colon and rectum cancer. Black people had the highest rate of new colon and rectum cancer (40 per 100,000 people), followed by White and Hispanic people, at 36 and 33 per 100,000, respectively. The lowest rate of new colon and rectum cancers was among AIAN people at 26 per 100,000 people.
Age-Adjusted Rate of Cancer Incidence per 100,000 by Race/Ethnicity, 2018

Across all cancers and for each cancer type there are differences in incidence rates within racial and ethnic groups, such as by gender, geographic location, and country of origin. For example, overall cancer incidence rates were higher for men than women among White, Black, Hispanic, and AIAN people in 2018, while they were higher for women among Asian and Pacific Islander people. Black men have the highest rates of age-adjusted lung cancer incidence among all groups. In general, rural populations have higher incidence of preventable cancers and higher mortality compared to their urban counterparts, although cancer incidence is higher in urban areas for some types of cancer, such as breast and prostate cancer. Research further shows a similar pattern for people of color in rural areas, who generally have higher cancer incidence and mortality for preventable cancers compared to their urban counterparts. Other research has found that Black women in rural counties had higher incidence of regional cervical cancer than those in urban counties, and White women in rural counties had higher incidence than those in urban counties for cervical cancer at every stage, while there were no rural-urban differences among Hispanic women. Research also shows that, within racial and ethnic groups, there is wide variation in cancer incidence between U.S.-born and foreign-born people living in the U.S. For example, studies show that foreign-born Hispanic and Asian people have higher incidence of gastric cancer than their U.S. born counterparts, largely due to increased infection from H. pylori, which is endemic to multiple Latin American and Asian countries. However, compared to foreign-born Latino people, U.S.-born Latino people have higher rates of breast, colorectal, prostate, lung, and liver cancers, and U.S.-born Chinese and Filipina people have higher breast and colorectal cancer incidence compared to their foreign-born counterparts.

Cancer Mortality by Race and Ethnicity

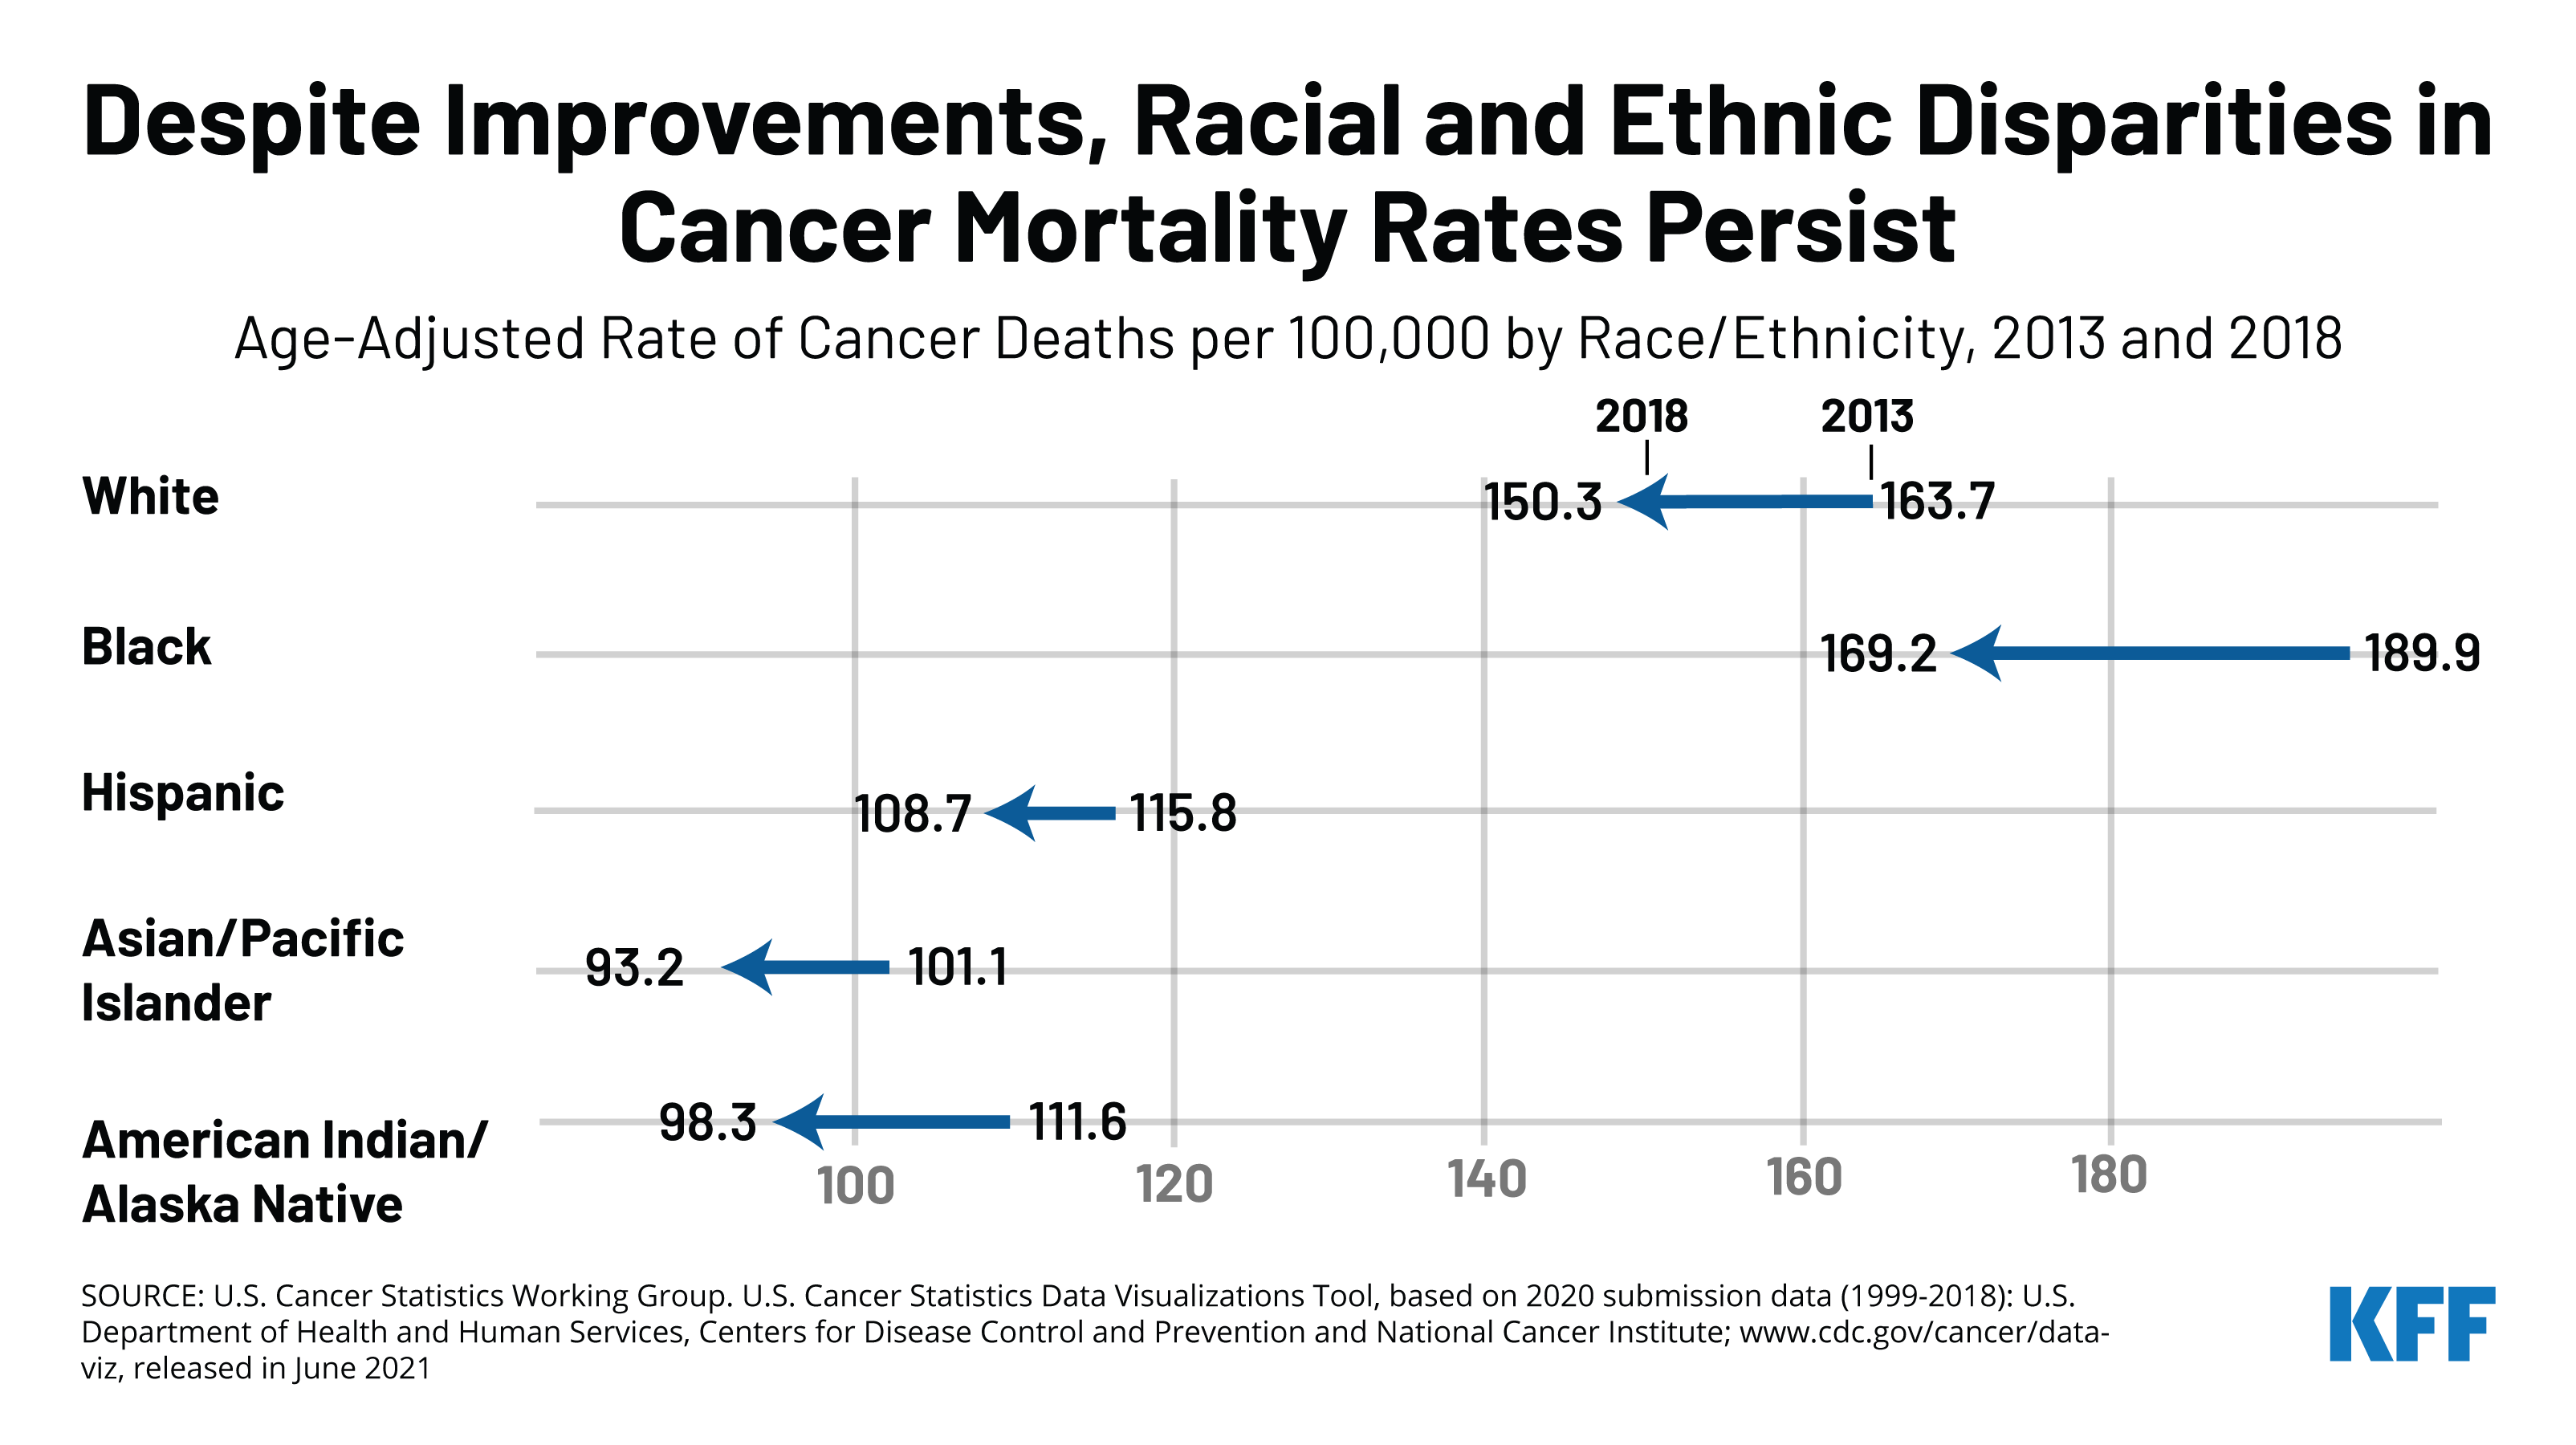
Overall cancer mortality rates decreased for all racial and ethnic groups, with the largest decrease among Black people, but Black people continued to have the highest cancer mortality rate in 2018 (Figure 3). Between 2013 and 2018, the difference between the overall cancer mortality rate for Black and White people narrowed, but Black people remained at higher risk for cancer death. Among the leading four types of cancer death, mortality rates for female breast cancer decreased for White, Black, and Hispanic people and increased for Asian and Pacific Islander and AIAN people. Colon and rectum and lung and bronchus cancer mortality rates decreased across all racial and ethnic groups, while prostate cancer mortality rates decreased for Black and AIAN people but remained fairly stable for White and Asian and Pacific Islander people. Decreases over the period narrowed disparities in mortality for Black people for colon and rectum, lung and bronchus, and prostate cancer, although they remained at higher risk for dying from colon and rectum and prostate cancer compared to White people. The decreases largely eliminated the difference in lung and bronchus mortality rates between Black and White people, while the difference in breast cancer mortality rates remained largely stable.

Age-Adjusted Rate of Cancer Deaths per 100,000 by Race/Ethnicity, 2013 and 2018

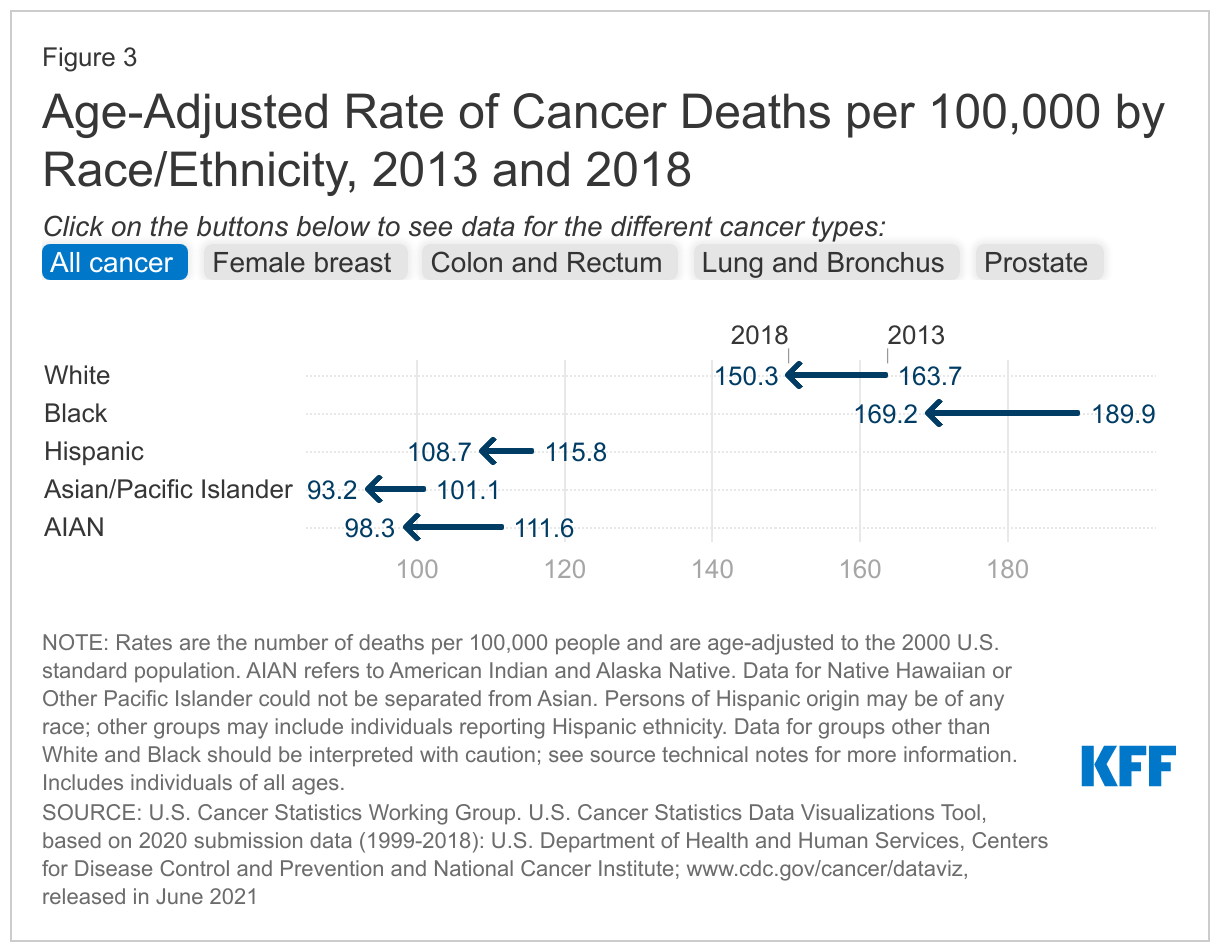
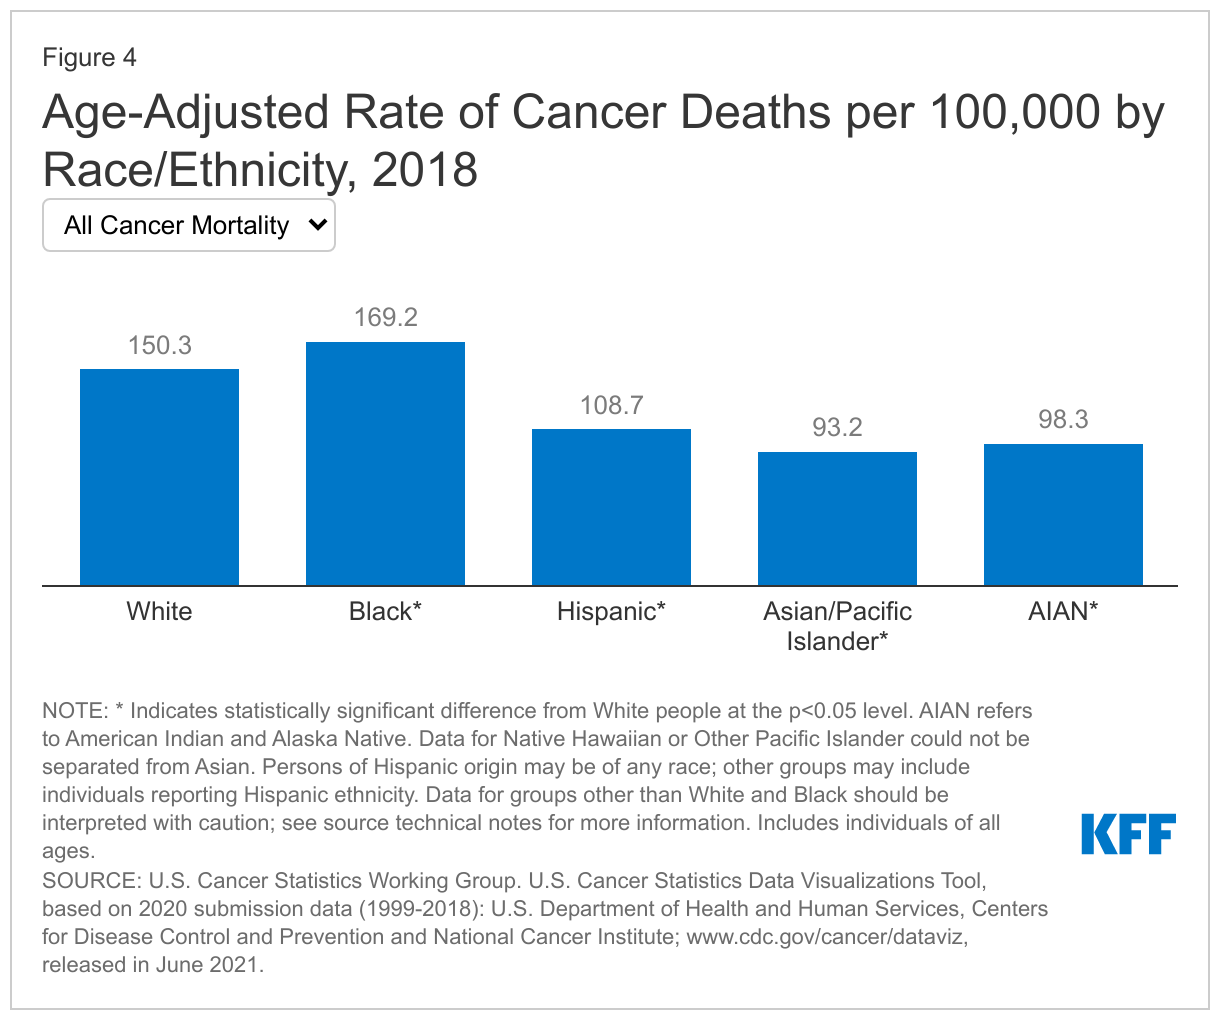
Black people are at the highest risk for cancer death even though White people have the highest rate of new cancers. This increased mortality risk partly reflects a later stage of disease at diagnosis among Black patients, although Black patients additionally have lower stage-specific survival for most cancer types. In 2018, Black people had the highest cancer mortality rate at 169 per 100,000 people, followed by White people at 150 per 100,000 (Figure 4). Rates were lower for Hispanic, AIAN, and Asian and Pacific Islander people. As is the case for cancer incidence rates, racial and ethnic patterns of cancer mortality vary by cancer type:

  • Female breast cancer. Black people had the highest rate of female breast cancer deaths (27 per 100,000 females) followed by White people (19 per 100,000 females), despite White people having the highest rate of new female breast cancers. Female breast cancer death rates for other groups were half or less than the rate for Black people.
  • Prostate cancer. Consistent with having the highest incidence of prostate cancer, Black people also had the highest rate of prostate cancer deaths, at 37 per 100,000 males, more than twice as high as the rates for all other groups, which ranged from 9.2 per 100,000 males for Asian and Pacific Islander people to 17.7 per 100,000 males for White people.
  • Lung and bronchus cancer. Like patterns in cancer incidence rates, Black and White people are at similar risk for lung and bronchus cancer death, with a mortality rate of 36 per 100,000 people for both groups. These rates are higher than rates for other groups, and more than double the rate for Hispanic people (15 per 100,000 people).
  • Colon and rectum cancer. Racial/ethnic patterns of colon and rectum cancer mortality rates also were similar to incidence patterns with Black people having the highest colon and rectum cancer death rate (17 per 100,000 people), followed by White people at 13 per 100,000 people and a slightly lower rate for Hispanic people at 11 per 100,000 people. Asian and Pacific Islander people had the lowest rate of death due to colon and rectum cancer at 9 per 100,000 people.
Age-Adjusted Rate of Cancer Deaths per 100,000 by Race/Ethnicity, 2018

As is the case for cancer incidence, across all cancers and for each cancer type there are differences in cancer mortality rates within racial and ethnic groups, such as by gender, country of origin, and geographic location. Across racial and ethnic groups, men have higher rates of cancer death compared to women. Notably, there exists variation in cancer mortality between U.S.-born and foreign-born Black people living in the U.S. For example, one study found that U.S.-born Black people experienced higher cancer mortality for cervical, lung and bronchus, colorectal, and prostate cancers compared to Black individuals from the Caribbean. Similarly, compared to foreign-born Latino people, U.S.-born Latino people have worse survival rates for breast, colorectal, prostate, lung, and liver cancers. In contrast, compared to foreign-born Asian people, U.S.-born Asian people experience lower mortality rates across multiple cancers, including breast, colon and rectum, and prostate cancers.

Cancer Screening, Diagnosis, and Treatment by Race and Ethnicity

Research shows that the overall rate of cancer screening is lower among Black, Hispanic, Asian, and AIAN populations compared to their White counterparts, but people of color are more likely than White people to receive certain types of screening. Reasons for these variations in screening patterns across different groups are not well understood. Research suggests that outside of health insurance coverage and geographic differences, participation in cancer screening is related to multiple factors, such as provider recommendation, shared decision-making between patients and providers, perceptions of cancer screening, and gender differences in cancer screening behaviors, which may vary across communities.

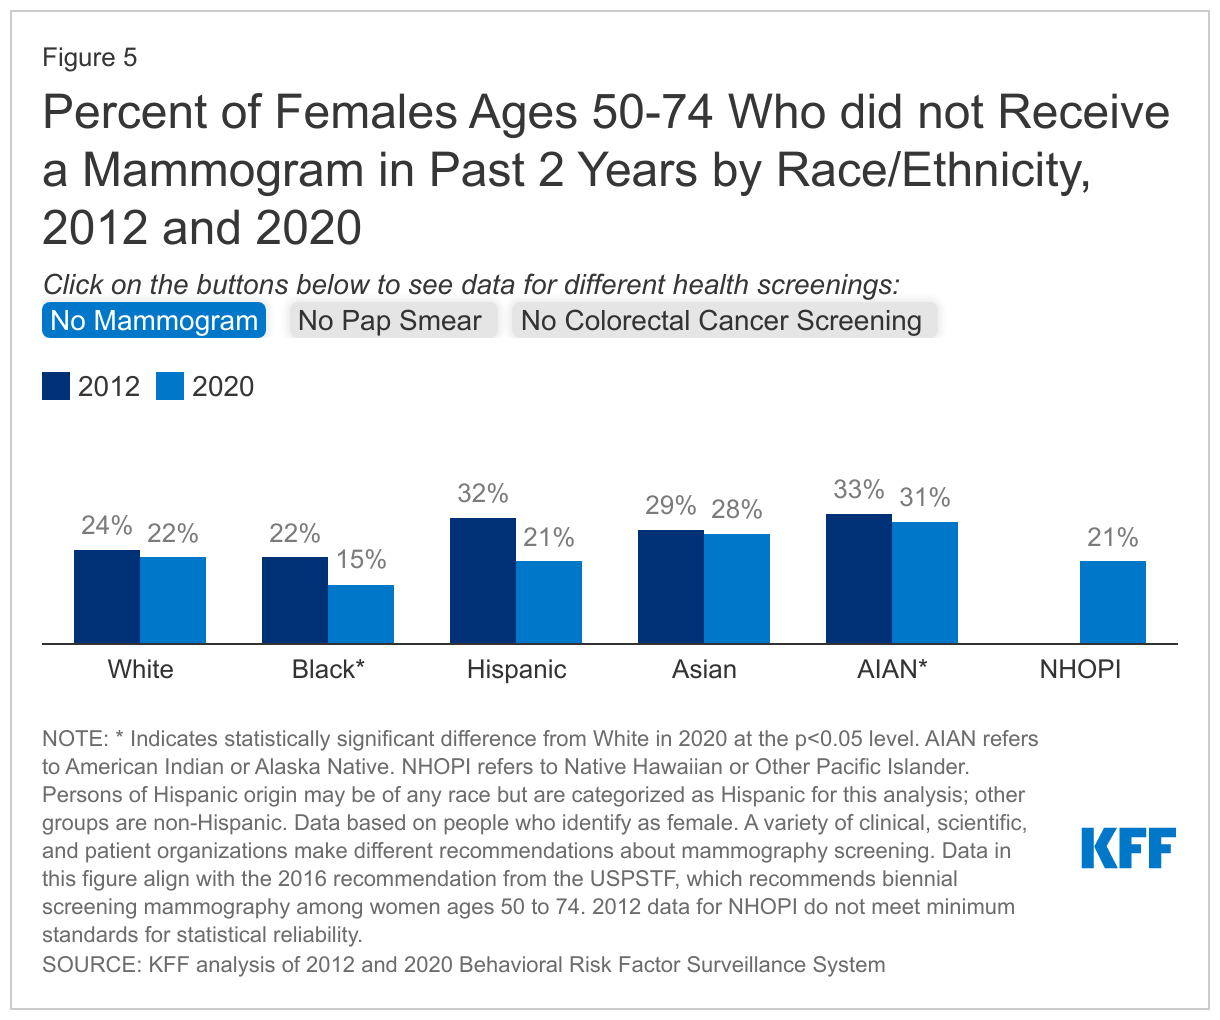
  • Mammograms. Since implementation of the Affordable Care Act coverage expansions, the share of people who have gone without a recent mammogram fell for some groups but did not change for other groups. Between 2012 (the latest year data are available prior to implementation of the ACA coverage expansions in 2014) and 2020, the share of people in the groups recommended for screening by the U.S. Preventive Services Task Force (USPSTF) who did not receive a recent mammogram fell for White, Black, and Hispanic people. There was no significant change for other groups. Hispanic people had the largest decrease, with the share falling by 11 percentage points from 32% to 21%, and Black people had a 7 percentage point decline from 22% to 15% (Figure 5). In contrast, White people had a smaller 2 percentage point decrease from 24% to 22%. The larger decrease for Hispanic people reversed a disparity and resulted in them being less likely than White people to go without a recent mammogram as of 2020 (21% vs. 22%). The share of Black people who did not receive a mammogram was already slightly lower than White people as of 2012 (22% vs. 24%), and this difference widened to 15% vs. 22% as of 2020. While this improvement likely, in part, reflects the implementation of focused interventions to decrease disparities in breast cancer screening, research also suggests that Black and Hispanic women are more likely than White women to overestimate their screening history. Native Hawaiian and Other Pacific Islander (NHOPI) people also were less likely than White people to go without a recent mammogram as of 2020, while Asian and AIAN people were more likely to go without a mammogram.
  • Pap smears. The share of people in the recommended groups for screening who did not receive a recent pap smear did not significantly change for most groups between 2012 and 2020. However, it increased from 17% to 22% for White people and from 31% to 36% for Asian people. As of 2020, Black people were less likely than White people to go without a recent pap smear (17% vs. 22%), while all other groups were more likely to have not received one, with the largest difference for Asian people (36% vs. 22%). However, research has found that Black women compared to all groups are the least likely to receive human papillomavirus (HPV) co-testing with pap smears.
  • Colorectal screening. The share of people in the recommended groups for screening who were not up-to-date with colorectal cancer screening decreased for most groups between 2012 and 2020. Native Hawaiian and Other Pacific Islander (NHOPI) people had the largest decrease, with the share falling by 18 percentage points from 46% to 28%, followed by Hispanic people who had a decrease of 10 percentage points, from 47% to 37%. As of 2020, Hispanic, Asian, and AIAN people were more likely than White people to not be up to date with colorectal cancer screening tests, while there were no significant differences between White and Black people in the recommended screening group.
  • Other research suggests that African American people face disparities in receipt of prostate screening relative to their increased risk. Similarly, eligible Black adults are less likely to undergo lung cancer screening compared to all other groups and less likely to complete subsequent annual screening for lung cancer compared to White patients. Individuals in rural areas, in general, are less likely to receive cancer screening compared to their urban counterparts, though these findings are mixed for different racial and ethnic groups.

Data suggest that the COVID-19 pandemic contributed to decreases or delays in cancer screening. Overall, health care use and spending dropped precipitously in the spring of 2020 when many social distancing measures were put in place to mitigate the spread of coronavirus. While health care use and spending began to rebound as the year progressed, overall spending remained down as of December 2020 due to a decrease in utilization of non-COVID medical care. Analysis from the Centers for Disease Control and Prevention (CDC) found that, during California’s stay-at-home order, cervical cancer screening rates among approximately 1.5 million women in the Kaiser Permanente Southern California (KPSC) network decreased approximately 80% compared with baseline. The decrease was similar across all racial/ethnic groups in the KPSC network and returned to near normal after reopening. According to an analysis of electronic health records by Epic Health Research Network, average weekly screenings for breast, colon, and cervical cancers dropped by 94%, 86%, and 94%, respectively, during January 20–April 21, 2020, relative to the averages before January 20, 2020. A follow-up study conducted in July 2020 showed that weekly screening rates were rising but had not yet reached pre-pandemic levels. Other research found that between January-June 2020, breast and cervical cancer screening rates fell among low-income women, with the highest decreases among AIAN, Asian and Pacific Islander, and Hispanic people. Subsequent research in Washington State found similar trends with greater reductions in breast cancer screening for communities of color compared to their White counterparts, and larger fall offs in screening for women in rural areas compared to urban areas during the pandemic. More recent research in Massachusetts found that over the remainder of 2020, while overall cancer screening appeared to have recovered (and even increased compared to pre-pandemic for all cancer screening, except for colonoscopy), the pandemic accentuated racial disparities in mammography for Black and Hispanic patients.

Percent of Females Ages 50-74 Who did not Receive a Mammogram in Past 2 Years by Race/Ethnicity, 2012 and 2020

Research suggests that people of color receive later stage diagnoses for some types of cancer compared to their White counterparts. For many cancers, stage of diagnosis may be one of the most important predictors of survival, where people diagnosed at earlier stages have better survival outcomes. For certain cancers, disparities in stage of diagnosis despite comparable screening rates may be related to screening guidelines not accounting for earlier onset and increased age-specific cancer incidence for different groups, as well as disparities in quality of screening techniques and delays in diagnostic evaluation. Furthermore, national surveys do not distinguish between screening and follow-up mammograms, which may contribute to overestimates of screening. Recent analysis from the American Cancer Society finds that, among people diagnosed with cancers for which screening is recommended (lung, colorectum, female breast, cervix, and prostate), Black people generally had the lowest proportion of localized-stage cancer and the highest proportion of distant-stage cancer compared with other racial and ethnic groups, except for prostate cancer, for which AIAN men had the highest proportion of distant-stage disease. Black people were also more likely than other groups to be diagnosed with advanced disease for most other cancer types. Other research shows that, compared to White patients, Black patients present with more advanced disease at diagnosis across prostate, breast, and cervical cancers. Research further shows that, across multiple tumor types, Black patients present with higher-grade and more aggressive disease compared to White patients, and among those with endometrial cancer, Black patients are more likely to have subtypes associated with worse outcomes. Hispanic people are more likely than White people to be diagnosed with distant stage lung cancer, yet have lower lung cancer mortality compared to both Black and White people. Prior work has also found that compared to White patients, AIAN patients have more advanced disease at diagnosis and worse survival outcomes for multiple cancers. For skin cancers, Black patients have the highest percentage of late-stage melanoma and increased mortality compared to White patients, likely secondary to a higher proportion of later stage diagnoses, although other studies have found that increased mortality rates persist even for earlier stage diagnoses.

Racial disparities in cancer care and treatment have also been identified, particularly for diagnostic and treatment delays, which contribute to worse survival outcomes. Evidence suggests that Black patients are less likely than White patients to receive stage-appropriate treatment or guideline-concordant care across multiple types of invasive cancers. Compared to White patients, Black patients are less likely to receive a lung cancer screening after receiving a referral, are less likely to receive a provider recommendation for surgery for lung cancer, and are more likely to refuse surgery after it is recommended. Black people also are treated less frequently with chemotherapy and radiation for colorectal cancer. Furthermore, research has found lower rates of provider recommendation for colorectal screening for Black patients compared to their White counterparts. For breast and gynecological cancers, Black and Hispanic women are less likely than White women to receive certain evidence-based workup procedures or guideline recommended treatments. Other work has found that, compared to White women with similar treatment plans, Black women more often have delays in breast cancer treatment initiation. Research has similarly found that compared to White patients, Black and Hispanic patients have increased delays in receipt of surgery for breast cancer. While less studied, work has found that Asian women have a higher rate of receiving no follow-up after abnormal breast cancer screening compared to White women, with these differences being starkest among Filipina and Vietnamese women.

People of color are also more likely to report unmet needs for cancer care, including supportive care. Across communities of color, unmet socioeconomic and supportive care needs are linked to poor cancer therapy adherence. Even after adjusting for differences in socioeconomic status and health system access, research finds that U.S.-born Black people and foreign-born Latino and Asian people are more likely to perceive an unmet need in cancer care than U.S.-born White people. Furthermore, Hispanic cancer survivors report worse quality of life and unmet supportive care needs (including information about disease, psychological support, pain management, and treatment side effects) compared to White cancer survivors. Similar work has identified a high prevalence of unmet needs in physical health concerns, emotional support, and daily activity challenges for Asian and Pacific Islander cancer survivors and a shortage of patient navigators and support groups for AIAN cancer survivors.

Factors Contributing to Racial Cancer Disparities

Research suggests that racial cancer disparities are driven by a combination of inequities in health coverage and access to care, social and economic factors, and care and treatment that are rooted in racism and discrimination. Moreover, some research suggests that hereditary risk and genetic determinants for specific subtypes of cancer, in addition to environmental influences on genetic expression, may also explain a portion of disparities.

People of color are more likely than their White counterparts to be uninsured and to face other barriers to accessing health care that may limit access to cancer screening, care, and treatment. Data show that people of color are less likely to have health insurance and more likely to face barriers to accessing care, such as not having a usual source of care. Research shows that, overall, uninsured people are more likely than those with insurance to go without needed medical care due to cost and less likely to receive preventive care and services. Research further shows that financial barriers and lack of health insurance prevent adequate cancer care and management and are associated with lower screening, delays in diagnosis, decreased receipt of cancer therapies, and lower treatment adherence. One study found that Hispanic and African American women were more likely than White women to experience delays in receiving adjuvant chemotherapy for breast cancer, and that insurance status was an important factor contributing to these delays. Research also finds that Black and Hispanic cancer patients are more likely than White patients to forego needed cancer treatment because of problems with transportation and that Black patients are more likely to report health care costs as a barrier to cancer care follow-up. Other work shows that lack of doctor recommendations, increased health literacy risks, and competing priorities (working multiple jobs, needing to reschedule physician appointments, and low family income) contribute to differences in receipt of breast cancer screening and pap smear testing among Black and Hispanic women. Among AIAN people, decreased availability of endoscopic services within Indian Health Service and tribal facilities, in addition to underfunded referral systems may contribute to more limited screening compared to the rest of the U.S. population.

Beyond health coverage and access to care, discrimination and bias within the health care system may contribute to cancer disparities. A significant and longstanding body of research suggests that provider and institutional bias and discrimination are drivers of racial health disparities, contributing to racial differences in diagnosis, prognosis, and treatment decisions and differences in experiences obtaining health care. For example, KFF survey data show that Black and Hispanic adults are more likely to report some negative experiences with health care providers, including providers not believing they were telling the truth or refusing to provide pain medication or other treatments they thought they needed. Furthermore, recent research has found that Black patients are over twice as likely as White patients to have at least one negative descriptor in the history and physical notes of their electronic health record. Research finds that women perceiving racial or ethnic-based medical discrimination were less likely to be screened for colorectal and breast cancer compared to those not perceiving discrimination. Other studies have not found a link between race-based discrimination and receipt of cancer screening but have found that perceived discrimination due to other reasons such as age or gender is associated with decreased receipt of pap smears and mammography.

Research also points to the role of communication and interactions between providers and patients in driving disparities. This work suggests that enhancing providers’ ability to provide culturally and linguistically appropriate care, as well as increasing diversity of the health care workforce, may help address health disparities. For example, research shows that limited health literacy and limited English proficiency is associated with a decreased likelihood of breast and colorectal cancer screening among Chinese Americans. Other work finds that disparities in cancer screening among immigrants reflect a combination of cultural beliefs and attitudes, lack of knowledge, and barriers to access, which the authors conclude highlight the importance of developing culturally sensitive interventions to increase cancer screening uptake among these communities. Experiences suggest that socio-culturally and individually-tailored education and outreach, community level interventions which often rely on community health workers or religious leaders, and changes at the health systems level, such as direct referral to cancer screening from primary care providers and increased clinical equipment and staffing, may improve cancer screening and follow-up for people of color.

Disparities in exposure to risk factors, due largely to underlying social and economic inequities, drive cancer disparities. For example, historic housing policies, including redlining, and ongoing economic inequities have resulted in residential segregation that pushed many low-income people and people of color into segregated urban neighborhoods. Many of these neighborhoods have dense industrial facilities that result in high exposure to harmful air toxins. Reflecting these patterns, research finds higher exposure to air toxins that pose cancer risks in neighborhoods with concentrated shares of African American people compared to neighborhoods with higher shares of White people. Similarly, in California, higher exposure to pesticides is associated with increased rates of testicular germ cell cancer, particularly among Latino people. Beyond exposure to environmental risks, certain health behaviors may influence cancer risks and outcomes, such as smoking, obesity, alcohol consumption, and limited physical activity. These individual health behaviors are often shaped by broader social and economic factors, such as access to healthy food, financial ability to purchase food, availability of green space, and time to engage in leisure activities. Data show that AIAN and Black adults are more likely than White adults to smoke, while Asian and Hispanic adults have lower smoking rates. Moreover, Black, AIAN, NHOPI, and Hispanic adults are more likely to be obese than White adults, while Asian adults are less likely to be obese. Research further suggests that Latino and African American people are more likely than their White counterparts to have multiple behavioral risks that may contribute to cancer risk. However, research also finds that Black patients diagnosed with lung cancer are less likely to be chronic smokers compared to White patients and that, even at lower levels of smoking, Black and AIAN patients have higher rates of lung cancer compared to White patients, suggesting that smoking may not be the main driver of lung cancer disparities for these groups. Increased prevalence of comorbidities among people of color, such as diabetes, may also influence disparities in cancer survival and treatment outcomes. Moreover, foreign-born Asian and Latino people may face an increased risk for specific cancers associated with infection with cancer-associated pathogens that have higher incidence in their countries of origin.

While socioeconomic and health care access factors are primary drivers of cancer disparities, research also suggests that hereditary risk and genetic determinants for specific cancer subtypes may explain a portion of disparities. Some genetic determinants may influence susceptibility due to genetic variants or cancer-driven gene mutations in obesity, chronic inflammation, and immune responses. Research further suggests that environmental influences on gene expression may play a role in explaining racial disparities in cancer incidence and progression. For breast cancer, American Cancer Society analyses consistently find that Black people have the second highest incidence rate for female breast cancers after White people, but disproportionately higher rates of triple negative breast cancers and increased likelihood of being diagnosed with high-grade and metastatic breast cancer compared to all other groups. Hormone receptor status for breast cancers is a significant factor contributing to survival disparities, with triple negative breast cancers being less likely to be detected through screening and associated with worse prognosis, high frequency of metastasis, and lower survival compared to other breast cancer subtypes. Research has linked a higher prevalence of triple negative breast cancers among Black women to West African ancestry and specific birthplace. However, prior research has noted that tumor biological differences may contribute less to racial disparities in cancer outcomes compared to health care access barriers, and that there are no racial differences in efficacy of local or systemic therapy for breast, lung, or colorectal cancers.

Current screening guidelines for some cancers may also contribute to disparities by not accounting for differences in cancer risk across communities. Cancer screening guidelines have been developed based on clinical trials that largely underrepresented communities of color and, as such, may not reflect variations in cancer incidence and risk factors among different groups. In 2020, the American Thoracic Society released a statement noting that lung cancer screening guidelines do not recognize disparities in smoking behaviors or lung cancer risk and suggesting that researchers, providers, and professional organizations should consider an approach that includes eligibility assessments for high-risk individuals who are excluded under the guidelines. Research showed that under these USPSTF screening guidelines African American and Hispanic people were less likely than White people to be eligible for lung cancer screening despite having equal or greater risk of lung cancer compared to White smokers. Although the screening guidelines were updated in March 2021, this research further found that while the shares of people eligible for screening increased across groups, these disparities persisted. Moreover, some researchers have suggested that separate prostate cancer screening guidelines should be utilized for African American men given their higher rates of incidence and mortality, pointing to the lack of racial diversity in the studies upon which existing guidelines are based. For breast cancer, work has suggested promoting screening before the age of 50 to reduce mortality disparities, given the younger age of onset and higher incidence of certain cancer types among Black women. The USPSTF currently recommends breast cancer screening prior to the age of 50 as a Grade C guideline, which means it is suggested providers offer or provide this service for selected patients depending on individual circumstances. For colon cancer, there have similarly been efforts to lower the age to begin screening to 45 years for Black patients. As of May 2021, USPSTF guidelines were updated to begin colorectal cancer screening at age 45 as a Grade B recommendation, meaning it is suggested that providers offer the service to all eligible people. This change was made to reflect increasing colorectal cancer incidence at a younger age in the general U.S. population and higher rates among Black and AIAN people.

Underrepresentation of Black and Hispanic adults and other people of color in oncology clinical trials may contribute to cancer treatment and mortality disparities. Research has identified multiple barriers to participation in clinical trials for people of color, including lack of understanding and information about trials, fear and stigma of participating, and time and resource constraints associated with trial participation (including financial burden, time commitment, transportation, and compensation). Furthermore, research suggests that physicians are less likely to discuss clinical trials with patients of color and that trials may exclude a significant portion of Black patients due to co-existing comorbidities or lab cutoffs. Research has found that when offered to participate, at least half of patients offered participation in a clinical trial do participate, and that Black patients participate in clinical trials at similar rates compared to White patients. Moreover, previously limited coverage of clinical trial participation by Medicaid may have exacerbated underrepresentation in trials, given that people of color are disproportionately covered through Medicaid. In 2021, the Centers for Medicare and Medicaid Services issued new requirements for all states to cover routine patient costs associated with clinical trial participation. However, Medicaid does not cover ancillary costs of trial participation, such as those related to childcare and employment. Medicaid does offer a separate non-emergency medical transportation benefit, while the Food and Drug Administration does not consider reimbursement for travel expenses to and from clinical trial sites or associated costs.

Looking Ahead

Overall, the data suggest that continued efforts within and beyond the health care system will be important to reduce ongoing racial disparities in cancer, many of which are rooted in systemic racism. Within the health care system, these may include ongoing efforts to reduce gaps in health insurance, increase access to care, and eliminate discrimination and bias. Beyond the health care system, addressing broader social and economic factors, including exposure to environmental risks and disparities in behavioral risks will also be important. Furthermore, there are ongoing discussions about reevaluating the implications of current cancer screening guidelines for disparities and whether to adjust guidelines or screening approaches to account for higher prevalence and risk for cancers among different communities. Moving forward, increasing diversity among oncology clinical trials and within the health care workforce will also be important for addressing disparities in cancer care and treatment, and ensuring that all people benefit from continued advancements in cancer treatment.