KFF designs, conducts and analyzes original public opinion and survey research on Americans’ attitudes, knowledge, and experiences with the health care system to help amplify the public’s voice in major national debates.
COVID-19 Vaccination Rates Among Nursing Home Staff Have Risen by 25 Percentage Points Since the Biden Administration Announced a Vaccination Mandate for Health Care Workers Last Year
Vaccine Mandate Does Not Appear to Have Exacerbated Staffing Shortages, Analysts Find
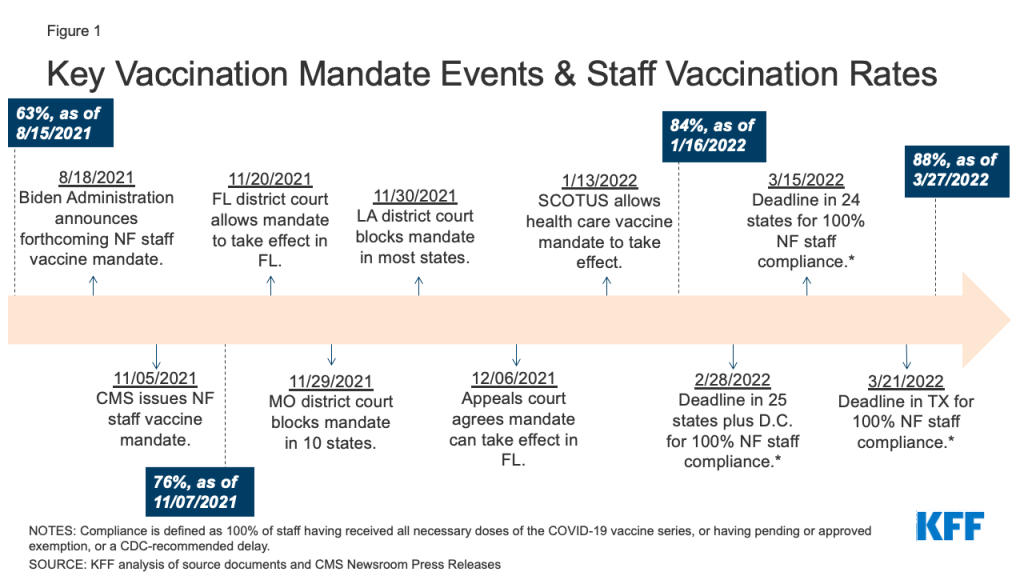
In a new analysis, KFF researchers find that COVID-19 vaccination rates among nursing home staff increased by 25 percentage points nationally (63% to 88%) from when the Biden administration announced the vaccine mandate for health care workers in August 2021 to after vaccination deadlines passed in March 2022.
Researchers analyzed nursing home-level data from the federal government covering some 14,700 nursing homes, or about 97 percent of all nursing homes in the U.S. They conclude that while a number of factors may have been at work, it appears that the mandate contributed to the increases in staff vaccination rates.
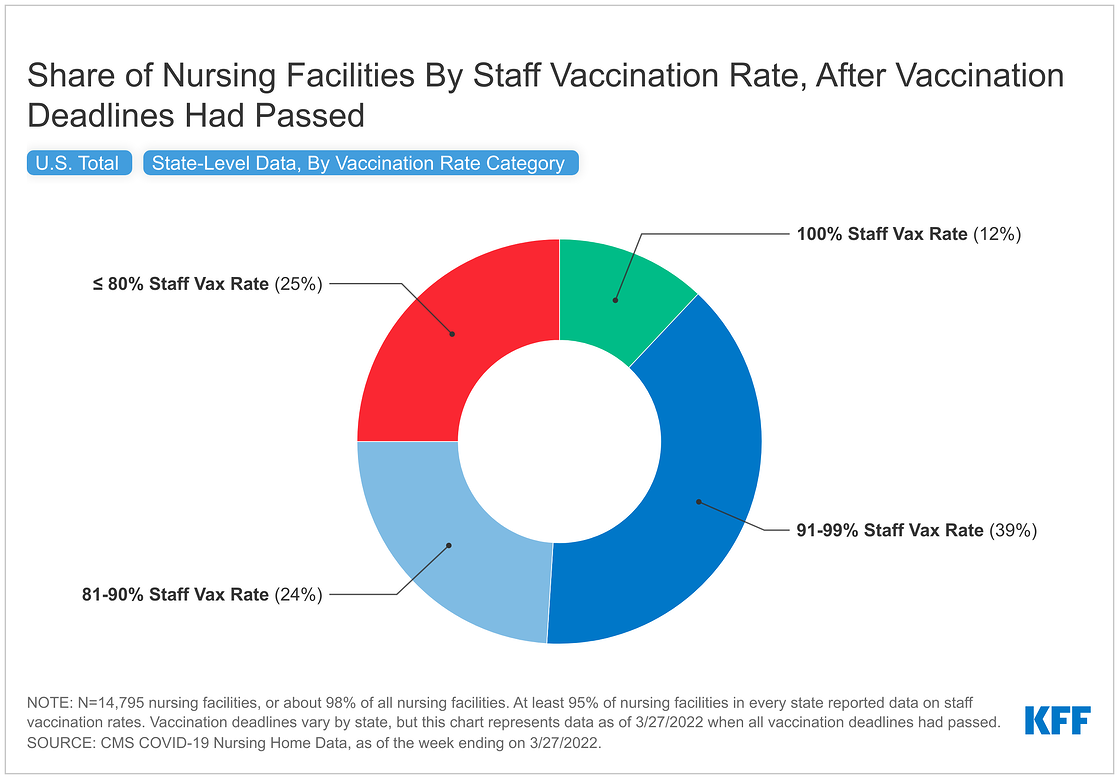
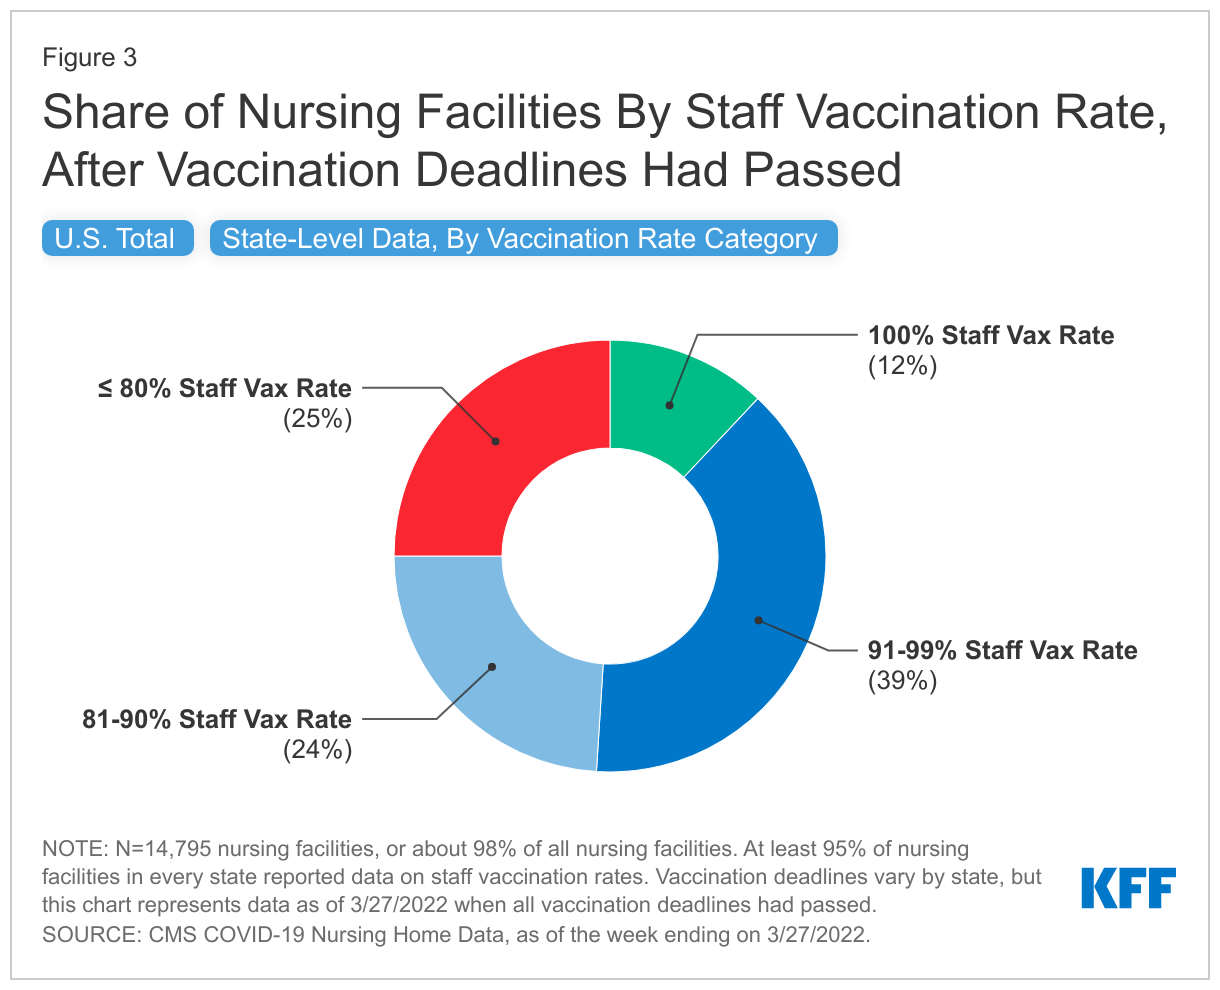
As of March 2022, 12 percent of nursing homes nationally reported that 100 percent of their staff were fully vaccinated, while 39 percent reported staff vaccination rates of over 90 percent but less than 100 percent. The remaining 49 percent of nursing homes reported that fewer than 90 percent of their staff had been fully vaccinated.
While the federal mandate does not explicitly require booster shots, the national booster rate for nursing home staff was 44 percent as of March 2022.
Some nursing home operators warned that requiring health care workers to be vaccinated against COVID-19 could contribute to staffing shortages. Data suggest that the vaccine mandate has not exacerbated such shortages, however.
KFF analysts find that 28 percent of nursing homes in the U.S. reported staffing shortages as of March 2022, down slightly from the peak in January 2022 where nearly one in every three nursing homes reported a shortage.
Staff shortages in nursing homes are a longstanding problem that predates the pandemic. In a separate analysis also released today, KFF analysts summarize federal and state standards related to nursing home staffing prior to COVID-19 and identify changes that states have made to minimum staffing requirements during the pandemic. They also examine state legislative and regulatory actions since the onset of the pandemic that directly affect worker wages and training requirements.
The Biden administration has announced plans to propose new federal minimum staffing adequacy regulations in the next year, and the National Academies of Science, Engineering, and Medicine recently recommended minimum staffing levels as part of its comprehensive report on ways to improve nursing home quality.
Conditions and COVID-19 precautions in nursing homes remain a subject of heightened public interest since over one in five COVID-19 deaths during the pandemic has been in a long-term care facility. While the vaccine mandate remains in effect, litigation challenging the new rule is ongoing. Although cases in Texas and Florida were dismissed after the Supreme Court allowed the rule to take effect, cases in Missouri and Louisiana are still pending.
Over one in five COVID-19 deaths has been in a long-term care facility since the start of the pandemic. Due to the disproportionate impact of COVID-19 on this population early in the pandemic, vaccinations of nursing facility residents and staff were a high priority when the vaccine rollout began in Winter 2020-2021. Since then, the Centers for Medicare and Medicaid Services (CMS) has implemented a health care worker vaccination mandate, which does not include booster shots, for nursing facilities and other providers that participate in Medicare and/or Medicaid. Although some states sued to challenge this rule, the Supreme Court allowed the mandate to take effect while those cases are resolved by the lower courts.
This analysis uses nursing facility-level data reported by the federal government to track the increase in vaccination rates among nursing facility staff nationally and by state between August 2021 (when the vaccine mandate was first announced) and March 27th, 2022 (after the vaccine deadline for health workers had passed in all states), building on a previous data note. Additionally, this analysis provides state-level information on booster rates among nursing home staff and the prevalence of staffing shortages after all vaccination deadlines had passed. Approximately 14,700 nursing facilities (or about 97% of all nursing facilities) are included in this analysis, and at least 95% of facilities in each state reported reliable data. See methods for more details.
While this analysis does not directly attribute the increase in vaccination rates to the mandate, since many factors could affect these measures, the trends are nonetheless helpful for understanding the impact of different policies on rates of infections, hospitalization, and deaths attributable to COVID over time. Key findings from our analysis include:
Vaccination Rates: Nursing facility staff vaccination rates increased nationally by 25 percentage points, from 63% to 88%, between August 2021 and March 2022 (Figures 1 and 2). As of March 2022, 12% of nursing facilities nationally reported 100% staff vaccination rates, and 39% of facilities reported rates over 90% but less than 100% (Figure 3). The remaining 49% of facilities reported rates of 90% or below. These data cannot be used to estimate the share of facilities in each state that comply with the mandate since data do not account for vaccine exemptions.
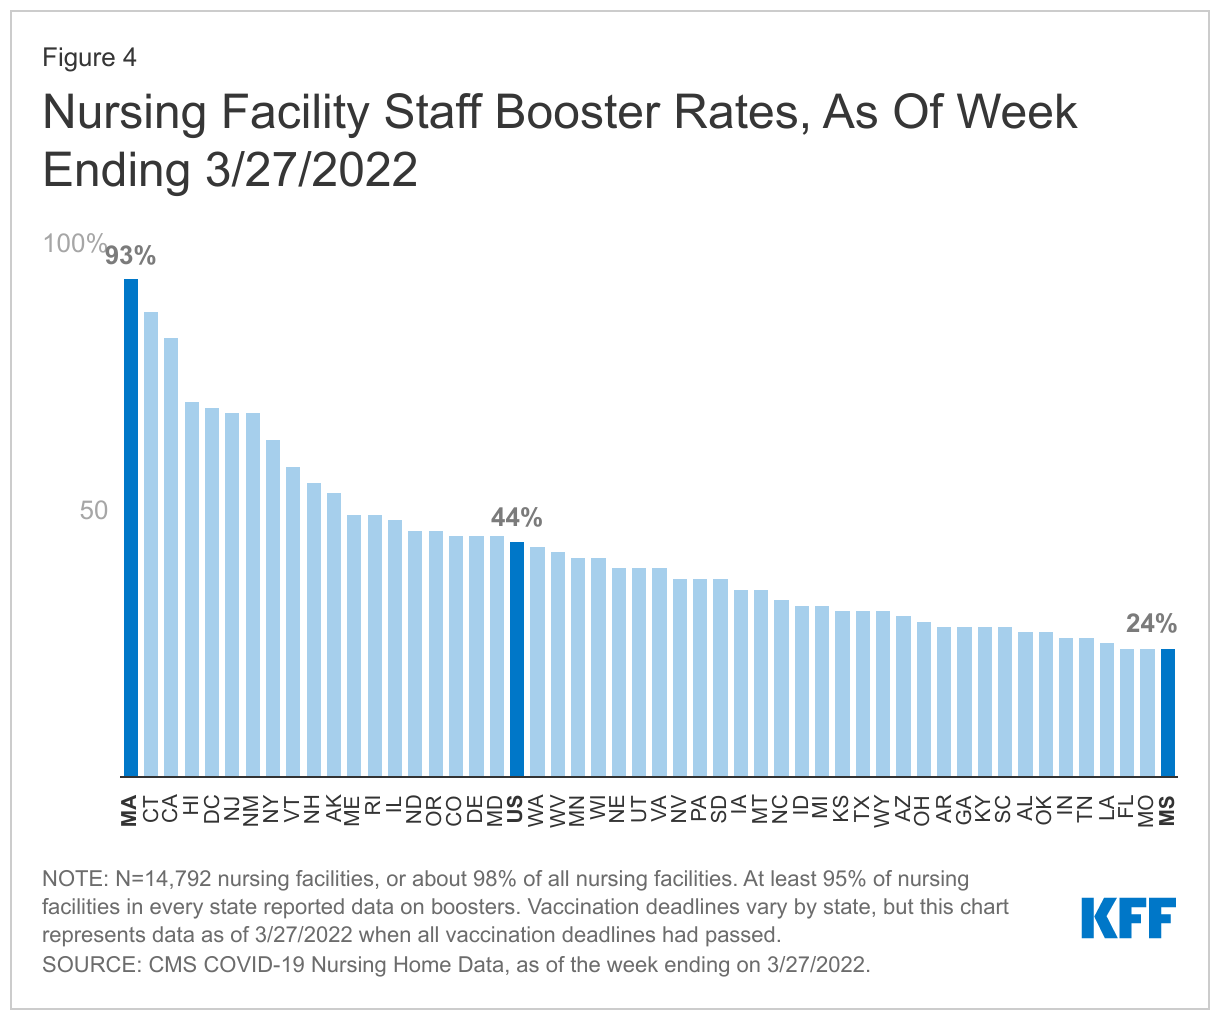
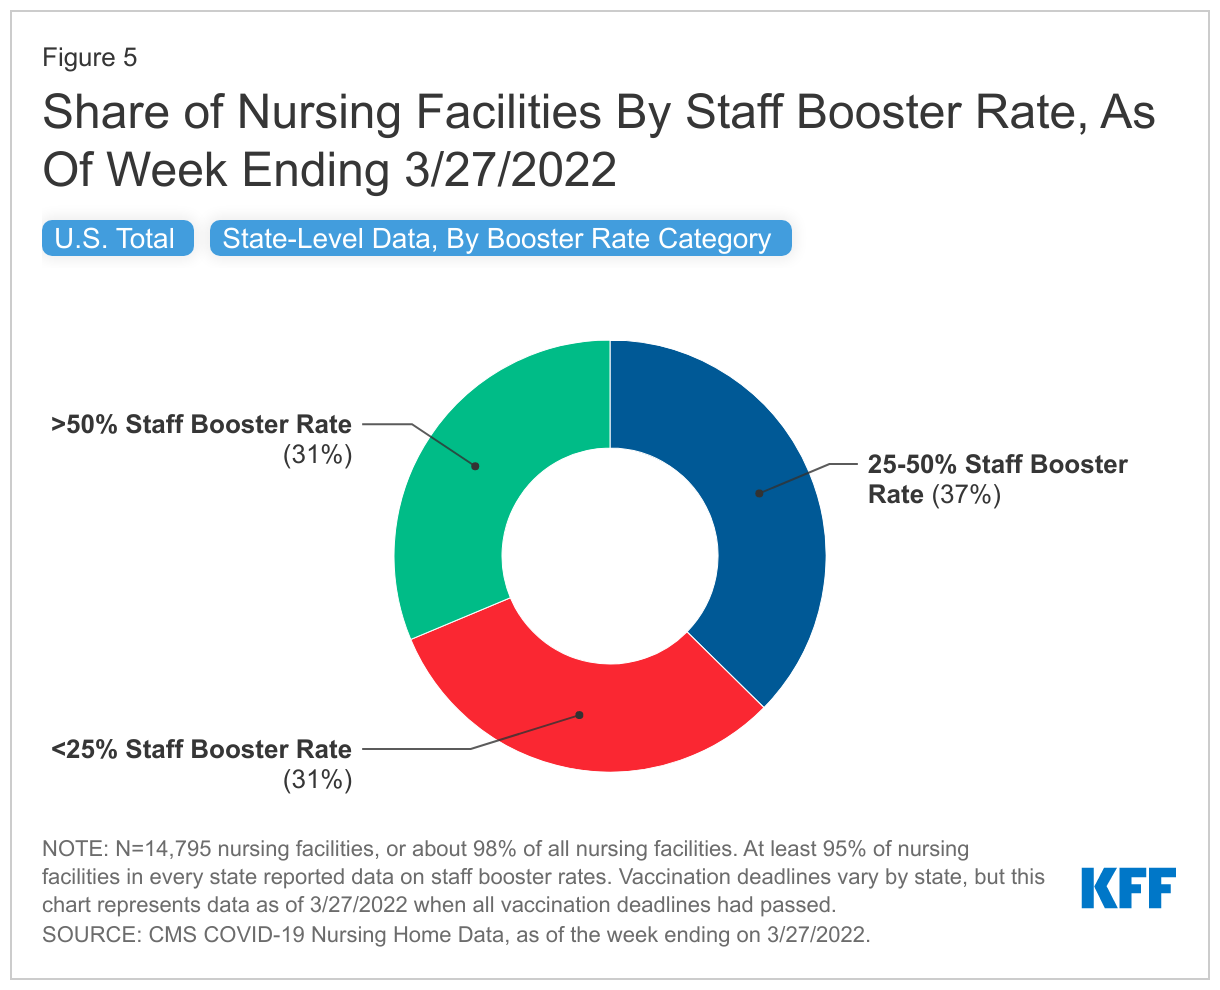
Booster Rates: As of March 2022, the national booster rate for nursing facility staff was 44%, ranging from 93% in MA to 24% in FL, MO, and MS (Figure 4). While the federal mandate does not explicitly require booster shots, five states (CT, MA, NJ, NY, and CA) that reported a greater than 30-percentage point increase in booster rates from January 2022 to March 2022, as well as some of the highest booster rates in March 2022, had state-level booster mandates during this time period. Nationally, about one-third of facilities reported booster rates among nursing facility staff higher than 50%, while another one-third of facilities reported booster rates under 25% (Figure 5).
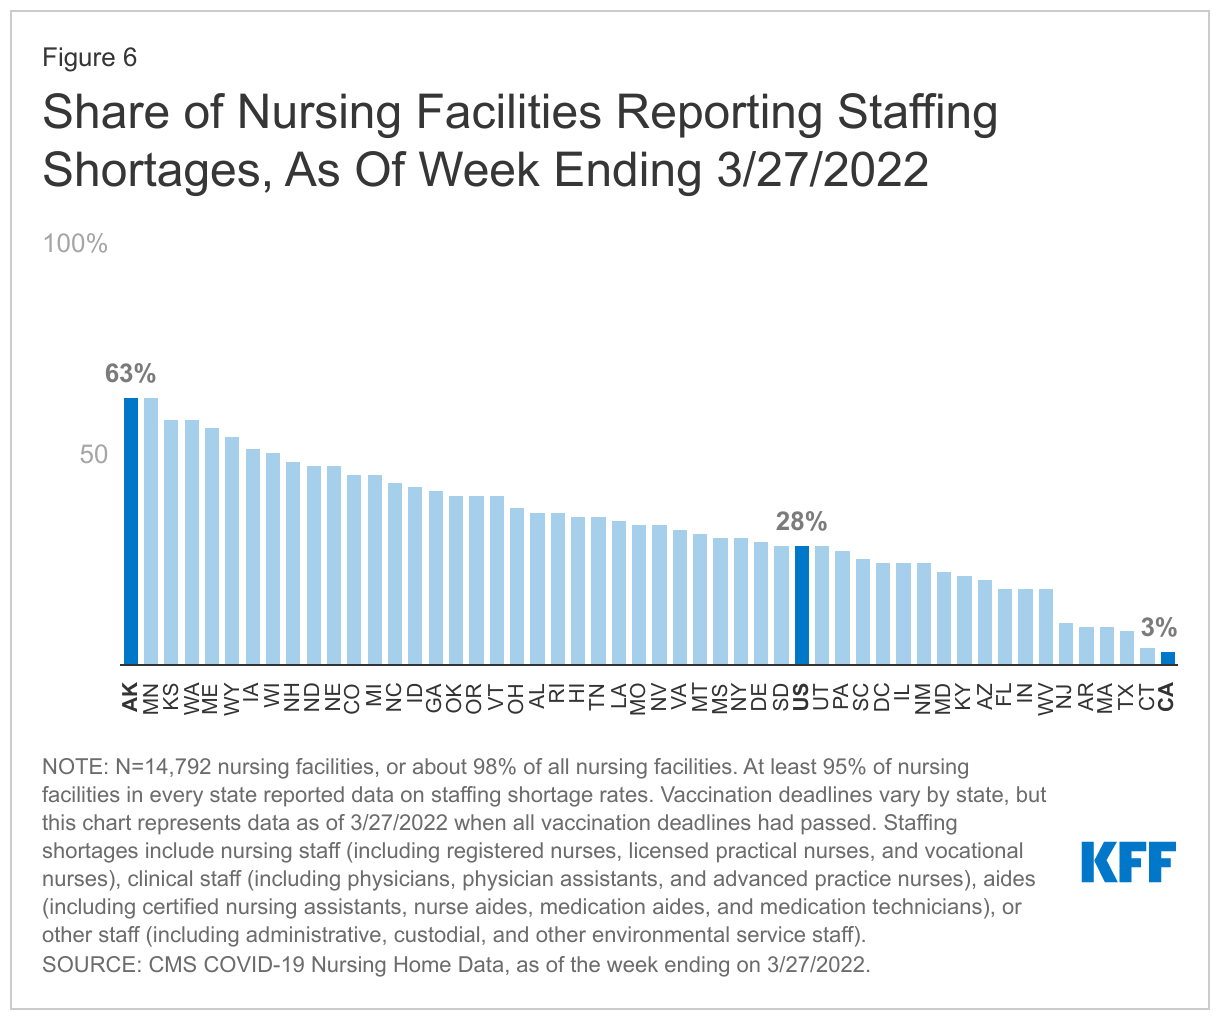
Staff Shortages: More than one in four (28%) of nursing facilities nationally reported staffing shortages as of March 2022 ranging from 63% in AK to 3% in CA (Figure 6). Staffing shortages peaked nationally during the Omicron wave, with nearly one in three facilities reporting a shortage in January 2022. Staffing shortage rates have fallen since then from 33%, and remained relatively stable through March 2022, even after the implementation of the vaccine mandate.
Vaccine Mandate: Requirements and Litigation
In mid-August 2021, the Biden Administration announced that nursing facility staff would be required to be vaccinated against COVID-19 as a condition of participation in the Medicare and Medicaid programs. CMS released the interim final rule establishing the new vaccination requirement in November 2021. Due to litigation, facilities in different states had different deadlines to comply with the new rule. CMS guidance requires 100% of staff in nursing facilities to have completed their vaccinations or have a pending or approved exemption by February 28th in 25 states plus D.C.; by March 15th in 24 states; and by March 21st in the remaining state, Texas.
CMS released a series of guidance with details on enforcement and implementation timelines for facilities to comply with the mandate. After the mandate became effective in all states, including in states that sued to challenge it, the substantive provisions of the guidance were the same for all states, except that the effective dates differed, as explained above. Under this guidance, CMS established three difference enforcement action thresholds:
Within 30 days after the relevant guidance was issued: 100% of staff must have received at least one dose of COVID-19 vaccine, or have a pending or approved exemption, or a CDC-recommended delay. A facility that is above 80% and has a plan to achieve a 100% staff vaccination rate within 60 days is not be subject to additional enforcement action.
Within 60 days after the relevant guidance was issued: 100% of staff must have received all necessary doses of the COVID-19 vaccine series, or have a pending or approved exemption, or a CDC-recommended delay. A facility that is above 90% and has a plan to achieve a 100% staff vaccination rate within 30 days is not be subject to additional enforcement action.
Within 90 days after the relevant guidance was issued: Facilities that do not comply with the 100% standard may be subject to enforcement action.
Nursing facilities that do not achieve compliance could be subject to enforcement through a number of mechanisms. CMS states that federal and state surveyors will begin surveying facilities for compliance with the rule as part of initial certification, standard recertification or reaccreditation, and complaint surveys 30 days following the issuance of the guidance. Facilities that do not achieve the 100% standard may be subject to enforcement through actions such as civil monetary penalties, denial of payments, and termination of participation from the Medicare and Medicaid programs. CMS in the guidance emphasizes that their “primary goal is to bring health care facilities into compliance” and termination would likely occur “only after providing a facility with an opportunity to make corrections and come into compliance.”
While the vaccine mandate is in effect, litigation challenging the new rule is ongoing. Although cases in Texas and Florida were dismissed after the Supreme Court allowed the rule to take effect, cases in Missouri and Louisiana are still pending. The Missouri case is now back at the district court for a decision about whether to permanently block the rule, while the Louisiana case is currently at the 5th Circuit Court of Appeals, awaiting an expected return to the district court. Although the Supreme Court decided that the federal government has authority to issue the rule, the states in both active cases are now seeking to amend their complaints to add new claims that were not part of their arguments at the Supreme Court.
Missouri now argues that the rule is arbitrary and capricious since the Omicron variant has replaced the Delta variant, which was prevalent when the rule was issued. Louisiana now argues that requiring state surveyors to enforce the rule violates the “anti-commandeering doctrine” and also challenges subsequent CMS guidance that indicates that state surveyors should be vaccinated. In both the Missouri and Louisiana cases, the district court judges have indicated that they are likely to allow the states to add these new claims, which raises the possibility that the rule could be blocked again – decisions that likely would be appealed.
Nursing Facility Staff Vaccinations
Nursing facility staff vaccination rates increased nationally by 25 percentage points (63% to 88%) between August 2021 (when the vaccine mandate for health workers was initially announced) and March 2022, the deadlines for compliance with the mandate in all states (Figure 1). While a number of factors may have influenced the rise in vaccination rates, it appears that the vaccine mandate contributed to increases in staff vaccination rates.
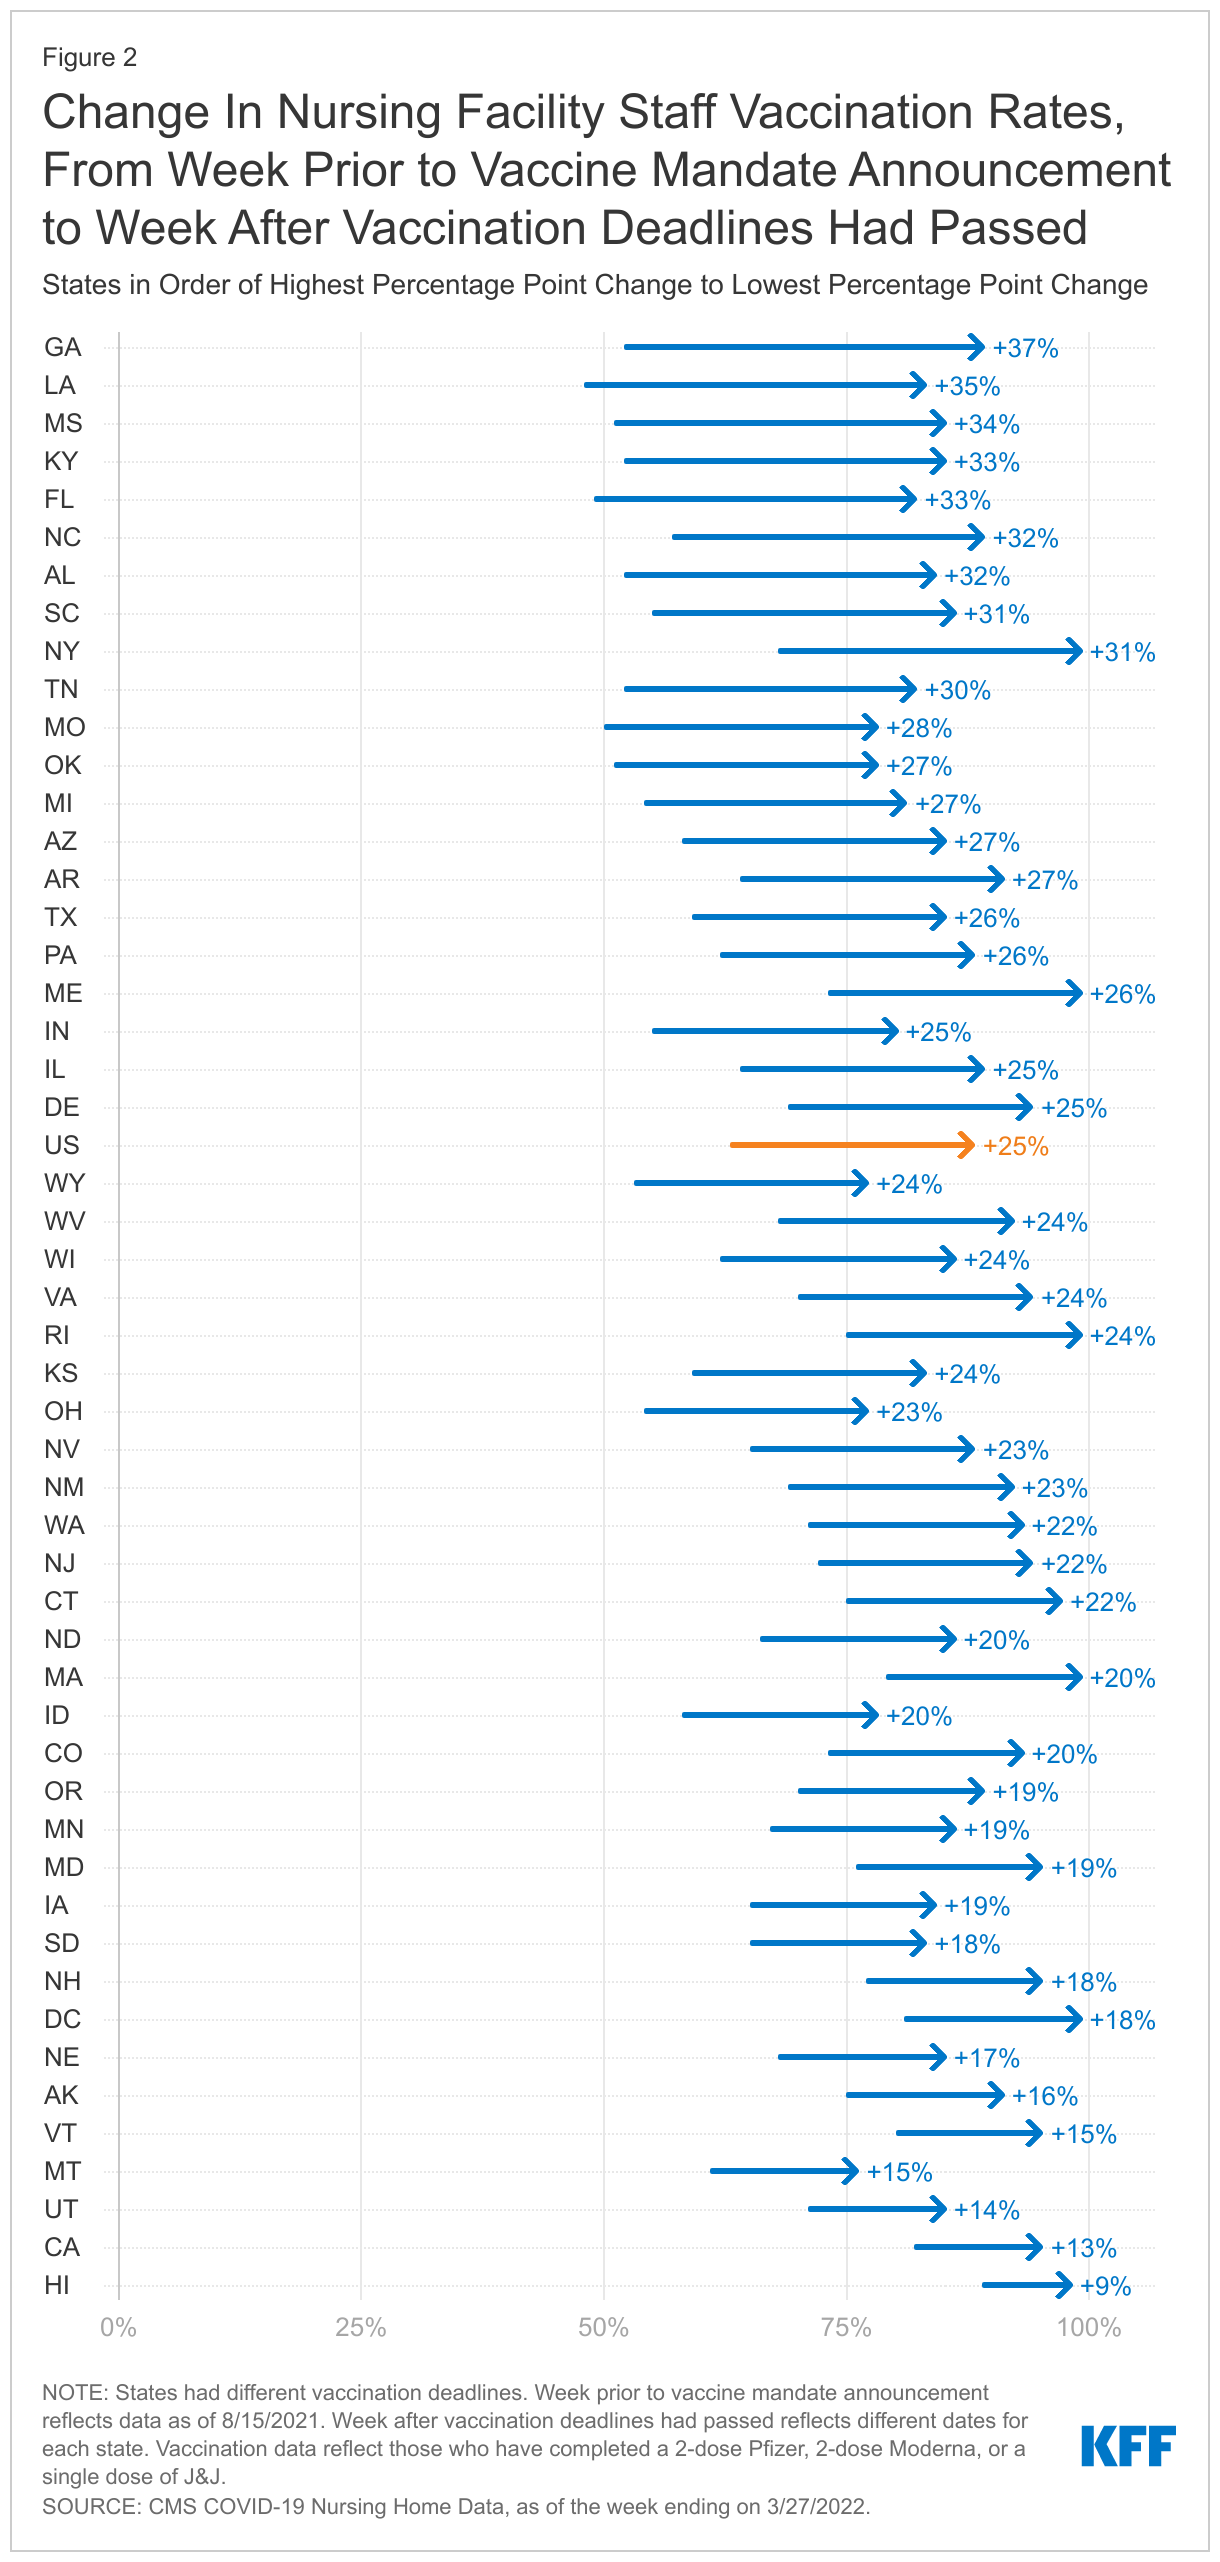
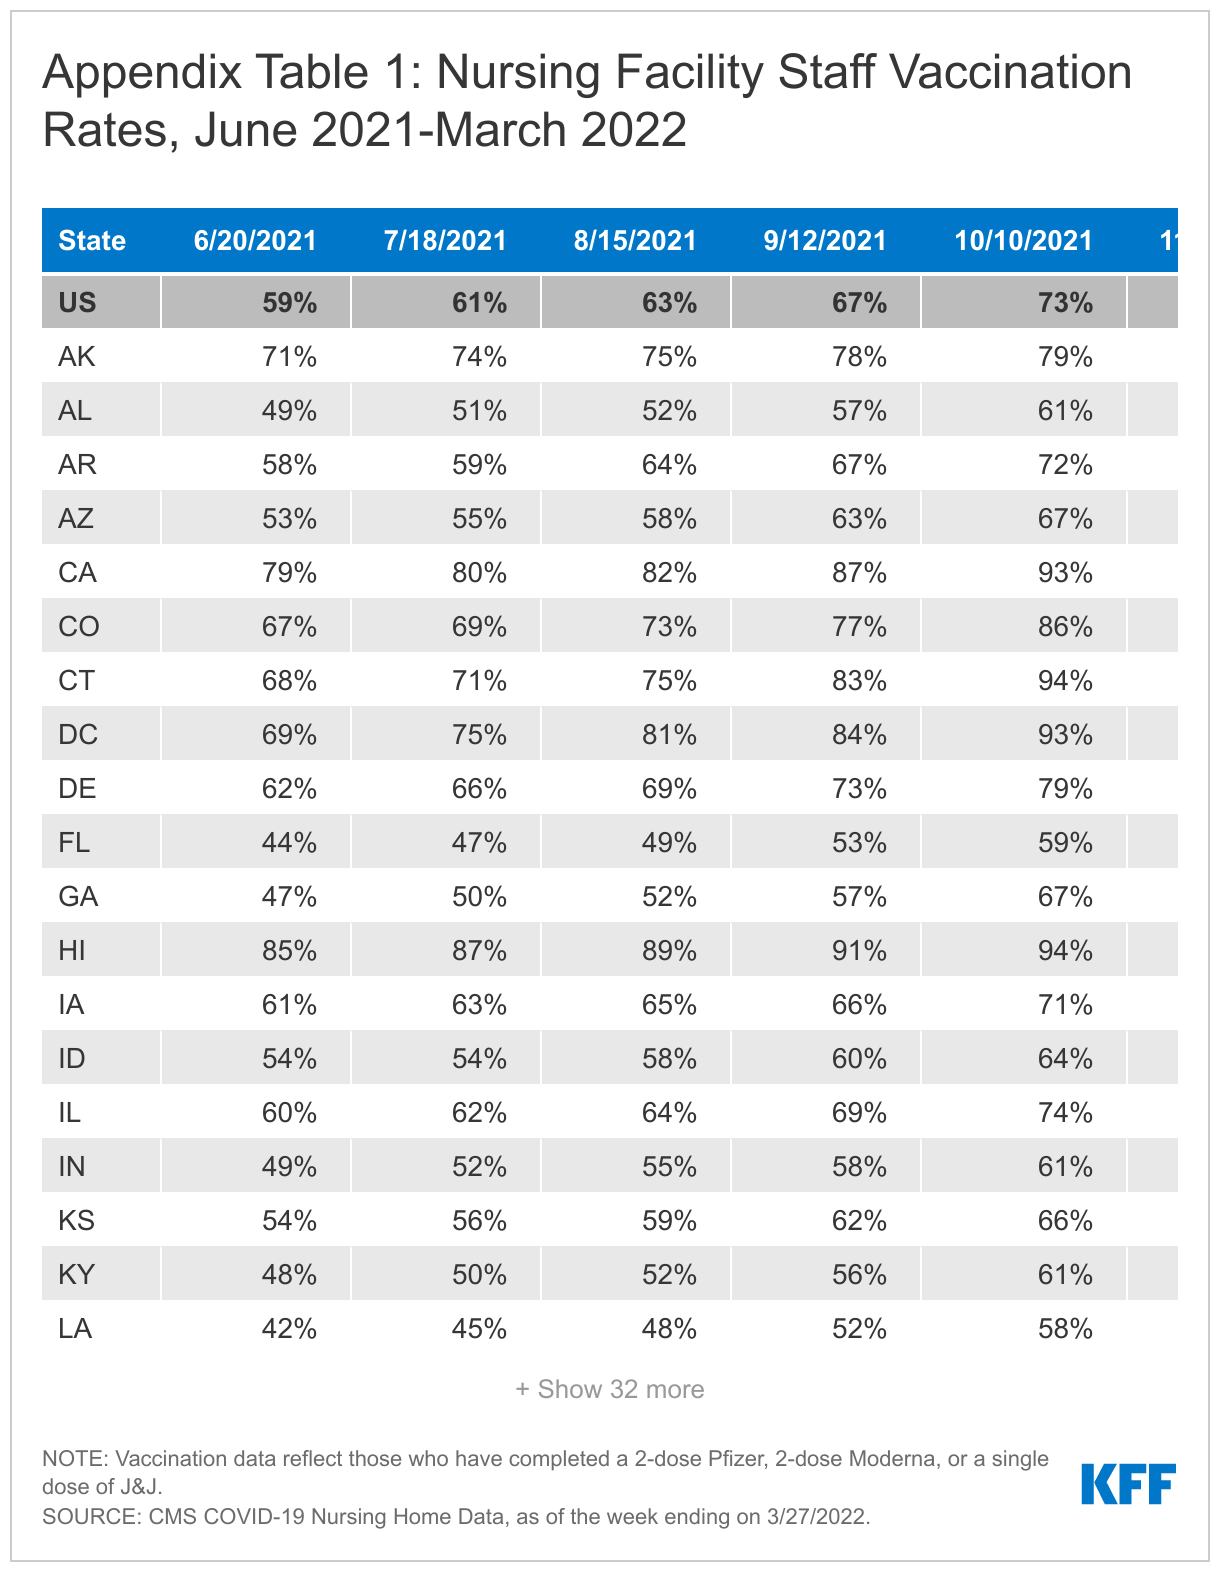
By the end of March 2022, after vaccine mandate deadlines had passed in all states, vaccination rates for nursing facility staff varied widely by state, ranging from 76% in Montana to 99% in five states (NY, RI, DC, ME, and MA) (Appendix Table 1). Previous analysis found similar state variation in nursing facility staff vaccination rates prior to the mandate deadlines, which CMS cited as a factor leading to the adoption of the rule. While state variation in vaccination rates has persisted since the deadlines passed, all states reported an increase in staff vaccination rates after the vaccination deadlines passed (Figure 2).
The increase in staff vaccination rates also varied across states between August 2021 and March 2022, ranging from a 37-percentage point increase in Georgia to a nine-percentage point increase in Hawaii (Figure 2). Nursing facilities in ten states reported a 30-percentage point or greater increase between August 2021 and March 2022, while facilities in five states reported an increase of 15 percentage points or less in same time period (Figure 2). This variation may be partially attributed to some states reporting high baseline vaccination rates, such as Hawaii (89%) and California (82%), while other states such as Georgia and Louisiana reported lower rates (48% and 52%, respectively).
After all vaccination deadlines had passed by the end of March 2022, 12% of facilities reported a staff vaccination rate of 100% and 39% of facilities reported staff vaccination rates greater than 90% but less than 100%. The remaining 49% of facilities reported rates of 90% or lower (Figure 3). The share of facilities reporting universal staff vaccination rates ranged from 56% of facilities in Rhode Island to 0% of facilities in Wyoming. The share of facilities reporting near-universal rates of vaccination (91-99%) ranges from 82% of facilities in Connecticut to 16% of facilities in Oklahoma. 24% of nursing facilities reported vaccination rates between 81-90% and roughly the same share (25%) reported a staff vaccination rates of 80% or lower.
It is difficult to assess compliance with the mandate based on these data. The federal data includes the number of staff who report medical contraindications to the COVID-19 vaccine, but does not track other potential exemptions, such as religious exemptions or CDC-recommended delays. Additionally, it is not clear whether all staff with a reported medical contraindication fall under the umbrella of “approved exemptions”. A ProPublica investigation found that nearly 20,000 nursing facility workers, or about one percent of nursing facility staff, claimed a medical exemption for vaccines and an additional 164,000, or about nine percent, declined to get the vaccine for another reason, which could include a religious objection.
Nursing Facility Staff Boosters
The national booster rate for nursing facility staff was 44% as of March 2022 (Figure 4). Though booster shots have been cited as crucial protection against serious illness and death due to COVID-19, the CMS rule does not require staff to receive booster shots. The CDC began recommending boosters for nursing home residents in September 2021, after data indicated that vaccinations become less effective over time, especially among older adults. Staff booster rates in nursing facilities increased 17 percentage points (27% to 44%) between mid-January 2022 and March 2022, after vaccination deadlines had passed. January 2022 was chosen as the comparison time period since it is five months after the vaccine mandate was announced, aligning with CDC’s recommendations to receive a booster shot five months after most initial vaccine regimens.
Booster rates for nursing facility staff varied widely across states, ranging from 93% in Massachusetts to 24% in Florida, Missouri, and Mississippi, as of March 2022 (Figure 4). Eight states reported booster rates above 60%, while 13 states reported booster rates below 30%. This wide variation may reflect differences in attitudes or hesitancy about boosters, as well as state and local policies on boosters. Five states (CT, MA, NJ, NY, and CA) reported a greater than 30 percentage point increase in booster rates from January 2022 to March 2022, as well as some of the highest booster rates in the country in March 2022 (an average of 72%, or nearly 30 percentage points higher than the national average). All five of these states had booster mandates during this time period, which may partially explain why these state-level increases are higher than the national increase of 17 percentage points in this time period.
As of the end of March 2022, after all vaccination deadlines had passed, about one-third of nursing facilities nationally reported staff booster rates of over 50%, another third reported rates between 25-50%, and the third of remaining facilities reported rates of under 25% (Figure 5). There is wide state variation in the share of facilities reporting staff boosters of over 50%, ranging from 99% of facilities in Massachusetts to five percent of facilities in Tennessee. Conversely, about 60% of facilities in Florida, Louisiana, and Missouri reported staff booster rates of under 25%, while zero percent of facilities in Massachusetts fall in this category.
Nursing Facility Staffing Shortages
More than one in four (28%) nursing facilities nationally reported staffing shortages as of March 2022 after all vaccination deadlines had passed, ranging from 63% of facilities in Alaska to 3% of facilities in California (Figure 6). State variation in staffing shortages may be attributable to variation in local economies and labor markets and could also be due to differences in the way in which nursing facilities define and report staff shortages. Previous analysis shows that staffing shortages peaked nationally during the Omicron wave, with nearly one in every three facilities reporting a shortage in January 2022. Rates have fallen slightly since then and remained relatively stable through March 2022, even after the implementation of the vaccine mandate. When issuing the vaccine mandate rule, CMS acknowledged that some staff may leave their jobs because they do not want to receive the vaccine, possibly exacerbating staffing shortages, while also citing examples of vaccine mandates that resulted in high rates of compliance and few employee resignations. Data suggest that the vaccine mandate has not exacerbated staffing shortages to the extent initially hypothesized since shortages have actually fallen nationally since January 2022. There are likely a multitude of factors that impact staffing shortages beyond the vaccine mandate.
Looking Ahead
While it is difficult to isolate the impact of the staff vaccination mandate on vaccination rates, booster rates, and staff shortages, the mandate did likely play a role in increased vaccination rates from August 2021 to March 2022. As new COVID-19 variants emerge and make their way into nursing facilities, maximizing vaccination and booster rates among facility staff will help protect against illness and death of residents and staff, and help maintain sufficient staffing levels. The Biden Administration has announced a number of policies to address staffing issues in nursing facilities, including establishing minimum staffing levels for Medicare and Medicaid-certified nursing facilities, supporting state efforts to tie Medicaid reimbursement rates to increases in staff compensation, and launching a national nursing career pathways campaign. The National Academies of Sciences, Engineering, and Medicine also released a comprehensive report on quality of care in nursing facilities and recommended enhanced and updated federal staffing standards as one component of a wide-ranging package of nursing facility reforms. Since the onset of the COVID-19 pandemic, some states have adopted changes to increase state-level minimum staffing requirements. It will be important to watch whether and how lessons from the pandemic are integrated into new federal and state policies to improve nursing facility care quality and protect residents and staff.
Methods
This analysis uses federal data reported weekly by facilities to the CDC’s National Healthcare Safety Network (NHSN) through March 27th, 2022 to align with the week right after all vaccination deadlines had passed. The federal data includes only data on Medicare or Medicaid certified nursing facilities. This analysis therefore does not reflect other long-term care settings, such as assisted living facilities, residential care facilities, group homes, or intermediate care facilities. These data are updated regularly to reflect revised data from previous weeks, so future versions of this dataset reflecting the same time period may output different values.
CMS performs data quality checks to identify facilities that may have entered incorrect data before publishing this data for public download. Facilities that have submitted erroneous data will have an “N” displayed in the column titled “Passed Quality Assurance Check”. Our final sample of nursing facilities in each week of data excludes facilities that CMS flagged in their data quality check, as well as facilities that are missing measures of staff census, staff vaccinations, staff boosters, or staffing shortages, depending on the metric of interest. With these exclusions, each week of data for every metric represents anywhere from 14,800 to 14,900 facilities, or 97-98% of total facilities. Each week of data represents a slightly different set of facilities due to weekly variation in nursing facility reporting.
Completed vaccination refers to those who have completed a 2-dose Pfizer, 2-dose Moderna, or a single dose of J&J. Booster data reflect any additional dose of vaccination. Shortage measures reflect any reported shortages among nursing staff (including registered nurses, licensed practical nurses, and vocational nurses), clinical staff (including physicians, physician assistants, and advanced practice nurses), aides (including certified nursing assistants, nurse aides, medication aides, and medication technicians), or other staff (including administrative, custodial, and other environmental service staff). These measures are asked and reported as binary measures (yes/no) and reflect staffing shortages as of the week of data reporting; therefore, we are unable to determine the magnitude of staffing shortages among nursing facilities that report “yes” to one or more staff positions.
While staffing shortages in nursing homes have existed for decades, the COVID-19 pandemic has highlighted and intensified the need for sufficient, consistent, trained staff to care for residents. Numerous studies have found that high staffing levels are associated with higher care quality. Yet, a recent report concluded that “staffing standards in almost every state remain severely low.” In April 2022, the National Academies of Science, Engineering, and Medicine recommended minimum staffing levels, policies to ensure competitive wages and benefits, and improvements to staff training and opportunities for career advancement, among other reforms, as part of its comprehensive report to improve nursing home quality. The Biden Administration has announced plans to propose new federal minimum staffing adequacy regulations in the next year.
This issue brief summarizes federal and state standards related to nursing home staffing prior to COVID-19 and builds on existing information by identifying changes to state minimum staffing requirements adopted since the onset of the COVID-19 pandemic. We also examine state legislative and regulatory actions since the onset of the pandemic that directly affect worker wages and training requirements. Key findings include the following:
Staffing Requirements: At least five states (AR, CT, MA, NY, RI) adopted permanent increases to nursing home minimum staffing requirements after the onset of the COVID-19 pandemic, while at least one state (GA) adopted a permanent decrease. At least two states (OR, SC) adopted temporary decreases to account for potential staffing issues during the pandemic.
Wages: At least four states (CO, IL, MA, NC) adopted laws or regulations that require increases to nursing home staff wages since the onset of the COVID-19 pandemic. At least three states (MI, NC, OH) adopted temporary increases or one-time bonuses to nursing home staff wages post-COVID. Other states may have adopted or proposed Medicaid provider reimbursement rate changes that do not explicitly require corresponding increases in direct care staff wages.
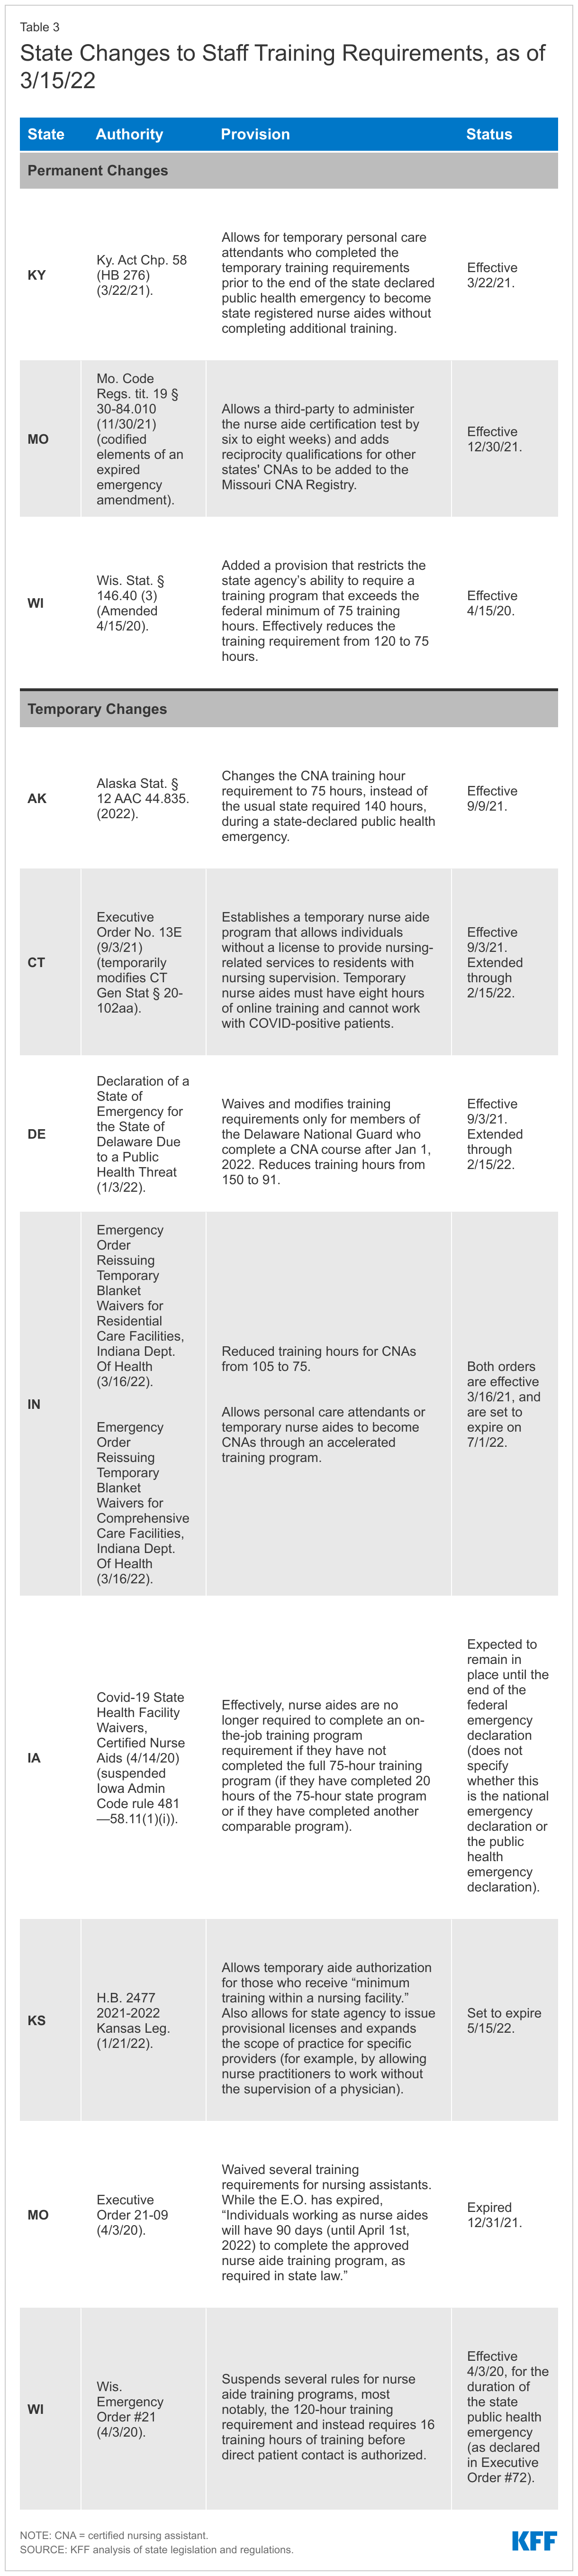
Training: At least 3 states (KY, MO, WI) adopted permanent changes to staff training requirements post-COVID to expand the pool of staff available to work in nursing homes, while at least 8 states (AK, CT, DE, IA, IN, KS, MO, WI) adopted temporary changes in this area.
Over the next year, policy action is expected on the federal level related to nursing home staffing. Following up on the White House announcement of a package of nursing home reforms, the Centers for Medicare and Medicaid Services (CMS) recently released a request for information to inform its planned development of a federal minimum staffing requirement for nursing homes. While Congress could adopt legislative changes, it is currently unclear whether the nursing home provisions that were included in the Build Back Better legislation that passed the House would be included in a potential budget reconciliation package that could be considered this summer. As passed by the House in November 2021, the Build Back Better provisions would have directed the HHS Secretary to study and report to Congress and propose regulations on any appropriate minimum federal nursing staff to resident ratios. The legislation also would have replaced the current federal requirement for a registered nurse for at least eight consecutive hours per day, 7 days per week, with a new requirement for a registered nurse 24 hours a day. Finally, both federal and state policymakers will likely be considering the recommendations in the National Academies’ comprehensive report on improving nursing home care quality.
Introduction
While staffing shortages in nursing homes have existed for decades, the COVID-19 pandemic has highlighted and intensified the need for sufficient, consistent, trained staff to care for residents. As of March 27, 2022, more than one in four nursing homes nationally reported a shortage of at least one type of staff, though the share of nursing homes reporting staffing shortages varies widely by state. As of March 20, 2022, nursing homes were most likely to report a shortage of aides, followed by nursing staff, and least likely to report a shortage of clinical staff. The pandemic has taken a substantial toll on people living and working in nursing homes. Over 200,000 residents and staff in long-term care facilities have died from COVID-19, comprising more than one in five of all COVID-19 deaths in the U.S.1 Most of these deaths (about 155,000) have occurred in nursing homes that are certified to participate in the Medicare and/or Medicaid programs.2
Numerous studies over several decades have found that high staffing levels are associated with higher care quality for nursing home residents. A December 2021 study reviewed state nursing home staffing standards and concluded that “staffing standards in almost every state remain severely low.” The Medicaid and CHIP Payment and Access Commission (MACPAC) recently reviewed state policies that can help address staffing issues, including increasing Medicaid payment rates, changing Medicaid payment methods to incentivize facilities to devote more revenue to staff, and requiring minimum staffing levels above the federal standard. In April 2022, the National Academies of Science, Engineering and Medicine recommended minimum staffing levels, policies to ensure competitive wages and benefits, and improvements to staff training and opportunities for career advancement, among other reforms, as part of its comprehensive report to improve nursing home quality.
The Biden Administration recently announced plans to propose new federal minimum staffing adequacy regulations in the next year. States can choose to adopt staffing or training requirements that are stricter than federal rules as part of their role in licensing nursing home providers and administering state Medicaid programs, which finance the majority of nursing home care. Nursing home staff shortages and high turnover rates among staff are largely attributed to low wages. While Medicare and Medicaid reimbursement rates to nursing homes can indirectly influence worker wages, states also can adopt policies to require or incentivize providers to raise wages paid to direct care workers.
This issue brief summarizes federal and state standards related to nursing home staffing prior to COVID-19 and builds on existing information by identifying changes to state minimum staffing requirements adopted since the onset of the COVID-19 pandemic. We also examine state legislative and regulatory actions since the onset of the pandemic that directly affect worker wages (other than increases to provider reimbursement rates), and training requirements. Detailed state-level information is included in the Appendix Tables. While we reviewed legislation and regulations in all 50 states and DC, this brief may not capture all relevant policy changes.
What were federal and state staffing requirements pre-COVID?
A 2001 CMS study recommended a minimum of 4.1 nursing hours per resident per day to prevent harm to residents. However, there has never been a federally required minimum number of staffing hours per resident day, despite repeated calls to establish one from researchers and patient advocates over the last several decades. Additionally, a series of Institute of Medicine reports have recommended that nursing home staff include registered nurses 24 hours a day. The April 2022 National Academies report recommends direct-care registered nurse coverage 24 hours a day, with additional registered nurse “coverage that reflects resident census, acuity, case mix” and residents’ professional nursing needs as determined by their assessments and care plans.
Federal regulations require nursing aides to complete a 75-hour training program and to pass a competency evaluation in order to work in a nursing home longer than four months. Nursing aides (also called nursing assistants) provide the majority of direct care in nursing homes. In response to the COVID-19 public health emergency, CMS temporarily waived the training requirement as a means of addressing potential staffing shortages during the pandemic. However, CMS recently announced that this waiver will sunset on June 6, 2022, citing concerns about care quality. CMS has advised states to reevaluate their training programs and consider allowing some of the time worked by nursing aides during the public health emergency to count toward the 75-hour training requirement after the waiver ends.
How have state staffing requirements changed since COVID-19?
This brief examines state legislative and regulatory actions since the onset of the pandemic to address nursing home staffing, including minimum staffing requirements, policies that directly affect worker wages (other than increases to provider reimbursement rates), and training requirements. We include both permanent and temporary changes to illustrate the types of action states are taking. While we reviewed legislation and regulations in all 50 states and DC, this brief may not capture all relevant policy changes. Figure 2 summarizes state activity post-COVID in the areas of minimum staffing requirements, worker wages, and training requirements. Detailed state-level information is included in the Appendix Tables.
State Changes to Minimum Staffing Requirements
At least five states adopted permanent increases to nursing home minimum staffing requirements after the onset of the COVID-19 pandemic, while at least one state adopted a permanent decrease (Figure 2 and Appendix Table 1). Among the states that adopted increases, the amount ranged from an additional 0.16 hprd in Connecticut to an additional 3.78 hprd in Rhode Island. Other states adopting increases include Arkansas, Massachusetts, and New York. Arkansas also adopted a broader definition of the direct care staff whose hours count toward its new minimum staffing requirement, while Rhode Island no longer allows director of nursing hours to count toward its new minimum staffing requirement. By contrast, Georgia permanently decreased its minimum staffing requirement by 0.24 hprd. All of the states adopting permanent minimum staffing changes post-COVID, including Georgia with its decrease, continue to exceed the federal minimum staffing requirement of 0.30 hours per resident day.
Two states, Florida and New Jersey, retained their total daily minimum staffing hours but restructured how those hours are allocated across staffing types or shifts post-COVID (Appendix Table 1). Specifically, Florida retained its total hprd but increased the number of licensed practical nurse hours and decreased the number of certified nursing assistant hours that count toward the overall total. Florida also amended its definition of direct care staff whose hours can count toward the minimum hprd to include personal care attendants. New Jersey retained its total hprd but now divides the daily minimum to set specific hprd requirements during each of the three shifts in a day.
At least two states adopted temporary decreases to minimum staffing requirements post-COVID to account for potential staffing issues during the pandemic (Appendix Table 1). These states include Oregon and South Carolina. Oregon also authorized facilities to utilize personal care assistants, nursing assistants, physical therapists, and occupational therapists to meet no more than 25 percent of the certified nursing assistant minimum staffing requirement during this time. Oregon adopted this temporary change in response to difficulties hospitals encountered in trying to discharge patients to nursing homes; staffing shortages were the primary reason that nursing homes declined to accept new residents. Although South Carolina’s state agency did not explicitly describe the reasons for the temporary change, South Carolina hospitals are experiencing similar difficulty discharging patients to nursing homes due to staffing shortages. Oregon and South Carolina’s temporary decreases still result in state minimum staffing requirements that exceed the federal minimum level of 0.30 hprd.
Legislation that would have permanently increased minimum staffing requirements post-COVID was proposed but failed to pass in at least two states. Arizona introduced HB 2848 on February 11, 2021, which would have increased its minimum staffing requirement. However, the bill was voted down in the House Rules Committee four days later. Kentucky introduced House Bill 215 on January 8, 2020, which would have increased its minimum staffing requirement. The bill was voted down two days later in the House Health and Family Services Committee. The Kentucky bill was unpopular among nursing home industry representatives, which characterized it as “overregulation” and alleged that it would encourage excessive litigation. Nursing home administrators also opposed the bill due to an increasing statewide staffing shortage, which was exacerbated by the pandemic.
State Changes to Worker Wages
At least four states adopted laws or regulations that require increases to nursing home staff wages since the onset of the COVID-19 pandemic (Figure 2 and Appendix Table 2). One of these states, Colorado, passed legislation that established a $15.00 per hour minimum wage for nursing home direct care staff as of January 2022. At least three other states (IL, MA, and NC) adopted changes that require nursing homes to increase staff wages as a condition of receiving increased Medicaid provider reimbursement rates. Illinois specified that nursing homes must increase direct care staff wages by $1.00 per hour as of July 2020, and an additional 50 cents per hour as of January 2021. Massachusetts and North Carolina both direct nursing homes to devote a certain share of the rate increase to direct care staff wages (75% and 80%, respectively). A goal of North Carolina’s legislation is to raise staff wages to $15.00 per hour; prior to the increase, wages averaged $10.30 per hour. Other states may have adopted or proposed Medicaid provider reimbursement rate changes that do not explicitly require corresponding increases in direct care staff wages.
At least three states adopted temporary wage increases or one-time bonuses for nursing home staff post-COVID. These changes apply to all staff and are not limited to providers that participate in Medicaid. Michigan enacted a temporary one year increase of $2.35 per hour for direct care staff, including nurses and aides. Without the increase, starting wages for aides averaged $11.00 to $12.00 per hour. North Carolina’s legislature appropriated $1 million for one-time bonus payments to direct care staff, while Ohio’s legislature appropriated $300 million for wages, incentives, and bonuses to recruit and retain direct care staff.
State Changes to Staff Training Requirements
At least three states adopted permanent changes to staff training requirements to expand the pool of staff available to work in nursing homes post-COVID (Figure 2 and Appendix Table 3). One of these states, Wisconsin, lowered the training hour requirement for nurse aides from 120 hours to the federal minimum of 75 hours. Additionally, Missouri now allows third parties to administer the certification test for nursing assistants, which is expected to expedite the process by six to eight weeks. Missouri also established reciprocity standards to allow out-of-state certified nursing assistants (CNAs) to work in Missouri. Also, Kentucky adopted changes that allow for personal care attendants that finished training during the state-declared public health emergency to become state registered nurse aides. Once the state-declared public health emergency ends, these nurse aides are not required to complete additional training.
At least eight states adopted temporary changes to staff training requirements post-COVID to expand the pool of staff available to work in nursing homes (Appendix Table 3). Four of these states (AK, DE, IN, and WI) lowered the training hour requirements for CNAs during the pandemic, in efforts to address staffing issues. Alaska’s temporary reduction applies during any state-declared public health emergency, not just during the COVID public health emergency. Missouri waived its training requirements, and Iowa temporarily suspended an additional on-the-job training requirement for CNAs. Connecticut and Kansas adopted changes that allow temporary nurse aides to work, though Connecticut’s temporary executive order has expired.
Looking Ahead
Over the next year, policy action is expected on the federal level related to nursing home staffing. Following up on the White House announcement of a package of nursing home reforms, CMS recently released a request for information to inform its planned development of a federal minimum staffing requirement for nursing homes. Responses are due on June 10, 2022. CMS also plans to conduct a research study, noting that resident acuity has increased in recent years, and to issue proposed regulations within one year.
In addition to administrative agency action, Congress could adopt legislative changes, though it is currently unclear whether the nursing home provisions that were included in the Build Back Better legislation would be included in another budget reconciliation package that is possible this summer. As passed by the House in November 2021, the Build Back Better provisions would have directed the HHS Secretary to study and report to Congress and propose regulations on any appropriate minimum federal nursing staff to resident ratios. The legislation also would have replaced the current federal requirement for a registered nurse for at least eight consecutive hours per day, 7 days per week, with a new requirement for a registered nurse 24 hours a day.
Finally, both federal and state policymakers will likely be considering the recommendations in the National Academies’ comprehensive report on improving nursing home care quality. Specifically, that report notes the need to improve worker wages, benefits, training, and working conditions as an integral part of improving nursing home resident health and quality of life.
KFF appreciates the contributions of Emma Childress, law/master of health administration student at St. Louis University, and Belle Harris, law student at Georgetown University, who worked as contractors on this project. We also are grateful for the dedicated work of Meghana Ammula, KFF research assistant.
Appendix
Endnotes
KFF analysis of CDC COVID data tracker, CMS COVID-19 Nursing Home data, and state-reported deaths in long-term care facilities (week ending April 17, 2022). ↩︎
Expressed numerically for a 100-bed facility, the federal standard equates to 0.30 staffing hours per resident day (hprd), including a full-time director of nursing (0.06 hprd), a registered nurse for 8 consecutive hours per day (0.08 hprd), and a registered nurse or licensed nurse during the other two shifts (0.16 hprd). The National Consumer Voice for Quality Long-Term Care report provides a detailed explanation of this calculation for purposes of comparing standardized federal and state staffing requirements.
↩︎
Despite occasional anecdotal reports of people having trouble finding a doctor who takes their insurance, KFF researchers find in a new analysis that the vast majority of non-pediatric office-based physicians accept new Medicare patients, as well as new private insurance patients.
Eighty-nine percent of such physicians accepted new Medicare patients in 2019, and 91 percent accepted new private insurance patients, according to the analysis, which uses data from the federal 2019 National Electronic Health Records Survey (NEHRS). Among primary care physicians the rates are lower, but still comparable for new patients with Medicare (83%) and private insurance (86%).
In addition, the analysis found that roughly the same percentage of non-pediatric office-based physicians accepted new Medicare patients in 2011 (88%) as in 2019. And the share of physicians who accept new private insurance patients has risen considerably over the period — up 10 percentage points from 81 percent in 2011 to 91 percent in 2019.
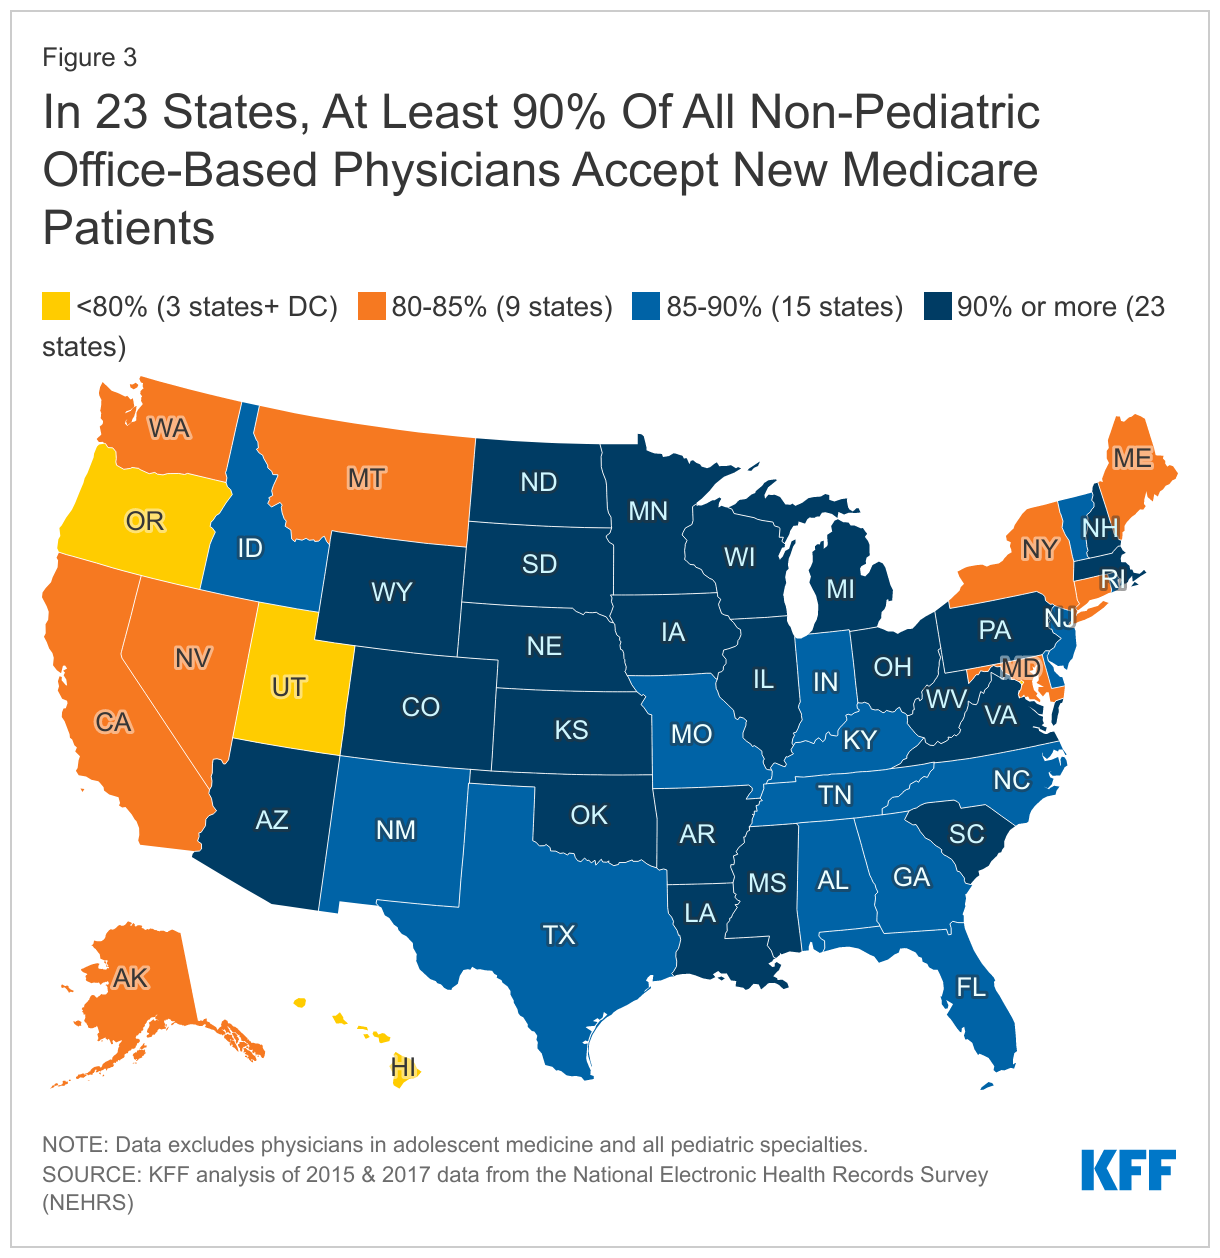
The new analysis also contains state-level data. KFF researchers find that in 23 states, at least 90 percent of all non-pediatric office-based physicians accepted new Medicare patients in 2015-2017. Across all states the share ranged from 76 percent in Washington D.C. to 95 percent in three states (Iowa, Minnesota, and Pennsylvania), similar to the range for privately-insured patients.
The findings are notable because some proponents of doing more to contain health care costs have proposed adopting Medicare rates, or a multiple of Medicare rates, for those who now have private insurance, since Medicare rates tend to be lower. Skeptics of that approach – which could involve directly regulating prices, or creating a Medicare-like plan as a public option or as part of a single payer system — have raised concerns that moving towards Medicare rates would cause access problems.
Across a range of specialties, KFF analysts find that the share of physicians accepting new Medicare patients is similar to the share accepting new patients with private insurance. The share of physicians accepting new patients is lowest among psychiatrists, with 60 percent accepting new Medicare patients and 59 percent accepting new privately-insured patients.
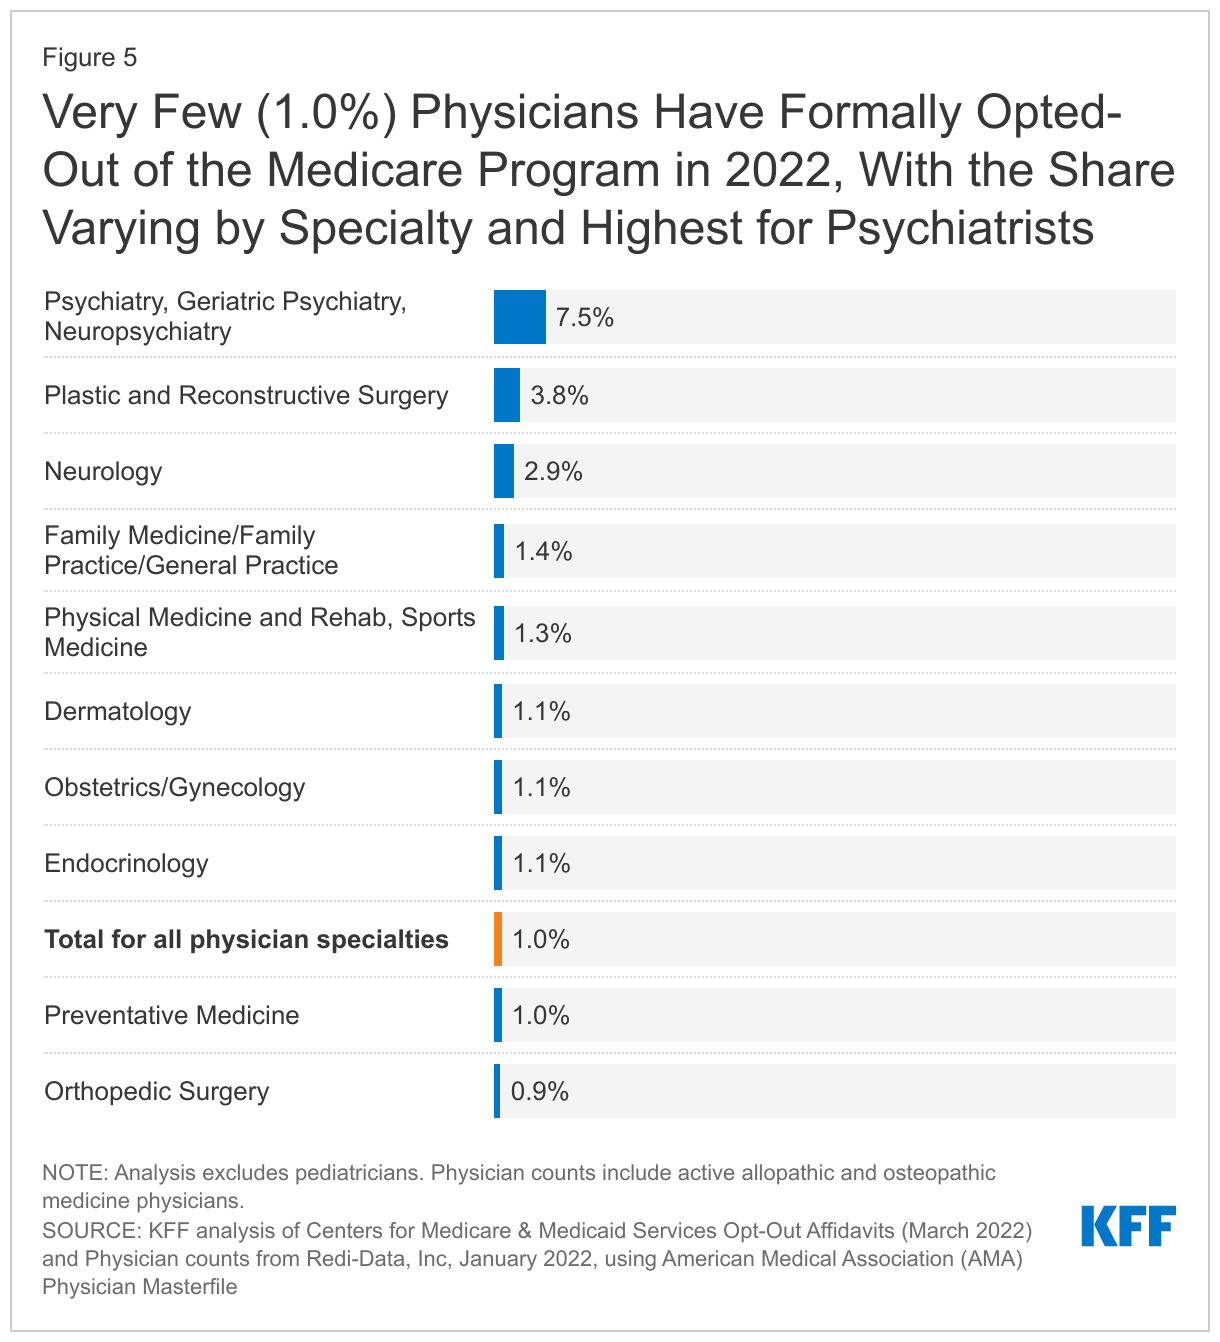
KFF analysts also find that a very small share (1%) of non-pediatric physicians formally opted-out of the Medicare program in 2022, with psychiatrists being the most likely to opt-out (7.5% ). In all states except for Alaska and Colorado, fewer than 2 percent of physicians have opted-out of Medicare.
The fact that the vast majority of physicians are accepting new patients does not mean that all patients will have access to all clinicians, since providers may only be in the networks of some private insurance or Medicare Advantage plans.
For more data and analyses about Medicare visit kff.org.
Over the past decade, health care prices paid by private insurers have risen sharply. These higher prices contribute to higher health care costs per person, which contribute to higher premiums and out-of-pocket spending among the privately insured. In contrast to Medicare, which pays physicians based on a fee schedule, prices for those with private insurance are negotiated by payers and providers, and on average, private insurers pay 143% more for physician services than Medicare. The difference in Medicare and private prices has served as the basis for proposals to adopt Medicare rates, or a multiple of Medicare rates, for those with private insurance, or as part of a Medicare-like plan through a public option or single payer plan.
Over the years, some have questioned whether the level of Medicare payments for physicians are too low to cover the costs of providing care and have raised concerns that moving towards Medicare rates would cause access problems. Previous KFF analysis has found that even though Medicare payments to physicians are lower, the vast majority of Medicare beneficiaries report having a usual source of care and high levels of satisfaction with the quality of their medical care. In addition, two separate KFF analyses, using data from 2012-2013 and 2020, found that the nearly all physicians accept Medicare, and only a small fraction “opt out” of Medicare altogether.
This brief builds on and updates the previous KFF analyses by drawing on the 2019 National Electronic Health Records Survey (NEHRS) to examine: 1) the share of non-pediatric office-based physicians accepting new patients with Medicare or private insurance and how these rates have changed over time; and 2) the share of physicians accepting new patients by physician specialties, geographic areas, and physician and practice characteristics across Medicare and private insurance. We are only able to assess whether doctors report accepting any new patients and cannot evaluate whether all new patients are accepted or how timely or convenient it is to schedule an appointment. This analysis further examines the extent to which non-pediatric physicians are opting out of Medicare, by specialty and state, drawing on 2022 opt-out affidavit data published by the Centers for Medicare & Medicaid services and data on the total number of active state-licensed physicians from Redi-Data, Inc (See Methods box for details).
Key findings include:
Across almost every dimension we examine, the share of physicians accepting new Medicare patients is similar to the share accepting new patients with private insurance, with the only exception being the share of obstetricians and gynecologists accepting new Medicare patients (93%) is somewhat lower than the share accepting new privately-insured patients (99%). Physicians accepting new patients with private insurance will not be participating in every plan’s network, and similarly will not be in every Medicare Advantage plan network.
Most non-pediatric office-based physicians accept new Medicare patients (89%), as well as new private insurance patients (91%).
In 2011 and 2019, 88% and 89% of non-pediatric office-based physicians accepted new Medicare patients, respectively, with modest fluctuations in the years in between. The share accepting new patients with private insurance increased by 10 percentage points over the period, rising from 81% in 2011 to 91% in 2019, a share similar to Medicare.
Across most specialties, the majority of physicians (at least 80%) accept new patients with Medicare and private insurance. Almost all surgical specialists accept new Medicare and privately-insured patients (96% for both). Among primary care physicians the rates are lower, but comparable for new patients with Medicare (83%) and private insurance (86%), similar to the share of physicians in other medical specialties accepting new Medicare (87%) and privately-insured (88%) patients. The share of physicians accepting new patients is lowest among psychiatrists with 60% accepting new Medicare patients and 59% accepting new privately-insured patients.
In 23 states, at least 90% of all non-pediatric office-based physicians accepted new Medicare patients in 2015-2017. Across states, the share of physicians accepting new Medicare patients ranged from a high of 95% in three states (Iowa, Minnesota, and Pennsylvania) to a low of 76% in the District of Columbia, similar to the range across states for privately-insured patients.
A very small (1%) share of non-pediatric physicians formally opted-out of the Medicare program in 2022, with psychiatrists accounting for a disproportionate share of physicians opting-out. In all states except for Alaska and Colorado, less than 2% of physicians have opted-out of Medicare.
Findings
Acceptance of new patients by office-based physicians by type of insurance coverage
Differences in payment rates may affect whether people with different types of insurance coverage have comparable access to physician services. We use data from the National Electronic Health Records Survey (NEHRS) for 2011 to 2019 (the most recent year of data) to assess whether there are differences in the share of non-pediatric office-based physicians who are accepting new patients across Medicare and private insurance.
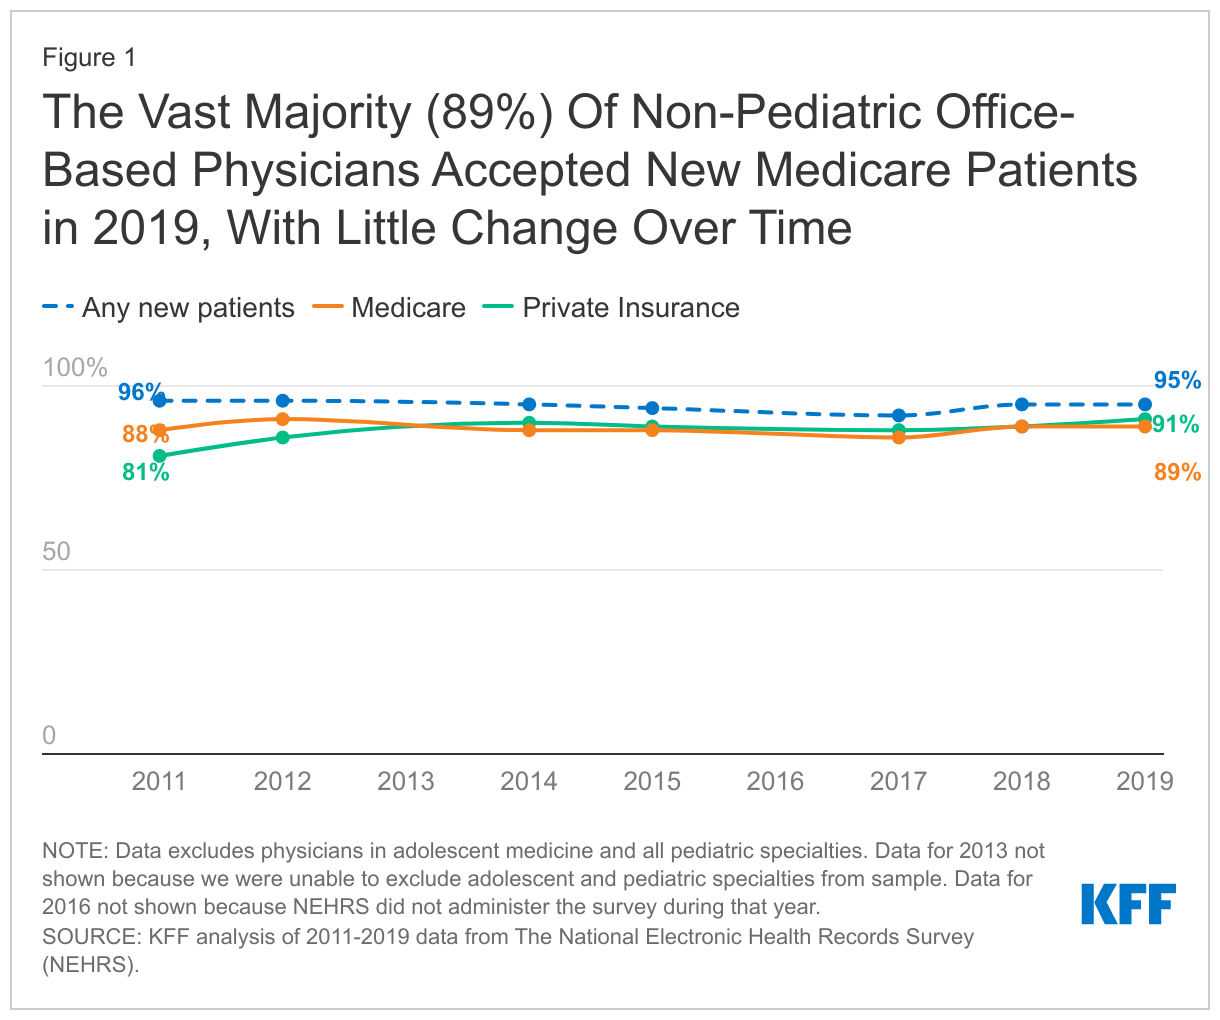
The vast majority of non-pediatric office-based physicians accept new patients, with similar shares accepting new Medicare and privately-insured patients. Overall, 95% of office-based physicians accepted new patients in 2019. The share of physicians accepting new patients was similar for Medicare (89%) and private insurance (91%), with no statistically significant differences between the payers (Figure 1). The share of physicians accepting any new patients is higher than the share accepting Medicare or private insurance because some physicians only accept patients with one type of insurance but not others, including types of insurance not broken out here (i.e., self-pay patients).
Between 2011 and 2019 the overall share of non-pediatric office-based physicians accepting new patients was stable and a consistent share accepted new Medicare patients. In 2011 and 2019, 88% and 89% of office-based physicians accepted new Medicare patients, respectively, with modest fluctuations in the years in between. During this same period, the share of physicians accepting new privately-insured patients increased from 81% in 2011 to 91% in 2019, becoming more similar to the share that accepted new Medicare patients (Figure 1).
Share of physicians accepting new Medicare and privately-insured patients, by specialty
To understand whether access varies more for some types of physicians, we examine whether the share of physicians accepting new patients is different for primary care, medical and surgery specialty groups, and among 12 common specialties.
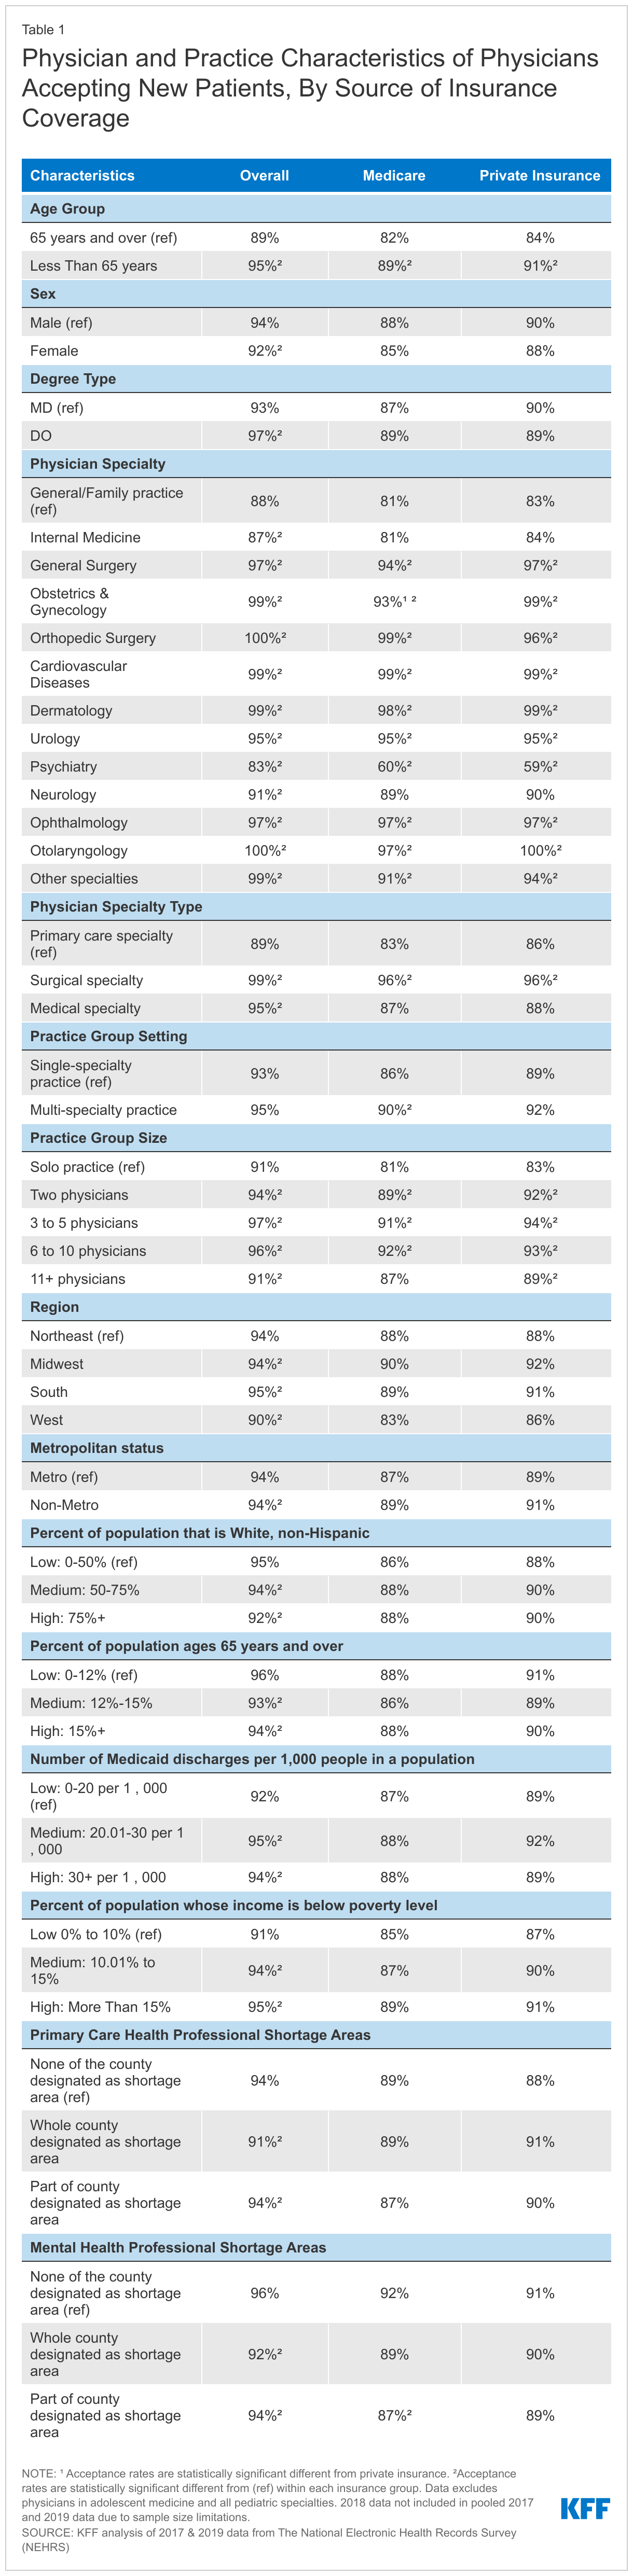
A smaller share of primary care physicians accept new Medicare or privately-insured patients than physicians in other medical or surgical specialties. To look at differences by specialty type, we pooled 2017 and 2019 NHERS survey data. Overall, a smaller share of primary care physicians (89%) reported having an open practice—meaning they accept any new patients—compared to other medical specialists (95%) and surgical specialists (99%). This pattern was consistent across Medicare and private insurance. A smaller share of primary care physicians accepted new Medicare (83%) or privately insured patients (86%), while the vast majority of surgical specialists accepted new patients with either type of insurance (96% for both). Among other medical specialists, 87% were accepting new Medicare patients and 88% were accepting new privately-insured patients (Table 1).
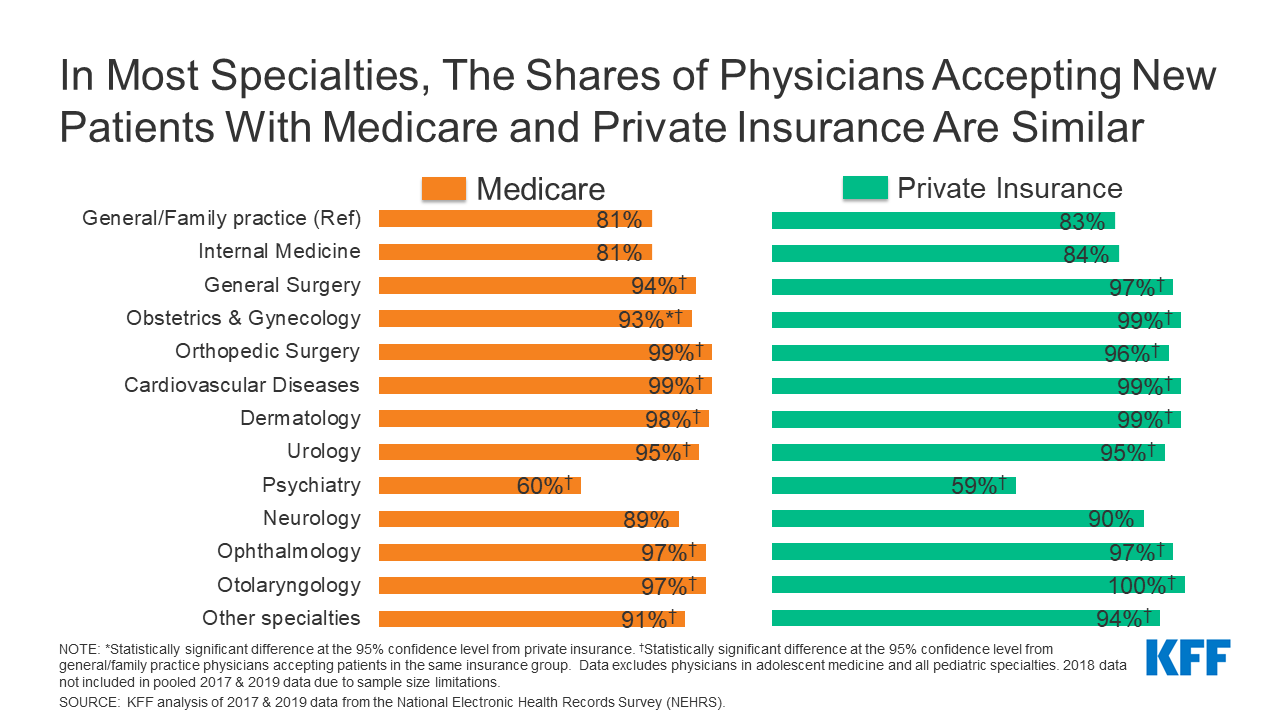
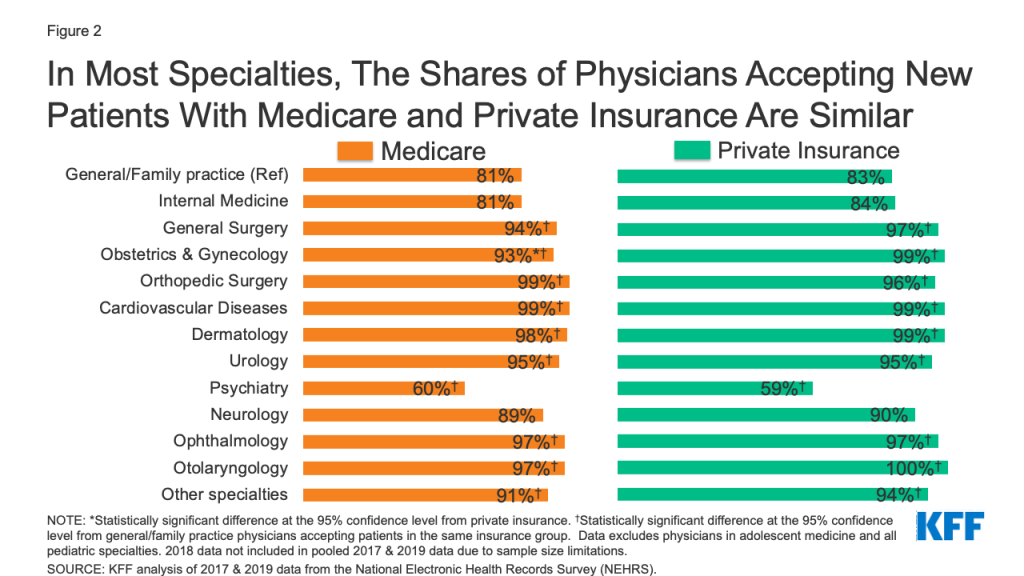
In most specialties, similar shares of physicians accept new Medicare and privately-insured patients. Except for obstetrics and gynecology, there were no statistically significant differences in the share of physicians accepting new patients with Medicare and private insurance. A larger share of obstetricians and gynecologists accepted new privately-insured patients (99%) than new Medicare patients (93%) (Figure 2, Table 1). Notably, almost 1 in 5 of general/family practice and internal medicine physicians were not taking new Medicare patients, similar to the share not taking new privately-insured patients.
Figure 2: In Most Specialties, The Shares of Physicians Accepting New Patients With Medicare and Private Insurance Are Similar
Among all non-pediatric, office-based physicians, psychiatrists were least likely to accept new patients regardless of insurance type. Among psychiatrists, similar shares were accepting new Medicare (60%) and privately-insured (59%) patients (Figure 2, Table 1). For both Medicare and private insurance, the share of psychiatrists accepting new patients was at least 20 percentage points lower than the share of physicians in general/family practice accepting new patients.
Variation in acceptance of new patients across states, in counties that have provider shortages, and by metropolitan status
To understand whether access to physician services varies geographically, we examined the share of office-based physicians accepting new patients by state, metropolitan status, as well as for counties that are designated as primary care or mental health professional shortage areas (HPSAs). Examining whether the share of physicians accepting new Medicare or privately-insured patients varies in HPSA designated counties highlights how differences in payment rates interacts with the supply of providers to affect access to physician services.
state-level shares of physicians accepting new patients
In every state, a large majority of non-pediatric office-based physicians accept new Medicare patients, with some variation among states. In 23 states, at least 90% of physicians accepted new Medicare patients (Figure 3). The five states with the highest share of physicians accepting new Medicare patients were Iowa (95%), Minnesota (95%), Pennsylvania (95%), South Carolina (95%), and North Dakota (94%). The states with the smallest share of physicians accepting new Medicare patients were the District of Columbia (76%), Utah (79%), Oregon (79%), Hawaii (79%), and Maryland (80%). This pattern was generally similar for privately-insured patients, where the share of physicians accepting new patients ranged from 96% (Arkansas) to 72% (the District of Columbia).
county and rural status variation
The Health Resources and Services Administration (HRSA) designates counties as primary care and/or mental health professional shortage areas (HPSAs) if the availability of providers or services is lower than necessary to support the population’s needs. When a county is designated as a HPSA, there are additional incentives for health care professionals to provide services, including a 10 percent bonus payment for providing care to Medicare beneficiaries and eligibility for special federal and state student loan repayment programs for providers that accept Medicare, Medicaid and CHIP patients in these areas. We examine whether the lower supply of providers in HPSA-designated areas is correlated with fewer physicians accepting new patients.
The vast majority of physicians in counties with primary care or mental health shortages accept new Medicare patients, with similar rates for privately-insured patients. In counties where the whole county is designated as a primary care HPSA, 89% of physicians accepted new Medicare patients and 91% of physicians accepted new privately-insured patients. Similarly, in mental health HPSAs, most physicians accepted both new Medicare (89%) and privately-insured (90%) patients. While the share of physicians in these areas accepting new patients is generally high, access can still be problematic since there are not enough physicians available in these areas to provide care.
Most (89%) physicians practicing in rural areas accept new Medicare patients, similar to the share of physicians accepting new privately-insured patients (91%). The share of physicians accepting new patients were similar across Medicare and private insurance in both rural and urban areas (Table 1).
Variation in acceptance of new patients by physician and practice characteristics
The composition of physicians is changing as more women enter medicine, the share of physicians who hold a Doctor of Osteopathic Medicine (DO) rather than a Doctor of Medicine (MD) is increasing, and doctors practice medicine longer, raising the average age of physicians in the United States. Additionally, physicians are increasingly practicing as part of large or multi-specialty groups, rather than in solo or small practice settings. As the composition of the physician workforce and how physicians practice changes, understanding the relationship between physician and practice characteristics and the acceptance of new patients, and whether this varies by payer, is helpful in assessing how access to physician services may evolve over time. We examine physician acceptance rates by physician characteristics (age, sex, degree type) and practice characteristics (group size, group setting), using 2017 and 2019 pooled data from the NEHRS.
The share of physicians accepting new Medicare patients was generally similar across physician demographic groups, but younger physicians were more likely to take new patients. There were no statistically significant differences in the share of physicians accepting new patients between Medicare and private insurance by physician age, sex or degree type (Table 1). Across both Medicare and private insurance, physicians who were younger than age 65 were more likely than physicians ages 65 and older to take new patients, with 89% and 91% of physicians under age 65 accepting new Medicare and privately-insured patients, respectively, compared to 82% and 84% of physicians age 65 and over. A similar trend was evident for physicians younger than age 50 compared to physicians ages 50 and older. There were no statistically significant differences within insurance groups by physician sex or degree type.
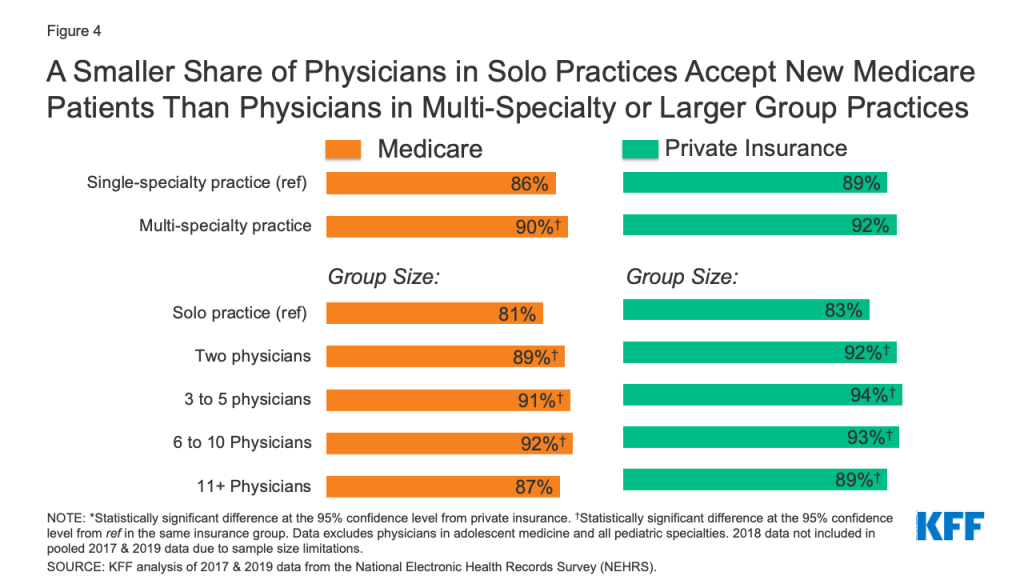
Solo practicing physicians were least likely to report that they were accepting new patients with both Medicare and private insurance. The share of physicians accepting new Medicare and privately-insured patients was similar when comparing by the size and practice type. By group size, a smaller share of physicians in solo practices accepted new Medicare (81%) or privately-insured (83%) patients than in practices with 2 physicians (89% for Medicare, 92% for privately-insured), 3-5 physicians (91% for Medicare, 94% for privately insured), and 6-10 physicians (92% for Medicare, 93% for privately-insured). Additionally, a smaller share of physicians in solo practices accepted new privately-insured patients (83%) than physicians in practices with or 11 or more physicians (87% for Medicare, 89% for privately-insured); however, differences between physicians in solo practices and physicians in practices with 11 or more physicians were not statistically significant for new Medicare patients.
A larger share of physicians in multispecialty group practices accepted new Medicare (90%) patients compared to physicians in single-specialty practices (86%) (Table 1, Figure 4). Differences between Medicare and privately-insured patients and between single- and multi-specialty practices for private insurance were not statistically significant.
Figure 4: A Smaller Share of Physicians in Solo Practices Accept New Medicare Patients Than Physicians in Multi-Specialty or Larger Group Practices
Physician Opt-Out Rates in the Medicare Program
Physicians and other health providers may participate in Medicare by either 1) agreeing to accept Medicare’s fee schedule amounts as payment-in-full (i.e., participating providers) or 2) accepting Medicare patients but choosing whether to accept Medicare’s approved amount on a claim-by-claim basis (i.e., non-participating providers). Physicians can also choose to “opt-out” of the Medicare program entirely by submitting an opt-out affidavit to Medicare. Physicians who have opted-out of Medicare enter into private contracts with their Medicare patients, allowing them to bill their Medicare patients any amount they deem appropriate and Medicare patients are responsible for the entire cost of these services. Prior KFF analyses found that a historicallysmall share of physicians have chosen to opt-out of Medicare entirely. Our analysis examines the extent to which non-pediatric physicians are opting-out of Medicare, by specialty, and by state. We use opt-out affidavit data from the Centers for Medicare & Medicaid services as of March 2022. To calculate the total number of active state-licensed physicians, we draw January 2022 data from Redi-Data, Inc.
Only 1% of all non-pediatric physicians have formally opted-out of the Medicare program in 2022, with opt-rates varying by specialty, and highest for psychiatrists (7.5%). As of March 2022, 10,105 non-pediatric physicians have opted-out of Medicare, accounting for a very small share (1.0%) of the total number of active physicians, consistent with the shares reported in 2013 and 2020. Opt-out rates vary by specialty and are highest for psychiatrists (7.5%), physicians in plastic and reconstructive surgery (3.8%), and neurology (2.9%) (Figure 5). Among the 10,105 physicians opting out of Medicare, psychiatrists account for 42% of these physicians.
In all but two states (Alaska, Colorado), less than 2 percent of non-pediatric physicians have opted-out of Medicare. As of March 2022, Alaska (3.3%), Colorado (2.2%), District of Columbia (1.9%), Wyoming (1.9%), and Idaho (1.9%) have the highest rates of non-pediatric physicians who have opted out of Medicare. States with the lowest physician opt-out rates include North Dakota (0.1%), West Virginia (0.1%), South Dakota (0.2%), Nebraska (0.3%), and Minnesota (0.4%).
Discussion
Our analysis finds that the vast majority of non-pediatric office-based physicians accept new patients. We also find that the share accepting new Medicare patients largely mirrors the share accepting new privately-insured patients, despite higher payments from private insurers relative to Medicare. This suggests that Medicare’s relatively lower payment rates for physician services do not generally lead to fewer physicians accepting new Medicare patients. We note, however, that due to data limitations we were unable to differentiate the extent to which physicians accepting new patients are accepting all, most, or just some new patients, or the timeliness of getting appointments and needed care. We also cannot assess how many physicians participate in any or all private insurance or Medicare Advantage networks, or the impact of concierge medicine on patients’ access to physician services.
The high share of non-pediatric, office-based physicians accepting new patients – both Medicare and privately insured – was consistent across most specialties, geographic areas, and physician and practice characteristics. Increasingly, hospitals are acquiring medical practices and providing more services in a hospital setting. Due to data limitations, we are unable to assess how these trends may affect access to physician services, either overall or for patients with different types of insurance.
Notably, psychiatrists are significantly less likely than other physicians to accept new patients with either Medicare or private insurance. This finding does not suggest that Medicare rates specifically contribute to access problems for beneficiaries, but it does raise a concern about access to psychiatrists and potentially other mental health practitioners, an issue that was likely exacerbated by the COVID-19 pandemic with the increase in the share of adults reporting symptoms of anxiety disorder and/or depressive disorder.
Despite concerns that lower physician fees paid by Medicare relative to fees paid by private insurance may disincentivize physicians from taking Medicare patients, our analysis suggests that Medicare beneficiaries continue to have good access to physicians, similar to people with private insurance.
This work was supported in part by Arnold Ventures. We value our funders. KFF maintains full editorial control over all of its policy analysis, polling, and journalism activities.
Methods
This analysis draws on data from the National Electronic Health Records Survey (NEHRS) for survey years 2011 through 2019 to examine the share of physicians accepting new patients across Medicare and private insurance. NEHRS is a nationally representative sample survey limited to office-based physicians who principally engage in patient care activities, are non-federally employed, are not in specialties of anesthesiology, pathology, and radiology, and are younger than 85 years of age at the time of the survey. Our analysis excludes physicians in adolescent medicine and all pediatric specialties. Physicians who did not know whether they accepted a form of payment were also excluded from the analysis. These physicians accounted for less than 5% of observations.
To examine physician acceptance rates by physician and practice characteristics, we pooled 2017 and 2019 NEHRS data due to sample size limitations that precluded analyses of single-year data stratified by different characteristics.
To examine physician acceptance rates by state, we drew on data from 2015 & 2017 NEHRS because 2018 & 2019 NEHRS does not include state-level data and the 2016 survey was not administered.
Trend analyses of physician acceptance rates do not include 2013 data because we were unable to exclude pediatric specialties for this year. Additionally, trend analyses do not include 2016 data because NEHRS was not administered that year.
Our analysis of NEHRS data includes some limitations. NEHRS does not ask respondents their reasons for not accepting new patients by insurance coverage, which limits our ability to fully ascertain factors that contribute to physician acceptance rates. Additionally, the survey does not inquire about the extent to which physicians accepting new patients are accepting all, most, or just some new patients. Another limitation to our analysis is that NEHRS is limited to office-based physicians and therefore, our findings cannot be generalizable to physicians practicing in hospitals or other outpatient departments. Further, the survey does not distinguish Medicare provided under managed care (i.e., Medicare Advantage) versus traditional Medicare. Therefore, whether physicians are more inclined to accept Medicare patients in either Medicare Advantage plans or traditional Medicare is unknown. Differences between states and physician characteristics may also reflect differences in the composition of the workforce.
Even with pooled data, there are limited sample sizes in some groups and some states. While all states have at least 50 observations, readers are cautioned that there is uncertainty around these estimates when making comparisons between states or groups.
This analysis also draws on Medicare opt-out affidavit data from the Centers for Medicare & Medicaid Services (CMS) to examine the extent to which non-pediatric physicians are opting out of Medicare. Medicare opt-out affidavit data is as of March 2022. We excluded pediatricians as well as other non-physician specialists. We obtained January 2022 data on the number of active allopathic and osteopathic physicians by specialty and state from Redi-data, Inc, which utilizes data from the American Medical Association (AMA) Physician Masterfile. One limitation of this analysis is that due to data source limitations, we were unable to exclude active physicians in professional activity other than patient care, such as research and administration. For more details on our methods on the Medicare opt-out analysis, please see the Methods section of the brief, “How Many Physicians Have Opted-Out of the Medicare Program?”.
KFF Analysts Find That Between 5.3 Million and 14.2 Million People Could Lose Medicaid Coverage Following the End of the Public Health Emergency and Continuous Enrollment Requirement, With an Unknown Number Able to Find New Coverage
Medicaid Enrollment is Expected to Grow By About 25 Percent, or 22.2 Million Enrollees, From FY 2019 Through FY 2022, Mainly Due To Continuous Enrollment Requirement in Place During COVID
The Enrollment Growth is Expected to Cost States Over $47 Billion Through FY 2022, But States Will Have Received $100 Billion to Cover New Medicaid Costs and Provide Additional General Fiscal Relief
Between 5.3 million and 14.2 million low-income people could lose Medicaid coverage following the end of the public health emergency and federal continuous enrollment requirement, KFF researchers find in a new analysis. We arrive at those estimates after examining two potential scenarios about how states might manage the resumption of eligibility redeterminations and disenrollments.
KFF analysts also project that, from fiscal year 2020 through fiscal year 2022, states will have collectively spent $47.2 billion to cover additional people enrolled in Medicaid because of the continuous enrollment requirement and will have received $100.4 billion in new federal funds to cover those costs and provide general fiscal relief through enhanced Medicaid matching funds.
Based on the analysis, we estimate that enrollment will have risen by 25 percent, to a projected 110.3 million, by the end of fiscal year 2022. That would be 22.2 million more people than were enrolled in fiscal 2019, before the pandemic. We attribute most of the increase to the continuous enrollment requirement that helped to ensure coverage for enrollees during the pandemic and halted churn or temporary lapses in coverage due to enrollees cycling on and off the program in short periods of time.
In a recent KFF survey of state Medicaid directors in the field in February 2022, state officials projected that median Medicaid enrollment would decline by 5 percent next year following the end of the public health emergency. Another KFF survey from January 2022 found states expect on average about 13 percent of Medicaid enrollees to be disenrolled following the end of the continuous enrollment requirement (with estimates ranging from 8% to over 30%).These recent survey results illustrate the great deal of uncertainty surrounding how states will implement the end of the continuous enrollment requirement and how many individuals will lose coverage.
In the new analysis, KFF researchers examine two potential scenarios based on these survey results, estimating that a 5 percent decline in Medicaid enrollment would translate into a decline of 5.3 million enrollees and a 13 percent decline in Medicaid enrollment would translate into a decline of 14.2 million enrollees. There was a wide range in state estimates, so in any given state the share of enrollees losing coverage could be lower or higher than these illustrative estimates.
The biggest losses are expected to be among adults made eligible for coverage by the Affordable Care Act’s Medicaid expansion, other adults eligible for Medicaid other than due to a disability, and children, as these were the groups that experienced the largest increase during the pandemic. Researchers did not examine how many of the people who lose Medicaid might be able to find coverage from other sources such as the ACA Marketplace, how many might become uninsured and how many might still be eligible for Medicaid but face barriers in retaining coverage.
In exchange for abiding by the continuous enrollment requirement, states became eligible for a 6.2 percentage point bump in the federal Medicaid match rate (“FMAP”) to help them manage rising enrollment and rapidly provide broader fiscal relief by allowing states to reduce state Medicaid spending at a time when states experienced significant drops in revenue early in the pandemic.
KFF analysts find that over time states will have received pandemic-related federal Medicaid money amounting to more than double the higher state Medicaid costs they have faced due to increased enrollment. We did not examine how states used the fiscal relief. State spending on Medicaid is likely to increase following the expiration of the public health emergency and the loss of enhanced federal funding, even after factoring in the expected declines in Medicaid enrollment.
States that have not expanded Medicaid under the ACA have tended to draw more federal fiscal relief than expansion states during the pandemic, chiefly because the enhanced federal matching money does not apply to the ACA adult expansion population.
The new analysis uses data from a companion KFF analysis also released today. In the second analysis, KFF researchers more closely examine typical Medicaid enrollment patterns before the pandemic.
The full analyses are:
Fiscal and Enrollment Implications of Medicaid Continuous Coverage Requirement During and PHE and After the PHE Ends
Unwinding the PHE: What We Can Learn From Pre-Pandemic Enrollment Patterns
For more data and analyses related to Medicaid and the pandemic, visit kff.org
The Families First Coronavirus Response Act (FFCRA), passed during the coronavirus pandemic, includes a Medicaid continuous enrollment requirement that prohibits states from disenrolling people from Medicaid in exchange for additional federal funds. The continuous enrollment requirement has prevented coverage loss and churn (moving off and then back on to coverage) among enrollees during pandemic and, along with other factors, has contributed to the substantial enrollment growth in Medicaid. From February 2020 to January 2022, total Medicaid/CHIP enrollment has increased by 15.7 million enrollees (22.1%). The continuous enrollment requirement will last until the end of the month in which with national public health emergency (PHE) ends. Currently, the PHE is in effect through mid-July 2022 and, at this time, it is expected that the continuous enrollment requirement will end August 1, 2022. The Biden administration has said it will give states 60 days’ notice before the PHE ends, and so if state are not notified by mid-May, the PHE will likely be extended further.
To help inform the current policy discussion and better understand the factors that contribute to Medicaid enrollment changes, this brief examines typical enrollment patterns for Medicaid and CHIP1 and uses 2018 Medicaid claims data to gain insight into the effects of the continuous enrollment requirements by eligibility group. Overall, we find that:
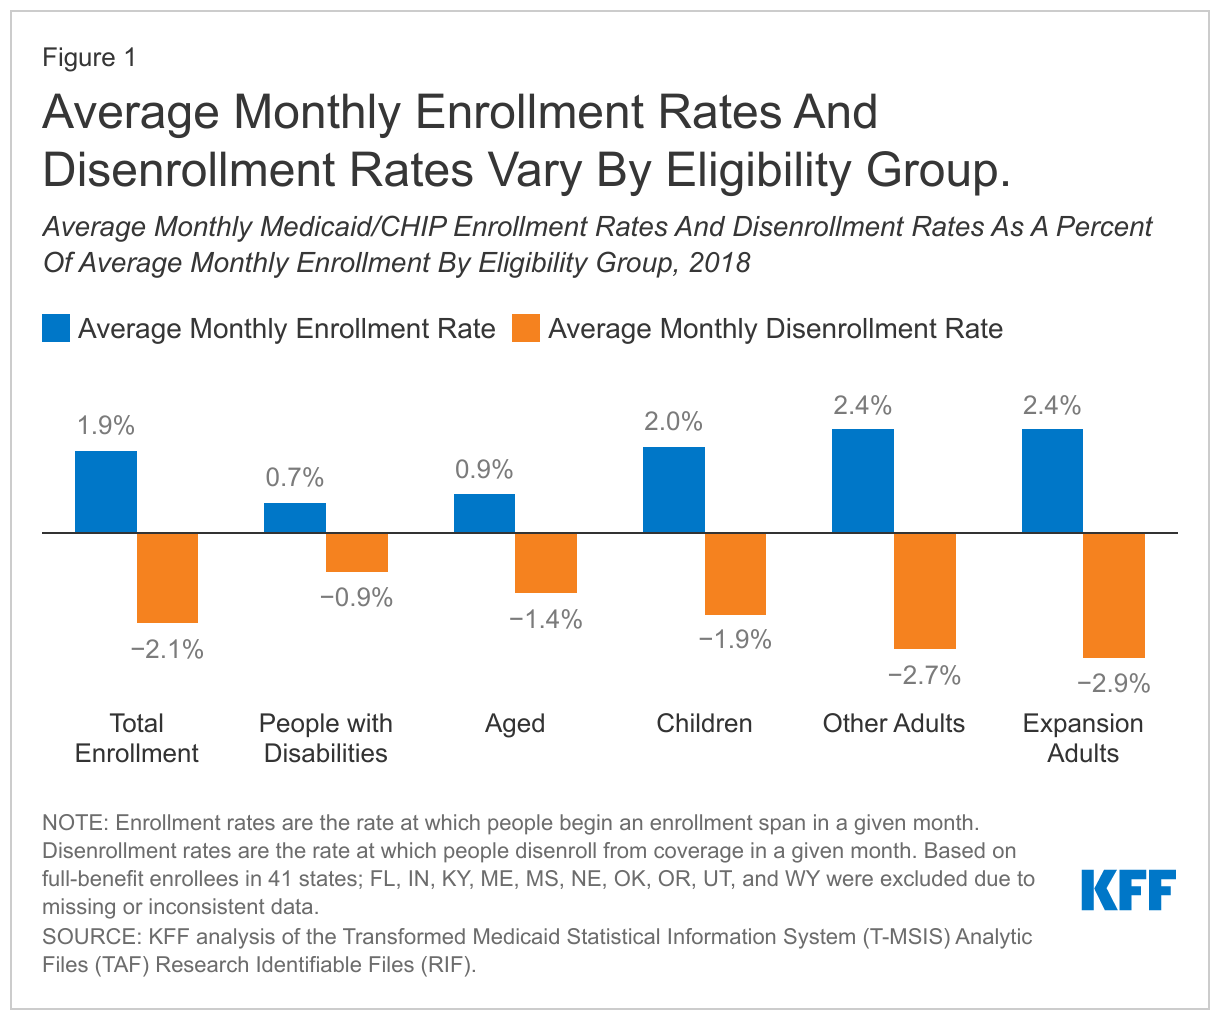
Roughly 2% of Medicaid enrollees come on or leave the program in an average month, although there is variation across eligibility groups.
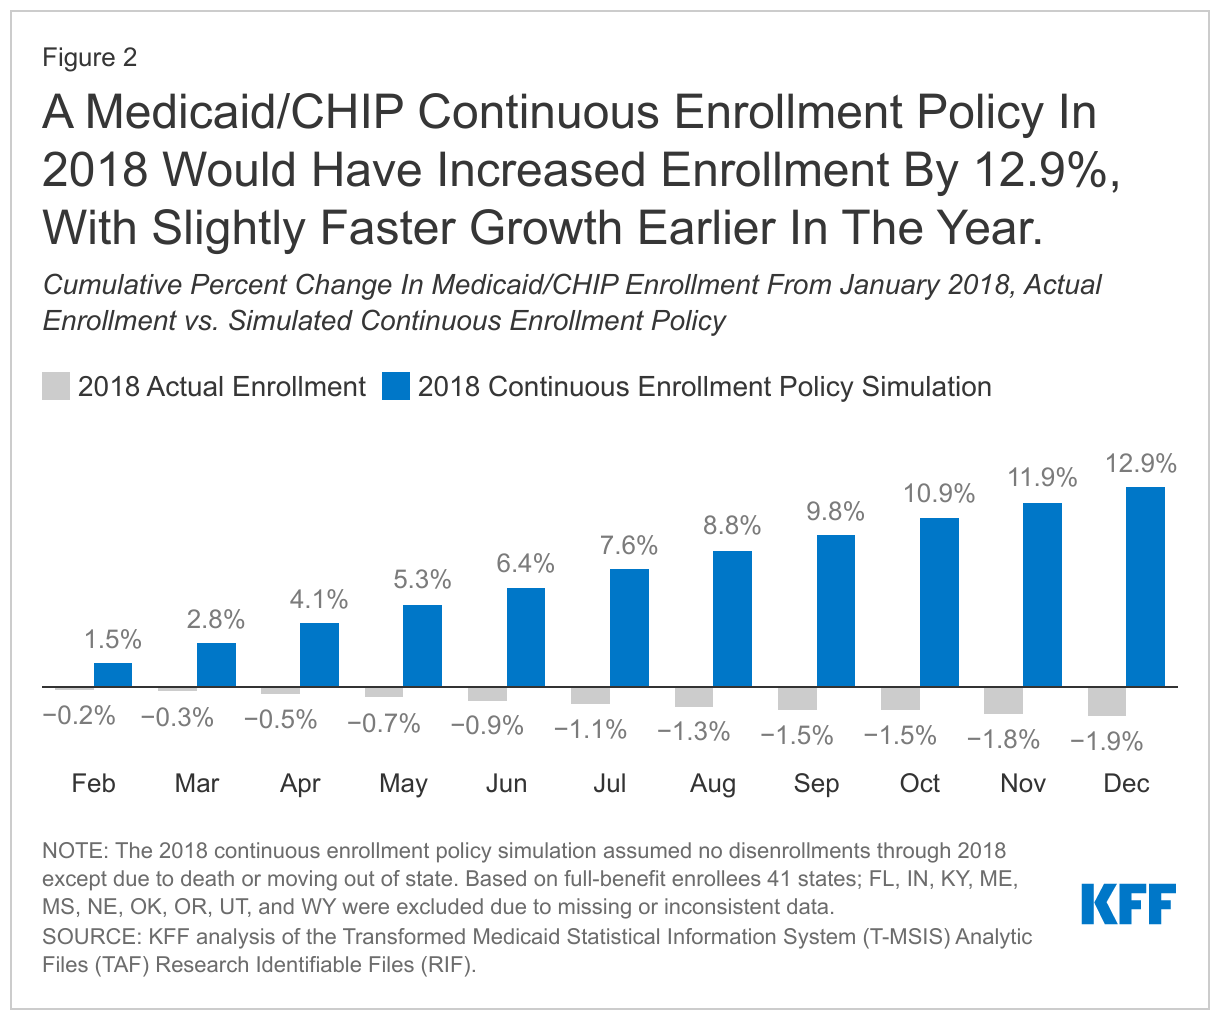
A policy to require continuous enrollment would result in sharp reductions in monthly disenrollment rates and would also reduce monthly enrollment rates due to reductions in churn.
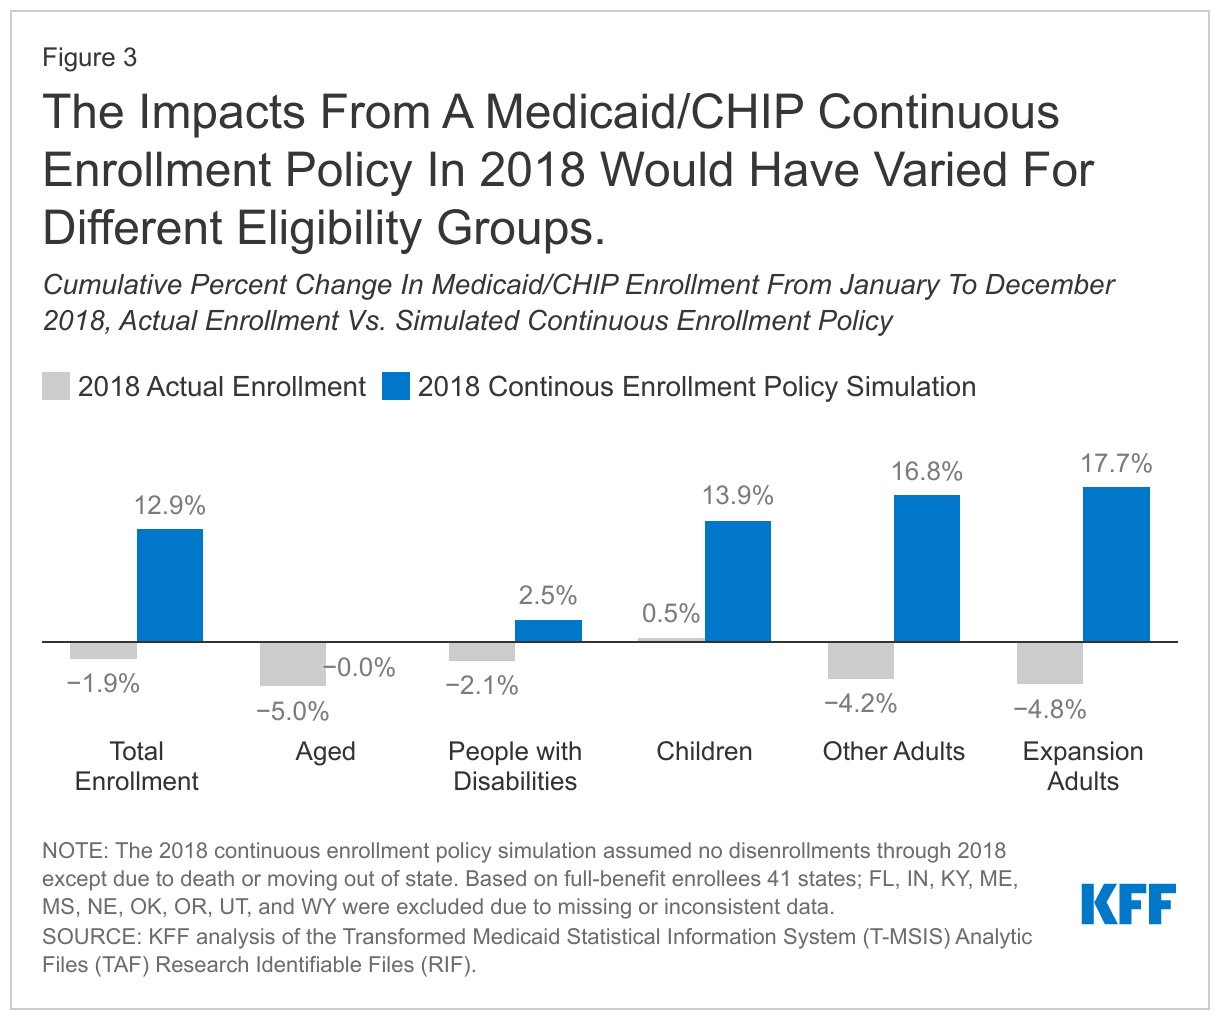
Based on data from 2018, the effect of continuous coverage would have greater impact on enrollment for children and non-elderly adults as they are more likely to experience higher rates of churn or income fluctuations affecting eligibility.
These findings from the simulation may help explain how the current continuous enrollment requirement may have contributed to Medicaid enrollment increases and what may happen with the unwinding of the PHE. A description of the data and methods underlying this analysis is in the Methods section at the end of the brief.
What factors contribute to enrollment changes over time?
Medicaid enrollment is driven by several factors, including economic conditions and policy choices. Medicaid is a countercyclical program, meaning that typically during economic downturns, more people qualify and enroll in Medicaid. Economic downturns were the primary driver of Medicaid enrollment growth in the 2001 recession and again during the Great Recession beginning in 2007. Medicaid enrollment also reflects policy changes. For example, Medicaid enrollment growth peaked in FY 2015 due to implementation of the Affordable Care Act (ACA) coverage expansions. Also, prior to the pandemic, enrollment declined in FY 2018 and FY 2019 and was relatively flat in FY 2020 before increasing sharply in 2021.
Enrollment trends reflect the net effect of people coming onto the program as well as people leaving the program. People typically enroll or disenroll from coverage for three main reasons:
Change in income (for example, a drop in income may make someone newly eligible, while an increase in income may make someone ineligible for Medicaid);
Change in circumstance other than income (for example, children may age out of coverage, people may move to another state or die); and
Barriers to renewing coverage that are not based on ongoing eligibility but may result in disenrollment (for example, forms to renew coverage may be confusing or someone may miss a deadline resulting in disenrollment).
It is often difficult to understand the relative magnitude of each of these factors in contributing to net enrollment changes over time.
What do data show about enrollment patterns?
In general, data show that about as many people enroll in Medicaid in a given month as disenroll, with small differences leading to changes in net monthly enrollment. In 2018, the average monthly disenrollment rate was 2.1% while the monthly enrollment rate (people beginning an enrollment span) was 1.9%, which resulted in a net monthly enrollment decline of 0.2% (Figure 1). Earlier research attributed this enrollment decline to a robust economy and to policies and processes in place that may have boosted disenrollment, such as more frequent checks on income or barriers to renewing coverage. At the same time, our analysis of data for other recent years showed similar patterns (approximately 2% of enrollees coming on or off the program each month), with the difference in monthly new enrollment and disenrollment rates leading to an overall increase or decrease in enrollment. As noted above, we expect patterns would have been different (with much higher enrollment rates relative to disenrollment rates) during the Great Recession and after the implementation of the ACA.
Average monthly enrollment and disenrollment rates vary by eligibility group (Figure 1). In 2018, both enrollment and disenrollment rates for elderly enrollees and enrollees with a disability were lower than rates for children and adults. In other words, in a given month, fewer elderly and disabled enrollees were entering and leaving the program relative to total enrollment in those groups compared to children and non-elderly adults. The elevated enrollment rates and disenrollment rates among children and adults reflect that they are more likely to experience income fluctuations affecting eligibility and also leading to higher rates of churn.
Not all enrollment and disenrollment reflects people newly entering or permanently leaving Medicaid. Another analysis that examined churn within Medicaid shows that, among people enrolled in 2018, approximately 10% experienced a gap in enrollment of less than a year. This suggests that the enrollment in each month reflects individuals who had been enrolled, then disenrolled, and then were re-enrolling after a gap in Medicaid coverage, as well as those who were newly eligible. Similarly, disenrollments in each month reflect some people who may re-enroll in Medicaid after a short gap, as well as those who transitioned from Medicaid to other coverage or become uninsured. As noted above, children and non-elderly adults experience the highest rates of churn compared to people with disabilities or enrollees ages 65 and over.
What happens to enrollment patterns under a continuous enrollment requirement?
To help understand the effects of the current Medicaid continuous enrollment policy, we examined what would have happened if there were a similar policy prohibiting disenrollment in place in 2018. Halting disenrollment (except for enrollees who were disenrolled due to a move out of state or death) lowered the average monthly disenrollment rate compared to actual 2018 (0.2% vs. 2.1%, respectively). Halting disenrollments in the simulation also lowered the average enrollment rate compared to actual 2018 (1.4% vs. 1.9%, respectively) due to eliminating churn. Over the course of the year, the simulated continuous enrollment policy resulted in a net increase in enrollment (12.9%, Figure 2) from January to December 2018 compared to the slight decrease in enrollment observed in actual 2018 (-1.9%). When looking at the monthly enrollment changes, the first few months of the simulation experienced slightly faster growth than the later months.
The simulated continuous enrollment policy led to much higher enrollment growth for children and non-elderly adults compared to people with disabilities and those ages 65 and older (Figure 3). This result was also expected, as these groups typically have higher turn-over (i.e., greater disenrollment and enrollment rates) and so they would experience bigger effects from a policy to stop disenrollment.
Children and expansion adults accounted for 76% of the enrollment change due to the simulated continuous enrollment policy for 2018 (Appendix Table 1). These findings are as of December 2018, or after 12 months of the simulated continuous enrollment policy. While the total number of enrollees are not complete because we exclude 10 states from the analysis, we estimate that actual enrollment declined by 1.2 million or 1.9% in 2018 for the 41 states included in our analysis. Under the simulated continuous enrollment policy, enrollment would have increased by 8.0 million or 12.9%. The net change would be an increase of 9.2 million in enrollment. We estimate that, of this net growth, children account for 43% of this net change and expansion adults make up 33% of the change. Other non-elderly adults not enrolled through the Medicaid expansion made up 18% of the net change. These three eligibility groups represent the largest share of total Medicaid/CHIP enrollment2 and also experienced higher average monthly enrollment and disenrollment rates in actual 2018. People with disabilities made up 3% of enrollment due to this net enrollment growth and people ages 65 and older made up 2%.
What to watch going forward?
Understanding historic enrollment patterns and the effects of a simulated policy to halt disenrollment in 2018 can help inform the current continuous enrollment requirement in place. Key findings suggest that, first, halting disenrollment has a significant effect on overall enrollment growth. Second, growth may be steeper when the policy is first put into place, but growth rates may slow as a result of lower churn. Third, the policy would have a significantly disproportionate effect on children and non-elderly adults relative to people with disabilities and those ages 65 and older. Finally, the simulated growth patterns reflect recent experience with Medicaid growth. We observed steep growth in Medicaid enrollment in calendar year 2020 when the continuous coverage policy was put into effect but, similar to the simulation, observed growth rates have slowed over time.
Overall growth rates may be harder to compare given the sharp differences in economic conditions in 2018 compared to recent experience. The fact that observed growth rates from February 2020 through January 2021 showed 13.5% growth, slightly higher than the one-year results of the simulation (12.9%), suggest that much of current growth is attributable to the continuous coverage rather than new enrollment. The economic effects of the COVID-19 recession are complex. Unlike prior recessions that resulted in large shifts in income and losses of employer coverage, this recession largely affected low-wage workers who may have already been eligible for Medicaid.
Finally, as the PHE expires and states are able to resume more routine renewals and disenrollments, our analysis (in addition to current enrollment reports) shows that a large share of non-elderly adults and children could be at risk of losing coverage, even if many continue to be eligible. Efforts to conduct outreach, education and provide enrollment assistance can help ensure that those who remain eligible are able to retain coverage and those who are no longer eligible can transition to other sources of coverage. The Centers for Medicare and Medicaid Services (CMS) released new guidance in March 2022 emphasizing continuity of coverage for enrollees after the end of the continuous enrollment requirement, and the guidance also extended the timeline for states to complete all redeterminations after the continuous enrollment requirement ends from 12 to 14 months (states will still need to initiate all redeterminations within 12 months). However, a recent survey of state officials shows that, as of January 2022, many states had not made key decisions about how to handle the resumption of disenrollments after the end of the PHE. State policy choices about how to prioritize pending eligibility actions, engage with stakeholders, conduct outreach to enrollees, and provide enrollment assistance will have important implications for the continuity of coverage for millions of Medicaid enrollees, especially non-elderly adults and children.
The authors thank former KFF Vice President Rachel Garfield for her role in writing this report and technical assistance with the analysis.
Methods
Data Source and Linkage
Our analysis is based on the Transformed Medicaid Statistical Information System (T-MSIS) Analytical Files (TAF) Research Identifiable Files (RIF). We include beneficiaries who were enrolled at any point in 2018. We use the 2018 Demographic Eligibility (DE) Base file to determine eligibility pathway based on last-best eligibility data. We draw enrollment dates from the 2017-2019 DE Dates files. Our analysis uses enrollment dates from 2017 and 2019 so that we are able to identify people who were enrolled from December 2017 into January 2018, as well as December 2018 into January 2019. Data for 2019 are from the preliminary version of the T-MSIS RIF. All other DE Base and DE Dates files are final versions (Release 1).
State Exclusion Criteria
We use 41 states in our analysis. We excluded 10 states (FL, IN, KY, ME, MS, NE, OK, OR, UT, and WY) due to missing or inconsistent data based on state-level information available at the DQ Atlas as well as our own analysis We relied on data quality assessments from DQ Atlas to exclude states that have a “medium concern”, “high concern”, or “unusable” data quality assessment for: (1) the average monthly Medicaid/CHIP enrollment compared to an external enrollment benchmark (Medicaid/CHIP Performance Indicator Data) (excluded five states (IN, KY, ME, MS, NE)); (2) the average length of enrollment gaps, and (3) the percent of beneficiaries with overlapping Medicaid and S-CHIP enrollment spans (no states were excluded based on measures 2 or 3). We further excluded states based on: (4) the percent of beneficiaries missing an eligibility group code (threshold of >=10%, excluded OR); (5) the percent of beneficiaries with only one enrollment span (threshold of >=99.5, excluded FL, KY, and WY); and (6) the percent of beneficiaries with three or more enrollment spans in a year (threshold of >=5%, excluded OK). Notably, our exclusion criteria related to the number of enrollment spans in a year (measures 5 and 6) are less restrictive than that in the DQ Atlas because we did not want to make assumptions about the number of enrollment spans in our analysis, but did want to remove extreme cases that are the most likely to represent inaccurate enrollment dates.
Beneficiary Linking, Eligibility Classification, and Exclusion
We linked individuals across years using BENE_ID, which are unique enrollee identifiers created by the Chronic Conditions Warehouse and are recommended for use when combining data for multiple years. We also use BENE_ID to link the DE Base and DE Dates files. We assigned restricted benefit status and eligibility group code using a last-best approach for 2018, which assigns eligibility based on the most recent eligibility code in 2018. We classified eligibility groups using a hierarchy that first checked if the eligibility group code was missing, then checked for medically needy eligibility, disability (under age 65), and expansion adult. Any enrollees in the DE Base file that had a non-missing eligibility code and had not been assigned an eligibility group through this hierarchy were then were assigned by age to children (ages 20 and under), adults (ages 21 to 64), and aged (ages 65 and over).
The 2018 DE Base files for 41 states in our analysis contained 74.0 million observations coded as full-benefit after removing a small number of “dummy” records that represent enrollees who have claims data but no eligibility data provided by the states. We removed observations missing eligibility codes (151,000 observations), people qualifying through a medically needy pathway (1.5 million observations), people missing a BENE_ID for linking files (953,000 observations), and people with duplicated BENE_ID (102,000 observations). After merging with the DE Dates files, there were less than 3,000 enrollees who did not have a matching BENE_ID in the DE Dates and DE Base files and were dropped from the final sample. Our final sample included 71.3 million unduplicated, full-benefit enrollees.
Calculating Enrollment Trends
The DE Dates files provide a start and end date for every enrollment span in our time period. However, the earliest start date in any DE Date file in January 1st of that year, and the latest end date is December 31st of that year. Using the 2017 and 2019 DE Dates files, linked by BENE_ID, we were able to identify people who started enrollment spans in January 2018 (versus people who were continuously enrolled from December 2017) and people who disenrolled in December 2018 (versus people who were continuously enrolled into January 2019). Before calculating monthly enrollment and disenrollment rates, we merged all overlapping and contiguous enrollment spans for enrollees, which we defined as enrollment spans that are separated by one day or less. For example, if a person has two enrollment spans with an end date and a start date that are one day apart (i.e., the person disenrolled and re-enrolled the next day), we considered these spans to be contiguous and merged them into one enrollment span. After merging overlapping and contiguous enrollment spans, we counted the number of enrollment starts and disenrollments in a month (the enrollment and disenrollment rates). Enrollment counts are de-duplicated counts of people enrolled at any point in the month. Average monthly net change in enrollment is the average of monthly enrollment change from January 2018 to December 2018.
Simulating A Continuous Enrollment Policy
To simulate a continuous enrollment policy in 2018, we assume that no one is disenrolled from Medicaid and CHIP except in cases of death or moving to a different state. We used the 2018 DE Base file to identify death dates. We used the 2018 and 2019 DE Bases files to identify people who moved states and then re-enrolled in Medicaid and CHIP (and used BENE_ID for linking files). Notably, we do not have information about why a person was disenrolled or length of time before they enrolled in another state (we only can see that they were enrolled in another state after disenrollment). In total, there were 1.5 million people disenrolled in the simulation due to death or moving out of state.
After accounting for death and moving, we de-duplicated enrollees with multiple spans in 2018. We then used each enrollee’s earliest enrollment date in 2018 (or, if continuously enrolled from 2017, kept the date from 2017), and extended coverage through the year unless the enrollee had a death date or “move out” date. Finally, using this simulated sample, we calculated monthly enrollment rates, disenrollment rates, and total enrollment as described above.
Our simulation has important differences from the current continuous enrollment requirement under the FFCRA. First, our simulation applies to Medicaid and CHIP; however, while the current continuous enrollment requirement under the FFCRA does not apply to separate CHIP programs. In total, 3.6% of enrollees in our sample were only enrolled in separate CHIP programs throughout 2018 (and never enrolled in Medicaid through the year). Additionally, our simulation does not match the economic conditions of the pandemic, and the simulation does not account for other related factors such as elevated death rates or state or federal policy actions facilitating enrollment in Medicaid, CHIP, or Marketplace coverage.
Appendix
Our simulation of a continuous enrollment policy in 2018 applies to both Medicaid and the Children’s Health Insurance Program (CHIP). Although the continuous coverage policy under the FFCRA does not apply to separate CHIP programs, it does apply to CHIP Medicaid expansion programs. See the Methods section for more details on the simulation. ↩︎
January 2018 enrollment was the same in the simulation analysis and in actual 2018. The share of total full-benefit Medicaid/CHIP enrollment for each eligibility group in January 2018 were as follows: children (48%), expansion adults (22%), other adults (13%), people with disabilities (11%), and individuals ages 65 and older (7%). See Appendix Table 1 for enrollment counts. ↩︎
PEPFAR, the U.S. global HIV program and largest commitment by any nation to address a single disease, was designed as a vertical, singularly-focused, global HIV initiative. While credited with helping to change the trajectory of the global HIV epidemic, some have argued that PEPFAR, and other vertical initiatives, risk “crowding out” other health investments, potentially resulting in worse, non-HIV-related health outcomes, while others have argued the opposite. In our recent analysis, which looked over the full course of the program, we found that PEPFAR was associated with large, significant declines in overall mortality in countries that received its support, suggesting a positive spillover effect of the program beyond HIV. Here, we look at seven maternal and child health measures to further assess this relationship. PEPFAR’s potential impact in this area is plausible, given its investment in the health workforce, laboratory services, and other aspects of health systems strengthening, estimated to total more than $1 billion per year, and its increased emphasis on reaching women where they receive prenatal care and seek immunizations and other services for their children. We analyze the change in these measures in 90 PEPFAR recipient countries between 2004-2018 compared to similar low- and middle-income countries. Our main findings are as follows:
PEPFAR was associated with significant, positive improvement in six of the seven maternal and child health measures assessed.
Specifically, PEPFAR countries experienced large, significant reductions in both maternal and child mortality, relative to what would have been expected in PEPFAR’s absence, over the course of the program. The child mortality rate was reduced by 35% and the maternal mortality rate was reduced by 25%. These effects were strongest where PEPFAR engages in more intensive planning and programming and invests more funding.
PEPFAR countries also experienced significant increases in childhood immunization rates in three areas – measles immunization (a 9% increase), DPT immunization (11%), and Hepatitis B immunization (8%) – and an increase in the percent of newborns protected against tetanus because their mothers were immunized against the disease (7%).
There was no significant association found between PEPFAR and the prevalence of anemia among women of reproductive age.
Taken together, these findings add to the evidence base that PEPFAR has had positive health spillover effects beyond just HIV, with no negative, “crowding-out” effects. As policymakers and others consider the future of the program, these findings can help to inform their discussions about how PEPFAR can best continue to reach HIV goals and contribute to broader health gains.
Introduction
PEPFAR, the U.S. global HIV program and largest commitment by any nation to address a single disease, was designed as a vertical, singularly-focused, global HIV initiative. In many countries, PEPFAR funding represents the largest external health investment of any donor, and often surpasses domestic HIV spending.1 While credited with saving millions of lives and helping to change the trajectory of the global HIV epidemic, some have argued that PEPFAR, and other vertical initiatives, could risk “crowding out”, or displacing, other health investments and efforts, potentially resulting in worse, non-HIV-related health outcomes.2 Others have argued that PEPFAR’s investments over time contribute to the broader health system.3 In both cases, most of the literature is from a decade or more ago. In our recent analysis4 , we examined PEPFAR’s impact through 2018 and found that it was associated with large, significant declines in overall mortality, suggesting a positive spillover effect beyond HIV. Here, working with researchers at Brandeis University, we use a quasi-experimental design to look at seven maternal and child health measures to further assess whether there were other health spillover effects, either positive or negative, in PEPFAR countries over this period.
Maternal and child health is an important area to examine. First, prior studies of PEPFAR’s association with such measures have found mixed results.5 Second, poor maternal and child health outcomes have presented ongoing challenges, concurrent with HIV, in low and middle income countries. Lastly, improving maternal and child health is a main target of the Sustainable Development Goals and of the U.S. government’s global health efforts.6 If PEPFAR is shown to have positive spillover effects on maternal and child health, it would suggest that HIV investments have yielded bigger dividends and that the program has served as a wider platform. However, if negative spillover effects are detected, it would suggest that PEPFAR investments may have worked at cross-purposes with these other health areas, diverting resources with detrimental results.
While PEPFAR does not directly fund non-HIV specific maternal and child health services, its potential impact in the area of maternal and child health is plausible given its significant investments in the health workforce, laboratory services, and other aspects of health systems strengthening, estimated to total more than $1 billion per year.7 Indeed, attention to the importance of strengthening the underlying health systems in the countries in which it works was specified in its original authorizing legislation8 and its first Congressionally-mandated strategy.9 This emphasis has been enhanced over time, particularly starting with PEPFAR’s 2008 reauthorization.10,11 Its current guidance to countries, used to prepare their annual programmatic and budgeting plans, states that “Plans should ensure that PEPFAR’s actions are supporting enduring public health systems and capabilities. That is, people and systems that serve the PEPFAR mission, but are trained and designed to be resilient public health assets for a long-term public health response to HIV, which can be adapted for responses to other public health threats and emergencies.”12 In addition, as part of PEPFAR’s effort to address HIV among women, particularly pregnant women, and children, it has increasingly emphasized reaching women where they receive prenatal care and seek immunizations and other services for their children, and on integrating services.13,14 Guidance provided to countries as early as 2006, for example, included the importance of providing routine childhood immunizations to children with HIV and stated that PEPFAR funds could be used for linking to immunization programs and referral and follow-up for immunization15 and country guidance has continued to encourage such linkages.
Box: Outcome Measures
1. Child mortality rate2. Maternal mortality ratio3. Measles immunization4. DPT immunizations5. HepB3 immunizations6. Newborns protected against tetanus7. Prevalence of anemia among women of reproductive age
For this analysis, we identified seven maternal and child health outcome measures16 (see Box). These measures were chosen because they represent global health target areas and because sufficient data were available for analysis. We used a difference-in-difference, quasi-experimental design to analyze the change in each measure in 90 PEPFAR countries between 2004, the first year in which PEPFAR funding began, and 2018, compared to a comparison group of 67 low- and middle-income countries. We tested several model specifications. Our final model specification controls for numerous baseline variables that may also be expected to influence the health outcomes examined and which help to make the non-PEPFAR group more comparable to the PEPFAR group. However, despite the strengths of the difference-in-difference model design, it is still possible that there may be other, unobservable ways in which comparison countries differed from PEPFAR countries, which could account for our results. (See methodology for more detail).
Findings
Between 2004 and 2018, PEPFAR was associated with significant, positive improvement in six of the seven maternal and child health measures assessed. These include both mortality measures and all but one immunization measure. There was no evidence of any negative, spillover effect.
The largest effects of PEPFAR’s investments were found in reductions in the child mortality rate. The child mortality rate was 34.7% lower in PEPFAR countries compared to what would have been expected if PEPFAR had been absent. These effects were greater in countries with more intensive planning and programming through the PEPFAR “COP” process17 , which are also countries with greater investment. Because we did not assess the independent effect of PEPFAR spending in COP countries, it is unclear if mortality declines were due to greater spending, more intensive planning and programming, or some combination of both. (See Figure 1 and Tables 5-6).
Figure 1: Percent Change in Child and Maternal Mortality Rates in PEPFAR Countries, 2004-2017/18*
The maternal mortality rate also declined significantly in PEPFAR countries, though not as steeply. Between 2004 and 2017 (the most recent year for which maternal mortality data were available), the maternal mortality rate was 24.6% lower than would have been expected. As with child mortality, these effects were greater18 in countries with more intensive planning and greater PEPFAR investment (see Figure 1 and Tables 5-6).
PEPFAR was also associated with significant improvements in childhood immunization rates in three areas – measles; diphtheria, tetanus, and pertussis (DPT); and Hepatitis B – and with increased protection against newborn tetanus. In each of these areas, PEPFAR countries saw greater increases in immunization against disease than would have been expected in PEPFAR’s absence. Measles immunization rates among children increased by 9%, DPT immunization by 11.3%, and Hepatitis B immunization by 8.4%. In addition, the percent of newborns protected against neonatal tetanus because their mothers were immunized against the disease increased by 6.9% (see Figure 2 and Tables 5-6). Spending intensity and planning, however, were not consistently correlated with greater increases or significantly different from what would have been expected.
Figure 2: Percent Change in Childhood Immunizations and Protection Against Newborn Tetanus in PEPFAR Countries, 2004-2018
PEPFAR was not associated with the final measure of maternal and child health assessed. The prevalence of anemia among women of reproductive age did decrease but this decline was not significant (see Tables 5-6).
Implications
These findings, which cover a longer time period than prior studies, add to the evidence base that PEPFAR has had positive health spillover effects, beyond just HIV. Our findings are particularly strong for child and maternal mortality, some of which likely capture reductions in HIV-related mortality itself but extend beyond these. For example, HIV accounted for 5.1% of the estimated 4 million child deaths in sub-Saharan Africa in 2003, compared to 1.6% of the estimated 2.8 million child deaths in 2018, a drop that would not fully drive the overall decline in child mortality.19 Similarly, HIV, which is not considered to be a direct cause of maternal mortality, was estimated to have accounted for 6.4% of maternal deaths in sub-Saharan Africa between 2003 and 2009.20 Beyond mortality, significant improvements were also found in several immunizations that protect children from disease. Additionally, we find no evidence of any negative, “crowding-out” effect of PEPFAR in maternal and child health.
Still, it is important to note that despite the strengths of the model design used here, it is possible that there may be other, unobservable ways in which comparison countries differed from PEPFAR countries, which could account for our results. Future analysis could seek to explore other factors that may contribute to these findings. It could also further explore the multiple and complex pathways that may help to explain the relationships between PEPFAR support and improved maternal and child health outcomes, and examine the change in other non-HIV specific health measures in PEPFAR countries over time.
Taken together, these findings indicate that U.S. investments in PEPFAR, which have altered the trajectory of the HIV epidemic, saving millions of lives, have also paid significant dividends beyond HIV alone. As policymakers and others consider the future of the program, these findings can help to inform their discussions about how PEPFAR can best continue to reach HIV goals and contribute to broader health gains.
Methods
We used a difference-in-difference21 , quasi-experimental design to estimate a “treatment effect” (PEPFAR), compared to a group without the intervention (the counterfactual). The difference-in-difference design compares the before and after change in outcomes for the treatment group to the before and after change in outcomes for the comparison group. We constructed a panel data set for 157 low- and middle- income countries between 1990 and 2018. Our PEPFAR group included 90 countries that had received PEPFAR support (between 2004 and 2018). Our comparison group included 67 low- and middle-income countries that had not received any PEPFAR support or had received minimal PEPFAR support (<$1M over the period or <$.05 per capita) between 2004 and 2018. The pre-intervention period was 1990 to 2003 and post intervention period was 2004 to 2018 for all measures except maternal mortality (2000-2003 and 2004-2017) and prevalence of anemia among women of reproductive age (1990-2003 and 2004-2016), due to data limitations. Data on PEPFAR spending by country were obtained from the U.S. government’s https://foreignassistance.gov/ database and represent U.S. fiscal year disbursements; data for other measures were obtained from the World Bank’s World Development Indicator database and the Institute for Health Metrics and Evaluation (IHME), unless otherwise noted. Our outcomes of interest, their definitions, and sources are listed in Table 1. Baseline variables and sources are listed in Table 2.
Table 1: Outcome Variables
Variable
Definition
1. Child mortality rate
Probability of a child dying between birth and 5 years of age, per 1,000 live births.
2. Maternal mortality ratio
Number of women who die from pregnancy-related causes while pregnant or within 42 days of pregnancy termination per 100,000 live births
3. Measles immunization
Percent of children ages 12-23 months who received the measles vaccination
4. DPT immunizations
Percent of children ages 12-23 months who received DPT vaccinations (3 doses)
5. HepB3 immunizations
Percent of children ages 12-23 months who received hepatitis B vaccinations (3 doses)
6. Newborns protected against tetanus
Percentage of births by women of child-bearing age who are immunized against tetanus
7. Prevalence of anemia among women of reproductive age
Prevalence of anemia among women of reproductive age (% of women ages 15-49)
United Nations, Department of Economic and Social Affairs, Population Division (2019). World Population Prospects 2019, Online Edition. Rev, https://population.un.org/wpp/
We explored several difference-in-difference model specifications, compared to an unadjusted model (see Table 3). Each specification controlled for numerous baseline variables that may be expected to influence the outcome of interest to help make the non-PEPFAR group more comparable to the PEPFAR group. Baseline means for outcome variables are provided in Table 4. Final results are presented in Tables 5-6 and are from model specification #3, and significance is only reported in the analysis for results at the p<0.001 level. Other model specifications generally produced similar results, with the exception of one model that included other donor spending on health as an annual variable; this may be due to the potential confounding of this measure with PEPFAR spending itself. The appendix provides trend data for each outcome variable in PEPFAR and comparison countries over the full study period.
Table 3: Model Specifications
Model
Difference-in Difference Specification
1
Unadjusted model
2
Includes baseline variables 1-9 (and an additional baseline variable for disease incidence, 12-16, depending on outcome measure)
3
Includes baseline variables 1-11 (and an additional baseline variable for disease incidence, 12-16, depending on outcome measure)
4
Includes baseline variables 1-9 (and an additional baseline variable for disease prevalence, 12-16, depending on outcome measure) and yearly per capita donor spending on health (non-PEPFAR) by all donors
Despite the strengths of the difference-in-difference design, there are limitations to this approach. While we adjusted for numerous baseline factors that could be correlated with our outcomes of interest, there may be other, unobservable factors that are not captured here. Similarly, while our baseline factors are also intended to adjust for selection bias, there may be other ways in which comparison countries differed from PEPFAR countries (and factors which influenced which countries received PEPFAR support), which could bias the estimates.
Table 4: Baseline Means, PEPFAR Countries, 2004
Outcome Measure
All PEPFAR countries
COP countries
Non-COP countries
High spending
Medium spending
Low spending
Child Mortality Rate
78.9
97.9
68.9
99.5
71.8
65.4
Maternal Mortality Rate
409.8
497.5
363.7
519.6
345.5
364.4
Measles Immunization
77.5
74.5
79.1
72.9
79.9
79.7
DPT Immunizations
78.0
74.2
79.9
74.8
80.1
79.0
Hepatitis B Immunizations
79.1
74.4
81.7
80.7
78.3
78.5
Anemia among women of reproductive age
37.0
39.0
36.0
38.6
36.3
36.2
Newborns protected against tetanus
75.7
75.6
75.8
75.1
78.3
74.2
Table 5: Estimates of PEPFAR’s Impact by Measure, 2004-2018 (Percent change from Mean)
Outcome Measure
All PEPFAR countries
COP countries
Non-COP countries
High spending
Medium spending
Low spending
Child Mortality Rate
-34.7%***
-36.4%***
-33.6%***
-40.5%***
-30.4%***
-32.4%***
Maternal Mortality Rate
-24.6%***
-26.3%***
-23.5%***
-26.1%***
-29.0%***
-18.9%***
Measles Immunization
9.0%***
10.0%***
8.3%***
9.5%***
6.7%***
10.8%***
DPT Immunizations
11.3%***
11.2%***
11.1%***
12.5%***
8.7%***
12.8%***
Hepatitis B Immunizations
8.4%***
18.3%***
4.5%*
9.8%**
7.5%**
6.9%*
Anemia among women of reproductive age
-2.8%
-4.1%*
-2.1%
-5.7%**
-2.0%
-0.7%
Newborns protected against tetanus
6.9%***
4.9%*
8.4%***
7.1%**
6.3%**
7.3%**
***p < 0.001 **p < 0.01 *p < 0.05
Table 6: Estimates of PEPFAR’s Impact by Measure, 2004-2018(Percentage point difference-in-difference from means; standard errors in parentheses)
Outcome Measure
All PEPFAR countries
COP countries
Non-COP countries
High spending
Medium spending
Low spending
Child Mortality Rate
-27.383***
-35.668***
-23.168***
-40.243***
-21.807***
-21.179***
(1.424)
(1.694)
(1.426)
(1.898)
(1.835)
(1.855)
Maternal Mortality Rate
-100.742***
-130.898***
-85.399***
-135.678***
-100.044***
-68.936***
(15.131)
(13.809)
(15.927)
(20.151)
(19.495)
(19.701)
Measles Immunization
6.946***
7.462***
6.560***
6.947***
5.339***
8.571***
(0.748)
(0.894)
(0.772)
(1.006)
(0.984)
(0.983)
DPT Immunizations
8.810***
8.693***
8.889***
9.350***
6.999***
10.113***
(0.705)
(0.830)
(0.729)
(0.946)
(0.925)
(0.925)
Hepatitis B Immunizations
6.667***
13.641***
3.638*
7.875**
5.901**
5.385*
(1.545)
(2.102)
(1.674)
(2.436)
(2.011)
(2.220)
Anemia among women of repro. age
-1.023
-1.581*
-0.740
-2.184**
-0.724
-0.252
(0.550)
(0.702)
(0.556)
(0.736)
(0.712)
(0.720)
Newborns protected against tetanus
5.240***
3.736*
6.393***
5.338**
4.921**
5.398**
(1.300)
(1.472)
(1.403)
(1.534)
(1.653)
(1.606)
***p < 0.001 **p < 0.01 *p < 0.05
Jen Kates is with KFF. Gary Gaumer, William Crown, Dhwani Hariharan, and Allyala Nandakumar are with Brandeis University.
Appendix
Figure A1: Child Mortality Rate,1990-2018, PEPFAR and Comparison CountriesFigure A2: Maternal Mortality Rate, 2000-2017, PEPFAR and Comparison CountriesFigure A3: Measles Immunization,1990-2018, PEPFAR and Comparison CountriesFigure A4: DPT Immunizations,1990-2018, PEPFAR and Comparison CountriesFigure A5: Hep B Immunizations,1990-2018, PEPFAR and Comparison CountriesFigure A6: Newborns Protected Against Tentanus,1990-2018, PEPFAR and Comparison Countries
Endnotes
State Department, PEPFAR Global Stakeholders Briefing, November 23, 2021. ↩︎
See, for example: Shiffman J, “Has donor prioritization of HIV/AIDS displaced aid for other health issues?” Health Policy Plan, 2008 Mar, 23(2): 95-100; Lordan G, Tang KK, Carmignani F, “Has HIV/AIDS displaced other health funding priorities? Evidence from a new dataset of development aid for health,” Soc Sci Med, 2011 Aug, 73(3): 351-355; Barbiero VK, “Fulfilling the PEPFAR mandate: a more equitable use of PEPFAR resources across global health”, Glob Health Sci Pract, 2013 Nov 14,1(3): 289-293. ↩︎
See, for example: Embrey M, Hoos D, Quick J, “How AIDS funding strengthens health systems: progress in pharmaceutical management”, J Acquir Immune Defic Syndr, 2009 Nov, 52 Suppl 1: S34-37. Walensky RP, Kuritzkes DR, “The impact of the President’s Emergency Plan for AIDS Relief (PEPFAR) beyond HIV and why it remains essential”, Clin Infect Dis, 2010 Jan 15, 50(2): 272-275; Rasschaert F, Pirard M, Philips MP, Atun R, Wouters E, Assefa Y, Criel B, Schouten EJ, Van Damme W, “Positive spill-over effects of ART scale up on wider health systems development: evidence from Ethiopia and Malawi”, J Int AIDS Soc, 2011 Jul 6,14 Suppl 1: S3. Bendavid E, Holmes CB, Bhattacharya J, Miller G, “HIV Development Assistance and Adult Mortality in Africa”, JAMA, 2012, 307(19): 2060-2067. ↩︎
See, for example: Brugha R, Simbaya J, Walsh A, Dicker P, Ndubani P, “How HIV/AIDS scale-up has impacted on non-HIV priority services in Zambia”, BMC Public Health, 2010,10: 540; Kruk ME, Jakubowski A, Rabkin M, Elul B, Friedman M, El-Sadr W, “PEPFAR programs linked to more deliveries in health facilities by African women who are not infected with HIV”, Health Aff (Millwood), 2012 Jul 31(7): 1478-1488; Grépin KA, “HIV donor funding has both boosted and curbed the delivery of different non-HIV health services in sub-Saharan Africa”, Health Aff (Millwood), 2012 Jul 31(7):1406-1414; Luboga SA, Stover B, Lim TW, Makumbi F, Kiwanuka N, Lubega F, Ndizihiwe A, Mukooyo E, Hurley EK, Borse N, Wood A, Bernhardt J, Lohman N, Sheppard L, Barnhart S, Hagopian A, “Did PEPFAR investments result in health system strengthening? A retrospective longitudinal study measuring non-HIV health service utilization at the district level.” Health Policy Pla, 2016 Sep 31(7). ↩︎
The program’s 2003 authorizing legislation states that the “magnitude and scope of the HIV/AIDS crisis demands a comprehensive, long-term, international response focused upon addressing the causes, reducing the spread, and ameliorating the consequences of the HIV/AIDS pandemic, including…. development of health care infrastructure and delivery systems through cooperative and coordinated public efforts and public and private partnerships”. See, Public Law 108–25—May 27, 2003, 117 STAT. 715. Available at: https://modern.kff.org/wp-content/uploads/2021/12/PEPFAR-Original-Legislation-2003-PL-108-25.pdf↩︎
The first strategy states that, “While mobilizing rapid scale-up for treatment availability, the Emergency Plan will also lay the foundation for sustainable high-quality treatment programs. This will be accomplished by: Strengthening national human resource capacity through health care worker recruitment and retention strategies, longer-term training, and technical assistance; Establishing, disseminating, and implementing treatment protocols; Developing the capacity of new partners; and Developing and strengthening health infrastructure. See, President’s Emergency Plan for AIDS Relief: U.S. Five-Year Global AIDS Strategy, 2004. Available at: https://modern.kff.org/wp-content/uploads/2021/12/PEPFAR-Original-5-Year-Strategy-2004.pdf. ↩︎
We examined two other maternal and child health measures for potential inclusion (receipt of prenatal care and modern contraceptive prevalence) but these did not meet the difference-in-difference parallel trend assumption (that in the absence of an intervention, the difference between the treatment and comparison group is constant over time) and therefore were not included in our final selection. ↩︎
A subset of PEPFAR countries prepare annual Country Operational Plans (COPs). COPs are developed through a multi-stakeholder planning process, document planned investments and results, and serve as a basis for approval of final PEPFAR funding. ↩︎
As measured by percentage point difference, see Table 6. ↩︎
Analysis of data from the Institute for Health Metrics and Evaluation (IHME), GHDx, VizHub. Available at: https://vizhub.healthdata.org/gbd-compare/. Accessed February 17, 2022. ↩︎
Say L, Chou D, Gemmill A, Tunçalp Ö, Moller AB, Daniels J, Gülmezoglu AM, Temmerman M, Alkema L. “Global causes of maternal death: a WHO systematic analysis.” Lancet Glob Health. 2014 Jun;2(6):e323-33. ↩︎
Gertler, Paul J., Sebastian Martinez, Patrick Premand, Laura B. Rawlings, and Christel M. J. Vermeersch. 2016. Impact Evaluation in Practice, second edition. Washington, DC: Inter-American Development Bank and World Bank. Available at: https://openknowledge.worldbank.org/handle/10986/25030. ↩︎
Under longstanding immigration policy, federal officials can deny entry to the U.S. or adjustment to lawful permanent resident (LPR) status (i.e., a “green card”) to someone they determine to be a public charge. On September 9, 2022, the Biden Administration published new public charge inadmissibility regulations.1 that have largely codified 1999 field guidance governing public charge determinations and these regulations went into effect on December 23, 2022.2 The Biden Administration returned to use of this 1999 field guidance in March 2021, when it stopped applying public charge regulations implemented by the Trump Administration in 2019 that had newly considered the use of noncash assistance programs, including Medicaid, in public charge determinations.3,4 Under the final rule and the 1999 field guidance, the government will not consider use of noncash benefit programs, including Medicaid coverage, except for long-term institutionalization, when making public charge determinations. A primary stated aim of the final public charge rule is to address chilling effects of the 2019 rule that led many immigrant families, including citizen children in these families, to not seek assistance, including health coverage and care, for which they were eligible.5,6,7
This brief provides an overview of the public charge rule and discusses its potential impacts for health coverage and care of immigrant families.
History of Public Charge Policies
The concept of denying entry to immigrants on the basis of becoming a “public charge” was first introduced into federal legislation as part of the Immigration Act of 1882, which was the first act to regulate immigration at the federal level.8This Act permitted the government to prevent any person “unable to take care of himself or herself without becoming a public charge” from entering the country. A subsequent revised version of the Act allowed the government to deny entry to “paupers or persons likely to become a public charge,” and allowed the deportation of any who did become a public charge within a year. Certain immigrants, including refugees and asylees and other humanitarian immigrants, are exempt from public charge determinations under law.9 Immigration officials must consider, at a minimum, an individual’s age, health, family status, assets, resources, and financial status, and education and skills when making a public charge inadmissibility determination. However, federal legislation does not define who should be considered a public charge, leaving substantial discretion to immigration officials to make those determinations.
In 1999, the Department of Justice issued Field Guidance on Deportability and Inadmissibility on Public Charge Grounds. This field guidance defined a public charge as “an alien who has become or is likely to become primarily dependent on the federal government for subsistence as demonstrated by either (i) the receipt of public cash assistance for income maintenance or (ii) institutionalization for long-term care at government expense.“ In response to confusion about whether the use of Medicaid, the Children’s Health Insurance Program (CHIP), and other non-cash programs applied in public charge determinations, the guidance further clarified that immigration officers should not place any weight on the receipt of non-cash public benefits (other than institutionalization) with respect to determinations of admissibility or eligibility for adjustment to LPR status.
In 2019 theTrump Administration issued new regulations that broadened the scope of programs that the federal government would consider in public charge determinations to include previously excluded health, nutrition, and housing programs. The regulations also redefined a public charge as an “alien who receives one or more public benefits for more than 12 months in the aggregate within any 36-month period (such that, for instance, receipt of two benefits in one month counts as two months),” and defined public benefits to include federal, state, or local cash benefit programs for income maintenance and certain health, nutrition, and housing programs, including non-emergency Medicaid for non-pregnant adults, the Supplemental Nutrition Assistance Program (SNAP), and several housing programs. It also identified characteristics that would be considered as negative factors and heavily weighted negative factors that increase the likelihood of someone becoming a public charge, including prior receipt of public benefits (for more than 12 months within the prior 36 months) and having income below 125% of the federal poverty level (FPL) ($28,787 for a family of three as of 2022), as well as positive factors and heavily weighted positive factors that decrease the likelihood of someone becoming a public charge.
Impacts of the 2019 Trump Administration Changes
Research suggests that the 2019 Trump Administration changes to public charge policy and other immigration policy changes increased fears among immigrant families about participating in programs and seeking services, including health coverage and care.10 Although very few people subject to public charge determinations are eligible for the public programs listed in the 2019 rule due to the programs’ restrictions on eligibility for immigrants, the rule had much broader chilling effects on program participation across immigrant families.11 Fears and confusion related to the rule led to individuals forgoing enrollment in or disenrolling themselves and their children from programs. Prior KFF analysis estimated that the rule could lead to disenrollment of between 2.0 to 4.7 million Medicaid and CHIP enrollees who are noncitizens or citizens living in a family with a noncitizen if the rule led to disenrollment rates ranging from 15% to 35%. A 2021 KFF survey of Hispanic adults found that 1 in 4 potentially undocumented Hispanic adults and over 1 in 10 lawful permanent resident Hispanic adults reported that they or a family member did not participate in a government assistance program in the past three years due to immigration-related fears (Figure 1).12 Similarly, a KFF survey of Asian community health center patients found that over 50% reported not having enough information about how recent immigration policy changes, including the public charge rule, impact them and their family, and 1 in 4 reported that they or a family member in their household avoided participating in a publicly-funded health, nutrition, or housing program in the past 12 months due to immigration-related fears.13
Research also suggests that immigration-related fears haveaffected willingness to access COVID-19 vaccines. For example, KFF COVID-19 Vaccine Monitor survey data from May 2021 found that almost 4 in 10 unvaccinated Hispanic adults (rising to 58% of those who are potentially undocumented) said they were concerned that they may be required to provide a government-issued identification or Social Security number to get vaccinated and about one third (rising to 63% of the potentially undocumented) were concerned that getting the vaccine would negatively affect their own or a family member’s immigration status.
Overview of the 2022 Final Rule on Public Charge
The Biden Administration reversed the public charge policy changes implemented by the Trump Administration. Following an array of court actions challenging implementation of the 2019 Trump Administration changes to public charge policies, in March 2021, the Biden Administration filed motions asking the Supreme Court to dismiss the federal government’s appeal to maintain the rule and reinstated use of the 1999 field guidance to govern public charge determinations. It subsequently proposed a new public charge rule on February 24, 2022, which would largely codify the 1999 field guidance. The final rule was published on September 9, 2022 and went into effect on December 23, 2022.
A primary purpose of the 2022 public charge rule is to address the chilling effects of the 2019 rule on immigrant families’ participation in public programs, including Medicaid and CHIP. As mentioned in the preamble, “DHS believes that, in contrast to the 2019 Final Rule, this proposed rule would effectuate a more faithful interpretation of the statutory concept of ‘‘likely at any time to become a public charge’’; avoid unnecessary burdens on applicants, adjudicators, and benefits-granting agencies; and mitigate the possibility of widespread ‘‘chilling effects’’ with respect to individuals disenrolling or declining to enroll themselves or family members in public benefits programs for which they are eligible, especially by individuals who are not subject to the public charge ground of inadmissibility.” The preamble also discusses the 2019 rule’s chilling effects on immigrant families during the COVID-19 pandemic, contributing to ‘‘reduce[d] access to vaccines and other medical care, resulting in an increased risk of an outbreak of infectious disease among the general public,’’ which could perpetuate inequities in morbidity and mortality due to the pandemic.
The 2022 public charge rule returned to the 1999 public charge definition of someone who is likely to become primarily dependent on the federal government as demonstrated by the use of cash assistance programs for income maintenance or government-funded institutionalized long-term care, such as mental health or nursing home care (Table 1). Under the final rule, the federal government will only consider cash assistance programs, including Supplemental Security Income (SSI), Temporary Assistance for Needy Families, and state, local, and Tribal cash assistance to pay for basic needs such as rent, food, and utilities. It also will consider “long-term government assistance for institutionalization,” including that provided in a nursing home or mental health institution. Long-term institutionalization at government expense would be the only category of Medicaid-funded services to be considered in public charge determinations. The 2022 rule clarifies that “long-term institutionalization” excludes institutionalization for short periods for rehabilitation and institutionalization that violates federal discrimination laws (such as the Americans with Disabilities Act).14 The rule also specifies that it excludes receipt of home and community-based services, including those provided through Medicaid. Moreover, to mitigate chilling effects, the 2022 rule clarifies that applying for a public benefit, being approved for benefits in the future, assisting someone else to apply for benefits, or being in a household or family with someone who receives benefits would not constitute receipt of public benefits for consideration of public charge. This represents a change from the 1999 Field Guidance, which allowed for consideration of a noncitizen’s family’s reliance on public cash benefits as the sole means of support for the family.
The rule applies a forward-looking test to public charge determinations, where adjudicators predict whether a person could become a public charge in the future based on present factors including age, family status, income and resources, education, and health status. Under the 2022 rule, the aforementioned statutory minimum factors must be analyzed in their totality, and no single factor, other than the lack of a sufficient Affidavit of Support, when required, would control the decision. Under the 2019 rule, public charge determinations also were based on a totality of circumstances, but the rule further specified that certain factors should we weighted as negative or positive or heavily weighted negative or positive factors in determinations. For example, officials were directed to consider receiving public benefits for more than 12 months in a 36-month period as a heavily weighted negative factor. The 2022 rule eliminates this practice of separately defining each factor and assigning its weight, noting that, “each inadmissibility determination must be individualized and based on the evidence presented in the specific case, and the relative weight of each factor and associated evidence is necessarily determined by the presence or absence of specific facts. Consequently, the designation of some factors as always ‘‘heavily weighted’’ suggested a level of mathematical precision that would be unfounded and inconsistent with the long-standing standard of considering the totality of the individual’s circumstances.” In addition, under the 2022 public charge rule, U.S. Citizenship and Immigration Services officers are required to articulate a reason for every public charge determination.
Table 1: Public Charge Definition and Programs Considered Under 2019 Rule and 2022 Final Rule
2019 Rule
2022 Final Rule
Public Charge Definition
More likely than not at any time in the future to receive one or more public benefits for more than 12 months in the aggregate within any 36-month period (such that, for instance, receipt of two benefits in one month counts as two months).
Likely to become primarily dependent on the federal government as demonstrated by use of cash assistance programs or government-funded institutionalized long-term care.
Programs Considered in Public Charge Determinations
SSI
TANF
Federal, state, or local cash benefit programs for income maintenance
Non-emergency Medicaid for non-pregnant adults over age 21
SNAP food assistance
Housing assistance
SSI
TANF
State/local cash assistance programs
Long-term institutionalization at government expense (including Medicaid coverage for institutional services)
Heavily Weighted Negative Factors
Has received one or more public benefits for more than 12 months in the aggregate within the prior 36 months
Not a full-time student and is authorized to work, but is unable to demonstrate employment, recent employment, or a reasonable prospect of future employment
Has a medical condition that requires extensive treatment or institutionalization and is uninsured and does not have sufficient resources to pay for medical costs related to the condition
Previously found inadmissible or deportable on public charge grounds
Not specified. Statutory minimum factors (age, family status, health, education, income and resources) must be considered in their totality.
Heavily Weighted Positive Factors
Household has financial assets/resources of at least 250% of the FPL
Authorized to work or employed with an income of at least 250% of the FPL
Individual has private insurance that is not subsidized by Affordable Care Act tax credits
Implications
The Biden Administration's changes to public charge policies are intended to reduce fears of accessing programs, but it will likely require sustained community-level efforts to rebuild trust and reduce fears among families. Prior experience suggests that outreach and education from trusted members of the community will be important for helping to alleviate fears and that direct one-on-one assistance will be key for facilitating enrollment of eligible people into programs for which they and their children are eligible, including Medicaid and CHIP.15 The Biden Administration recently increased funding for Navigators to help eligible individuals enroll in Marketplace, Medicaid, and CHIP coverage with a focus on individuals with limited English proficiency (LEP), communities of color, and rural areas, which may facilitate increased enrollment of eligible individuals in immigrant families.16 However, broader multilingual outreach efforts focused on helping families understand the changes to the rule will also likely be important.
Even with community level outreach and enrollment efforts, some families may remain fearful and confused about the policy. For example, in earlier research, some families have expressed concerns that rules may change in the future. Moreover, some families may remain confused about the policy. In particular, the continued inclusion of long-term institutional care covered by Medicaid in public charge determinations prevents clear and simple messaging that all Medicaid coverage is excluded from public charge determinations. This consideration of long-term institutional care also disproportionately affects people with disabilities and older adults, who are more likely to use long-term institutionalization services.
Increased enrollment of eligible uninsured immigrants may help to close gaps in health coverage for immigrant families, but many uninsured immigrants remain ineligible for coverage. Overall, noncitizen immigrants are significantly more likely than citizens to be uninsured.17 In 2020, among the nonelderly population, 26% of lawfully present immigrants and about four in ten (42%) undocumented immigrants were uninsured compared to less than one in ten (8%) citizens. Moreover, among citizen children, those with at least one noncitizen parent were significantly more likely to be uninsured as those with citizen parents (10% vs. 4%). Most (81%) uninsured lawfully present immigrants are eligible for a coverage option under the ACA but are not enrolled, so facilitating enrollment of eligible individuals may help to narrow these coverage gaps. However, other immigrants, including undocumented immigrants, remain ineligible for federal health coverage options, and will continue to face increased challenges accessing health care.
Asian, Native Hawaiian, and Other Pacific Islander (NHOPI) people are a diverse and growing population in the United States. Asian people are the fastest-growing racial or ethnic group in the United States, with their population increasing 81% from 10.5 million to 18.9 million between 2000 and 2019.
Given the diversity of the population, broad data on Asian and NHOPI people often mask underlying disparities among subgroups of the population. For example, there is a nearly 8-fold difference in uninsured rates among Asian and NHOPI subgroups, ranging from 4% for Japanese people to 32% for Mongolian people. Uninsured rates also vary by citizenship status among Asian and NHOPI people, with noncitizens more likely to lack coverage across groups.
Data are also often missing to identify and address disparities. Enhancing data to better understand the experiences of Asian and NHOPI people is of particular importance at this time, given growing levels of racism and discrimination amid the COVID-19 pandemic, including a significant uptick in hate incidents against Asian and NHOPI people. A KFF survey of Asian community health center patients found that 1 in 3 respondents experienced more discrimination in 2021 than when the COVID-19 pandemic began and that many reported negative experiences due to their race or ethnicity, ranging from receiving poor service to being verbally or physically attacked.
Source
KFF analysis of 2019 American Community Survey 1-yr Public Use Microdata Sample, 2021 KFF survey of Asian community health center patients