How Community Health Centers Are Serving Low-Income Communities During the COVID-19 Pandemic Amid New and Continuing Challenges

Authors: Jessica Sharac, Lina Stolyar, Bradley Corallo, Jennifer Tolbert, Peter Shin, and Sara Rosenbaum
Published: Jun 3, 2022

Executive Summary

Community health centers are a national network of safety-net primary care providers serving low-income, medically underserved communities. In addition to providing comprehensive primary care services, health centers have aided in national, state, and local responses to the coronavirus pandemic by providing a range of services designed to slow the spread and lessen the severity of COVID-19. Based on findings from a national survey of health centers, this brief examines how the pandemic has affected health center patients and services as well as the ongoing challenges health centers and their patients face. Key findings include:

Impact of the Pandemic on Health Center Patients and Services

  • Health centers increased their use of telehealth services in response to the pandemic. The pandemic necessitated a rapid expansion of health centers’ telehealth services as patients avoided in-person care due to the risk of infection, federal guidance to avoid nonessential care, and social distancing requirements. While in-person visits have rebounded, health centers’ use of telehealth services continues to be higher than before the pandemic.
  • Health centers reported an increase in the number of patients seeking housing, food and nutrition, and transportation services due to the economic disruptions caused by the pandemic. Health centers provide a range of social and supportive services to complement primary care. Compared to before the pandemic, over half of responding health centers said they saw an increase in the number of patients seeking housing services, food and nutrition services, and transportation services. A majority of responding health centers reported providing health literacy (71%) and transportation services (63%) on-site, while at least four in ten reported providing SNAP, WIC, or other nutritional services (44%) and healthy food options, such as a food pantry or meal delivery (42%), on-site.
  • In the wake of a growing need for mental health and substance use disorder (SUD) services during the pandemic, health centers added new services. Since the start of the pandemic, 64% of health centers reported adding at least one new mental health or SUD service (including new telehealth options). However, health centers indicated that staffing shortages and patients’ inability to access services through telehealth (e.g., due to lack of internet access or computers/phones) as the most common challenges to providing mental health and SUD services.
  • The share of health centers providing medication-assisted treatment (MAT) for treating opioid use disorder (OUD) increased during the pandemic. Roughly half of health centers (48%) saw an increase in patients with OUD compared to the start of the pandemic. The number of health center patients nationally who received MAT for OUD grew by 27% from 2019 to 2020, spurred by an infusion of federal grants for behavioral health services at health centers in the years leading up to the pandemic and the ongoing need for these services.

Key Issues to Watch

  • Health centers face ongoing challenges recruiting and retaining staff and financial implications related to changes to the 340B Drug Discount Program. Among responding health centers, recruiting new employees and retaining current employees were cited as top challenges by 78% and 54% of responding health centers, respectively, and are consistent with challenges reported in previous years. Looking ahead, health centers may face financial challenges as they transition out of the pandemic. A majority of health centers reported that certain actions by pharmaceutical manufacturers and pharmacy benefit managers (PBMs) related to access to and reimbursement for 340B drugs have had a negative effect on revenue.
  • The unwinding of the Medicaid continuous enrollment requirement could lead to coverage disruptions for many health center patients and revenue declines for health centers. The loss of Medicaid coverage among health center patients could lead to an increase in uncompensated care costs for health centers. At the same time, the temporary infusion of federal COVID-19 grant funding for health centers will end and federal funding for some programs that helped health centers during the pandemic, such as the HRSA COVID-19 Uninsured Program, faces an uncertain future.


Issue Brief

Introduction

Community health centers are a national network of safety-net primary care providers serving low-income, medically underserved communities. In addition to providing comprehensive primary care services, health centers have aided in national, state, and local responses to the coronavirus pandemic by providing a range of specific services designed to slow the spread and lessen the severity of COVID-19. These include providing both rapid and PCR tests, administering vaccines, and distributing masks and testing supplies and oral antiviral pills, while continuing to treat the ongoing health needs of their patients.

Additional federal grant funding made available during the pandemic has helped health centers to respond to the needs of their patients and weather the financial uncertainty related to the pandemic. However, health centers face uncertainty on a number of fronts, including the unwinding of the Medicaid continuous enrollment requirement and the loss of temporary telehealth flexibilities when the COVID-19 public health emergency (PHE) ends, as well as the lack of additional federal COVID-19 funding for programs like the Health Resources and Services Administration’s (HRSA’s) COVID-19 Uninsured program.

To understand how the pandemic has affected health center patients and services as well as the challenges health centers and their patients face, KFF and the Geiger Gibson/RCHN Community Health Foundation Research Collaborative at the George Washington University surveyed health centers in the 50 states and District of Columbia (DC). This survey was conducted in late 2021 and focused on the pandemic’s effect on services, the effects of policies on health center programs, the impact of changes made to the 340B Drug Discount Program, preparedness for the PHE unwinding, and the challenges health centers face. This brief presents survey findings for all responding health centers and also reports data from an ongoing biweekly survey conducted by HRSA.

Impact of the Pandemic on Health Centers and Their Patients

Responding to Changing Patient Needs

Health centers’ use of telehealth services increased during the pandemic. The pandemic necessitated a rapid expansion of health centers’ provision of telehealth services amid a decline in in-person visits as patients avoided in-person care due to the risk of infection, federal guidance to avoid nonessential care, and social distancing requirements. As a result, the use of telehealth increased compared to prior to the pandemic and peaked in April 2020 when more than 50% of visits on average were conducted virtually. The most recent data as of May 2022 show that telehealth visits have decreased somewhat, with about 15% of visits on average provided virtually, but still remain higher than pre-pandemic levels.

Telehealth has helped to maintain or improve access to care during the pandemic, but health centers reported challenges in providing virtual services to patients. Nearly all responding health centers cited lack of internet access among patients (97%) and lack of comfort using telehealth technology among patients (93%) as major or minor challenges to providing telehealth services (Figure 1). Additionally, over seven in ten responding health centers (72%) reported inadequate reimbursement for audio-only or telephonic telehealth services as a challenge.

Top Five Challenges for Health Centers in Providing Telehealth Services

Temporary policies enacted in response to the pandemic enabled health centers’ pivot to telehealth services; ending these policies could lead health centers to reduce the use of telehealth. During the public health emergency, many state Medicaid agencies, Medicare, and private insurers enacted temporary telehealth policies to improve accessibility and to provide enhanced reimbursement for telehealth. Additionally, the federal government, through the Federal Communications Commission, also provided one-time grant funding to providers (including health centers) to increase access to telehealth during the pandemic. Nearly eight in ten responding health centers (79%) reported that they would reduce the use of telehealth if these temporary telehealth flexibilities put in place by state Medicaid agencies and other payers do not remain in place.

Health centers contributed to COVID-19 vaccination, testing, and treatment efforts, reaching underserved and vulnerable populations. Supported by temporary federal grants in response to the pandemic as well as a number of national programs directly supplying health centers with tests, vaccines, therapeutics, and masks, health centers began providing new COVID-19-related services in 2020 and became an important national resource for equitably distributing these services in underserved communities. For example, according to data from a biweekly survey conducted by the Health Resources and Services Administration (HRSA), health centers have reported administering1  more than 20 million vaccine doses (roughly 4% of all vaccinations), with more than two-thirds (69%) of vaccine doses administered to people of color. Health centers that responded to our 2021 survey reported taking actions to increase COVID-19 vaccinations uptake, including by encouraging staff to talk to patients about the vaccine during visits (96%), posting information about the vaccine on social media (92%), and conducting community outreach (71%). The HRSA survey also revealed that roughly three in ten health centers utilized mobile vans, pop-up clinics, or other events out in the community to provide the vaccine and conduct outreach in May 2022.

Increased Demand for Services

Social Services

Health centers provided a range of social and supportive services both on-site and through referrals. A majority of responding health centers reported providing health literacy (71%) and transportation services (63%) on-site, while at least four in ten reported providing SNAP, WIC, other nutritional services (44%), healthy food services (42%), and education services (40%) (Appendix Table 1). We did not ask about case management, which is a required service of the Health Center Program and should be offered on-site or through referral at all health centers.

Health centers reported an increase in the number of patients seeking housing, food and nutrition, and transportation services during the pandemic. The pandemic caused economic disruptions, particularly for lower-income workers and families and contributed to an increased need for certain social services. Compared to before the pandemic, over half of responding health centers said they saw an increase in the number of patients seeking housing services (69%), food and nutrition services (63%), and transportation services (53%) (Figure 2).

Share of Health Centers That Saw Increases in Select Social and Supportive Services Since the Start of the Pandemic
Mental Health and Substance Use Disorder Services

With an uptick in mental health problems, substance use disorders (SUD), and difficulty accessing behavioral health care during the pandemic, health centers have sought to expand access to these services. Going into the pandemic, nearly all health centers provided mental health services on-site and most provided SUD services. By late 2021, over six in ten (64%) health centers reported that they added a new mental health or SUD service. Almost half of responding health centers (47%) added individual therapy as a new service in-person, via telehealth, or both, while around one in five of responding health centers added group therapy and support groups as a new service (21% and 18%, respectively) (Figure 3). Additionally, about a third added counseling (34%) or medication (31%) for medication-assisted treatment (MAT) for opioid use disorder (OUD) as a newly offered in-person or virtual service since the start of the pandemic.

Share of Health Centers That Added Mental Health or Substance Use Disorder (SUD) Services During the Pandemic
Opioid Use Disorder Services

Many health centers saw an increase in patients with OUD compared to the start of the pandemic. Health centers have historically played a significant role in addressing the opioid crisis as community-based providers with the capacity to provide medication-assisted treatment (MAT) for treating opioid use disorder (OUD). Increasingly, health centers are providing MAT, the standard of care, for OUD treatment. Prior to the pandemic, between 2016 and 2019, HRSA awarded more than $1.4 billion in federal grants to enable health centers to expand access to mental health and substance use disorder (SUD) services. Health centers used these grants to increase staff, improve the integration of behavioral health and primary care, and expand delivery of MAT services.

The number of health center patients nationally who received MAT for OUD has grown substantially during the pandemic, likely reflecting the infusion of funding for behavioral health services for health centers in the years leading up to the pandemic and the ongoing need for these services. Additionally, four in ten responding health centers saw an increase in patients with a prescription OUD and 42% saw an increase in non-prescription OUD compared to the start of the pandemic (Figure 4).

Share of Health Centers Reporting an Increase in the Number of Patients with Opioid Use Disorder Compared to Before the Pandemic

The share of health centers providing MAT increased during the pandemic. Drug overdose deaths increased by 39% nationally from March 2020 to December 2021 and, along with a reported increase in OUD patients, more health centers reported that they provided on-site MAT services for OUD. Over seven in ten (71%) responding health centers reported that their health center provides MAT medication on-site—62% provide MAT medications with OUD counseling and 9% provide only MAT medications—up from 64% in 2019 (Figure 5). The capacity of health centers to provide MAT services has also increased. Over six in ten (61%) responding health centers reported having the capacity to treat all patients who seek MAT services on-site, compared to 53% in 2019 (Figure 5).

Share of Health Centers That Provide Select Medication-Assisted Treatment Services

Most health centers that provide MAT services for OUD offer more than one medication, giving providers more options to meet patients’ needs. OUD treatment includes the use of one of three medications (methadone, naltrexone, and buprenorphine) along with counseling. Of responding health centers that provide MAT services, two-thirds (67%) provided two OUD medications on-site, up from 60% in 2019, and 4% offer all three medications.

Challenges Facing Health Centers

Managing Patient Needs

While most health centers reported being able to see new patients in a timely manner for routine medical and SUD services, fewer health centers said they could schedule mental health and dental visits within two weeks. Close to three-fourths of responding health centers said that new patients could schedule a routine medical visit (76%) or SUD service visit (73%) on a walk-in basis or within two weeks (Figure 6). Smaller shares of responding health centers said that new patients could make a mental health service appointment on a walk-in basis or within two weeks (61%) and 40% said that new patients could schedule routine dental visits in the same time frame. These findings may reflect both the effects of the pandemic, as well as continuing challenges in providing these services that predate the pandemic.

Wait Times for New Patients for Services at Health Centers

Health centers reported difficulties scheduling timely medical appointments for patients with specialists outside of their health centers, especially for uninsured and Medicaid patients (Figure 7). Over eight in ten (81%) responding health centers reported that it was very or somewhat difficult to schedule an appointment with a specialist for their uninsured patients, while 63% reported difficulties scheduling appointments for Medicaid fee-for-service patients (FFS), which was comparable to the share that reported difficulties for Medicaid managed care patients (58%). Over two-thirds of health center patients are uninsured or enrolled in Medicaid. Fewer health centers reported challenges scheduling appointments for their Medicare (37%) or privately insured patients (28%). Additionally, roughly half of responding health centers said that increased availability of telehealth during the pandemic made no difference in helping to obtain timely appointments with specialists outside their organization, despite the nearly universal increase in telehealth use during the pandemic at health centers and most other outpatient providers. Only about one-third of responding health centers said telehealth made scheduling appointments with specialists outside their organization easier while 10% or less said telehealth made obtaining outside appointments harder.

Scheduling Appointments With Specialists Outside of Health Centers for Patients by Insurance Type

Despite the increased need for certain mental health, SUD, and social and supportive services, health centers cited staffing shortages as the top challenge to providing these services (Figure 8). Almost nine in ten (85%) responding health centers cited staffing shortages as a challenge in providing social and supportive services while nearly eight in ten (79%) and seven in ten (69%) reported staffing issues as a barrier to providing mental health and SUD services, respectively. While health centers have been able to shift to telehealth, especially for mental health visits, almost half of responding health centers cited patients’ inability to access mental health and SUD services through telehealth as a common challenge (50% for mental health and 49% for SUD services). Other barriers to providing social and supportive services included lack of reimbursement, cited by 71% of responding health centers, and lack of physical space for services, cited by 67% of health centers. Fewer health centers reported these barriers to providing mental health and SUD services.

Share of Health Centers Reporting Select Challenges in Providing Mental Health, SUD, and Social and Supportive Services

Key Issues to Watch

Health centers face new challenges related to access to and reimbursement from the 340B Drug Discount Program. The 340B Drug Discount Program provides discounted prescription medications to safety net providers, including health centers, allowing them to pass on saving to their patients and to support operations. Virtually all responding health centers (96%) reported that they participate in the 340B Drug Discount Program either through on-site pharmacies or through contracts with outside pharmacies. Among responding health centers that participate in 340B, 86% indicated that they contract with an outside pharmacy to provide 340B drugs to their patients. Recently, pharmaceutical manufacturers have limited the sale of 340B drugs to contract pharmacies. In addition, some pharmacy benefit managers (PBMs), which help to administer and manage prescription drug benefits on behalf of health insurers or state Medicaid agencies, are paying lower rates to 340B-qualified entities than to non-340B entities. Nearly seven in ten (69%) responding health centers with contract pharmacies in the 340B program reported that manufacturers’ restrictions on contract pharmacies have had a negative impact on revenue, and over half (52%) of responding health centers said PBMs’ practice of paying lower rates to 340B entities has had a negative impact on their revenue. A smaller share of responding health centers (28%) said state policy decisions to shift pharmacy benefits from Medicaid managed care to Medicaid fee-for-service had a negative effect while 44% said they did not know the impact.

The end of the continuous enrollment requirement will likely affect millions of Medicaid enrollees, creating uncertainty for health centers and their patients. Provisions in the Families First Coronavirus Response Act (FFCRA) require states to provide continuous coverage for Medicaid enrollees until the end of the month in which the public health emergency (PHE) ends in order to receive enhanced federal funding. The current PHE is in place until mid-July 2022 though it is likely to be extended again. When the PHE ends, states will begin processing redeterminations and many health center patients could lose coverage if they are no longer eligible or face administrative barriers despite remaining eligible. Recent estimates show that between 5.3 million and 14.2 million Medicaid enrollees could lose coverage following the end of the PHE. Most health centers (66%) reported they have taken or plan to take actions to boost eligibility staff to assist their patients with renewals. However, the loss of Medicaid coverage among patients could have financial implications for health centers.

Staff recruitment and retention remain common concerns at health centers nationally. Consistent with challenges in providing key health services, among responding health centers, recruiting new employees and retaining current employees were cited as top overall challenges by 78% and 54% of responding health centers, respectively (Figure 9). These workforce issues, perennial challenges for health centers, have been exacerbated by the pandemic. Inadequate physical space (30%), decreased patient visits (24%), and changes to the 340B program (21%) were also among the top challenges for responding health centers. The share of health centers reporting increasing costs to operate health centers and a high number of uninsured patients as top challenges declined from previous years. In 2019, roughly half (52%) of health centers cited increased operating costs as a major challenge and 24% cited high numbers of uninsured patients. In contrast, in 2021, less than one-third cited increasing operational costs (whether due to COVID-19-related expenses or for other reasons) and just over 10% reported uninsured patients as a major challenge. However, the situation could shift again with the end of the public health emergency if expected coverage losses occur and lead to increased financial strain.

Share of Health Centers Reporting Select Challenges

Conclusion

The COVID-19 pandemic has been disruptive for health centers, as for other health care providers, and health centers have adapted to meet patient needs. The pandemic led to declines in utilization of certain services and forced health centers to shift the services they offer and how they deliver care. In response, health centers pivoted to providing telehealth services and have played an active role in COVID-19 testing and vaccination efforts, aided by temporary federal COVID-19 relief funding. They have also responded to the mental health crisis that surfaced during the pandemic by increasing access to mental health, SUD, and OUD services.

Looking ahead, the financial and operational disruptions that health centers have confronted throughout the pandemic will not abate overnight when the PHE declaration ends. Patients will continue to need care, but many are likely to lose Medicaid coverage as states unwind the Medicaid continuous enrollment requirement and, in turn, health centers could see an increase in uncompensated care costs. At the same time, the temporary infusion of federal COVID-19 grant funding for health centers will end and future federal funding for some programs that helped health centers during the pandemic, such as the HRSA COVID-19 Uninsured Program, face an uncertain future. Moreover, ongoing actions by pharmaceutical manufacturers and PBMs limiting access to and reimbursement for 340B drugs have had a negative effect on some health centers’ budgets. In addition to these continued financial uncertainties, health centers are facing ongoing workforce challenges that have been exacerbated by the pandemic. How health centers transition out of the pandemic and address these concurrent challenges will affect how low-income communities access primary care and related services.

Methods

The National Survey of Community Health Centers and Their Response to the Coronavirus Pandemic and Changes to the 340B Program (“2021 survey”) was conducted by KFF and the Geiger Gibson Program in Community Health Policy at the George Washington University in partnership with the National Association of Community Health Centers (NACHC) and supported by the RCHN Community Health Foundation. The survey was fielded from September to December 2021 to the CEOs or project directors of 1,342 federally-funded health centers in the 50 states and the District of Columbia (DC) listed in the 2020 Uniform Data System (UDS). There were 357 responses from 48 states and DC, with a resulting 27% response rate. We verified that there were no duplicate responses from any one health center and that every response answered at least one question in addition to identifying information, which was our criteria for inclusion in the analysis. The survey data were weighted using 2020 UDS data on patient size (total patients), share of patients who are racial/ethnic minorities, and total revenue per patient.

Additional funding support for this brief was provided to the George Washington University by the RCHN Community Health Foundation.

Appendix

Appendix Table 1: Share of Health Centers That Provide Select Social and Supportive Services

Endnotes

  1. Health centers report the number of vaccinations received by health center patients in the HRSA Health Center COVID-19 Survey. The survey’s questionnaire asks health centers to report the total number of patients receiving a vaccine, and HRSA has clarified that this count includes health center patients receiving vaccinations anywhere, including in settings other than the health center. However, we expect that health centers delivered the vast majority of vaccinations reported in the survey, and the number of patients reported through the survey receiving their vaccinations elsewhere is likely minimal. ↩︎

Traditional Medicare Spending Fell Almost 6% in 2020 as Service Use Declined Early in the COVID-19 Pandemic

Published: Jun 1, 2022

In 2020, spending for traditional Medicare beneficiaries declined for the first time in more than two decades. The drop in spending followed the sharp decline in the use of health care services during the initial months of the COVID-19 pandemic, and reflects a decrease in spending among traditional Medicare beneficiaries on most health care goods and services. The lower spending in traditional Medicare contributed to the relatively slower growth in Medicare spending overall in 2020. However, total Medicare spending increased in 2020 because federal payments per Medicare Advantage enrollee rose 6.9%. Medicare Advantage payments were determined in mid-2019 prior to the pandemic, and therefore, did not reflect the lower utilization that occurred in 2020.

This analysis uses recently released data from the Centers for Medicare & Medicaid Services (CMS) to examine trends in spending and utilization by type of health care service between 2010 and 2020 for Medicare beneficiaries who were enrolled in both Part A and Part B of traditional Medicare. (Similar data for beneficiaries enrolled in Medicare Advantage or for prescription drug spending are not available.) The data include both Medicare and beneficiary out-of-pocket spending on Part A and Part B covered services, but not Part D prescription drug spending. Understanding how spending and utilization changed across different types of services in 2020 is useful for identifying areas where beneficiaries delayed or skipped care in response to the pandemic, which could have longer-term implications for health outcomes and Medicare spending.

We find that Medicare spending declined across most, but not all, types of services, as a smaller share of beneficiaries used most types of Medicare-covered health care services in 2020 compared to 2019. Specifically:

  • Total spending on Part A and Part B services for traditional Medicare beneficiaries was $348.0 billion in 2020, a decrease of 5.8% ($21.4 billion) from 2019.
  • Spending per traditional Medicare beneficiary for Part A and Part B services fell 3.6%, or $402, to $10,739 per person in 2020, compared to $11,142 per person in 2019.
  • The decline in traditional Medicare spending reflects decreases in spending for most types of services, ranging from 0.1% less for durable medical equipment to 13.1% less for procedures, compared to 2019. Only spending on skilled nursing facilities, Part B drugs, and hospice increased in 2020
  • Use of nearly all types of services by traditional Medicare beneficiaries was lower in 2020 compared to 2019. Only three types of services had increases across all measures of utilization: hospice, dialysis, and Part B drugs. Skilled nursing facilities had lower use but higher spending (see KFF analysis, Amid the COVID-19 Pandemic, Medicare Spending on Skilled Nursing Facilities Increased More than 4% Despite an Overall Decline in Utilization).
  • Among traditional Medicare beneficiaries, average spending per user increased for 12 of the 17 types of services examined.

Findings

Spending

total Spending fell 5.8%, or $21.4 billion, for traditional medicare beneficiaries in 2020

Total spending for traditional Medicare beneficiaries was $348.0 billion. That is $21.4 billion, or 5.8%, lower than in 2019 and represents the only year-over-year decline since 2010 (Figure 1).

Total Spending for Traditional Medicare Beneficiaries Declined in 2020

Traditional medicare spending per person was 3.6%, OR $402, lower in 2020 than 2019

The decline in total spending for traditional Medicare beneficiaries was driven by a decrease in spending per person, which fell 3.6%, or $402, in 2020 compared 2019 ($10,739 vs. $11,142) (Figure 2). Although spending per person also declined in 2012 and 2014, the decrease in those years was relatively small ( -0.2% in 2012 and -0.1% in 2014). In addition, there was a small drop in the number of beneficiaries enrolled in traditional Medicare in 2020 (data not shown), continuing a trend of declining enrollment in traditional Medicare as the share of Medicare beneficiaries opting for Medicare Advantage has grown.

Spending Per Person for Traditional Medicare Beneficiaries Fell $402  in 2020

Traditional medicare spending fell across most types of services in 2020

The decrease in Medicare spending reflects a decline in spending for almost all types of Medicare-covered services between 2019 and 2020. The largest declines in dollar terms were for the largest categories of spending: inpatient hospital spending fell $7.9 billion (from $117.1 billion to $109.2 billion, 37.0% of total), outpatient hospital spending fell $5.1 billion (from $60.5 billion to $55.4 billion, 24.1% of total) and evaluation & management (office visit) spending fell $3.7 billion (from $34.3 billion to $30.6 billion, 17.2% of total) (Figure 3 and Table 1).

Inpatient Hospital Services Accounted for Over One-Third of the Decline in Traditional Medicare Spending in 2020

As a percent of 2019 spending for the respective service categories, spending on procedures declined the most, falling 13.1% (from $23.7 billion to $20.6 billion), followed by spending on imaging (-12.9%, from $7.9 billion to $6.9 billion) and spending on Federally Qualified Health Centers/Rural Health Centers (-11.7%, from $2.1 billion to $1.8 billion). In contrast, spending increased for skilled nursing facilities, Part B drugs and hospice (Table 1).

Traditional Medicare Spending Fell Across Most Types of Services in 2020

Utilization

Use of nearly all types of services fell between 2019 and 2020

The share of traditional Medicare beneficiaries using specific types of services fell across most categories and was generally accompanied by a decline in the total number of services provided (Table 2). For example, the largest drop in the share of traditional Medicare beneficiaries using a particular type of service was for imaging services, which was 5.5 percentage points lower in 2020 compared to 2019 (64.7% vs 70.2%). Consistent with this decline, traditional Medicare beneficiaries had 574 fewer imaging events per 1,000 beneficiaries in 2020 than in 2019. Outpatient hospital services had the next largest drop in the share of beneficiaries using the service, declining 4.8 percentage points in 2020 compared to 2019 (from 66.4% to 61.6%). There was a corresponding decrease in the number of outpatient hospital visits, which declined by 702 visits per 1,000 beneficiaries in 2020 compared to 2019. See Appendix table for complete 2019 and 2020 utilization data by service category.

Use of Most Types of Health Care Services Declined Among Traditional Medicare Beneficiaries in 2020

use increased for hospice, dialysis and part b drugs

While use of Medicare-covered services generally declined, the share of beneficiaries using hospice, dialysis and Part B drugs increased very modestly, by less than 1 percentage point, between 2019 and 2020. There was also an increase in the number of hospice stays (+2 stays per 1,000 beneficiaries) and days (+58 days per 1,000 beneficiaries) and the number of dialysis visits (+9 visits per 1,000 beneficiaries) in 2020 compared to 2019 (see Appendix). (The data do not include the number of times beneficiaries used Part B drugs because of reported difficulty in constructing a standardized measure.)

Spending Per User

spending per user increased Across 12 of the 17 service categories

While both spending and utilization declined across most types of services between 2019 and 2020, average spending per user increased for 12 of the 17 categories. In dollar terms, the largest increases were for long-term care hospitals (+$4,364, 10.2%), skilled nursing facilities (+$2,724, 16.3%), inpatient rehabilitation facilities (+$2,269, 9.7%), and inpatient hospital (+$1,825, 8.5%). These increases indicate that the beneficiaries who used inpatient hospital and post-acute care services in 2020 required more intensive, and therefore costly, care than beneficiaries who used these services in 2019. The largest decrease per user was for dialysis (-$431, -1.6%), which also saw an increase in the number of users and number of visits, suggesting that all else equal, the new use was relatively lower cost.

Traditional Medicare Spending Per User Increased Across Most Types of Services in 2020

Discussion

Total spending among the 32 million traditional Medicare beneficiaries with both Part A and Part B fell in 2020, the first year of the COVID-19 pandemic, corresponding to lower service use across most types of Medicare-covered health care services compared to 2019. The lower spending in traditional Medicare contributed to the relatively slower growth in Medicare spending overall in 2020. However, because spending on Medicare Advantage continued to grow, total Medicare spending rose slightly in 2020. Payments to Medicare Advantage plans are determined prior to the plan benefit year (in mid-2019 for 2020) and so did not incorporate the effects of the pandemic on health care utilization, though plans have historically been paid more per enrollee, on average, than similar beneficiaries would have cost in traditional Medicare. Consistent with higher payments and lower utilization, Medicare Advantage plans had higher gross margins and lower medical loss ratios, on average, in 2020 compared to 2019, suggesting that they became more profitable during the pandemic. Enrollment in Medicare Advantage has grown rapidly over the last decade, reaching nearly 40% of all Medicare beneficiaries in 2020, and is projected to exceed 50 percent of total Medicare population by 2025. That growth in enrollment, and the higher growth in spending per Medicare Advantage enrollee compared to traditional Medicare, has contributed to Medicare Advantage accounting for an increasing share of Medicare spending, and contributed to increases in total Medicare spending.

It is not yet known the extent to which the decline in use across most types of health care services may have affected health outcomes of traditional Medicare beneficiaries. The Medicare population is at risk of having negative effects from delaying or forgoing care because they have relatively high health needs. More than one-fifth of Medicare beneficiaries have five or more chronic conditions and almost one-third have at least one functional impairment. It is possible that the decline in use could have negative implications for future health if people delayed routine care and screenings or were unable to schedule procedures in a timely manner, missing the opportunity for early diagnosis and treatment. The drop in utilization also has the potential to lead to higher future health care spending if more health care services are required or if treatments are more intensive. In addition, Medicare beneficiaries were hit hard by COVID-19, with people age 65 and older accounting for a disproportionate share of cases and deaths. While the long-term effects of COVID-19 are not yet known, they are likely to have a greater impact on people ages 65 and older, including corresponding health care use and Medicare spending.

While use of health care services declined sharply in 2020, that did not necessarily translate into a loss of revenue for most providers because of policies adopted by Congress, states, and both the Trump and Biden Administrations. For example, Congress established the Provider Relief Fund, which authorized $178 billion in funding, nearly all of which has been disbursed, to compensate providers for lost revenue and unexpected costs due to the pandemic.

The decline in spending for traditional Medicare beneficiaries in 2020 represents the first decrease in spending since 1999. The previous decline was primarily a result of changes to Medicare provider payments enacted as part of the Balanced Budget Act of 1997. In contrast, the decrease in 2020 was driven by lower use of health care services amid the COVID-19 pandemic. There is a question of whether any of the changes in spending and use will be sustained, though the expectation is that these were most likely one-time, or otherwise short-lived, changes. While actual data for 2021 is not yet available, Medicare spending is projected to have rebounded and is expected to continue to grow in coming years.

This work was supported in part by Arnold Ventures. We value our funders. KFF maintains full editorial control over all of its policy analysis, polling, and journalism activities.

Appendix

Use of Medicare-Covered Services in 2019 and 2020, by Service Type

Amid the COVID-19 Pandemic, Medicare Spending on Skilled Nursing Facilities Increased More than 4% Despite an Overall Decline in Utilization

Published: Jun 1, 2022

The use of health care services declined sharply in the early months of the COVID-19 pandemic, as people delayed or skipped care, before rebounding in the latter part of 2020. While total spending for beneficiaries in traditional Medicare dipped in 2020 for the first time since 1999, spending did not decline across all types of services. As described in a separate KFF analysis, Medicare spending increased in 2020 for skilled nursing facilities (SNFs), Part B drugs and hospice. The largest increase in total spending was for SNFs and occurred despite a decline in utilization.

Skilled nursing facilities provide short-term rehabilitation services, usually following discharge from an acute care hospital. Medicare pays SNFs a predetermined amount per day that a beneficiary receives care, which varies based on the day of the stay and the person’s needs, as well as geographic differences in wages. Certain high-cost ancillary services are paid separately. For the first 20 days, beneficiaries do not pay any cost sharing; for days 21-100, there is a daily copayment (equal to $194.50 in 2022). The SNF payment system was modified, effective October 2019, and changes were expected to result in higher payments for patients complex medical needs.

Prior to the pandemic, traditional Medicare beneficiaries were generally required to have a hospital stay of at least three days to qualify for SNF care, and benefits were limited to 100 days. During the COVID-19 public health emergency, CMS has waived the three-day requirement, allowing beneficiaries to be admitted to a SNF directly from the community or following a shorter hospital stay, and has allowed beneficiaries with COVID-19 to extend their benefit for an additional 100 days. While these policies alone would be expected to increase SNF utilization, early reports of deaths attributable to COVID-19 and ongoing concerns about transmission of COVID-19 in SNFs and other long-term care facilities appear to have contributed to a drop in SNF admissions.

This analysis uses recently released Medicare spending data from the Centers for Medicare & Medicaid Services (CMS) for the 32 million beneficiaries enrolled in both Part A and Part B of traditional Medicare to examine the change in Medicare SNF spending and utilization between 2019 and 2020 (see Methods for details). We find:

  • Total Medicare SNF spending increased $1.1 billion (4.4%) between 2019 and 2020, despite 200,000 fewer traditional Medicare beneficiaries using SNF services in 2020.
  • Average spending per SNF user was $2,724 (16.3%) higher in 2020 compared to 2019, driven by an increase in average spending per day (+$44), with an increase in the average length of stay (+1.6 days) also contributing.
  • Medicare beneficiaries under the age of 65 accounted for a disproportionately large share of the increase in total Medicare SNF spending between 2019 and 2020.

Findings

total Skilled nursing facility spending rose 4.4% in 2020, while spending on Most other services declined

Total spending for traditional Medicare beneficiaries for SNF services was $1.1 billion (4.4%) higher in 2020 than in 2019 – increasing from $24.9 billion to $26.0 billion. The increase is notable because spending on most other types of services declined and because it follows several years of gradually declining spending on SNF services after the implementation of productivity adjustments included in the Affordable Care Act (Figure 1).

Total Traditional Medicare SNF Spending Increased in 2020

The number of Traditional Medicare beneficiaries using SNF Services continued to decline in 2020

The increase in total SNF spending occurred despite a drop in both the number and share of traditional Medicare beneficiaries using SNF services in 2020. Approximately 1.3 million (4.1%) beneficiaries enrolled in both Part A and Part B of traditional Medicare had a SNF stay in 2020, slightly down from 1.5 million (4.5%) in 2019. That is the lowest number, and smallest share, of beneficiaries to use a SNF in the decade between 2010 and 2020 (Figure 2).

The Number of Traditional Medicare Beneficiaries Using Skilled Nursing Facilities Has Declined By One-Third Over the Last Decade

Traditional medicare spending per skilled nursing facility user increased sharply in 2020

While the number of beneficiaries using SNF services declined (along with the total number of SNF stays), SNF spending per user increased $2,724 (16.3%), rising to $19,394 in 2020 from $16,670 in 2019. This is the amount spent on SNF services only, including spending for multiple SNF stays for beneficiaries who were admitted to a SNF more than once during the year. It does not reflect spending for any ancillary Part B services provided during a SNF stay. The sharp growth in spending follows several years of more gradual increases in spending per SNF user (Figure 3), which averaged 1.5% a year between 2012 and 2019.

Traditional Medicare Spending Per SNF User Increased Sharply in 2020

SNF stays were longer in 2020

While there were fewer SNF users and fewer total SNF stays in 2020 compared to 2019, the average duration of each stay was slightly longer. In 2020, the average length of stay was 26.3 days, compared to 24.7 days in 2019. That increase follows several years of declining or stable average lengths of stay (Figure 4).

SNF Average Length of Stay for Traditional Medicare Beneficiaries Increased in 2020

spending per day increased in 2020

In addition to an increase in the average length of SNF stays, the average Medicare SNF spending per day rose from $490 in 2019 to $534 in 2020, or 9.1%. While SNF spending per day has increased each year since 2012, the rise in 2020 was the largest since 2011 (before changes to SNF payment in the ACA went into effect) (Figure 5). For comparison, between 2012 and 2019, average spending per day increased 2.9% a year on average.

Traditional Medicare Spending Per SNF Day Has Increased Steadily Since 2012

beneficiaries under age 65 account for a disproportonate share of the increase in SNF spending

Beneficiaries under the age of 65 with long-term disabilities represent less than 10% of all traditional Medicare beneficiaries using SNF services, or approximately 115,000 of the 1.3 million SNF users in 2020. However, this group accounted for 26% of the increase in SNF spending between 2019 and 2020. This is because both the average length of stay and the spending per day for these beneficiaries rose more than for beneficiaries ages 65 and older. Specifically, the average length of stay increased 2.2 days for those under age 65 (from 25.1 to 27.3 days), compared to an increase of 0.9 days for those ages 65 and over (from 24.6 to 26.5 days). Notably, spending per SNF day was somewhat higher for younger beneficiaries than older beneficiaries for the first time in 2020 ($545 vs. $533), reflecting an increase from 2019 of $65 and $42, respectively (Figure 6). In addition, there was a smaller decline in the number of SNF users under age 65 than ages 65 and over (data not shown).

Traditional Medicare Spending Per SNF Day Has Increased Steadily Since 2012

Discussion

In contrast to most other types of services, Medicare spending for skilled nursing facilities increased in 2020. This increase occurred despite an overall decrease in the number of Medicare beneficiaries using SNF services. The higher spending is explained by longer and more expensive SNF stays in 2020 compared to 2019, both of which increased more sharply for Medicare beneficiaries under the age of 65 than for older Medicare SNF users.

The longer, more expensive stays are likely the result of a change in the composition of Medicare beneficiaries admitted to SNFs, combined with revisions to the SNF prospective payment system (PPS) that went into effect in October 2019. In the first months of the COVID-19 pandemic, nursing home occupancy declined substantially, and remained well below pre-pandemic levels throughout 2020, as fewer patients underwent procedures requiring rehabilitation, such as knee or hip replacements, and people avoided both short- and long-term facilities because of concerns about infections and deaths attributable to COVID-19 in nursing homes and other long-term care facilities. Thus, beneficiaries who used SNF services likely had more intensive care needs that could not be accommodated in other settings.

In addition, to help relieve hospital capacity, CMS waived the requirement that Medicare beneficiaries have a three-day hospital stay before being admitted to a SNF. This policy likely increased occupancy levels above what they would have been otherwise, as over 15% of SNF stays in 2020 were covered under the waiver. The mix of patients also likely changed, as Medicare beneficiaries with COVID-19 were 66% more likely to be discharged from the hospital to a SNF than non-COVID patients.

Further, CMS also waived the 100-day benefit period for skilled care for people with COVID-19. This means Medicare beneficiaries with COVID-19 could renew their SNF benefits for an additional 100 days of care. This may have contributed to the longer average length of stay. In addition, it is possible that COVID-positive patients may have opted to stay longer in a SNF instead of going home and potentially infecting family members. Given the relatively high Medicare margins for SNFs, these facilities may not have had strong incentives to discharge patients quickly.

At the same time, substantial revisions to the SNF PPS went into effect in October 2019. The revised methodology is intended to better reflect the clinical care needs of patients. The changes were estimated to increase payments for medically complex patients and patients with high costs for nontherapy ancillary items. Although the changes were meant to be budget neutral, CMS estimates that the revisions led to a slight increase in payments in fiscal year 2020. These changes explain some of the higher spending per SNF user in 2020.

Notably, the sharp increase in spending per SNF user in 2020 followed relatively slow growth in spending per SNF user and year-over-year declines in total SNF spending between 2012 and 2019. Those trends, combined with early evidence of the potential for accountable care organizations (ACOs) to reduce traditional Medicare spending on SNF services, helped foster an expectation that greater coordination and communication could reduce SNF spending without compromising quality as ACOs expanded. However, the increase in SNF spending amid the pandemic and future projections may temper those expectations. While Medicare spending growth for SNFs is projected to slow once the public health emergency expires and associated waivers end, small year-over-year increases in Medicare spending on SNF services are expected through the end of the decade.

This work was supported in part by Arnold Ventures. We value our funders. KFF maintains full editorial control over all of its policy analysis, polling, and journalism activities.

Methods

We use data from the CMS Geographic Variation Public Use File, which includes spending and utilization for traditional Medicare beneficiaries who are enrolled in both Part A and Part B and have no months of Medicare Advantage enrollment during the year. These data exclude a small subset of traditional Medicare beneficiaries, and so do not match other Medicare spending data exactly.

These data are reported both overall and for beneficiaries under age 65 and age 65 and over separately. The data include the number of traditional Medicare beneficiaries enrolled in Part A and Part B, total Medicare payments for SNF services, Medicare payments per person for SNF services, Medicare payments per SNF user for SNF services, the number of SNF users, the share of traditional Medicare beneficiaries with any SNF use, the number of SNF covered stays per 1,000 beneficiaries, and the number of SNF days per 1,000 beneficiaries. In addition, we calculate the average length of stay and the average spending per day as follows:

Average length of stay = SNF days per 1,000 beneficiaries / SNF covered stays per 1000, beneficiaries

Spending per day = SNF Medicare payments / (SNF covered days per 1,000 beneficiaries * number of traditional Medicare beneficiaries with Part A and Part B / 1,000)

Youth Access to Gender Affirming Care: The Federal and State Policy Landscape

Authors: Lindsey Dawson, Jennifer Kates, and MaryBeth Musumeci
Published: Jun 1, 2022

This analysis reflects the policy environment as of June 2020. Our newer tracker, provides a regularly updated overview of state policy restrictions on youth access to gender affirming care.

Numerous states have implemented or considered actions aimed at limiting LGBTQ+ youth access to gender affirming health care. Four states (Alabama, Arkansas, Texas, and Arizona) have recently enacted such restrictions (though the AL, AR, and TX laws all have been temporarily blocked by court rulings) and in 2022, 15 states are considering 25 similar pieces of legislation. At the same time, other states have adopted broad nondiscrimination health protections based on gender identity and sexual orientation. Separately, the Biden administration, which has been working to eliminate barriers and expand access to health care for LGBTQ+ people more generally, has come out against restrictive state policies. This analysis explores the current state and federal policy landscape regarding gender affirming services for youth and the implications of restrictive state laws.

Table 1: Key Terms
Gender IdentityGender identity is one’s internal sense of being male, female, some combination, or another gender. Gender identity may or may not align with sex or gender assigned at birth.
TransgenderSomebody who is transgender has a gender identity different from that traditionally associated with sex assigned at birth.
Gender DysphoriaGender dysphoria refers to “a concept [and clinical diagnosis] designated in the DSM-5 as clinically significant distress or impairment related to a strong desire to be of another gender, which may include desire to change primary and/or secondary sex characteristics. Not all transgender or gender diverse people experience dysphoria.”
Gender Affirming CareGender-affirming care is a model of care which includes a spectrum of “social, psychological, behavioral or medical (including hormonal treatment or surgery) interventions designed to support and affirm an individual’s gender identity.”

What is the status of state policy restrictions aimed at limiting youth access to gender affirming care?

Four states (Alabama, Arkansas, Texas, and Arizona) recently enacted laws or policies restricting youth access to gender affirming care and, in some cases, imposing penalties on adults facilitating access. Alabama, Arkansas, and Texas have been temporarily blocked from enforcing these laws and policies by court order.

  • Alabama. In April 2022, the Alabama governor signed a bill into law that prevents transgender minors from receiving gender affirming care, including puberty blockers, hormone therapy, and surgical intervention. The bill makes it a felony for any person to “engage in or cause” a transgender minor to receive any of these treatments, punishable by up to 10 years in prison or a fine up to $15,000. The bill additionally states that nurses, counselors, teachers, principals, and other administrative school officials shall not withhold from a minor’s parents or guardian that their child’s “perception of his or her gender or sex is inconsistent with the minor’s sex” assigned at birth and shall not encourage a minor to do so. Shortly after enactment, a federal lawsuit challenging the law was filed by four Alabama families with transgender children, two healthcare providers, and a clergy member. Subsequently, the U.S. Department of Justice (DOJ) joined the case as an additional plaintiff challenging the law. This case has been consolidated with another lawsuit filed by two other Alabama families with transgender children, which raises similar challenges. In May 2022, a federal district court entered a preliminary injunction, blocking enforcement of several sections of the Alabama law while the litigation is pending. Specifically, the preliminary injunction applies to the sections of the law that prohibit puberty blockers and hormone therapy. Other sections of the law remain in effect, including the prohibition on surgical intervention and the prohibition on school officials keeping secret or encouraging or compelling children to keep secret certain gender-identity information from children’s parents. When deciding to grant the preliminary injunction, the district court found that the plaintiffs were substantially likely to succeed on their claim that the sections of the law that prohibit puberty blockers and hormone therapy unconstitutionally violate parents’ fundamental right to autonomy under the 14th Amendment’s due process clause by prohibiting parents from obtaining medical treatment for their children subject to medically accepted standards. The court also fond that the plaintiffs were substantially likely to succeed on their claim that these sections of the law are unconstitutional sex discrimination in violation of the 14th Amendment’s equal protection clause because the law denies medically necessary services only to transgender minors, while allowing those services for cisgender minors. Additionally, the court found that the plaintiffs were likely to suffer irreparable harm, in the form of “severe physical and/or psychological harm” and “significant deterioration in their familial relationships and educational performance,” if the law was not blocked. The state has appealed the district court’s decision to the 11th Circuit.
  • Arkansas. In 2021, on override of Governor Hutchinson’s veto, Arkansas lawmakers passed legislation prohibiting gender-affirming treatment for minors, including puberty blockers, hormone therapy, and gender affirming surgery. The law also prohibits medical providers from making referrals to other providers for minors seeking these procedures. Under the law, medical providers offering gender affirming care or providing referrals for such care to minors may be subject to discipline by relevant licensing entities. The legislation additionally includes a prohibition on private insurance coverage of gender affirming services for minors and a prohibition on the use of public funds, including through Medicaid, for coverage of these services for minors. In May 2021, four families of transgender youth and two physicians challenged the Arkansas law in federal court, arguing that the law is illegal sex discrimination under the 14th Amendment’s equal protection clause. They also argue that the law violates parents’ right to autonomy protected by the 14th Amendment’s due process clause and violates the families and physicians’ right to free speech under the 1st Amendment. The U.S. Department of Justice (DOJ) filed a statement of interest in support of the plaintiffs’ motion for a preliminary injunction in the Arkansas case. DOJ  argued that the Arkansas law  violates the Equal Protection Clause of the 14th Amendment because the state law “singles out transgender minors. . . specifically and discriminatorily den[ies] their access to medically necessary care based solely on their sex assigned at birth.” A preliminary injunction was granted in July 2021, temporarily blocking the state from enforcing the law while the case is pending. The court found that the plaintiffs were likely to succeed on all three of their Constitutional claims, and that the law was not substantially related to the state’s interest in protecting children or regulating physicians’ ethics because the law allows the same medical treatments for cisgender minors. The court also found that the plaintiffs will suffer irreparable physical and psychological harm if the law is not blocked. The court also denied the state’s motion to dismiss the case. The state has appealed both of those decisions to the 8th Circuit, where a decision is currently pending. A group of 19 states filed an amicus brief in support of the state’s appeal.1  They argue that states have “broad authority” to regulate gender affirming services, because they allege this area is “fraught with medical uncertainties,” contrary to the evidence from the American Academy of Pediatrics and the American Medical Association on which the lower court relied. Another group of 20 states and the District of Columbia filed an amicus brief in support of the plaintiffs.2  They argue that they and their residents are economically, physically, and mentally harmed by discrimination against transgender people. They also argue that their states “protect access to gender-affirming healthcare based on well-accepted medical standards” and that Arkansas’ law is unconstitutional sex discrimination and “ignores medical consensus as well as decisions made between doctors and their patients.” Litigation in the case continues in the district court, where the case is scheduled for trial during the week of July 25, 2022.
  • Texas. In February 2022, Governor Abbott of Texas issued a directive defining certain gender affirming services for youth as child abuse, and calling for investigation of and penalties for parents who support their children in taking certain medications or undertaking certain procedures, which could include the removal of their children. In addition, under the directive, health care professionals who facilitate access to these services could also face penalties and a range of professionals in the state would be mandated to report known use of the specified gender affirming services. While other states with proposed policies to limit youth access to gender affirming care include penalties for parents who facilitate access to these services (see below), no implemented policy ties the parental role to child abuse as the Texas directive does. In the wake of litigation, a state court entered a temporary injunction preventing the state from enforcing the directive while the case is pending. The court found that the governor acted outside his statutory legal authority in issuing the directive, and the plaintiffs will suffer immediate and irreparable injuries, including loss of employment, deprivation of constitutional rights, and loss of medically necessary care. However, the Texas Supreme Court subsequently modified the temporary injunction, finding that the courts lack authority to prevent enforcement of the directive statewide. Instead, the state is prohibited from enforcing the directive only against the plaintiffs involved in the lawsuit while the case is pending. The case is scheduled for trial on July 11, 2022.
  • Arizona. In March 2022, Arizona Governor Ducey signed legislation into law that bans physicians from providing gender-affirming surgical treatment to minors. The legislation does not address hormone therapy or puberty blockers.

In addition, since January 2022 15 states introduced a total of 25 bills that would restrict access to gender-affirming care for youth. Provisions in these bills varied considerably and include those that would:

  • criminalize or impose/permit professional disciplinary action (e.g. revoking or suspending licensure) on health professionals providing gender-affirming care to minors, in some cases labeling such services as child abuse
  • penalize parents aiding in youth accessing gender-affirming care
  • permit individuals to file for damages against providers who violate such laws
  • limit insurance coverage or payment for gender affirming services or prohibit the use of state funds for such services

Beyond these policies, states have also passed or considered other policies restricting access, including so called “bathroom bills” which restrict access to bathrooms or locker rooms based on sex assigned at birth, the recent Florida “don’t say gay” bill that would prohibit classroom discussion on sexual orientation or gender identity, and laws that limit transgender students’ access to sports. While these policies are not directly tied to health or health care access, their attempts to limit access to social spaces and services and present non-affirming sentiments could negatively impact LGBTQ+ people’s mental health and well-being. For instance, one recent study found that state laws permitting the denial of services to same-sex couples “are associated with increases in mental distress among sexual minority adults.” In addition, and directly related to health care, Florida recently released non-biding guidance recommending against gender affirming care for youth.

Though not specific to youth access to gender affirming care, some states have adopted policies that provide health care protections to LGBTQ+ people, including:

  • prohibitions on health insurance discrimination based on sexual orientation and/or
  • requirements that state Medicaid programs explicitly cover health services related to gender transition

What is federal policy regarding gender-affirming services?

The Biden administration has taken multiple steps to promote access to health care for LGBTQ+ people and to prohibit discrimination on the basis of sexual orientation and gender identity, including:

  • On his first day in office, President Biden signed an executive order directing federal agencies to review existing regulations and policies in order to “prevent and combat discrimination” based on gender identity and sexual orientation. The order states that “people should be able to access healthcare…without being subjected to sex discrimination” and views sex nondiscrimination protections as encompassing sexual orientation and gender identity, following the Supreme Court’s Bostock
  • On May 10, 2021, also in light of the Bostock ruling, the Biden Administration announced that the Department of Health and Human Services’ (HHS) Office for Civil Rights (OCR) would include gender identity and sexual orientation in its interpretation and enforcement of Section 1557’s prohibition against sex discrimination. Section 1557 of the Affordable Care Act (ACA) contains the law’s primary nondiscrimination provisions, including a prohibition on discrimination on the basis of sex by a range of health care entities and programs that receive federal funding. The May 2021 announcement marked both a reversal of Trump Administration policy, which eliminated gender identity and sex stereotyping from the regulations, and an expansion of Obama Administration policy, which included gender identity and sex stereotyping in the definition of sex discrimination but omitted sexual orientation. Following the Bostock ruling, two federal district courts issued nationwide preliminary injunctions, blocking implementation of several provisions of the Trump Administration’s regulations related to Section 1557. Biden Administration implementing regulations on Section 1557 are expected to expand on the May announcement.

In addition to establishing a foundation of nondiscrimination policies for LGBTQ+ people, and participating in the Alabama and Arkansas cases as noted above, the administration has responded specifically to the Texas directive, denouncing it as discriminatory and stating that gender affirming care for youth should be supported as follows:

  • Statement from President Biden: The statement from the president states that the administration is “putting the state of Texas on notice that their discriminatory actions put children’s lives at risk. These announcements make clear that rather than weaponizing child protective services against loving families, child welfare agencies should instead expand access to gender-affirming care for transgender children.”
  • Statement from Dept. of Health and Human Services (HHS) Sec. Becerra: Becerra’s statement reaffirms “HHS’s commitment to supporting and protecting transgender youth and their parents, caretakers and families” and details action items the administration is taking in response to the Texas directive including those that follow below.
  • Following the actions in Texas, HHS’s Administration on Children, Youth and Families issued an Information Memorandum to state child welfare agencies writing that child welfare systems should advance safety and support for LGBTQI+ youth, including though access to gender affirming care.
  • Also in response to Texas, HHS’s OCR issued a new notice and guidance which lays out federal enforcement policy for nondiscrimination related to gender identity. The guidance relies on ACA Section 1557’s prohibition against sex discrimination, including gender identity, in health programs and activities receiving federal financial assistance; Section 504 of the Rehabilitation Act, which prohibits discrimination on the basis of disability by entities receiving federal financial assistance; and Title II of the Americans with Disabilities Act (ADA), which prohibits discrimination on the basis of disability by state and local governments.
    • Specifically, the guidance states that categorically refusing treatment based on gender identity is prohibited discrimination under Section 1557. The guidance also states that Section 1557’s prohibition against sex-based discrimination is likely violated if a provider reports parents seeking medically necessary gender affirming care for their child to state authorities, if the provider or facility is receiving federal funding. The guidance further states that restricting a provider from providing gender affirming care may violate Section 1557.
    • The guidance states that in cases where gender dysphoria qualifies as a disability, restrictions that prevent individuals from receiving medically necessary care based on a diagnosis or perception of gender dysphoria may also violate Section 504 and the ADA.
    • It also articulates requirements under the Health Insurance Portability and Accountability Act (HIPAA) that prohibit health plans and providers from disclosing protected health information, such as use of gender affirming physical or mental health care without patient consent, except in limited circumstances.

OCR enforces each of these federal laws, and the guidance states that parents or caregivers who believe their child has been denied health care, including gender affirming care, and health care providers who believe they have been unlawfully restricted from providing such care, may file an administrative complaint for OCR to investigate.

What do major medical societies say about gender affirming services?

Most major U.S. medical associations, including those in the fields of pediatrics, endocrinology, psychiatry, and psychology, have issued statements recognizing the medical necessity and appropriateness of gender affirming care for youth, typically noting harmful effects of denying access to these services. These include statements from the American Medical Association, American Academy of Pediatrics, the Endocrine Society, American Psychological Association, American Psychiatric Association, and the World Professional Association for Transgender Health, among others, which in some cases were specifically issued in response to the Arkansas legislation and Texas directive. Further, 23 medical associations or societies, including those named above, together filed an amicus brief in the case filed against Texas Gov. Abbott opposing the state directive. The brief states that denying gender affirming treatment to adolescents who need them would irreparably harm their health and that enforcing the directive would irreparably harm providers who are forced to choose between potentially facing civil and criminal penalties or endangering their patients. A similar amicus brief was filed in the Arkansas case.

Additionally, the Endocrine Society supports gender affirming care for young people in their clinical practice guidelines, as does the World Professional Association for Transgender Health’s standards of care. Together these guidelines form the standard of care for treatment of gender dysphoria.

What are the implications of access restrictions?

State policies restricting youth access to gender affirming care could have significant health and other implications for LGBTQ+ youth, their parents, health care providers, and, in some cases, other community members:

LGBTQ+ youth: LGBTQ+ youth experience higher rates of depression, anxiety, and suicidality than their non-LGBTQ+ peers. In one CDC study of youth in 10 states and 9 urban school districts, a higher share of transgender students reported suicide risk outcomes across a range of metrics than cisgender students. These include, in the past 12 months: having felt sad or hopeless, considered attempting suicide, made a suicide plan, attempted suicide, or had a suicide attempt treated by a doctor or nurse. Inability to access gender affirming care, such as puberty suppressors and hormone therapy, has been linked to worse mental health outcomes for transgender youth, including with respect to suicidal ideation, potentially exacerbating the already existing disparities. Conversely, access to this care is associated with improved outcomes in these domains. Policies that aim to prohibit or interrupt access to gender affirming care for youth can therefore have negative implications for health in potentially life-threatening ways.

In addition, LGBTQ people report higher rates of negative experiences with medical providers, so creating barriers to gender affirming care could further challenge transgender people’s relationship with the healthcare system.

Finally, with the Texas directive specifically, and in several other states with bills under consideration, youth are vulnerable to secondary trauma, knowing that if they seek such care, their families and providers could be subject to penalties, and, in the case of Texas, children could be separated from their parents.

Parents: In several states with bills under consideration, parents who facilitate access to evidence-based and potentially lifesaving gender affirming services for their children could face penalties. Under the Texas directive, because it is defined as child abuse, parents who facilitate access to gender affirming care for their children, could be subject to penalties, including losing custody of their children. This may place parents in the position of either supporting their children in accessing care supported by medical evidence and facing penalties or denying their children access in an effort not to make their family vulnerable to investigation and potential separation. Each option for parents in this scenario has the potential to be traumatic for the family, and for youth in particular.

Providers: Like parents, providers may be torn between what the medical literature supports is in the best interest of their patients or facing potential sanctions, including violating professional ethics around confidentiality, as in the case of Texas. The American Psychological Association said in a statement that a requirement such as the Texas directive is a violation of both patient confidentiality and professional ethics. Under such circumstances, providers may be forced to decide whether they will provide the highest standard of care for their patients and potentially face sanctions, or obey the state directive but withhold care and potentially violate patient confidentiality and professional ethics. Further, as noted above, the Biden Admiration has stated that HIPAA requirements prohibit providers from disclosing use of gender affirming care without patient consent, except as in narrow circumstances. However, following HIPPA requirements in this case may make providers vulnerable to state sanction under the directive.

Teachers and others: In Texas, in addition to health care providers, other mandated reporters, such as teachers, could also face penalties for failure to report youth known to be accessing gender affirming care. The directive also states that ”there are similar reporting requirements and criminal penalties for members of the general public,” extending the policy’s reach to practically anyone with knowledge of youth accessing these services.

Looking forward

The legal and policy landscape regarding youth access to gender affirming care is shifting across the country, with an increasing number of states seeking to limit such access and impose penalties. Such policies may have significant, negative implications for the health of young people. At the same time, these states are at odds with federal law and policy, and in two recent cases courts have temporarily blocked enforcement of such restrictions. Moving ahead, it will be important to watch how state bills still under consideration unfold and the final outcome of cases in Alabama, Arkansas, and Texas. Decisions in these cases could determine how such policies intersect with existing federal policies — including Section 1557’s prohibition on sex based discrimination in health care, federal disability non-discrimination protections, and HIPAA patient privacy protections — as well as providers’ professional ethics standards.

  1. These states include Alabama, Alaska, Arizona, Georgia, Idaho, Indiana, Kansas, Kentucky, Louisiana, Mississippi, Missouri, Montana, Nebraska, South Carolina, South Dakota, Tennessee, Texas, Utah, and West Virginia. ↩︎
  2. These states include California, Colorado, Connecticut, Delaware, Hawaii, Illinois, Maine, Maryland, Massachusetts, Michigan, Minnesota, Nevada, New Jersey, New Mexico, New York, North Carolina, Oregon, Rhode Island, Vermont, and Washington. ↩︎
News Release

Private Insurers Expect to Pay $1 Billion in Rebates to Consumers This Year for Setting Premiums Too High Relative to Medical Costs

Published: Jun 1, 2022

Private insurance companies are expecting to pay out $1 billion in rebates to consumers this fall under an Affordable Care Act provision that requires insurers to spend the bulk of customers’ premium payments on care, a new KFF analysis finds.

Rebates are based on insurers’ experiences over the previous three years. This year’s total is roughly half the size of last year’s $2 billion, in part because 2021 was a less profitable year and because the 3-year window no longer includes 2018, when individual market insurers overpriced their ACA marketplace plans due to uncertainty caused by the repeal-and-replace debate and other ACA policies.

This year’s rebates continue to reflect the impact of the COVID-19 pandemic, which led to a sharp reduction in health claims in 2020, when many people skipped care amid stay-at-home orders and medical offices’ closures.

Rebate amounts will vary by market. Individual market insurers are expected to pay out an estimated $603 million in rebates to more than 4 million people, including many covered through the ACA’s marketplaces. Small and large group insurers are expected to pay about $275 million and $168 million respectively to plans that cover about 4 million more people. The amounts are preliminary estimates, with final rebate data coming later this year.

The rebates are the result of insurance companies not meeting the ACA’s medical loss ratio threshold, which requires insurers to spend at least 80 percent of premium revenues (85% for large group plans) on health care claims or quality improvement activities. Higher loss ratios in 2021 could lead to steeper premium increases next year, as some insurers try to regain higher margins.

“The ACA never did much to reduce the rate of increase in national health spending, but it did a lot to make health care more affordable for consumers, from subsidizing coverage, to protecting people with pre-existing conditions, to requiring these rebates from insurers,” KFF President and CEO Drew Altman said.

Not all policy holders are due rebates, but among those who are, this year’s rebates work out to roughly $141 per plan member in the individual market, $155 per member in the small group market and $78 per member in the large group market, according to our analysis of preliminary data reported by insurers to the National Association of Insurance Commissioners, and compiled by Mark Farrah Associates. Insurers will issue the rebates to eligible consumers in the fall.

Price Regulation, Global Budgets, and Spending Targets: A Road Map to Reduce Health Care Spending, and Improve Affordability

Authors: Maximilian Pany, Jeannie Fuglesten Biniek, and Tricia Neuman
Published: May 31, 2022

Report

Since the passage of the Affordable Care Act (ACA), the number of people without health insurance has dropped substantially. However, the ACA and other market-based efforts have fallen short in meaningfully constraining prices and other underlying drivers of health care spending. High health care spending contributes to slower wage growth for workers, higher premiums and deductibles, and negatively affects job growth.1 ,2  High health care spending also affects federal and state budgets because it results in higher health insurance spending for government employees and lost tax revenue due to the exclusion of employer-sponsored health insurance spending from taxable income.

Health care spending is a function of both the price and volume of services, though it is primarily prices that have driven recent increases in spending on the commercially insured.3  Ongoing efforts to increase price transparency aim to put downward pressure on commercial prices by facilitating patient shopping, but provider compliance has been low,4 ,5 ,6 ,7  and evidence suggests patients tend not to use price shopping tools when they are available.8 ,9  Antitrust enforcement and other market-based policies, such as efforts to lower barriers of entry in hospital markets by repealing certificate-of-need laws and prohibitions on agreements that forbid health insurers from steering people to preferential providers,10  aim to constrain prices by fostering provider competition. However, health care spending has generally continued to rise rapidly, prompting the consideration of proposals that more directly regulate the level and/or growth of prices or spending.

In this paper, we review several policy options to reduce health care spending and improve affordability through constraints on prices, including price regulation (i.e., setting or capping prices or price growth), global budgets (i.e., limiting spending to a budget), and spending growth targets (i.e., limiting spending growth). We provide examples of these options currently in practice at the state and federal levels and discuss how those experiences can inform future efforts. As with all complex policy choices, these approaches pose difficult trade-offs and potentially face significant opposition from hospitals and other health care providers, depending on the details of how they are implemented. We describe the policy design considerations and discuss the tradeoffs and implications of adopting each option and design decision. After reviewing each option, we discuss the legislative and regulatory pathways for adopting new policies, as well as considerations for monitoring and enforcement.

Background

The U.S. spends more on health care than any other country, and U.S. health care spending has risen more rapidly than the economy as a whole over the last few decades. High and rising health care spending drives increasing premiums and out-of-pocket costs for workers and their families and for employers who fund a large share of that coverage. Between 2010 and 2018, spending per person with private insurance grew considerably faster than for people covered by Medicare, increasing at an average annual rate of 3.8% compared to a rate of 1.7%. Nationwide, 173 million people under age 65 have private health insurance, either from an employer plan (155 million) or the non-group market (18 million), accounting for more than $1 trillion in health care spending in 2019. Health care expenses for employers are consuming a growing share of total employee compensation and dampening wage growth.11  Rising health care spending also contributes to higher government spending through the tax exclusion for employer-sponsored health insurance, health benefits for public employees, and direct subsidies of non-group plans under the ACA.

While both the price and volume of services determine spending, rising prices have accounted for most of the spending growth on the commercially insured in recent years12  and are responsible for most of the spending differential compared to other countries.13 ,14  Unlike Medicare, which sets prices administratively, commercial insurers negotiate with providers to determine service prices.15  Growth in both physician and hospital prices paid by commercial insurers have far outpaced general inflation, with hospital prices growing substantially faster than physician prices. For example, over the period from 2007 to 2014, prices paid by commercial insurers for hospital inpatient care grew an estimated 42 percent while the prices paid to physicians grew an estimated 18 percent.16 

Provider prices paid by commercial insurers are largely dictated by market conditions—with hospitals and other health care providers commanding higher prices when they have more leverage in negotiations with insurers. A large body of research has documented that commercial insurers pay higher prices than Medicare for comparable services, and that gap is growing. Commercial insurers pay, on average, about double Medicare rates for hospital services and about 143% of Medicare rates for physician services, with large variation across markets.

Over several decades, provider consolidation has increased the number of markets where providers have the upper hand in negotiations with commercial payers.17 ,18  While antitrust enforcement actions have sought to prevent anti-competitive practices on the part of providers (most notably recent action against Sutter Health in California), health care consolidation has continued, increasing the share of health care markets with highly concentrated providers.19  Moreover, high provider prices exist in many markets that are not highly concentrated by conventional measures,20  potentially because providers are more differentiated (i.e., differ along dimensions such as services offered, convenience, amenities, and potentially quality) than commonly assumed, or because conventional measures of market concentration underestimate the extent of provider influence over prices. Decades of sustained consolidation and rising prices in the health care sector call into question the ability of commercial insurers and employers to control increases in health care prices on their own.

Approaches to constraining health care prices

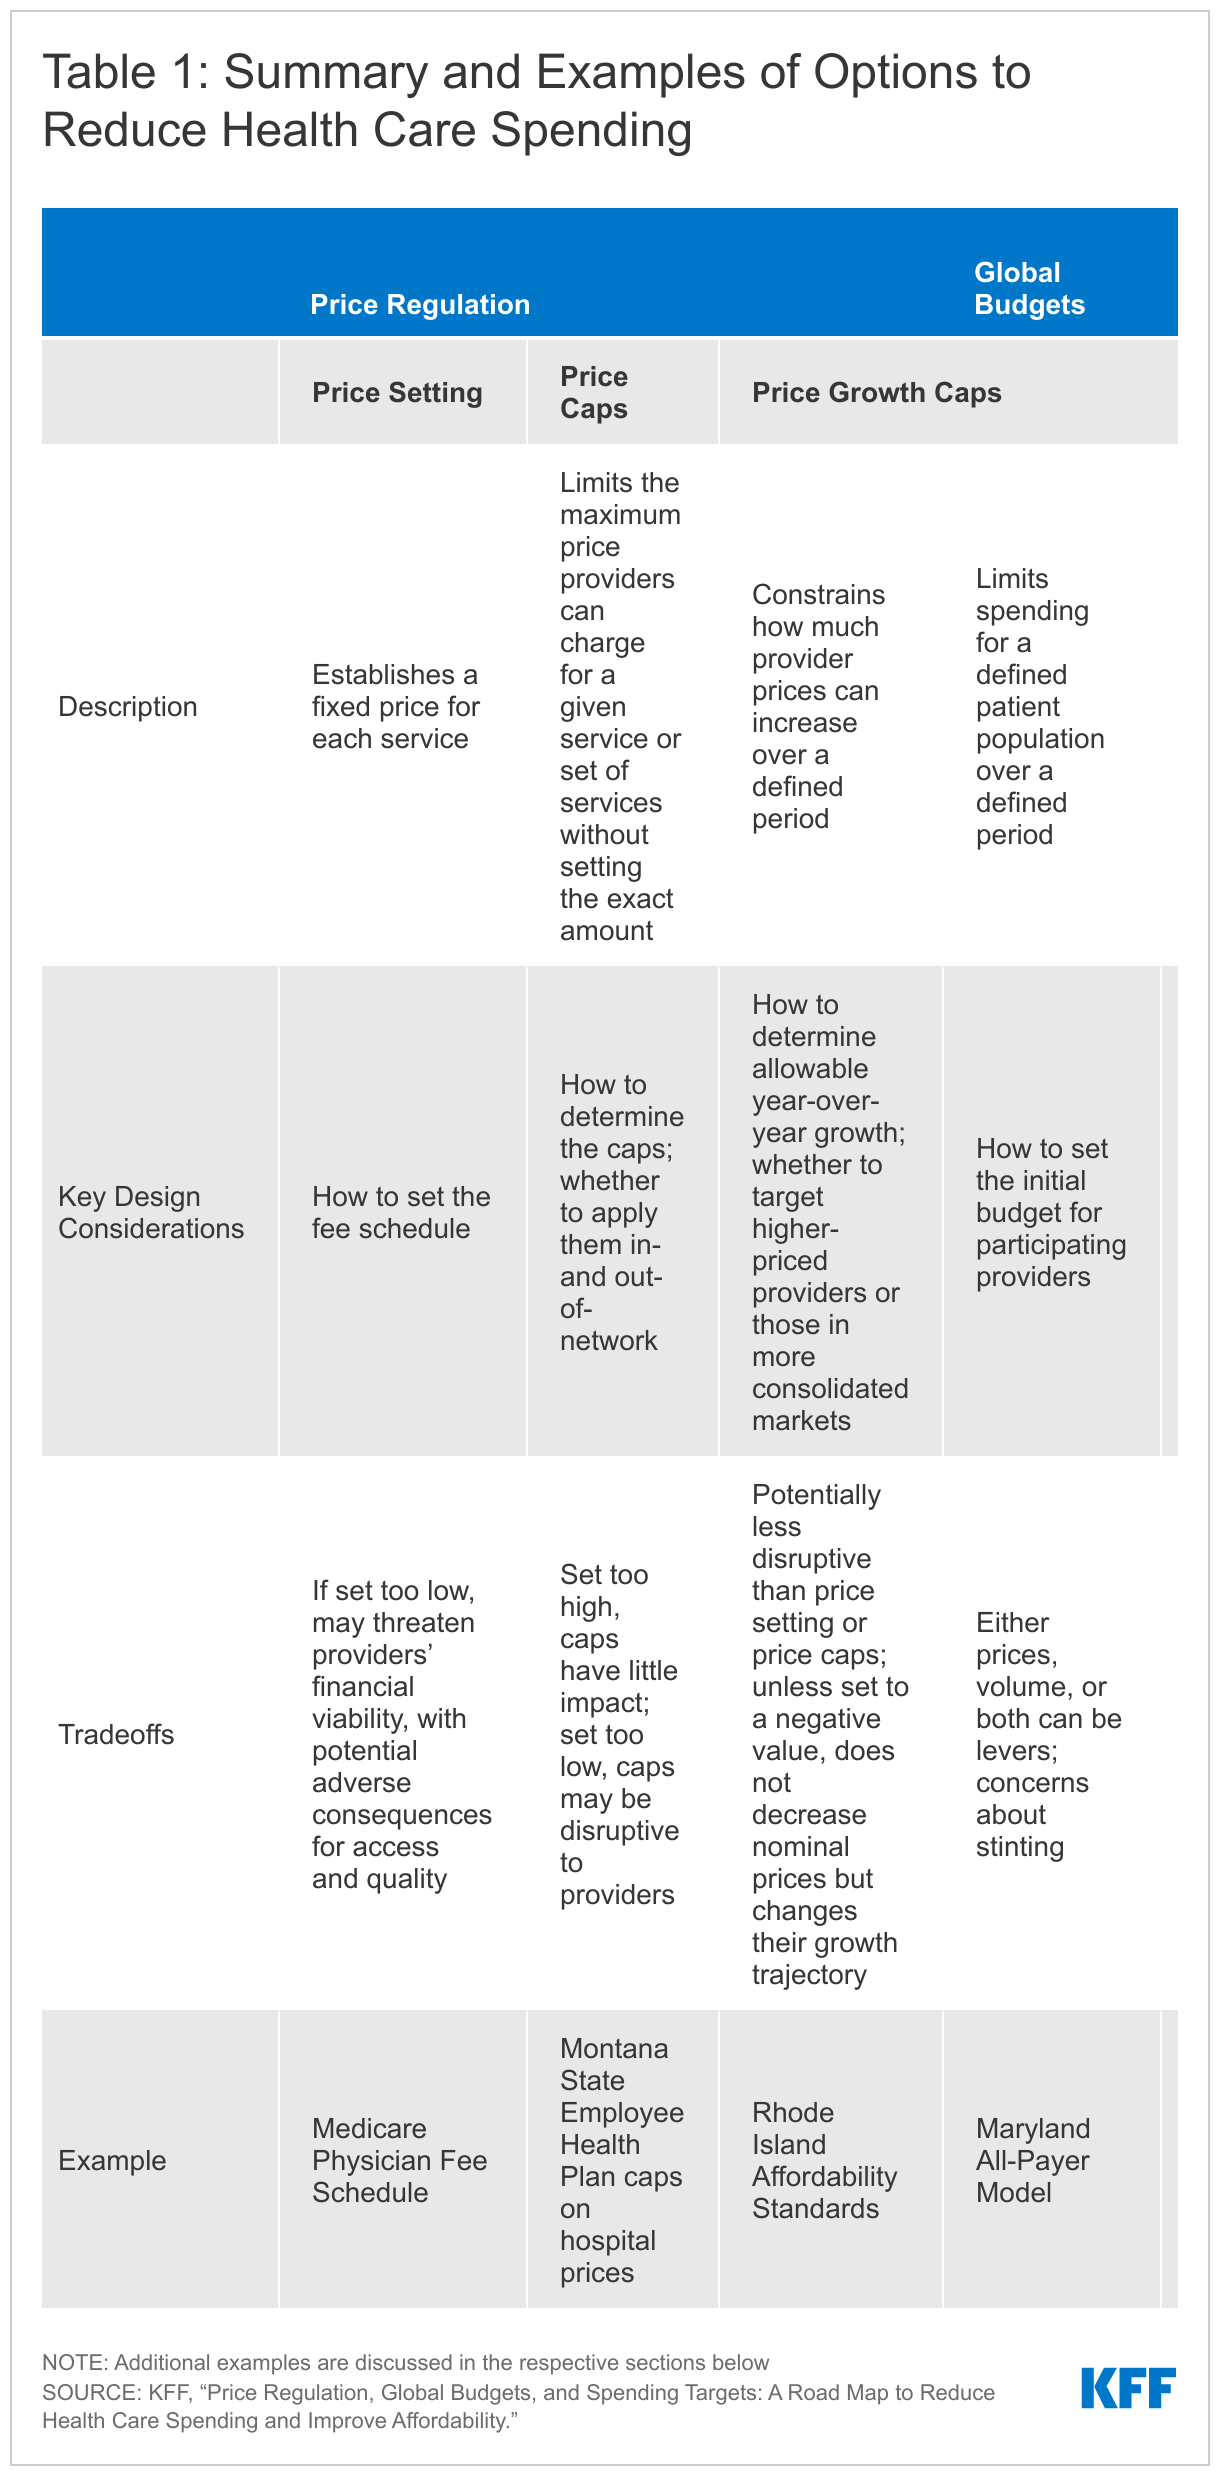
Given that competition and market-based policies have not succeeded in meaningfully constraining health care prices, some policymakers have turned their attention to more regulatory approaches. Policymakers and other stakeholders have a range of options available to constrain health care spending for the commercially insured by putting downward pressure on prices. We review three major approaches: first, price regulation, which either sets or caps the price of services or the growth in prices directly; second, global budgets, which set an overall limit on health care spending, leaving it to providers and payers to determine how to keep spending under budget; third, spending growth targets, which set a limit on how much spending can grow over a defined period, again leaving it to providers and payers to determine whether to achieve the target by constraining growth in prices, volume, or both. These approaches are summarized in Table 1, including examples currently in practice.

Table 1: Summary and Examples of Options to Reduce Health Care Spending

These approaches could (and in some instances already do) work within the current health insurance system, or they could be paired with a role for federal or state governments in expanding the public provision of insurance (such as public option proposals). They could be used broadly at the national or state level, or in a targeted way, for example in areas with high provider prices or for types of services that have seen large price increases. While this paper focuses on policy approaches that constrain hospital and physician spending by putting downward pressure on prices, they could also have effects on the volume and potentially quality of services provided. Providers could respond to price changes in many ways, some of which may be disruptive to access or quality and some of which may shift or increase volume. To reduce potential adverse effects, these approaches could be phased in gradually, monitored, and adjusted.

Though a range of proposals to rein in prescription drug prices are currently being debated, those proposals are outside of the scope of this paper.

Price regulation

Price regulation aims to constrain prices or price growth directly. It can apply to prices for all services or a subset of services. It can also apply to all providers equally or can be applied more narrowly to certain types of providers (e.g., high-price providers) but not others (e.g., low-price providers).21  We review three broad categories of price regulation options: price setting, which establishes a fixed price for each service with a fee schedule; price caps, which establish a maximum price, below which market dynamics can work to determine the exact price level; and price growth caps, which limit the extent to which prices can change over time. Price caps and price growth caps are not mutually exclusive and may be implemented together.

Price setting

The most common form of price regulation is price setting, which establishes a fixed price for each service paid to each provider. Price setting has a long and ongoing history in the United States at both the federal and state levels. At the federal level, Medicare has been setting hospital and physician prices for decades (see box 1). Over the years, Congress has made changes to Medicare payment policy to manage program spending and encourage providers to operate more efficiently, including the introduction of alternative payment models (such as Accountable Care Organizations (ACOs)) and broad adjustments to Medicare rates (such as the ACA’s productivity adjustment to prospective payment rates).

At the state level, mandatory hospital rate setting systems were prevalent in the 1970s and 1980s, with evidence suggesting that they slowed growth in expense per day and per admission during that time.22  Most systems were enacted and governed by legislation that prescribed many features of the rate setting process, which over time grew increasingly complex. Against the backdrop of growing use of managed care, there was a dissolution of the political coalition of state policymakers, hospitals, and employers that had enabled them in all states except Maryland.23 

Box 1: How Medicare Sets Prices

Understanding how Medicare sets prices is helpful for evaluating the potential impact of any policy proposal that would peg commercial rates to Medicare. Medicare has separate processes for determining payment rates for hospitals and physicians, as well as other providers and services. Medicare’s Inpatient Prospective Payment System (IPPS) sets hospital payments prospectively by grouping inpatient diagnoses into diagnosis-related groups (DRGs), each of which has an associated DRG weight that is intended to reflect average resource utilization for treating the conditions in that DRG. A patient case’s DRG weight gets multiplied by a hospital-specific base payment rate to determine payment for that admission. Hospital base payment rates are adjusted for hospitals’ area wages, share of Medicare and Medicaid patients, and teaching status, among other factors.

Medicare has also established methodologies for making payments for hospital outpatient services and physician services. Medicare uses an outpatient prospective payment system (OPPS) to pay for services provided to beneficiaries in hospital outpatient departments, such as nursing services, medical supplies, equipment, and rooms, with separate payments for professional services provided during an outpatient visit. For physician and other health professional services, Medicare payments are based on the specific service provided, and payment rates established under the physician fee schedule. The payment rate for each service is based on the amount of work required to provide the service, practice expenses, and professional liability insurance (PLI) costs, and adjusted for input prices, and other factors. The case weights applied to physician services, called Relative Value Units (RVUs), are updated by the Relative Value Scale Update Committee (RUC), a committee convened by the American Medical Association and specialty societies. Evidence suggests that RUC proposals to update RVUs skew in favor of more heavily represented specialties, especially where they have common interests.24 

Policy design considerations

The main design decision for price setting policies is to establish the fee schedule on which to base rates, which determines how stringent the regulation is. One option is to use the existing fee schedules established by Medicare (see box 1), which has the advantage of being widely accepted and utilized. Given that Medicare rates tend to be much lower than commercial rates and some may be below cost, prices could be set as a multiple of Medicare rates, which results in higher prices than Medicare but keeps intact Medicare’s relative pricing across services.

Proposals that set prices at the service level need to consider how to take into account alternative payment models, which don’t pay for each service individually but rather for a defined set of services or a population, and are becoming increasingly prevalent. One option is to aggregate prices into a price for the relevant bundle of services defined by the alternative payment model. When this is not possible or desirable and the alternative payment model has its own mechanism for constraining prices, such as global budgets, the model could be exempted from price setting. However, if alternative payment models are excluded, and other providers in the same market are subject to price setting, alternative payment models may become an avenue for provider gaming unless they are regulated with complementary approaches such as spending growth caps or global budgets.

Another consideration for policymakers is whether to use price-setting on a more targeted basis. For example, some proposals25 ,26  would set private prices at a percent of Medicare rates for provider markets that are highly consolidated. Another option would be to target providers based on their price level, measured across a basket of services. In addition, administrative costs are an important consideration with efforts that involves targeting, as well as “edge cases” such as rural markets that are technically highly consolidated but may not support competition because of low demand for services due to low population density.

Implications and tradeoffs

The decision about how to set the fee schedule could have implications for provider finances and incentives, as well as patient access and potentially quality—key considerations for any proposal to slow or reduce health care spending. A recent KFF analysis found that if commercial insurance used Medicare rates broadly, health care spending on the commercially insured would have been an estimated $352 billion lower in 2021. Reducing commercial prices by that much is likely to impact the financial viability of providers: average hospital revenue would fall an estimated 35 percent if commercial prices were set at Medicare rates, with wide variation in the impact across states.27  In addition, providers may compensate for decreased prices by increasing or shifting volume, for example to higher-margin services or care settings.28 ,29 

Given the wide variation in commercial prices,30 ,31  the revenue effects would be larger for some providers than others.32  To the extent that providers have high prices because of high costs or quality and not only market power,33  large price cuts could induce these providers to discontinue unprofitable service lines, reduce quality, or exit altogether. This may have adverse consequences for patient access, particularly in communities with few alternatives. At the same time, since some providers are currently paid relatively low prices, price setting could also result in price increases for certain providers, which could reduce overall savings. Unlike Medicare, whose large share of the market entices providers to participate, commercial payers negotiate with providers over both price and network inclusion.34 ,35  If prices were instead set administratively, hospitals and other providers might decide not to participate in the networks of health insurance plans with lower enrollment if such participation required forgoing more profitable contracts.

Linking provider prices to Medicare rates is likely to amplify the effect of Medicare policy changes, such as the Affordable Care Act’s productivity adjustment or site-based pricing differentials, by extending these to commercial markets. Setting prices based on Medicare rates is also likely to intensify political pressure on Congress to raise Medicare rates (or resist reductions) as provider revenue would rely more heavily, or potentially exclusively, on Medicare payment design, increasing existing federal budgetary pressures.36 ,37  Medicare-based prices, without further reforms, would also lock in Medicare’s relative service rates,38  including differentials between cognitive and procedural services and those between primary care and specialty services.

Decisions about whether to target price setting policies to certain health care markets, such as highly consolidated markets, involve tradeoffs between the amount of potential savings and mitigating potential negative effects of the policy. Because high-priced providers are not always located in highly concentrated markets,39  policies that target these markets may fail to constrain the majority of high prices and leave many high-priced providers unregulated while regulating others. However, to the extent that high prices may be associated with higher quality in more competitive markets, targeting concentrated markets for price setting may blunt any adverse effects on quality.40 

Price caps

Price caps limit the maximum price providers can charge for a given service or set of services without setting the exact payment amount,41 ,42 ,43  preserving a role for market forces (and market-based policies) to influence prices underneath the caps and allowing prices to continue to vary (to some extent) across providers and health plans. For example, Montana and Oregon limit payments to certain providers under their public employee health plan to a percent of Medicare rates. In Washington state, Cascade Care public option plans on the state’s ACA Marketplace include an aggregate provider price cap of 160% of Medicare (see box 2). This means that total payment for participating providers cannot exceed 160% of Medicare, but the regulation does not apply to prices for specific services.44 

Box 2: Price Caps Adopted by States

In recent years, Montana, Oregon, and Washington have adopted price caps set as a multiple of Medicare rates for providers who deliver care to people enrolled in certain health insurance plans. Those approaches are briefly described in this box.

Similar efforts have not been advanced in other states. For example, North Carolina was unable to get the majority of its hospitals to agree to a planned contract rate of 196% of Medicare rates for services provided to the approximately 700,000 members in its state employee health plan, leading the state to abandon the effort.45  Notably, the proposed rates in North Carolina were lower than the price caps in Montana and did not make exempt certain hospitals, such as critical access hospitals or small rural hospitals, as Oregon did, factors that potentially led to its failure.

Montana

Since 2016, Montana’s state employee health plan has used “reference-based pricing” agreements to limit the prices paid for care at all hospitals in the state. Under these agreements, outpatient services are paid between 230­–250% of Medicare rates and inpatient services are paid between 220–225% of Medicare rates. Those ranges are narrower than the previous range in prices of between 239–611% and 191–322% for outpatient and inpatient care, respectively. Initial evidence suggests that reference-based pricing saved Montana an estimated $47.8 million in inpatient and outpatient spending from 2017 to 2019.46  Slight increases in volume following the adoption of price caps were more than offset by the decrease in prices.

Oregon

In 2017, lawmakers in Oregon passed legislation limiting hospital payments for enrollees in the state employee health plans to 200 percent of Medicare for in-network care and 185 percent of Medicare for out-of-network care. The caps were applied to a subset of the hospitals in the state that represented 60 percent of spending by the health plans (exempting critical access hospitals, rural hospitals with fewer than 50 beds, and sole community hospitals in small counties that had a large share of their revenue from Medicare). Initial evaluations of the impact of the price caps estimate savings of at least $81 million, or approximately 5% of total health costs, in a plan year. 

Washington

In 2019, Washington State enacted legislation creating Cascade Care, a public option health plan available starting in 2021 on the Washington State Health Benefit Exchange (the state’s ACA Marketplace). These plans are administered by private insurers and operate under an aggregate price cap of 160% of Medicare payment rates. That 160% aggregate cap is lower than average provider reimbursement in other exchange plans, which were estimated to average about 174% of Medicare rates. To ensure minimum payments for certain providers, there are also price floors for rural hospitals and primary care physicians. The aggregate price cap for providers and facilities may be waived for health plans that are unable to form a provider network that meets network adequacy standards, for those able to reduce year-over-year premiums by at least 10%, or, beginning in 2023, for plans with actuarially sound premiums that are lower than those in the previous year.

In 2021, five insurers offered public option plans covering about 1% of Exchange enrollees with 19 of 39 counties having at least one public option plan available. In 9 of those 19 counties, a public option plan was the lowest-premium option. Public option plans tended to be more available in counties in which the Exchange was more competitive, but they had the lowest premium in smaller, less competitive counties.47 

Policy design considerations

This policy requires policymakers to define the approach and level of price caps. One question is whether to subject each service to a cap, or to impose an aggregate cap, which would allow some services to be paid above and some below the cap. If an aggregate cap is adopted, it would also be necessary to define the bundle of services that are considered together under each aggregate cap. Another key decision is how broadly to apply the price cap and whether to exempt certain providers. For example, the cap could include only inpatient hospital care, or both inpatient and outpatient hospital, physician, and other services. In addition, caps could be applied to all providers or could exempt those in areas where there is a relatively low supply of providers, such as rural areas. If desired, price caps could be combined with price floors for certain types of providers or services to ensure a minimum payment.

Price caps can be based on (a multiple of) Medicare rates or on some measure of prevailing rates in the commercial market (e.g., the median or a different percentile of prices across providers).48  Basing them on Medicare rates offers relative administrative simplicity, as Medicare fee schedules are readily accessible and a large share of providers already participate in Medicare. Basing them on prevailing market rates allows caps to reflect differences across services and markets, beyond what Medicare already allows. Compared to caps based on Medicare, market-based caps do not lock in Medicare’s service price differentials, and may fluctuate with local market conditions (e.g., wages) to a greater degree than Medicare’s rates. While market-based caps also reflect the effect of differences in provider market concentration, this can be counteracted by basing caps on a lower percentile of the commercial price distribution (one proposal suggests a multiple of the 20th percentile, for example)49  or by capping market-based caps at a maximum informed by a percentile of the national commercial price distribution.

Price caps could also be applied in a more limited way to just out-of-network care.50 ,51  Since providers negotiate with payers over both price and network inclusion,52 ,53  capping out-of-network prices can influence prices in-network—pushing them closer to the out-of-network rate. The extent to which this happens depends on insurer and provider bargaining leverage as well as providers’ ability and willingness to reduce access for out-of-network patients. In Medicare Advantage, for example, where in-network prices are negotiated but out-of-network prices default to traditional Medicare rates, and providers must still treat out-of-network Medicare Advantage enrollees, most negotiated prices are close to Medicare rates.54 ,55  In settings where providers are not required to treat out-of-network patients, capping out-of-network prices alone may not influence in-network prices nearly as much.

Implications and tradeoffs

Capping prices can be less disruptive than setting prices, because caps retain the potential for market forces and market-based policies to influence prices under the cap. This is particularly the case when caps are set to only bind for the highest of prices. Some proposals advocate for starting with generous caps that could subsequently be lowered,56  recognizing the tradeoff between the effectiveness of caps in reducing spending and their potential for unintended consequences for the financial viability of providers, quality, and access. Specifically, if caps are set very high, they would not be binding on many providers, reducing their impact on spending. If caps are set very low, they become akin to price setting, and providers and the communities they serve may be adversely impacted if providers respond by reducing quality, shutting down service lines, or exiting altogether.

Providers for whom caps are binding may find other ways to exercise their market power, such as negotiating higher prices for services for which caps are not binding, creating alternative payment structures, or demanding additional non-service-based payments (e.g., performance bonuses).57  Price caps that apply at the service level (rather than across all services for a given provider) may suggest a need for complementary regulation to pre-empt provider circumvention via alternative payment models, such as by shifting volume away from capped services to payment models for which it is difficult to establish caps. To the extent that individual services are combined into broader groups of services, service-specific price caps could be aggregated to derive a group-level cap. Aggregation is more complex for population-level payment models such as ACOs or capitation, which may require regulation of total medical expenditures. More generally, coupling price caps with limits on increases in total medical expenditures can help discourage circumvention of the caps.

In highly concentrated markets, a small number of providers or insurers may be able to unilaterally influence market-based (but not Medicare-based) caps. Medicare-based caps could be more susceptible to regulatory capture by providers, however. One alternative that curtails potential benchmark gaming and regulatory capture but preserves the ability of price caps to account for area differences in market dynamics is to set caps based on a large, even national, market but then adjust them for area differences in input costs (such as wage rates).

If only a subset of health plans employs price caps (e.g., as part of a public option or plans for state employees) and caps are set at relatively low levels, providers may choose not to contract with those plans, which can lead to their market exit. In that case, policymakers would be under pressure to increase caps to attract providers and plans. For example, Washington State’s Cascade Care public option plan increased provider price caps from the originally-proposed 100% of Medicare rates to 160% of Medicare rates (see box 2).58  However, applying price caps to a subset of plans, such as the health plans for a state’s employees, may face less opposition from providers.

Capping only out-of-network prices may be more palatable to providers than capping in-network prices because providers are free to negotiate prices if they choose to be in the network. Enforcement would be limited to out-of-network prices, which would substantially narrow the scope. Commercial payers already commonly specify maximum payments for out-of-network services, and Congress subjects certain out-of-network payment disputes to arbitration that can consider historical in-network price benchmarks in its recent No Surprises Act.

Price growth caps

Price growth caps constrain how much provider prices can increase over a defined period. Rhode Island’s Affordability Standards (box 3), for example, limit provider price growth to a measure of inflation plus one percentage point.59 

Policy design considerations

The primary consideration for price growth caps is selecting the index and methodology used to determine allowable annual changes in prices. Generally, these caps are pegged to measures of economic or price growth, such as gross domestic product, the consumer price index (CPI), or a medical price inflation index. The growth cap can either be set to the selected metric or can include a plus or minus factor (e.g., 1 or 2 percentage points). When calculating the cap and when evaluating whether price growth has remained below the limit, policymakers can opt to use one year of data or the average over several years, the latter of which would provide more stability but would also be slower to respond to changes.

A key challenge with price growth caps is determining whether caps should apply service-by-service, or on a more aggregated basis. Service-specific caps constrain price inflation for each service. However, providers or insurers may attempt to circumvent service-specific caps by redefining services, potentially as part of payment model innovation and akin to how pharmaceutical manufacturers have introduced new versions of the same drugs with different dosage amounts or routes of administration in order not to be bound by Medicaid’s drug price growth cap.60  One way to address such gaming is to design caps to also be provider- and insurer-specific, such that providers with market power cannot shift price growth for the same service from one payer to another.61  Another remedy would be to pair price growth caps with limits on provider-specific case mix-adjusted growth in total medical expenditures.62 

In addition, while existing price growth caps tend to limit price growth for all providers equally, price growth caps could be designed to constrain providers with higher prices more than those with lower prices.63  For example, prices of high-price providers could be constrained to grow at CPI minus one percentage point, while prices of low-price providers were allowed to grow at CPI plus one percentage point.

Implications and tradeoffs

Compared with other forms of price regulation, price growth caps are less likely to be disruptive to providers since they generally do not reduce nominal prices. They may thus be less likely than other forms of price regulation to adversely impact access or quality. However, unless price growth caps vary inversely with provider price (i.e., are more stringent for high-price providers and less stringent for low-price providers),64  they may lower health care spending growth but also lock in existing price variation, or at least not provide incentives to reduce it.

A fundamental issue with price growth caps is that the cost of providing some services may grow faster in price than others because of factors unrelated to provider market power, such as changes in the price of certain supplies, or other input costs. Changes in global supply chains due to the COVID-19 pandemic have impacted provider inventory and purchasing costs of medical supplies,65  which has implications for the cost of delivering care and may eventually be reflected in increased provider prices for impacted services. The unforeseeable nature of a global pandemic, for example, means that predetermined price growth caps may unintentionally punish providers who are disproportionately affected by changes in input costs. Such adverse consequences can be blunted by tying price growth caps to measures of cost inflation that capture such changes.

By limiting price increases instead of price levels, price growth caps also obviate the complicated issue of determining the appropriate service price, facilitating implementation. Many proposals, for instance, limit price increases to slightly above general inflation (the Build Back Better Act’s proposal to cap Medicare drug price growth is one recent example in pharmaceuticals). Like price caps, price growth caps allow market forces to continue to act underneath.66 ,67  Compared to both price setting and price caps, price growth caps are likely easier to implement, primarily because setting benchmarks requires substantially less data.

Box 3: Price Growth Cap in Rhode Island

In 2010, Rhode Island’s Office of the Health Insurance Commissioner adopted a set of “Affordability Standards” for all commercial health insurers in the state to reduce health care spending through more efficient systems and improve health insurance affordability. Commercial insurers are subject to multiple requirements, including a cap on annual price increases for inpatient and outpatient services equal to the CMS National Prospective Payment System Hospital Input Price Index (used in Medicare) plus one percentage point.

An evaluation found that implementation of the affordability standards was associated with a reduction in total spending growth as well as a decline in fee-for-service spending growth. Specifically, fee-for-service spending per person in plans subject to the regulations was an average of $76 per year lower between 2010 and 2016 than enrollees in the control group. That difference is approximately 8.1% of average spending per person in Rhode Island in 2009, the year before the limits were in place. Notably, neither inpatient nor outpatient utilization declined, meaning the reductions in spending were driven by slower growth in prices

Global Budgets

Under a global budget, providers are paid a fixed amount for treating a patient population over a defined period, instead of being paid for each service piecemeal. Because they constrain total provider revenue, global budgets create an incentive for less care to be delivered, with the goal of making care delivery more efficient. By shifting financial risk from payers to providers, global budgets reduce payer uncertainty around total claims cost and thus facilitate payers’ budget projections,68  which can be especially helpful for states, most of which cannot run a deficit.

Two general models of global budget initiatives exist. First, global budgets can be used in payment arrangements in which all payers in an area must participate. This is the case in Maryland, which added a global budget provision to its long-standing hospital all-payer payment system in 2014 (Box 4).69  Under the global budget system, each hospital in Maryland receives a fixed budget based on historical spending and forecasted changes in use, among other factors. Prices continue to be regulated, so hospitals need to manage utilization. Global budgets are also part of a rural hospital payment demonstration program in Pennsylvania and the Medicare for All Act of 2019 (H.R. 1384).

A second model, a voluntary global budget arrangement, pays providers fixed amounts for defined patient populations (but not for all patients across all payers). Many of Medicare’s Accountable Care Organization (ACO) programs fall into this category as do similar contracts by commercial payers, such as the Alternative Quality Contract (AQC) used by Blue Cross Blue Shield of Massachusetts. Some arrangements let providers share in savings they produce by coming in under budget (also called "one-sided” or “upside” risk) to further incentivize efficiency. Others also have providers share in any losses from coming in over budget (“two-sided” or “downside” risk).

Policy design considerations

Global budgets allow policymakers to directly constrain total health care spending by paying providers a lump sum for all services they deliver. This increases budgetary certainty and can help providers be more efficient. However, whether cost savings result depends on how global budgets are implemented.

One of the primary policy decisions related to the implementation of global budgets is the process by which the initial budget for each participating provider (often, though not necessarily, a hospital) is set. One approach is to base a provider’s initial budget on previous medical spending on the patient population that the provider will likely be responsible for. Once a provider’s global budget is set for the first year, an administrative process typically adjusts the budget for subsequent years, potentially by inflating budgets by a measure of general or medical inflation. The choice of how to set the initial budget and what measure to peg future growth has implications for the pace of spending growth. Using historical spending preserves higher payments due to historically high prices or overuse of services in the base period that was used to set the global budget. Similarly, providers cannot correct any underuse that occurred in the base period without being penalized by going over budget or becoming more efficient.

It is also possible to implement global budgets on a voluntary basis for providers who agree to be accountable for the spending of a set of patients. In this case, an important question is how to attribute patients to the participating providers. Many Medicare ACOs, for instance, attribute patients based on the organizational affiliation of their primary care physicians. Patients may get care from multiple providers, some of which may not be part of their attributed ACO. This so-called “leakage” represents spending that the ACO does not have direct control over, but that counts against its budget. ACOs, and providers under similar global budget arrangements, are thus incentivized to minimize leakage and keep care in-house. The narrower its scope of services, the more potential leakage an ACO is exposed to, which may make coordination of care more difficult but also incentivize the reduction of wasteful spending. Global budgets can thus work for physician practices as well as hospitals. The larger the organization, the more financial risk it may be willing and able to take. One way to reduce leakage is by designing referral systems that encourage internal referrals.

Implications and tradeoffs

In contrast to price regulation, global budgets limit spending (which includes both price and utilization). To stay under budget and achieve savings, providers can constrain either prices or volume or both. To the extent that it is difficult to set relative prices that won’t distort provider behavior, this additional flexibility of global budgets may insulate against some of the potential unintended consequences of price regulation. However, this same flexibility may increase concerns that needed services may be underprovided.

Global budgets create strong incentives for providers to reduce wasteful spending. A key concern, however, is that global budgets incent volume reductions irrespective of quality, thereby potentially reducing the provision of both high- and low-value care. Consequently, most global budget contracts include pay-for-performance provisions that stipulate quality targets and make a certain percentage of payment contingent on meeting them. Global budgets can also include risk adjustment meant to ensure providers do not preferentially select patients with favorable risk profiles.

Since global budgets transfer some financial risk from payers to providers, they may expose providers to large financial shocks, such as the one caused by the COVID-19 pandemic, and the uncertainty they create. On one hand, global budgets may buffer providers’ revenue losses from reductions in volume (such as elective services). This was the case in Maryland, where hospitals could receive their full anticipated revenues based on their fixed budgets despite volume declines during the pandemic, enabled by Maryland allowing compensatory price increases to partially offset volume reductions and budget roll-overs to the next year.70  On the other hand, providers also bear the financial risk for increased care costs due to unanticipated care needs (such as those caused by a public health crisis). If too severe or prolonged, this may necessitate restructuring such as the closing of service lines or provider exits. Alternatively, it may cause policymakers to step in and ease limits, or offset expenses due to unforeseeable events, such as a pandemic. Global budget models can be designed with such extreme cases in mind, for example by including risk mitigation provisions that share financial risk with payers in the case of a large, unexpected shock.

Evidence on the performance of Medicare ACOs as well as Massachusetts’s AQC, both global budget initiatives with provider performance incentives, suggest that voluntary global budget contracts can achieve modest savings while maintaining or slightly increasing quality.71 ,72 ,73 ,74 ,75 ,76 ,77  While prices are fixed in Medicare, Medicare ACOs can reduce spending by reducing volume or referring to lower price settings. Savings in commercial global budget models can include price reductions. For example, savings in the AQC predominantly came from reduced prices and utilization in the outpatient setting, with savings exceeding participation incentive payments in later years,78 ,79  suggesting the possibility for net savings. In one study, physician-led ACOs achieved greater savings than hospital-led ACOs,80  likely because of greater incentive to reduce wasteful spending due to a narrower scope of services. While concern exists that global budgets may incentivize provider consolidation, the evidence so far is limited and mixed.81 ,82 

Box 4: Maryland’s Global Budget Model

Maryland has used an all-payer model to pay hospitals for more than four decades. Building off of this experience, in 2014, under a 5-year CMS 1115 waiver, the state gave each of its acute care hospitals an annual global budget for inpatient, hospital outpatient, and emergency department care. The goal of the waiver was to test whether an all-payer system for hospital payment that is accountable for the per-person total hospital cost of care is an effective model for advancing better care, better health, and reduced costs. In 2019, the state continued the global budgets payment framework through its Total Cost of Care Model. Maryland has also obtained a second waiver from CMS to include Medicare and Medicaid in this model.

Under these waivers, the annual global budget for hospitals in Maryland encompassed all payers: Medicaid, Medicare, commercial insurers, and self-paying patients. The program limits growth in per-person total spending on hospital care, across all payers in Maryland, to a set percent each year. The goal of the limits on hospital spending was to both contain overall spending growth as well as to encourage hospitals to find ways to deliver hospital care and dedicate the unused resources on primary care.

An independent agency in Maryland set the global budget for each hospital by looking at past hospital revenue and updates it annually. Despite the global budget system in Maryland, a fee-for-service payment system is used to ensure cashflow by paying hospitals over the course of each year.83  In order to help hospitals meet their global budget target, if hospital volume falls, prices are permitted to increase a limited amount. Similarly, volume increases can be accompanied by decreases in price. Working within these “rate corridors,” hospitals face penalties if they miss the global budget target.

A federal evaluation of the global payment model published in 2018 found that Maryland had significant changes on some cost and quality measures, though not all.84  Overall, Maryland reduced total expenditures and hospital expenditures for Medicare beneficiaries. Maryland also saw a significant decline in all-cause hospital readmissions and potentially avoidable hospitalizations. However, there was not a statistically significant decline in total expenditures or total hospital expenditures for commercial plan members in Maryland relative to the comparison group. The evaluation attributed this to different utilization patterns for the commercial population, particularly increased expenditures for hospital and non-hospital outpatient services that offset savings on emergency department visits and observation stays.

Beyond cost savings, global budgets also have the advantage of providing more predictable revenue for providers. In the early months of the COVID-19 pandemic when hospital admissions dropped due to declines in non-emergency procedures, Maryland’s global budget program was able to put policies in place to stabilize revenues as well as factor in the grants that Maryland hospitals received from the federal Provider Relief Fund.85 

Spending Growth Targets

Spending growth targets place limits on increases in total health care expenditures. Targets are specified for a particular period of time at the insurer, provider, or market level. They can be mandatory or voluntary. The mere existence of a voluntary target may help motivate providers and insurers to constrain spending, likely via a reluctance to be “named and shamed”.

Several states have adopted varying versions of spending growth targets. Massachusetts, which has the oldest effort dating back to 2012, sets a voluntary statewide growth target (set at 3.1% for 2022) and has tasked an independent state agency with monitoring compliance (Box 5). The agency has no authority to fine offending providers but can require them to file performance improvement plans committing to concrete actions to reduce spending. Oregon also uses performance improvement plans to hold insurers and providers accountable to spending growth targets. Both states have the ability to levy financial penalties in cases of sustained non-compliance. Rhode Island has a state spending growth benchmark and the Office of the Insurance Commissioner has broad authority to monitor health insurance premium increases of fully-insured health plans via rate review and decline to approve those deemed excessive.86  Other states have implemented their own spending growth benchmarks or have proposed them,87  including California, Connecticut, Delaware, Nevada, New Jersey and Washington.88 

Box 5: Spending Growth Target in Massachusetts

In 2006, Massachusetts passed legislation that achieved near-universal health insurance coverage in the state. However, projections for health care spending estimated that the spending would grow sharply, consuming an increasing share of the state’s economy. Concerned about this trajectory, in 2012, the state enacted legislation to establish an independent agency, the Health Policy Commission (HPC), to lead efforts to reduce health care spending and improve affordability in the state. Another key feature of the legislation was to establish an annual target for total statewide health care spending growth, called the health care cost growth benchmark.

Since 2013, the voluntary benchmark serves as a standard against which to evaluate health care spending growth in Massachusetts. The benchmark is set annually based on a formula that estimates the projected economic growth in the state. Through 2017, the benchmark was equal to the projected economic growth, and since 2018 it has been set to 0.5 percentage points below this estimate.

Each year, the Center for Health Information and Analysis (CHIA) evaluates how well Massachusetts performed relative to the health care cost growth benchmark. The annual report calculates overall spending growth, as well as spending growth by payer type and service category. It also includes evaluations of provider and health system trends, quality, premiums and cost sharing. Between 2013 and 2020, spending growth was below the benchmark in four years, and exceeded the benchmark in four years. However, even in years when the benchmark was exceeded, spending grew slower than national health care spending, which some have interpreted as evidence that the benchmark, and the efforts it encourages, are succeeding in constraining health care spending growth.

In addition, each year HPC and CHIA work together to assess how individual payers and providers performed relative to the health care cost growth benchmark. Additional data is reviewed for payers and providers who do not meet the benchmark (and certain large payers and physician groups who are not sufficiently under the target), and those underperforming may be required to submit a performance improvement plan. The payers and providers for which a performance improvement plan is required are named publicly. They are required to report on the causes of their spending growth, as well as a savings goal and actionable steps to achieve that goal. These payers and providers are then monitored by HPC for 18 months. As a last resort fines can be assessed for non-compliance.

Policy design considerations

Policy design considerations for limits on spending growth are similar to those for price growth caps. Importantly, a target growth benchmark needs to be determined. Existing efforts rely on stakeholder input and commonly limit spending increases to a measure of general or medical inflation plus or minus one to two percentage points,89 ,90  though this is a balancing act. Set too low, growth targets may adversely impact care delivery. Set too high, they do little to constrain spending.

Another consideration is whether benchmarks should be voluntary or mandatory. Voluntary efforts are less controversial, but also likely to be less effective at constraining spending. In either case, policymakers could consider a mechanism to hold plans and providers accountable to the targets. Enforcement could include regular performance review, which may require commitments to improvement, and involve financial penalties for plans and providers that do not comply.

It is also necessary to decide whether spending growth targets apply at the insurer or provider level. Limits on insurer-level expenditure growth may push insurers to increase their focus on reducing waste, improving benefit design, and negotiating aggressively with providers. This may be particularly true to the extent that medical loss ratio regulations, which require insurers to spend a fixed proportion of their premium revenues on paying medical claims, may loosen cost containment pressures on insurers.91  Limits on provider-level total expenditure growth requires providers to contain growth in service prices, volume, or find cost efficiencies in their delivery processes, and are closely related to global budgets but regulate expenditure growth instead of expenditure levels (though global budgets commonly also consider provider expenditure growth).

Implications and tradeoffs

Spending growth targets can be implemented as standalone policies or in conjunction with broader health system reforms. Rhode Island’s 2010 affordability standards, for instance, pair spending growth targets with insurance rate review intended to limit premium growth, as well as provider price growth caps, and other payment reform initiatives. Evidence suggests that Rhode Island’s set of affordability standard policies were associated with lower spending growth in fee-for-service plans as compared to other states,92  though the relative impact of spending growth targets versus other provisions is difficult to tease apart and reduced prices suggest that price controls may have played an important part. In general, limits on spending growth are a natural complement to price regulation (such as price setting, price caps, or price growth caps) since they minimize potential circumvention of price controls as well as compensatory increases in volume.

Spending growth targets may distort incentives less than alternatives, though they may also produce smaller-scale effects. This may be less disruptive to, and lead to less opposition from, health care providers than more drastic changes, such as price setting at a low multiple of Medicare. However, efforts that limit spending growth too drastically could be difficult to enforce. For example, before it was replaced by the Medicare Access and CHIP Reauthorization Act, Medicare’s Sustainable Growth Rate (SGR) formula was overridden annually by Congress because physicians argued that it would have reduced physician fees too severely.93  Moreover, policies that limit spending growth do not directly, nor necessarily, constrain commercial provider prices, which are often twice Medicare rates and widely understood to be a root cause of high spending on the commercially insured and evidence of market failure in health care.

Process for Adopting Policy Changes

To implement the policy options reviewed in this paper, specific legislative or regulatory action is required. That generally means passing legislation through two chambers of Congress or a state legislature and gaining the support of the President or Governor. In some cases, executive action could be used to implement more targeted changes for a subset of health insurance markets or plans. The levers available vary depending on whether the policy is being adopted at the state or federal level and whether the policy applies to payers or providers. Additionally, once adopted, implementation will generally require ongoing monitoring, and potentially new data to be collected and analyzed.

Legislative and executive actions

Directly regulating prices for private payers or imposing a global budget or spending growth target, would generally require legislation at the federal or state level. In some cases, depending on the policy and the state, it would be possible for states to implement new regulations without new legislation, such as how Rhode Island adopted limits in price growth for commercial insurers regulated by state. State regulation of most self-funded health plans, which include 64% of workers covered by employer-sponsored insurance, is pre-empted by the Employee Retirement Income Security Act (ERISA). Therefore, in the absence of new federal legislation, states cannot generally impose requirements on these plans, and instead would have to rely on voluntary participation.94  At the federal level, policymakers can impose requirements on self-funded health plans by amending ERISA, though this route has historically been used to expand coverage, rather than target health care spending or prices.

States can implement the policies we discussed for fully insured plans, including plans on the ACA’s Marketplaces or the health insurance plans for their own public employees. For example, states could leverage or expand their department of insurance’s rate review authority to ensure that health plan premium increases are not inconsistent with limits on price growth.95  Additionally, price caps that apply to a subset of insurance markets or plans under state oversight could be established.

Instead of adopting policies that impose requirements on plans, policymakers could regulate how providers are paid, which is not subject to ERISA pre-emption.96  While this can be done on a state-by-state basis, if the policy includes the prices paid for Medicare patients, under current law it would generally require a Social Security Act Section 1814(b) waiver from CMS that exempts the relevant providers from Medicare’s payment systems. Another route for adopting payment reforms that include Medicare and Medicaid is to establish a demonstration through the Center for Medicare and Medicaid Innovation (CMMI).

Alternatively, both the federal and state tax codes could be amended to incentivize payers and providers to adopt price-reducing policies. For example, tax benefits could be extended to hospitals or other providers that participate in voluntary global budget arrangements.

Monitoring and enforcement

Following the adoption of any of the policies discussed in this paper, ongoing monitoring would be important to ensure provider solvency, patient access, and quality, and that the appropriate resources are available for the agencies responsible for enforcement. Whether the policy was adopted at the state or federal level, states would likely have a role in monitoring and enforcement given their oversight of fully-insured plans. This could involve establishing a new regulatory body, an office within an existing agency, or a quasi-governmental entity that facilitates participation by stakeholders.

In addition, monitoring and enforcement would require data on health prices and/or spending to be collected. One approach for meeting data needs would be to utilize all-payer claims databases (APCDs) that contain medical claims from all public and private payers. While several states have APCDs, ERISA pre-emption means that self-insured payers cannot be required to participate unless new federal legislation is adopted. Another option is to require additional reporting as part of the rate review process. However, ERISA pre-emption again means that the data would most likely be limited to a subset of active health plans.

The extent to which monitoring and enforcement are complicated by the proliferation of alternative payment models depends on the specific policy option adopted. By regulating total cost of care, global budgets may obviate the need for (additional) alternative payment models altogether. Spending growth targets can be defined to be broad enough to encompass any payments associated with alternative payment models. By aiding in the redefinition of services and facilitating extra-claims payments (such as quality bonuses), alternative payment models could be avenues for provider circumvention of price regulation, however. To counteract this, enforcement efforts could include monitoring of total and non-claims spending and define triggers for enforcement action.

Current state-level efforts to constrain health care prices have utilized various structures for monitoring and enforcement. For example, Massachusetts created an independent state agency, the Massachusetts Health Policy Commission, which is overseen by an 11-member Board of Commissioners with specific, statutorily defined expertise, and appointed by various government officials. In Rhode Island, the Office of the Health Insurance Commissioner oversees the state’s efforts. In California, legislation under consideration would establish the Office of Health Care Affordability within the Department of Health Care Access and Information. Any or all of these could serve as examples going forward.

Implications of Lowering Health Care Prices for Patients and Payers

Policies that directly regulate health care prices or impose global budgets or spending targets could have significant implications for patients and payers, including employers and insurers, as well as state governments and the federal government. For example, using the Medicare fee schedule to set reimbursement for all people with private insurance would have lowered spending on health care covered by private insurance by an estimated 41% or $352 billion in 2021, assuming no other changes to the health care system.

Lower spending could translate into lower premiums and lower cost sharing, particularly if insurers are incentivized or required to pass savings through to consumers. For employers that provide health insurance, lower health care prices would ease pressure to increase premiums or cost sharing, may lead to higher wage growth, and could increase full-time employment.97  This could translate to an increase in taxable income, which would generate higher federal and state revenues. Lower prices would also lower health care spending for federal and state employees.

At the same time, reduced commercial prices would very likely lead to reduced provider revenues, which would be sure to face strong industry opposition and may potentially negatively impact health care access and quality. By reducing income for some individuals employed in the health care sector, reduced commercial prices could also negatively impact tax revenues, even if they generate overall savings. One option to counteract any negative impacts is to gradually phase in reforms to provider payment while monitoring access, quality, and labor market effects and preserving the ability to titrate benchmarks up or down.

Conclusion

Health care prices in the United States are high, highly variable, and a key driver of rising health care spending. Market-based efforts have been largely unsuccessful in meaningfully constraining prices, leading policymakers and other stakeholders to search for alternatives, including price regulation, global budgets, and spending growth targets. However, these measures are controversial and raise issues about the appropriate role for government in regulating health care prices and spending.

In this paper, we reviewed several policy options that may constrain health care spending, primarily by putting downward pressure on provider prices. All of the options discussed have trade-offs. In particular, the potential magnitude of savings is generally higher the more broadly and stringently the policies are applied. However, so is the potential for adverse consequences, including reduced access and quality. Policymakers may find the desired balance between these outcomes by giving careful attention to the design considerations we discussed.

The reforms discussed in this paper have been adopted to varying degrees by a few states. Those experiences serve as examples of how different approaches can work in practice, particularly if states decide to pursue such changes in the absence of federal legislation.

Jeannie Fuglesten Biniek and Tricia Neuman are with KFF. Maximilian Pany is an independent consultant.This work was supported in part by Arnold Ventures. We value our funders. KFF maintains full editorial control over all of its policy analysis, polling, and journalism activities.

Endnotes

  1. Congressional Budget Office, The Prices That Commercial Health Insurers and Medicare Pay for Hospitals’ and Physicians’ Services (Washington, DC: Congressional Budget Office, October 2021),  https://www.cbo.gov/publication/57422 ↩︎
  2. Matthew Rae, Rebecca Copeland, and Cynthia Cox, Tracking the rise in premium contributions and cost-sharing for families with large employer coverage (Washington, DC: KFF, August 14, 2019): https://www.healthsystemtracker.org/brief/tracking-the-rise-in-premium-contributions-and-cost-sharing-for-families-with-large-employer-coverage/ ↩︎
  3. Health Care Cost Institute, 2019 Health Care Cost And Utilization Report (Washington, DC: Health Care Cost Institute, October 2021),  https://healthcostinstitute.org/images/pdfs/HCCI_2019_Health_Care_Cost_and_Utilization_Report.pdf ↩︎
  4. Suhas Gondi et al, “Early Hospital Compliance With Federal Requirements for Price Transparency,” JAMA Internal Medicine 181, no. 10 (June 14, 2021):1396-1397, doi:10.1001/jamainternmed.2021.2531. ↩︎
  5. Morgan A. Henderson and Morgane C. Mouslim, “Low Compliance From Big Hospitals On CMS’s Hospital Price Transparency Rule,” Health Affairs (March 16, 2021), https://www.healthaffairs.org/do/10.1377/hblog20210311.899634/full/ ↩︎
  6. Bianca Mulaney, Shreya A. Shah, Christine Kim, and Laurence C. Baker, “Compliance with Price Transparency by California Hospitals,” Stanford Health Policy (July 10, 2021), https://healthpolicy.fsi.stanford.edu/publication/compliance-price-transparency-california-hospitals ↩︎
  7. Nisha Kurani et al, Early results from federal price transparency rule show difficulty in estimating the cost of care Estimates (Washington, DC:  Kaiser Family Foundation, April 2021), https://www.healthsystemtracker.org/brief/early-results-from-federal-price-transparency-rule-show-difficultly-in-estimating-the-cost-of-care/. ↩︎
  8. Sunita Desai et al, “Association Between Availability of a Price Transparency Tool and Outpatient Spending,” JAMA 315, no. 17 (May 3, 2016): 1874-1881, doi:10.1001/jama.2016.4288. ↩︎
  9. Anna D. Sinaiko, Karen E. Joynt, and Meredith B. Rosenthal, “Association Between Viewing Health Care Price Information and Choice of Health Care Facility,” JAMA Internal Medicine 178, no. 12 (December 2016), doi:10.1001/jamainternmed.2016.6622 ↩︎
  10. Martin Gaynor, What to Do about Health-Care Markets? Policies to Make Health-Care Markets Work (Washington, DC: The Hamilton Project, March 10, 2021), https://www.hamiltonproject.org/papers/what_to_do_about_health_care_markets_policies_to_make_health_care_markets_work . ↩︎
  11. Benjamin Sommers, “Who Really Pays for Health Insurance?” International Journal of Health Care Finance and Economics 5 (March 2005): 89–118 https://doi.org/10.1007/s10754-005-6603-5. ↩︎
  12. Health Care Cost Institute, 2019 Health Care Cost And Utilization Report (Washington, DC: Health Care Cost Institute, October 2021),  https://healthcostinstitute.org/images/pdfs/HCCI_2019_Health_Care_Cost_and_Utilization_Report.pdf ↩︎
  13. Gerard F. Anderson, Peter Hussey, and Varduhi Petrosyan, “It’s Still The Prices, Stupid: Why The US Spends So Much On Health Care, And A Tribute To Uwe Reinhardt,” Health Affairs 38, no. 1 (January 2019): 87-95, https://doi.org/10.1377/hlthaff.2018.05144 ↩︎
  14. Irene Papanicolas, Liana R. Woskie, and Ashish K. Jha, “Health Care Spending in the United States and Other High-Income Countries,” JAMA 319, no. 10 (March 13, 2018):1024-1039, doi:10.1001/jama.2018.1150 ↩︎
  15. Congressional Budget Office, The Prices That Commercial Health Insurers and Medicare Pay for Hospitals’ and Physicians’ Services (Washington, DC: Congressional Budget Office, October 2021),  https://www.cbo.gov/publication/57422 ↩︎
  16. Zack Cooper et al, “Hospital Prices Grew Substantially Faster Than Physician Prices For Hospital-Based Care In 2007–14,” Health Affairs 38, no. 2 (February 2019): 184-189, https://doi.org/10.1377/hlthaff.2018.05424 ↩︎
  17. David M. Cutler and Fiona Scott Morton. “Hospitals, Market Share, and Consolidation.” JAMA 310, no. 18 (November 13, 2013); 1964-2970, doi:10.1001/jama.2013.281675 ↩︎
  18. Brent D. Fulton, “Health Care Market Concentration Trends In The United States: Evidence And Policy Responses,” Health Affairs 36, no. 9 (September 1, 2017): 1530–1538,  https://doi.org/10.1377/hlthaff.2017.0556. ↩︎
  19. Brent D. Fulton, “Health Care Market Concentration Trends In The United States: Evidence And Policy Responses,” Health Affairs 36, 1530–1538, https://doi.org/10.1377/hlthaff.2017.0556. ↩︎
  20. Maximilian J. Pany, Michael E. Chernew, and Leemore S. Dafny, “Regulating Hospital Prices Based On Market Concentration Is Likely To Leave High-Price Hospitals Unaffected,” Health Affairs 40, no. 9 (September 2021): 1386-1394, https://doi.org/10.1377/hlthaff.2021.00001 ↩︎
  21. Michael E. Chernew, Leemore S. Dafny, and Maximilian J. Pany, A Proposal to Cap Provider Prices and Price Growth in the Commercial Health-Care Market (Washington, DC: The Hamilton Project, March 2020),  https://www.hamiltonproject.org/papers/a_proposal_to_cap_provider_prices_and_price_growth_in_the_commercial_health_care_market ↩︎
  22. Robert Murray, Robert Berenson, Hospital Rate Setting Revisited: Dumb Price Fixing or a Smart Solution to Provider Pricing Power and Delivery (Washington, DC: Urban Institute, November 2015), https://www.urban.org/sites/default/files/publication/73841/2000516-Hospital-Rate-Setting-Revisited.pdf ↩︎
  23. Robert Murray, Robert Berenson, Hospital Rate Setting Revisited: Dumb Price Fixing or a Smart Solution to Provider Pricing Power and Delivery (Washington, DC: Urban Institute, November 2015), https://www.urban.org/sites/default/files/publication/73841/2000516-Hospital-Rate-Setting-Revisited.pdf ↩︎
  24. David C. Chan Jr and Michael J. Dickstein, Industry Input in Policymaking: Evidence from Medicare (Cambridge, MA: National Bureau of Economic Research, February 2018), https://www.nber.org/system/files/working_papers/w24354/w24354.pdf ↩︎
  25. Hospital Competition Act of 2019, H.R. 506, 116th Cong. § 2 (2019). ↩︎
  26. Fair Care Act of 2019, H.R. 1332, 116th Cong. § 401 (2019). ↩︎
  27. Michael E. Chernew, Andrew L. Hicks, and Shivani A. Shah, “Wide State-Level Variation In Commercial Health Care Prices Suggests Uneven Impact Of Price Regulation,” Health Affairs 39, no. 5 (May 2020): 791-799, https://doi.org/10.1377/hlthaff.2019.01377 ↩︎
  28. Joseph P. Newhouse and Daniel J. Byrne, “Did Medicare’s Prospective Payment System cause length of stay to fall?” Journal of Health Economics 7, no. 4 (December 1988): 413-416, https://doi.org/10.1016/0167-6296(88)90023-9 ↩︎
  29. Mireille Jacobson, Craig C. Earle, Mary Price, and Joseph P. Newhouse, “How Medicare’s Payment Cuts For Cancer Chemotherapy Drugs Changed Patterns Of Treatment, “ Health Affairs 29, no. 7 (July 2010):1391-1399, https://doi.org/10.1377/hlthaff.2009.0563 ↩︎
  30. Zack Cooper, Stuart V Craig, Martin Gaynor, and John Van Reenen, “The Price Ain’t Right? Hospital Prices and Health Spending on the Privately Insured,” The Quarterly Journal of Economics, 134, no. 1 (September 4, 2019): 51-107, https://doi.org/10.1093/qje/qjy020 ↩︎
  31. Chapin White and Christopher M. Whaley, Prices Paid to Hospitals by Private Health Plans Are High Relative to Medicare and Vary Widely: Findings from an Employer-Led Transparency Initiative (Santa Monica, CA: RAND Corporation, 2019), https://www.rand.org/pubs/research_reports/RR3033.html ↩︎
  32. Michael E. Chernew, Andrew L. Hicks, and Shivani A. Shah, “Wide State-Level Variation In Commercial Health Care Prices Suggests Uneven Impact Of Price Regulation,” Health Affairs 39, no. 5 (May 2020): 791-799, https://doi.org/10.1377/hlthaff.2019.01377 ↩︎
  33. Congressional Budget Office, The Prices That Commercial Health Insurers and Medicare Pay for Hospitals’ and Physicians’ Services (Washington, DC: Congressional Budget Office, October 2021),  https://www.cbo.gov/publication/57422 ↩︎
  34. Congressional Budget Office, The Prices That Commercial Health Insurers and Medicare Pay for Hospitals’ and Physicians’ Services (Washington, DC: Congressional Budget Office, October 2021),  https://www.cbo.gov/publication/57422 ↩︎
  35. Martin Gaynor M, Kate Ho, Robert J. Town, “The Industrial Organization of Health-Care Markets†,” Journal of Economic Literature 53, no. 2 (June 2015): 235-284, https://www.jstor.org/stable/24433982 ↩︎
  36. Michael E. Chernew, Leemore S. Dafny, and Maximilian J. Pany, A Proposal to Cap Provider Prices and Price Growth in the Commercial Health-Care Market (Washington, DC: The Hamilton Project, March 2020),  https://www.hamiltonproject.org/papers/a_proposal_to_cap_provider_prices_and_price_growth_in_the_commercial_health_care_market ↩︎
  37. Michael E. Chernew, David A. Cutler, and Shivani A. Shah, Reducing Health Care Spending: What Tools Can States Leverage? (Washington, DC: Commonwealth Fund, August 2021),  https://www.commonwealthfund.org/publications/fund-reports/2021/aug/reducing-health-care-spending-what-tools-can-states-leverage ↩︎
  38. Michael E. Chernew, Leemore S. Dafny, and Maximilian J. Pany, A Proposal to Cap Provider Prices and Price Growth in the Commercial Health-Care Market (Washington, DC: The Hamilton Project, March 2020),  https://www.hamiltonproject.org/papers/a_proposal_to_cap_provider_prices_and_price_growth_in_the_commercial_health_care_market ↩︎
  39. Maximilian J. Pany, Michael E. Chernew, and Leemore S. Dafny, “Regulating Hospital Prices Based On Market Concentration Is Likely To Leave High-Price Hospitals Unaffected,” Health Affairs 40, no. 9 (September 2021): 1386-1394, https://doi.org/10.1377/hlthaff.2021.00001 ↩︎
  40. Zack, Cooper, Joseph J. Doyle Jr, John A. Graves, and Jonathan Gruber, Do Higher-Priced Hospitals Deliver Higher-Quality Care? (Cambridge, MA: National Bureau of Economic Research, February 2022), http://www.nber.org/papers/w29809 ↩︎
  41. Michael E. Chernew, Leemore S. Dafny, and Maximilian J. Pany, A Proposal to Cap Provider Prices and Price Growth in the Commercial Health-Care Market (Washington, DC: The Hamilton Project, March 2020),  https://www.hamiltonproject.org/papers/a_proposal_to_cap_provider_prices_and_price_growth_in_the_commercial_health_care_market ↩︎
  42. Michael E. Chernew and Maximilian J. Pany, “Regulation of Health Care Prices: The Case for Backstop Price Caps in Commercial Health Care Markets,” JAMA 325, no. 9 (March 2, 2021):817, doi:10.1001/jama.2020.26821 ↩︎
  43. Robert A. Berenson and Robert B. Murray, “How Price Regulation Is Needed To Advance Market Competition,” Health Affairs 41, no. 1 (January 2022): 26-34, https://doi.org/10.1377/hlthaff.2021.01235 ↩︎
  44. Aditi P. Sen et al, “Participation, Pricing, and Enrollment in a Health Insurance “Public Option”: Evidence From Washington State’s Cascade Care Program,” The Milbank Quarterly 100 (March 2022), https://www.milbank.org/quarterly/articles/participation-pricing-and-enrollment-in-a-health-insurance-public-option-evidence-from-washington-states-cascade-care-program/ ↩︎
  45. Catalyst for Payment Reform, Reference-Based Pricing: Risks and Rewards of Playing Health Care Hardball (Catalyst for Payment Reform, April 2021), https://www.catalyze.org/wp-content/uploads/2021/04/RBP-Whitepaper_April-2021_Published.pdf ↩︎
  46. Steve Schramm and Zachary Aters, Estimating the Impact of Reference-Based Hospital Pricing in the Montana State Employee Plan, (Scottsdale, AZ: Optumas, April 6, 2021), https://www.nashp.org/wp-content/uploads/2021/04/MT-Eval-Analysis-Final-4-2-2021.pdf ↩︎
  47. Aditi P. Sen et al, “Participation, Pricing, and Enrollment in a Health Insurance “Public Option”: Evidence From Washington State’s Cascade Care Program,” The Milbank Quarterly 100 (March 2022), https://www.milbank.org/quarterly/articles/participation-pricing-and-enrollment-in-a-health-insurance-public-option-evidence-from-washington-states-cascade-care-program/ ↩︎
  48. Michael E. Chernew, Leemore S. Dafny, and Maximilian J. Pany, A Proposal to Cap Provider Prices and Price Growth in the Commercial Health-Care Market (Washington, DC: The Hamilton Project, March 2020),  https://www.hamiltonproject.org/papers/a_proposal_to_cap_provider_prices_and_price_growth_in_the_commercial_health_care_market ↩︎
  49. Michael E. Chernew, Leemore S. Dafny, and Maximilian J. Pany, A Proposal to Cap Provider Prices and Price Growth in the Commercial Health-Care Market (Washington, DC: The Hamilton Project, March 2020),  https://www.hamiltonproject.org/papers/a_proposal_to_cap_provider_prices_and_price_growth_in_the_commercial_health_care_market ↩︎
  50. Michael E. Chernew, Leemore S. Dafny, and Maximilian J. Pany, A Proposal to Cap Provider Prices and Price Growth in the Commercial Health-Care Market (Washington, DC: The Hamilton Project, March 2020),  https://www.hamiltonproject.org/papers/a_proposal_to_cap_provider_prices_and_price_growth_in_the_commercial_health_care_market ↩︎
  51. Robert A. Berenson and Robert B. Murray, “How Price Regulation Is Needed To Advance Market Competition,” Health Affairs 41, no. 1 (January 2022): 26-34, https://doi.org/10.1377/hlthaff.2021.01235 ↩︎
  52. Congressional Budget Office, The Prices That Commercial Health Insurers and Medicare Pay for Hospitals’ and Physicians’ Services (Washington, DC: Congressional Budget Office, October 2021),  https://www.cbo.gov/publication/57422 ↩︎
  53. Martin Gaynor M, Kate Ho, Robert J. Town, “The Industrial Organization of Health-Care Markets†,” Journal of Economic Literature 53, no. 2 (June 2015): 235-284, https://www.jstor.org/stable/24433982 ↩︎
  54. Jared Lane Maeda and Lyle Nelson, “How Do the Hospital Prices Paid by Medicare Advantage Plans and Commercial Plans Compare With Medicare Fee-for-Service Prices?” INQUIRY 55 (Jan-Dec 2018), doi: 10.1177/0046958018779654 ↩︎
  55. Julius L. Chen, Andrew L. Hicks, Michael E. Chernew, “Prices for Physician Services in Medicare Advantage Versus Traditional Medicare,” American Journal of Managed Care 24 no. 7 (July 20, 2018):341-344, https://www.ajmc.com/view/prices-for-physician-services-in-medicare-advantage-versus-traditional-medicare ↩︎
  56. Michael E. Chernew, Leemore S. Dafny, and Maximilian J. Pany, A Proposal to Cap Provider Prices and Price Growth in the Commercial Health-Care Market (Washington, DC: The Hamilton Project, March 2020),  https://www.hamiltonproject.org/papers/a_proposal_to_cap_provider_prices_and_price_growth_in_the_commercial_health_care_market ↩︎
  57. Michael E. Chernew and Maximilian J. Pany, “Regulation of Health Care Prices: The Case for Backstop Price Caps in Commercial Health Care Markets,” JAMA 325, no. 9 (March 2, 2021):817, doi:10.1001/jama.2020.26821 ↩︎
  58. Michael S. Sparer, “Redefining the “Public Option”: Lessons from Washington State and New Mexico,” Milbank Quarterly 98 (June 2020), https://www.milbank.org/quarterly/articles/redefining-the-public-option-lessons-from-washington-state-and-new-mexico/ ↩︎
  59. Aaron Baum et al, “Health Care Spending Slowed After Rhode Island Applied Affordability Standards To Commercial Insurers,” Health Affairs 38, no. 2 (February 2019):237-245, https://doi.org/10.1377/hlthaff.2018.05164 ↩︎
  60. Mark Duggan and Fiona Scott Morton, “The Distortionary Effects of Government Procurement: Evidence from Medicaid Prescription Drug Purchasing,” The Quarterly Journal of Economics 121, no. 1 (February 2005): 1-30, https://doi.org/10.1093/qje/121.1.1 ↩︎
  61. Michael E. Chernew, Leemore S. Dafny, and Maximilian J. Pany, A Proposal to Cap Provider Prices and Price Growth in the Commercial Health-Care Market (Washington, DC: The Hamilton Project, March 2020),  https://www.hamiltonproject.org/papers/a_proposal_to_cap_provider_prices_and_price_growth_in_the_commercial_health_care_market ↩︎
  62. Michael E. Chernew and Maximilian J. Pany, “Regulation of Health Care Prices: The Case for Backstop Price Caps in Commercial Health Care Markets,” JAMA 325, no. 9 (March 2, 2021):817, doi:10.1001/jama.2020.26821 ↩︎
  63. Michael E. Chernew, Leemore S. Dafny, and Maximilian J. Pany, A Proposal to Cap Provider Prices and Price Growth in the Commercial Health-Care Market (Washington, DC: The Hamilton Project, March 2020),  https://www.hamiltonproject.org/papers/a_proposal_to_cap_provider_prices_and_price_growth_in_the_commercial_health_care_market ↩︎
  64. Michael E. Chernew, Leemore S. Dafny, and Maximilian J. Pany, A Proposal to Cap Provider Prices and Price Growth in the Commercial Health-Care Market (Washington, DC: The Hamilton Project, March 2020),  https://www.hamiltonproject.org/papers/a_proposal_to_cap_provider_prices_and_price_growth_in_the_commercial_health_care_market ↩︎
  65. Peggy G. Chen et al., Medical Device Supply Chains: An Overview and Description of Challenges During the COVID-19 Pandemic (Washington, DC: Office of the Assistant Secretary for Planning and Evaluation, October 13, 201), https://aspe.hhs.gov/reports/medical-device-supply-chains ↩︎
  66. Michael E. Chernew, Leemore S. Dafny, and Maximilian J. Pany, A Proposal to Cap Provider Prices and Price Growth in the Commercial Health-Care Market (Washington, DC: The Hamilton Project, March 2020),  https://www.hamiltonproject.org/papers/a_proposal_to_cap_provider_prices_and_price_growth_in_the_commercial_health_care_market ↩︎
  67. Michael E. Chernew and Maximilian J. Pany, “Regulation of Health Care Prices: The Case for Backstop Price Caps in Commercial Health Care Markets,” JAMA 325, no. 9 (March 2, 2021):817, doi:10.1001/jama.2020.26821 ↩︎
  68. Robert A. Berenson, Divvy K. Upadhyay, Suzanne F. Delbanco, and Roslyn Murray, Payment Methods and Benefit Designs: How They Work and How They Work Together to Improve Health Care (Washington, DC : Urban Institute, April 2016), https://www.urban.org/sites/default/files/2016/05/03/05_global_budgets_for_hospitals.pdf ↩︎
  69. Ankit Patel et al., “Maryland’s Global Hospital Budgets — Preliminary Results from an All-Payer Model,”  The New England Journal of Medicine 373, no. 20 (November 12, 2015):1899-1901, doi:10.1056/NEJMp1508037 ↩︎
  70. Rachel Machta et al, Evaluation of the Maryland Total Cost of Care Model: Implementation Report (Washington, DC: Mathematica, July 2021), https://www.mathematica.org/publications/evaluation-of-the-maryland-total-cost-of-care-model-implementation-report ↩︎
  71. J. Michael McWilliams et al., “Early Performance of Accountable Care Organizations in Medicare,” The New England Journal of Medicine 374 (June 16, 2016): 2357-2366, DOI: 10.1056/NEJMsa1600142 ↩︎
  72. J. Michael McWilliams et al, “Medicare Spending after 3 Years of the Medicare Shared Savings Program,” New England Journal of Medicine 379, no.12 (September 20, 2018): 1139-1149, doi:10.1056/NEJMsa1803388 ↩︎
  73. J. Michael McWilliams et al., “Performance Differences in Year 1 of Pioneer Accountable Care Organizations,” New England Journal of Medicine 372, no.20 (May 14, 2015): 1927-1936, doi:10.1056/NEJMsa1414929 ↩︎
  74. J. Michael McWilliams et al., “Changes in Patients’ Experiences in Medicare Accountable Care Organizations,” New England Journal of Medicine 371, no.18 (October 30, 2014): 1715-1724, doi:10.1056/NEJMsa1406552 ↩︎
  75. J. Michael McWilliams, Bruce E. Landon, Vinay K. Rathi, and Michael E. Chernew, “Getting More Savings from ACOs — Can the Pace Be Pushed?”  New England Journal of Medicine 380, no. 23 (June 6, 2019): 2190-2192, DOI: 10.1056/NEJMp1900537 ↩︎
  76. Zirui Song et al., “Changes in Health Care Spending and Quality 4 Years into Global Payment,” New England Journal of Medicine 371, no. 18 (October 30, 2014): 1704-1714, doi:10.1056/NEJMsa1404026 ↩︎
  77. Zirui Song Z, Yunan Ji, Dana G. Safran, and Michael E. Chernew, “Health Care Spending, Utilization, and Quality 8 Years into Global Payment,” New England Journal of Medicine 381, no. 3 (July 18, 2019): 252-263, doi:10.1056/NEJMsa1813621 ↩︎
  78. Zirui Song et al., “Changes in Health Care Spending and Quality 4 Years into Global Payment,” New England Journal of Medicine 371, no. 18 (October 30, 2014): 1704-1714, doi:10.1056/NEJMsa1404026 ↩︎
  79. Zirui Song Z, Yunan Ji, Dana G. Safran, and Michael E. Chernew, “Health Care Spending, Utilization, and Quality 8 Years into Global Payment,” New England Journal of Medicine 381, no. 3 (July 18, 2019): 252-263, doi:10.1056/NEJMsa1813621 ↩︎
  80. J. Michael McWilliams et al, “Medicare Spending after 3 Years of the Medicare Shared Savings Program,” New England Journal of Medicine 379, no.12 (September 20, 2018): 1139-1149, doi:10.1056/NEJMsa1803388 ↩︎
  81. Hannah T. Neprash, Michael E. Chernew, and J. Michael McWilliams, “Little Evidence Exists To Support The Expectation That Providers Would Consolidate To Enter New Payment Models,” Health Affairs 36, no. 2 (February 2017), https://doi.org/10.1377/hlthaff.2016.0840 ↩︎
  82. Genevieve P. Kanter, Daniel Polsky, and Rachel M. Werner, “Changes In Physician Consolidation With The Spread Of Accountable Care Organizations,” Health Affairs 38, no. 11 (November 2019):1936-1943,  https://doi.org/10.1377/hlthaff.2018.05415 ↩︎
  83. Chris L. Peterson and Dale N. Schumacher, “How Maryland’s Total Cost Of Care Model Has Helped Hospitals Manage The COVID-19 Stress Test,” Health Affairs Blog (October 7, 2020), DOI: 10.1377/hblog20201005.677034 ↩︎
  84. RTI International, Evaluation of the Maryland All-Payer Model Third Annual Report (Waltham, MA : RTI International, March 2018), https://downloads.cms.gov/files/cmmi/md-all-payer-thirdannrpt.pdf ↩︎
  85. Chris L. Peterson and Dale N. Schumacher, “How Maryland’s Total Cost Of Care Model Has Helped Hospitals Manage The COVID-19 Stress Test,” Health Affairs Blog (October 7, 2020), DOI: 10.1377/hblog20201005.677034 ↩︎
  86.  California Health Care Foundation, Commissioning Change: How Four States Use Advisory Boards to Contain Health Spending (Sacramento, CA : California Health Care Foundation, January 9, 2020), https://www.chcf.org/publication/commissioning-change-four-states-advisory-boards-contain-health-spending/ ↩︎
  87. Elsa Pearson and Austin Frakt, “Health Care Cost Growth Benchmarks in 5 States,” JAMA 324, no. 6 (August 11, 2020): 537-538, doi:10.1001/jama.2020.12437 ↩︎
  88. Joel Ario, Kevin McAvey, and Amy Zhan, State Benchmarking Models: Promising Practices to Understand and Address Health Care Cost Growth (New York, NY: Manatt Health, June 2021), https://www.manatt.com/insights/white-papers/2021/state-benchmarking-models-promising-practices-to-u ↩︎
  89. Joel Ario, Kevin McAvey, and Amy Zhan, State Benchmarking Models: Promising Practices to Understand and Address Health Care Cost Growth (New York, NY: Manatt Health, June 2021), https://www.manatt.com/insights/white-papers/2021/state-benchmarking-models-promising-practices-to-u ↩︎
  90. Johanna Butler, Insurance Rate Review as a Hospital Cost Containment Tool: Rhode Island’s Experience (Portland, ME: The National Academy for State Health Policy, February 1, 2021), https://www.nashp.org/insurance-rate-review-as-a-hospital-cost-containment-tool-rhode-islands-experience/ ↩︎
  91. Steve Cicala, Ethan M.J. Lieber, and Victoria Marone, “Regulating Markups in US Health Insurance,” American Economic Journal: Applied Economics 11, no. 4 (October 2019): 71-104, DOI: 10.1257/app.20180011 ↩︎
  92. Aaron Baum et al., “Health Care Spending Slowed Following State Regulation of Commercial Insurers through Rhode Island’s Affordability Standards,” Health Affairs 38, no. 2 (February 2019): 237-245, doi: 10.1377/hlthaff.2018.05164 ↩︎
  93. Robert Steinbrook, “The Repeal of Medicare’s Sustainable Growth Rate for Physician Payment,” JAMA 313, no.20 (May 26, 2015):2025-2026, doi:10.1001/jama.2015.4550 ↩︎
  94. Gobeille v. Liberty Mutual Insurance Company, 577 U.S. ___ (2016) ↩︎
  95. Michael E. Chernew, Maximilian J. Pany, and Leemore S. Dafny, “Two Approaches To Capping Health Care Prices,” Health Affairs Forefront (March 31, 2022), https://www.healthaffairs.org/do/10.1377/forefront.20220329.385487/full/ ↩︎
  96. New York State Conference of Blue Cross & Blue Shield Plans v. Travelers Ins. Co.,514 US 645 (1995) ↩︎
  97. Katherine Baicker and Amitabh Chandra, “The Labor Market Effects of Rising Health Insurance Premiums,” Journal of Labor Economics 24, no. 3 (July 2006): 609-634, https://www.ncbi.nlm.nih.gov/pmc/articles/PMC6593124/     ↩︎
Poll Finding

KFF COVID-19 Vaccine Monitor: Pregnancy Misinformation – May 2022

Published: May 27, 2022

Findings

Key Findings

  • Misinformation surrounding the COVID-19 vaccines has been widespread and previous KFF COVID-19 Vaccine Monitor research has found that belief and uncertainty about COVID-19 misinformation is common. Looking specifically at pregnancy-related misinformation about the vaccines, the latest KFF COVID-19 Vaccine Monitor finds that it still persists. About one in five adults (18%) and about three in ten women who are pregnant or planning to get pregnant (29%) believe at least one of three false statements about pregnancy and the vaccines. This includes about one in seven adults (14%) and nearly one in four women who are pregnant or planning to become pregnant (24%) who believe pregnant women should not get vaccinated for COVID-19.
  • Beyond those who believe misinformation, an even larger share says they have heard these false statements and are unsure whether they are true or not. Overall, about six in ten adults and seven in ten women who are pregnant or planning to become pregnant either believe or are unsure about at least one of three false statements about pregnancy and the COVID-19 vaccines.
  • While most of the public say they are at least somewhat confident in the safety of the COVID-19 vaccines for adults in general, they are less likely to express confidence that the vaccines are safe for those who are pregnant or trying to become pregnant. Even among Democrats and vaccinated adults – groups that express high levels of confidence in the safety of the vaccines for adults – less than half say they are “very confident” the vaccine is safe for those who are pregnant.
  • With CDC estimates showing about three in ten pregnant women remain unvaccinated, the latest KFF COVID-19 Vaccine Monitor finds that a majority of women who are pregnant or planning to become pregnant say they are “not too confident” or “not at all confident” that the vaccine is safe for pregnant women and those trying to get pregnant.

Misinformation On COVID-19 Vaccines And Pregnancy

There have been reports of widespread misinformation about the COVID-19 vaccine and its effects on pregnancy, breastfeeding, and fertility. With pregnant women excluded from initial COVID-19 vaccine trials and conflicting early messages about whether they should get the vaccine, vaccination uptake among those who were pregnant lagged that of adults overall. Though the CDC recommends COVID-19 vaccines for pregnant people, the latest KFF COVID-19 Vaccine Monitor finds that one in seven adults (14%) have heard that pregnant women should not get the COVID-19 vaccine and believe it to be true, rising to nearly one in four (24%) among women who are pregnant or planning to become pregnant.

The CDC also recommends COVID-19 vaccines for those who are breastfeeding, though about one in ten adults (10%) and about one in six women who are pregnant or plan to become pregnant (17%) say they have heard and believe that it is unsafe for women who are breastfeeding to get a COVID-19 vaccine. Another 7% of adults overall, rising to 16% of women who are pregnant or plan to become pregnant, say they have heard and believe that the COVID-19 vaccines have been shown to cause infertility.

Overall, belief in misinformation about the vaccines and pregnancy is relatively common, with about one in five adults (18%), and a similar share of women of reproductive age (ages 18 to 49) (20%), believing at least one item of misinformation asked about in the survey. Notably, about three in ten (29%) women who are pregnant or planning to become pregnant say they have heard and believe at least one of these three false statements.

Nearly Three In Ten Women Who Are Pregnant Or Are Planning To Become Pregnant Believe At Least One Item Of Misinformation About The COVID-19 Vaccine And Pregnancy

Beyond those who believe misinformation, an even larger share says they have heard these false statements and are unsure whether they are true or not, which may contribute to additional confusion.  About a third of the public overall say they have heard each of the false statements asked about in the survey and are unsure whether it is true. In total, about six in ten adults overall (62%) either believe or are unsure of at least one of these false statements about the vaccines and pregnancy.

Around Six In Ten Believe Or Are Unsure About At Least One Piece Of Misinformation Surrounding Pregnancy And COVID-19 Vaccine

Among those for whom questions about the safety of the vaccines and pregnancy are particularly relevant – women who are pregnant or planning to become pregnant – nearly four in ten (37%) are unsure if pregnant women should not get the vaccines and 44% are unsure if the COVID-19 vaccines cause infertility. Altogether, among women who are pregnant or planning to become pregnant, 60% believe that pregnant women should not get the vaccine or are unsure if this is true, 58% believe or are unsure whether the vaccines have been shown to cause infertility, and 52% believe or are unsure whether it is unsafe for breastfeeding women to get vaccinated.

Seven In Ten Women Who Are Pregnant Or Planning To Believe Or Are Unsure About At Least One Piece Of Misinformation Surrounding Pregnancy And COVID-19 Vaccines

About seven in ten women under age 50 (69%) and women who are pregnant or planning to become pregnant (72%) either believe or are unsure of at least one of these items of misinformation about the vaccines and pregnancy. Among women of reproductive age (ages 18-49), belief or uncertainty about this type of misinformation is more prevalent among those without a college degree (75% vs. 59% of college graduates) and those who are unvaccinated (83%). Notably, however, even among vaccinated women under age 50, six in ten (63%) say they have heard and believe or are unsure of at least one item of misinformation asked about in the survey.

Among Women Under 50, Those Who Are Unvaccinated And Those Without A College Degree Are More Likely To Believe Or Be Unsure Of Misinformation About The COVID-19 Vaccine And Pregnancy

Perceptions Of Safety Of COVID-19 Vaccines For Adults And Pregnant People

The widespread reach of misinformation surrounding the COVID-19 vaccines and pregnancy and fertility may be reinforcing concerns that many adults have heard about the safety of COVID-19 vaccines for women who are pregnant or hope to become pregnant in the future. While about seven in ten adults say they are at least somewhat confident that the COVID-19 vaccines are safe for adults generally (72%), fewer express confidence in their safety for people who are pregnant or trying to become pregnant (53%). About a quarter of the public (23%) say they are “very confident” that the COVID-19 vaccines are safe for people who are pregnant or trying to become pregnant while a further three in ten (30%) say they are “somewhat confident”. However, close to half say they are “not too confident” (22%) or “not confident at all” (23%).

Seven In Ten Are Confident In The Safety Of COVID-19 Vaccines For Adults, With Fewer Confident In The Safety For Pregnant People

The lower levels of confidence in the safety of the vaccines for those who are pregnant or are trying to become pregnant are present even among groups that express relatively high levels of confidence in vaccines for adults more generally. For example, 70% of Democrats say they are “very confident” that the COVID-19 vaccines are safe for adults, however a much smaller share (40%) say the same about the safety of vaccines for pregnant people and those trying to become pregnant. Similarly, a majority of vaccinated adults (57%) feel “very confident” about the safety of COVID-19 vaccines for adults, while 30% say the same of vaccines for pregnant people.

Across Partisans, Less Than Half Are Very Confident The COVID-19 Vaccines Are Safe For People Who Are Pregnant Or Trying

Among women between the ages of 18 and 49, seven in ten are confident the vaccines are safe for adults more generally, while just under half (48%) express confidence that they are safe for those who are pregnant or trying to conceive. Unsurprisingly, very few (9%) unvaccinated women under 50 say they are confident the vaccine is safe for people who are pregnant or trying to become pregnant, whereas about two-thirds (64%) of their vaccinated counterparts say they are confident it is safe for that group. Among women under the age of 50, college graduates are more likely than those without a college degree to say they are confident in the safety of the COVID-19 vaccines for pregnant people or those who plan to become pregnant (66% vs. 36%).

Forty-two percent of women who are pregnant or planning to become pregnant say they are at least somewhat confident that the vaccine is safe for pregnant people and those trying to get pregnant while a majority say they are “not too confident” (31%) or “not at all confident” (27%). This lack of confidence in the safety of the vaccine for those who are pregnant may have contributed to some women avoiding or delaying getting the vaccine, with CDC estimates showing about three in ten pregnant women remain unvaccinated.

Among Women Under Age 50, About Half Express Confidence That The Vaccines Are Safe For Pregnant People

Methodology

This KFF COVID-19 Vaccine Monitor Poll was designed and analyzed by public opinion researchers at the Kaiser Family Foundation (KFF). The survey was conducted May 10-19, 2022, online and by telephone among a nationally representative sample of 1,537 U.S. adults including 615 women aged 18 to 49, conducted in English (1,442) and in Spanish (95). The sample includes 1,285 adults reached through the SSRS Opinion Panel either online or over the phone (n=60 in Spanish) with an oversample of women aged 18 to 49 (n=272). The SSRS Opinion Panel is a nationally representative probability-based panel where panel members are recruited randomly in one of two ways: (a) Through invitations mailed to respondents randomly sampled from an Address-Based Sample (ABS) provided by Marketing Systems Groups (MSG) through the U.S. Postal Service’s Computerized Delivery Sequence (CDS); (b) from a dual-frame random digit dial (RDD) sample provided by MSG. For the online panel component, invitations were sent to panel members by email followed by up to four reminder emails. 1,246 panel members completed the survey online and panel members who do not use the internet were reached by phone (39).

Another 252 (n=35 in Spanish) interviews were conducted from a random digit dial telephone sample of prepaid cell phone numbers obtained through MSG. Phone numbers used for the prepaid cell phone component were randomly generated from a cell phone sampling frame with disproportionate stratification aimed at reaching Hispanic and non-Hispanic Black respondents. Stratification was based on incidence of the race/ethnicity groups within each frame.

The combined cell phone and panel samples were weighted to match the sample’s demographics to the national U.S. adult population using data from the Census Bureau’s 2021 Current Population Survey (CPS). Weighting parameters included sex, age, education, race/ethnicity, region, and education. The sample was also weighted to match patterns of civic engagement from the September 2017 Volunteering and Civic Life Supplement data from the CPS. The sample was also weighted to match frequency of internet use from the National Public Opinion Reference Survey (NPORS) for Pew Research Center.  The weights take into account differences in the probability of selection for each sample type (prepaid cell phone and panel). This includes adjustment for the sample design and geographic stratification of the cell phone sample, within household probability of selection, and the design of the panel-recruitment procedure.

The margin of sampling error including the design effect for the full sample is plus or minus 3 percentage points. Numbers of respondents and margins of sampling error for key subgroups are shown in the table below. For results based on other subgroups, the margin of sampling error may be higher. Sample sizes and margins of sampling error for other subgroups are available by request. Sampling error is only one of many potential sources of error and there may be other unmeasured error in this or any other public opinion poll. Kaiser Family Foundation public opinion and survey research is a charter member of the Transparency Initiative of the American Association for Public Opinion Research.

This work was supported in part by grants from the Chan Zuckerberg Initiative DAF (an advised fund of Silicon Valley Community Foundation), the Ford Foundation, and the Molina Family Foundation. We value our funders. KFF maintains full editorial control over all of its policy analysis, polling, and journalism activities.

GroupN (unweighted)M.O.S.E.
Total1,537± 3 percentage points
Women
Women ages 18-49615± 5 percentage points
Women ages 50 and older310± 7 percentage points
Race/Ethnicity
White, non-Hispanic843± 4 percentage points
Black, non-Hispanic248± 8 percentage points
Hispanic306± 7 percentage points
Party identification
Democrat524± 5 percentage points
Republican340± 6 percentage points
Independent391± 6 percentage points


News Release

Misinformation About COVID-19 Vaccines and Pregnancy is Widespread, Including Among Women Who are Pregnant or Planning to Get Pregnant

Among This Group, 1 in 4 Wrongly Believe Pregnant Women Shouldn’t Get Vaccinated, and Many More Aren’t Sure About This and Other Myths

Published: May 27, 2022

Misinformation and confusion about the COVID-19 vaccines and pregnancy remains widespread, with most people – including women who are pregnant or trying to get pregnant – either believing or being uncertain about at least one of three false claims they’ve heard, a new KFF COVID-19 Vaccine Monitor shows.

Among women who are pregnant or trying to get pregnant – the group for whom accurate information about the vaccines’ safety before, during and after pregnancy is most important – 72% either believe or are unsure about at least one of the myths. Specifically:

  • Nearly a quarter (24%) incorrectly believe pregnant women should not get a COVID-19 vaccine; another 37% have heard the misinformation and are not sure if it is true.
  • 17% wrongly believe it is unsafe for women who are breastfeeding to get a vaccine; another 36% have heard the misinformation and are not sure if it is true.
  • 16% wrongly believe that the COVID-19 vaccines have been shown to cause infertility; another 44% have heard the misinformation and are not sure if it is true.

“More than two years into the pandemic, there’s a surprising amount of confusion about the vaccine’s safety for pregnant women,” said Mollyann Brodie, a KFF Executive Vice President and Executive Director of the Public Opinion and Survey Research Program. “The fact that so many younger women incorrectly believe the vaccines can cause infertility or that they’re not safe for pregnant women highlights the real challenges facing public health officials.”

The widespread reach of this misinformation may contribute to the public’s lower level of confidence in the safety and effectiveness of the COVID-19 vaccines for pregnant woman. For instance, about half (53%) of adults say they are confident in the vaccines’ safety for pregnant women and those trying to conceive, well below the 72% share who express confidence in its use for adults generally.

About 4 in 10 (42%) women who are or planning to become pregnant express confidence in the vaccines’ safety for pregnant women and those trying to conceive.

As part of KFF’s THE CONVERSATION / LA CONVERSACIÓN campaign, OB-GYNs, a nurse and midwife affirm the safety of the COVID-19 vaccine during pregnancy and debunk myths about the impact on fertility in 40+ FAQ videos. Tailored media messages and community tools address information needs about the vaccines.

Designed and analyzed by public opinion researchers at KFF, the Vaccine Monitor survey was conducted from May 10-19, 2022, among a nationally representative random digit dial telephone sample of 1,537 adults, including 306 Hispanic adults and 248 non-Hispanic Black adults. Interviews were conducted in English and Spanish online (1,246) and by phone (39). The margin of sampling error is plus or minus 3 percentage points for the full sample. For results based on subgroups, the margin of sampling error may be higher.

The KFF COVID-19 Vaccine Monitor is an ongoing research project tracking the public’s attitudes and experiences with COVID-19 vaccinations. Using a combination of surveys and qualitative research, this project tracks the dynamic nature of public opinion as vaccine development and distribution unfold, including vaccine confidence and acceptance, information needs, trusted messengers and messages, as well as the public’s experiences with vaccination.

News Release

4 Key Q&As About the Impact of Climate Change on Health Equity

Published: May 24, 2022

While climate change effects ripple across the world and all populations, it is poised to disproportionately affect people of color, low-income communities, immigrants, and other high-need groups. Many of these groups have historically been exposed to climate hazards due to government policies and discriminatory practices that leave them more vulnerable to adverse climate events like record-breaking heat, wildfires, coastal flooding, and the spread of infectious diseases.

A new KFF brief looks at key questions about the effects of climate change on health equity:

  • Who is at Increased Risk for Negative Health Impacts Due to Climate and Climate Change?
  • Why is a Focus on Climate Change and Health of Growing Importance?
  • What are Current Federal Efforts to Address Climate Change and Health Equity?
  • How Do Climate and Climate Change Affect Health?

Climate Change and Health Equity: Key Questions and Answers

Published: May 24, 2022

Introduction

Over the past few years, a plethora of research has come out linking climate change to adverse health outcomes around the world. In 2021, a worldwide group of medical research professionals suggested that rising temperatures associated with climate change was the greatest threat to global public health. Illustrating the growing potential consequences of climate change, 2021 marked some of the most frequent extreme and costly climate events in the United States in the past decade. Climate and climate change related health risks disproportionately impact historically marginalized and under-resourced groups, who have the least resources to prepare for and recover from these disasters. As climate-related events become more common, the impacts on health and health care will increase in both frequency and intensity. This brief provides an overview of the impact of climate and climate change on health, identifies who is at increased risk for negative health impacts associated with climate and climate change, explains why there is a growing focus on climate change and health, and reviews recent federal efforts to address climate change and health equity.

How Do Climate and Climate Change Affect Health?

Climate and weather can negatively impact individual and population-level health through multiple pathways. The Centers for Disease Control and Prevention (CDC) notes that different climate drivers, including increasing temperatures, precipitation extremes, extreme weather, and rising sea levels, affect health through a range of exposure pathways, including extreme heat, poor air quality, reduced food and water quality, changes in infectious agents, and population displacement (Figure 1). These exposures may lead to negative health outcomes such as heat-related and cardiopulmonary illnesses; food-, water-, and vector-borne diseases, and worsened mental health and stress.

Figure 1: Climate Change and Health

Climate-related health threats are expected to increase going forward. For example:

  • Climate change has caused longer, more frequent, and more intense heat waves, which are likely to result in more heat-related illnesses and deaths. Studies have found that exposure to extreme heat makes people sick and may also cause death. In the United States, more than 65,000 people visit the emergency room for heat-related stress and approximately 702 people die from heat exposure each year.
  • Increasingly frequent extreme weather events due to climate change cause direct loss of life and negatively impact health through the damage they cause. Over the past twenty years, major storms such as hurricanes Katrina, Rita, Sandy, Harvey, and Maria, have resulted in massive loss of life and billions of dollars of damage. In addition to the immediate hazards created by the storms, the flooding and damage they cause to infrastructure can lead to the spread of waterborne diseases and contamination from industrial and agricultural waste runoff; compromise emergency response efforts; limit access to basic needs, including food, water, and housing; and disrupt access to health care and prescription medications. For example, in a survey of Katrina evacuees in Houston shelters, KFF found that, immediately after the hurricane, 25% of evacuees reported going without needed medical care and about a third (32%) went without their needed prescription medicines. Moreover, impacts extend beyond the immediate aftermath of storms. KFF survey data of New Orleans residents one year after Hurricane Katrina found that 32% said their life remained “very disrupted” or “somewhat disrupted” by the storm, with this share rising to 59% of African American residents in Orleans Parish. More than a third (36%) of those living in the Greater New Orleans area reported their access to health care deteriorated since the storm, 19% reported declines in their physical health, and 16% reported deterioration in their mental health. Ten years after the storm, KFF survey data of New Orleans residents who lived in the area during Katrina reported lingering mental health effects, including problems sleeping. In Puerto Rico, there was an excess mortality of 2,975 deaths as a result of Hurricane Maria. KFF interviews with Puerto Ricans two months after Hurricane Maria found that participants were continuing to face challenges meeting basic needs, and daily life remained challenging due to lack of electricity. In a KFF survey of Puerto Ricans one year after the storm, a quarter said their lives were still somewhat or very disrupted and about a quarter said they or a household member had a new or worsened health condition since the storm.
  • Worsening air quality also may negatively impact health in a variety of ways. Research suggests that climate change may contribute to increases in particulate matter and ground-level ozone—key components of smog and harmful air pollutants. The CDC notes that prolonged exposure to ozone can lead to worse lung function, an increase in cardiovascular- and respiratory-related hospital visits and admissions, and an increase in premature deaths. The Organization for Economic Cooperation and Development predicts that global annual health care costs associated with air pollution will increase from $21 billion in 2015 to $176 billion in 2060. Increases in wildfires due to changes in rain patterns and warmer summers may worsen air quality through the emission of particulate matter and other ozone-forming gases in smoke, which contribute to increased incidences of respiratory and cardiovascular illnesses. Moreover, longer and more intense pollen seasons stemming from longer warmer periods and increased carbon dioxide concentrations may negatively impact respiratory health, particularly for allergy and asthma sufferers. The CDC reports that medical costs associated with pollen exceed $3 billion each year and result in fewer productive work and school days.

Who is at Increased Risk for Negative Health Impacts Due to Climate and Climate Change?

While climate change poses health threats for everyone, people of color, low-income people, and other marginalized or high-need groups face disproportionate risks due to underlying inequities and structural racism and discrimination. The same factors that contribute to health inequities influence climate vulnerability— the degree to which people or communities are at risk of experiencing the negative impacts of climate change.

People of color face increased climate-related health risks compared to their White counterparts. As a result of historic and contemporary structural racism and discrimination, people of color are more likely to live in poverty; be exposed to environmental hazards; and have less access to health, economic, and social resources; making them more at risk for negative health impacts due to climate compared to their White counterparts. Last year, the United States Environmental Protection Agency (EPA) found that racial and ethnic minorities were most likely to live in areas with the highest projected increases in morbidity and mortality due to climate related changes in temperatures and air pollution. They were more likely to lose labor hours and opportunities due to increases in high-temperature days. They were also the most likely to live in areas with projected land loss due to sea level change, as well as live in coastal areas with the highest projected increases in traffic delays due to high-tide flooding. For example:

  • Historical policies such as redlining have led to residential segregation of Black people into urban neighborhoods that increase their exposure to extreme heat and poor air quality. Black people are 40% and 34% more likely than all other demographic groups to live in areas with the highest projected increases in extreme temperature-related deaths and the highest projected increases in childhood asthma diagnoses, respectively. Black people are also 41 to 60% more likely than non-Black people to live in areas with the highest projected increases in premature death due to exposure to harmful particulate matter. The disproportionate exposure to extreme heat and poor air quality increases their risk of premature mortality.
  • Similarly, Hispanic people are 21% more likely to live in the hottest parts of cities, yet 30% of them do not have access to air-conditioning and are susceptible to the adverse outcomes associated with heat exposure. Additionally, they make up nearly half of agricultural workers and 28% of construction workers in the United States, among whom heat related illnesses are very common. Overall, Hispanic people are more than three times as likely to die from heat-related illnesses than non-Hispanic White people. Residential exposure to pesticides may also increase health risks. For example, in California, higher exposure to pesticides is associated with increased rates of testicular germ cell cancer, particularly among Latino people. Further, in the events of extreme weather, Hispanic people with limited English proficiency may be at increased risk due to lack of linguistically accessible information. For example, during a 2013 flash flood event an only Spanish-speaking family in Oklahoma missed warnings of severe flash floods and died while taking refuge from a tornado in a drainage ditch.
  • Asian and Pacific Islander people are more likely to live in areas that are at a disproportionate risk of being excluded from adaptation measures that could mitigate the impacts of high-tide flooding-related traffic delays compared to non-Asian people and non-Pacific Islanders. U.S. colonial and military activity have also created legacies of environmental pollution in U.S. territories, including those in the Pacific Islands. In a recent study, researchers found that a majority of EPA violations on the islands occurred at or were associated with U.S. military sites. For example, Anderson Air Force Base in Guam which was placed on the National Priority List (NPL) due to the presence of hazardous materials is located above an aquifer that provides drinking water to at least 70% of the island’s residents. In American Samoa, soil and ground water analyzed from a local elementary school was found to be contaminated with fuel compounds, lead, and other heavy metals from when the U.S. Navy stored petroleum fuel on and used the site as a military installation during World War II. Exposure to fuel compounds, lead, and heavy metals can be harmful to health.
  • Historic land dispossession of American Indian and Alaska Native (AIAN) Tribal lands has relegated many AIAN people to land that is disproportionately exposed to climate change risks, including extreme heat, wildfires, and reduced precipitation. As the average global temperature increases and sea levels rise, Tribal lands are being disproportionately eaten away by coastal erosion. One Inuit Eskimo village in Alaska, Shishmaref, had to relocate its entire population due to the impacts of climate change-related coastal erosion. AIAN people also have less access to potable water and, due to droughts, have more limited ability to grow their traditional heirloom crops. In addition, many AIAN Tribal lands are considered food deserts and lack access to healthy store-bought food making them reliant on less nutritious, convenience food store options.

Immigrants in the U.S. also face increased climate-related risks due to structural inequities. Immigrants are more likely than U.S. born people to work in environmentally hazardous professions and live in congregate housing with limited access to heating or cooling infrastructures, making them more susceptible to climate-related health risks. Noncitizen immigrants make up more than four in ten of agricultural workers in the United States. Data shows that between the years 1991 to 2006, agricultural workers engaged in crop production died at a 20 times higher rate from heat-related illnesses compared to all U.S. workers. Noncitizen immigrants also are more likely than citizens to be poor, which may contribute to increased challenges responding to and recovering from extreme weather events. For example, in the aftermath of Hurricane Harvey, immigrants were more likely than U.S.-born residents to report losses in employment and income. While immigrants were less likely to experience home damage, among those that did, they were less likely to have applied for government disaster assistance. Nearly half (48%) of immigrants with home damage said they were worried seeking help would draw attention to their or their families’ immigration statuses.

Low-income communities are likely to be disproportionately affected by climate change. People with low socioeconomic status are more likely to live in fragile housing, be exposed to environmental hazards, and have more limited ability to prepare for or recover from extreme climate events. Low-income households are more likely to have high energy burdens, a recent study found that 25% of low-income households could not afford to pay an energy bill in the past year, and nearly 13% were unable to pay an energy bill in the past month. This inability to pay their bills increases their likelihood of having their utilities disconnected, which would increase their exposure to extreme weather and resultant adverse health outcomes. In the event of extreme flooding and other weather, residents of federally assisted housing are put at an increased risk of exposure to toxic waste and runoff due to proximity to hazardous waste sites. A 2020 analysis found that 70% of the country’s most hazardous waste sites are located within one mile of U.S. Department of Housing and Urban Development (HUD)-assisted housing developments. Low-income communities are also more likely to be adversely impacted by natural disasters and other climate-related emergencies. In interviews with low-income survivors of Hurricane Katrina, KFF found that many survivors also reported suffering from emotional and mental trauma, barriers to accessing care resulting in serious and persistent gaps in care, unstable living conditions, and severe financial concerns. Similarly, a KFF survey of Puerto Ricans one year after Hurricane Maria found that those with lower incomes were more likely than residents with higher incomes to report housing-related challenges, including major damage or destruction of their home and unsafe housing conditions.

Older adults are more sensitive to climate change due to a variety of age-related reasons, including decreased thermoregulation, and a higher burden of chronic disease and disabilities. Given their age-related health changes, lower concentrations of air pollution and smaller temperature changes may result in adverse reactions. Analysis of fee-for-service Medicare data found that short-term exposure to air pollution was associated with an increase in annual hospital admissions and inpatient and post-acute care costs. Older people are also more likely to live alone and be socially isolated, putting them at increased risks of missing extreme weather warnings and potentially unable to respond to weather disasters. Further, in the last forty years, the number of older adults living in coastal communities has increased by 89%, which in combination with rising sea levels may put them at additional risk of being negatively affected by coastal flooding.

Why is a Focus on Climate Change and Health of Growing Importance?

In recent years, there has been an increase in the frequency and intensity of adverse climate-related events, with the potential to worsen health outcomes and exacerbate health inequities. The Intergovernmental Panel on Climate Change (IPCC) recently released its sixth report on climate change, noting that the risk to human health is increased with every fractional increase in global temperature. In June 2021, the western United States experienced record-breaking heat waves, increasing the risk of heat-related injuries, droughts, and wildfires. In addition to extreme heat, the past five years recorded some historical storm activity, with 2020 being the second time in history that the National Oceanic and Atmospheric Administration (NOAA) exceeded the 21-name Atlantic list of storms. Researchers predict that the Earth will continue to experience an increase in its mean temperature, weather variability, and the frequency and intensity of extreme weather events. A 2019 Government Accountability Office report found that the effects of climate change posed a threat to 60% of the hazardous waste sites known as Superfund sites in the country. In 2020, scientists reported that extreme coastal flooding would threaten more than 900 Superfund sites in the next 20 years. This could have detrimental impacts on nearby residents (primarily low-income and communities of color) by exposing them to toxic chemicals through flooding and runoff.

Changes in land use, increases in ambient temperature, and changes in weather patterns can impact the spread of infectious diseases. As temperature rise, scientists project changes in mosquito abundance and mosquito-borne disease spread, which could increase people’s exposure to dengue, zika, yellow fever, and other mosquito-borne diseases. In the past twenty years, the mosquitos that spread dengue fever in the United States increased by 8.2% in response to rapid temperature increases. Climate change-related temperature increases have also contributed to the expanded range of ticks, increasing the risk of contracting Lyme disease.

What are Current Federal Efforts to Address Climate Change and Health Equity?

While addressing climate change would require a massive and sustained effort, the Biden administration has identified addressing climate change as a priority and taken a range of actions focused on mitigating the impacts of climate change, including its impacts on health equity.

On January 27, 2021, President Biden announced an Executive order on tackling the Climate Crisis at Home and Abroad, emphasizing the need for a government-wide approach to addressing the climate crisis, including centering climate change in all levels of policymaking. In response to Biden’s executive order, the U.S. Department of Health and Human Services (HHS) enacted its climate action plan, including the establishment of the Office of Climate Change and Health Equity (OCCHE) to address climate change and health equity. The climate action plan includes building more resilient and adaptive health programs, increasing the responsiveness to climate crises, and developing climate-resilient grant policies at HHS. In addition, OCCHE is tasked with creating an Interagency Working Group to Decrease Risk of Climate Change to Children, the Elderly, People with Disabilities, and the Vulnerable and a biennial Health Care System Readiness Advisory Council.

The executive order committed to delivering at least 40 percent of overall benefits from federal investments in climate and clean energy to disadvantaged communities. This includes addressing the impact Superfund sites have on communities, the launch of the Communities Local Energy Action Program (Communities LEAP), which helps communities that the fossil fuel industry has historically impacted to develop locally-driven energy plans to reduce local air pollution, increase energy resilience, lower both utility costs and energy burdens. The U.S. Department of Energy launched a $9 million effort to help 15 underserved and frontline communities better assess their energy storage as a means of achieving energy resilience and reducing energy insecurity.

In October 2021 Occupational Safety and Health Administration (OSHA) proposed a rule to protect workers from extreme heat exposure in indoor and outdoor settings and set up a National Emphasis Program (NEP) on heat inspections. The comment period for the proposed rule concluded on January 26, 2022. OSHA launched the NEP for Outdoor and Indoor Heat-Related Hazards on April 8, 2022. The NEP is an enforcement program that seeks to identify and eliminate or reduce worker exposures to occupational heat-related illnesses and injuries in workplaces where heat hazards are prevalent. It would include inspections prioritizing heat-related interventions and inspections of work activities on days when the heat index surpasses 80 degrees Fahrenheit. It is an expansion of the agency’s current heat-related illness prevention initiatives

The federal government has also taken several actions to protect disproportionately affected populations from exposure to toxic chemicals. The EPA revoked the usage of certain dangerous chemicals, including chlorpyrifos- a pesticide that negatively impacts farmworkers and children. There are also cross-agency efforts underway to reduce pollution burdens and exposures, including lead exposure and asthma disparities in children of color.

Last year, FEMA announced grants and initiatives dedicated to advancing climate change adaptation and promoting risk reduction and community resilience across the country. These include developing a FEMA National Risk Index to identify locations most at risk for 18 natural hazards, adopting climate resilience building standards, and dedicating funding to support communities at risk of being affected by climate-related extreme weather events and other natural disasters. For example: the Hazard Mitigation Assistance grant programs, Flood Mitigation Assistance grant program, Individuals and Households Program, and other programs. Hazard mitigation strategies play key roles in preventing or minimizing the impacts of natural disasters on communities by investing in and supporting climate resilient infrastructure. In collaboration with public health experts, these programs can also facilitate addressing health concerns caused and exacerbated by disasters, including reducing lapses in health care access, addressing physical and mental health challenges, spread of communicable disease, and others.