Editorial Note: Originally published in April 2017, this resource is updated as needed to reflect the latest developments.
Key Points
- On May 8, 2025, the Trump administration invoked the “Kemp-Kasten amendment” in order to withhold FY 2025 funding for the United Nations Population Fund (UNFPA, the lead U.N. agency focused on global population and reproductive health); the same determination was made during President Trump’s first term. FY 2025 funding for UNFPA was expected to total $32.5 million in core support and potentially millions more for other project activities.
- While under current law any U.S. funding withheld from UNFPA is to be made available for other family planning, maternal health, and reproductive health activities, Congress rescinded (permanently canceled) FY 2025 funding appropriated for UNFPA as part of a broader foreign aid rescission package requested by the President. Although Congress again appropriated $32.5 million in core support for UNFPA for FY 2026, it is expected that President Trump will again withhold the funds from the organization.
- The Kemp-Kasten amendment is a provision of U.S. law, first enacted by Congress in 1985 and included in appropriations language annually, that states that no U.S. funds may be made available to “any organization or program which, as determined by the president of the United States, supports or participates in the management of a program of coercive abortion or involuntary sterilization.”
- Kemp-Kasten has often been used, as determined by presidents along party lines, to withhold U.S. funding to UNFPA. While framed broadly, Kemp-Kasten was originally intended to restrict funding to UNFPA specifically, after concerns arose about China’s population control policies and UNFPA’s work in China; to date, it has only been applied to UNFPA. Evaluations by the U.S. government and others have found no evidence that UNFPA directly engages in coercive abortion or involuntary sterilization in China, and more generally, UNFPA does not promote abortion as a method of family planning or fund abortion services.
- Kemp-Kasten has been used to withhold funding from UNFPA in 20 of the past 41 fiscal years.
What is the Kemp-Kasten Amendment?
The Kemp-Kasten amendment, first enacted in 1985, is a provision of U.S. law that states that no U.S. funds may be made available to “any organization or program which, as determined by the [p]resident of the United States, supports or participates in the management of a program of coercive abortion or involuntary sterilization.”1 It was the congressional response to a Reagan administration decision in 1984 to temporarily withhold some funding from UNFPA and to begin conditioning its funding on assurances that the agency did not engage in or provide funding for abortion or coercive family planning. This policy change was made after concerns arose about whether UNFPA supported China’s coercive population policies.2 It was announced by the Reagan administration at the 2nd International Conference on Population in 1984, in conjunction with the “Mexico City Policy.”3 The Mexico City Policy originally required foreign NGOs to certify that they would not “perform or actively promote abortion as a method of family planning” with non-U.S. funds as a condition of receiving U.S. family planning assistance; the Trump administration recently expanded this restriction to encompass more funding, more organizations, and more policy areas (see the KFF explainer on the policy).
Box 1: The Original Language Regarding UNFPA in the U.S. Policy Statement at the 2nd International Conference on Population, 1984
“With regard to the United Nations Fund for Population Activities [UNFPA], the US will insist that no part of its contribution be used for abortion. The US will also call for concrete assurances that the UNFPA is not engaged in, or does not provide funding for, abortion or coercive family planning programs; if such assurances are not forthcoming, the US will redirect the amount of its contribution to other, non-UNFPA, family planning programs.”4
What U.S. funding does Kemp-Kasten apply to?
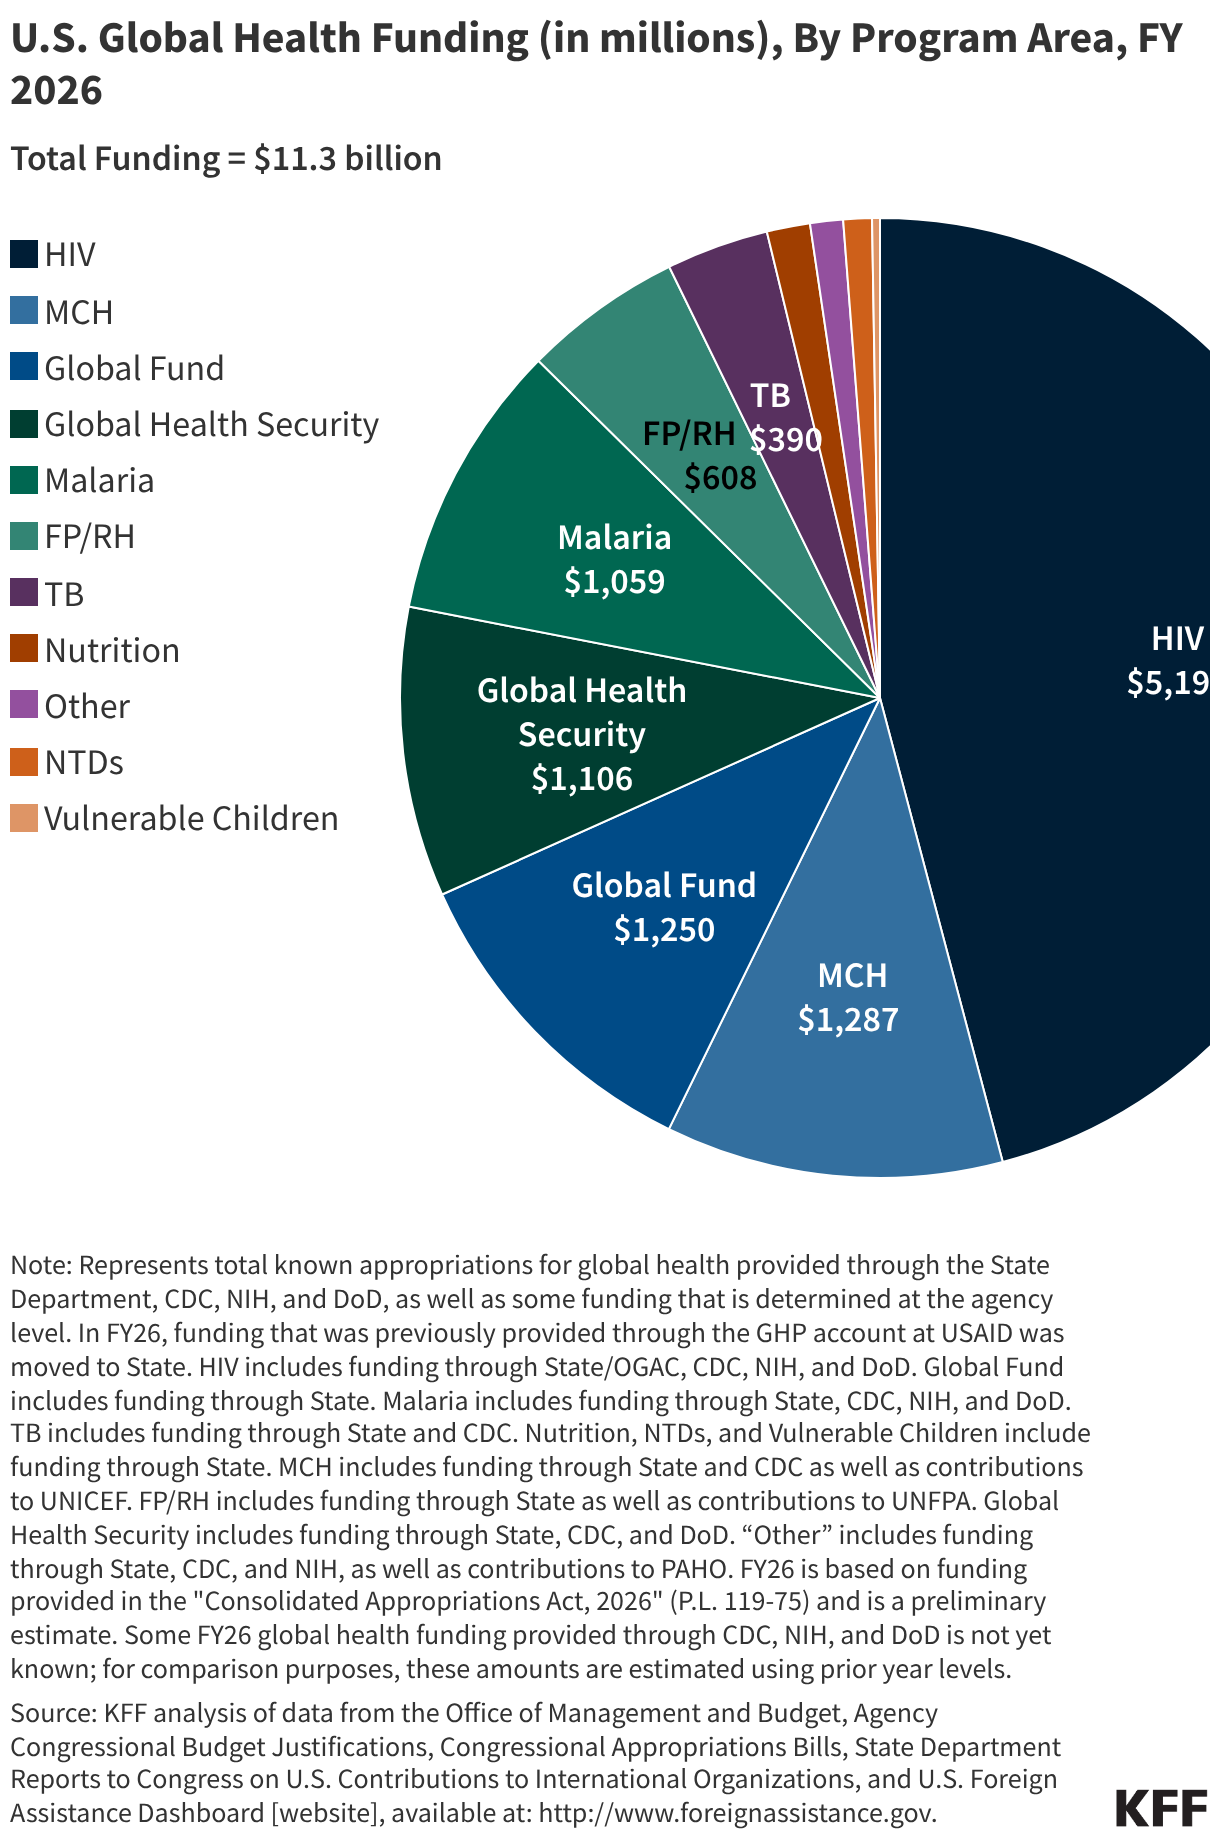
Kemp-Kasten applies to all funds appropriated under the State and Foreign Operations appropriations act as well as any unobligated balances from prior appropriations. This includes all funding provided to the State Department and the now-dissolved USAID, which, in turn, includes the vast majority of U.S. global health funding.5
When has Kemp-Kasten been in effect?
The Kemp-Kasten amendment has been in effect for 41 years. First enacted in 1985,6 its language has been included in the State and Foreign Operations appropriations act every fiscal year since then. (Although the provision is present in current law, language similar to Kemp-Kasten was also included in President Trump’s presidential memorandum reinstating the Mexico City Policy on January 24, 2025.7) While Congress has kept the amendment in place annually, it remains up to the president to determine whether or not to invoke Kemp-Kasten as a reason to withhold funding from an organization (see below).8
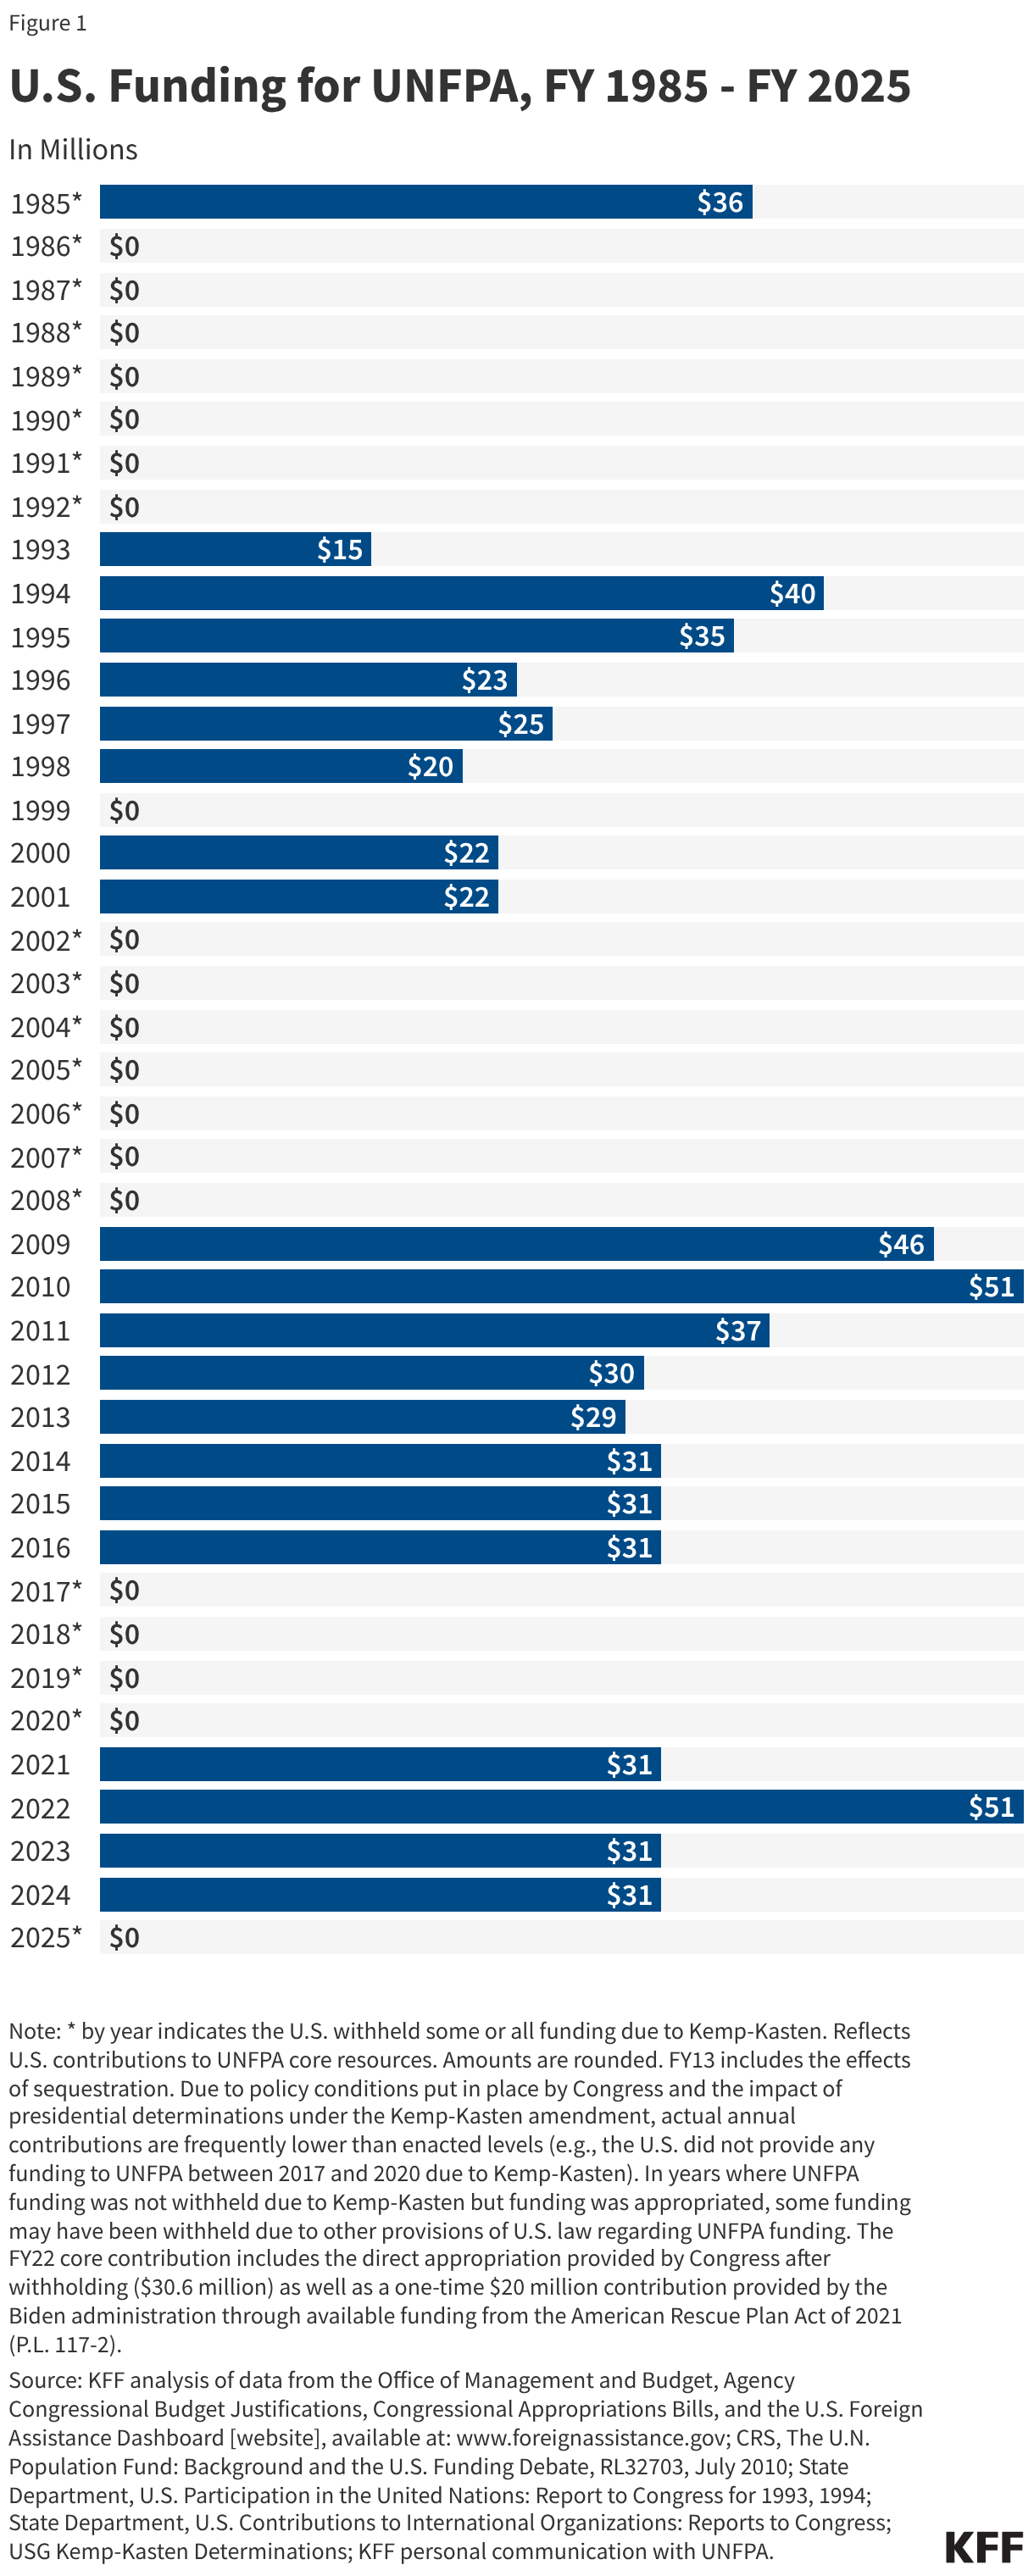
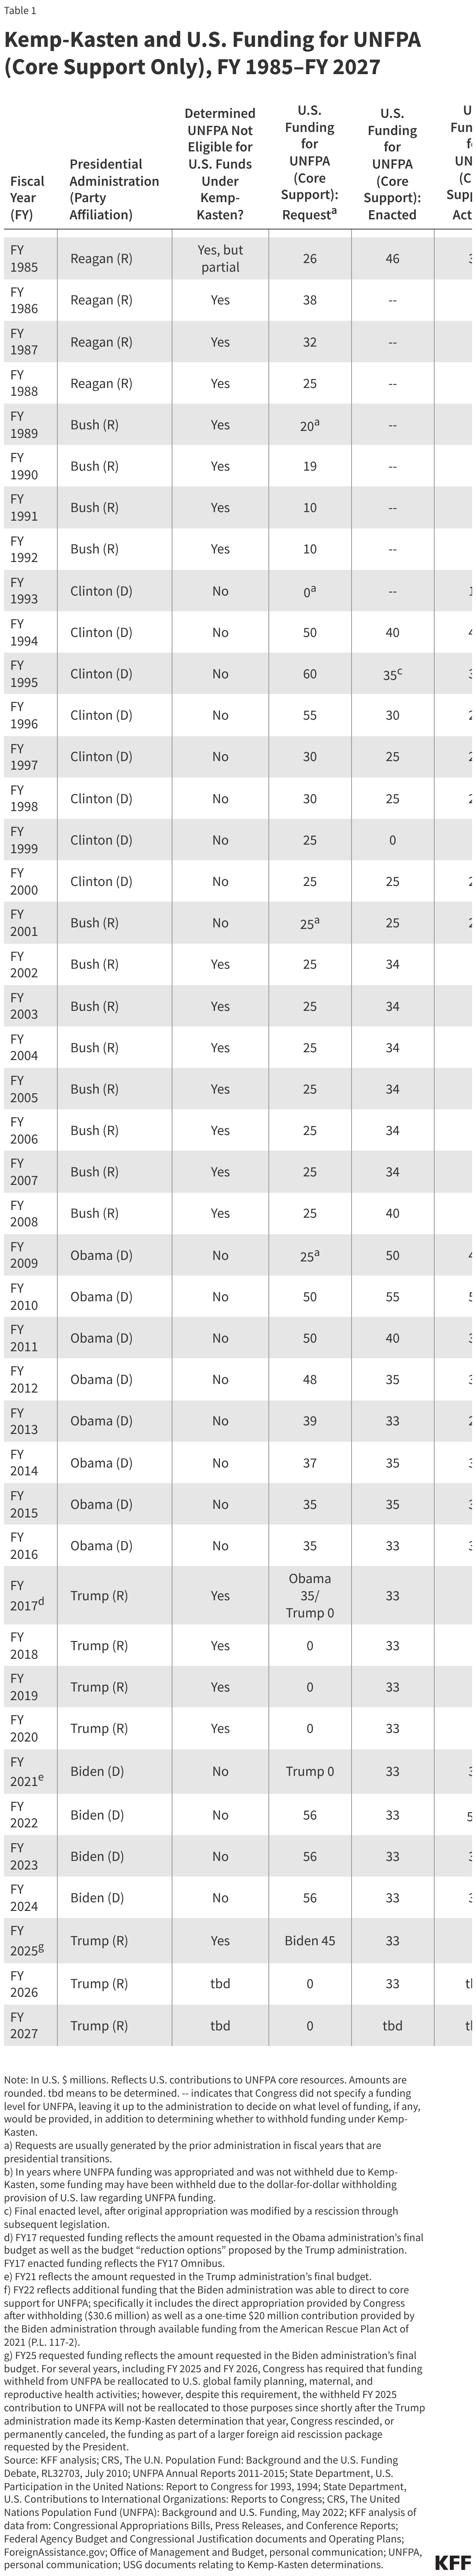
Though Kemp-Kasten technically could apply to funding provided to any organization or program (including U.S. NGOs, non-U.S. NGOs, multilateral organizations, and foreign governments), the U.S. government has issued determinations about only one organization, UNFPA, thus far. The U.S. played a key role in the launch of UNFPA in 1969 and was, until 1985, the largest government donor to the agency.9 However, the U.S. has withheld funding from UNFPA due to presidential determinations that it violated Kemp-Kasten as often as it has provided funding since 1985 (in 20 of the past 41 fiscal years, to date), and in some years, funding was also withheld from UNFPA based on other provisions of the law, such as the dollar-for-dollar withholding requirement10 (see below). These determinations have been made along party lines with only one exception – the first year of President George W. Bush’s administration (see Figure 1 and Table 1).
How much funding does the U.S. provide to UNFPA?
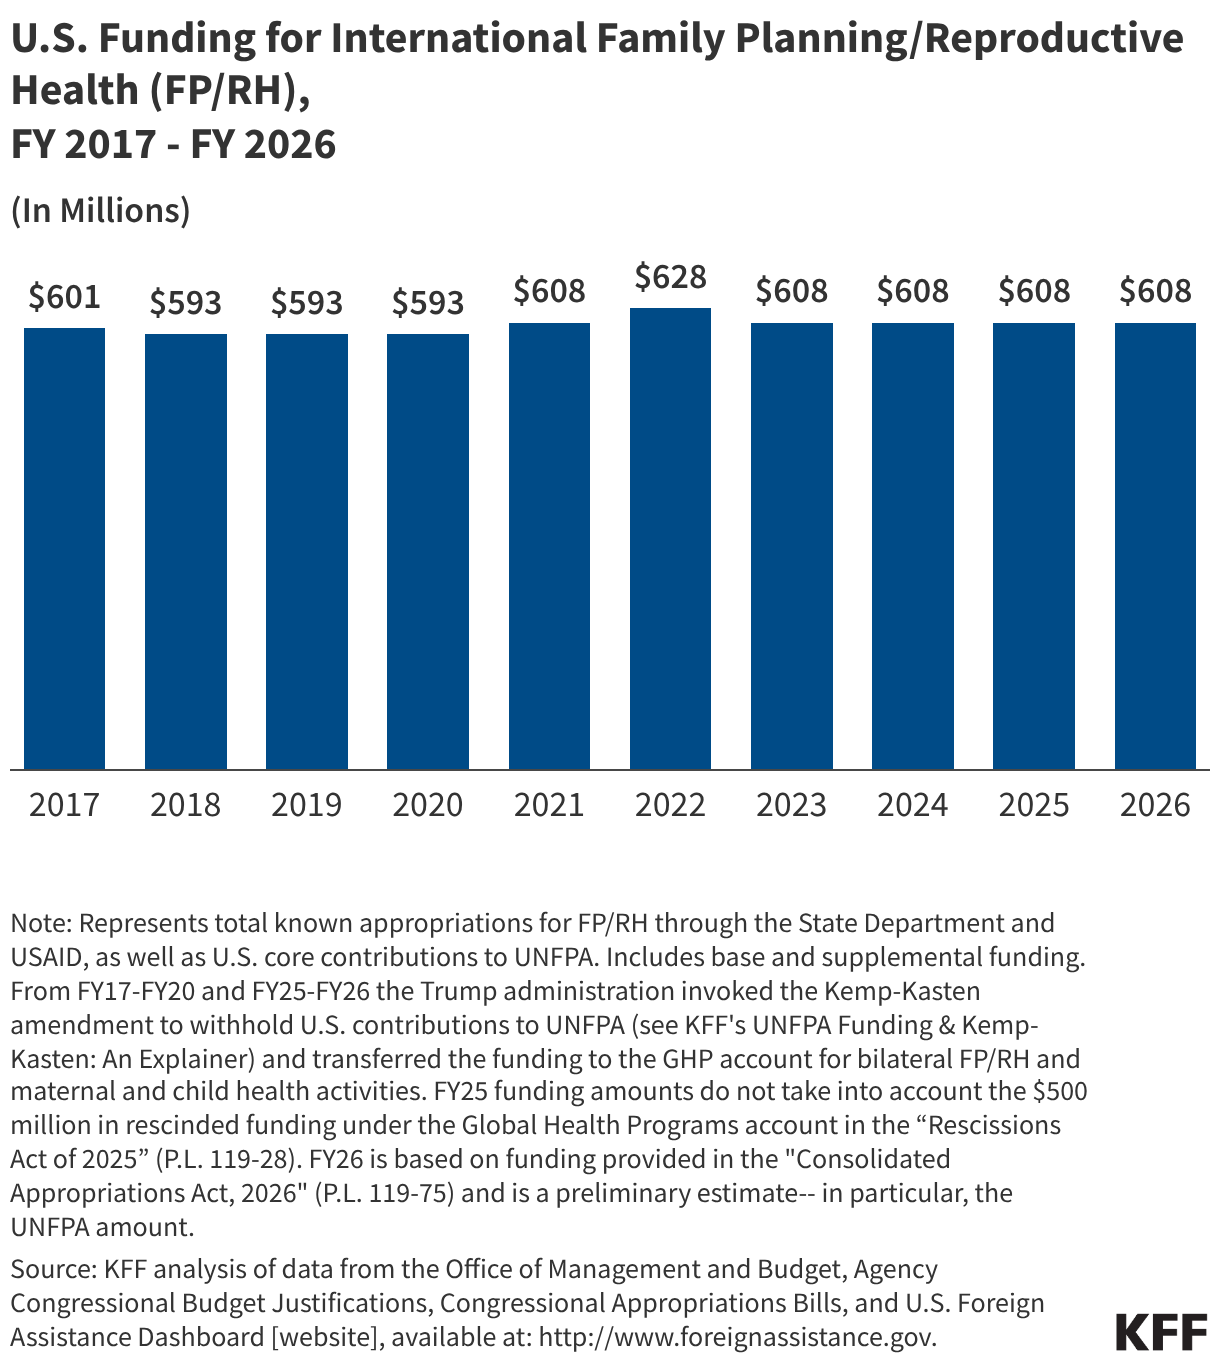
In 2024, the U.S. was the largest donor to UNFPA, having provided 17% of all contributions. Total funding from the U.S. for UNFPA was $231.8 million – $30.5 million in core support and $201.3 million for other projects – in FY 2024 (see Box 2).11 See Figure 1 and Table 1 for historical funding data.
Box 2: Core and Non-Core Support to UNFPA
According to UNFPA, contributions to core resources allow the agency to support any activity, while contributions to non-core resources – funds earmarked for a specific purpose – may only be used for the stated project or activity.12 Governments provide contributions toward UNFPA core and non-core resources on a voluntary basis, since UNFPA does not assess a required contribution from governments.
How is a determination about Kemp-Kasten made?
By law, it is up to the president to determine whether any organization or program should be ineligible for funding due to a violation of the Kemp-Kasten amendment (in practice, this authority has generally been delegated to the State Department). In most recent years, legislative language has also specified that this determination must be: 1) made no later than six months after the date of enactment of the law that includes the provision and 2) accompanied by the evidence and criteria used to make the determination.13
Most recently, on January 24, 2025, at the beginning of his second term, President Trump directed the Secretary of State to begin the process of making a Kemp-Kasten determination by taking “all necessary steps,” and in May 2025, the United States again invoked Kemp-Kasten to withhold funding from UNFPA. These determinations are usually made after the annual appropriations process is completed. For example, in 2017, the Trump administration’s determination was made on March 30, 2017, at the six month mark after the passage of the FY 2017 continuing resolution appropriations bill and was accompanied by a two-page justification memorandum.14
Has there ever been evidence that UNFPA supports coercive abortion or involuntary sterilizations?
To date, there has been no evidence that UNFPA supports coercive abortion or involuntary sterilizations. Several evaluations by the U.S. government (including one by an assessment team sent to China by the State Department in 2002) as well as other groups, such as the British All-Party Parliamentary Group on Population, Development, and Reproductive Health (in 2002) and the Interfaith Delegation (in 2003), have found no evidence of direct engagement by UNFPA in such activities in China or elsewhere.15 In addition, UNFPA does not promote abortion as a method of family planning or fund abortion services.16 In years when a determination has been made that UNFPA violated Kemp-Kasten, the U.S. government has stated that the determination was based on its conclusion that UNFPA support to or partnering with the Chinese government for other population and reproductive health activities was sufficient grounds for invoking the amendment to withhold funding. In the March 30, 2017, determination by the Trump administration, for example, the justification memorandum stated that: “While there is no evidence that UNFPA directly engages in coercive abortions or involuntary sterilizations in China, the agency continues to partner with the NHFPC [China’s National Health and Family Planning Commission] on family planning, and thus can be found to support, or participate in the management of China's coercive policies for purposes of the Kemp-Kasten amendment.”
What other legislative requirements apply to U.S. funding for UNFPA?
In addition to Kemp-Kasten, there are several other provisions of law that Congress has enacted in recent years to set conditions on U.S. funding for the agency.17 These provisions:
- require UNFPA to keep U.S. funding to the agency in a separate account, not to be commingled with other funds;
- prohibit UNFPA from funding abortion;
- prohibit UNFPA from using any U.S. funds for their programming in China;
- reduce the U.S. contribution to UNFPA by one dollar for every dollar that UNFPA spends on its programming in China (“dollar-for-dollar withholding”); and
- in some years, state that not more than half of funding designated for the U.S. contribution to UNFPA is to be released before a particular date, which varies by fiscal year (this provision is not currently in effect).
What happens to funding that is withheld from UNFPA?
For several years, including FY 2025 and FY 2026, Congress has required that funding withheld from UNFPA be reallocated to U.S. global family planning, maternal, and reproductive health activities. (However, despite this requirement, the withheld FY 2025 contribution to UNFPA will not be reallocated to those purposes since shortly after the Trump administration made its Kemp-Kasten determination that year, Congress rescinded, or permanently canceled, the funding as part of a larger foreign aid rescission package requested by the President.18) The enactment of this provision first affected reallocation of FY 2002 funds.19 It is now typically included in the State and Foreign Operations appropriations act each year.20


 Gary Claxton
  Matthew Rae
  Aubrey Winger