FAQs on Health Spending, the Federal Budget, and Budget Enforcement Tools

Published: Mar 20, 2023

Note: This brief was updated on March 20, 2023, to include details on fiscal year 2023 spending from the fiscal year 2024 budget released by the Biden Administration on March 9, 2023.

In January 2023, Treasury Secretary Yellen announced that the U.S. had reached the $31.381 trillion debt limit, prompting the Treasury Department to begin taking so-called “extraordinary measures” that are expected to help the government avoid defaulting on its debt until the summer of 2023. The debt limit, also known as the debt ceiling, is the maximum amount of money that the federal government is legally authorized to borrow to cover federal spending, including Social Security, Medicare, defense, and other federal government programs and obligations. The amount of the debt limit is established by law and increasing or suspending it requires legislative action. Congress has passed legislation 20 times since 2001 to increase or suspend the debt limit to avoid the federal government defaulting on its obligations.

In current discussions around the debt limit, some Republican lawmakers have pushed for reductions in future federal spending as part of a deal to raise the debt limit. The Biden Administration has said it will not negotiate spending reductions as part of debt limit talks but is open to separate discussions about approaches to debt and deficit reduction. House Speaker McCarthy has agreed that cuts to Social Security and Medicare are “off the table” in these discussions but has not ruled out seeking other spending cuts. This leaves open the question of whether Medicaid, the Affordable Care Act (ACA) premium tax credits, and possibly other health programs and services could be targeted for spending reductions in the near future.

These FAQs answer basic questions about health spending and the federal budget and budget enforcement tools, including the debt limit and sequestration. Health spending includes mandatory spending on health insurance programs like Medicare, Medicaid, the Children’s Health Insurance Program (CHIP), and the ACA Marketplaces; and discretionary spending on federal agencies such as the Centers for Disease Control and Prevention (CDC), the National Institutes of Health (NIH), the Food and Drug Administration (FDA), and the Health Resources and Services Administration (HRSA. Discretionary spending also includes domestic health programs and services, such as hospital and medical care for veterans, and the Indian Health Service; and spending for global health programs and services, such as the U.S. President’s Plan for AIDS Relief (PEPFAR). (See the Methods box for details on the data used for this analysis.)

How much support does the federal government provide for health programs and services?

The federal government provides support for health programs and services both through spending on programs and services and through tax expenditures. Federal spending on domestic and global health programs and services accounted for 29% of net federal outlays in fiscal year (FY) 2023 (taking into account offsetting receipts), or $1.9 trillion out of $6.4 trillion (Figure 1). Specifically, Medicare accounted for 13% of the total, Medicaid and CHIP accounted for 10%, other domestic health spending accounted for 4%, hospital and medical care for veterans was 2%, and global health was 0.1%. By comparison, Social Security accounted for 21% of federal outlays in FY 2023, while defense accounted for 13%.

Federal Spending on Domestic and Global Health Programs and Services Accounted for 29% of Net Federal Outlays in FY 2023

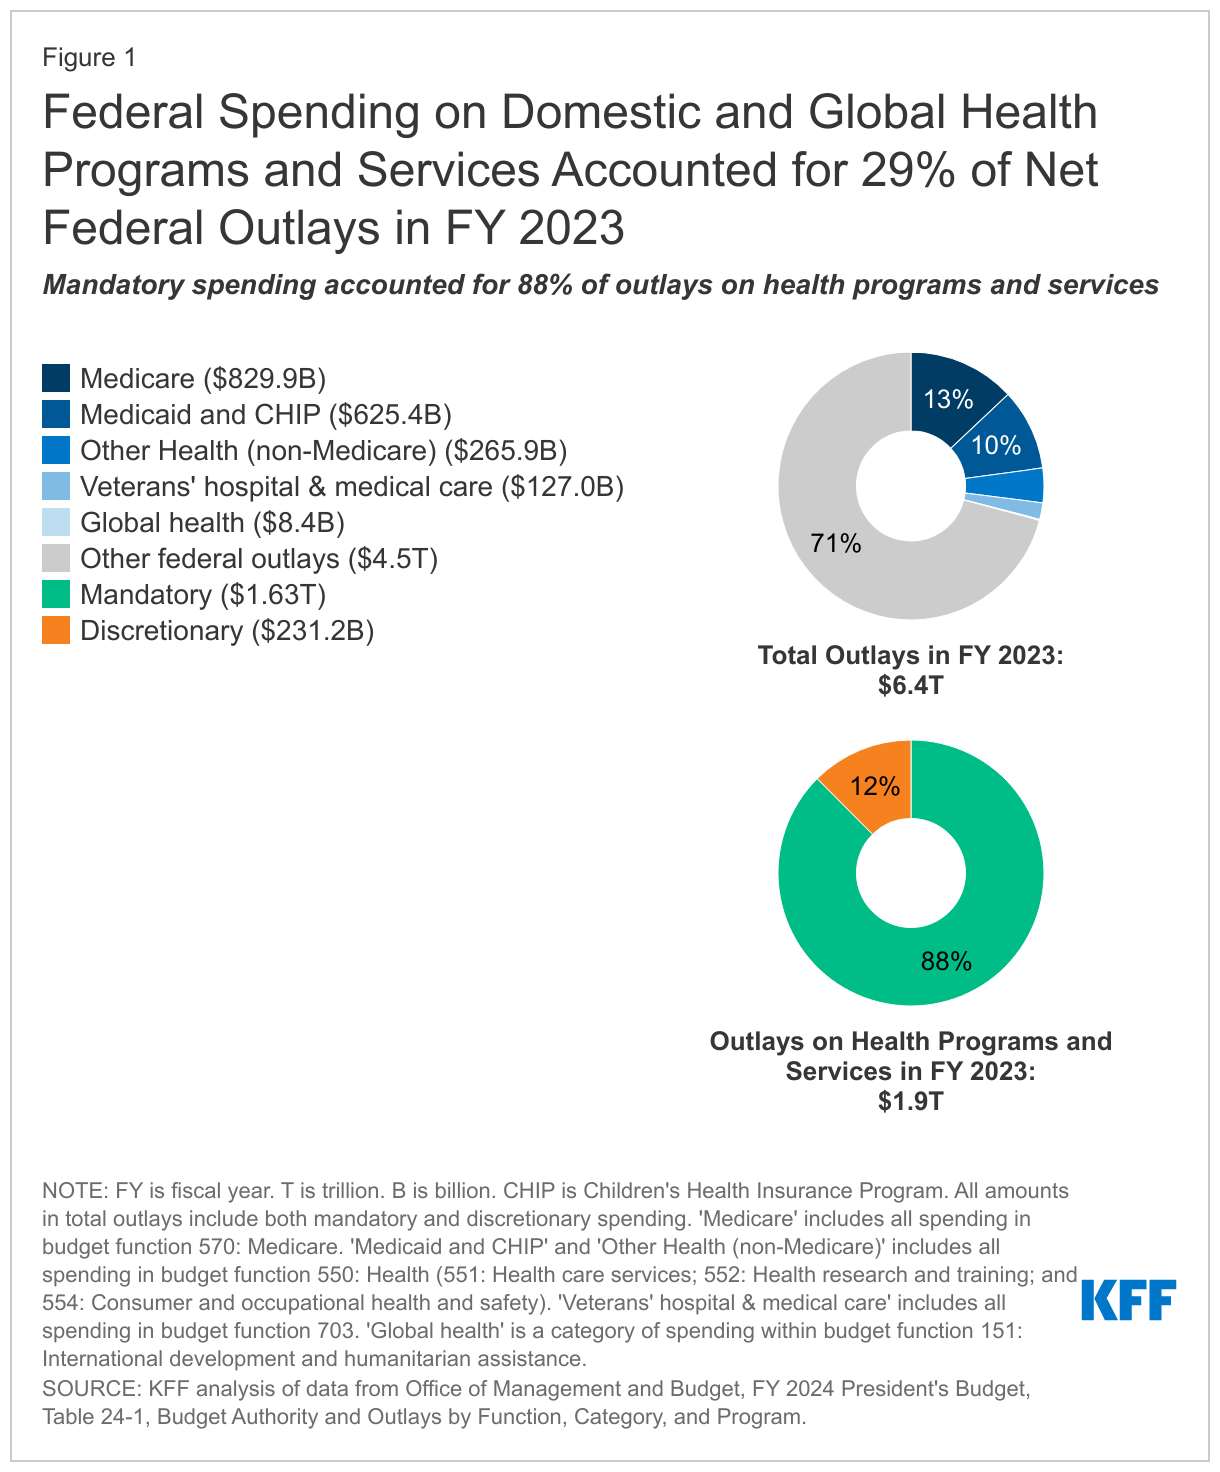
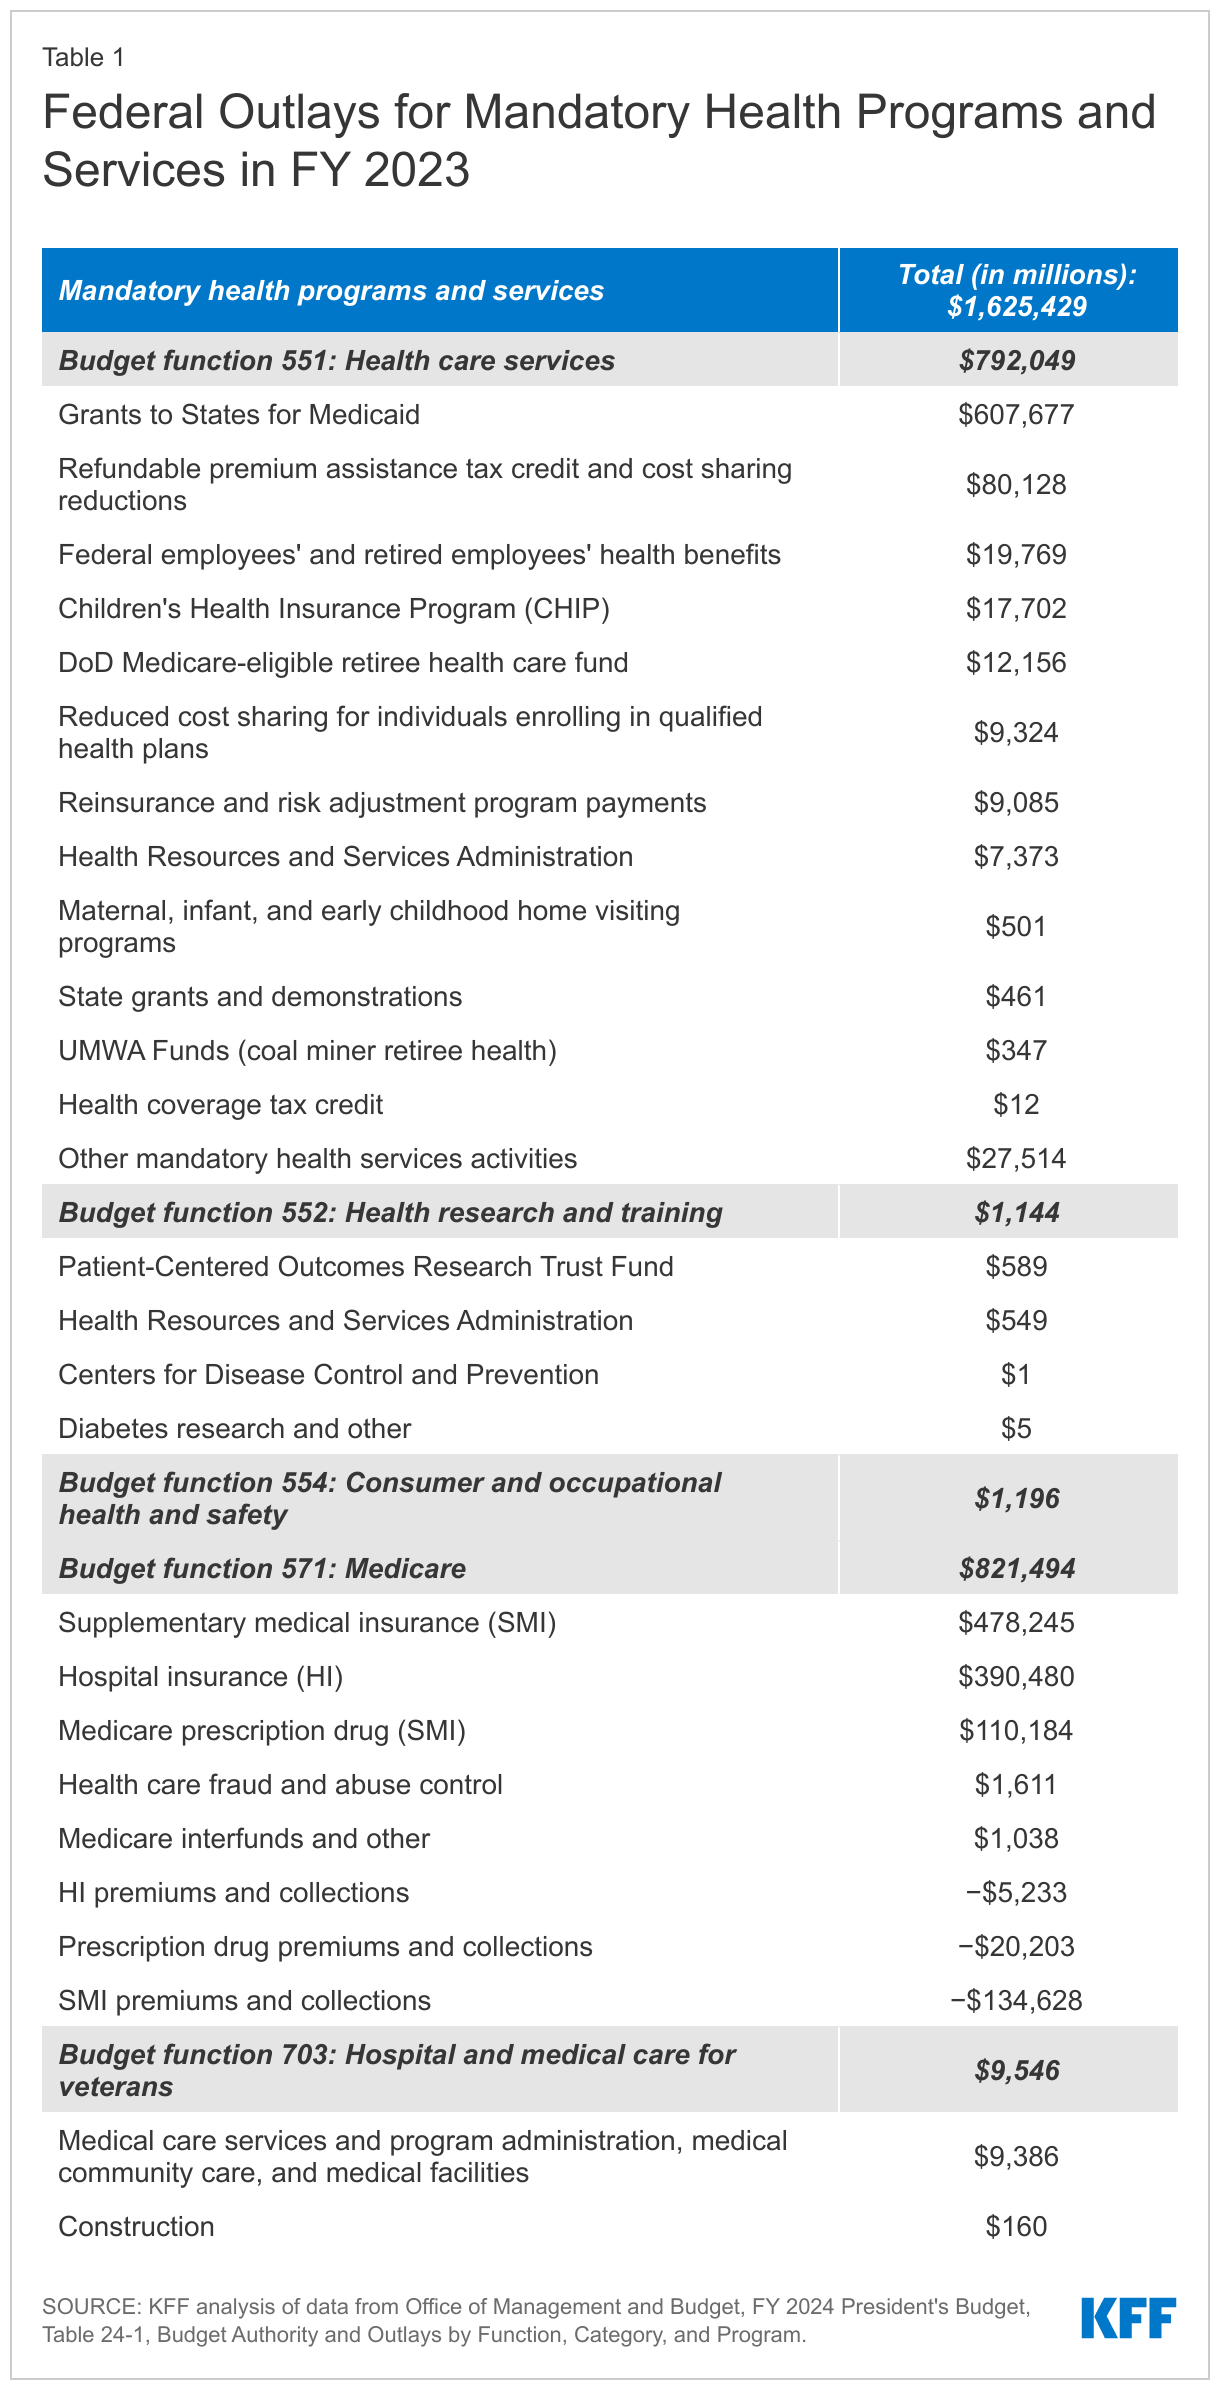
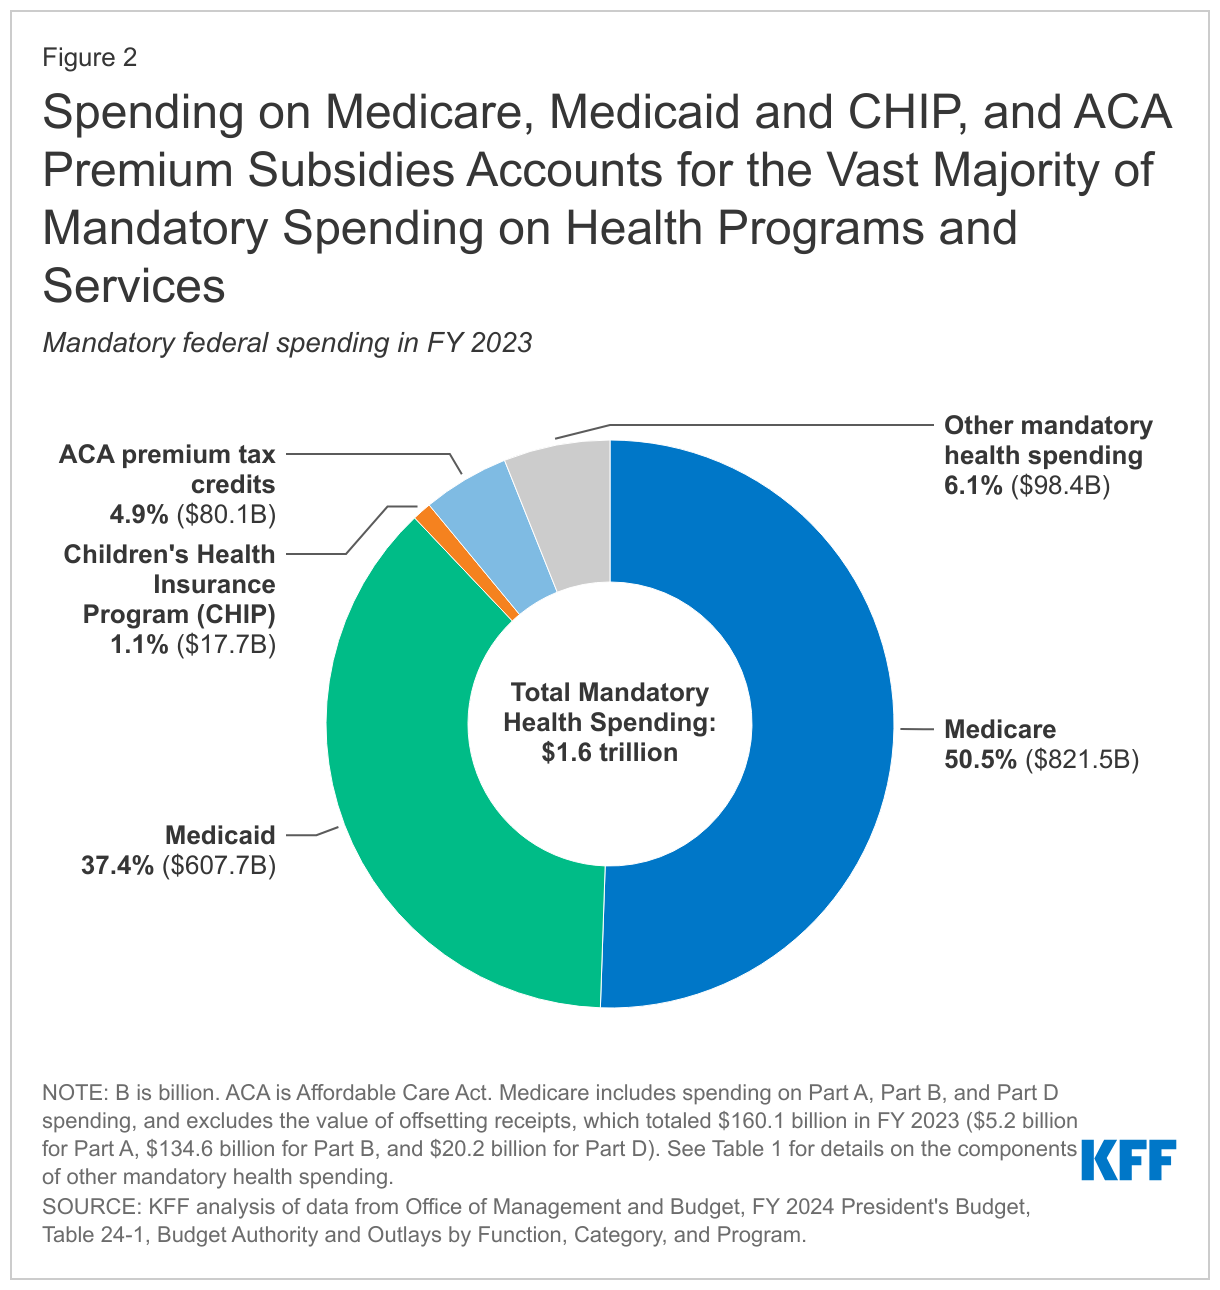
Mandatory spending comprises the majority (88% or $1.6 trillion) of federal spending on health programs and services. Mandatory spending is not subject to annual appropriations votes by Congress but instead mandated by existing laws. Mandatory health spending includes nearly all Medicare spending, federal spending on Medicaid and CHIP (which are jointly funded by states and the federal government), and the refundable portion of the health insurance premium tax credit for coverage through the ACA Marketplaces, along with other mandatory health spending, which is detailed in Table 1. Medicare alone, which covers 65 million older adults and younger people with long-term disabilities, accounts for half of mandatory spending on federal health programs and services, while Medicaid, which covers 84 million individuals, accounts for another 37% (Figure 2). ACA premium tax credits—which include a refundable portion that counts as outlays and a non-refundable portion that counts as lost revenue—represent a much smaller portion (5% of mandatory outlays).

Spending on Medicare, Medicaid and CHIP, and ACA Premium Subsidies Accounts for the Vast Majority of Mandatory Spending on Health Programs and Services

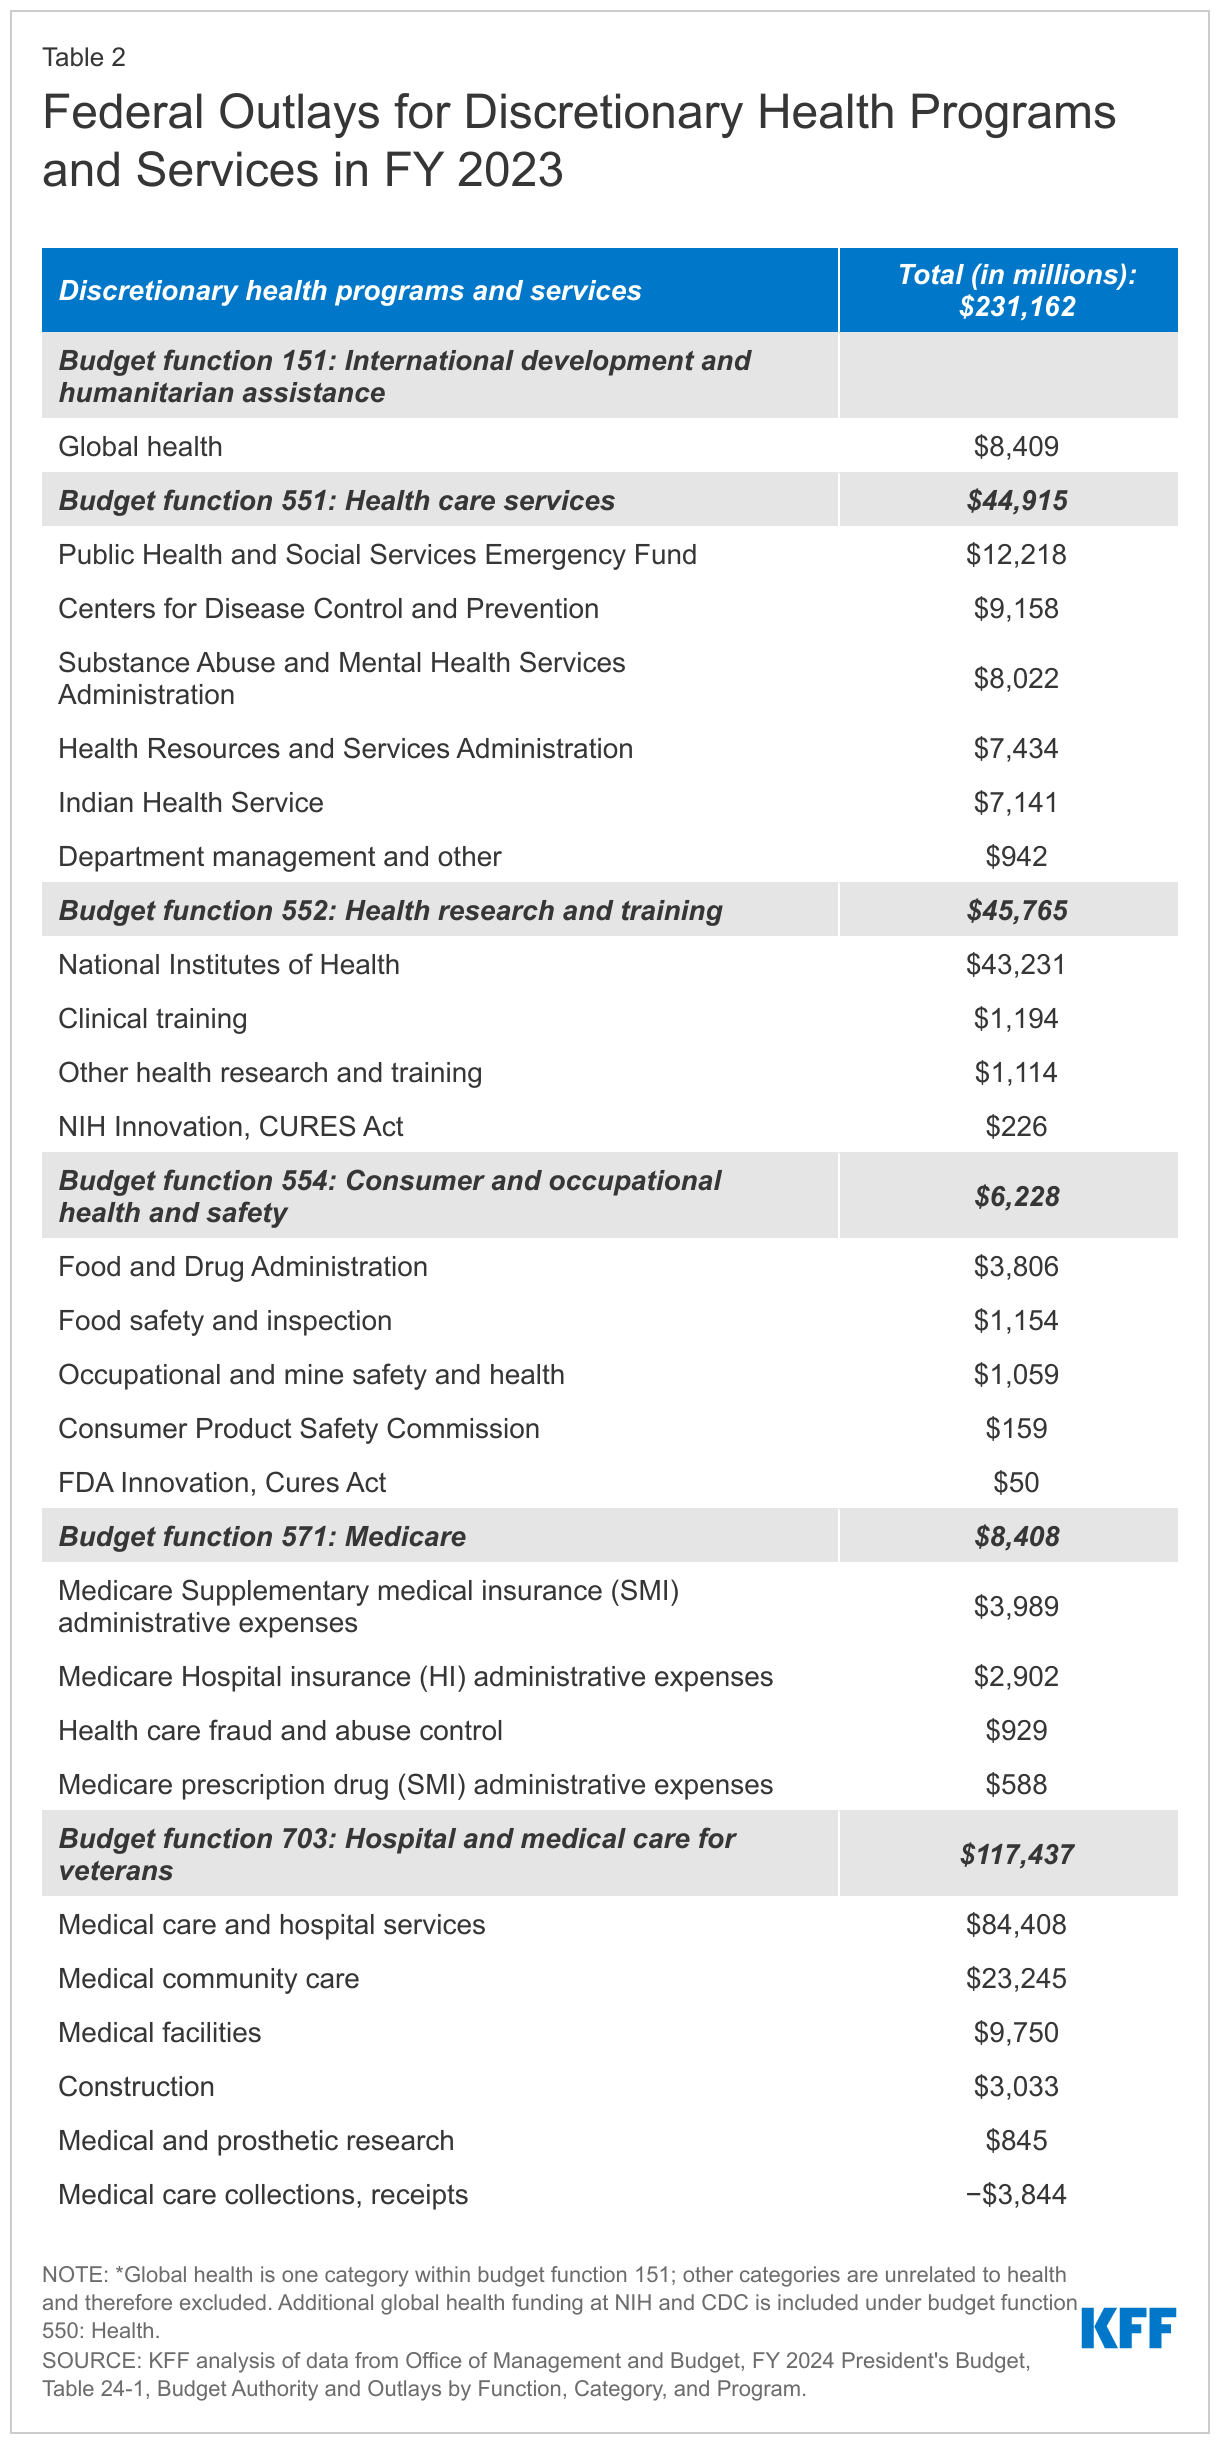
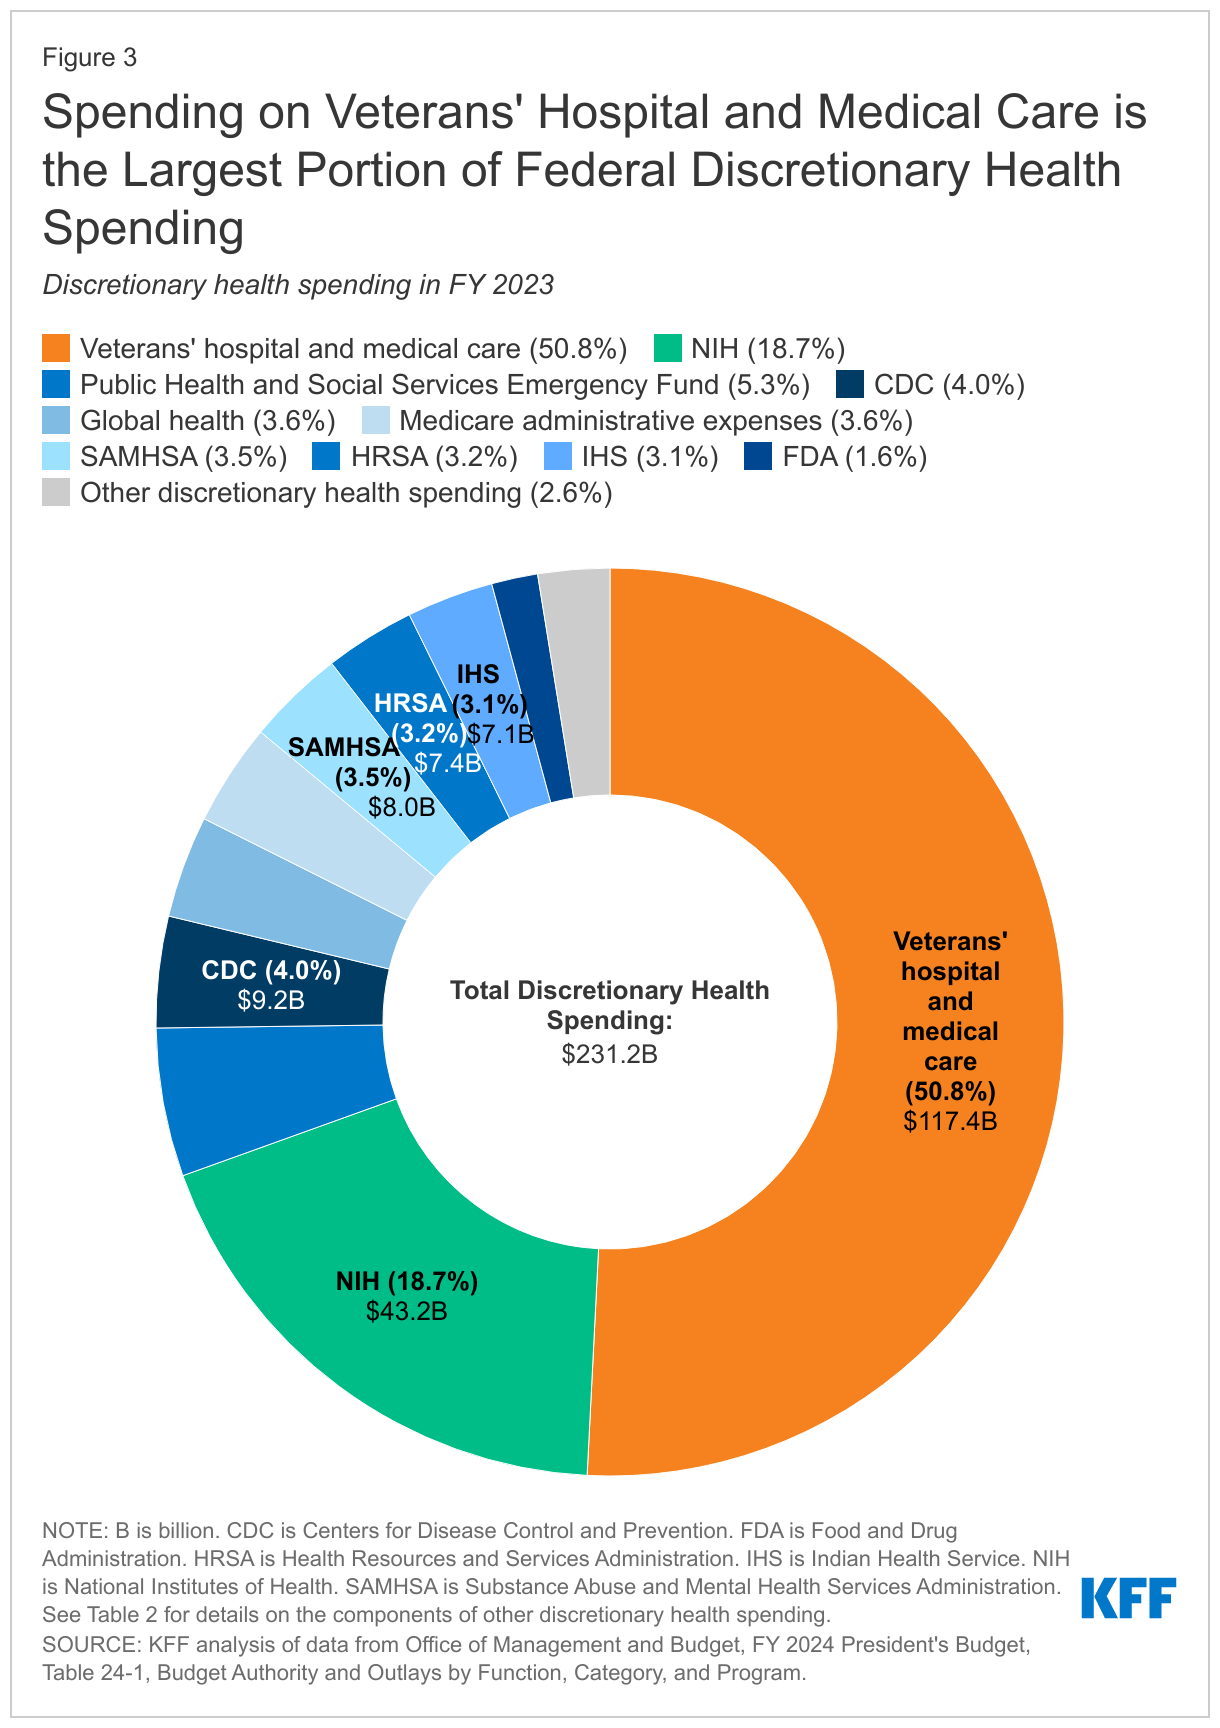
The remaining 12% of federal health spending ($231 billion) is discretionary spending, which is subject to votes by Congress during the annual appropriations process. Discretionary health spending includes nearly all spending on veterans’ hospital and medical care, estimated to provide services to more than 7 million veteran patients in FY 2022; spending on agencies such as the CDC, NIH, FDA, and HRSA; global health spending; and certain other health programs and services (Figure 3, Table 2).

Spending on Veterans' Hospital and Medical Care is the Largest Portion of Federal Discretionary Health Spending

In addition to federal spending on health programs and services, the federal government provides several tax benefits that support health-related activities, known as tax expenditures. These tax provisions are similar to federal spending in that they provide benefits from the federal government to employers, individuals, and other entities. Tax expenditures are revenue losses to the federal government because they allow for certain exclusions, exemptions, or deductions from income for the purpose of determining the amount of income taxes owed; provide preferential tax rates for certain programs; or reduce tax liability through tax credits.

Based on data from the Treasury Department, the three largest health-related tax expenditures in FY 2022 were:

  • the tax exemption of employer contributions for medical insurance premiums and medical care: $224.5 billion (not including additional lost revenue from exempting employer contributions from payroll taxes for Social Security and Medicare);
  • the premium tax credit for ACA Marketplace coverage: $14.7 billion (excluding the value of the refundable portion of the tax credit, which is classified as a mandatory outlay); and
  • tax deductions for contributions to Medical Savings Accounts and Health Savings Accounts: $13 billion.

How does the debt limit affect federal health spending?

The debt limit itself does not directly affect levels of spending by the federal government, including mandatory and discretionary health spending. Government spending and revenues are, however, directly affected by legislation passed by Congress and signed by the President, which can add to the federal deficit and debt if, on balance, spending exceeds revenue. Over time, budget deficits have added to the government’s borrowing needs. Based on the latest projections from the Congressional Budget Office, annual federal budget deficits, amounting to a cumulative $20.2 trillion over the coming decade, will result in a substantial increase in federal debt.

Raising the debt limit does not mean the federal government is allowed to spend more money than Congress has previously authorized it to spend. But in a scenario where Congress failed to raise the debt limit, the government would be unable to borrow more money and would have insufficient funds to meet its current obligations. The amount of allowable spending would be limited to cash on hand and incoming revenues.

If the debt limit were reached and the Treasury Department had taken all “extraordinary measures” to avoid default, it is not clear what steps the government would or could take in response to meet the government’s obligations, but could include payment delays, prioritizing some payments over others, and automatic across-the-board payment reductions. Any of these options could affect payments for health and retirement benefits, including Social Security, Medicare, Medicaid and CHIP, veterans’ benefits, and other programs.

How does the regular congressional budget process affect federal health spending?

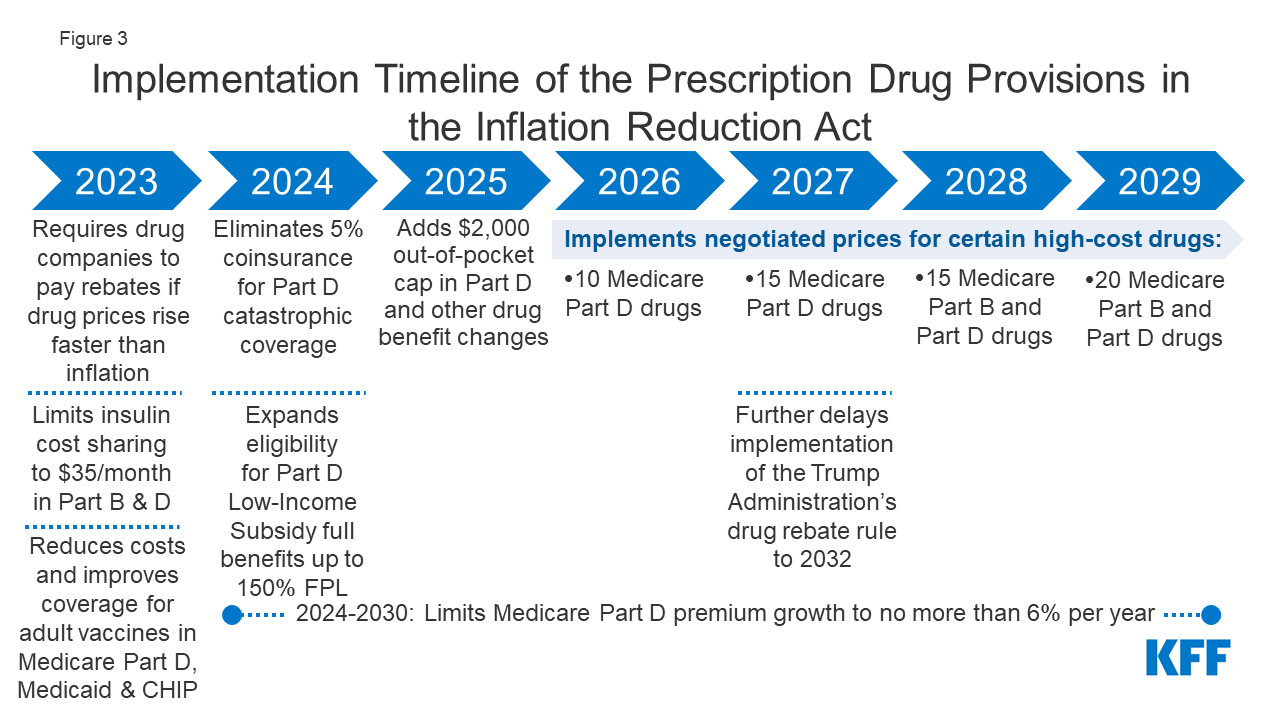
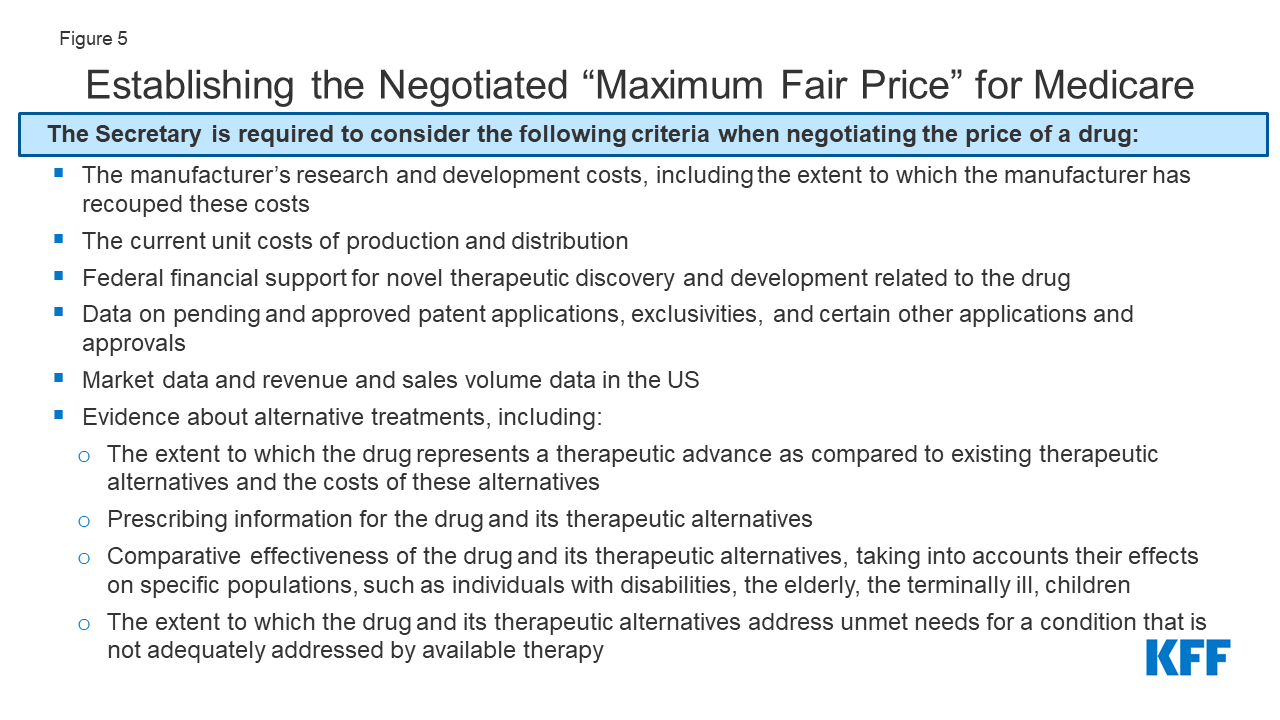
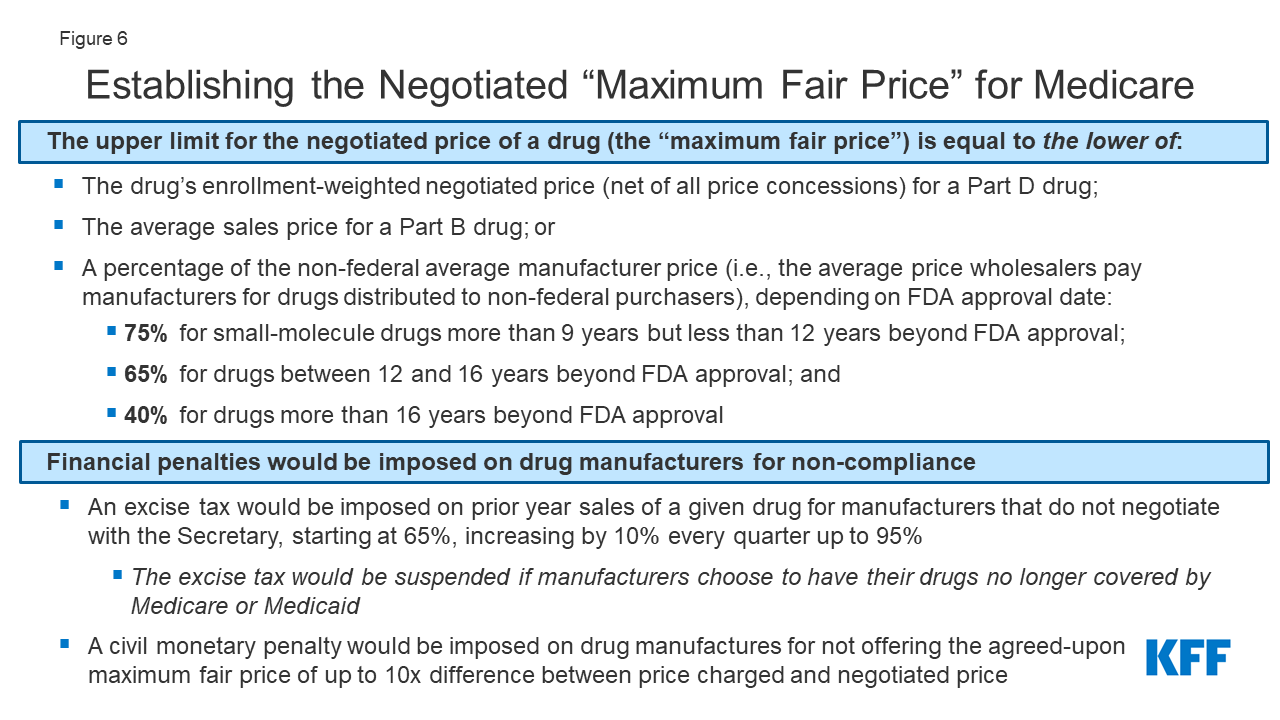
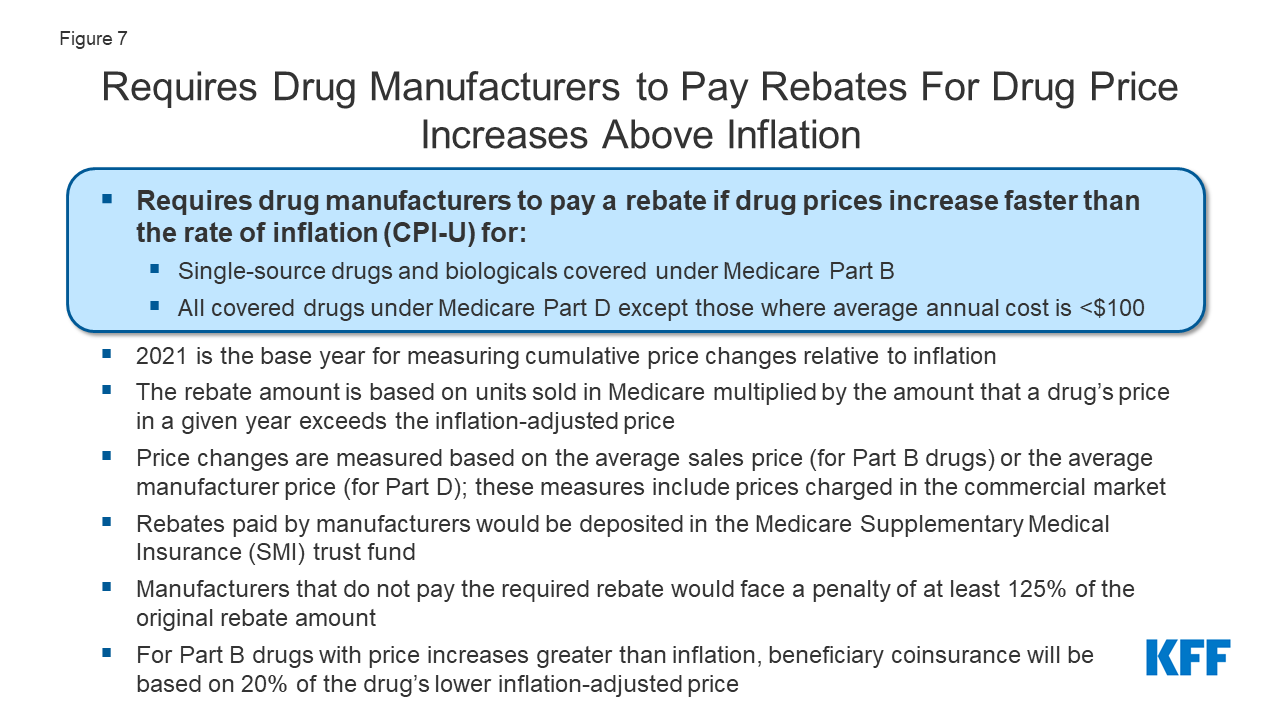
The regular Congressional budget process begins with a concurrent resolution that sets the overall federal spending and revenue levels. The budget resolution may also include reconciliation instructions to allow for a fast-track process that requires only a majority vote in the Senate for changes to spending on mandatory programs and federal revenues. The reconciliation process has recently been used to pass the Inflation Reduction Act of 2022 and the Tax Cuts and Jobs Act of 2017, as well as portions of the Affordable Care Act of 2010.

In most years over the last two decades, however, Congress has failed to agree to a budget resolution. When a resolution is not adopted, each chamber adopts its own (and usually different) targets for discretionary spending, and changes to mandatory spending and revenues may only be done through regular order (rather than reconciliation), and thus typically require a three-fifths vote in the Senate.

The Appropriations Committees develop 12 separate appropriates measures, including the Labor, Health and Human Services, Education and Related Agencies appropriations bill, which includes most domestic discretionary health spending. These bills are often combined for consideration by the full House and Senate into an omnibus bill. Congress is required to approve appropriations and the President is required to sign them into law before September 30 (the end of the federal fiscal year). If this deadline isn’t met, Congress can pass a continuing resolution to fund the government based on the preceding fiscal year amounts. When neither full year appropriations nor a continuing resolution is passed, the government “shuts down.” Continuing resolutions are more common than government shutdowns. For example, before approving the Consolidated Appropriations Act, 2023, which funds the government through September 30, 2023, Congress passed two continuing resolutions as lawmakers negotiated.

In years that a budget resolution is agreed to, it may also include rules designed to impose fiscal discipline on the legislative process. These rules remain in effect until removed or revised by a future resolution. Two examples include the House and Senate PAYGO rules, which require any legislative provisions that are projected to increase the deficit over various time periods (different under House and Senate PAYGO rules) to be offset by spending reductions or tax increases. The rules are enforced through a “point-of-order” against legislation that violates the rule, though these are routinely waived when the legislation has sufficient support in the chamber.

What is sequestration and how does it affect federal health spending?

Sequestration is a budget enforcement tool that requires automatic, across-the-board reductions in federal spending, typically by a specified percentage. The sequestration process was established by Congress in 1985 to encourage Congress to meet specific budgetary goals. It is of recent interest because of the budget sequesters called for under the Budget Control Act of 2011 (BCA) and the Statutory Pay-As-You-Go Act of 2010 (PAYGO).

The BCA was enacted over a decade ago during a time when many lawmakers were expressing concern over federal budget deficits. The law included limits on annual discretionary spending, established a committee to develop proposals to reduce the deficit, and required sequestration of mandatory spending and further reductions in discretionary spending if the committee failed to report deficit reduction legislation. Because the committee did not come to agreement, sequestration was triggered. Under the BCA, a sequestration of mandatory federal spending was established for FY 2013 to FY 2021 but has been extended several times and is currently in effect through FY 2031. (The separate BCA requirement for limits on discretionary spending expired at the end of FY 2021.)

Under the Statutory PAYGO Act, sequestration is triggered when legislation enacted by Congress during a session is projected to increase the deficit on average over a five- or ten-year period, as determined by the Office of Management and Budget (OMB). However, sequestration under Statutory PAYGO has not yet occurred since it has been waived by Congress each time it would otherwise have been required.

Certain programs and types of spending are exempt from sequestration. Most of these exemptions relate to mandatory spending. Health spending exempt from sequestration includes certain health programs such as Medicaid, CHIP, ACA tax credits, Medicare Part D Low-Income Subsidies, Medicare Part D reinsurance spending, and veterans’ medical care. Social Security is also exempted.

Notably, most Medicare spending is not exempt from sequestration, but for Medicare (as well as certain other programs), special rules apply that limit the percentage reduction in spending. Under the BCA, reductions in Medicare benefits spending—including payments to providers under Part A and Part B and payments to plans under Part C (Medicare Advantage) and Part D—are limited to 2% rather than the uniform percentage reduction that would be applied to other nonexempt mandatory spending. Under a Statutory PAYGO sequester, Medicare benefit payment reductions are limited to 4%.

Sequestration of Medicare spending is currently in effect under the BCA’s mandatory spending sequester, although during the COVID-19 pandemic, it was suspended from May 2021 to March 2022 and reduced from 2% to 1% from April 2022 through June 2022. The Consolidated Appropriations Act (CAA), 2023 extended the BCA’s 2% sequestration of Medicare spending specifically partway into FY 2032 rather than expiring at the end of FY 2031, as it does for other nonexempt mandatory spending. In addition, while enactment of the American Rescue Plan Act of 2021 triggered a 4% Medicare sequester under Statutory PAYGO for FY 2022 (along with across-the-board cuts in certain other mandatory spending), Congress delayed these cuts to January 1, 2023 and then waived them for 2023 and 2024.

Health Spending and Budget Issues to Watch

The Biden Administration has released the President’s budget for FY 2024, which includes many savings and revenue proposals to reduce the federal deficit, along with many health-related proposals to lower prescription drug costs, extend the solvency of the Medicare Part A trust fund, and make permanent the ACA’s enhanced premiums tax credits, among other proposals. Under regular order, release of the President’s budget would be followed by the passage of a budget resolution by Congress in April. These actions could set the stage for discussions over the federal budget deficit and debt between the Administration and members of Congress in subsequent months. House Republicans have expressed support for a  plan to balance the budget within 10 years by cutting government spending (and not increasing taxes). But without new revenues and without reducing spending on Social Security, Medicare, or defense, steep spending reductions in other areas would be needed to balance the budget. This could mean large spending cuts to health programs and services such as Medicaid, CHIP, and ACA subsidies, as well as veterans’ hospital and medical care, the NIH, FDA, and other health agencies, and other health programs and services.

The Treasury Department estimates that it will have exhausted the extraordinary measures being taken to avoid a default on the debt by early June. The Biden Administration supports a so-called ‘clean’ vote on raising the debt limit, separate from any discussions about approaches to reduce the federal deficit and debt. Although President Biden and Speaker McCarthy have ruled out changes to Medicare spending in discussions over the debt limit, it is possible that cuts to other federal health spending programs and services could be considered. Policymakers who are seeking to negotiate reductions in federal spending in exchange for a vote to raise the debt limit have proposed limiting new discretionary spending, which would affect many federally funded health programs and services, and imposing work requirements for Medicaid, among other options.

While most policymakers have not expressed support for cuts to Medicare in current budget discussions, CBO projects that higher spending on both Medicare and Social Security will put growing pressure on the federal budget. Federal law requires annual reports on the financial status of the Medicare and Social Security trust funds to be issued by April 1 each year, and typically these reports draw attention to this issue. Based on the 2022 report, the Medicare Trustees projected that the Medicare Part A trust fund, which pays for inpatient hospital, skilled nursing facility, home health and other Part A services, would be depleted in 2028. The projected shortfall is attributable to both the rise in spending, due to rising health care costs, growing enrollment, and an aging population, combined with insufficient revenues to cover all expenditures.

Some policymakers in Congress have proposed the creation of bipartisan, bicameral committees to address the solvency of government programs with trust funds, including Medicare, Social Security, and the highway trust fund. The President’s FY 2024 budget proposes to generate new tax revenue for the Part A trust fund through tax increases on high-income taxpayers (households earning more than $400,000 per year). These additional revenues, together with savings from prescription drug proposals, which would be credited to the Part A trust fund, are estimated to extend the solvency of the Medicare Part A trust fund by at least 25 years.

In the near term, the question of how lawmakers will respond to the debt limit looms large in current discussions about the federal budget and federal spending on government programs such as Social Security, Medicare, and Medicaid. The government has been funded through the end of the current fiscal year (September 30, 2023), but action will be needed by then to avoid funding gaps and avert a government shutdown, which could have the effect of curtailing the operations of government agencies like the FDA, NIH, and CDC and the provision of certain veterans’ services. Over the longer term, public and private payers and individuals face financial pressures associated with higher health care costs. For the federal government, rising health care costs affect spending on the government’s major health care programs, Medicare and Medicaid, along with spending on certain other health programs and services, such as veterans’ medical care. Providing funding for both mandatory and discretionary health programs and services that millions of people rely on while taking steps to address the growing federal budget deficit and debt could pose a challenge for policymakers in the months and years ahead.

This work was supported in part by Arnold Ventures. KFF maintains full editorial control over all of its policy analysis, polling, and journalism activities.

Methods

This analysis is based on data on federal outlays from the Office of Management and Budget (OMB) FY 2024 President’s Budget. Specifically, we use FY 2023 data on federal outlays from Table 24-1. Budget Authority and Outlays by Budget Function, Category, and Program.

The federal budget groups spending into roughly 20 categories called ‘budget functions,’ which are groups of activities or programs that fulfill specific purposes, such as defense, transportation, and health. This analysis focuses on non-defense health spending, which is defined to include spending in the following categories within four budget functions:

150: International Affairs:

151: International development and humanitarian assistance: Global health

550: Health:

551: Health care services

552: Health research and training

554: Consumer and occupational health and safety

570: Medicare

700: Veterans Benefits and Services

703: Hospital and medical care for veterans

For each category, we include both mandatory and discretionary spending, where applicable.

Spending totals in this analysis are outlays, which represent actual cash flows, rather than budget authority, which represents the amounts authorized by Congress for new obligations by federal agencies. Global health outlay totals presented here do not match those presented in other KFF resources, such as the U.S. Global Health Budget Tracker, which highlight the budget authority totals as provided by Congress in annual appropriations and include some other funding components that are counted elsewhere in this analysis. As noted above, in this analysis ‘global health’ is a category of spending within budget function 151: International development and assistance, which accounts for the majority of global health funding. Additional global health funding at NIH and CDC is included under budget function 550: Health.

This analysis does not include spending by the Department of Health and Human Services that falls outside of the ‘Health’ or ‘Medicare’ budget functions, which consists mainly of spending on the Administration for Community Living (ACL) and Administration for Children and Families (ACF), which falls within budget function 500—Education, Training, Employment, and Social Services.

Tables

Federal Outlays for Mandatory Health Programs and Services in FY 2023
Federal Outlays for Discretionary Health Programs and Services in FY 2023

The Implications of COVID-19 for Mental Health and Substance Use

Published: Mar 20, 2023

Note: This brief was updated on March 20, 2023 to incorporate the latest available data.Concerns about mental health and substance use remain elevated three years after the onset of the COVID-19 pandemic, with 90% of U.S. adults believing that the country is facing a mental health crisis, according to a recent KFF/CNN survey. The pandemic has affected the public’s mental health and well-being in a variety of ways, including through isolation and loneliness, job loss and financial instability, and illness and grief.

Over the course of the pandemic, many adults reported symptoms consistent with anxiety and depression, with approximately four in ten adults reporting these symptoms by early 2021, before declining to approximately three in ten adults as the pandemic continued (Figure 1). Additionally, drug overdose deaths have sharply increased – largely due to fentanyl – and after a brief period of decline, suicide deaths are once again on the rise. These negative mental health and substance use outcomes have disproportionately affected some populations, particularly communities of color and youth. As the end of the declaration of the public health emergency nears – on May 11, 2023 – many people continue to grapple with worsened mental health and well-being and face barriers to care.

The Share of Adults Reporting Symptoms of Anxiety and/or Depressive Disorder During, the COVID-19 Pandemic

This brief explores mental health and substance use during, and prior to, the COVID-19 pandemic. We highlight populations that were more likely to experience worse mental health and substance use outcomes during the pandemic and discuss some innovations in the delivery of services. We analyze and present findings using the most recent data available at the time of this publication – including the Household Pulse Survey and the CDC WONDER database. Key takeaways include:

  • Symptoms of anxiety and depression increased during the pandemic and are more pronounced among individuals experiencing household job loss, young adults, and women. Adolescent females have also experienced increased feelings of hopelessness and sadness compared to their male peers.
  • Deaths due to drug overdose increased sharply across the total population coinciding with the pandemic – and more than doubled among adolescents. Drug overdose death rates are highest among American Indian and Alaska Native people and Black people.
  • Alcohol-induced death rates increased substantially during the pandemic, with rates increasing the fastest among people of color and people living in rural areas.
  • After briefly decreasing, suicide deaths are on the rise again as of 2021. From 2019 to 2021, many communities of color experienced a larger growth in suicide death rates compared to their White counterparts. Additionally, self-harm and suicidal ideation has increased faster among adolescent females compared to their male peers.
  • Several changes have been implemented in the delivery of mental health and substance use services since the onset of the pandemic, including the utilization of telehealth, steps to improve access to treatment for opioid use disorders, expansion of school-based mental health care, and the rollout of the 988 crisis line. As the public health emergency declaration comes to an end, it is possible that some of these changes will be interrupted.

Prevalence of Mental Illness and Substance Use During the Pandemic

Anxiety and depression

The pandemic was associated with a high prevalence of anxiety and depression symptoms in adults. Research suggests that these symptoms increased during the pandemic, but the extent of this increase is unclear.1  Throughout the pandemic, symptoms of anxiety and depression have been more pronounced among several populations.

For example, individuals experiencing household job loss were more likely than their counterparts to report symptoms of anxiety and/or depression (53% vs. 30%) in February 2023 (Figure 2). Job loss and unemployment – which have long been associated with adverse mental health outcomes – increased substantially early on in the pandemic.

Share of Adults Reporting Symptoms of Anxiety and/or Depressive Disorder, February 2023

Fifty percent of young adults (ages 18-24) reported anxiety and depression symptoms in 2023, making them more likely than older adults to experience mental health symptoms (Figure 2). Young adults have experienced a number of pandemic-related consequences – such as closures of universities, transitioning to remote work, and loss of income or employment – that may contribute to poor mental health. Additionally, young adults in college settings may encounter increased difficulty accessing treatment.

Symptoms of anxiety and/or depression were also elevated among women (36%) compared to men (28%) in February 2023 (Figure 2). Even before the pandemic, women were more likely than men to report mental health disorders, including serious mental illness.

Concerns about youth mental health further increased with the onset of the pandemic and the recent uptick in gun violence. In a recent KFF/CNN survey, roughly half of parents (47%) said the pandemic had a negative impact on their child’s mental health, including 17% who said it had a “major negative impact”. Poor mental health has been more pronounced among adolescent females in particular. As shown in Figure 3, the gap in the share of adolescent females and males reporting feelings of hopelessness and sadness – symptoms indicative of depressive disorder – widened from 2019 (47% vs. 27%, respectively) to 2021 (57% vs. 29%, respectively). Many female adolescents also reported adverse experiences in 2021, which can negatively impact mental health.

Share of High School Students with Persistent Feelings of Hopelessness and Sadness, Before and During the Pandemic, by Sex

Substance use and deaths

The pandemic has coincided with an increase in substance use and increased death rates due to substances. In 2021, there were over 106,600 deaths due to drug overdose in the U.S. – the highest on record. This spike in deaths has primarily been driven by substances laced with synthetic opioids, including illicitly manufactured fentanyl.

Further, the overall drug overdose death rate rose by 50% during the pandemic (Figure 4), but varied across states. While drug overdose death rates increased across all racial and ethnic groups, the increases were larger for people of color compared to White people. White people continue to account for the largest share of deaths due to drug overdose per year, but people of color are accounting for a growing share of these deaths over time. In 2021, the highest drug overdose death rates were among American Indian Alaska Native (AIAN) people (56.6 per 100,000), Black people (44.2 per 100,000), and White people (36.8 per 100,000) (Figure 4). Differences in drug overdose deaths by sex were also exacerbated during the pandemic. As shown in Figure 4, the gap in the drug overdose death rates between males and females increased from 2019 (29.6 vs. 13.7 per 100,000, respectively) to 2021 (45.1 vs. 19.6 per 100,000, respectively).

Age-Adjusted Drug Overdose Death Rates, Before and During the COVID-19 Pandemic

Research suggests that substance use among adolescents has declined, yet drug overdose deaths have sharply increased among this population, primarily due to fentanyl-laced substances. Among adolescents, drug overdose deaths have more than doubled from 2019 (282 deaths) to 2021 (637 deaths) following a period of relative stability.2  Male, Black, and Hispanic youth have experienced the highest increases in deaths due to drug overdose.

During the pandemic, excessive drinking increased along with alcohol-induced deaths. Alcohol-induced death rates increased by 38% during the pandemic, with rates the highest and increasing the fastest among AIAN people. AIAN people died of alcohol-induced causes at a rate of 91.7 per 100,000 in 2021, six times more than the next highest group – Hispanic people at a rate of 13.6. Black people also experienced significant increases in alcohol-induced deaths during COVID, with rates increasing more than 45% (Figure 5). Both rural and metropolitan areas experienced an increase in alcohol-induced deaths during the pandemic, but rural areas saw the largest increase (46% increase compared to 36%).

Age-Adjusted Alcohol-Induced Death Rates, Before and During the COVID-19 Pandemic

Suicidal ideation and deaths

Concerns about suicidal ideation and suicide deaths have also grown during the pandemic. Notably, self-harm and suicidal ideation has increased among adolescent females. Thirty percent of adolescent females seriously considered attempting suicide in 2021 compared to 14% of their male peers (Figure 6). Other analyses found that as the pandemic progressed, emergency department visits for suicide attempts increased among adolescents, primarily driven by females.

Share of High School Students with Serious Thoughts of Suicide, Before and During the Pandemic, by Sex

Suicide deaths in the U.S. began to increase in 2021 after briefly slowing in 2019 and 2020, although some research suggests that some suicides may be misclassified as drug overdose deaths since it can be difficult to determine whether drug overdoses are intentional. From 2019 to 2021, many communities of color experienced a larger growth in suicide death rates compared to their White counterparts.3  In 2021, suicide deaths by firearm accounted for more than half (55%) of all suicides in the U.S., but varied greatly across states.

The pandemic has also raised concerns about mental illness, suicide, and substance use among other populations. Essential workers and people with chronic health conditions may have experienced worsened mental health due to increased risk of contracting or becoming severely ill from COVID-19. Many of these individuals, particularly those with chronic conditions, were already at-risk of experiencing poor mental health outcomes prior to the pandemic. LBGT+ people have historically faced mental health problems at higher rates than their non-LGBT+ peers. The pandemic has continued to negatively impact LBGT+ people’s mental health in disproportionate ways. In addition, people experiencing prolonged COVID-19 symptoms, or long COVID, may be more likely to develop new mental health conditions or to experience worsening of existing ones.

Changes in the Delivery of Mental Health and Substance Use Disorder Services

Leading up to the pandemic, many people faced barriers accessing mental health and substance use disorder services for reasons including costs, not knowing where to obtain care, limited provider options, and low rates of insurance acceptance. Young adults, Black adults, men, and uninsured people were less likely to receive services compared to their peers.

In recent years, access to care barriers may have worsened due to pandemic disruptions and closures, workforce shortages, and increased demand for services. In response to growing need, some policies and strategies were implemented to address access challenges, such as growth of telehealth, improved access to opioid use disorder treatment, the expansion of school-based mental health services, and the rollout of 988; however, challenges remain.

The delivery of mental health and substance use disorder services via telehealth grew sharply during the pandemic. By 2021, nearly 40% of all mental health and substance use disorder outpatient visits were delivered through telehealth. These behavioral health services via telehealth have also been more utilized in rural areas than urban areas during the pandemic. This underscores the role telehealth can play in improving access to behavioral health services in rural areas, which often face additional provider and resource shortages. Further, community health centers – which serve low-income and medically underserved communities, including communities of color and those in rural areas – experienced a large increase in behavioral health visits in 2021, largely driven by telehealth. During the pandemic, many state Medicaid programs expanded coverage of behavioral health telehealth services. This includes broadening the range of behavioral health services offered virtually and allowing for more provider types to be reimbursed for telehealth services. Many state Medicaid programs reported that telehealth has helped maintain and expand access to behavioral services during the pandemic. Some private payers have also improved coverage for mental health and substance use services by removing pre-pandemic telehealth coverage restrictions. Although telehealth can broaden access to care, in-person care may be necessary or preferred for some or for those experiencing challenges with technology and digital literacy.

As opioid-related overdose deaths have sharply increased, measures to improve access to treatment have been implemented. Following the onset of the pandemic, the federal government allowed for new flexibilities in opioid use disorder (OUD) treatment to ease access barriers, for example allowing for take-home methadone doses and covering telehealth treatment, and the Biden administration has proposed making these flexibilities permanent. Further, the 2023 Consolidated Appropriations Act eliminated the X-waiver requirement for prescribing buprenorphine, which substantially increases the number of providers who are authorized to prescribe buprenorphine to treat OUD. Voluntary guidelines for providers have also been issued to help reduce opioid overprescribing and misuse. At the same time, the Drug Enforcement Agency recently proposed returning to previous rules that required in-person visits before prescribing controlled substances to patients via telehealth, though there are some exceptions.

In response to growing mental health concerns among youth, integration of mental health services in school-based settings became a priority. Recent legislation aims to expand mental health care in schools – a setting that is easily accessible by children and adolescents. Specifically, legislation provides funding to expand and train mental health providers in schools; implement suicide, drug, and violence prevention programs; and provide trauma support services, among others. Further, recognizing Medicaid’s importance in covering and financing behavioral health care for children, CMS is now required to provide updated guidance on how to support and expand school-based behavioral health services. The recently passed Consolidated Appropriations Act (CAA) continues to build on prior pandemic-era legislation that promotes access to behavioral health care for children. For example, to ensure more stable coverage for low-income children the CAA requires states to provide 12 months of continuous eligibility for children in Medicaid and CHIP.

An easy-to-remember number for the suicide and behavioral health crisis hotline, 988, was launched in 2022. On July 16, 2022, the federally mandated crisis number988, became available to all landline and cell phone users, providing a single three-digit number to access a network of over 200 local and state funded crisis centers where those in need may receive crisis counseling, resources and referrals. After 988 implementation, national answer rates increased alongside increases in call volume. Long-term sustainable funding of local 988 crisis call centers remains uncertain in many states. In addition to 988, some states are developing behavioral health crisis response systems, such as mobile crisis or crisis stabilization units, which will enable a specialized behavioral health response for behavioral health crises that require intervention. The CAA included provisions aimed at strengthening and evaluating 988 and the developing behavioral health crisis continuum.

Despite steps taken to improve the delivery of mental health and substance use services, challenges remain. Provider workforce challenges are widespread, with nearly half of the U.S. population (47%) living in a mental health workforce shortage area. Shortages may contribute to access challenges and contribute to increases in psychiatric boarding in emergency rooms. Additionally, provider network directories are often outdated, further contributing to access challenges. While recent legislation has taken steps in response – including funding for at least 100 new psychiatry residency positions, grants for mental health peer support providers, and improvements to provider directories through the CAA – these are relatively small measures in the face of big access challenges. The lack of a diverse mental health care workforce may contribute to limited mental health treatment among people of color. Separately, even with insurance coverage, individuals with mental health needs face challenges accessing care. While Medicaid enrollees have limited out-of-pocket costs there is variation in who is eligible and the range of services covered across states. Additionally, the end of Medicaid’s continuous enrollment provision – on March 31, 2023 – could result in millions of disenrollments over the next year which could disrupt access to behavioral health services. Among private insurance enrollees, enrollees, with mental illness face high out-of-pocket costs; and these costs vary substantially across states. While most adults with mental illness have private insurance, rates of mental illness and substance use disorders are most prevalent among nonelderly adults with Medicaid.

Looking Ahead

Although steps have been taken to address negative mental health impacts stemming from the pandemic, mental health and substance use concerns remain elevated. Heightened racism and increasing gun violence may also contribute to poor mental health outcomes. Further, negative mental health impacts have been more pronounced among several populations, including communities of color, young adults and children – populations which have historically experienced increased barriers to care. Additionally, despite renewed discussions and new federal grants for state parity enforcement under the CAA, challenges with mental health parity persist – including lack of clarity on specific protections, low compliance rates, and slow federal enforcement. Finally, the COVID-19 public health emergency will end in May 2023, which may at least partially unravel steps taken toward delivering mental health services via telehealth and improving access to substance use disorder services.

History has shown that the mental health impact of disasters outlasts the physical impact, suggesting today’s elevated mental health needs will continue well beyond the coronavirus outbreak itself. As we emerge from the COVID-19 pandemic and the federal public health emergency draws to an end, it will be important to consider how the increased need for mental health and substance use services may persist long term, even as new cases and deaths due to COVID-19 hopefully subside.

This work was supported in part by Well Being Trust. KFF maintains full editorial control over all of its policy analysis, polling, and journalism activities.

  1. The Household Pulse Survey (HPS) is a rapid response survey that has provided real-time data during the pandemic and includes a 4-item Patient Health Questionnaire (PHQ-4) anxiety and depression screening scale. In order to understand how the prevalence of anxiety and depression may have shifted in the adult population during the onset of the pandemic, mental health estimates from HPS were compared against pre-pandemic data from the National Health Interview Survey, which also includes the 4-item PHQ scale. However, recent research finds that these comparisons may not be reliable given lower response rates and over estimation in HPS; and are no longer included in this brief. ↩︎
  2. KFF analysis of Centers for Disease Control and Prevention, Wide-ranging Online Data for Epidemiologic Research (WONDER). Accessed at: https://wonder.cdc.gov/mcd-icd10-expanded.html ↩︎
  3. KFF analysis of Centers for Disease Control and Prevention, Wide-ranging Online Data for Epidemiologic Research (WONDER). Accessed at: https://wonder.cdc.gov/mcd-icd10-expanded.html ↩︎
News Release

Latest Federal Data Show That Young People Are More Likely Than Older Adults to Be Experiencing Symptoms of Anxiety or Depression

Americans’ Mental Health Continues to Be A Concern as Many People Try to Move Beyond the Pandemic

Published: Mar 20, 2023

Young adults in the United States continue to be more likely than their older counterparts to be experiencing symptoms of anxiety or depression, according to the latest federal data analyzed by KFF researchers.

The analysis of the Census Bureau’s Household Pulse Survey finds that half (50%) of adults ages 18-24 reported anxiety and depression symptoms in 2023, compared to about a third of adults overall. The data also show that young adults are more likely than adults of any other age group to experience mental health symptoms.

Many young adults have come of age in an era of pandemic-related school closures, remote work and job and income loss, all of which may contribute to poor mental health. Additionally, young adults in college settings may encounter increased difficulty accessing treatment.

But young adults are not alone in experiencing heightened mental health symptoms. The mental health and substance use concerns that were present during the COVID-19 crisis continue to affect many Americans, even as many people try to move beyond the pandemic, Census data show.

Nearly 4 in 10 (39.3%) adults reported symptoms of anxiety or depression in February 2021, compared to 32.3 percent in 2023.  A KFF/CNN survey in October 2022 found that 90 percent of the public believes there is a mental health crisis in the U.S..

Poor mental health has also been more pronounced among adolescent females during the pandemic, with 57 percent reporting feelings of hopelessness and sadness compared to 29 percent of their male peers in 2021, the latest such data available. In the same period, 30 percent of adolescent females reported that they seriously considered attempting suicide, compared to 14 percent of adolescent males.

Additionally, drug overdose deaths have sharply increased during the pandemic. According to Centers for Disease Control and Prevention data, in 2021 there were over 106,600 deaths due to drug overdose in the U.S. — the highest on record. This spike in deaths has primarily been driven by substances laced with synthetic opioids, including illicitly manufactured fentanyl.

Here again young people especially have been affected.  Research suggests that while substance use among adolescents has declined, drug overdose deaths have sharply increased among this population, primarily due to fentanyl-laced substances. Among adolescents, drug overdose deaths have more than doubled from 2019 (282 deaths) to 2021 (637 deaths). Male, Black, and Hispanic youth have experienced the highest increases in deaths due to drug overdose.

The analysis details several changes in the delivery of mental health and substance use services that have been implemented since the onset of the pandemic, including the growth of telehealth, steps to improve access to treatment for opioid use disorders, expansion of school-based mental health care, and the rollout of the 988 national suicide prevention and crisis line.

Related Resources

News Release

As the Courts Weigh the Future of the ACA’s Preventive Services Coverage, a New Analysis Shows that Most People with Private Insurance Received At Least One of Those Benefits in 2018

Published: Mar 20, 2023

The provision of the Affordable Care Act (ACA) that requires most private health plans to cover many preventive services without any cost-sharing for their enrollees is being challenged in federal court. The U.S. District Court in the Northern District of Texas in September concluded that aspects of the requirement were unconstitutional and violated religious rights but has allowed the provision to remain in effect while it considers a remedy.

As the courts consider the ACA’s preventive services requirement, a new KFF analysis finds that roughly 100 million people received ACA-required preventive services with no patient cost-sharing in a typical year.

Overall, about 60% of the 173 million people enrolled in private health coverage used at least one of the ACA’s no-cost preventive services in 2018 prior to the COVID-19 pandemic.

The most commonly received preventive services include vaccinations, well woman and well child visits, and screenings for heart disease, cervical cancer, diabetes, and breast cancer. COVID-19 vaccines are also provided at no cost to patients under the ACA’s preventive services requirement, though how many people will take them up in the future is uncertain.

Women and children are more likely than men to have used at least one no-cost preventive service through their private insurance in 2018.

Preventive Services Use Among People with Private Insurance Coverage” also looks at variations in the use of preventive services in the large group, small group and individual markets. It is available through the Peterson-KFF Health System Tracker, an online information hub that monitors and assesses the performance of the U.S. health system. 

In addition, other KFF resources explain the Braidwood Management Inc. v. Becerra case and its implications:

Explaining Litigation Challenging the ACA’s Preventive Services Requirements: Braidwood Management Inc. v. Becerra

Learn about the implications of the most recent legal challenge contesting the ACA requirement that most private insurance plans cover specific preventive care items and services at no cost to patients.

PrEP FAQs

Answer key questions about pre-exposure prophylaxis (PrEP) and its coverage, which prompted the court challenge.

Many Women Use Preventive Services, but Gaps in Awareness of Insurance Coverage Requirements Persist: Findings from the 2022 KFF Women’s Health Survey

Review findings on women’s receipt of cancer screenings and other preventive services as well as knowledge of insurance coverage requirements for these services.

Preventive Services Covered by Private Health Plans under the Affordable Care Act

Read a summary of the federal requirements for coverage for preventive services in private plans, major updates to the requirement, and recent policy activities.

Preventive Services Tracker

Explore the adult preventive services most private plans must cover, including a summary of the recommendation, the target population, and related federal coverage clarifications.


Preventive Services Use Among People with Private Insurance Coverage

Authors: Krutika Amin, Brett Lissenden, Allison Carley, Gregory Pope, Gary Claxton, Matthew Rae, Shameek Rakshit, and Cynthia Cox
Published: Mar 20, 2023

This analysis of claims data estimates that six in ten people with private health insurance – or about 100 million people – used at least one preventive service covered without any out-of-pocket costs through a provision of the Affordable Care Act (ACA) in a typical year prior to the COVID-19 pandemic (2018).

The provision that requires most private health plans to cover many preventive services without any cost-sharing for their enrollees is being challenged in federal court. The U.S. District Court in the Northern District of Texas in September concluded that aspects of the requirement were unconstitutional and violated religious rights but has allowed the provision to remain in effect while it considers a remedy.

The most commonly received preventive services include vaccinations, well woman and well child visits, and screenings for heart disease, cervical cancer, diabetes, and breast cancer. COVID-19 vaccines are also provided at no cost to patients under the ACA’s preventive services requirement, though how many people will take them up in the future is uncertain.

Women and children are more likely than men to have used at least one no-cost preventive service through their private insurance. The analysis also looks at variations in the use of preventive services in the large group, small group and individual markets. It is available through the Peterson-KFF Health System Tracker, an online information hub that monitors and assesses the performance of the U.S. health system.

Medicaid Coverage of Behavioral Health Services in 2022: Findings from a Survey of State Medicaid Programs

Authors: Madeline Guth, Heather Saunders, Bradley Corallo, and Sophia Moreno
Published: Mar 17, 2023

Medicaid plays a key role in covering and financing care for people with behavioral health conditions. Nearly 40% of the nonelderly adult Medicaid population (13.9 million enrollees) had a mental health or substance use disorder (SUD) in 2020. Most enrollees with behavioral health conditions qualify for Medicaid because of their low incomes. Behavioral health services are not a specifically defined category of Medicaid benefits: some may fall under mandatory Medicaid benefit categories (e.g., psychiatrist services may be covered under the “physician services” category), and states may also cover behavioral health benefits through optional benefit categories (e.g., case management services, prescription drugs, and rehabilitative services). Behavioral health services for children are particularly comprehensive due to Medicaid’s EPSDT benefit for children: children diagnosed with behavioral health conditions receive any service available under federal Medicaid law necessary to correct or ameliorate the condition. However, the same is not required for adults.

To better understand the variation in access to behavioral health services for adults in Medicaid, KFF surveyed state Medicaid officials about behavioral health benefits covered for adult enrollees in their fee-for-service (FFS) programs. These questions were part of KFF’s Behavioral Health Survey of state Medicaid programs, fielded as a supplement to the 22nd annual budget survey of Medicaid officials conducted by KFF and Health Management Associates (HMA). A total of 45 states (including the District of Columbia) responded to the behavioral health benefits survey. This issue brief uses the survey data to describe the landscape of behavioral health service coverage across states, including themes across and within service categories. Additional state-by-state detail is available in KFF’s Medicaid Behavioral Health Services data collection. Further policy context is available in a series of behavioral health briefs that can be accessed in the “Behavioral Health Supplemental Survey” section on this page.

Medicaid coverage of behavioral health services varied moderately across states, with the median number of covered services at 44 of the 55 services queried (Figure 1). We provided state Medicaid officials with a list of 55 behavioral health benefits and asked them to indicate which were covered under their FFS Medicaid programs for adults, as of July 1, 2022 (for more information on survey methods, see Appendix A). We grouped the benefits queried by service category: institutional care/intensive, outpatient, SUD, naloxone (without prior authorization), crisis, integrated care, and other services. Notably, all but one state (SC) reported coverage of at least half of all services queried, with a median coverage rate of four-fifths of all services (44 of 55). These high rates of coverage reflect state trends in recent years to expand Medicaid services across the behavioral health care continuum—however, coverage of services may not translate into access to care, particularly given workforce shortages that make accessibility a challenge for Medicaid enrollees (as well as people with private insurance). We also asked states that reported coverage of each service to indicate any copay requirements as well as notable limits on the services (such as day limits or other utilization controls, including prior authorization requirements).1  Across services, most states reported no copay requirements, but limits were more common.

State Coverage of Behavioral Health (BH) Services in FFS Medicaid, as of July 1, 2022

These findings are limited to FFS Medicaid and do not comprehensively capture variation in coverage for managed care organizations (MCOs) or Section 1115 waivers. Within each service category, we asked states to note differences in coverage for populations receiving services from MCOs or through Section 1115 waivers. Most states continue to rely on MCOs to deliver inpatient and outpatient behavioral health services, and these MCOs may offer services to their adult enrollees that differ from those available on a FFS basis. States also may use Section 1115 waivers to operate their Medicaid programs in ways that differ from what is required by federal statute; these can include “comprehensive” waivers that make broad changes in Medicaid benefits and other program rules or more targeted demonstrations. For state-specific information on behavioral health benefit coverage variation in MCOs or Section 1115 waivers as reported by states, see footnotes on indicators in the data collection. See also Appendix A for a summary of survey methods.

Across responding states, coverage rates were highest for SUD and outpatient services and lowest for crisis services (Figure 2). As indicated in Figure 2, for each service category, the majority of responding states covered more than 50% of the services queried, with at least a few states reporting coverage of 100% of services queried. Some states reported high coverage rates across service categories, including six states that cover more than 90% of all services queried: NY, AZ, OR, MI, NJ, and WV. Each of these states cover all services in multiple of the categories: for example, MI and OR each cover 100% of the services queried in the institutional, outpatient, SUD, and integrated care categories.2 

State Coverage of Behavioral Health (BH) Services in FFS Medicaid

Additional detail on definitions of and trends within each service category, including copays and limits, is included in the bullets below. For a detailed table showing the number of states with coverage of each individual benefit, see Appendix B.

  • Institutional care and intensive services are typically reserved for situations that require a higher level of care and monitoring, such as behavioral health emergencies or long-term treatment for those with ongoing needs. Although a large majority of responding states report coverage of inpatient psychiatric hospital services and 23-hour observation, fewer than half of states report coverage of psychiatric residential treatment and adult group homes. Within this category, limits and copays are most common for psychiatric inpatient care, with more than one-third of covering states reporting limits and nearly one-fifth reporting copays. In states without Section 1115 waivers of the IMD payment exclusion, the number of psychiatric or residential care facilities that accept Medicaid may be restricted.
  • Outpatient services include a wide range of psychiatric services provided in outpatient settings. Services in this category range from psychiatric testing—which may be used to inform diagnosis of mental health conditions—to more intensive services, like partial hospitalization services—a more intensive treatment that occurs multiple times a week on an outpatient basis. While all or nearly all states cover evaluation and testing services as well as individual, family, and group therapy, there is more variation in coverage of ADL/Skills training, case management, and day treatment services. Within this category, states were most likely to report limits for case management and copays for therapy (individual, family, or group).
  • Services to treat SUD were queried in categories that follow the level of care criteria from the American Society of Addiction Medicine (ASAM), ranging from early intervention to more intensive services, such as medically monitored intensive inpatient services (which may be subject to the IMD exclusion). Most states reported the highest coverage rates for SUD services compared to the other categories, likely bolstered by provisions in the SUPPORT Act. Within this category, nearly all states cover outpatient SUD treatment, while states were least likely to cover clinically managed high intensity residential services. As services grow in intensity, the number of states placing limits on the service also increases. Also within this service category, all or nearly all states reported coverage of medications for SUD treatment, including buprenorphine, naltrexone, and methadone. About one-third of states report limits for buprenorphine, but fewer limits are reported for naltrexone, which is not a controlled substance. For most SUD medications, about one-quarter of states report copay requirements (whereas fewer states report copays for services across the ASAM levels).
    • We also asked states to report coverage of naloxone (without prior authorization requirements), which is used to reverse an opioid overdose and is prescribed to people with opioid use disorder, but may be available over the counter in the future. Nearly all states cover at least one formulation of naloxone without a prior authorization. A handful of states place other limits on these prescriptions and fewer than one-third of states require copays. (Data for this service category is not shown in Figure 2, but can be found in Appendix B.)
  • Crisis services provide specialized responses to enrollees experiencing behavioral health emergencies. These services aim to reduce the reliance on law enforcement professionals, emergency departments, and other organizations staffed by people who are not behavioral health professionals. States were less likely to cover crisis services compared to other categories: for most states, crisis services was the category for which the state reported the lowest coverage rate, including several states that reported covering none of the crisis services queried. In contrast, four states (AZ, NM, NY, and TN) reported covering every crisis service queried. The wide range of coverage across states may reflect the emerging nature of crisis management in behavioral health. Within this category, states most frequently covered mobile crisis services (about three-quarters of responding states). This relatively higher coverage rate could be in part connected to the American Rescue Plan Act’sprovision of a new option and enhanced funding for states to provide community-based mobile crisis intervention services.
  • Integrated care services provide behavioral health care in conjunction with physical health care. Examples include mental health screening in primary care settings and psychiatric evaluation with medical services. Traditionally, physical and behavioral health services have been delivered separately, but a growing body of evidence supports their integration. Coverage of services in this category varies; collaborative care model services are covered least frequently and psychiatric evaluations with medical services, as well as Medicaid individual/family counseling, are covered most often. For most integrated care services, few states reported copays, and limits were somewhat more common (fewer than one-fifth of states).

We also asked states to report coverage of a few additional behavioral health benefits in an “other” category. For example, more than four-fifths of responding states cover peer support services, which are provided by individuals who have personally experienced behavioral health challenges. These professionals may help enrollees with emotional support or navigation of health care or other social services. Peer supports has been identified as one method that states are using to extend the Medicaid behavioral health workforce.

Looking ahead, states may continue the trend of expanding Medicaid behavioral health benefits and may also enhance access to behavioral health care through other programs or policies. Since FY 2016, behavioral health benefits have been the most frequent category of service expansions reported on KFF’s annual Medicaid budget survey. For example, in FY 2022 and/or FY 2023, a number of states reported expanding coverage of crisis services and/or of services aimed to improve the integration of physical and behavioral health care. As access to behavioral health care is a key Medicaid priority at both the state and federal levels, these trends are likely to continue into the future. Notably, comprehensive coverage of behavioral health services has been linked to higher Medicaid acceptance rates by providers. In addition to further expanding coverage of behavioral health services, states may take additional policy actions to increase access and improve outcomes for enrollees with behavioral health conditions. For example, states may pursue initiatives to address behavioral health workforce shortages, such as by adopting permanent expansions of behavioral health telehealth policy to facilitate access to care. State Medicaid agencies may also play a role in developing, implementing, and helping to fund a statewide crisis system, including 988 crisis hotline services. KFF surveyed states on these and other behavioral health policies, with the results to be published in a series of briefs that can be accessed in the “Behavioral Health Supplemental Survey” section on this page. Finally, in addition to state Medicaid policy, federal legislation could continue to shape the behavioral health landscape for Medicaid enrollees.

This work was supported in part by Well Being Trust. KFF maintains full editorial control over all of its policy analysis, polling, and journalism activities.

This brief draws on work done under contract with Health Management Associates (HMA) consultants Angela Bergefurd, Gina Eckart, Kathleen Gifford, Roxanne Kennedy, Gina Lasky, and Lauren Niles.

Appendix A: Methodology

KFF contracted with Health Management Associates (HMA) to survey Medicaid directors in all 50 states and the District of Columbia to identify those behavioral health services covered for adult beneficiaries in their programs. The survey instrument captured information about services covered, copay requirements, and notable limits on those services as of July 1, 2022. The survey data is summarized in this brief and published on a state-by-state basis in KFF’s Medicaid Behavioral Health Services data collection. This data reflects what the states reported on the survey; responses vary in level of detail and were not verified through another source.

The survey asked states to report coverage of services in their fee-for-service (FFS) programs for categorically needy (CN) traditional Medicaid adults ages 21 and older. The survey did not ask about service coverage for medically needy (MN) coverage groups, which may differ from the state’s CN benefit package. Children were excluded from the survey because all children under age 21 enrolled in Medicaid through the categorically needy pathway are entitled to the Early and Periodic Screening, Diagnostic, and Treatment (EPSDT) benefit, which requires states to cover all screening services for children as well as any services “necessary… to correct or ameliorate” a child’s physical or mental health condition (regardless of whether the service is covered for adults). All but six states (AR, DE, GA, MN, NH, UT) submitted survey responses, though in some instances a responding state may have left a particular service row blank. The territories are not included in the data.

We provided states with a list of 55 optional Medicaid behavioral health services. For each service, the state selected from a yes/no dropdown menu on the survey to indicate whether the service was covered. The list of behavioral health services included in this survey was based on the services queried by KFF in a similar 2018 survey; the 2018 data is available in the data collection. While we have posted data for both years, the data should not be compared across years as a trend due to changes in question phrasing over time.

Note that while this survey focused on coverage in FFS, most states continue to rely on MCOs to deliver inpatient and outpatient behavioral health services, and these MCOs may offer services to their adult enrollees that differ from those available on a FFS basis. States had an opportunity on the survey to note differences in required minimum benefits for MCOs, as well as differences in benefit coverage under Alternative Benefit Plans (benefit plans that Medicaid expansion states are required to design, in line with federal guidelines, for newly eligible ACA expansion adults) or Section 1115 waiver programs. To the extent that they were reported, these notes are included in the data collection as state-specific footnotes. However, the level of comprehensiveness of states’ responses in capturing these differences varies, and the level of information provided is likely inconsistent across states. Therefore, while the state-specific footnotes may provide useful context about coverage in an individual state, they should not be taken as a complete list of differences in benefit coverage under managed care, Alternative Benefit Plans, or Section 1115 waiver programs nationally.

Additional information on Medicaid coverage of behavioral health services is available here and here.

Appendix B: Summary Table

Medicaid Behavioral Health Services: National Summary Counts - Institutional Care and Intensive Services
  1. Specifically, we asked states to describe any “notable limits on services or days or other utilization controls.” This question was open to state interpretation, so limits may not be consistently reported across states. ↩︎
  2. Also, NY covers all services in the crisis, SUD, and integrated care categories; AZ covers all services in the institutional, outpatient, crisis, and SUD categories; NJ covers all services in the institutional, outpatient, and integrated care categories; and WV covers all services in the outpatient and SUD categories. ↩︎
News Release

As State Medicaid Programs Prepare to Resume Disenrollments, Many States Are Using a Range of Strategies to Make it Easier for People Who Remain Eligible to Retain Coverage, But in Others it Will be More Difficult

Annual 50-State Survey Looks at Medicaid Eligibility, Enrollment, and Renewal Policies

Published: Mar 16, 2023

With pandemic-era protections for Medicaid enrollees set to expire this month, state Medicaid programs are gearing up to resume eligibility checks and disenrollments. But how the unwinding of the federal continuous enrollment provision affects enrollees and state budgets will vary according to states’ differing approaches and administrative capabilities, a new KFF survey finds.

The 21st annual KFF survey of state Medicaid and Children’s Health Insurance (CHIP) Program officials finds that many states are using an array of strategies to promote continuity of coverage, while other states have adopted policies that may make it harder for people who are still eligible to retain coverage. Staffing shortages and systems limitations could also affect whether eligible enrollees are able to remain enrolled.

The survey, conducted by KFF in collaboration with the Georgetown University Center for Children and Families, presents a snapshot of actions that states are taking to prepare for the unwinding of the provision that has paused Medicaid disenrollments since February 2020. It also highlights states’ Medicaid eligibility, enrollment, and renewal policies and procedures in place as of January 2023.

KFF has estimated that enrollment in Medicaid and CHIP will have grown by 23.3 million enrollees, to nearly 95 million, by the end of March when the continuous enrollment provision expires. Millions of beneficiaries are expected to be disenrolled over the next year, including some who are no longer eligible for Medicaid and others who still qualify but lose coverage due to administrative paperwork problems.

In the new survey, the one-third of states that were able to report projected coverage losses estimate that about 18 percent of Medicaid enrollees will be disenrolled after the continuous enrollment provision ends. The estimates range from seven percent to 33 percent of total enrollees and are consistent with other estimates that about 15 million people may lose Medicaid coverage over the coming year.

There is variation in the strategies states are adopting that could affect the amount of coverage losses, including:

  • Taking 12-14 months to complete renewals following the end of the continuous enrollment provision (43 states). Taking more time can help prevent inappropriate terminations of those who are still eligible but could maintain enrollment of ineligible people for longer.
  • Improving rates of renewals using ex parte processes that use reliable data sources — such as the Federal Data Services Hub and Supplemental Nutrition Assistance Program (SNAP) information — to verify ongoing eligibility, reducing the administrative burden on both states and enrollees (30 states).
  • Contacting enrollees when renewal action is needed and following up with those who don’t respond (36 states). About half of the states (27) have been flagging individuals who may no longer be eligible or who did not respond to renewal requests.
  • Adopting continuous eligibility policies for children, postpartum and for some adults that will help more people retain coverage during the unwinding. A total of 37 states have extended postpartum coverage to 12 months and 26 states provide 12-month continuous eligibility to some or all children in Medicaid and CHIP.

At the same time, some states have not adopted these strategies. Several states lack fully automated systems, processing some or most renewals manually (12 states) and others have ex parte renewal rates below 25 percent (11 states), which will increase the administrative burden on staff and enrollees. Even among states that adopt policies to promote continuity of coverage, implementation of policies and systems capacity will be key in how enrollees fare during the unwinding.

The challenge of processing an unprecedented volume of eligibility renewals and disenrollments comes at a time when most state Medicaid programs face significant staffing challenges. The survey finds that more than half of reporting states have staff vacancy rates greater than 10 percent for eligibility workers (16 of 26 reporting states) and slightly less than half for call center staff (13 of 28 reporting states).

These and other findings from the survey will be discussed today at a public web briefing. An archived video recording of the briefing will be available on kff.org later today.

The full survey report, “Medicaid and CHIP Eligibility and Enrollment Policies as States Prepare for the Unwinding of the Pandemic-Era Continuous Enrollment Provision,” includes state-level data about Medicaid and CHIP eligibility in every state. Also available are other recent KFF analyses related to the end of the continuous enrollment provision, including “Unwinding the Continuous Enrollment Provision: Perspectives from Current Medicaid Enrollees” and “Medicaid Enrollment Growth: Estimates by State and Eligibility Group Show Who may be at Risk as Continuous Enrollment Ends.

News Release

Annual Update of Key Health Data Collection by Race and Ethnicity, Now Including Mental Health Measures

Published: Mar 15, 2023

The annual update of KFF’s collection of wide-ranging data on health and health care by race and ethnicity is now available, and this year includes measures on mental health care access, mental illness, substance use disorder, suicide rates, and drug overdose death rates.

The handy reference, “Key Data on Health and Health Care by Race and Ethnicity,” has nearly 50 charts and up to 70 data measures that highlight the scale and scope of disparities among six racial and ethnic groups in three broad categories: health coverage and access to and use of care; health status, outcomes, and behaviors; and social determinants of health.

When the measures are examined collectively to see how Asian, Hispanic, Black, American Indian and Alaska Native (AIAN), and Native Hawaiian and Other Pacific Islander (NHOPI) people fare compared to White people, readers can see the extent of disparities experienced by specific groups. For example, Black people fared worse than White people in 55 measures of health and health care and Hispanic people fared worse than White people in 44 of them. However, the data may mask disparities faced by subgroups within these broad racial and ethnic categories. For example, while Asian people fare the same or better than White people on many measures, certain ethnic subgroups of Asian people may fare worse. Further, ongoing data gaps and limitations hinder the ability to have a comprehensive understanding of the experiences of smaller groups, such as AIAN and NHOPI people.

The overview of how specific racial/ethnic groups fared compared to White people is a gateway to explore the detailed findings, some of which have received attention or policy action recently:

  • Among adults with any mental illness, Black (39%), Hispanic (36%), and Asian (25%) adults were less likely than White (52%) adults to receive mental health services as of 2021.
  • 2020 data reflect that AIAN people had the highest rates of drug overdose deaths compared with all other racial and ethnic groups. Drug overdose death rates among Black people exceeded rates for White people as of 2020, reflecting larger increases among Black people in recent years.
  • Although Black people did not have higher cancer incidence rates than White people overall and across most types of cancer that were examined, they were more likely to die from cancer.
  • At birth, AIAN and Black people had a shorter life expectancy compared to White people as of 2021, and AIAN, Hispanic, and Black people experienced larger declines in life expectancy than White people between 2019 and 2021. These life expectancy trends may matter in any discussion of increasing the age of eligibility for Medicare.
  • Black infants were more than two times as likely to die as White infants, and AIAN infants were nearly twice as likely to die as White infants as of 2021. Black and AIAN women also had the highest rates of pregnancy-related mortality.

The Estimated Value of Tax Exemption for Nonprofit Hospitals Was About $28 Billion in 2020

Published: Mar 14, 2023

Editor’s note: This analysis was revised on March 27, 2023 to account for data anomalies and incorporate corrections, including to our estimate of the value of property tax exemption. These corrections result in a modest increase in the total estimated value of tax exemption, from $27.6 to $28.1 billion.

Over the years, some policymakers have questioned whether nonprofit hospitals—which account for nearly three-fifths (58%) of community hospitals—provide sufficient benefit to their communities to justify their exemption from federal, state, and local taxes. This issue has been the subject of renewed interest in light of reports of nonprofit hospitals taking aggressive steps to collect unpaid medical bills, including suing patients over unpaid medical debt, including patients who are likely eligible for financial assistance. Further, recent research indicates that nonprofit hospitals devote a similar or smaller share of their operating expenses to charity care in comparison to for-profit hospitals. In light of these concerns, several policy ideas have been floated to better align the level of community benefits provided by nonprofit hospitals with the value of their tax exemption.

This data note provides an estimate of the value of tax exemption for nonprofit facilities based on hospital cost reports, filings with the Internal Revenue Service (IRS), and American Hospital Association (AHA) survey data (see Methods for additional details). We define the value of tax exemption as the benefit of not having to pay federal and state corporate income taxes, typically not having to pay state and local sales taxes and local property taxes, and any increases in charitable contributions and decreases in bond interest rate payments that might arise due to receiving tax-exempt status. (For additional information, see Methods.)

Results

The total estimated value of tax exemption for nonprofit hospitals was about $28 billion in 2020 (Figure 1). This represented over two-fifths (44%) of net income (i.e., revenues minus expenses) earned by nonprofit facilities in that year. To put the value of tax exemption in perspective, our estimate is similar to the total value of Medicare and Medicaid disproportionate share hospital (DSH) payments in the same year ($31.9 billion in fiscal year 2020) (i.e., supplemental payments to hospitals that care for a disproportionate share of low-income patients which are intended, in part, to offset the costs of charity care and other uncompensated care).

The total estimated value of tax exemption for nonprofit hospitals was about $28 billion in 2020

The estimated value of federal tax-exempt status was $14.4 billion in 2020, which represents about half (51%) of the total value of tax exemption. This is primarily due to the estimated value of not having to pay federal corporate income taxes ($10.3 billion). In addition, we assumed that individuals contribute more to tax-exempt hospitals because they can deduct donations from their income tax base ($2.5 billion) and issue bonds at lower interest rates because the interest is not taxed ($1.6 billion). Our estimates of changes in charitable contributions and interest rates on bonds only account for federal tax rates for simplicity and may therefore understate the total value of tax exemption because they do not account for the effects of state taxes.

The total estimated value of state and local tax-exempt status was $13.7 billion in 2020, which represents about half (49%) of the total value of tax exemption. This amount includes the estimated value of not having to pay state or local sales taxes ($5.7 billion), local property taxes ($5.0 billion) or state corporate income taxes ($3.0 billion).

The total estimated value of tax exemption (about $28 billion) exceeded total estimated charity care costs ($16 billion) among nonprofit hospitals in 2020 (Figure 2), though charity care represents only a portion of the community benefits reported by these facilities. Hospital charity care programs provide free or discounted services to eligible patients who are unable to afford their care and represent one of several different types of community benefits reported by hospitals. TheInternal Revenue Service (IRS) also defines community benefits to include unreimbursed Medicaid expenses, unreimbursed health professions education, and subsidized health services that are not means-tested, among other activities. One study estimated that the value of tax exemption exceeded the value of community benefits broadly for about one-fifth (19%) of nonprofit hospitals during 2011-2018 or about two-fifths (39%) when considering the incremental value of community benefits provided relative to for-profit facilities. Other research suggests that nonprofit hospitals devote a similar or smaller share of their operating expenses to charity care and unreimbursed Medicaid costs—which accounted for most of the value of community benefits in 2017—when compared to for-profit hospitals.

The total estimated value of tax exemption (about $28 billion) exceeded total estimated charity care costs ($16 billion) among nonprofit hospitals in 2020, though charity care represents only a portion of the community benefits reported by these facilities

The value of tax exemption grew from about $19 billion in 2011 to about $28 billion in 2020, representing a 45 percent increase (Figure 3). The value of tax exemption increased in most of the years (7 out of 9) in our analysis, though there was a notable decrease of $5.8 billion in 2018. The largest single-year increase was $4.1 billion in 2020. The large decrease in the value of tax exemption in 2018 coincided with the implementation of the Tax Cuts and Jobs Act of 2017, which permanently reduced the federal corporate income tax rate from 35 to 21 percent and therefore decreased the value of being exempt from federal income taxes.

The value of tax exemption grew from about $19 billion in 2011 to about $28 billion in 2020, representing a 45 percent increase

The large increase in the value of tax exemption in 2020 overlapped with the start of the COVID-19 pandemic. This increase primarily reflects a large increase in aggregate net income for nonprofit hospitals in 2020. Although there were disruptions in hospital operations in 2020, hospitals received substantial amounts of government relief, and it is possible that other sources of revenue, such as from investment income, may have also increased. Increases in net income in turn increased the value of not having to pay federal and state income taxes.

Increases in the estimated value of tax exemption over time also reflect net income growth that preceded the pandemic as well as increases in estimated property values, supply expenses, and charitable contributions, each of which would carry tax implications if hospitals lost their tax-exempt status (e.g., with some supply expenses being subject to sales taxes). Even when setting aside the strong financial performance of nonprofit hospitals in 2020 as a potential outlier, total net income among nonprofit facilities increased substantially in the preceding years, before increasing further in 2020. Although we are not able to directly observe the value of the real estate owned by hospitals, the estimated value of exemption from local property taxes—which is based on our analysis of property taxes paid by for-profit hospitals—increased by 63 percent from 2011 to 2019. Finally, the supply expenses in our analysis increased by 44 percent and charitable contributions increased by 49 percent from 2011 to 2019.

Discussion

The estimated value of tax exemption for nonprofit hospitals increased from about $19 billion in 2011 to about $28 billion in 2020. The rising value of tax exemption means that federal, state, and local governments have been forgoing increasing amounts of revenue over time to provide tax benefits to nonprofit hospitals, crowding out other uses of those funds. This has raised questions about whether nonprofit facilities provide sufficient benefit to their communities to justify this tax benefit. Federal regulations require, among other things, that nonprofit hospitals provide some level of charity care and other community benefits as a condition of receiving tax-exempt status. However, a 2020 Government Accountability Office (GAO) report raised questions about whether the government has adequately enforced this requirement. Further, some argue that the federal definition of “community benefits” is too broad—e.g., by including medical training and research that could benefit hospitals directly—though others believe that the definition is too narrow. Most states have additional community benefit requirements for nonprofit or broader groups of hospitals—such as providing charity care to patients below a specified income threshold—though there is little information about the effectiveness of these regulations or the extent to which they are enforced.

Several policy ideas have been floated at the federal and state level that would increase the regulation of community benefits spending among nonprofit hospitals or among hospitals more generally. These include proposals to create or expand state requirements that hospitals provide charity care to patients below a specified income threshold, mandate that nonprofit hospitals provide a minimum amount of community benefits, establish a floor-and-trade system where hospitals would be required to either provide a minimum amount of charity care or subsidize other hospitals that do so, create mechanisms to increase the uptake of charity care, expand oversight and enforcement of community benefit requirements, replace current tax benefits with a subsidy that is tied to the value of community benefits provided, and introduce reforms intended to better align community benefits with local or regional needs. These policy options would inevitably involve tradeoffs. While they may expand the provision of certain community benefits, hospitals would incur new costs as a result, which could in turn have implications for what services they offer, how much they charge commercially insured patients, and how much they invest in the quality of care.

Methods

Our analysis defined the value of tax exemption as the benefit of not having to pay federal or state corporate income taxes, typically not having to pay state and local sales taxes and local property taxes, and any increases in charitable contributions and decreases in bond interest rate payments that might arise due to receiving tax-exempt status. To estimate the value of these benefits, we drew on methods from three studies and a report commissioned by the American Hospital Association (AHA). As is the case with prior work, we assumed that nonprofit hospitals and health systems would take various allowed deductions if they were required to pay taxes, but we do not capture all nuances of the tax code, nor do we model any other actions that hospitals take to reduce their tax burden, such as by changing how they operate or changing how they account for revenues and expenses. Two of the studies that we draw from estimated the total value of tax exemption or of federal tax exemption. Our estimates are smaller than these amounts, which likely reflects aspects of our approach that are more conservative than these papers. We detail our specific approach for each component below.

As a starting point, we relied on RAND Hospital Data, which applies cleaning and processing steps to annual cost report data submitted by hospitals to the Healthcare Cost Report Information System (HCRIS). Every Medicare-certified hospital must submit a cost report to a Medicare Administrative Contractor (MAC) under contract with the Centers for Medicare & Medicaid Services (CMS), meaning that HCRIS pulls data from all US hospitals except federal hospitals and some children’s hospitals. We used the calendar year version of RAND Hospital Data, which apportions data from different cost reports for hospitals that do not use a calendar year reporting period. For example, 2019 data reflect the weighted average of hospital finances during various periods from 2018 through 2020 (i.e., both before and during the COVID-19 pandemic) for a subset of hospitals. We excluded hospitals in the U.S. Territories and hospitals that did not report positive operating expenses in a given year (about 0.3% of remaining hospitals). We also relied on the AHA Annual Survey Database and IRS Form 990 data, focusing on hospitals and systems that we were able to match to RAND Hospital Data. We imputed values for supply expenses, charitable contributions, and tax-exempt bonds in instances where data were missing or unavailable for a given hospital or health system or year. We did not attempt to impute net income when missing (about 1.0% of remaining hospitals).

Federal corporate income tax. We estimated the federal corporate income tax that a given nonprofit hospital or health system would have to pay without the tax exemption by multiplying an estimate of taxable income by the federal corporate income tax rate, which was 35 percent from 2011 through 2017 but decreased to 21 percent in 2018. Our estimate of taxable income reflects the difference between revenues and expenses, accounting for deductions allowed under the federal tax code for interest rate payments, state corporate income taxes, state and local sales taxes, and local property taxes and adjusting for estimated changes in charitable contributions and bond interest rate payments. Hospitals may report unrealized gains or losses on financial instruments, which do not affect their tax base, as part of their net income. We aggregated hospital level data to the system level, as applicable, before estimating tax benefits. Aggregate estimates of tax benefits are lower when calculated at the system versus hospital level, as systems may be able to offset taxable profits from one system member with losses from another. We also modeled options for businesses to offset taxable income with losses in earlier and later years. Other studies have used an alternative approach that multiplies net income by estimates of effective tax rates based on tax filings from for-profit hospitals, nursing homes, and residential care facilities. Using this approach would have increased our estimates by $3.6 billion. We chose our approach because it is more closely tied to financial data from nonprofit hospitals.

State corporate income tax. We estimated the state corporate income tax that a given nonprofit hospital or health system would have to pay without tax exemption by multiplying an estimate of their taxable income in a given state by the state corporate income tax rate. We used a similar approach to estimating taxable income as above, except that we did not deduct the state corporate income tax (by definition) and we did not allow entities to offset taxable income with losses from later years, in line with state law. We obtained state corporate income tax rates by year from the Tax Foundation.

State and local sales taxes. We estimated the state and local sales taxes that a given nonprofit hospital or health system would have to pay without tax exemption by multiplying their total non-pharmaceutical supply expenses (or, for a system, the total supply expenses among member hospitals in a given state) by the average state and local sales tax rate in that state. We obtained total non-pharmaceutical supply expenses from the AHA Annual Survey Database. We obtained average state and local tax rates by state and year from the Tax Foundation.

Property taxes. We estimated the local property taxes that a given nonprofit hospital would have to pay without the tax exemption based on the amount paid by for-profit hospitals that reported this information. In the small number of states with five or more for-profit hospitals, we calculated the median ratio of property taxes to operating expenses among for-profit hospitals for a given state and year and then multiplied this amount by the operating expenses for a given nonprofit hospital. In states with fewer than five for-profit hospitals, we instead relied on the national median ratio among for-profit hospitals.

Charitable contributions. If nonprofit hospitals were no longer tax-exempt, donors who take itemized deductions for income taxes would no longer be able to deduct their contributions. We assumed that donors would decrease their contributions by an amount equal to their tax increase. We estimated this amount by multiplying charitable contributions by the estimated average household marginal tax rate of donors to health care organizations (32% from 2011 to 2017 and 23% from 2018 to 2020). Our 2011 to 2017 estimate of the marginal tax rate comes from a previous study. We updated this amount for 2018 to 2020 based on a Tax Policy Center estimate of the decrease in the average effective marginal tax rate for all donors in 2018 as a result of changes to the tax code. We estimated charitable contributions from Internal Service Revenue (IRS) Form 990 data by subtracting government grants and in-kind contributions from total contributions, gifts, grants, and other related amounts.

Bond interest rate payments. We assumed that, if interest rate payments from hospitals to bondholders were taxed, issuers would increase interest rates accordingly. We estimated the difference between taxable and non-taxable interest rates by: (1) estimating the average taxable interest rate using a rolling average of the Moody’s Seasoned Aaa and Baa index over the previous 10 years, (2) assuming a marginal tax rate for investors of 24 percent (based on a Capital Group post suggesting that municipal bonds are a better investment than taxable bonds for individuals with a marginal tax rate of 24% or higher), (3) assuming that average bond interest rates for nonprofit hospitals are equal to the after-tax bond interest rates among for-profit hospitals (so that investors are indifferent between the two), and (4) taking the difference. To estimate the value to a given hospital of paying lower interest rates, we multiplied the difference by the total value of tax-exempt bonds issued, which we obtained from IRS Form 990 data.

We used RAND Hospital Data to estimate charity care costs in 2020 based on amounts reported by the hospitals in our tax exemption analysis. HCRIS instructions indicate that hospitals should report amounts related to both their charity care and uninsured discounts as part of their charity care costs. After cleaning these data, we imputed values in instances where data were missing.

This work was supported in part by Arnold Ventures. KFF maintains full editorial control over all of its policy analysis, polling, and journalism activities.