Medicare Beneficiaries: A Population At Risk – Findings from the Kaiser/Commonwealth 1997 Survey of Medicare Beneficiaries
Medicare Beneficiaries: A Population at Risk
Findings from the Kaiser/Commonwealth Fund 1997 Survey of Medicare Beneficiaries
Charts for Medicare Beneficiaries: A Population at Risk Part 2
Cathy Schoen, Patricia Neuman, Michelle Kitchman,
Karen Davis, and Diane Rowland
December 1998
Table Of Contents
List of Charts
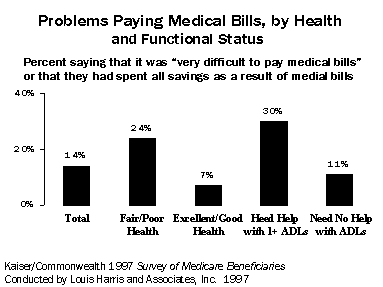
Chart 16 Problems Paying Medical Bills, by Health and Functional Status
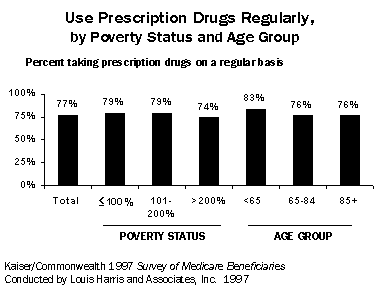
Chart 18 Use Prescription Drugs Regularly, by Poverty Status and Age Group
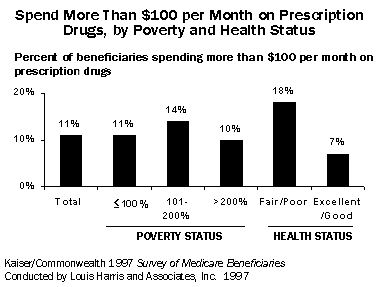
Chart 19 Spend More Than $100 per Month on Prescription Drugs, by Poverty and Health Status
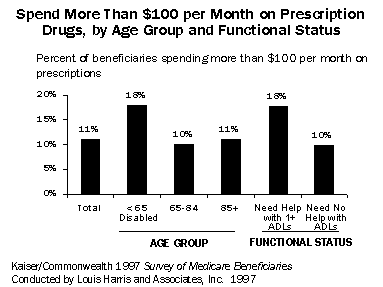
Chart 20 Spend More Than $100 per Month on Prescription Drugs, by Age Group and Functional Status
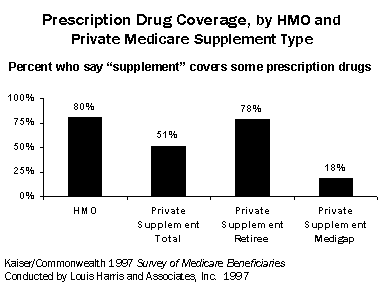
Chart 21 Prescription Drug Coverage, by HMO and Private Medicare Supplement Type
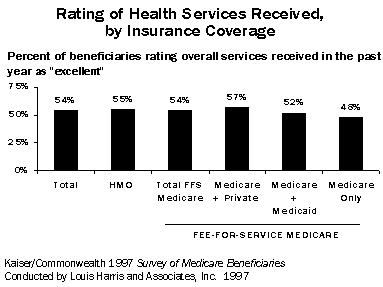
Chart 22 Rating of Health Services Received, by Insurance Coverage
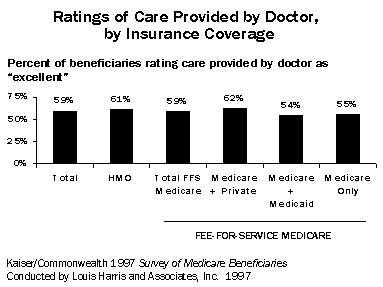
Chart 23 Rating of Care Provided by Doctor, by Insurance Coverage
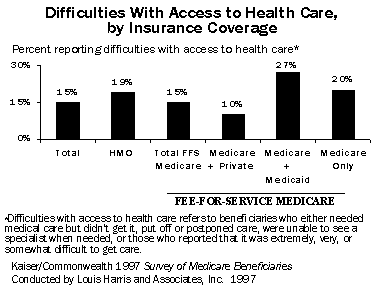
Chart 24 Difficulties with Access to Health Care, by Insurance Coverage
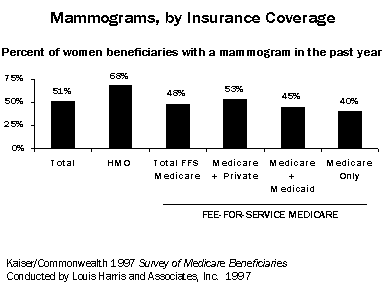
Chart 25 Mammograms, by Insurance Coverage
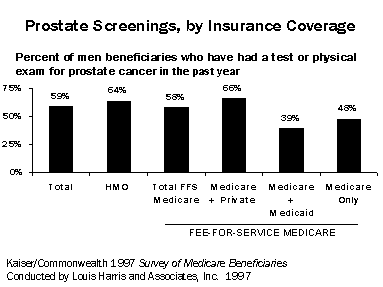
Chart 26 Prostate Screenings, by Insurance CoverageImplications
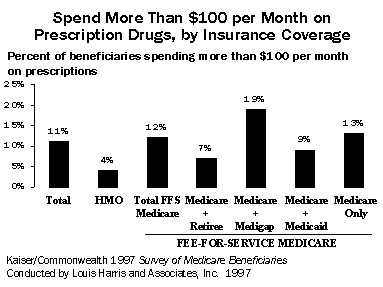
Chart 27 Spend More Than $100 per Month on Prescription Drugs, by Insurance Coverage
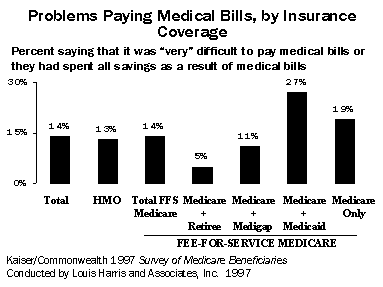
Chart 28 Problems Paying Medical Bills, by Insurance Coverage
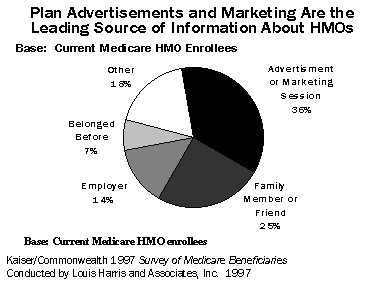
Chart 30 Plan Advertisements and Marketing Are the Leading Source of Information About HMOs
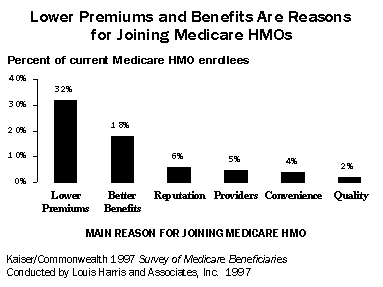
Chart 31 Lower Premiums and Better Benefits Are Reasons for Joining Medicare HMOs
Report Appendix B: Charts Part 1 Appendix B: Charts Part 2
Appendix C: Tables Part 1 Appendix C: Tables Part 2
Medicare Beneficiaries: A Population at Risk
Library Index