Behavioral Health Crisis Response: Findings from a Survey of State Medicaid Programs

Authors: Heather Saunders, Madeline Guth, and Nirmita Panchal
Published: May 25, 2023

Recent efforts to develop and improve behavioral health crisis response systems have been marked by several key federal initiatives. These include national guidelines for crisis care put forth by SAMHSA in 2020, an initiative for states to use Medicaid funding for mobile crisis services through the American Rescue Plan Act (ARPA) in 2021, and the 988 crisis line rollout in 2022. Most recently, the Consolidated Appropriations Act–passed in December 2022– included several provisions aimed at enhancing and evaluating the behavioral health crisis continuum. This surge in action has grown in light of longstanding and worsening behavioral health issues, tragic incidents involving law enforcement, and growing reports of psychiatric boarding in emergency departments (EDs).

Medicaid – the single largest payer of behavioral health services in the country – is particularly well positioned to partner with state behavioral health authorities and other stakeholders to plan, implement, and monitor the behavioral health crisis response systems.  Further, the Medicaid population may be particularly impacted by these changes, as 39% have mild, moderate, or severe mental health or substance use disorder conditions.

To better understand the development, implementation, and coverage of crisis services in state Medicaid programs, KFF conducted a Behavioral Health Survey of state Medicaid programs as a supplement to its 22nd annual budget survey of Medicaid officials conducted by KFF and Health Management Associates (HMA). We surveyed state Medicaid officials about the services that were in place in state fiscal year (FY) 2022 or implemented/planned for FY 2023, as well as challenges they face. Forty-four states (including the District of Columbia) responded to the survey, although response rates varied by question. This issue brief utilizes this survey data to answer three key questions:

  • What are the core behavioral health crisis services and how often are they covered by states?
  • Are states pursuing opportunities for enhanced federal funding for crisis services?
  • What challenges are confronting Medicaid programs in the implementation and delivery of crisis services?

Background

Crisis behavioral health services provide access to trained mental health professionals for individuals experiencing mental health or substance use emergencies–an alternative to emergency departments and law enforcement. Literature has shown that crisis services divert people away from psychiatric hospitalization and reduce the need for intervention within emergency departments or by law enforcement. It is estimated that law enforcement officers spend a sizable amount of their time responding to behavioral health calls, while ED visits for behavioral health reasons continue to rise; however, professionals in these settings are generally not equipped to treat mental health conditions or safely de-escalate crises. Without access to necessary evidence-based care, mental health crises can worsen or prolong.

National guidelines identify three core crisis services that should be accessible to anyone who is experiencing a behavioral health crisis: crisis hotlines, mobile crisis units, and crisis stabilization. While crisis residential and crisis respite services are a part of the crisis continuum and may also provide interventions to help to stabilize crisis, they are not considered core services. Although these crisis services do not necessarily have to be accessed in a specific order, Crisis Now illustrates how they may be accessed and used.  Core crisis services are described below in Table 1:

Behavioral Health Core Crisis Services

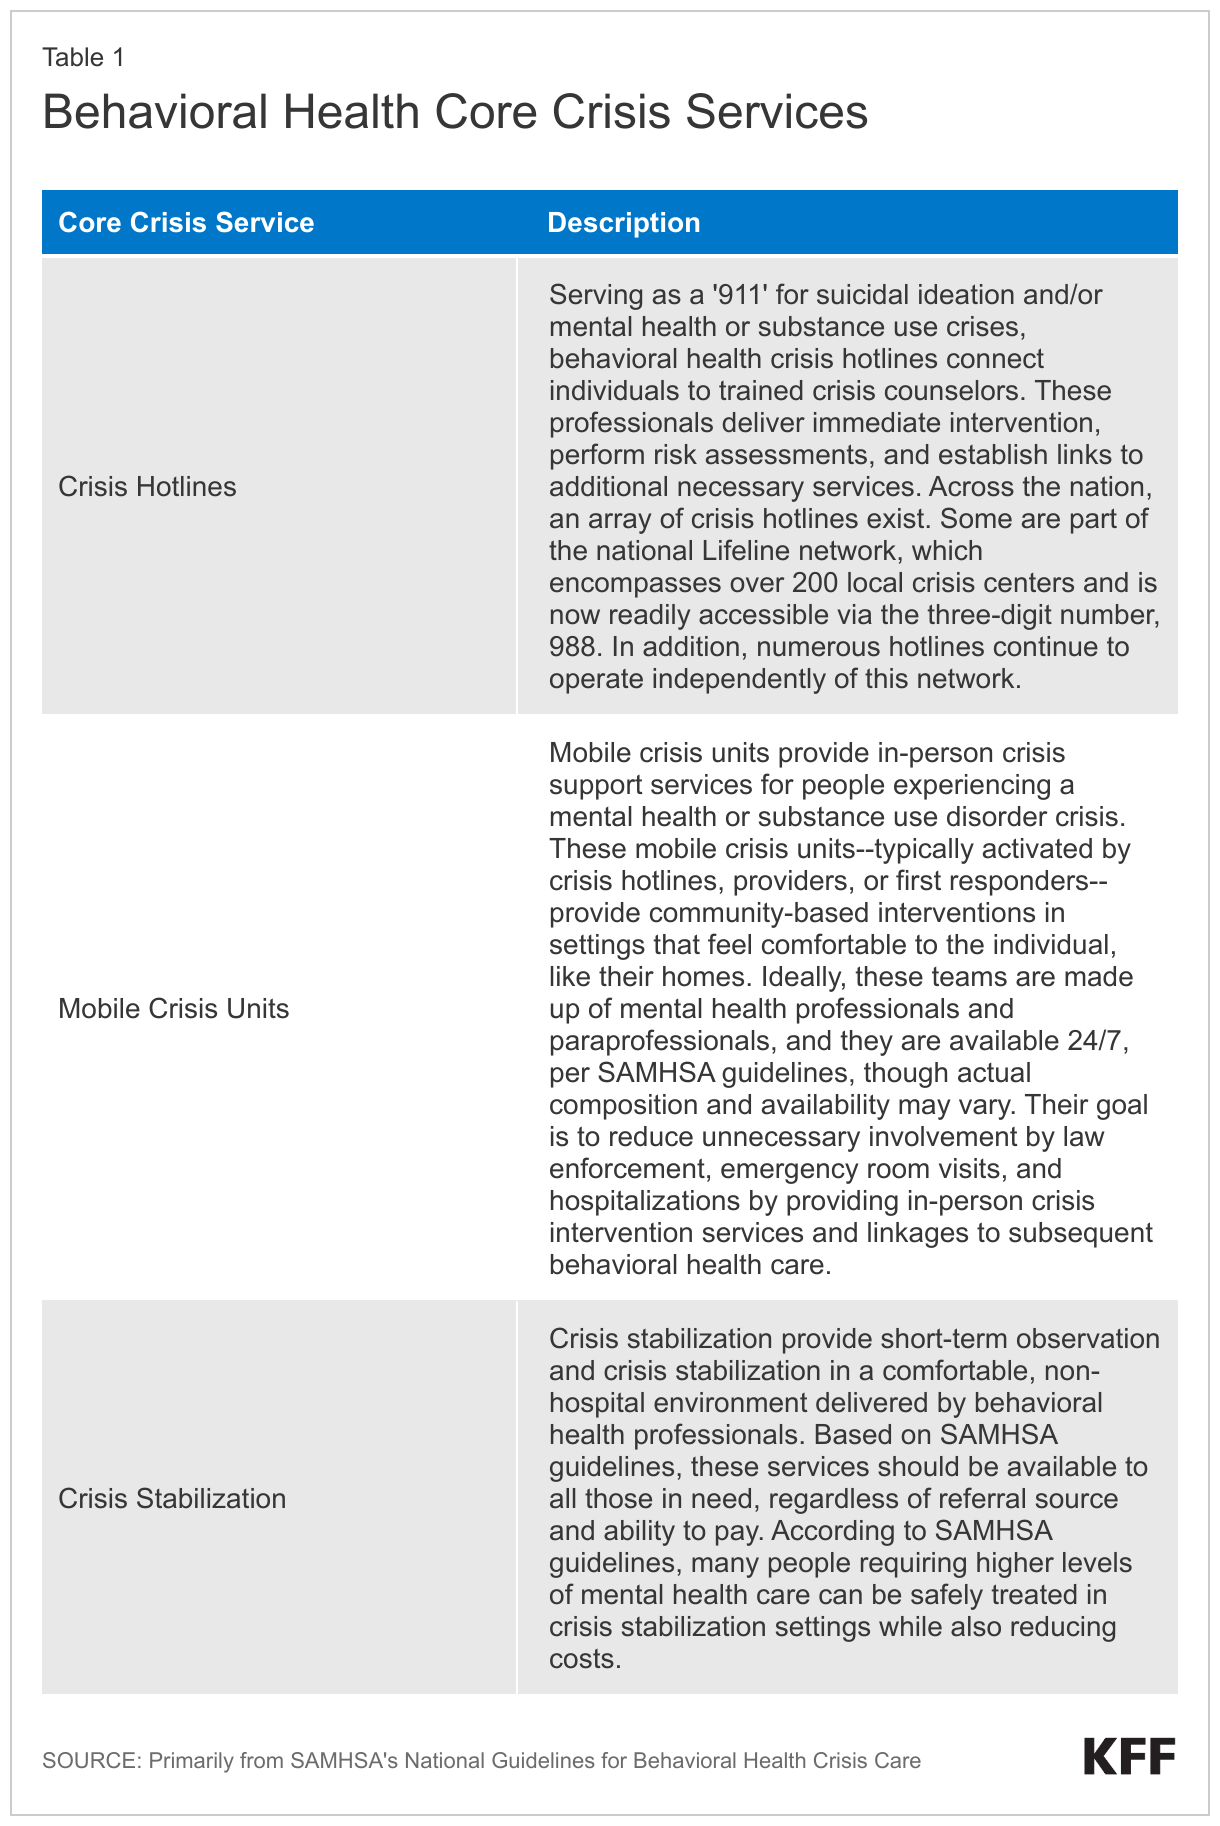
SAMHSA’s national guidelines report that integration of services across systems will reduce fragmentation and improve care transitions. Examples of technology and integration that may help include a system for assessing crisis levels, a crisis bed registry, GPS mobile crisis dispatch, and the ability for crisis staff to schedule appointments. Further, data dashboards may provide ongoing insights into service utilization and impact of crisis services.

Medicaid Coverage of Core Crisis Services

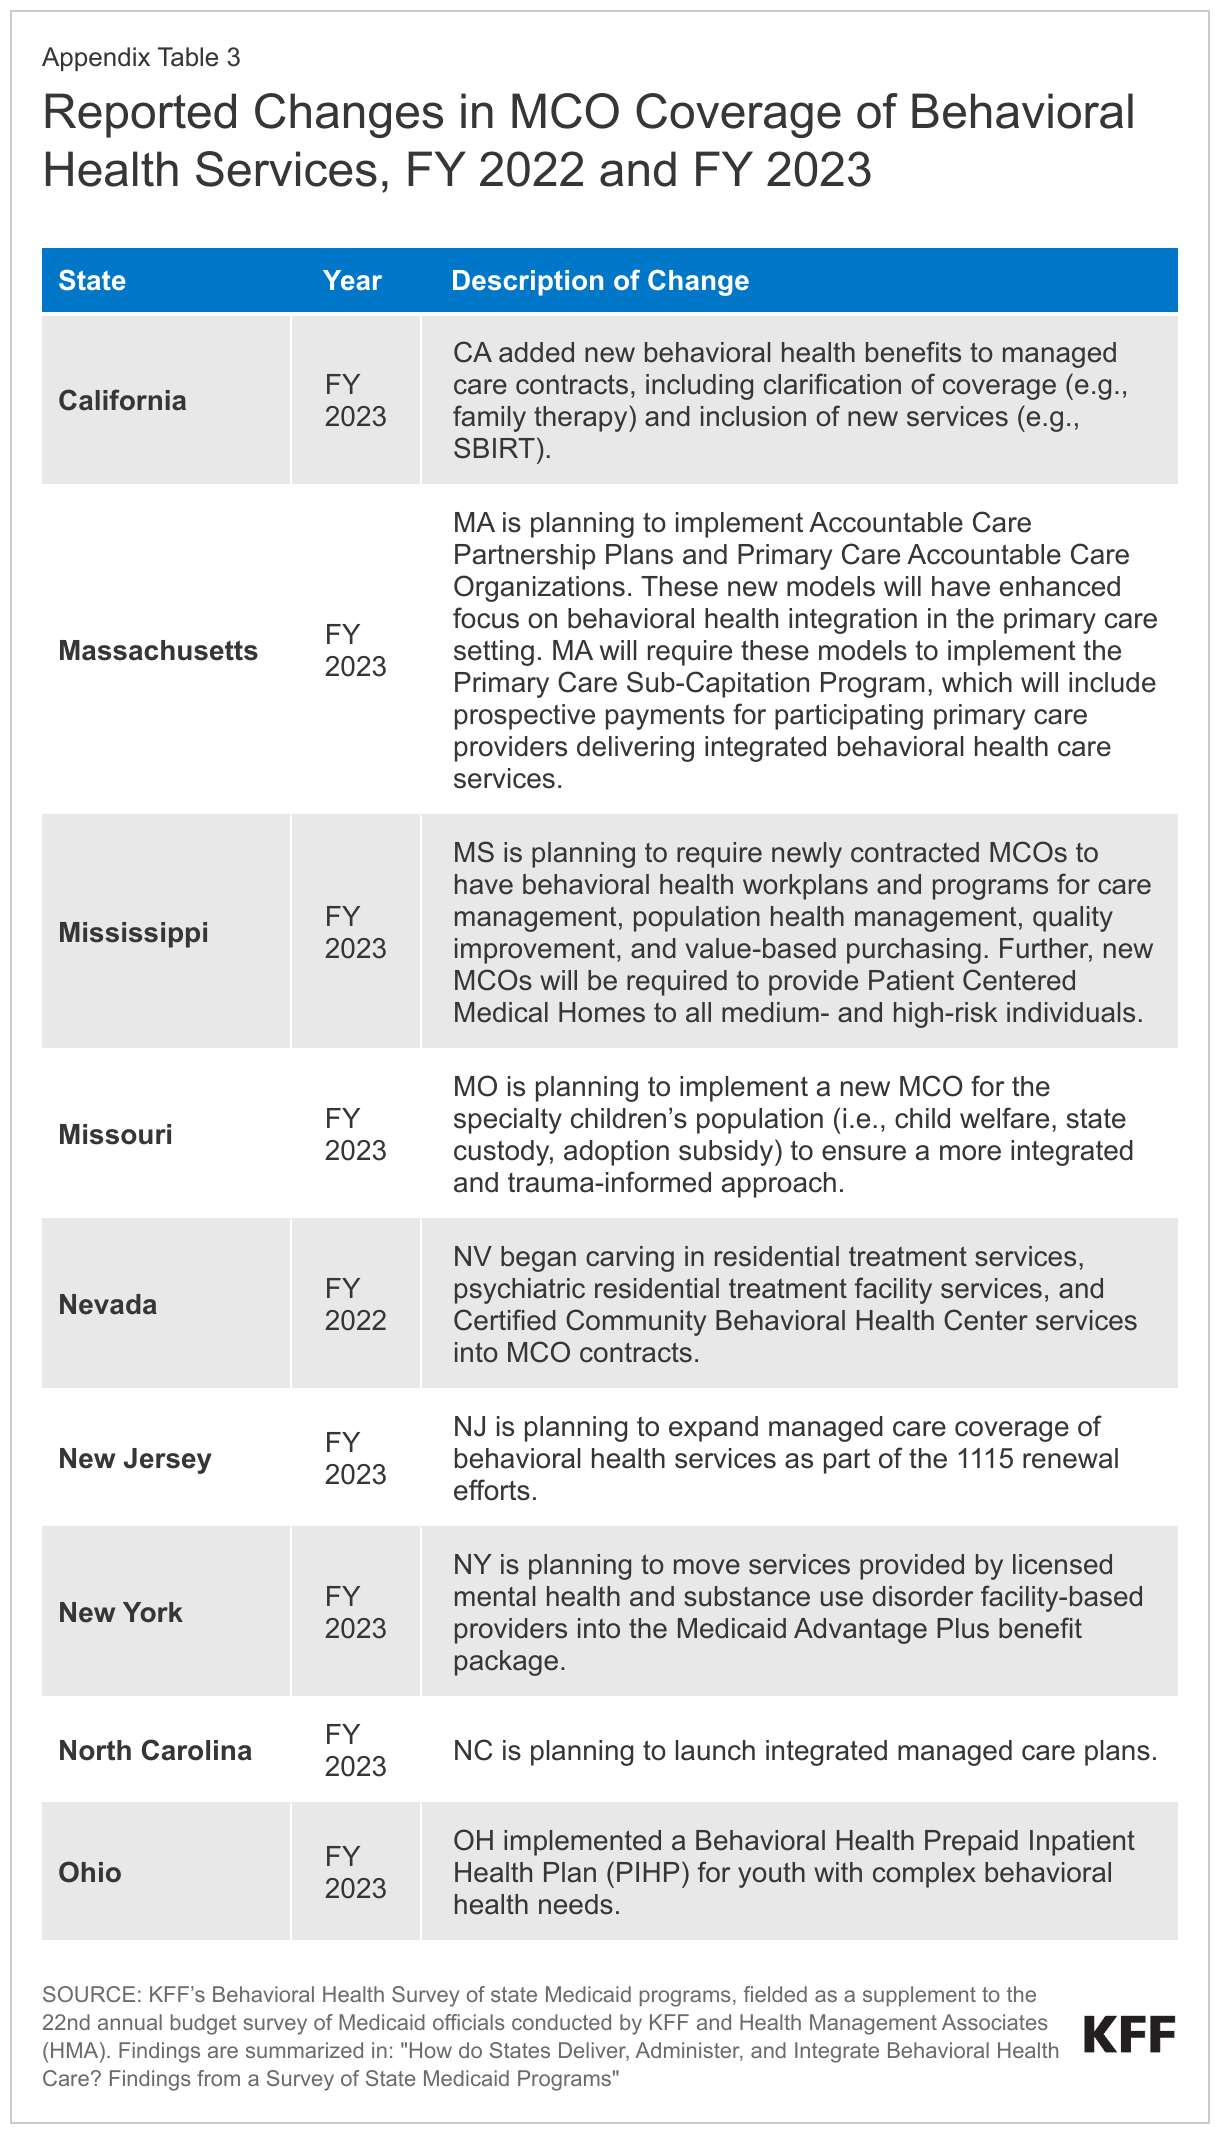
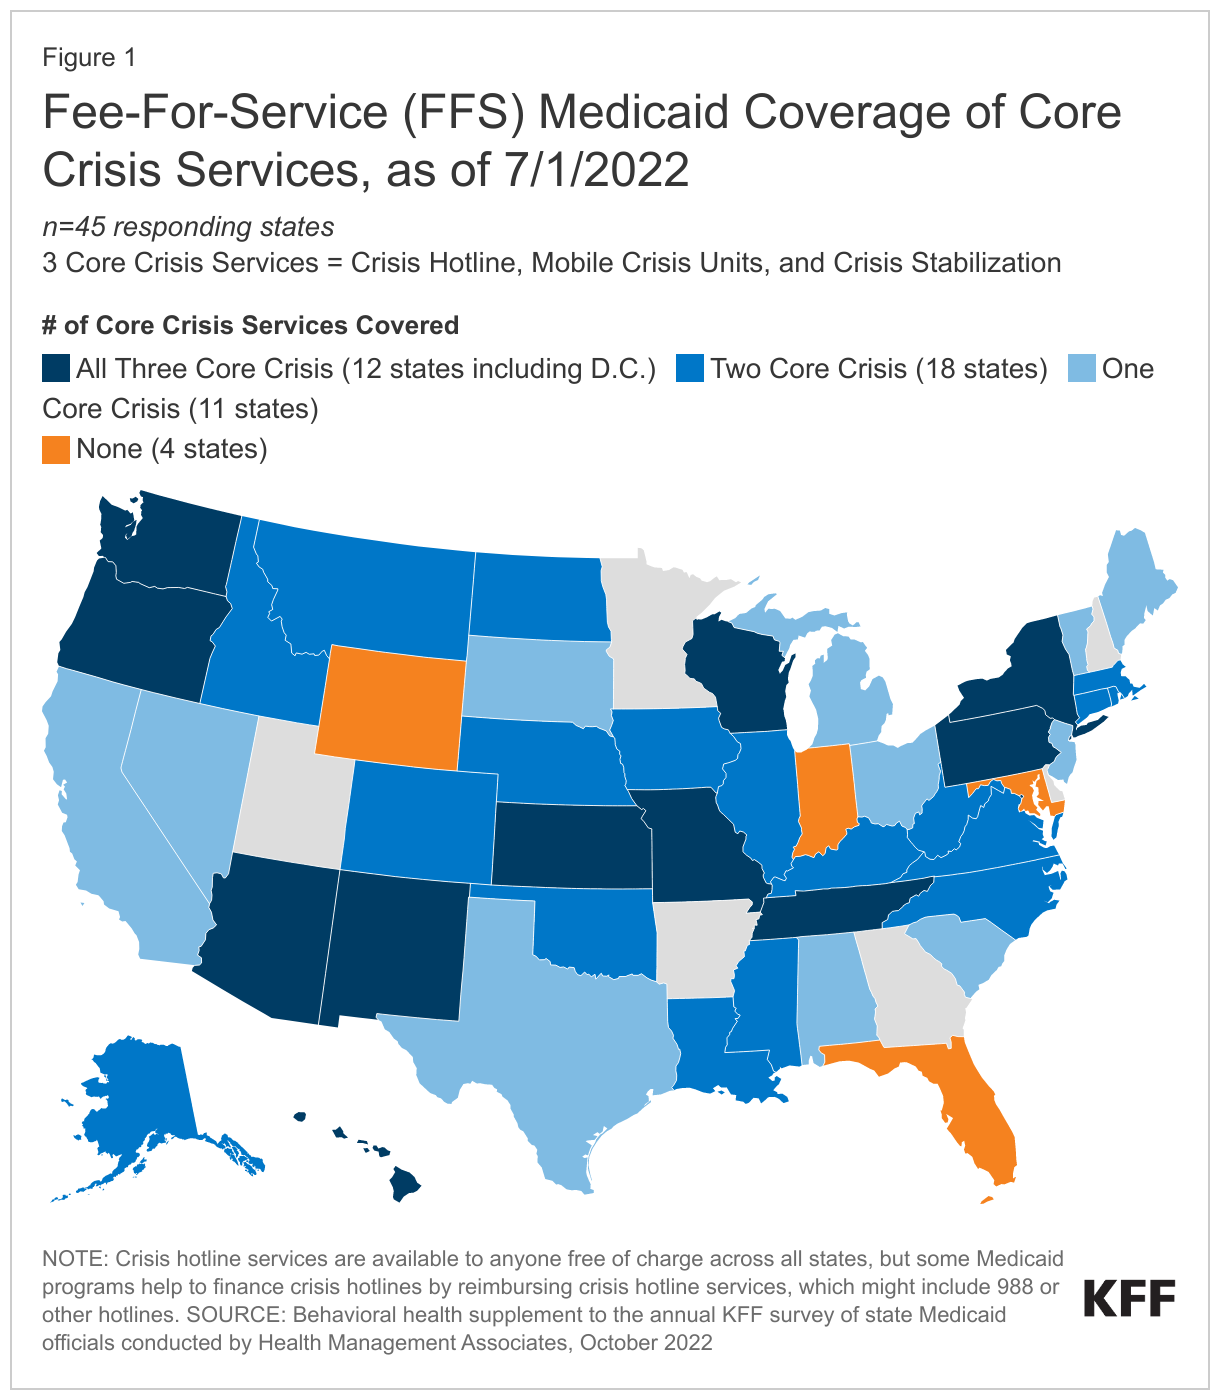
About three-quarters of responding states (33 of 45) do not cover all three core crisis services for FFS adults, but most states cover at least one core crisis service (41 of 45) (Figure 1). Medicaid programs are less likely to cover crisis services compared to other behavioral health service categories. Despite this generally lower coverage, the landscape of crisis response systems is evolving across states, driven in part by the opportunity for enhanced federal matching funds for qualified mobile crisis services (see next section of this brief). For example, Massachusetts is implementing a multi-year roadmap for behavioral health reform that includes a 24/7 help line, clinical assessment, and referral to treatment. The state of Montana is working toward aligning its crisis services with the Crisis Now Model. Crisis hotline services are available to anyone free of charge across all states, but some Medicaid programs help to finance crisis hotlines by reimbursing crisis hotline services, which might include 988 or other hotlines.

Fee-For-Service (FFS) Medicaid Coverage of Core Crisis Services, as of 7/1/2022

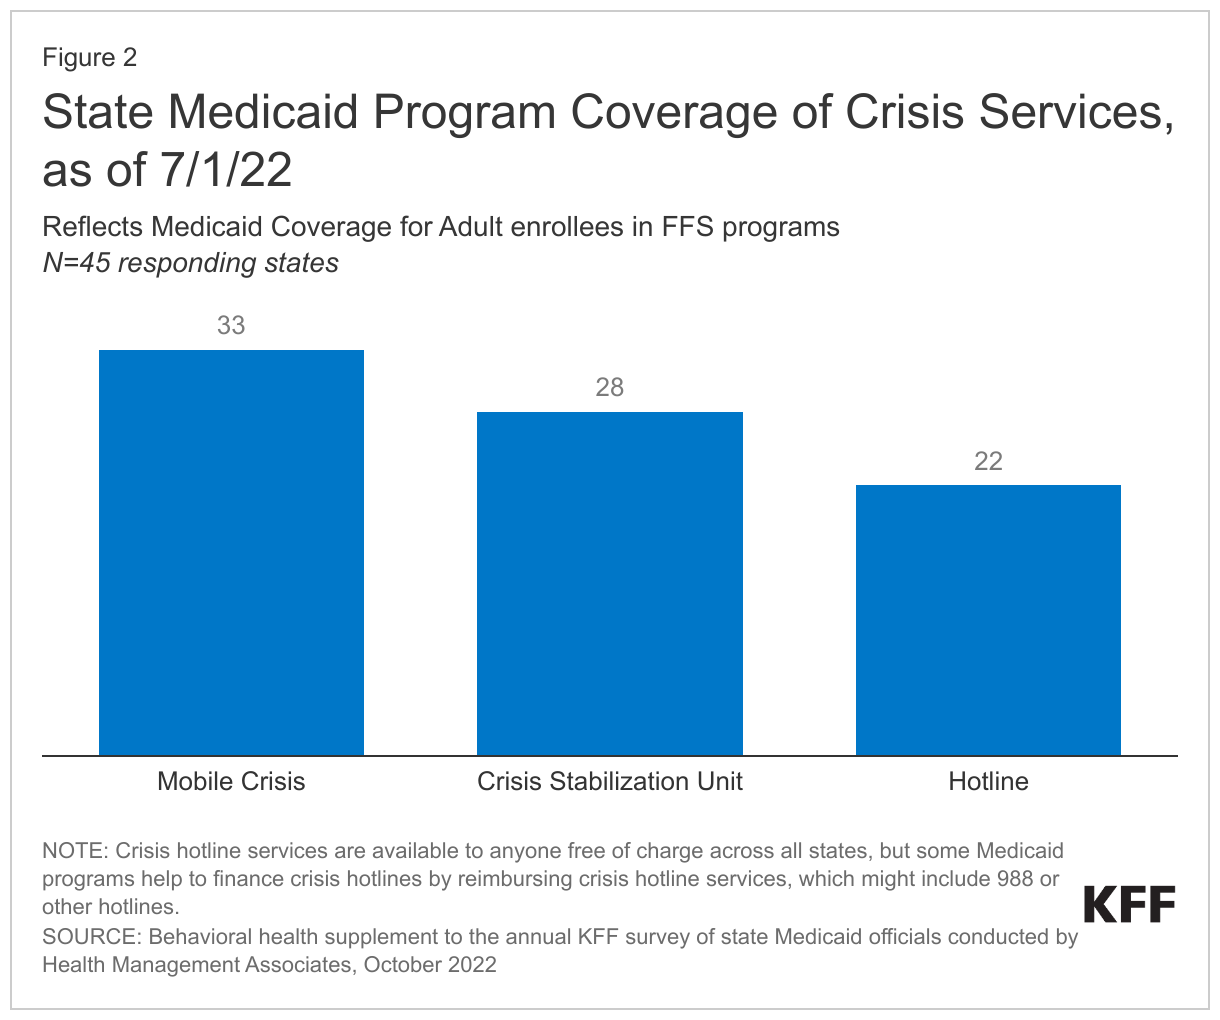
States report higher coverage rates for mobile crisis and crisis stabilization units but lower coverage for crisis hotlines under adult fee-for-service (FFS) Medicaid. However, it is unclear how widespread these services are within states and whether they align with best practice recommendations, such as trauma-informed care. (These findings do not account for variations in coverage provided by managed care organizations (MCOs) or Section 1115 waivers.)

  • Nearly three-quarters of responding states (33 of 45) reported mobile crisis coverage for adults in FFS programs. People experiencing a crisis may receive help from mobile crisis teams, which are usually dispatched from crisis hotlines, providers, emergency medical services, or law enforcement.
  • Nearly two-thirds of responding states (28 of 45) report adult FFS coverage of crisis stabilization units. Research suggests that care provided in crisis stabilization facilities may produce cost savings compared to emergency department or inpatient care.
  • Crisis hotlines are the least frequently covered core crisis service (22 of 45 responding states). Crisis hotline services are available to anyone free of charge across all states, but some Medicaid programs help to finance crisis hotlines by reimbursing crisis hotline services, which might include 988 or other hotlines. One reason why coverage for this crisis service is lower than others may be the difficulty in obtaining insurance information during emergency crisis calls. Some states are finding ways to address this issue, with the National Association of State Mental Health Program Directors (NASMHPD) reporting that some states are surveying callers about Medicaid coverage and utilizing an administrative federal match based on share of Medicaid-covered callers.

Most of the states that cover mobile crisis also report that they currently require or are planning to require peer supports on their teams. Peer supports are individuals with lived experience, and research and national guidelines support their involvement in mobile crisis teams. A total of 7 states required peer supports on mobile crisis teams as of FY2022, with 13 more states planning to require it in FY2023. Several states report that they encourage peer support, but do not make it mandatory. Other states have plans to include peer supports in subsequent years or on a subset of teams. Arizona, for example, plans to require peer support specialists on 25% of mobile teams in FY 2023.

State Medicaid Program Coverage of Crisis Services, as of 7/1/22

Options for Enhanced Federal Funding for Crisis Services

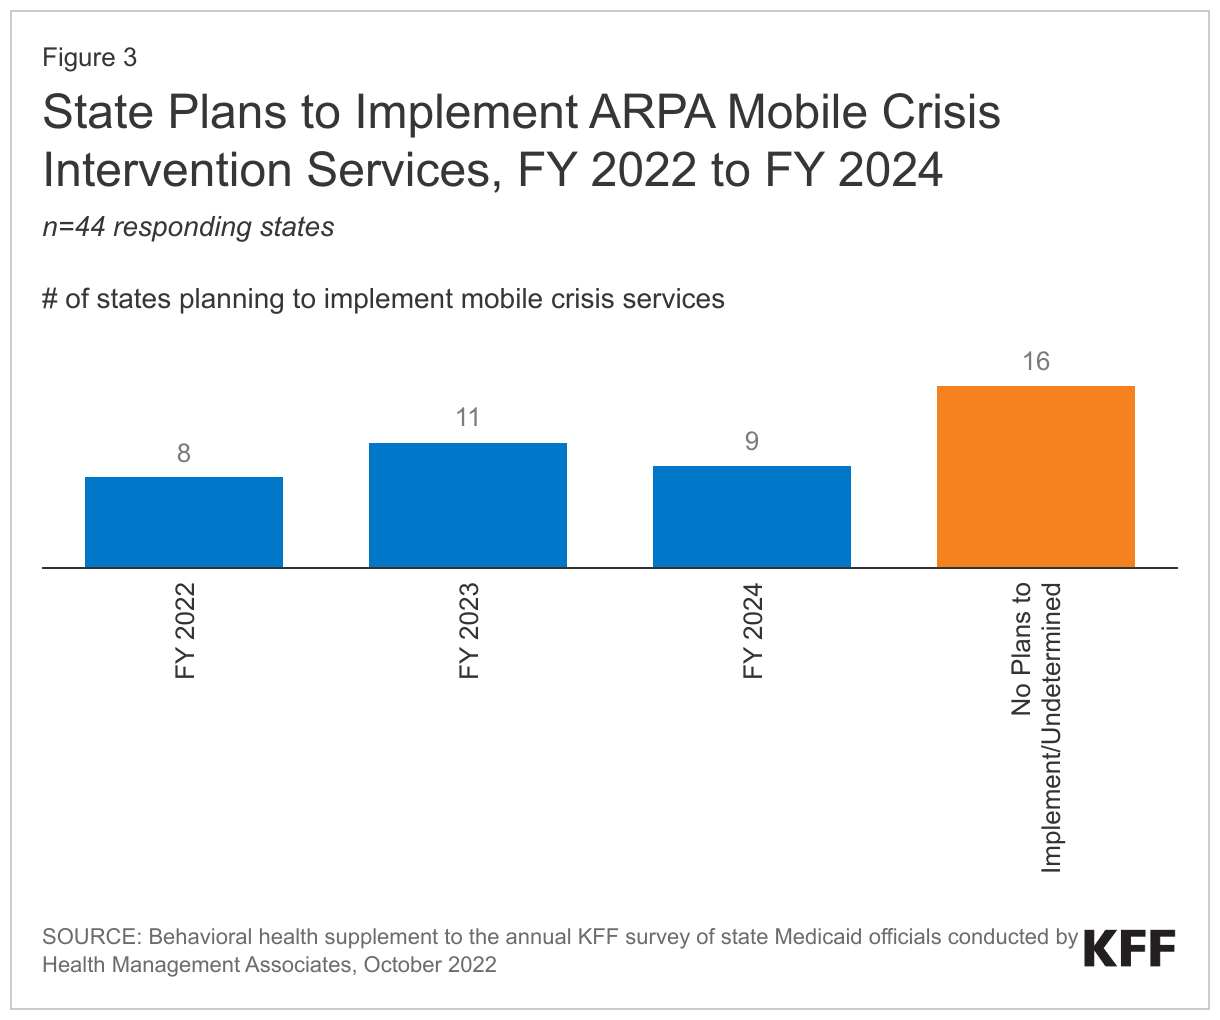
Over half of responding states (28 of 44) report that they have taken up or plan to implement the American Rescue Plan Act (ARPA) mobile crisis intervention services option (Figure 3). The option under ARPA is available to states for 5 years, beginning April 1, 2022. Medicaid programs that provide qualifying community-based mobile crisis services under this option will receive 85% enhanced federal matching funds for the first three years of implementation. This enhanced funding must supplement, not supplant, the previous level of state funding for qualifying mobile crisis services. While it is not necessary for mobile crisis services to be available across the state or to all populations to qualify for enhanced match, states must meet certain criteria, such as 24/7 service among participating providers. Among states that chose to pursue the ARPA option, 8 states reported implementation of qualifying mobile crisis services in FY 2022; 11 states reported plans to implement in FY 2023; and 9 in FY 2024 (Figure 3). Among states without plans to implement ARPA mobile crisis services or with an undetermined status, reasons for not pursuing this option included pre-existing non-ARPA crisis services and/or difficulty understanding and meeting the ARPA requirements for the enhanced match. Through funding provided by the ARPA, planning grants were awarded to 20 state Medicaid programs–to help them prepare for the implementation of qualifying mobile crisis services.

State Plans to Implement ARPA Mobile Crisis Intervention Services, FY 2022 to FY 2024

Less than one-quarter of states (8 of 43) are using or plan to access enhanced administrative match to support the technology needed to support implementation of crisis call centers or other crisis services. SAMHSA’s best practice guidelines advocate for an “air traffic control” model for crisis services that includes a system for assessing crisis levels, wait times, and linkage to additional services, as well as the ability for crisis staff to schedule appointments, a crisis bed registry, GPS mobile crisis dispatch, and performance monitoring dashboards. ARPA guidance explains that states can apply a 90% enhanced administrative match for the development of certain technology systems to help implement crisis services (and receive an ongoing 75% match for operations of these systems). Kentucky and Massachusetts are applying these funds toward crisis hotline integration or development, while New Jersey focuses on mobile response teams and vacancy tracking.

Challenges Confronting Medicaid Programs in the Implementation and Delivery of Crisis Services

State Medicaid programs often collaborate with multiple state agencies to design and implement crisis services. To gain a deeper understanding of the barriers associated with the implementation and delivery of these services, we asked state Medicaid programs about the challenges states have faced or anticipate facing. Additionally, we asked them to identify which of these areas posed the most significant obstacles.

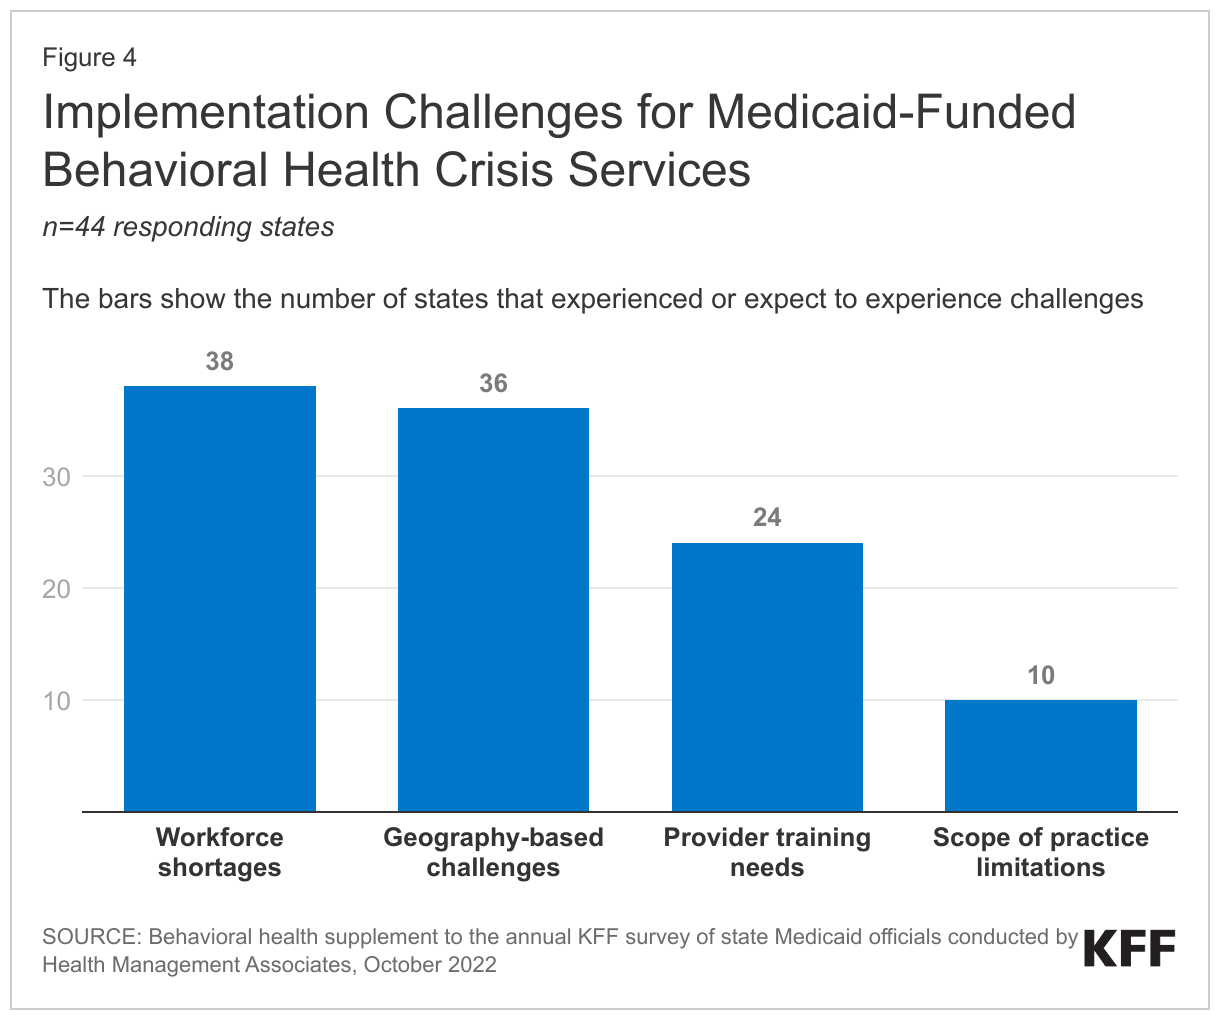
Almost all responding states (38 of 44) reported experiencing or expecting at least one obstacle to implementing crisis services, particularly workforce shortages and geography-based challenges (Figure 4). Workforce shortages and geographic challenges are not unique to crisis services, as other areas of behavioral health report similar barriers. Other challenges include provider training needs and scope-of-practice limitations. When we asked states to identify their biggest challenge, they overwhelmingly pointed to the shortage of a qualified workforce as their most significant obstacle.

Implementation Challenges for Medicaid-Funded Behavioral Health Crisis Services
  • Workforce Shortages. Finding qualified mental health professionals willing to work in crisis services and provide around-the-clock care, especially overnight, is a significant challenge. This high-stress environment contributes to high turnover rates, complicating the fulfillment of some ARPA requirements, such as maintaining a 24/7 two-person team. To address these workforce shortages, several states, including Nevada, have implemented strategies like allocating start-up funds to help providers expand their crisis workforce.
  • Geographic Challenges. Increased travel times in rural areas can result in longer response times for individuals in need. Some states have considered telehealth as a solution, although limitations exist for those without smartphones, reliable services, or comfort using them. Predicting demand in rural areas is challenging due to less concentrated populations, complicating 24/7 multidisciplinary team staffing. Staff safety is also a concern in areas with poor cell phone or internet reception. Additionally, states with significant tribal populations face added challenges in planning and coordinating efforts across agencies, MCOs, and providers.
  • Provider training needs. New and existing crisis professionals typically need initial and ongoing training in crisis services and population-specific topics. States emphasize the importance of providing trauma-informed, developmentally, and culturally appropriate care, which may necessitate additional trainings. States recognize the importance of these trainings, but point out that because of workforce shortages, it is difficult to take the existing crisis workforce out of the field for trainings. States are also challenged by a shortage of available trainings. To address the scarcity of available trainings in its state, Massachusetts is funding a behavioral health training clearinghouse containing free trainings.
  • Scope-of-practice limitations. Some states report that the roles and responsibilities of non-licensed staff, such as certified peers, are not always defined by state licensing boards. The shortage of staff and the limited roles they can perform also affect crisis services delivery. For example, in one state, a significant proportion of the workforce is comprised of unlicensed qualified mental health professionals who cannot diagnose or provide assessments for crisis services.

In addition to the challenges specified above, several states provided information about additional challenges:

  • Funding. Some states are concerned about sustainability of financing for crisis services, particularly as the ARPA enhanced funding (85% federal match) for community-based mobile crisis services is effective only for the first three years of implementation. For example, Oregon recommends permanent implementation of the enhanced federal match for qualifying crisis services. At present, crisis service financing relies heavily on local and state funding and block grants—though some states have added telecommunication Medicaid is the primary and one of the only insurers reimbursing for these services—even though people with other types of coverage are also served by behavioral health crisis systems. For example, Vermont points out that crisis services should be available to all regardless of insurance and identified the lack of mobile crisis coverage from Medicare and commercial payers as a challenge.
  • “Connecting” crisis care and other challenges. States also reported concerns around developing interconnections between 988 and the state’s existing infrastructure for effective “dispatching”, as well as improving cultural awareness and sensitivity to communities.

Looking Ahead

Keeping pace with larger federal and state initiatives, many Medicaid programs are developing or strengthening behavioral health crisis services. 988’s launch and enhanced federal funding opportunities have sparked developments, but states are unsure what will happen when enhanced funding opportunities expire. In addition, workforce shortages, questions about linking and coordinating across systems, and other logistical issues continue to pose challenges both within Medicaid and crisis systems generally.

Recent federal initiatives aim to mitigate some of these challenges. The Consolidated Appropriations Act, passed in December 2022, includes several provisions aimed at enhancing and evaluating the behavioral health crisis continuum. The Act establishes the Behavioral Health Crisis Coordinating Office within SAMHSA, directing it to identify and publish best practices. Additionally, the Act tasks various agencies with producing reports that evaluate the performance measures and outcomes of the behavioral health crisis continuum. Federal investments in the development and implementation of the 988 number have helped Lifeline improve answer rates, even with increases in outreach volume.

Despite recent advances in crisis services, uncertainties persist, including questions of how to integrate services across the crisis continuum and how to secure long-term sustainable funding. According to SAMHSA, crisis systems will be most effective when they can coordinate with each other and connect with other health care areas. The financing of crisis response systems is still emerging, with Medicaid currently a main insurer reimbursing for crisis services. However, Medicaid’s coverage is, at present, less comprehensive for crisis services compared to other categories of behavioral health benefits, though states may continue to enhance this coverage in coming years. As crisis response systems continue to grow and expand, states are navigating a variety of concerns—including workforce shortages, training needs, geographic challenges, and uncertainty about sustainable funding.

If you or someone you know is considering suicide, contact the 988 Suicide & Crisis Lifeline at 988

This brief draws on work done under contract with Health Management Associates (HMA) consultants Angela Bergefurd, Gina Eckart, Kathleen Gifford, Roxanne Kennedy, Gina Lasky, and Lauren Niles.

How do States Deliver, Administer, and Integrate Behavioral Health Care? Findings from a Survey of State Medicaid Programs

Authors: Madeline Guth, Heather Saunders, Lauren Niles, Angela Bergefurd, Kathleen Gifford, and Roxanne Kennedy
Published: May 25, 2023

Issue Brief

Increasing mental health challenges and growing opioid overdose deaths have heightened the focus on behavioral health issues and the need for improved delivery of services. Behavioral health conditions, including mental health and substance use disorders, are particularly prevalent among Medicaid enrollees, with approximately 39% living with such a disorder. Federal initiatives have aimed to increase access by addressing workforce shortages, improving school-based care delivery, and launching and funding crisis services.

Medicaid is the single largest payer of behavioral health services in the country, so state programs can help leverage changes in the system by implementing a range of policies that enhance the delivery, quality, and effectiveness of these services. Despite state and federal efforts to improve accessibility and quality, 35% of Medicaid-covered individuals with significant mental health concerns report not receiving treatment. States maintain flexibility in determining the coverage, delivery, and payment of behavioral health services, leading to variations in these areas.

KFF surveyed state Medicaid officials about behavioral health policies related to administration, delivery systems, integrated care, and data analytics. These questions were part of KFF’s Behavioral Health Survey of state Medicaid programs, fielded as a supplement to the 22nd annual budget survey of Medicaid officials conducted by KFF and Health Management Associates (HMA). A total of 44 states (including the District of Columbia) responded to the survey by December 2022, but response rates varied by question. Further policy context is available in a series of behavioral health briefs that can be accessed in the “Behavioral Health Supplemental Survey” section on this page.

This issue brief utilizes this survey data to answer four key questions:

  • How do states administer and finance their behavioral health programs?
  • What managed care arrangements do states use to deliver behavioral health care?
  • How are states promoting the delivery of integrated behavioral and physical health care?
  • How do states monitor behavioral health data?

Behavioral Health Administration and Spending

Medicaid covers a disproportionate share of adults with mental illness and/or SUD (22% vs. 18% of all non-elderly adults). In recent years, state Medicaid and behavioral health authorities are increasingly collaborating to fund, provide oversight, and develop policy for publicly-funded behavioral health services and supports. We asked states to describe the current organizational structure of their Medicaid and behavioral health authorities and to indicate any planned changes to this structure. We also asked states about growth of behavioral health spending in Medicaid.

States’ behavioral health administration structures vary, but in most states Medicaid and behavioral health authorities are different divisions under a single agency (Table 1). Only two states reported that Medicaid and behavioral health authorities were in the same division under a single agency. About one-third of states reported that Medicaid and behavioral health authorities were in separate agencies—either separate cabinet level agencies, separate social service agencies, or separate agencies for each of Medicaid, mental health, and SUD. Three states reported “other” administrative structures.1  While agency structure is not the only approach to coordination, operating Medicaid and behavioral health in a single agency may allow states to foster communication and data-sharing between these authorities. For example, one stated rationale for the 2015 merger of Arizona’s Medicaid and behavioral health authorities was to improve coordination of health care by integrating the management of health services for Medicaid enrollees.

State Behavioral Health and Medicaid Administration Models, as of 7/1/22

Of the 44 responding states, two reported plans to change the state administrative structure in FY 2023: Iowa reported that its Department of Human Services and Department of Public Health have aligned to form a single Department of Health and Human Services and that behavioral health and Medicaid will both be divisions within this larger agency. Idaho reported plans to transition behavioral health and Medicaid from different divisions under a single agency to a joint division under the agency, and to manage both Medicaid and non-Medicaid behavioral health services through a managed care organization (MCO).

Most states report that Medicaid spending on behavioral health services is growing faster or about the same as overall Medicaid spending growth. In particular, a plurality of responding states (18 of 43) reported faster growth in behavioral health spending, while only four states reported slower growth in behavioral health spending; of the remaining states, seven reported that growth was about the same and fourteen reported they did not know. Reasons reported for faster rates of behavioral health spending included increased utilization and expansion of telehealth, increased utilization of behavioral health services, rate increases for behavioral health services, and new or expanded services or eligibility criteria for those with behavioral health.

Delivery System Models and Managed Care Arrangements for Behavioral Health Services

States use a combination of fee-for-service (FFS) and managed care arrangements to deliver behavioral health care to Medicaid beneficiaries, with these services increasingly being provided by managed care organizations (MCOs) in recent years. State movement toward managed care models has included carving behavioral health services into comprehensive, capitated MCO contracts or contracting with risk-based limited benefit prepaid health plans (PHPs). Other states have retained the FFS model but may contract with public or private Administrative Service Organizations (ASOs) to deliver behavioral services on a non-risk basis. We asked states to indicate behavioral health delivery system models in place and, if applicable, to report MCO provision of different behavioral health benefits. We also asked states to report any behavioral health quality incentives in place across delivery system models.

Nearly all responding states had multiple behavioral health delivery system models in place as of July 1, 2022; in particular, most states reported covering behavioral health services under both FFS and through MCOs (Figure 1 and Appendix Table 1). Almost all responding states (42 of 44) reported covering at least some behavioral health services under FFS; of these, 32 states also reported that some behavioral health services were included in a managed care arrangement (MCO and/or PHP). Only two states (Tennessee and Maryland) reported that they did not use any FFS arrangements to cover behavioral health services. Some states with FFS and/or managed care models reported that coverage of behavioral health services also included public or private behavioral health ASOs and/or county or government administered ASOs. While states may use different delivery models for certain behavioral health services, the increased complexity of the behavioral health delivery landscape could complicate access to needed care for enrollees.

Medicaid Behavioral Health Delivery System Models, as of 7/1/22

Six states reported behavioral health delivery system changes planned for FY 2023:

  • Three states (Missouri, North Carolina, and Oklahoma) reported plans to put in place new MCO arrangements for covering behavioral services.
  • North Carolina and Arizona reported plans to eliminate their FFS models and transition all behavioral health benefits in to managed care.
  • Iowa reported a plan to eliminate its county/government ASO model.
  • Ohio implemented a new PHP model on July 1, 2022.

Most states continue to rely on MCOs to administer and manage inpatient and outpatient behavioral health services (Figure 2 and Appendix Table 2). States may carve specific services out of MCO contracts to FFS or PHPs; services frequently carved out include behavioral health, pharmacy, dental, and long-term services and supports (LTSS). However, significant movement has occurred across states to carve these services in to MCO contracts. Consistent with results from past years, the majority of MCO states reported that most specified behavioral health service types were always carved into their MCO contracts (i.e., virtually all services covered by the MCO); fewer states reported that services were always carved out (to PHP or FFS) or that carve-in status varies by geographic or other factors. Qualified Residential Treatment Programs (QRTPs)2  and mental health residential stays were the benefits most frequently carved-out. Some states reported that managed care coverage of specific behavioral health benefits varied by certain criterion, such as carve-outs for certain populations (see Appendix Table 2 for more information).

MCO Coverage of Behavioral Health Services, as of 7/1/22

Nine responding states with MCO arrangements for acute care benefits reported changes to how behavioral health benefits were delivered under MCO contracts in FY 2022 or 2023. Changes to contracts fall into a few key policy domains, including:

  • Revisions to support behavioral health integration. For example, North Carolina reported plans to launch integrated managed care plans.
  • Changes to benefit design or coverage. For example, Ohio implemented a new prepaid inpatient health plan (PIHP) for youth with complex behavioral health needs
  • Implementation of new payment models. For example, Massachusetts reported plans to implement prospective payments for participating primary care providers delivering integrated behavioral health care services.

See Appendix Table 3 for additional state-by-state detail on changes in MCO coverage of behavioral health services.

Three-quarters of responding states reported a financial quality incentive in place in FY 2022 or planned for FY 2023 to drive improvements in behavioral health care quality (Table 2). We asked states to report any financial incentives to promote behavioral health quality for MCOs, PHPs, and/or PCCMs or FFS. Of states with financial incentives in place or planned, states most commonly noted that they included behavioral health quality measures in an alternative or value-based payment program. States also reported withholding a percentage of managed care capitation payments or implementing performance bonuses or payments. Some states reported multiple kinds of financial incentives in place or planned. For example, Massachusetts noted that MCOs and Accountable Care Organizations (ACOs) participate in shared savings/losses programs tied to behavioral health quality performance indicators and that psychiatric and substance abuse treatment hospitals have a quality incentive payment structure.

State Use of Financial Incentives to Promote Behavioral Health Quality Improvement in Medicaid

Integrated Care

Many individuals receiving care for behavioral health conditions also have physical health conditions that require medical attention, and the inverse is also true. State Medicaid programs can adopt integrated care policies to address care fragmentation and better integrate physical and behavioral health care, such as by co-locating of both types of care at the same site or removing documentation requirements that may serve as barriers to integration. We asked states about whether they had implemented certain strategies to promote integrated care: Certified Community Behavioral Health Clinics, the psychiatric collaborative care model, and less extensive behavioral health documentation requirements.

About one-third of responding states reported recognizing Certified Community Behavioral Health Clinics (CCBHCs) as a provider type for reimbursement in FY 2022 or FY 2023 (Figure 3). The CCBHC demonstration, established by Congress in 2014 and expanded in 2022, aims to improve the availability and quality of ambulatory behavioral health services and to provide coordinated care across behavioral and physical health.3  We asked states to report information on CCBHC coverage and experiences:

  • CCBHC coverage: Nine states reported that they recognized CCBHCs as a specific enrolled provider type for Medicaid reimbursement in FY 2022, with an additional six states planning to do so in FY 2023. Most of the remaining states (17) reported no plans to recognize CCBHCs in FY 2023, while 12 states were undetermined.4  A few states reported reasons they did not currently plan to recognize CCBHCs, including concerns about payment methodology, budgetary impacts, or that the state had existing providers that served a similar function.
  • CCBHC challenges: Among states that do or plan to reimburse CCBHCs, challenges to their adoption included cost efficiency, implementation of payment structure, and workforce challenges.
  • CCBHC reimbursement structure: The most commonly reported CCBHC reimbursement methodology was a daily or monthly prospective payment system (PPS) (10 states). A handful of states reported using FFS, outlier/bonus payment, or another methodology.5  Finally, where applicable, states reported a range of approaches to managed care payment requirements for CCBHCs; some states require managed care entities (MCEs) to pay rates set by the state while others allow MCEs to negotiate rates

About one-third of responding states reimbursed psychiatric collaborative care model (CoCM) codes in FY 2022, with many states undetermined as to whether they will open such codes in the future (Figure 3). CoCM is a behavioral health integration model that enhances primary care by adding two services (and providers) to a primary care team: care management for patients receiving behavioral health treatment, and regular psychiatric inter-specialty consultation. CMS has developed specific CPT billing codes for COCM services. Fifteen states reported reimbursing these codes in FY 2022, with two more states planning to reimburse in FY 2023. An additional one-third of states (15) were undetermined about whether to reimburse these codes in the future,6  while the remaining 12 states reported no plans to open these codes.

Medicaid Integrated Care Models: Recognition of Certified Community Behavioral Health Clinics (CCBHCs)

A small number of states reported promoting integrated care by adopting less extensive documentation requirements for primary care settings as compared to specialty behavioral health settings. Four states reported they had less extensive requirements in place in FY 2022 (Arizona, California, Maryland, and Texas) and one state planned to adopt less extensive requirements in FY 2023 (Arkansas). For example, Arizona formally recognizes accredited patient centered medical homes with behavioral health distinction as meeting documentation requirements without the need for additional auditing and is working to do the same for behavioral health homes.

Behavioral Health Data and Health Information Exchanges

Data on behavioral health utilization can be used to understand areas such as care utilization patterns, access gaps, population trends, and health disparities. Health information exchanges (HIEs) can facilitate communication, which may result in more effective and timely linkages to behavioral health and other care, as well as improved coordination and quality. We asked states about initiatives to encourage and support behavioral health provider participation in HIEs, as well as any challenges encountered. In addition, we asked states whether they collected or analyzed data to better understand behavioral health utilization patterns, needs, or disparities.

About half of responding states reported a state initiative to encourage or support Medicaid behavioral health provider network participation in health information exchanges (HIEs) (Table 3). Leadership buy-in, financial incentives, infrastructure assistance, and quality incentives are some of the methods states use to encourage behavioral health providers to utilize HIEs. Most states report HIEs are used to manage admission, discharge, and to transfer data during acute care or crisis situations. Behavioral health providers may also utilize HIEs for care coordination, referral services, and in some instances, social services referrals.

State Initiatives to Support Medicaid Behavioral Health Provider Participation in Health Information Exchanges (HIEs), as of 7/1/22

States reported that technology limitations, costs, and confidentiality concerns were primary barriers to use of HIEs in behavioral health. Some states point to a lack of trust among behavioral health providers regarding entering sensitive data into the HIE due to concerns about violating enhanced confidentiality requirements for some behavioral health populations. States report several financial barriers that may prevent behavioral health providers from participating in HIE, including limited access to technology, upgrades to existing IT infrastructure, integration costs across data systems, and changes in billing and administrative processes.

Nearly all responding states (40 of 44) reported using state-level data to better understand the needs of Medicaid behavioral health populations. States report analysis of claims data, newly collected data, or other data sources. These include data analyses conducted within state Medicaid agencies, often through demonstrations or waivers, and within MCO contracts.

Looking Ahead

As states continue to expand behavioral health services coverage to close access gaps and address the pandemic’s impact on mental health and substance use disorders, they may face continued upward budget pressures in behavioral health services spending due to increased utilization. Improved data quality and access may prompt states and analysts to further examine the complex Medicaid behavioral health delivery system, examining access and outcomes associated with various delivery and financing mechanisms. While states are increasingly adopting integrated care initiatives and making efforts to reduce fragmentation across physical and mental health, behavioral health providers’ difficulty participating in health information exchanges may hinder progress.

In addition, current discussions over proposed federal rule changes, such as privacy regulations for people with substance use disorders and telehealth prescribing for controlled substances, may affect how behavioral health systems and providers deliver and coordinate care. Numerous existing and proposed federal initiatives aim to employ strategic policies to enhance the accessibility, quality, and availability of behavioral health care. For example, the Consolidated Appropriations Act (CAA) passed workforce requirements that aim to increase the accessibility and availability of behavioral health care, including requirements for Medicaid provider network directories and funding for new psychiatry residency positions. Finally, recognizing Medicaid’s importance in covering and financing behavioral health care for children, recent legislation has utilized Medicaid as one pathway to expand school-based behavioral health services and additional federal and state efforts in this area are ongoing.

This work was supported in part by Well Being Trust. KFF maintains full editorial control over all of its policy analysis, polling, and journalism activities.

This brief draws on work done under contract with Health Management Associates (HMA) consultants Angela Bergefurd, Gina Eckart, Kathleen Gifford, Roxanne Kennedy, Gina Lasky, and Lauren Niles.

Appendix

Medicaid Behavioral Health Delivery System Models in Place, as of 7/1/2022
MCO Coverage of Behavioral Health Services as of 7/1/22: Mental Health Services
Reported Changes in MCO Coverage of Behavioral Health Services, FY 2022 and FY 2023

Endnotes

  1. The three states are KY, MA, and MI: KY reported that both the State Medicaid Services (Department for Medicaid Services, DMS) and Behavioral Health (Department for Behavioral Health, Developmental and Intellectual Disabilities, DBHDID) are under the Kentucky Cabinet for Health and Family Services. MA reported that Medicaid and behavioral health were within the same executive office, under different agencies/programs. MI reported that adult behavioral health and Medicaid are in the same administration (the Behavioral and Physical Health and Aging Services Administration) within the Michigan Department of Health and Human Services (MDHHS), while children’s behavioral health policy is administered by a separate area of MDHHS. ↩︎
  2. Qualified residential treatment programs (QRTPs) are child care institutions that provide trauma-informed therapeutic programming designed to address the needs, including clinical needs, of children with serious emotional or behavioral disorders or disturbances. QRTPs may receive federal foster care maintenance payments, but may be subject to the IMD exclusion for federal Medicaid payment. On KFF’s Behavioral Health survey, of 43 states responding, 16 states reported reimbursing for QRTPs in FY 2022 and an additional 5 states planned to add reimbursement in FY 2023. Two states reported a Section 1115 waiver in place to allow coverage of services provided to enrollees in QRTPs that meet IMD criteria, while 5 states planned to seek such a waiver. Of these 5 states, all planned to seek Section 1115 authority to exempt the limitations on lengths of stays under the waiver for foster care children residing in QRTPs. ↩︎
  3. The Protecting Access to Medicare Act of 2014 established a demonstration program to improve community mental health services by funding planning grants for states to implement Certified Community Behavioral Health Clinics (CCBHCs), and the 2022 Safer Communities Act expanded this program. In addition to setting requirements for CCBHCs, the 2014 Act directed CMS to issue guidance on a prospective payment system for mental health services furnished by CCBHCs to account for the total cost of comprehensive services they provide. The CCBHC demonstration aims to improve the availability and quality of ambulatory behavioral health services and to provide coordinated care across behavioral and physical health. CCBHCs provide nine types of services: crisis mental health services; screening, assessment, and diagnosis; patient-centered treatment planning; outpatient mental health and substance use services; outpatient clinic primary care screening and monitoring; targeted case management; psychiatric rehabilitation; peer support and counselor services and family supports; and intensive, community-based mental health care for members of the armed forces and veterans. CCBHCs may partner with designated collaborating organizations to provide some of these services. ↩︎
  4. Including CT (which reported it is analyzing the CCBHC model and may implement a modified version in the future), ME (which reported that its goal is to cover CCBHCs by July 1, 2024), and WA (which reported it is currently conducting a research study for the adoption of CCBHCs with a target of FY 2024). ↩︎
  5. Of the 15 states that reported recognizing CCBHCs in FY 2022 or 2023, 12 provided information on their current CCBHC reimbursement structure(s). Some of these states reported the use of multiple reimbursement strategies. PPS methodologies: On May 20, 2015, the Centers for Medicare and Medicaid Services (CMS) issued guidance to states specific to the development of a PPS to be tested under the Section 223 Demonstration Program for CCBHCs, and required in Section 223 of the Protecting Access to Medicare Act of 2014. CMS released proposed updates to that CCBHC PPS Guidance in May 2023 to coincide with an additional round of state CCBHC grantees. CMS developed two PPS methodologies for reimbursing CCBHCs: one that pays a fixed daily rate for all service rendered to a Medicaid enrollee (similar to the methodology used by Federally Qualified Health Centers) and one that pays a fixed monthly rate. 8 states reported using the daily PPS model (ID, KS, KY, MI, MO, NV, NY, and OR) and 2 states reported a monthly PPS model (NJ and OK). Other methodologies: 3 states reported using FFS (NJ, NM, and NV), 3 states reported using outlier or bonus payments (MI, NJ, and NV), and 2 states reported using another methodology (AK reported that CCBHs are grant-funded; NY reported using a PPS methodology but carved out of managed care and paid using a CCBHC-specific code with a provider-specific rate based on each agency’s total cost of operations divided by total visits). ↩︎
  6. Including SC, which reported that it intended to cover these codes and hoped to do so in FY 2023, but a firm date had not been established. ↩︎

Use of ACA preventive services potentially affected by Braidwood v. Becerra

Authors: Krutika Amin, Shameek Rakshit, Cynthia Cox, Gary Claxton, and Allison Carley
Published: May 25, 2023

This analysis uses private insurance claims data to examine the number of people who received preventive services that could be affected by a now-stayed U.S. District Court ruling in Braidwood Management v. Becerra, which found the Affordable Care Act’s (ACA) preventive services mandate partially unconstitutional.

The Affordable Care Act (ACA) requires most private health plans to cover some in-network preventive services without cost-sharing for enrollees. On March 30, 2023, the U.S. District Court in the Northern District of Texas excluded from the requirement all preventive care recommendations issued by the United States Preventive Services Task Force (USPSTF) on or after March 23, 2010, when the ACA was signed into law. The district court also found that preexposure prophylaxis (PrEP), medication recommended for HIV prevention, violates the religious rights of those who have objections to its use.

The analysis finds that about one in 20 privately insured people – about 10 million people in total – received at least one ACA preventive service or drug in 2019 that would no longer have to be covered without any cost sharing if the ruling is allowed to stand. Statins, which are used to treat people at risk of cardiovascular disease, are the most commonly used preventive service potentially affected.

The analysis is available through the Peterson-KFF Health System Tracker, an online information hub that monitors and assesses the performance of the U.S. health system.

The Health Insurance and Financing Landscape for People with and at Risk for HIV

Authors: Lindsey Dawson, Jennifer Kates, and Tatyana Roberts
Published: May 25, 2023

Background

The health care coverage and financing landscape for people with and at risk for HIV in the U.S. is highly fragmented and made up of a patchwork of payers and programs. Each has its own eligibility requirements, services and benefits, cost sharing obligations, and financing structure. Further, program eligibility and benefits vary by state and in some cases, even more locally, leading to uneven access across the country and some people are left out of the system entirely. The Affordable Care Act (ACA), passed in 2010, expanded access to coverage and services for millions of people, including people with and at risk of HIV and as a result, the number of uninsured people has fallen significantly. Most people with HIV do have insurance coverage, particularly through Medicaid and private insurance, and many receive support from the Ryan White HIV/AIDS Program, the nation’s safety net program for people with HIV. This table provides an overview of the major payers and programs that provide coverage and services to people with and at risk of HIV. It builds on and updates earlier work published in the Lancet.

HIV Insurance Coverage and Care Landscape in the United States

Download the full version of this table (.pdf)

News Release

The Title X Network Has Largely Returned Under the Biden Administration 

Published: May 25, 2023

A new KFF brief examines the return of grantees and clinic sites to the Title X network under the Biden Administration, which reversed Trump Administration regulations that prohibited Title X sites from providing abortion referrals and having co-located abortion services. For more than 50 years, the federal Title X program has provided family planning services to nearly four million people a year through a network of clinics. The program is part of the U.S. public health safety net designed to serve people with lower incomes and those without insurance who otherwise cannot afford family planning services.

As a result of the Trump Administration rules, nearly 1,280 sites withdrew from the Title X program. Of the 411 Planned Parenthood sites that left the program under the Trump Administration, 286 (70%) have rejoined. Of the 869 other sites that left the program, 531 (61%) have returned. 

At the same time, 777 new sites that were previously not part of the program have joined, bringing the current Title X network back to 4,108 sites, which is 2% more than the original 4,010 sites before the Trump Administration regulations. All six states (HI, ME, OR, UT, VT, WA) that left the Title X network under the Trump Administration have returned with most of their sites, or they expanded their networks to new ones.Ongoing litigation challenging the Biden Administration Title X regulations continues, and its outcome could result in withdrawals and disqualifications. Current Title X regulations require clinics to provide pregnancy options counseling that includes abortion as an option. In states where abortion is now banned, there are examples of policies that require Title X clinics to exclude counseling on abortion, which is in direct conflict with Title X regulations. These policies may disqualify grantees in these states from participating in the program. 

Read “Rebuilding the Title X Network Under the Biden Administration” to learn more about the Title X program and network.

Rebuilding the Title X Network Under the Biden Administration

Published: May 25, 2023

Issue Brief

Key Takeaways

  • The federal Title X family planning program has undergone substantial changes in the number of participating clinics in response to shifting program priorities and rules that vacillate widely between different administrations, particularly about how counseling and referral to abortion services are handled by grant recipients.
  • The Trump Administration regulations that prohibited grantees from referring clients for abortion services or having co-located family planning and abortion services led to a withdrawal of almost a third of the sites from the Title X network. The reduction of the provider network and limits to in person care during the COVID-19 pandemic translated to a major reduction in the number of people served by the program from 3.9 million people in 2018 to 1.5 million in 2020, a 60% drop.
  • The Biden Administration issued regulations to reverse the Trump Administration policies banning abortion referrals and the participation of family planning providers that also offer abortion services in the program. Today, the Title X network has even more sites than the number participating prior to initiation of the Trump Administration regulations.
  • The Title X family planning program has been level funded at $286 million for nearly a decade, and as a result, has not been able to keep up with medical price inflation or the growing demand for family planning services.
  • While the size of the family planning network has largely recovered, ongoing litigation challenging the Biden Administration regulations and the program’s provision allowing minors to get contraception without parental consent could result in limits to the availability of federally supported family planning services in some states.
  • In states with abortion bans, continued participation in the Title X program may be impeded by state laws that prohibit pregnancy options counseling that includes abortion and referrals, a current requirement of the Title X program. The state of Tennessee (a Title X grantee) has already been disqualified because of their refusal to provide comprehensive pregnancy options counseling and abortion referral for those who seek it. In six of the states where abortion is banned (AL, AR, LA, OK, WI, and WV), the health department is the only Title X grantee.

Introduction

The federal Title X program, which has been in existence since 1970, has historically provided family planning services to nearly four million individuals a year through a network of approximately 4,000 clinic sites. The program is part of the U.S. public health safety net that is designed to serve individuals with lower incomes and those without insurance who otherwise may not be able to afford family planning services. Over the past number of years, the program has undergone substantial changes in the number of participating clinics and individuals it has been able to serve due to regulation changes and the COVID-19 pandemic.

The Title X program is led by a Deputy Assistant Secretary for Population Affairs who is appointed by the president, with program priorities and rules vacillating widely between different administrations. In particular, a provision of the Title X statute, Section 1008, that specifies that no federal funds appropriated under the program “shall be used in programs where abortion is a method of family planning” has been interpreted differently depending on who is in leadership. Throughout most of the history of the program, the ban has generally been understood to mean that Title X funds cannot be used to pay for or support abortion. However, the Trump and Reagan Administrations interpreted this more expansively as meaning that in addition to not paying for abortions, grantees were not permitted to use federal funds to promote, counsel, or refer clients for abortion or have co-located family planning services and abortion activities.

This interpretation, referred to as the Domestic Gag Rule by its opponents, is similar to the Mexico City Policy that requires foreign nongovernmental organizations to certify that they will not “perform or actively promote abortion as a method of family planning” using funds from any source (including non-U.S. funds) as a condition of receiving U.S. global family planning assistance. This policy has been reinstated and rescinded with the changing administrations for many years, which could be the future of the Title X regulations.

Title X Regulation Changes

In 2019, the Trump Administration made significant changes to the Title X regulations, which prohibited participating family planning clinics from providing abortion referrals and having co-located abortion services. This allowed grantees that had not previously participated in the program due to the requirement to provide nondirective pregnancy options counseling to begin receiving funding, such as the Obria Group, Inc., a Christian organization based in Southern California. Two other grantees joined the program under the Trump Administration, City of El Paso in Texas and Osceola Community Health Services in Florida. The new program regulations most notably resulted in a mass exodus of clinics from the Title X network, including over 400 Planned Parenthood clinics and almost 900 other Title X sites. From June 2019 to August 2021, almost a third of the Title X sites left the program (Figure 1).

Changes in Title X Clinic Participation Under Trump and Biden Administration Title X Regulations (2019-2023)

Not long after the clinics started leaving the program, the COVID-19 pandemic began, where fewer people were seeking in-person care. In 2018, the Title X program served 3.9 million clients, which decreased to 1.5 million by 2020, over a 60% reduction, due to the decrease in size of the network and the COVID-19 pandemic. After President Biden was elected in November 2020, the Department of Health and Human Services (HHS) issued proposed regulations in April 2021 reversing the Trump Administration’s regulations and again requiring comprehensive pregnancy options counseling and abortion referrals when desired, as well as allowing co-located abortion services. These regulations were finalized and became effective in November 2021 (Figure 2).

History of the Title X Network Under the Trump and Biden Administrations, 2018 to 2022

In January 2022 as part of the American Rescue Plan HHS awarded $6.6 million to 8 grantees to address “dire family planning needs” as part of a series of actions HHS took in response to Texas Law SB 8, which banned abortions in Texas after 6 weeks of pregnancy (Table 1).

January 2022 "Dire Need" for Title X Family Planning Services Supplemental Grant Awards

Title X Service Grants

In March 2022, HHS released a new funding announcement under the new regulations, which resulted in funding for 16 of the 18 grantees that had left the program under the Trump regulations. The two grantees that did not return as FY2022 grantees were Planned Parenthood of Illinois and Health Imperatives, Inc. in Massachusetts, although the network of clinics for these grantees stayed in the program, returning as sites under the Illinois Dept. of Public Health Family Planning Program and Massachusetts Department of Public Health grants, respectively. (Individual grantees can encompass multiple sites and clinics.) FY2022 grants were awarded to 76 grantees for a total of $256.6 million. The program has been level funded at $286 million for the past nine years despite inflation (Figure 3).

The Title X Program Has Been Flat Funded for the Past Nine Years and Has Not Kept up With Inflation

While these 76 grantees received 5-year awards to support their family planning networks, 13 grantees only received a one-year grant for FY2022 due to funding constraints. This resulted in 89 grantees funded at $265 million in FY2022 (Table 2). Additionally, in May 2022, HHS awarded supplemental funds totaling $16.3 million to 31 grantees to enhance and expand their telehealth infrastructure and capacity after the increase in the use of telehealth due to the pandemic. These funds were also made available through the American Rescue Plan for a 12-month project period.

Title X Grantees Receiving 1-Year Grants for FY2022 Instead of 5-Year Grants

For FY2023, HHS funded 87 grantees with $256 million. Eleven of the grantees that only received a one-year grant for FY2022 were re-funded in FY2023 with six receiving level funding and five receiving a decrease in funding. The City of El Paso did not reapply for FY2023 funding, and the State of Tennessee lost their Title X grant due to non-compliance with Title X regulations by not providing comprehensive pregnancy options counseling that includes referrals for abortion when desired.

Rebuilding the Title X Network

The Title X network has been rebuilding under the new regulations and funding. Of the 411 Planned Parenthood sites that left the program, 286 sites (70%) have rejoined.

Of the 869 other sites that left the program, 531 (61%) have returned. At the same time, there are 777 new sites that were previously not part of the program. This brings the current Title X network back to 4,108 sites, which is 2% more than the original 4,010 sites prior to the Trump regulations.

All six states that left the Title X network (HI, ME, OR, UT, VT, WA) under the Trump Administration’s regulations have returned with most of their sites or they have expanded their networks to new sites.

While most states had small increases in funding amounts from FY2019 to FY2022, California had a 42% decrease in funding from $21 million to $13.2 million. The state still managed to expand the number of Title X sites in their network and the grantee, Essential Access Health, recently received $60 million in state funding to expand reproductive health care for low-income individuals.

Nevada, which has five grantees, lost over a quarter of its funding from FY2019 to FY2022. Two of the grantees received larger grants (Nevada Primary Care Association and Southern Nevada Health District) and three of the grantees received less (Washoe County Health District, State of Nevada Division of Public & Behavioral Health, City of Carson City DBA Carson City Health & Human Services). Iowa has had a slight decrease in funding and the number of Title X clinics in Iowa has decreased by over 40%, largely due to the loss of the Planned Parenthood clinics in their network.

Impact of State Restrictions on Title X Funding

Two new grantees to the program, Bridgercare in Montana and Converge, Inc. in Mississippi, took over the Title X grants in their respective states in March 2022 after the state health departments had been the grantees for decades. Both grantees received slight increases in funding and Converge, Inc has been able to maintain Mississippi’s previous Title X network. However, the size of Montana’s Title X network has decreased slightly in response to a law passed by the Montana Legislature (House Bill 620), which prohibited the state from funding any organization that provides abortions, effectively excluding Planned Parenthood clinics from their Title X program.

In March 2023, Tennessee lost their Title X funding because of a state policy that required Title X clinics to only provide pregnancy options counseling for the options legal in the state, which excluded abortion, which is in violation of the federal requirements to provide comprehensive pregnancy options counseling. While Tennessee’s governor has said that the state will fund the health department for their lost Title X funding with $7.5 million in recurring annual state funding, it is unclear how long the state will maintain this funding. In Idaho, the Attorney General has clarified that the Idaho law banning abortion also prohibits Idaho medical providers from referring a woman across states lines to access abortion services, which would also be in violation of the Title X regulations requiring pregnancy options counseling. Planned Parenthood Great Northwest, Hawai’i, Alaska, Indiana, Kentucky, which is one of two Title X grantees in Idaho, is suing the Attorney General of the State of Idaho over their inability to provide comprehensive pregnancy options counseling to their clients.

This could become an issue in other states where abortion is banned and state laws or policies may be in direct conflict of Title X federal requirements, disqualifying a state health department from being a Title X grantee. There are currently 34 states with grantees that are state health departments and in 16 states the health department is the only Title X grantee, six of these are states where abortion is banned (AL, AR, LA, ND, SD, WI).

FY2023 Title X State Health Department Grantees

Current Title X Litigation

There are currently two lawsuits filed against HHS challenging aspects of the current Title X regulations. In a case filed in United States District Court for the Northern District of Texas, Amarillo Division in April 2020, Deanda v. Becerra, a father of three minor girls contends that the Title X provisions allowing minors to seek contraception without parental consent violates his rights as a parent under Texas law, and the due process clause of the fourteenth amendment. Judge Matthew Kacsmaryk, the only judge in the Amarillo division (and the same federal judge overseeing a case challenging approval of the abortion medication Mifepristone) ruled in favor of the plaintiff, stating that Title X does not preempt state laws requiring parental consent or notification before distributing contraception to minors, and that the Biden Administration Title X requirement violates the plaintiff’s fundamental right to control and direct the upbringing of his minor children. On December 20, 2022, the Court struck down as unlawful the provision of the regulations requiring Title X projects to provide minors services without requiring consent or notification of their parents or guardians. This ruling is not limited to the plaintiff or to Texas. In states that require parental consent or notification, minors may no longer be able to obtain contraceptive services without consent or notification. In February 2023, the Biden Administration appealed this decision to the Fifth Circuit Court of Appeals. The case is pending at the Fifth Circuit Court of Appeals, and the Biden Administration has requested oral argument.

On October 25, 2021, the state of Ohio, joined by 11 other states (AL, AZ, AK, FL, KS, KY, MO, NE, OK, SC, WV), filed a lawsuit in the US District Court for the Southern District of Ohio against HHS to block the implementation of the Biden Administration’s regulations. These states claim the final regulations violate Section 1008 of the Public Health Service Act that says none of the funds appropriated under Title X can be used in programs where abortion is a method of family planning. The litigants claim that by reinstating the regulations that allow co-located abortion services and require participating providers to offer referrals for abortions to clients who seek them, that HHS is not in compliance with the intent of the law. On December 29, 2021, the district court denied the plaintiffs’ motion for a preliminary injunction to block the Department of Health and Human Services from implementing or enforcing the final rule. The plaintiff states appealed this ruling to the Sixth Circuit Court of Appeals and the court heard oral arguments on October 27, 2022. In April 2023, the state of Arizona dropped out of the case (as the new governor and attorney general shifted to a Democratic administration). While this case is pending, the Biden Administration regulations, except for the parental consent provisions affected by the Deanda case discussed below, are in effect.

Looking Forward

The Biden Administration’s reversal of the Trump Administration’s Title X regulations has enabled grantees that left the program under the Trump regulations to rejoin. Many states have been able to rebuild their networks to where they were in 2019, and in some cases, have been able to increase the number of clinics in their networks. However, funding for Title X has not increased for the past nine years and some states are operating larger Title X networks with significantly less federal funding (e.g., California and Nevada).

With abortion banned or restricted in many states, access to Title X sexual and reproductive health services becomes even more important. While Tennessee is the first state to lose their Title X funding due to non-compliance around pregnancy options counseling after abortion has been banned in their state, other states may have similar conflicts. States with abortion bans may refuse to comply with the Title X regulations that require offering pregnancy options counseling that includes prenatal care and delivery; infant care, foster care, or adoption; and pregnancy termination, as well as abortion referrals upon request. In states where abortion is banned or restricted, this would require out-of-state referrals for those desiring abortion services.

HHS has released a grant opportunity forecast for $1.5 million designed to fund a currently funded Title X grantee to establish the Title X Nondirective Options Information, Counseling, and Referrals Hotline that will provide pregnant people with neutral and factual information, as well as nondirective counseling and referrals for those seeking this information. This hotline could help give people access to comprehensive information about pregnancy options regardless of where they live.

While there may be gaps in some states, HHS anticipated that the number of clients served by the program would return to around 4 million nationally by 2023, and with the Title X networks back to capacity in many states, it seems on track to reach that projection.

Appendix

Status of Title X Network from Before Trump Regulations to After Biden Reversal of Trump Regulations (2019-2023)

Title X FY2019, 2022, and 2023 Grantees and Awards

Health Care Disparities Among Asian, Native Hawaiian, and Other Pacific Islander (NHOPI) People

Published: May 24, 2023

Asian, Native Hawaiian, and Other Pacific Islander (NHOPI) people are a diverse and growing population in the U.S. (Figure 1). Asian people are the fastest-growing racial or ethnic group in the United States, almost doubling from 10.5 million to almost 20 million between 2000 and 2020. In addition, there are nearly 700,000 people in the country who identify as NHOPI. In this data note, we use 2021 American Community Survey (ACS) data to examine how demographic characteristics as well as measures of health coverage and other social and economic factors that drive health and health care vary for Asian and NHOPI people overall and by subgroups. We include data for smaller subgroups wherever available. Instances in which the unweighted sample size for a subgroup is less than 50 – which are smaller than what we would typically include in analysis like this — are noted in the figures, and confidence intervals for those measures are included in the Appendix. Although these small sample sizes may impact the reliability, validity, and reproducibility of data, they are important to include because they point to potential underlying disparities that are hidden without disaggregated data, further exacerbating health inequities.

Examining experiences among Asian and NHOPI people is important since broad data for Asian people often mask underlying disparities among subgroups of the population and disaggregated data are often not available or reported for NHOPI people. Understanding the experiences of Asian and NHOPI people is particularly important at this time given growing concerns about mental health and well-being amid a significant uptick in anti-Asian hate incidents since the pandemic, an increased focus on advancing health equity and addressing racism, and ongoing efforts to improve data collection and reporting, particularly for smaller population groups and subgroups of the broader racial and ethnic categories.

Figure 1: Asian and Native Hawaiian and Other Pacific Islander People (NHOPI) in the U.S., 2021

Demographics

The majority of Asian and NHOPI people in the U.S. are citizens, adults, and many are parents or living in multigenerational households (Figure 2). Asian and NHOPI people included larger shares of noncitizens relative to White people (25% and 14% vs. 1%). One in five Asian (20%) and 19% White people were children, while more than one in four (26%) NHOPI people were children. Larger shares of Asian people lived in households comprised of parents with children or multigenerational households as compared to White people (42% vs. 33%).

Citizenship and household status varied among Asian and NHOPI subgroups: For example, the share of Asian people who are noncitizens ranged from 5% among Hmong people to 55% among Mongolian people. Among NHOPI people, Native Hawaiian and Chamorro people were significantly less likely than NHOPI people overall to be noncitizens (at less than 1%). In contrast, Marshallese people were more likely to be noncitizens (54%). This variation reflects differences in birth citizenship rights across locations to which NHOPI people trace their origins. Specifically, people born in Hawaii and Guam (Chamorro people) are U.S. citizens by birth, while other Pacific Islander people, including those born in in the Marshall Islands, which is part of the Compact of Free Association (COFA) with the U.S are not conferred U.S. citizenship at birth. The share of these groups who are children also ranged widely, from 9% of Japanese people to 36% of Hmong people among Asian subgroups and from 17% of Fijian people to 43% of Marshallese people among NHOPI subgroups. Household composition also varied by subgroup. Among Asian subgroups, the share who were parents or living in multigenerational households ranged from 27% for Japanese people to 68% for Bhutanese people. Among NHOPI subgroups, Native Hawaiian people (27%) were less likely than the group overall to be in a multigenerational household, while Marshallese people were more likely (48%).

Citizenship, Age, and Household Type Among Asian and NHOPI People, 2021

Health Coverage

As of 2021, among the nonelderly population, 6% of Asian people and 11% of NHOPI people were uninsured (Figure 3). The uninsured rate for Asian people was slightly lower than the rate for White people (7%), while the rate for NHOPI people was higher. Across both groups, uninsured rates were lower for children compared to nonelderly adults. The shares of Asian people covered by private coverage were higher than the shares for White people and the shares covered by Medicaid were lower. In contrast, NHOPI people were less likely to have private coverage and more likely to be covered by Medicaid, with over half (52%) of NHOPI children being covered by Medicaid or the Children’s Health Insurance Program (CHIP).

Insurance Coverage among Nonelderly Asian and NHOPI People, 2021

There are wide variations in uninsured rates among Asian and NHOPI subgroups (Figure 4). As of 2021, among nonelderly Asian people, uninsured rates ranged from 4% for Asian Indian and Taiwanese people to 28% for Mongolian people. Among NHOPI people, uninsured rates ranged from 5% for Chamorro people to 24% for Marshallese people, although uninsured rates for other NHOPI subgroups were not statistically significantly different from nonelderly NHOPI people overall. Uninsured rates further varied by citizenship status, with higher uninsured rates for noncitizens across most groups. Among nonelderly Asian noncitizens, uninsured rates varied from 5% for Japanese people to 38% for Mongolian people. There were no statistically significant differences in uninsured rates among nonelderly NHOPI noncitizens. Of note, the sample sizes for some noncitizen subgroups were small (<50), which can lead to a higher degree of uncertainty, i.e., larger confidence intervals for their measures. Confidence intervals for each subgroup measure in Figure 4 can be found in the Appendix.

Uninsured Rates among Nonelderly Asian and NHOPI People Overall and by Citizenship Status, 2021

Socioeconomic Differences

A variety of social and economic factors influence individuals’ access to health coverage, their ability to access health care, and their overall well-being. While as a broad group Asian people often fare similar to or better than White people across many of these measures, some subgroups fare worse. On the other hand, NHOPI people generally fare worse than their White counterparts across a range of social and economic measures.

Data show variations in socioeconomic measures among nonelderly Asian and NHOPI subgroups, which may contribute to the differences in health coverage (Figure 5). Among Asian subgroups, there was an almost five-fold difference in the share of people who have received a bachelor’s degree or higher, with 18% of Laotian people having a bachelor’s degree or higher as compared to 87% of Taiwanese people. Overall educational attainment is lower among NHOPI people, with a lower share of Marshallese people (6%) having a bachelor’s degree or higher compared to nonelderly NHOPI overall, and a higher of Chamorro people (28%) having at least a college degree. The share of Asian households with at least one full-time worker also varied by subgroup, ranging from 66% among nonelderly Mongolian people to 91% among nonelderly Asian Indian people. Among NHOPI people, Fijian and Samoan people were slightly more likely than the overall group to have at least one full-time worker. Similarly, household income among Asian subgroups varied widely with the share of nonelderly people who lived in a low-income household (below 200% of the federal poverty level or $43,920 for a family of 3 in 2021) ranging from 12% among Asian Indian people to 55% among Mongolian people and 52% among Burmese people. Some of these differences are likely driven by differences in citizenship and visa status. For example, those entering the U.S. with work visas likely have higher median household incomes compared to those that entered as asylees and/or refugees. Many Burmese people immigrate to the U.S. as refugees fleeing war in their home country, which could contribute towards their lower household incomes. On the other hand, higher earning groups such as Taiwanese people and Asian Indian people usually immigrate through work visas. Despite eight in ten nonelderly Marshallese people living in a household with at least one full-time worker, 63% lived in a low-income household, while only 27% of Chamorro and Fijian people were low-income. Lower educational attainment as well as higher shares of noncitizens may in part explain the higher shares of Marshallese people living in low-income households.

Educational Attainment, Employment, and Household Income Among Nonelderly Asian and NHOPI People, 2021

Key Issues Looking Ahead

Understanding the experiences of Asian and NHOPI people is of particular importance at this time given growing concerns about mental health and well-being amid a significant uptick in anti-Asian hate incidents. The COVID-19 pandemic and underlying racism and discrimination have contributed to a significant rise in hate crimes against Asian people in the United States, which have contributed to deteriorating mental health among Asian people. In a 2021 survey, a majority of Asian Americans cited COVID cases being first reported in China and President Trump as major reasons for discrimination against the Asian and Pacific Islander community. Against the backdrop of these anti-Asian sentiments and actions, two tragic mass shootings occurred around this past Lunar New Year, of whom many of the victims were Asian. These tragic events and their devasting impacts on the community have highlighted the importance of understanding and addressing mental health needs among Asian and NHOPI people. Although overall rates of mental illness are generally lower among Asian people compared to White people, this finding may reflect underdiagnosis and underreporting. It also may mask variations in mental health among subgroups of the population. Among people with mental illness, Asian people are less likely to utilize mental health services compared to other racial and ethnic groups. In 2021, among adults with any mental illness in the past year, only 25% of Asian adults reported receiving mental health services compared to 52% of White adults (Figure 6). Data on utilization were not available for NHOPI people. Moreover, data show rising rates of suicide death among Asian and Pacific Islander adolescents (ages 12-17). Although they have lower rates of suicide deaths compared to their White peers, suicides were the leading cause of death among Asian and Pacific Islander children ages 10-14 and the second leading cause among those between the ages of 15 and 35 in 2020, and suicide death rates more than doubled among this population from 2010 (2.2 per 100,000) to 2020 (5.0 per 100,000).

Share of Adults (Ages 18 and up) with Any Mental Illness Who Received Mental Health Services in the Past Year, 2021

In the wake of the COVID-19 pandemic, there has been a heightened awareness and focus on addressing health disparities, including recognizing the ongoing impacts of historic actions and policies on health disparities today. Anti-Asian racism is not new within the United States. Anti-Asian sentiments and related Sinophobia are embedded in U.S. history, as evidenced by the implementation of the Chinese Exclusion Acts in the late 1800s and the incarceration of Japanese Americans in the twentieth century. Historical actions have also contributed to ongoing trauma and negative health outcomes for NHOPI people. In the 19th century, the U.S. began substantial expansion across the Pacific Ocean which included the colonization of many of the Pacific Islands, and the overthrow of the Hawaiian monarchy. Since occupation, the United States’ colonial, post-colonial, and military actions in the region have resulted in adverse socioeconomic, health, and environmental pollution-related legacies among local and Indigenous populations. In addition to these historic actions and their aftermath, Asian and NHOPI people have faced ongoing stresses associated with the perpetual foreigner and model minority stereotypes, and acculturation.

The federal government has taken several actions focused on advancing health equity broadly and in response to the rise in Asian hate and anti-Asian violence, specifically. Early in his presidency, President Biden issued a series of executive orders focused on advancing health equity, including orders that outlined equity as a priority for the federal government broadly and as part of the pandemic response and recovery efforts. Federal agencies were directed with developing Equity Action Plans that outlined concrete strategies and commitments to addressing systemic barriers across the federal government. In 2021, Congress enacted the COVID-19 Hate Crimes Act in response to the increase in anti-Asian violence during the pandemic. During that time, the Biden Administration also released Executive Order 14031 “Advancing Equity, Justice, and Opportunity for Asian Americans, Native Hawaiians, and Pacific Islanders,” which established the White House Initiative on Asian Americans, Native Hawaiians, and Pacific Islanders (WHIAANHPI). The WHIAANHPI is committed to advancing equity for Asian Americans, Native Hawaiians, and Pacific Islanders (AANHPI) by investing in AANHPI communities and responding to the spikes in anti-Asian violence. In January 2023, the White House announced its National Strategy to Advance Equity, Justice, and Opportunity for Asian American, Native Hawaiian, and Pacific Islander (AA and NHPI) Communities.

As part of efforts to address disparities and advance health equity, there are efforts underway to expand and improve availability of disaggregated data, including for Asian and NHOPI people. As shown in this analysis, Asian and NHOPI people have diverse characteristics and experiences that influence their health and health care. These differences point to the importance of having disaggregated data for Asian and NHOPI groups to identify disparities and direct efforts to address them. The Biden Administration has charged the government with addressing the systemic lack of disaggregated AANHPI data in federal statistical systems. The Interagency Working Group on Equitable Data in collaboration with the WHIANHPI is also working to improve research on policy and program outcomes for AANHPI communities. In April 2022, the working group released its Equitable Data Working Group Report, which highlighted the need to generate disaggregated data, increase access to disaggregated data, conduct equity assessments of federal programs, and emphasize accountability to communities in the United States. The Office of Management and Budget released proposals in January 2023 to update the minimum standards for collecting and presenting data on race and ethnicity for all federal reporting, including providing a separate racial category for people who identify as Middle Eastern or North African and moving to collect race and ethnicity through a combined single question instead of asking about Hispanic or Latino ethnicity in a separate question from race.

Appendix

Figure 4a: Share of All Nonelderly Uninsured Asian People, 2021

Figure 4a: Share of All Nonelderly Uninsured Asian People, 2021

Figure 4b: Share of Nonelderly Uninsured Asian Citizens, 2021

Figure 4b: Share of Nonelderly Uninsured Asian Citizens, 2021

Figure 4c: Share of Nonelderly Uninsured Asian Noncitizens, 2021

Figure 4c: Share of Nonelderly Uninsured Asian Noncitizens, 2021

Figure 4d: Share of All Nonelderly Uninsured NHOPI People, 2021

Figure 4d: Share of All Nonelderly Uninsured NHOPI People, 2021

Figure 4e: Share of Nonelderly Uninsured NHOPI Citizens, 2021

Figure 4e: Share of Nonelderly Uninsured NHOPI Citizens, 2021

Figure 4f: Share of Nonelderly Uninsured NHOPI Noncitizens, 2021

Figure 4f: Share of Nonelderly Uninsured NHOPI Noncitizens, 2021

(Back to top)

News Release

Survey Finds Many Medicaid Enrollees Unprepared for Eligibility Renewal Process, and Some Believe They Could Struggle to Find Coverage or End Up Uninsured if They Lose Medicaid

Published: May 24, 2023

A KFF survey of Medicaid enrollees largely fielded prior to states resuming their efforts to redetermine Medicaid enrollees’ eligibility reveals many enrollees are unprepared for the renewal process that could result in some losing their coverage either due to eligibility changes or paperwork issues.

During the COVID-19 pandemic, states suspended their Medicaid eligibility renewals in exchange for additional federal funding, ensuring continuous health coverage for enrollees. States recently have resumed eligibility renewals and as of April 1 could start to disenroll people who either no longer qualify or who do not complete the renewal process.

The survey found that nearly two-thirds (65%) of Medicaid enrollees were unsure whether states could remove people from the program if they no longer meet the eligibility requirements or don’t complete the renewal process. An additional small share (7%) incorrectly believe that states couldn’t do this.

More than four in 10 enrollees whose sole coverage is Medicaid say that if the state told them they were no longer eligible for Medicaid coverage, they would not know where to look for other coverage (27%) or end up uninsured (15%).

Other findings include:

  • Nearly half (47%) of Medicaid enrollees say they have not previously been through the Medicaid renewal process, including two-thirds (68%) of Medicaid enrollees who are 65 and older. This group may be less likely to understand the importance of completing the renewal paperwork to maintain their coverage.
  • A third (33%) of enrollees say they have not provided updated contact information to their state Medicaid agency in the past year. Some in this group may miss critical eligibility renewal notices that would require action on their part to maintain coverage.
  • About half (52%) of enrollees say they prefer to get Medicaid information via the U.S. mail, which is the primary way most states contact enrollees, though nearly half of enrollees say they would prefer to get Medicaid information another way – through email (29%), an online portal (11%), or text messages (8%).
  • About a third of Medicaid enrollees say they have had a change in income or other change that could now make them ineligible for Medicaid or are unsure if they have had such a change, but most enrollees (65%) say their circumstances have not changed, suggesting they are still eligible. Those who are still eligible could lose coverage if they don’t complete the renewal process.
  • The vast majority (85%) say that it would be useful if they had a navigator to help with the renewal process and look for other coverage if needed.

Designed and analyzed by public opinion researchers at KFF, the survey was conducted February 21-March 14, 2023, online and by telephone among a representative sample of 3,605 adults in the U.S. with health insurance coverage, including 1,212 individuals with Medicaid coverage. Interviews were conducted in English and in Spanish. The margin of sampling error is plus or minus 4 percentage points for those with Medicaid coverage. For results based on other subgroups, the margin of sampling error may be higher.

Poll Finding

The Unwinding of Medicaid Continuous Enrollment: Knowledge and Experiences of Enrollees

Published: May 24, 2023

Findings

During the COVID-19 pandemic, states kept people continuously enrolled in Medicaid in exchange for enhanced federal funding. Continuous enrollment in Medicaid ended on March 31, 2023, and over the coming months, states will redetermine eligibility for people enrolled in Medicaid and will disenroll those who are either no longer eligible or who are unable to complete the renewal process. This brief gauges Medicaid enrollees’ knowledge of and preparedness for the Medicaid renewal process and possible disenrollment from the program, based on early findings from KFF’s new Survey of Health Insurance Consumers, fielded February 21 through March 14, 2023.

Key Findings

Most Medicaid enrollees were not aware that states are now permitted to resume disenrolling people from the Medicaid program. Roughly two-thirds (65%) of all Medicaid enrollees say they are “not sure” if states are now allowed to remove people from Medicaid if they no longer meet the eligibility requirements or don’t complete the renewal process, with an additional 7% incorrectly saying states will not be allowed to do this. Three in four adults 65 and older say they are unsure if states are allowed to remove people from Medicaid, and Black adults are more likely than White adults to incorrectly say that states will not be allowed to do this. Just under three in ten (28%) overall are aware states are now allowed to remove people from Medicaid.

Large Majorities Across Demographic Groups Are Not Aware States Are Allowed To Remove People From Medicaid

Nearly half of Medicaid enrollees say they have not previously been through the Medicaid renewal process. This includes two-thirds (68%) of Medicaid enrollees who are 65 and older and more than half of Medicaid enrollees who are between the ages of 18 and 29 (53%). Prior to the pandemic, Medicaid enrollees had their Medicaid coverage redetermined at least annually, and many lost coverage at renewal even though they remained eligible because they faced administrative barriers to completing the process. Some Medicaid enrollees may not be aware that their Medicaid coverage was renewed because the state was able to complete the process using available data sources, and therefore did not require the enrollee to take any action to maintain coverage. Having past experience with actively renewing Medicaid coverage can help enrollees prepare for what to expect when their eligibility is redetermined in the coming months and improve their ability to navigate and complete the renewal process.

Nearly Half Of Medicaid Enrollees Have Not Been Through Renewal Process, Including Two-Thirds Of Older Adults

One-third of Medicaid enrollees say they have not provided updated contact information to their state Medicaid agency in the past year. States have taken several steps in the past year to encourage Medicaid enrollees to update their contact information to increase the likelihood that they receive renewal and other notices sent by the state. Two-thirds of Medicaid enrollees overall say they provided updated contact information to their state. Older adults are more likely than younger age groups to say they have not provided updated contact information to their state with about half (48%) of those 65 and older saying they have not done this, although older adults may have more stable contact information and consequently less need to report a change than other Medicaid enrollees. Older adults with Medicaid are also less likely to have either actively participated in a renewal process previously or provided updated contact information to their state Medicaid agencies. While one in five Medicaid enrollees overall haven’t done either of these things, the share increases to more than one-third (39%) of those 65 and older.

Fewer Older Adults With Medicaid Say They Have Provided Updated Contact Information To Their State Medicaid AgencyE

About half of Medicaid enrollees prefer to receive renewal information through  modes other than the U.S. mail, such as email or via an online portal. While most state Medicaid agencies use the U.S. mail service as their primary method of communicating with Medicaid enrollees, many have taken steps to expand the ways in which they communicate with enrollees to include email and through online accounts. The survey finds that providing information to Medicaid enrollees through multiple methods can increase the chances that they receive the information. The U.S. mail is how about half (52%) of Medicaid enrollees say they would prefer to receive information about renewing Medicaid coverage, while three in ten (29%) say they prefer to receive information via email, and about one in ten say they prefer to get information through an online portal (11%) or via text message (8%). Three-fourths of older adults say they prefer to receive renewal information through the mail, but younger adults are equally likely to prefer receiving information through the U.S. mail (39%) as through email (37%). Even among younger enrollees, text is not a preferred communication method.

While Older Medicaid Enrollees Prefer Receiving Renewal Information Via Mail, Younger Adults Are Equally Inclined To Prefer Email

About one-third of Medicaid enrollees (35%) say they have had a change in income or other change that could now make them ineligible for Medicaid or are unsure if they have had such a change, but most enrollees say their circumstances have not changed, suggesting they are still eligible. Increases in income or another change in circumstance, such as a pregnant woman who completes her postpartum coverage period and no longer qualifies on the basis of pregnancy, can make people ineligible for Medicaid. If these types of changes occurred while Medicaid coverage was protected, individuals may no longer qualify when the state redetermines their eligibility in the coming months. One in ten Medicaid enrollees say they may have had such a change, and another 25% are not sure. However, enrollees who have not experienced a change that would make them ineligible may still be at risk of losing coverage if they are unable to complete the renewal process. Younger adults are more likely than their older counterparts to say they think they have had a change that would make them ineligible. About one in eight of 18–29-year-olds (12%) and 30-49-year-olds (13%) say they think they have had such a change, compared to very small shares of older adults (4% of those ages 50-64 and 2% of those ages 65 and older).

Some Young Adults Say They Have Had A Change That Could Make Them Ineligible For Medicaid Coverage, One In Four Are Unsure

While about six in ten of those with Medicaid as their only source of coverage would look for coverage from other sources if they were told they were no longer eligible, over four in ten say they wouldn’t know where to look for other coverage or would be uninsured. Asked what they would do if informed by their state that they are no longer are eligible for Medicaid, about six in ten of those with Medicaid as their only source of coverage say they would look for coverage somewhere else including one-third (32%) who say they would look for coverage on the marketplaces, and one in eight who say they would look for coverage through their employer (13%), Medicare (12%), or directly from an insurance company (12%). About one in four adults (27%) with Medicaid as their only source of coverage say they wouldn’t know where to look for coverage if they were no longer eligible for Medicaid and an additional 15% say they would be uninsured.

One In Four Medicaid Enrollees Say They Don't Know Where Else To Look For Health Insurance, One In Seven Say They Will Be Uninsured If No Longer Eligible

The large majority of Medicaid enrollees say having an expert help with the renewal process would be useful. As Medicaid enrollees begin the renewal process, nearly nine in ten say having a state expert to help them navigate the process of renewing their Medicaid coverage and looking for other coverage, if needed, would be at least “somewhat useful.” About four in ten (44%) Medicaid enrollees say having a navigator would be “very useful” in helping them with the renewal process with an additional four in ten (41%) saying it would be “somewhat useful.” About one in six either say it would be “not too useful” (11%) or “not at all useful” (3%).

Large Majorities Of Medicaid Enrollees Say Navigators Could Be Helpful To Them During Renewal Process

Implications

As states resume disenrollments following the end of the Medicaid continuous enrollment provision, many Medicaid enrollees have been unaware of and may not be prepared for the coming changes, particularly older enrollees and enrollees ages 18-29. About half of enrollees say they have not completed a renewal process previously, so may not be on the lookout for renewal notices and may not be familiar with the steps they need to take to complete the process and maintain coverage if they remain eligible. While about half of Medicaid enrollees prefer to receive communications through modes other than the U.S. mail, some states continue to use the U.S. mail as the only method for sending notices. And, while only one in ten Medicaid enrollees say they have had a change that would likely make them ineligible for Medicaid, some are unsure, and many people are expected to fall through the cracks and lose coverage during the unwinding period even though they are still eligible. Engaging key stakeholders, including Medicaid managed care organizations (MCOs), Medicaid providers, and community-based organizations, in providing outreach to Medicaid enrollees, including targeted outreach to older adults, can raise awareness about the need to complete the renewal process. In addition, connecting people on Medicaid with Navigators and other organizations who can assist them with the renewal process can help increase the number of people who complete their renewals and retain coverage if they remain eligible or know where to look for and enroll in other coverage if they are determined to no longer be eligible. 

Methodology

This KFF Survey of Health Insurance Consumers was designed and analyzed by public opinion researchers at KFF. The survey was designed to reach a representative sample of insured adults in the U.S. The survey was conducted February 21 – March 14, 2023, online and by telephone among a nationally representative sample of 3,605 U.S. adults who have employer sponsored insurance plans (978), Medicaid (815), Medicare (885), Marketplace plans (880), or a Military plan (47).

The sample includes 2,595 insured adults reached through the SSRS Opinion Panel either online or over the phone (n=75 in Spanish). The SSRS Opinion Panel is a nationally representative probability-based panel where panel members are recruited randomly in one of two ways: (a) Through invitations mailed to respondents randomly sampled from an Address-Based Sample (ABS) provided by Marketing Systems Groups (MSG) through the U.S. Postal Service’s Computerized Delivery Sequence (CDS); (b) from a dual-frame random digit dial (RDD) sample provided by MSG. For the online panel component, invitations were sent to panel members by email followed by up to three reminder emails. 2,500 panel members completed the survey online and panel members who do not use the internet were reached by phone (95). Another 504 respondents were reached online through the Ipsos Knowledge Panel This panel is recruited using ABS, based on a stratified sample from the CDS.

Another 289 (n=10 in Spanish) interviews were conducted from a random digit dial (RDD) of prepaid cell phone numbers (n=190) and landline telephone numbers (n=99). Phone numbers used for the prepaid cell phone component were randomly generated from a cell phone sampling frame with disproportionate stratification aimed at reaching Hispanic and non-Hispanic Black respondents. Stratification for the prepaid cell phone sample was based on incidence of the race/ethnicity groups within each frame. Phone numbers for the landline component were randomly generated from a landline sampling frame utilizing MSG’s listed household sampling frame to identify households with an adult age 65 or older and therefore more likely to have Medicare. This landline sample was also disproportionately stratified to reach African American and Hispanic respondents. An additional 217 respondents were reached by calling back respondents who said they were insured in previous KFF probability-based polls. Respondents in the phone samples received a $10 incentive via a check received by mail. SSRS web respondents received a $5 electronic gift card incentive (some harder-to-reach groups received a $10 electronic gift card). Ipsos Knowledge Panel respondents were included in raffles and sweepstakes for cash prizes as appreciation for their participation.

Respondents with Employer-sponsored plans, Medicaid, Medicare, and Marketplace plans from the combined phone and panel samples were weighted separately to match each group’s demographics using data from the 2021 American Community Survey (ACS). Weighting parameters included gender, age, education, race/ethnicity, and region. The weights take into account differences in the probability of selection for each sample type (cellphone sample, landline sample, callback phone sample, and panel). This includes adjustment for the sample design, within household probability of selection, and the design of the panel-recruitment procedure. The total sample of insured adults was also weighted to match demographics of insured adults using data from the 2021 American Community Survey (ACS).

The margin of sampling error including the design effect for the full sample is plus or minus 2 percentage points. Numbers of respondents and margins of sampling error for key subgroups are shown in the table below. For results based on other subgroups, the margin of sampling error may be higher. Sample sizes and margins of sampling error for other subgroups are available by request. Sampling error is only one of many potential sources of error and there may be other unmeasured error in this or any other public opinion poll. KFF public opinion and survey research is a charter member of the Transparency Initiative of the American Association for Public Opinion Research.

This work was supported in part by the Robert Wood Johnson Foundation. We value our funders. KFF maintains full editorial control over all of its policy analysis, polling, and journalism activities.

GroupN (unweighted)M.O.S.E.
Total insured adults3,605± 2 percentage points
Insured adults with Medicaid coverage1,212± 4 percentage points
News Release

Recent Widening of Racial Disparities in U.S. Life Expectancy Was Largely Driven by COVID-19 Mortality

Published: May 23, 2023

During the COVID-19 pandemic, the U.S. population experienced the most significant two-year decline in life expectancy in roughly a century, according to new research by KFF, with data showing that COVID-19 deaths disproportionately impacted people of color and exacerbating longstanding racial disparities in life expectancy. While overall U.S. life expectancy declined by 2.7 years between 2019 and 2021, American Indian and Alaskan Native (AIAN) people experienced a decline of 6.6 years, Hispanic people and Black people dropped 4.2 and 4 years, respectively, compared to a decline of 2.4 years for White people and 2.1 years for Asian people

Cancer and heart disease continue to be the leading causes of death for the U.S. population and in 2020 COVID-19 joined them in the ranks, but the pandemic has coincided with other increases in causes of death. Liver disease rose to the ninth leading cause of death in 2021, reflecting a rise in alcohol-related deaths, with AIAN people experiencing the most significant increase in this cause of death.Increases in drug overdose deaths were a major factor in the rise of unintentional injury deaths from 2019 to 2021, although its ranking did not fluctuate much within racial groups.

While suicide’s ranking among the leading causes of death fell from 2019 to 2021, there was a significant increase in suicides among Black and White people and AIAN men.Provisional 2022 data indicate a decrease in overall mortality from 2021, reflecting declines in COVID-19 deaths overall. However, AIAN and Black people continue to have higher COVID-19 death rates than White people.Read the brief for a discussion about addressing underlying drivers of U.S. life expectancy racial disparities, including inequities in health insurance coverage, access to care, and social and economic factors that drive health.