What is Driving Widening Racial Disparities in Life Expectancy?

Published: May 23, 2023

Introduction

Amid the COVID-19 pandemic, life expectancy in the U.S. declined 2.7 years between 2019 and 2021, from 78.8 years to 76.1 years, marking the largest two-year decline in life expectancy since the 1920’s. This decline further widened the existing gap in life expectancy between the U.S. and other comparably large and wealthy countries. It also exacerbated longstanding racial disparities in life expectancy and mortality within the U.S., contributing to excess deaths and increased costs. This analysis examines trends in life expectancy and leading causes of death by race and ethnicity and discusses the factors that contribute to racial disparities in life expectancy. In sum, it finds:

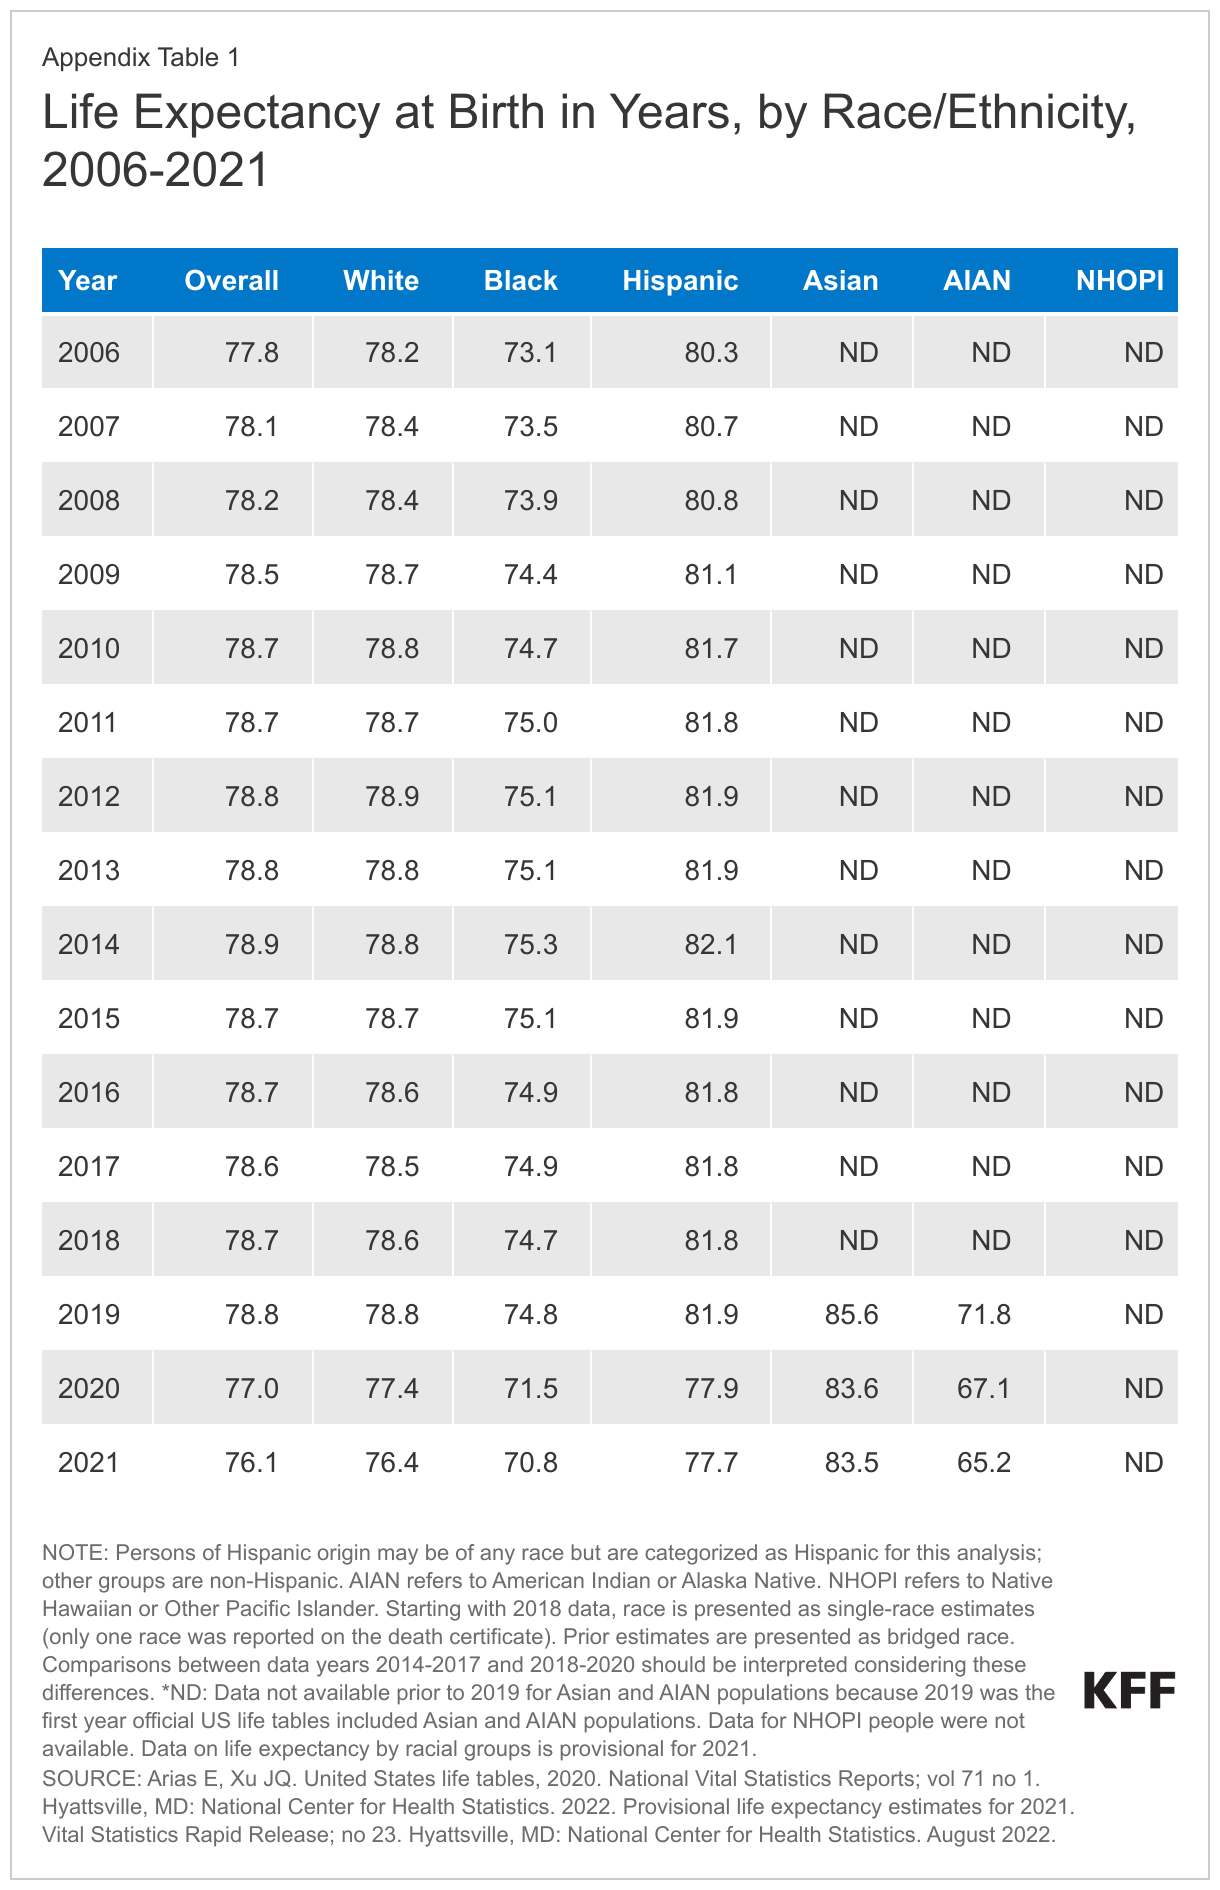
  • There was a sharp drop-off in life expectancy between 2019 and 2021, with particularly large declines among some groups. American Indian and Alaska Native (AIAN) people experienced the largest decline in life expectancy of 6.6 years during this time, followed by Hispanic and Black people (4.2 and 4.0 years, respectively).
  • Reflecting these declines, provisional data for 2021 show that life expectancy was lowest for AIAN people at 65.2 years, followed by Black people, whose expectancy was 70.8 years, compared with 76.4 years for White people and 77.7 years for Hispanic people. It was highest for Asian people at 83.5 years. Data were not reported for Native Hawaiian and Other Pacific Islander (NHOPI) people.
  • These declines were largely due to COVID-19 deaths and reflect the disproportionate burden of excess deaths, including premature excess deaths (before age 75), among people of color during the pandemic. Although COVID-19 mortality was a primary contributor to the recent decrease in life expectancy across groups, leading causes of death vary by race and ethnicity.

These recent stark declines and widening racial disparities in life expectancy amplify the importance of addressing underlying drivers of these disparities, including inequities in health insurance coverage and access to care and social and economic factors that drive health.

Life expectancy at birth represents the average number of years a group of infants would live if they were to experience throughout life the age-specific death rates prevailing during a specified period. Life expectancy is one of the most used measures of population health, enabling comparisons in health status between countries, states, local communities, and demographic groups. Differences in life expectancy occur across a broad range of dimensions which often intersect with each other, including race, socioeconomic status, gender, geography, and other characteristics. For example, In the U.S. and all other comparable countries, men tend to have shorter life expectancy at birth than women. In 2021, life expectancy for women in the U.S. was 5.9 years higher than for men (79.1 years vs. 73.2 year, respectively), and similar gender disparities persisted within racial and ethnic groups. This analysis focuses on differences in life expectancy by race and ethnicity overall, but within racial and ethnic groups there is variation by these other factors, such as gender.

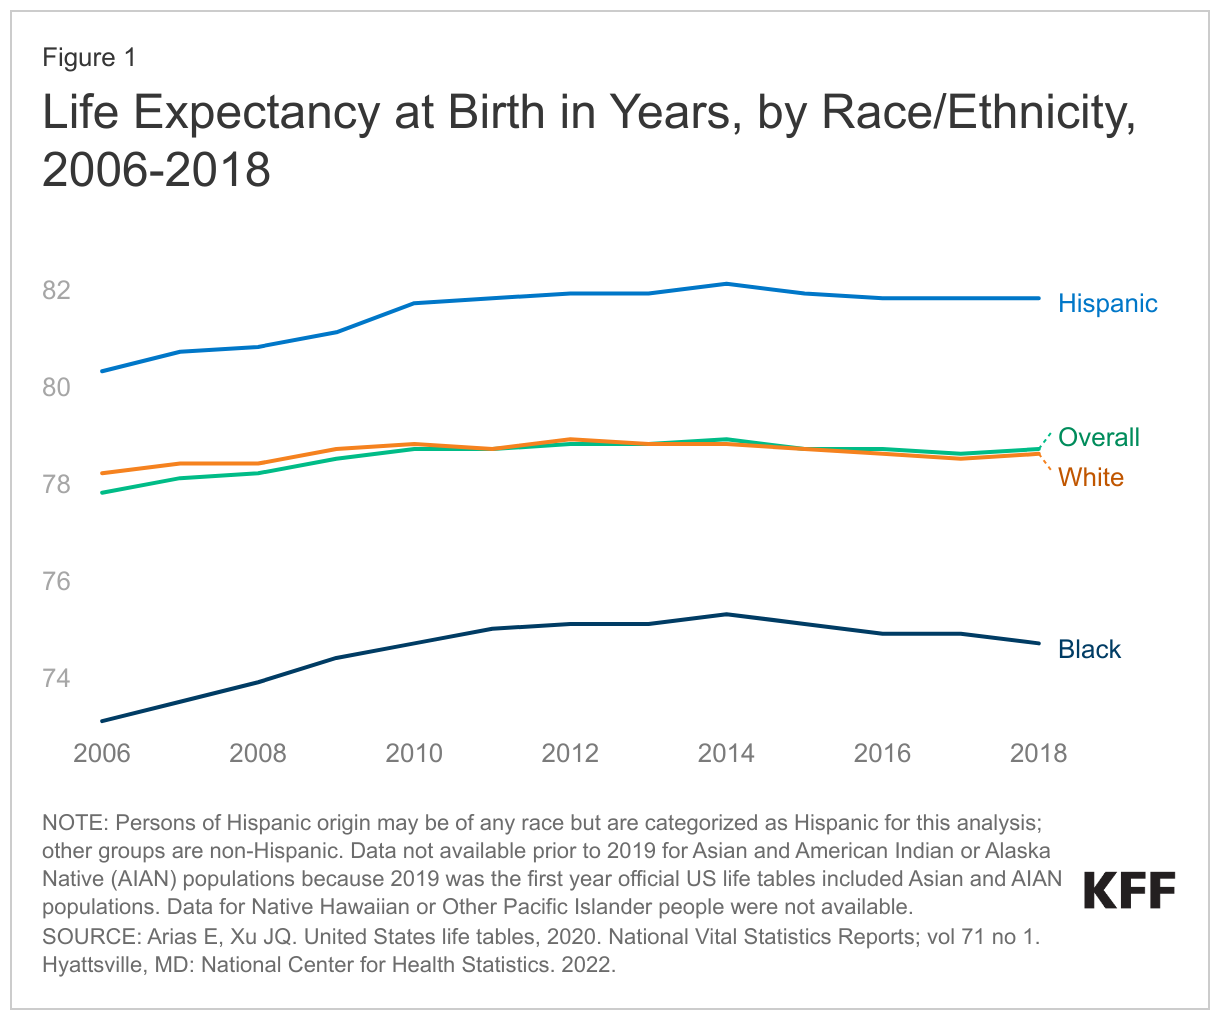
Prior to 2015, there were relatively steady increases in life expectancy in the U.S., but racial disparities persisted. Before 2015, life expectancy in the U.S. steadily increased with an overall gain of about 10 years between 1960 and 2015 from 69.7 years to 79.4 years. While there have been large gains in life expectancy across racial and ethnic groups, racial disparities have been longstanding and persisted over time. Black people have consistently had lower life expectancy than White people, while, conversely, Hispanic people have consistently had longer life expectancy compared to White people. When life expectancy reached its peak in 2014, life expectancy for Black people was more than three years shorter than White people (75.3 vs. 78.8 years), and Hispanic people had a longer life expectancy at 82.1 years (Figure 1 and Appendix Table 1). (Data were not available for other groups.)

Following this peak in 2014, life expectancy declined for the first time in over two decades. Between 2014 and 2017, overall life expectancy declined by 0.3 years with a slightly larger decline for Black people (0.4 years) compared with Hispanic and White people (0.3 years for both) (Figure 1 and Appendix Table 1). Separate data were not reported for Asian, AIAN and NHOPI people for this period. Research suggests that increases in mortality due to suicide, drug overdose and alcohol abuse were drivers of the decreasing life expectancy during this time. In 2018 and 2019, life expectancy remained relatively stable overall and across groups.

Life Expectancy at Birth in Years, by Race/Ethnicity, 2006-2018

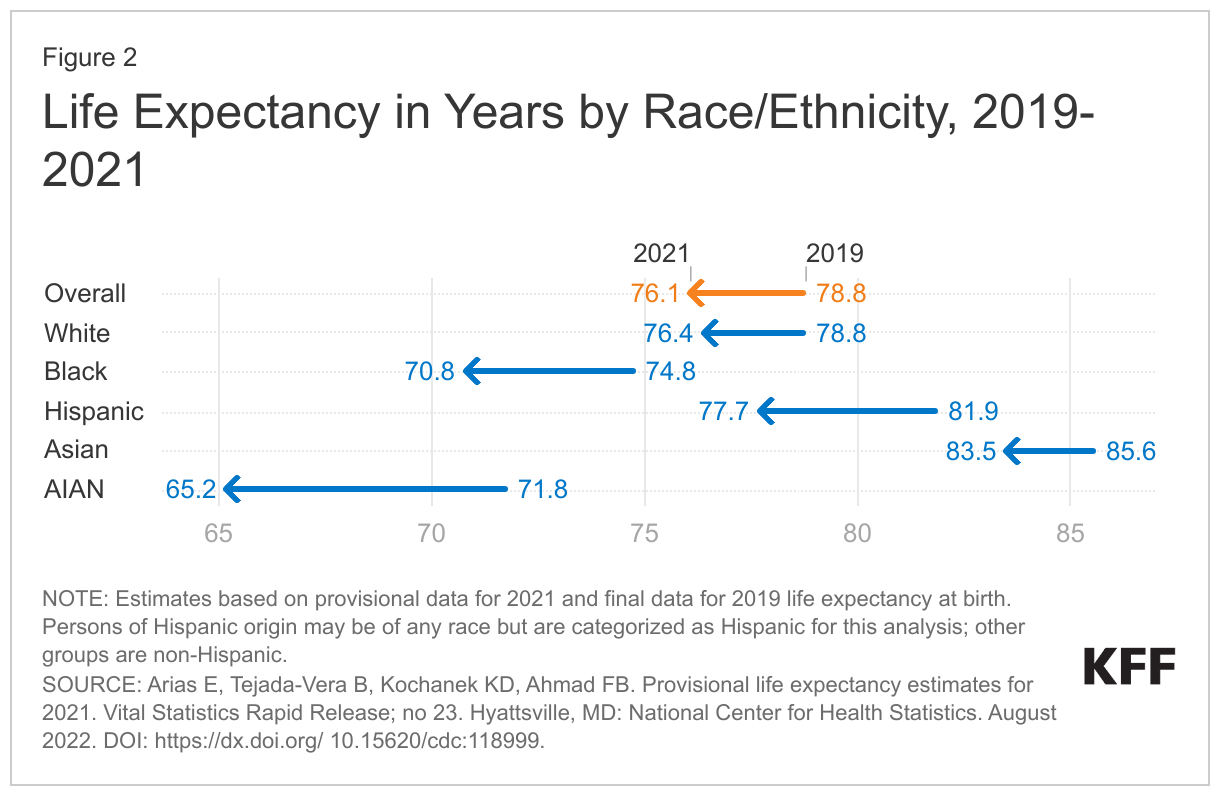
Life expectancy sharply declined by 2.7 years between 2019 and 2021, and disparities widened amid the COVID-19 pandemic (Figure 2). In 2019, prior to the onset of the pandemic, overall life expectancy was 78.8 years. AIAN people had the lowest life expectancy at 71.8 years, followed by Black people at 74.8. These groups both had lower life expectancies than White people, whose life expectancy was 78.8 years. Hispanic and Asian people had longer life expectancies of 81.9 and 85.6 years, respectively. The onset of the COVID-19 pandemic in 2020 resulted in higher mortality rates. Because life expectancy is based on death rates for a given period, these increased mortality rates drove declines in life expectancy in 2020 and 2021. Overall life expectancy declined by 2.7 years between 2019 and 2021, with AIAN people experiencing the largest life expectancy decline of 6.6 years, followed by Hispanic and Black people (4.2 and 4.0 years, respectively), and a smaller decline of 2.4 years for White people. Asian people had the smallest decline in life expectancy of 2.1 years between 2019 and 2021. These declines further widened gaps in life expectancy for AIAN and Black people compared to White people and reduced the advantage in life expectancy for Hispanic people relative to White people. As of 2021, provisional data show that life expectancy was lowest for AIAN and Black people at 65.2 years and 70.8 years, respectively, compared to 76.4 years for White people and 77.7 years for Hispanic people. It was highest for Asian people at 83.5 years. Data were not available for NHOPI people. Given that life expectancy reflects death rates from a specified year and provisional data from 2022 show that overall mortality declined 5.3% between 2021 and 2022, reflecting a fall-off in COVID-19 deaths, there may be small increases in life expectancy in upcoming years.

Life Expectancy in Years by Race/Ethnicity, 2019-2021

Causes of Recent Life Expectancy Declines

The declines in life expectancy between 2019 and 2021 largely reflect an increase in excess deaths amid the COVID-19 pandemic, which disproportionately impacted Black, Hispanic, and AIAN people. KFF analysis finds the pandemic was associated with faster rises in premature mortality rates and resulted in more excess years of life lost for people of color compared to their White counterparts, with people of color accounting for 59% of excess years of life lost while making up 40% of the population. Other analysis further finds that COVID-19 mortality had the largest contribution to the decline in life expectancy between 2020 and 2021 among AIAN, Black and White people, accounting for 21.4%, 35.0%, and 54.1% of their declines, respectively. Among Hispanic and Asian people, COVID-19 had the second largest contribution to the decline in life expectancy, accounting for 25.5% and 16.6% of their declines, respectively. The largest contributor to the decline for Hispanic people was an increase in mortality due to unintentional injuries, while growth in cancer deaths was the primary contributor to the decline for Asian people between 2020 and 2021.

Although COVID-19 mortality was a primary contributor to the recent decrease in life expectancy across groups, leading causes of death varied by race and ethnicity. Overall, COVID-19 was the third leading cause of death in 2021, after heart disease and cancer. However, COVID-19 was the top leading cause of death for Hispanic and AIAN people, followed by heart disease and cancer (Figure 3). Among Black, Asian, and White people, COVID-19 was the third leading cause of death, outranked by heart disease and cancer.

Beyond COVID-19 becoming a leading cause of death, there were other changes in leading causes of death that occurred during the pandemic (Figure 3). For example, flu activity has been lower since the beginning of the pandemic, leading to flu and pneumonia falling out of the ten leading causes of death in 2021. In contrast, liver disease rose to the ninth leading cause of death, reflecting sharp increases in alcohol-related deaths during the pandemic, with AIAN people experiencing the largest increase from 44.7 per 100,00 in 2019 to 77.8 per 100,000 in 2021. Deaths related to unintentional injuries also increased between 2019 and 2021, largely driven by increases in drug overdose deaths. Although suicide rates dropped out of the top ten leading causes of death overall during the pandemic (10th leading cause of death in 2019 vs. 11th in 2021), there was a significant increase in suicide deaths between 2020 and 2021 among Black and White men and women and AIAN men, and suicide remained the ninth leading cause of death for AIAN people and the tenth leading cause for White people in 2021. Although homicide deaths increased between 2020 and 2021, Black people are the only racial group for which homicide was a top ten cause of death in 2021, reflecting high rates of homicide among young Black men. For example, homicide was the leading cause of death in 2021 among Black males ages 15-34, and the death rate was 20 times higher than their White counterparts (126.1 per 1000,000 vs. 6.1 per 100,000), continuing a disparity in homicides that has existed for decades.

Top 10 Leading Causes of Death in the U.S. (Age-Adjusted Death Rates), by Race/Ethnicity, 2019 and 2021

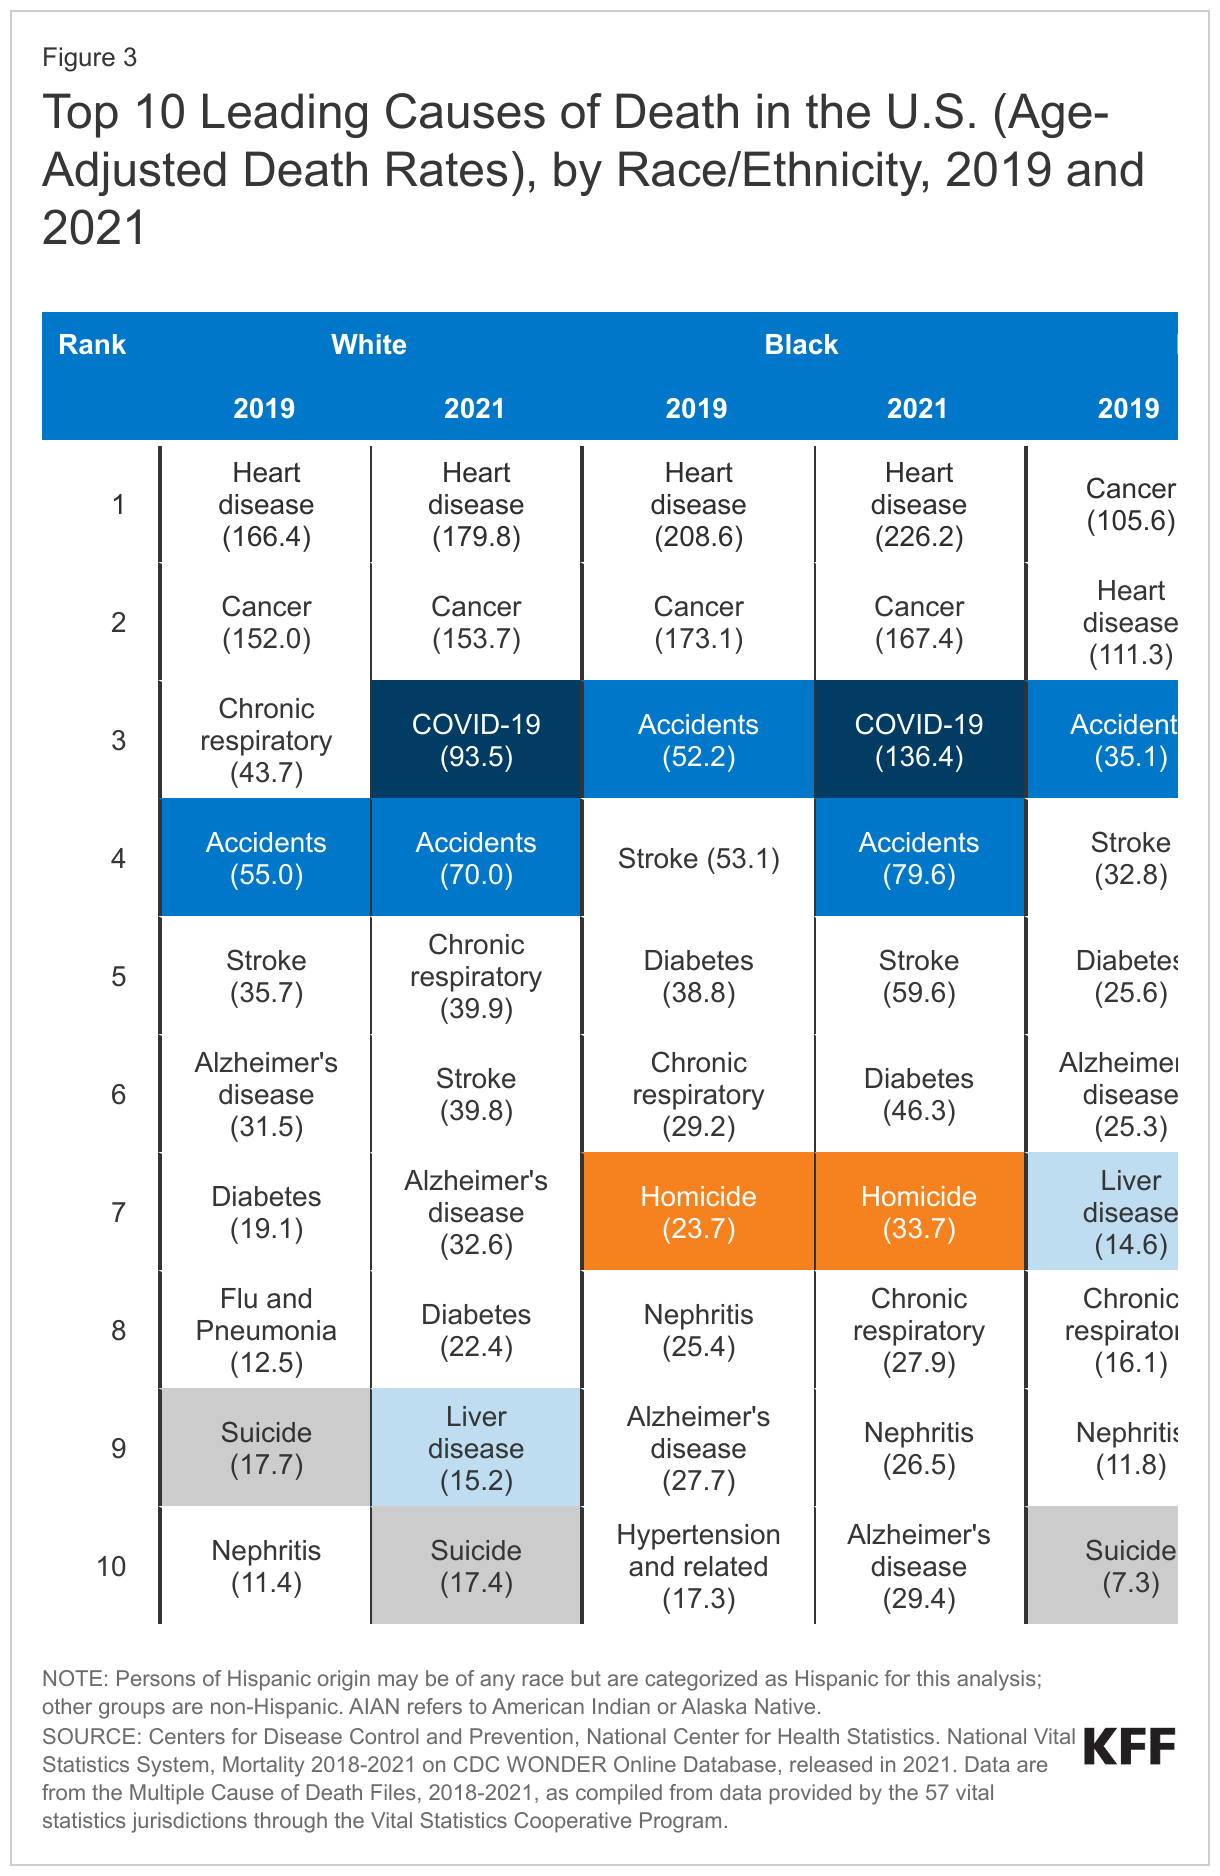
Provisional data from 2022 show that overall mortality declined 5.3% between 2021 and 2022, and that, in 2022, the three leading causes of death were heart disease, cancer, and unintentional injuries. During this time, COVID-19 deaths declined almost 50% overall and across all racial and ethnic groups, dropping to the fourth leading cause of death. Despite these declines in COVID-19 deaths, AIAN and Black people continued to have higher COVID-19 death rates compared to White people. Declining death rates from COVID-19 may improve life expectancy overall, however racial gaps will likely persist given the continued disparities in COVID-19 and other leading causes of death.

Factors Contributing to Racial Life Expectancy Disparities

Research suggests that the factors driving disparities in life expectancy are complex and multifactorial. They include differences in health insurance coverage and access to care, social and economic factors, and health behaviors that are rooted in structural and systemic racism and discrimination (Figure 4).

Figure 4: Health Disparities are Driven by Social and Economic Inequities​

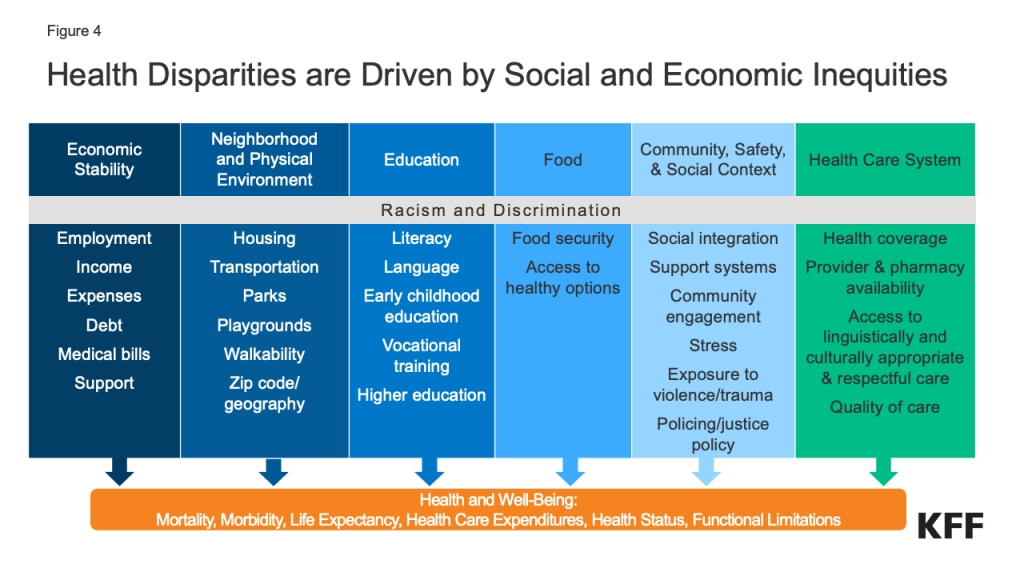
People of color are more likely than their White counterparts to be uninsured and to face other barriers to accessing health care that may contribute to shorter life expectancy. Data show that people of color are less likely to have health insurance and more likely to face barriers to accessing care, such as not having a usual source of care. Among AIAN people, chronic underfunding of the Indian Health Service further contributes to barriers to health care. Research shows that, overall, uninsured people are more likely than those with insurance to go without needed medical care due to cost and less likely to receive preventive care and services. Research further shows that uninsured people have higher mortality rates and lower survival rates than people with insurance.

Underlying social and economic inequities also drive disparities in mortality and life expectancy. Hispanic, AIAN, and Black people are more likely to have lower incomes and educational attainment levels compared to White people, and studies find that people with higher incomes and more education live longer lives. Other social and economic factors may also affect life expectancy. For example, historic housing policies, including redlining, and ongoing economic inequities have resulted in residential segregation that pushed many low-income people and people of color into segregated urban neighborhoods. Research finds that living in racially segregated neighborhoods is associated with shorter life expectancy and higher mortality rates for Black people.

Social and economic factors can also shape health behaviors and exposure to health risks that influence life expectancy,  For example, Black and AIAN people  have higher rates of smoking, substance and alcohol use disorders, and obesity compared to White people. Research suggests that eliminating smoking and obesity would greatly narrow disparities in life expectancy between Black and White people. People of color are also disproportionately affected by violence, including police and gun-related violence. Research shows African American and AIAN men and women and Latino men are at increased risk of being killed by police compared to their White peers. Black and Hispanic adults also are more likely than White adults to worry about gun violence according to 2023 KFF survey data. Other KFF analysis shows that firearm death rates increased sharply among Black and Hispanic youth during the pandemic driven primarily by gun assaults and suicide by firearm.

Research also highlights the role of racism and discrimination in driving racial disparities in mortality. Many of the inequities described above are rooted in racism and discrimination. Racism also contributes to lower quality of care among people of color. For example, a KFF/The Undefeated survey found that most Black adults believe the health care system treats people unfairly based on their race, and one in five Black and Hispanic adults report they were personally treated unfairly because of their race or ethnicity while getting health care in the past year. Beyond driving structural inequities and differences in experiences obtaining health care, research also demonstrates that racism and discrimination have direct negative impacts on health. For example, research finds that the cumulative effects of exposure to racism and chronic stress, referred to as allostatic load, may contribute to a more rapid decline in health and higher mortality among Black people. The health of AIAN people has also been negatively affected by ongoing racism and discrimination, and intergenerational trauma stemming from historical actions and policies, including genocide, removal from native lands, and assimilation efforts, including Indian boarding schools.

Some life expectancy patterns are not fully understood or observable in the data presented. Notably, Hispanic people have longer life expectancy than their White counterparts despite experiencing increased barriers to accessing health care and social and economic challenges typically associated with poorer health outcomes. Researchers have hypothesized that this finding, sometimes referred to as the Hispanic or Latino health paradox, in part, may stem from variation in outcomes among subgroups of Hispanic people by origin, nativity, and race, with better outcomes for some groups, particularly recent immigrants to the U.S. However, the findings still are not fully understood. Measures of life expectancy for Asian people as a broad group may mask underlying differences among subgroups of the population who vary across health access and social and economic factors. Research has shown variation in life expectancy among Asian subgroups, with Chinese people having the longest life expectancy and Vietnamese people having the shortest life expectancy, which may in part reflect differences in socioeconomic status. Additionally, data limitations for NHOPI people prevented the ability to include them in this analysis. Efforts to expand and improve data collection for NHOPI people will be important to gain a better understanding of their experiences, particularly since they suffered disproportionate impacts on mortality from COVID-19.

Conclusion

Overall, the data suggest that the COVID-19 pandemic exacerbated longstanding racial disparities in life expectancy. The recent declines and widening of disparities in life expectancy highlight the urgency and importance of addressing disparities in health broadly and increased attention to disparities in mortality and life expectancy specifically. Continued efforts within and beyond the health care system will be important to reduce ongoing racial disparities in life expectancy, many of which are rooted in systemic racism. Within the health care system, these may include ongoing efforts to reduce gaps in health insurance, increase access to care, and eliminate discrimination and bias. Beyond the health care system, addressing broader social and economic factors, including those that drive disparities in behavioral risks, will also be important.

Appendix

Life Expectancy at Birth in Years, by Race/Ethnicity, 2006-2021

(Back to top)

News Release

What Are the Exceptions to State Abortion Bans?

KFF Reviews Exceptions to State Abortion Bans and Key Issues for Access and Health

Published: May 18, 2023

A new KFF analysis reviews exceptions to abortion bans and describes how the stated aim to provide life-saving and health-preserving abortion care may not be achieved in practice. Abortion is currently banned in 14 states and many other states have attempted to ban or severely restrict abortion access. Exceptions to state abortion bans generally fall into four general categories: to prevent the death of the pregnant person, when there is risk to the health of the pregnant person, when the pregnancy is the result of rape or incest, and when there is a lethal fetal anomaly.

  • While the state bans and restrictions include life or health exceptions, the vagueness of the language describing them can effectively restrict the ability of clinicians to exercise their own medical judgement based on their expertise and accepted standards of care.
  • Abortion bans and restrictions have led physicians to delay providing miscarriage management care. 
  • Mental health exceptions are rare even though 20% of pregnancy-related deaths are attributable to mental health conditions. 
  • Few state abortion bans contain exceptions for pregnancies resulting from rape or incest and law enforcement involvement is often required to document the sexual assault. 
  • In states where there is more than one abortion ban, the exceptions can be at odds with each other, creating confusion among patients and providers.  

Read the brief, “A Review of Exceptions in State Abortions Bans: Implications for the Provision of Abortion Services” to learn more about how exceptions to abortion bans impact access to abortion care for people across the United States.

News Release

What is the Potential Impact of New Drugs for Obesity and Alzheimer’s Disease on Medicare Costs, Coverage and Beneficiaries? 

Published: May 18, 2023

Two new KFF analyses examine the potential impact of Medicare coverage of new prescription drugs for obesity and Alzheimer’s disease on program spending and beneficiary out-of-pocket costs, as well as the role that the Inflation Reduction Act could play in mitigating these effects.

Manufacturers of both types of drugs are lobbying for broad Medicare coverage of them, though they face different challenges.

The availability of effective weight-loss drugs, including Novo Nordisk’s Ozempic and Wegovy (semaglutide) and Eli Lilly’s Mounjaro (tirzepatide), has the potential to be transformative for people who struggle with obesity and obesity-related medical conditions. But, as the first analysis explains, these drugs, which are expensive, are not covered by Medicare because current law prohibits Medicare from covering drugs prescribed for weight loss. Congress would need to amend the law for weight-loss drugs to be covered under Medicare, though coverage could also potentially be achieved administratively through a demonstration waiver or a Center for Medicare and Medicaid Innovation model.

Without coverage, access to these relatively high-priced drugs will continue to be limited to people who can afford them, raising equity concerns. Wegovy, for example, has an estimated annual net price of $13,600. While Black Medicare beneficiaries have the highest rates of obesity, they may be least able to afford these new drugs, given their substantially lower incomes and assets compared with White beneficiaries.

In the fight against Alzheimer’s, the Food and Drug Administration will soon announce whether it will grant full approval to the new drug Leqembi (lecanemab), made by Eisai and Biogen, after granting accelerated approval in January. Our second analysis explains that, if that happens, Medicare is expected to cover Leqembi for all indicated populations. Medicare coverage of a drug that could slow the progression of cognitive decline offers hope for Alzheimer’s patients and their families. But it also raises concerns about the potential impact on Medicare spending.

The take-up rate of Leqembi among eligible individuals is difficult to estimate, but for illustrative purposes, if five percent of the 6.7 million older adults in the United States with Alzheimer’s disease were to take Leqembi, at the annual list price of $26,500, this would add an estimated $8.9 billion to Medicare Part B spending annually, roughly equal to spending on the top three Part B drugs combined in 2021. If double that share were to take the drug, the higher spending would amount to $17.8 billion. Higher spending would likely lead to higher Medicare Part B premiums.

Even if Medicare were to cover Leqembi, patients administered the drug would be responsible for 20 percent of the cost, or more than $5,000 out of pocket in cost sharing each year, unless they have coverage that covers a portion of these costs. With higher rates of dementia and lower incomes among older Hispanic and Black adults than among older White adults in the U.S., Black and Hispanic beneficiaries may be less likely to get this treatment if they can’t afford it.

If covered by Medicare, these drugs could be among the limited number of drugs that would be subject to Medicare’s new drug price negotiation authority under the Inflation Reduction Act – but not for several years. For example, manufacturers of biologic drug products like Leqembi would be exempt from having Medicare-negotiated prices take effect for 13 years from the drug’s licensure date, which for Leqembi itself would be no sooner than 2036. For one of the small-molecule drugs being used for weight loss, negotiated prices could potentially take effect in 2027.

Another provision of the law will cap out-of-pocket Part D spending at $2,000 in 2025. The cap would make weight loss drugs more affordable if they are covered under Part D, but the law’s new cap does not limit out of pocket spending for drugs that are covered under Medicare Part B, as would be the case with Leqembi.

For the full analyses, as well as more data and analyses about Medicare and prescription drugs, visit kff.org.

What Could New Anti-Obesity Drugs Mean for Medicare?

Published: May 18, 2023

This post has been updated to reflect the introduction of legislation in the 118th Congress in July 2023 that would authorize Medicare coverage of weight-loss medications.

A relatively new class of medications is generating excitement in the medical community and among people with obesity and others who struggle to lose weight. Initially approved to treat type 2 diabetes, these drugs, known as GLP-1 (glucagon-like peptide-1) agonists, including Novo Nordisk’s Ozempic and Wegovy (semaglutide) and Eli Lilly’s Mounjaro (tirzepatide), are also highly effective weight loss agents. But they are also expensive, and not covered by Medicare when used for weight loss. In this piece, we discuss Medicare coverage of obesity treatments, the potential cost implications if Medicare covers anti-obesity drugs, and how the Inflation Reduction Act could potentially address these cost concerns.

Medicare coverage of obesity services and treatments currently includes obesity screening, behavioral counseling, and bariatric surgery, but not drugs that are prescribed for weight loss. The 2003 law that established the Medicare Part D prescription drug benefit explicitly prohibits Part D plans from covering drugs used for weight loss, along with some other types of drugs, including agents used for cosmetic purposes or hair growth, fertility drugs, and drugs prescribed to treat sexual or erectile dysfunction.

With evidence that GLP-1s lead to significant weight loss and may offer additional health benefits to people with medical conditions exacerbated by excess weight, manufacturers of these drugs and other stakeholders are pushing for a change in law to allow coverage under Medicare. This push for expanded coverage under Medicare and other insurance plans is taking place despite some uncertainty about the risks associated with their use. A bipartisan group of lawmakers has introduced legislation, the Treat and Reduce Obesity Act, that would authorize Part D coverage of medications when used for the treatment of obesity or weight loss management in overweight individuals with related comorbidities.

Lifting the current law prohibition on coverage of weight-loss drugs would come at a cost to Medicare, given the high price and expected demand. Wegovy, for example, has an annual estimated net price of $13,600. According to a recent study, if 10% of Medicare beneficiaries with obesity use Wegovy, the annual cost to Medicare could be $13.6 billion (based on a 19% obesity rate from traditional Medicare diagnoses in 2021) to $26.8 billion (based on a 41.5% obesity rate from survey data for adults ages 60 and older). Higher take-up rates would mean higher Medicare spending. For context, total annual Part D spending in 2021 was $98 billion. Of note, these estimates do not account for potential reductions in Medicare spending that could occur if weight loss drugs reduce medical spending associated with other diseases, such as heart disease.

Maintaining the status quo, however, could raise both access and equity concerns, given the current price. The annual cost of Wegovy is unaffordable for many Medicare beneficiaries. Moreover, the rate of obesity is highest among Black Medicare beneficiaries compared to beneficiaries in other racial and ethnic groups (Figure 1). Without Medicare coverage, Black beneficiaries may be least able to afford these new drugs, given their substantially lower incomes and assets than White beneficiaries.

The Prevalence Rate of Obesity is Highest Among Black Medicare Beneficiaries Compared to Beneficiaries in Other Racial and Ethnic Groups

The Inflation Reduction Act of 2022 could help lessen the cost impact of weight loss drugs on Medicare and Part D enrollee out-of-pocket spending. If covered by Medicare, weight loss drugs could be among the limited number of drugs that will be subject to Medicare’s new drug price negotiation authority, but not for several years. At the earliest, a negotiated price for semaglutide, for example, would not be available before 2027 (based on FDA approval in late 2017) and not before 2031 for tirzepatide (based on FDA approval in 2022). Another provision would subject weight-loss drugs to the new law’s inflation rebate that aims to limit annual increases in drug prices. A third provision of the law will cap out-of-pocket Medicare Part D spending for covered drugs at $2,000 in 2025, which would certainly help to make these drugs more affordable. But even paying $2,000 out of pocket would still be beyond the reach of many people with Medicare who live on modest incomes.

To limit the potential cost impact to Medicare, lawmakers could consider shortening the period between FDA approval and the year negotiated prices take effect, as proposed in the Biden Administration’s FY2024 budget, but adopting this change to the newly-launched negotiation program seems unlikely in the current political climate. If the underlying Part D law is not changed, adding Medicare coverage for obesity drugs could possibly be achieved through other pathways, such as a demonstration program through the Centers for Medicare & Medicaid Innovation or Section 402 authority.

The availability of effective weight-loss drugs has the potential to be transformative for people who struggle with obesity and obesity-related medical conditions, but without insurance coverage, access to these relatively high-priced drugs will be limited to those who can afford them. While competition among GLP-1 medications could have a moderating effect on launch prices, the combination of intense demand and high prices for these treatments is likely to place tremendous pressure on Medicare spending if coverage is authorized, even in the wake of the prescription drug provisions in the Inflation Reduction Act. A decision to cover weight-loss drugs under Medicare could have ripple effects for employers and other payers if they follow Medicare’s lead.

This work was supported in part by Arnold Ventures. KFF maintains full editorial control over all of its policy analysis, polling, and journalism activities.

Mpox One Year Later: Where is the U.S. today?

Published: May 17, 2023

Introduction

May 18, 2023 marked one year since a case of mpox (monkeypox) was identified in the United States as a part of a new multi-country outbreak in regions where it had not previously been endemic. As a result, the World Health Organization (WHO) declared the mpox outbreak to be a Public Health Emergency of International Concern (PHEIC) on July 23, 2022 and the U.S. declared a Public Health Emergency (PHE) on August 4, 2022. Unlike prior mpox outbreaks, most of those impacted were gay and bisexual men and other men who have sex with men, including those with HIV. Furthermore, the majority of those affected in the U.S. have been people of color.

After the deployment of vaccines and treatments last summer, coupled with growing awareness of the disease, cases began to decline and both the WHO and the U.S. government have since ended their emergency declarations or allowed them to expire. Still, while cases in the U.S. continue to remain low, public health officials have expressed concern that they could rise again this spring and summer; indeed, recently, there was a small but notable outbreak in Chicago, raising questions about whether this is a harbinger for what is to come.

This brief provides an overview of the impact of mpox in the U.S. one year later, the federal response to date, and discusses the future outlook.

The 2022 Mpox Outbreak (as of May 10, 2023)

Global Cases: 87,314

US Cases: 30,395

US Deaths: 42

Source: CDC, 2022 Outbreak Cases and Data. 

The impact

The 2022 mpox outbreak was not evenly distributed across the US. The majority (52%) of cases have been concentrated in the four most populous states (CA, FL, NY, and TX) – disproportionate to their share of the total population — though all states, DC, and Puerto Rico have reported at least 3 cases. In addition, almost all cases have occurred among gay and bisexual men and other men who have sex with men, differing from prior outbreaks in endemic countries.

Data from the CDC  indicate that 99% of cases reported between May and July of 2022 were among men and of those, 94% were among men who had sexual contact with other men. In addition, within this group, those living with HIV have been especially hard hit. Among mpox cases with data available on HIV status, 41% were also HIV positive.

Additionally, people of color, particularly gay and bisexual men of color, have been disproportionately impacted by mpox. While Black people account for 12% of the US population, they account for 33% of mpox cases. Hispanic people account for 19% of the US population but 31% of mpox cases. There are also notable racial and ethnic disparities in deaths associated with mpox with almost all mpox deaths reported in the U.S. to date (92% of 38 deaths with available demographic data) being among Black and Latino people; some of this may have been driven by disproportionate access to mpox vaccines (see below). Further, 94% of those who died were HIV positive, not virally suppressed, and 40% were experiencing homelessness, pointing to overlapping and intersecting drivers of inequality.

Distribution of US Population and Mpox Cases and Vaccination Uptake, by Race/Ethnicity

Federal response to date

Coordination

After the first cases of mpox were identified in May of last year, the CDC and other agencies took initial response steps such as developing an updated case definition for mpox, providing guidance to states and other public health officials with respect to surveillance, reporting, and contact tracing, testing, vaccination, and coordinating with international partners. Some were critical  that the initial response was slow and early on there were substantial hurdles related to testing and vaccine supply and accessibility. In June of 2022, the White House announced a government-wide strategy including an approach to scaling up surveillance, vaccination and testing efforts, and the CDC activated its Emergency Operations Center to enhance operational support, including monitoring and coordination. The federal government also worked to educate health care providers and the public and identify research priorities.

Today, the federal response is coordinated by the National Mpox Response Office at the White House and involves coordination across the federal government, especially within the U.S. Department of Health and Human Services (HHS) and its operating divisions and offices. These include the Office of the Assistant Secretary for Preparedness and Response (ASPR, which includes the Strategic National Stockpile under the Office of Operations and Resources as well as the Biomedical Advanced Research and Development Authority (BARDA)), the Food and Drug Administration (FDA), Health Resources and Services Administration (HRSA), and the National Institutes of Health (NIH). The White House Office of Science and Technology Policy (OSTP) also plays a role.

Testing

Testing for mpox initially took place through the CDC and other public health laboratories and was very limited, creating access challenges for patients and providers. However, capacity ramped up and eventually expanded to commercial laboratories nationwide. Testing capacity grew from 6,000 tests per week in June of 2022 to 80,000 per week by July, with expansions largely due to CDC partnering with commercial laboratories. Because newer assays under emergency use authorization (EUA) are not included in this number, capacity is potentially larger today.

Vaccination

JYNNEOS, the preferred mpox vaccine used in the U.S., has been approved by the FDA for both smallpox and mpox, and is made available to jurisdictions through the Strategic National Stockpile. JYNNEOS, a two-dose regimen, can be used following a known or likely exposure (i.e., post-exposure prophylaxis or PEP) or as a preventive measure before an exposure occurs (i.e., pre-exposure prophylaxis or PrEP).

In the early days of the outbreak, HHS began shipping what was then a very limited supply of vaccines to states on May 21, 2022, using a four-tier distribution strategy that prioritized jurisdictions with the highest mpox case rates (the U.S. had just 65,000 JYNNEOS doses in the stockpile in late June 2022). Additional doses were ordered for the 2020-2023 period, with 6.9 million doses of JYNNEOS expected to be available by mid-2023, enough to vaccinate 3.5 million people. (See our prior analysis for more details.) Recent information suggest this timeline is on track as of March 2023. Today, a jurisdictional threshold approach is being used based on each jurisdiction’s estimated percentage of the nation’s population for whom JYNNEOS vaccination is recommended; jurisdictions can order any quantity of vials up to the threshold.

HHS also maintains a store of more than 100 million doses of the ACAM2000 vaccine, a smallpox vaccine considered effective for mpox, in the strategic national stockpile. However, due to its safety profile, JYNNEOS is the preferred vaccine.

Data on vaccine efficacy against disease ranged from 66% to 86% for two doses and from 36% to 75% for a single dose, depending on the study. A separate analysis of men aged 18-49 found that mpox incidence among those who were unvaccinated was 9.6 times higher than for those fully vaccinated and 7.4 times higher than among those with a single dose.

As of May 5, 2023 more than 1.2 million vaccine doses had been administered. However, just 38% of those vaccinated had been fully vaccinated. In addition, there are significant racial and ethnic disparities in vaccine uptake. Black and Hispanic people account for a smaller share of those with first dose vaccinations than their share of cases while White people have seen a lower case burden relative to their share of the population as a whole and a higher rate of vaccination (see Figure 1). A recent analysis by CDC found that vaccination is low among those at risk, defined as men who have sex with men who have an indication for HIV PrEP. Nationwide, just 23% of the population at risk is estimated to have been fully vaccinated, with significant variation across the country, ranging from just 5% in West Virginia to 67% in Washington, D.C.

Treatment

There are no available treatments that specifically target the mpox virus. However, because the smallpox and mpox viruses are similar, Ticoviromat (TPOXX), an antiviral approved for smallpox, is used to treat severe mpox cases. TPOXX is prescribed for mpox treatment under an expanded access Investigational New Drug (EA-IND) protocol and available from the strategic national stockpile at no cost. On July 1, 2022, HHS reported that the strategic national stockpile had over 1.7 million TPOXX antiviral treatment courses. Through January 2023, 6,832 patients with mpox has been treated with TPOXX.

Because TPOXX for mpox is only available under an EA-IND protocol through the CDC, access can be challenging. Initially, there were many reports of providers facing lengthy and burdensome processes in accessing treatment, creating a barrier for patients and a challenge for provider. In response CDC streamlined the approval process, though it still can take some time for providers to navigate.

In an effort to promote equitable access, jurisdictions can also request oral TPOXX using a threshold approach. TPOXX thresholds are formula driven: 75% is based on the number of jurisdictional cases and 25% on the number of individuals at the highest risk.

Federal Funding

New federal funding to address mpox has not been appropriated by congress, though the White House requested $4.5 billion in the FY23 omnibus spending bill.

Given the lack of new federal investment, agencies have had to use existing resources to fund response activities. For example, CDC has allocated funding to jurisdictions on two occasions through its Public Health Crisis Response Cooperative Agreement: once in December 2022 when $12.5 million was awarded to 21 jurisdictions for vaccination and other mpox response activities and again in January 2023 when $33.7 million was awarded to 53 jurisdictions to respond to remaining cases, prevent future outbreaks through vaccination efforts, and strengthen capacity to respond to future cases. In addition, several agencies, including the CDC and HRSA’s Ryan White HIV/AIDS Program, provided guidance around flexibilities to allow grantees to use existing funding to address mpox. Federal investments have also been directed to mpox research activities across a range of government programs/agencies.

Surveillance

In partnership with states and local jurisdictions, CDC plays the central federal role in mpox surveillance. Jurisdictions collect data which is then reported to and combined by the CDC. CDC then provides surveillance data and reports on a range of variables including:

Public communication and partnerships

The communication to the public and providers around mpox has largely come out of CDC. HHS’ Office of Infectious Disease and HIV/AIDS Policy, the Health Resources Services Administration (HRSA) –  especially within the Ryan White Program – have also played a role.

CDC has provided public education materials to jurisdictions, providers, and individuals though webinars, website materials, and engagement at local events. This includes equity tool kits for local outreach and messaging specifically aimed at the hardest hit communities and communities of color in an effort to address racial/ethnic disparities. CDC also engaged with on the ground partners as part of its vaccine equity pilot project aimed at reducing vaccine inequalities). Applications are now closed but in total 28 applications from 14 states and Puerto Rico were accepted, grouped by two strategies: vaccination events developed to reach specific populations disproportionately affected and vaccination events with a broad reach (though still generally targeting hard hit communities). Examples for projects include events at Southern Decadence and Atlanta Black Pride to provide vaccines and education though community engagement and targeted messaging.

Communication from HHS’ Office of Infectious Disease and the Ryan White Program has focused on the syndemic nature of mpox, HIV, and other STIs. The Ryan White Program has provided education for providers and jurisdictions, flexibility with its grants to respond to mpox, and distributed vaccination through grantees dually funded by Ryan White and HRSA Health Centers.

(In addition, there have been several private sector efforts to address communications gaps such as the mpox education and awareness resources developed by KFF’s Greater Than HIV program).

The Chicago outbreak and the future outlook nationwide

Overall mpox cases in the U.S. remain low but public health officials are monitoring whether there might be a surge of cases as we move into warmer months, a time often associated with more social gatherings and warned of a possible resurgence.

A recent outbreak in Chicago was reported via an alert from the city and raised concerns that this could occur. The alert stated that between mid-April and early May 2023, 13 confirmed or probable mpox cases had been identified in the city (compared to many weeks in February and March when the city reported no cases). Moreover, most cases were among those fully vaccinated, raising questions about vaccine effectiveness, and one-third were among virally suppressed people with HIV. Since this alert was published, more cases have been reported.

It is not yet known what the rest of the year will look like. There could be isolated local outbreaks as has occurred in Chicago or transmission could become more widespread, especially as vaccination lags in terms of initial uptake and second dose completion and potential wanning efficacy. On May 15, 2023, CDC released a Health Alert Network (HAN) message in response to the Chicago outbreak writing that the “spring and summer season in 2023 could lead to a resurgence of mpox as people gather for festivals and other events” and highlighting the important role vaccines play in potentially warding off more serious infection, even if full protection is not provided.

Separately, CDC estimates that if mpox is reintroduced and no additional risk mitigation occurs (i.e. vaccination or behavior changes), the risk of a resurgent outbreak is more than 35% in most jurisdictions and that such outbreaks could be large given that immunity among those most at risk is low.

Discussion

Overall, the public health system for addressing mpox in United States is in a markedly different place than it was one-year ago and is expected to be better able to respond should mpox cases rise. Additionally, providers are generally more knowledgeable about case identification and treatment and the communities most impacted have a better understanding of how to protect themselves, if cases climb.

However, disparities persist and those facing structural barriers and overlapping systems of discrimination — including LGBTQ people, people of color, those with HIV, and people experiencing homelessness — are particularly at risk. Building on lessons learned, including in terms of preparedness, coordination, engagement of hard-hit communities and leveraging an equity framework, will be important both to address lingering inequities today and to respond to potential future outbreaks tomorrow.

Testimony: Prior Authorization in Medicare Advantage

Published: May 17, 2023

Jeannie Fuglesten Biniek, an Associate Director for the Program on Medicare Policy at KFF, testified before the Senate Homeland Security and Government Affairs Committee Permanent Subcommittee on Investigations on May 17, 2023 as part of a hearing on Examining Health Care Denials and Delays in Medicare Advantage. Her testimony describes what the Medicare Advantage market looks like today, the use of prior authorization by Medicare Advantage insurers, and gaps in data that limit oversight and the ability to understand and assess how the use of prior authorization impacts Medicare Advantage enrollees.

News Release

Private Insurers Expect to Pay $1.1 Billion in Rebates This Year for Setting Premiums Too High Relative to Medical Costs

Published: May 17, 2023

Private insurance companies are expecting to pay out about $1.1 billion in rebates this fall under an Affordable Care Act (ACA) provision that requires insurers to spend the bulk of customers’ premium payments on care, a new KFF analysis finds.

Rebates are based on insurers’ experiences over the previous three years. This year’s estimated total is similar to the $1 billion paid out last year, but well short of the $2.5 billion record total paid out in 2020 and $2 billion paid out in 2021. 

Insurers in the individual market expect to owe about $500 million to consumers, including those with ACA marketplace plans, while those in the small-group market expect to owe about $330 million and those in the large group market expect to owe about $250 million. Insurers will determine the final amounts later this year and will issue the rebates to eligible consumers and purchasers in the fall.

The rebates are the result of insurance companies not meeting the ACA’s medical loss ratio threshold, which requires insurers to spend at least 80 percent of premium revenues (85% for large group plans) on health care claims or quality improvement activities. 

This year’s rebates reflect the continued impact of the COVID-19 pandemic, which led to much lower medical-loss rations in 2020 as many people skipped care amid stay-at-home orders and medical offices’ closures.

The estimates are based on an analysis of preliminary data reported by insurers to state regulators and compiled by Mark Farrah Associates. 

State Policy Choices Are Likely to Affect the Extent of Medicaid Enrollment Declines During the Unwinding Period

Authors: Jennifer Tolbert, Sophia Moreno, and Robin Rudowitz
Published: May 9, 2023

NOTE: This analysis, originally published on April 26, 2023, was updated on May 9, 2023 to include newer state data.

Starting on April 1, 2023, all states have begun the process of unwinding the Medicaid continuous enrollment provision. Adopted in March 2020, the continuous enrollment provision has protected coverage for millions enrolled in Medicaid during the past three years. Because states were prohibited from disenrolling people from Medicaid in exchange for enhanced federal funding, enrollment in the program has grown by an estimated 23 million to reach 95 million as of the end of March 2023. Now that continuous enrollment has ended, over the next year (and more quickly in some states), states will redetermine eligibility for everyone enrolled in Medicaid and will disenroll those who are no longer eligible, as well as those who remain eligible but who face barriers to completing the renewal process. Millions of people are expected to lose Medicaid coverage nationally.

The unwinding of the continuous enrollment provision will play out differently across the states based on policy choices states have made and variation in their administrative infrastructures. Some states have adopted multiple policies that are more likely to promote continued coverage among those who remain eligible. Others have adopted fewer of these policies, which will likely lead to a larger number of people losing Medicaid coverage, including some who remain eligible. Additionally, some states have automated eligibility systems that can more easily and accurately process renewals, reducing the number of renewals staff will have to complete manually. Having some way to order states based on their adoption of polices and strategies to promote continued coverage, as well as the capacity of their systems to process the expected volume of renewals, can be helpful for identifying where larger decreases in Medicaid enrollment are more or less likely.

Key Unwinding Metrics

Using data from a survey of state Medicaid eligibility, enrollment, and renewal policies conducted by KFF and the Georgetown University Center for Children and Families (CCF) earlier this year, we have identified 9 key metrics that will support continued Medicaid coverage during the unwinding for those who remain eligible. They include a mix of policy choices and measures of systems capacity and are grouped into three categories: renewal policies in place during the unwinding, systems for processing of renewals, and eligibility policies that promote continued coverage. The metrics include:

Renewal Policies

  • State will take 12-14 months to complete all renewals
  • State follows up on returned mail
  • State follows up with enrollees who have not responded to a renewal request before terminating coverage

System Capacity Measures

  • Processing of renewals is mostly automated
  • 50% or more of renewals are completed on an ex parte basis
  • State has taken steps to improve ex parte renewal rates

Eligibility Policies

  • State has adopted the Medicaid expansion
  • State has adopted 12-month postpartum coverage
  • State has adopted 12-month continuous eligibility for all children in Medicaid and CHIP

Importantly, the data included in this analysis reflect policies and procedures in place as of January 2023; it is possible, likely even, that states have updated some policies in response to guidance from the Centers for Medicare and Medicaid Services (CMS) or mitigation plans developed in coordination with CMS. In addition, some states indicated they were not processing ex parte renewals as of January 2023 and we cannot distinguish between states that paused ex parte renewals while the continuous enrollment provision was in place and those that may not have the system capacity to process ex parte renewals. Ex parte renewals involve automatically renewing coverage based on available data sources. Finally, some states did not provide data for one metric included in this analysis. States with missing data are noted in the figure below.

How Do States Compare Across Unwinding Metrics

Overall, states fall along a spectrum on meeting the metrics. Nine states meet eight or more of the metrics for promoting continuity of coverage, including one state, Colorado, that meets all nine metrics. At the other end of the scale, six states meet four or fewer of the measures (Figure 1). The majority of states fall somewhere in the middle, meeting all of the metrics in some categories but not others. More states (29) meet all of the metrics related to adopting renewal policies that promote continued coverage during the unwinding than meet the standards for metrics in the other two categories (7 states for system capacity and 14 states for eligibility policies).

Key Metrics to Promote Continued Coverage During the Unwinding of the Medicaid Continuous Enrollment Provision

Most states do not have fully automated systems that are capable of completing a majority of renewals using ex parte processes. A total of 42 states do not meet all three of the metrics that measure the capacity of state systems to process ex parte renewals. The total includes 14 states that reported having mostly manual systems for processing renewals or reported processing less than 25% of renewals via ex parte despite having automated systems. The administrative burden on both staff and enrollees is likely to be higher in these states and they will likely face unique challenges as they work to complete the increased volume of renewals during the unwinding period.

Despite fairly broad adoption of the Medicaid expansion and 12-month postpartum coverage, only 14 states have adopted all three eligibility policies, which also includes 12-month continuous eligibility for all children. While these policies are not directly related to the ability to complete the renewal process, they do affect how frequently an enrollee may have their eligibility redetermined, and in the case of adoption of the Medicaid expansion, the likelihood that nonelderly adults will be able to retain coverage when their eligibility is redetermined during the unwinding period. All states will have to implement 12-month continuous eligibility for all children in both Medicaid and CHIP by January 1, 2024; however, currently, only 23 states have adopted this policy.

Implications

Unwinding the Medicaid continuous enrollment provision is expected to be challenging for all states, but state policy choices and system capacity will matter in terms of how many people are able to maintain Medicaid or transition to other types of coverage. This analysis offers one way to assess states on whether their approach to and capacity for processing renewals during the unwinding period are likely to lead to larger or smaller declines in Medicaid enrollment and can be useful for focusing monitoring efforts. However, state policies and procedures are likely evolving, and while this analysis examines state policies, how states implement those policies will be just as important a factor in how the unwinding proceeds across states. Implementation, in turn, will be affected by state staffing capacity, the effectiveness of state outreach to and communications with enrollees, and state engagement with key stakeholders, including MCOs, providers, and community organizations, to assist with enrollee outreach efforts.

Number of Unwinding Metrics Met, Overall and by Category
News Release

After the COVID-19 Public Health Emergency Ends on May 11, Some Consumers Could Face High Prices for COVID-19 Testing

After the public health emergency, private health plans will no longer be required to cover the full cost of COVID-19 tests ordered or administered by a clinician or to reimburse consumers for at-home rapid tests.

Published: May 8, 2023

After the public health emergency ends on May 11, private health plans will no longer be required to cover the full cost of COVID-19 tests ordered or administered by a clinician or to reimburse consumers for at-home rapid tests.

To estimate what consumers might have to pay for tests, KFF’s new analysis draws on claims data showing what private insurers have paid for different types of COVID-19 tests, as well as hospitals’ published “self-pay” prices for patients without insurance and a survey of major retailers’ prices for at-home COVID-19 tests. What consumers pay will depend on their insurance plan or whether they have insurance at all.

The analysis finds the median price of a COVID-19 test in an outpatient clinical setting was $45 among people with large employer-based health coverage in 2021, though prices varied widely. Generally, antigen testing was cheaper than PCR testing, with a median price of $42 for antigen testing compared to $62 for PCR testing. In addition to the cost of the COVID-19 test itself, there may be an additional charge for the associated office visit depending on cost sharing arrangements, which can average about $90 for people with private health insurance. Together, the price for a COVID-19 test in a clinical setting and the associated visit could go up to $150 if a deductible applies.

The median “self-pay” price for someone without health insurance at a hospital or outpatient setting is $51 for a COVID-19 antigen test and $91 for a PCR test. Prices for a COVID-19 PCR test at a hospital also vary widely by state and are most expensive in Alaska, with a median self-pay price of $200, and least expensive in Utah, with a median self-pay price of $41.

The analysis also finds that most at-home rapid tests cost between $12 and $24 per pack (the price per test averages $11). Private insurers will no longer be required to cover the cost of these tests once the public health emergency ends.

Prices for COVID-19 Testing

Published: May 8, 2023

After the public health emergency ends on May 11, private health plans will no longer be required to cover the full cost of COVID-19 tests ordered or administered by a clinician or to reimburse consumers for at-home rapid tests.The analysis looks at what those tests could potentially cost consumers, depending on whether they have insurance and how their insurance covers such tests after the emergency ends. It draws on claims data showing what private insurers have paid for different types of COVID-19 tests, as well as hospitals’ published “self-pay” prices for patients without insurance and a survey of major retailers’ prices for at-home COVID-19 tests.

The analysis is available through the Peterson-KFF Health System Tracker, an online information hub that monitors and assesses the performance of the U.S. health system.