Note: This content was updated on February 14, 2024 to correct the description of how states were classified in terms of expansiveness of coverage for immigrants.
Executive Summary
Immigrant adults are a diverse population who make up 16% of adults in the United States and play a significant role in the nation’s workforce and communities, with one in four children in the U.S. having at least one immigrant parent (see Box 1). Immigrants include individuals with varied citizenship and immigration statuses, countries of origin, racial and ethnic identities, and social and economic circumstances. Yet, this diversity among immigrants is not always reflected in policy debates or discussions. While some data are available on health and health care for immigrants, they provide limited understanding of the variation of experiences among immigrants by different factors, particularly immigration status (see Box 2), which is not collected in federal surveys.
This report provides new data on health and health care experiences of immigrant adults ages 18 and over in the U.S., including data by immigration status, income, race and ethnicity, and other factors.1 It is based on the Survey of Immigrants, the largest and most representative nongovernmental survey of immigrants living in the U.S. to date, which was conducted by KFF in partnership with the Los Angeles Times during Spring 2023. The survey allows for a much richer and more nuanced understanding of the diversity of immigrant experiences and provides broader insights into experiences in health care settings than previously available through other data sources. KFF also conducted focus groups with immigrants from an array of backgrounds, which expand upon the survey information (see Methodology for more details). The report includes some data for the U.S.-born adult population based on a survey of the overall adult population conducted as part of this project and, in some other cases, federal survey data.
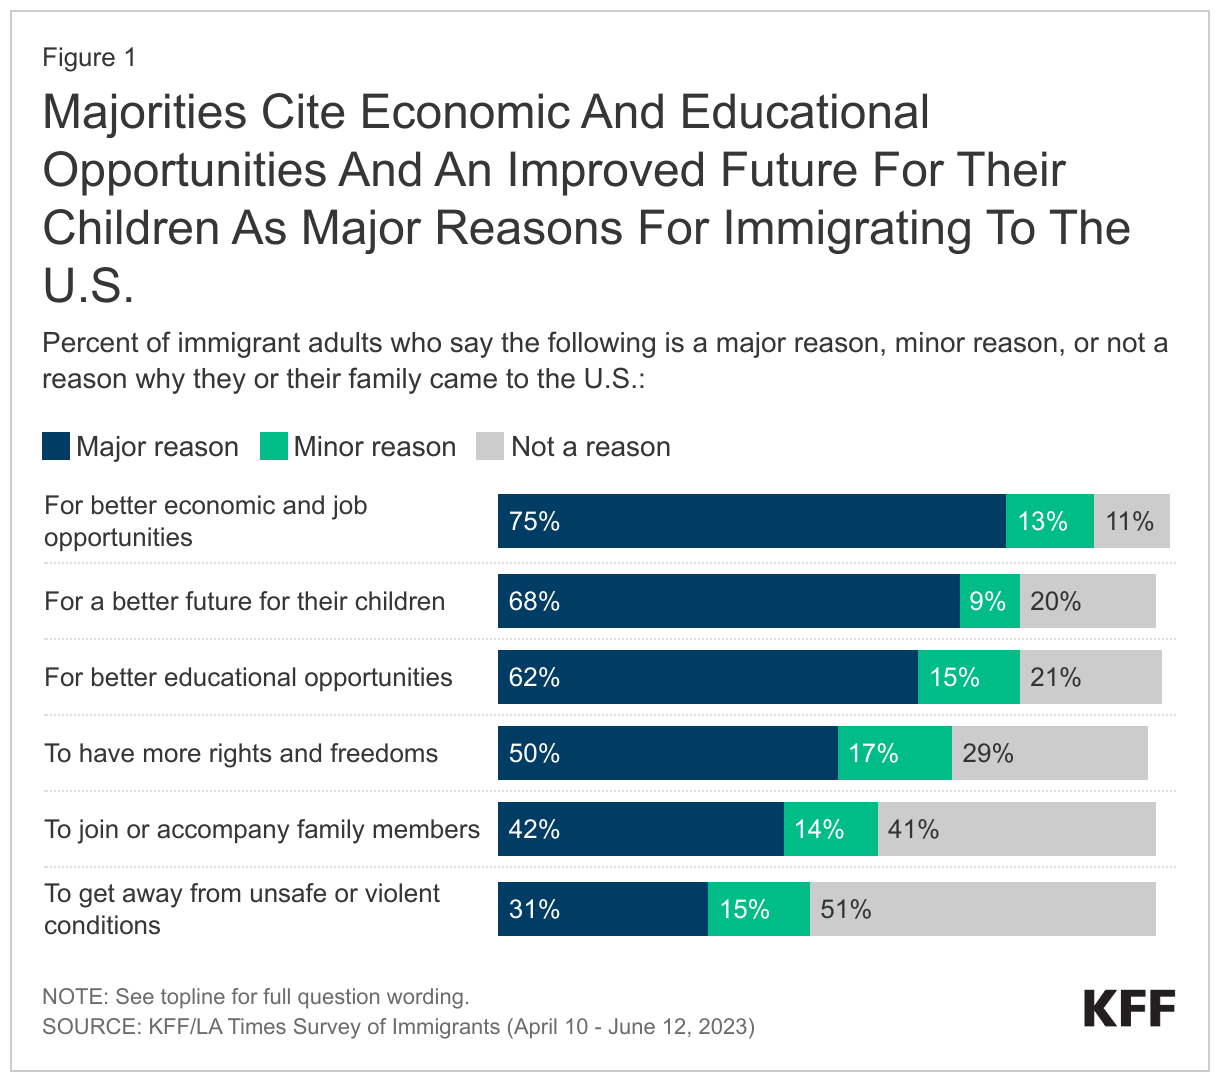
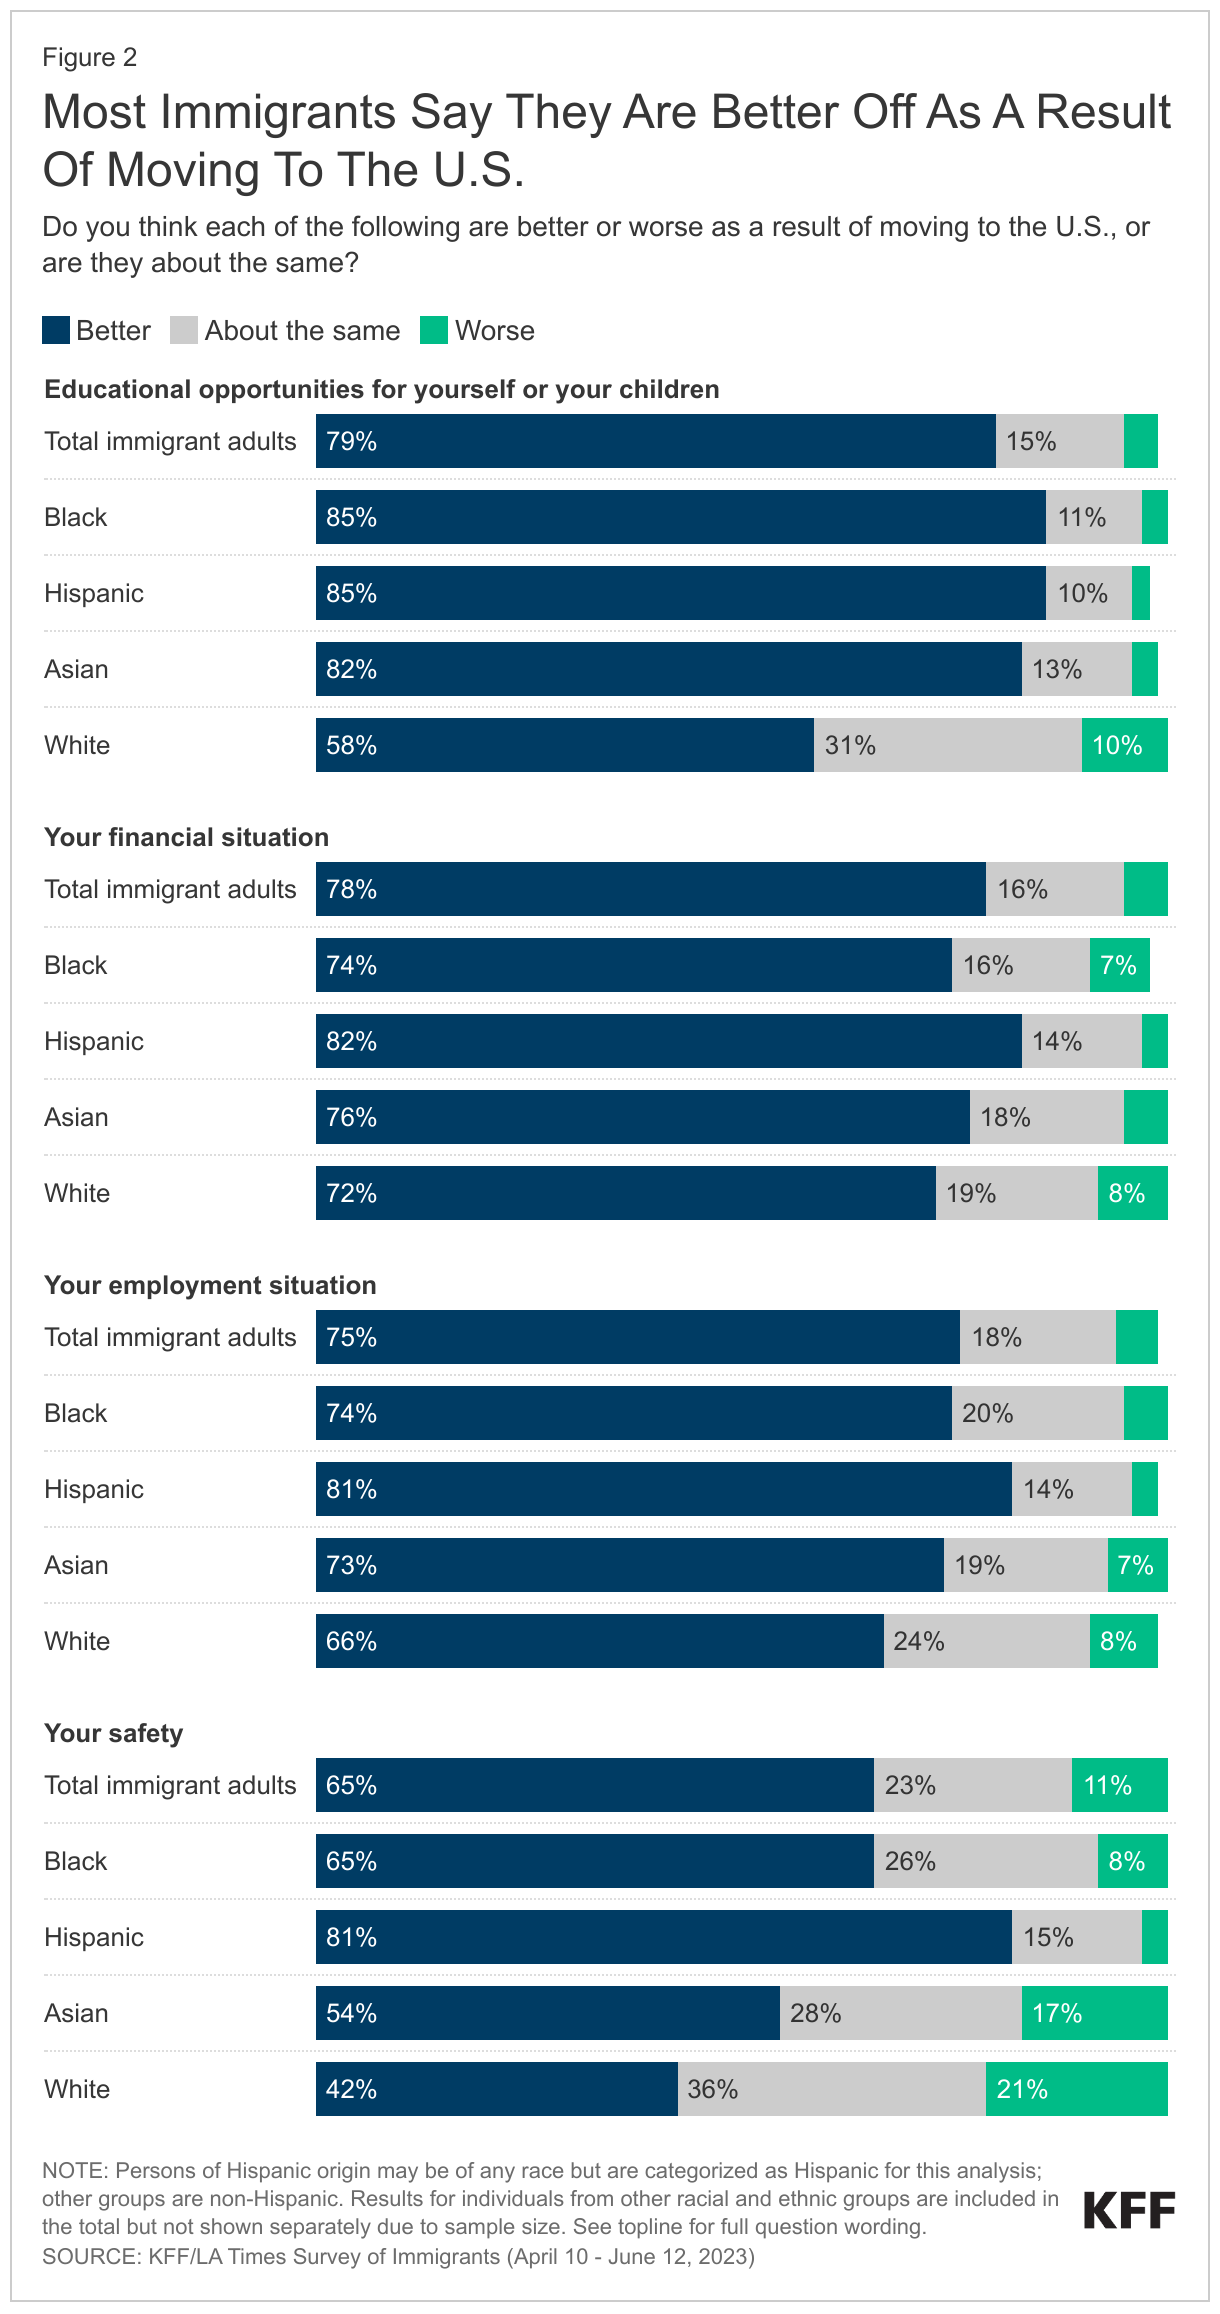
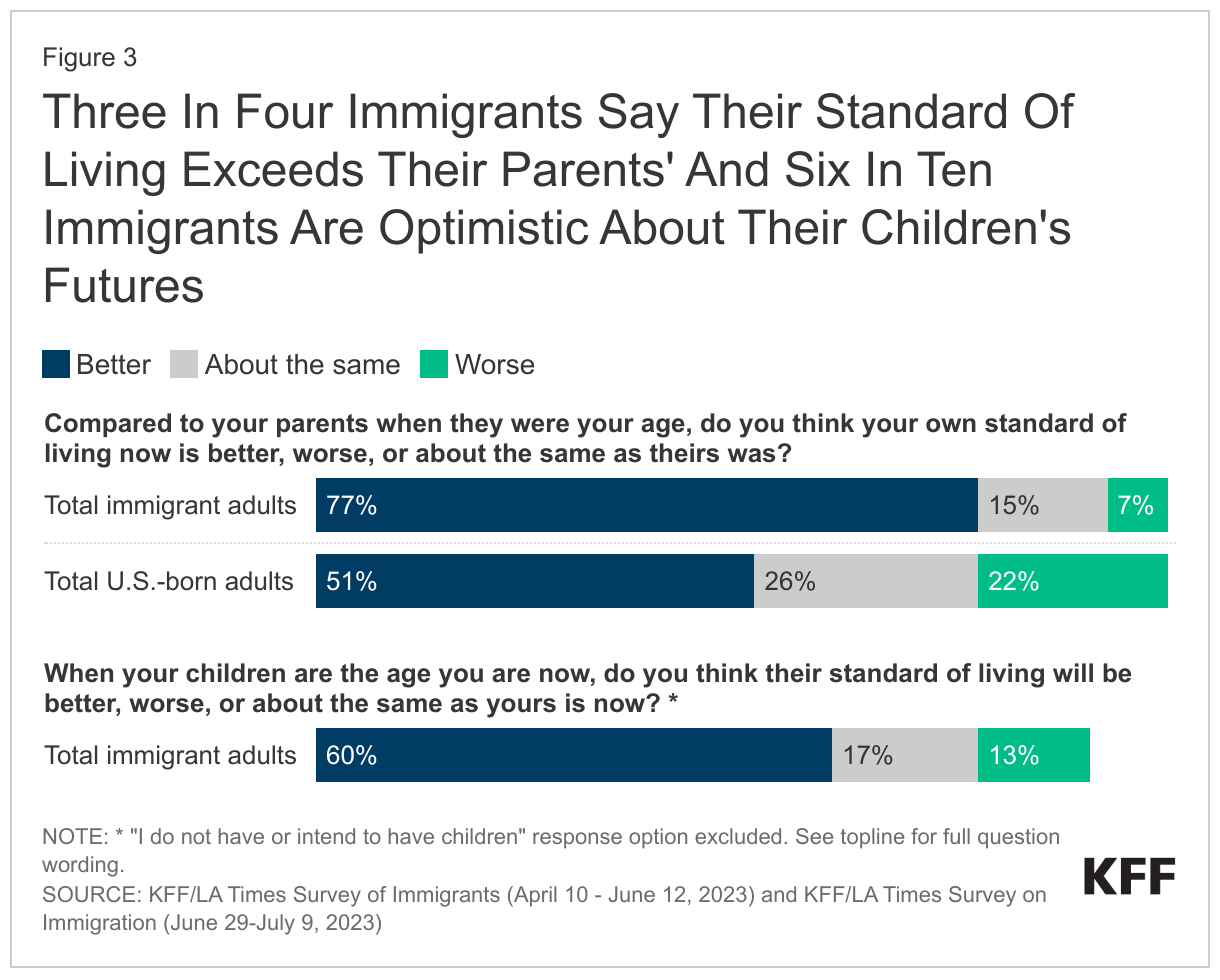
As shown in a companion report, although most immigrants say they came to the U.S. seeking better opportunities for themselves and their children and that their situations are improved relative to their countries of birth, many report facing serious challenges. This report further shows how these challenges extend to health care. Although most immigrants are healthy and employed, many face challenges to accessing and using health care in the U.S. due to higher uninsured rates, affordability challenges, linguistic and cultural barriers, and immigration-related fears, which has negative implications for their health and financial security. These challenges are more pronounced for some immigrants, including those who are likely undocumented, who have lower incomes, who are Black and Hispanic, and who have limited English proficiency (LEP). The survey data also show the difficulties immigrants face in obtaining health coverage and underscore the major role that coverage plays in access to health care. Although most immigrants are employed, they often are in lower wage jobs and industries that are less likely to offer health coverage, leading to lower rates of private coverage and higher uninsured rates. Noncitizen immigrants also face restrictions on eligibility for federally funded coverage. Given these restrictions, state coverage policies make a difference as immigrant adults in states that have adopted more expansive coverage policies are less likely to be uninsured. Consistent with the overall uninsured population, uninsured immigrants report significantly larger barriers to accessing and utilizing care compared to their insured counterparts. Some immigrants, particularly Black, Hispanic, and Asian immigrants have also experienced unfair treatment when seeking health care and difficulty accessing respectful and culturally competent care.
Key takeaways from this report include the following:
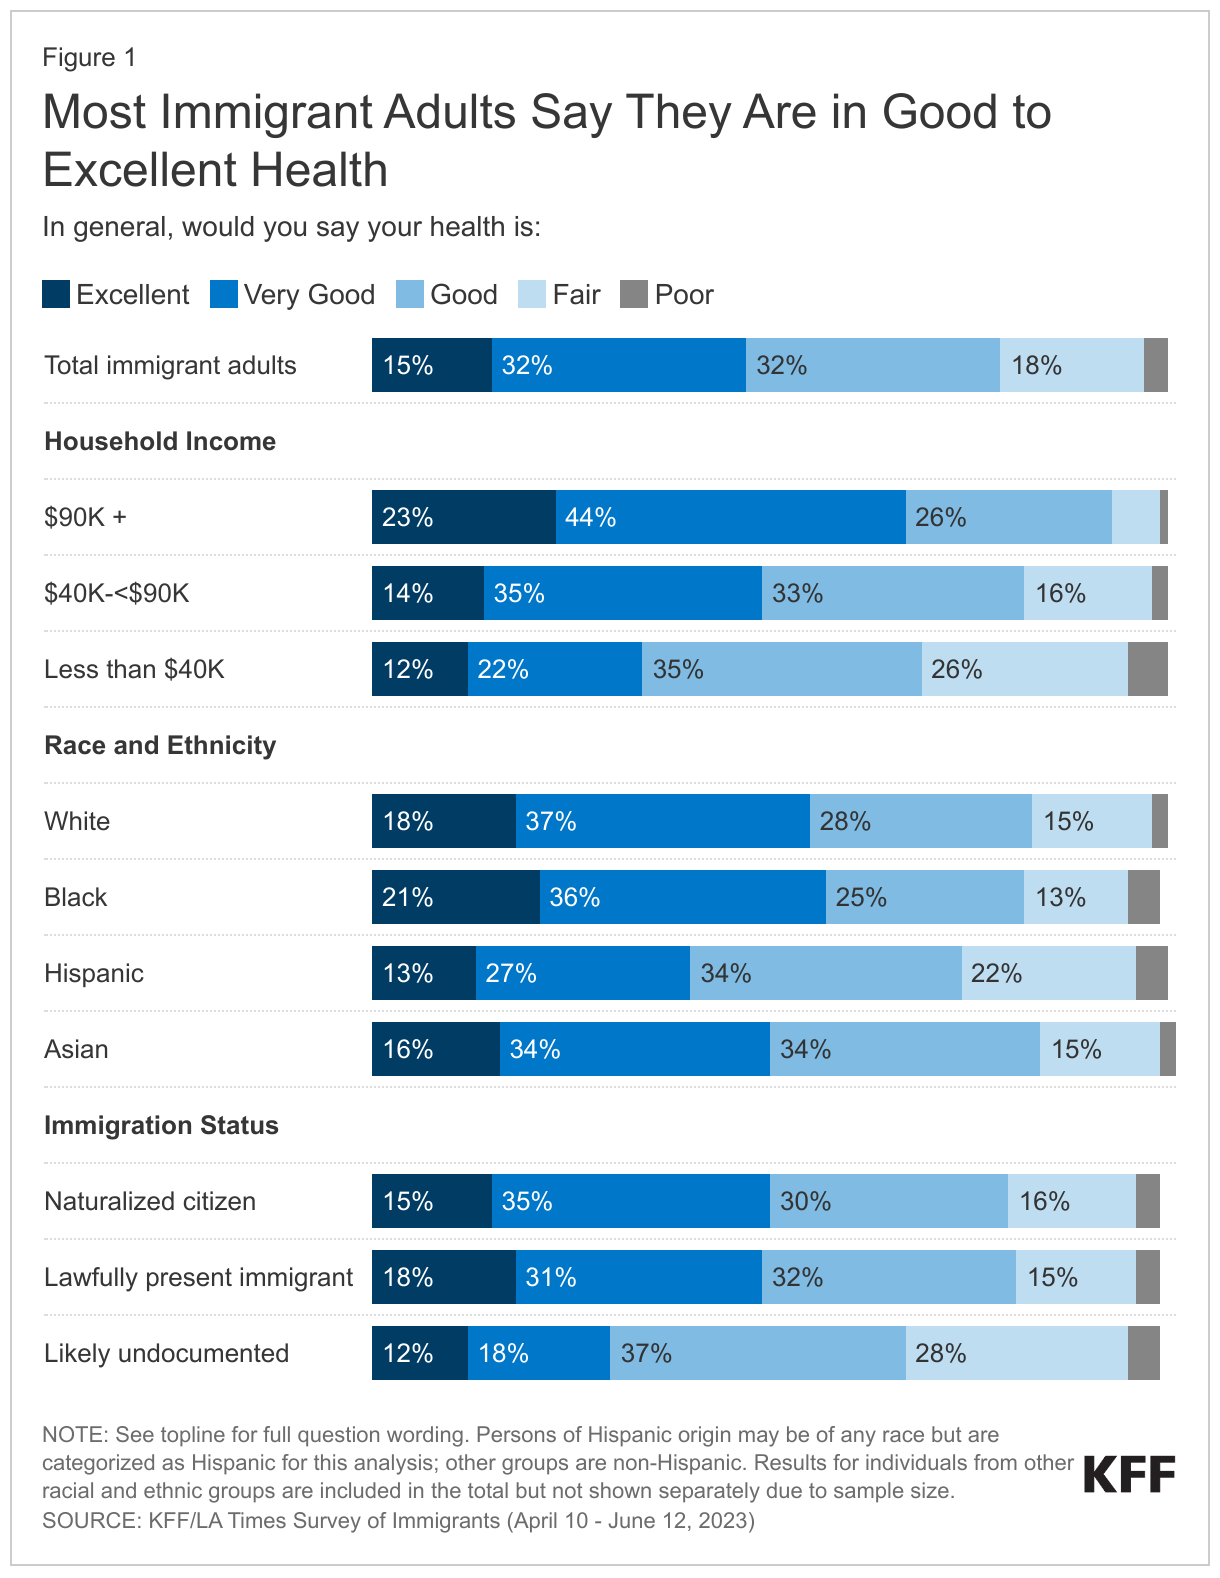
- Most immigrant adults (79%) report being in excellent or good health, but lower income immigrant adults are more likely to report worse health and having health conditions. Although most immigrant adults report good to excellent health, 14% say they have a health condition that requires ongoing treatment. Income is highly associated with self-reported health status, with worse health status and higher rates of health conditions reported among those with lower incomes. Nearly one in three (31%) lower income immigrant adults (household incomes of less than $40,000 per year) report fair or poor health compared with 7% of those in households with annual incomes of at least $90,000.
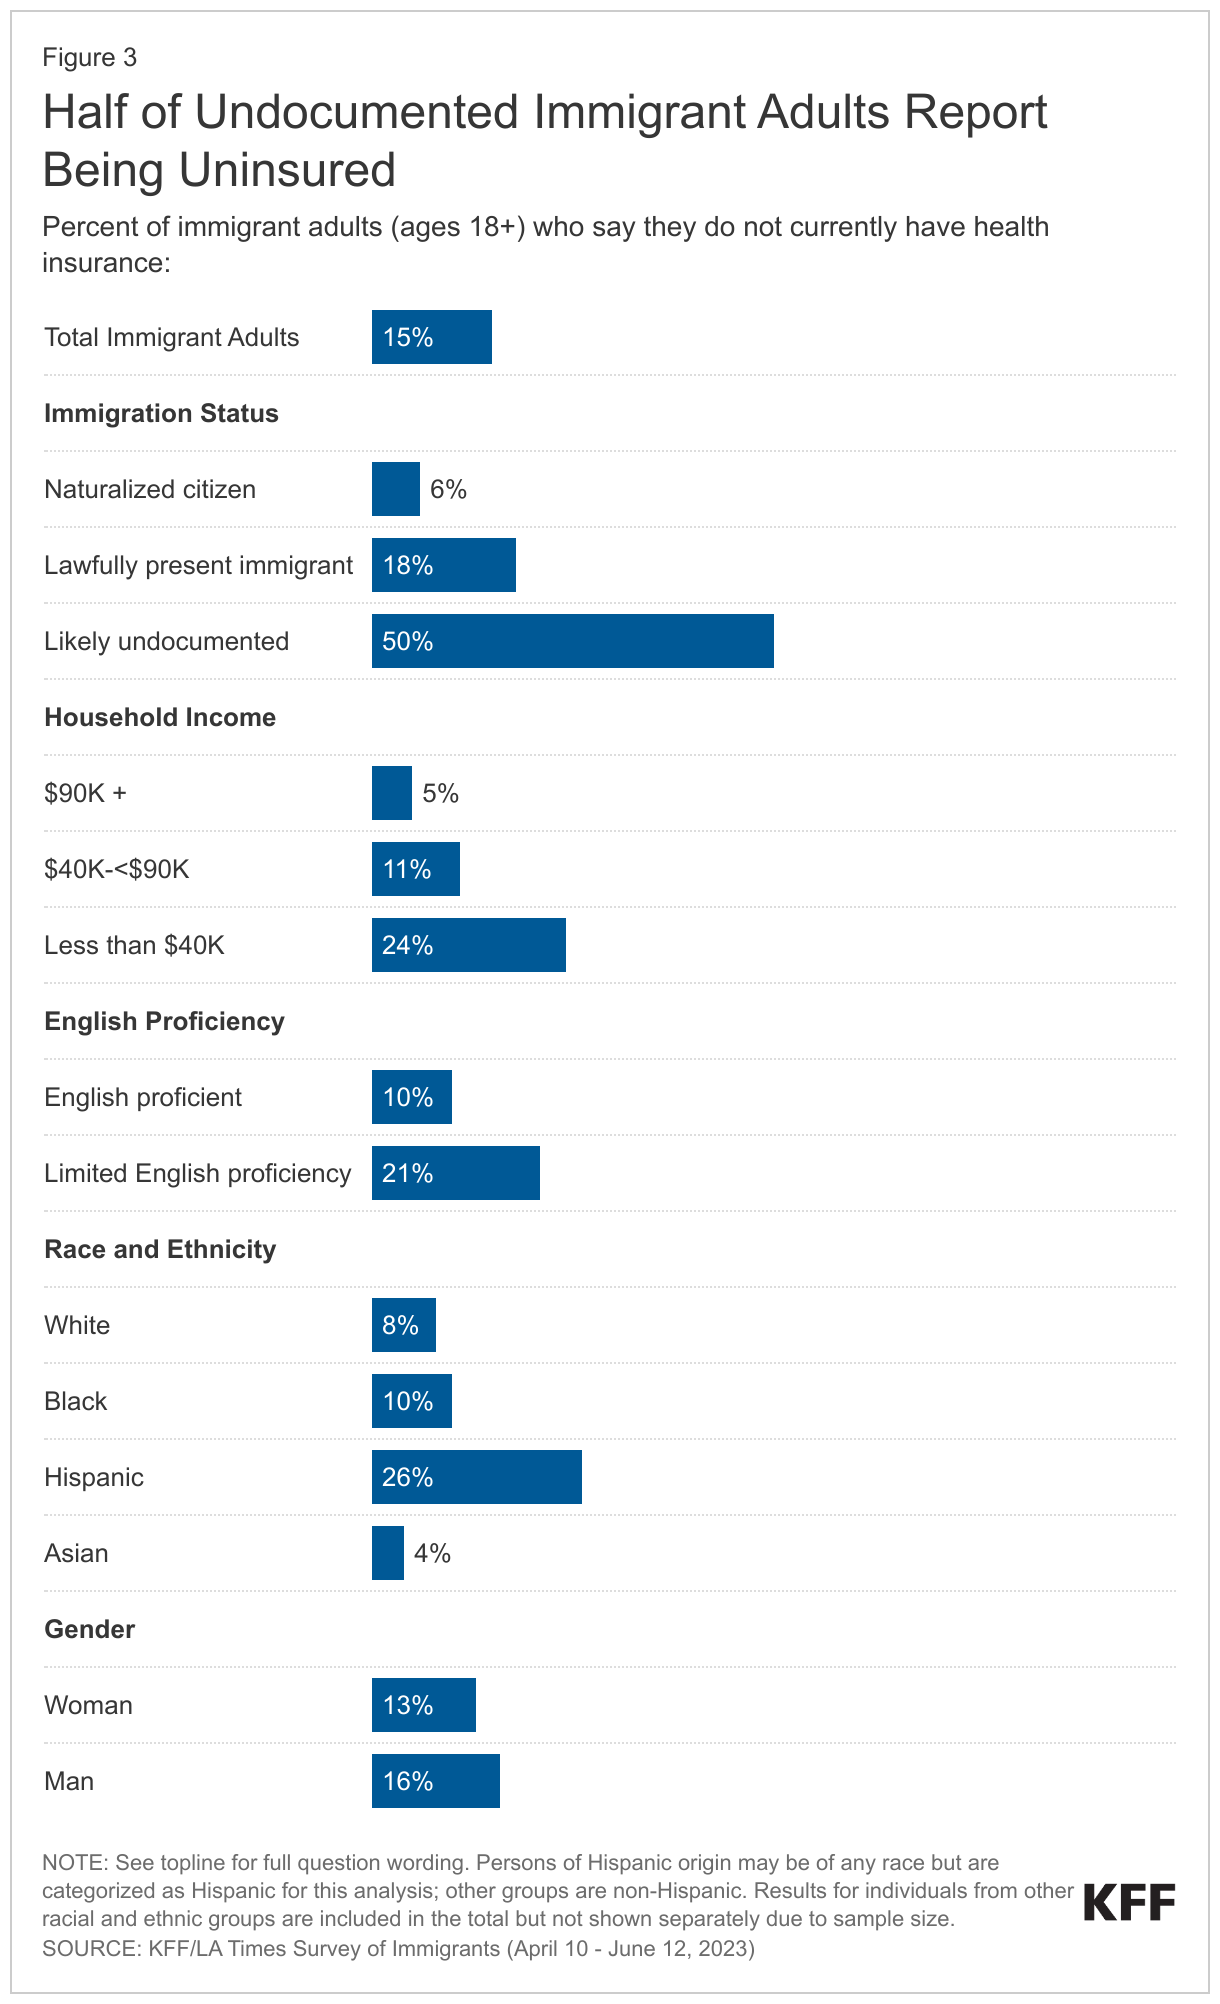
- Half of likely undocumented immigrant adults and nearly one in five (18%) lawfully present immigrant adults report being uninsured compared with less than one in ten citizens. Coverage rates also vary by income, with a quarter (24%) of lower income immigrant adults reporting being uninsured compared with 5% of immigrant adults with household incomes of at least $90,000. The high uninsured rates among noncitizen and lower income immigrant adults primarily reflect lower levels of private coverage due to disproportionate employment in lower income jobs that are less likely to offer employer-based insurance. Medicaid coverage helps offset some, but not all, of this gap, as many noncitizen immigrants remain ineligible for federally funded coverage programs. Many lawfully present immigrants face a five-year waiting period to enroll in Medicaid or Children’s Health Insurance Program (CHIP) coverage, and undocumented immigrants are prohibited from enrolling in any federally funded coverage, including Medicaid, CHIP, Affordable Care Act (ACA) Marketplace, and Medicare coverage.
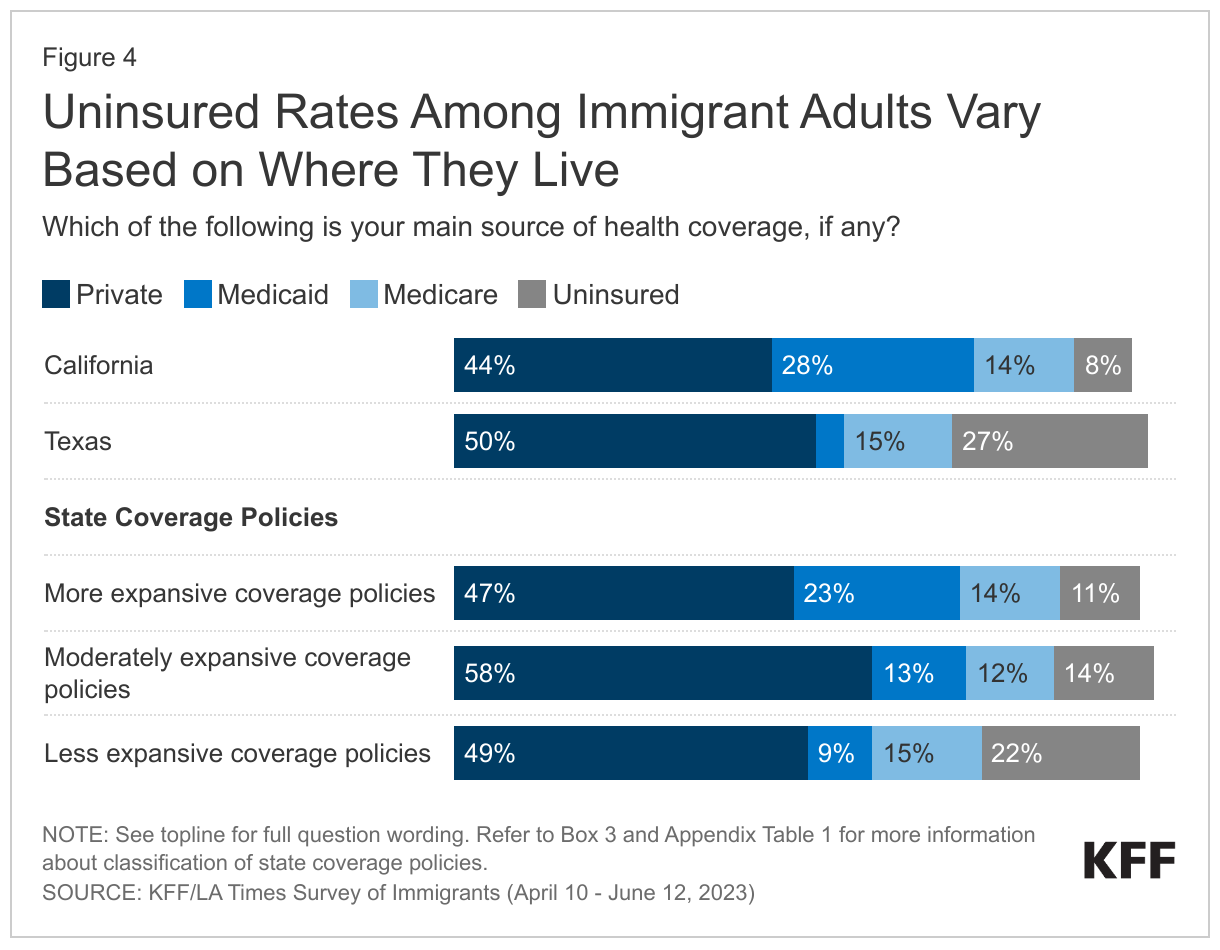
- While immigration status is a primary factor driving differences in uninsured rates, where immigrants live also matters, as those residing in states that provide more expansive coverage are less likely to be uninsured. States vary in the coverage they provide for their low-income population overall and immigrants specifically. Those that have adopted the ACA Medicaid expansion have broader eligibility for low-income adults, but noncitizen immigrants still face eligibility restrictions for this coverage. Some states have expanded coverage for immigrants by eliminating the five-year waiting period in Medicaid and/or CHIP for children and/or pregnant people and/or extending coverage to some groups regardless of immigration status through fully state-funded programs. Immigrants in states that have taken up more of these coverage options are less likely to be uninsured. For example, the uninsured rate for immigrant adults in California is less than one-third what it is in Texas (8% vs. 27%), reflecting more expansive coverage in California. Overall, immigrant adults in states with more expansive coverage, including Medicaid expansion and immigrant coverage expansions, are half as likely as immigrant adults residing in states with less expansive coverage to be uninsured (11% vs. 22%).
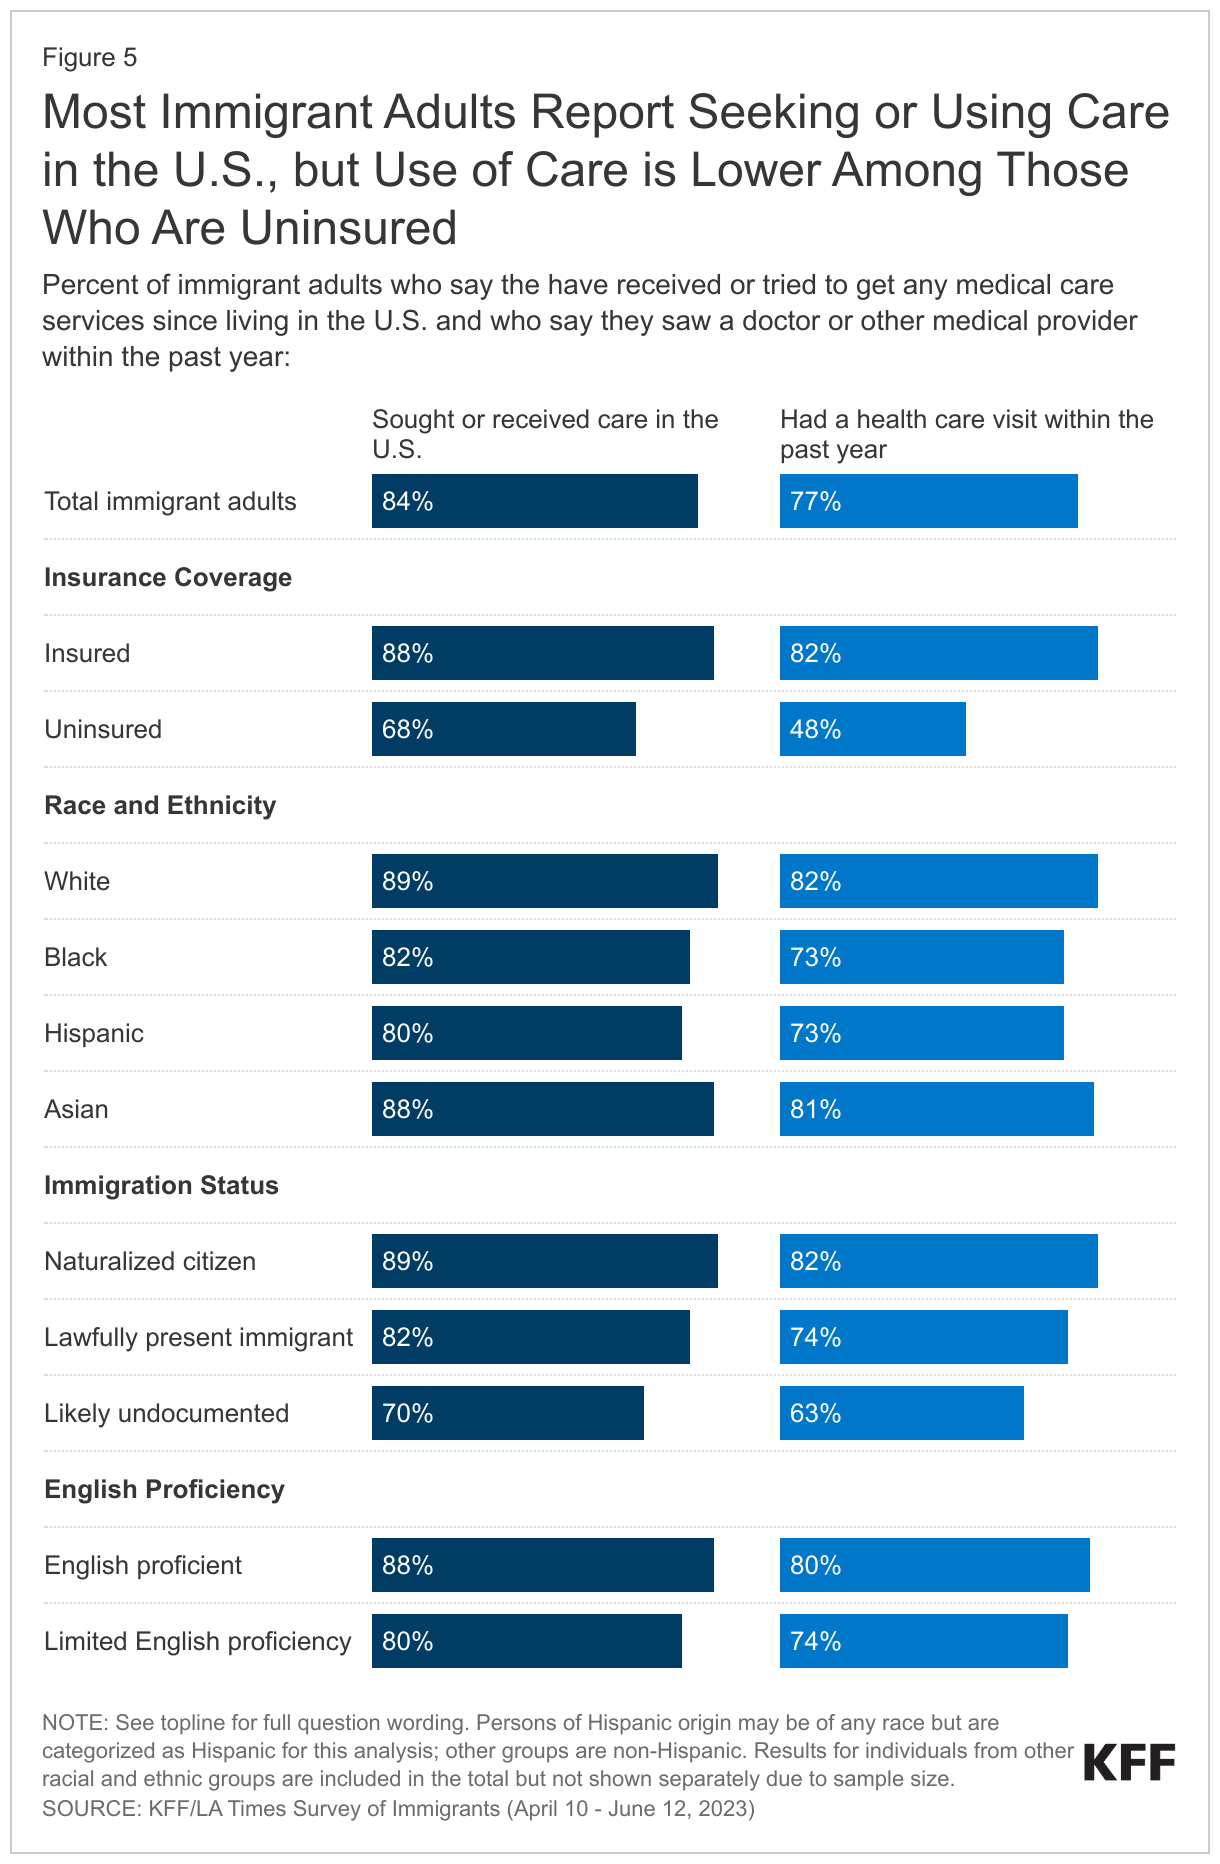
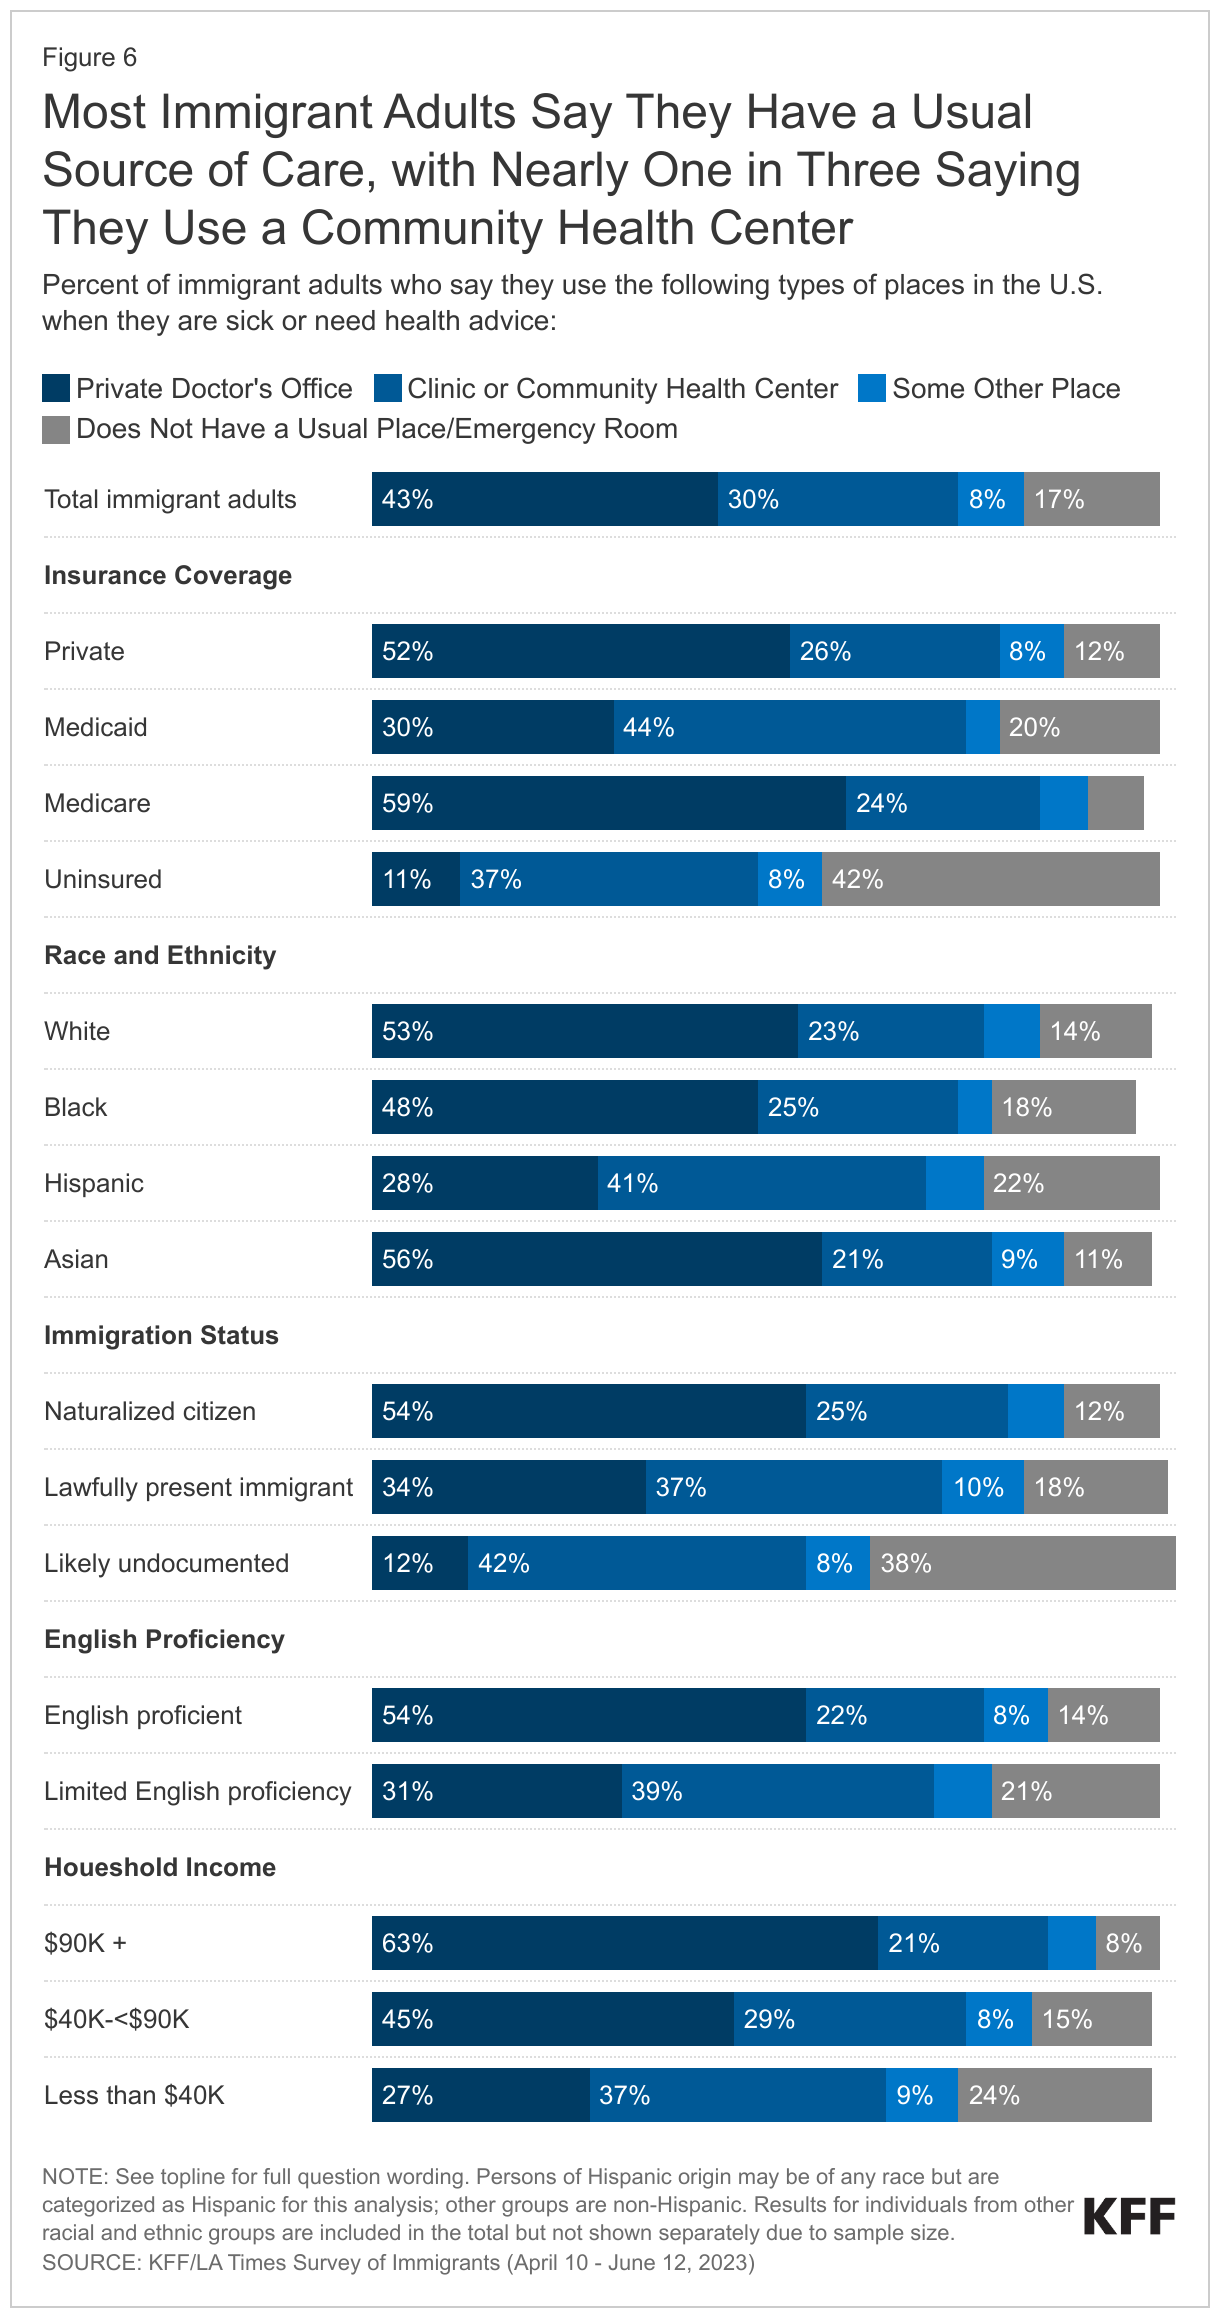
- While most immigrant adults report seeking or obtaining health care in the U.S. (84%) and say they have had a health care visit in the past year (77%), about half (48%) of uninsured immigrant adults report a visit in the past year. Hispanic and Black immigrants, likely undocumented immigrants, and those with LEP also are less likely to say have sought health care since arriving in the U.S. and less likely to report receiving health care in the past year. While this pattern largely reflects higher uninsured rates among these groups, some differences persist among those who have coverage, suggesting other factors such as immigration-related fears and linguistic barriers may also reduce use of care. Private doctors’ offices are the most common regular source of care for immigrant adults but nearly one in three say they use a community health center (CHC) or clinic.
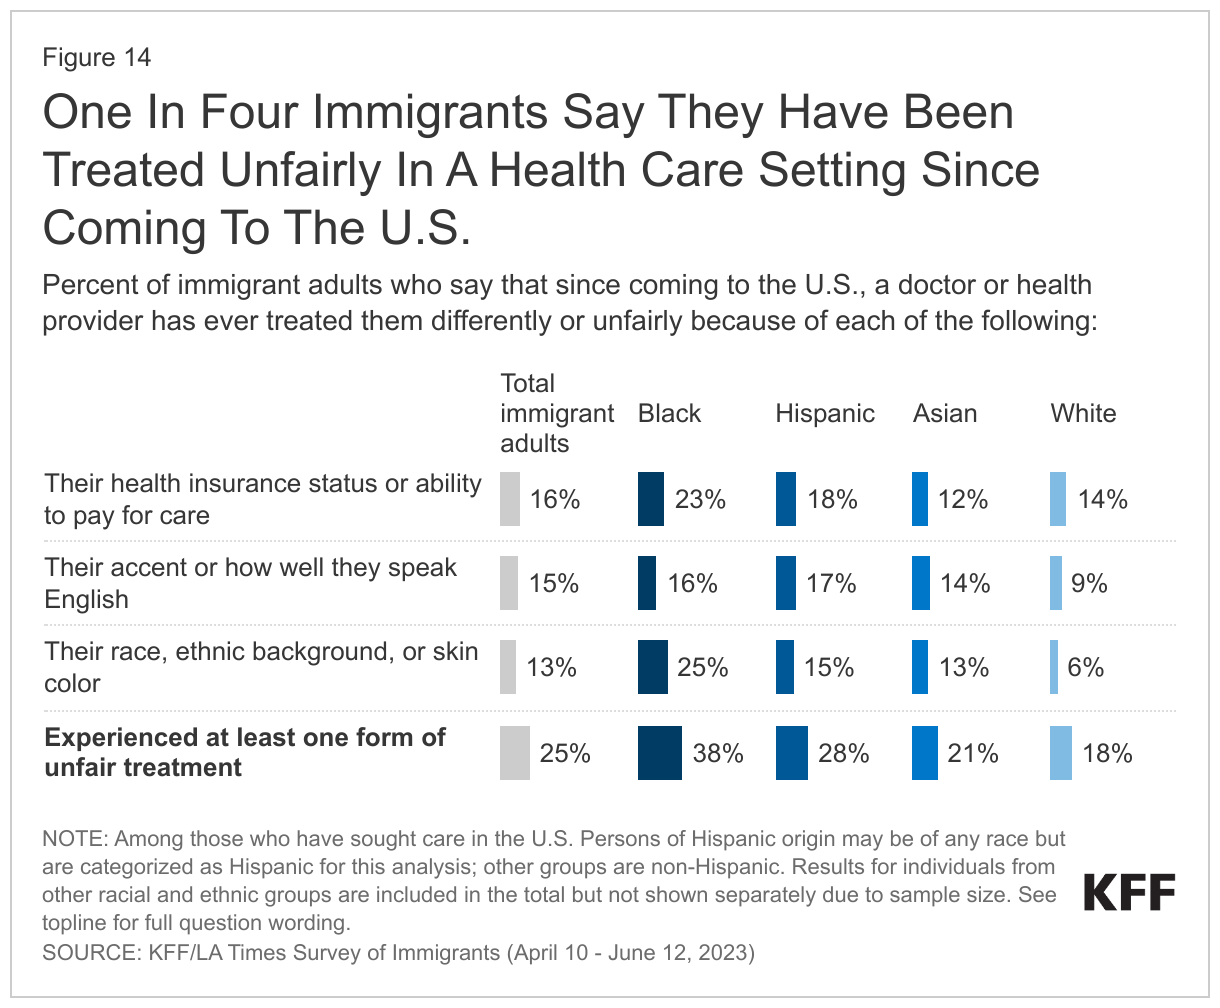
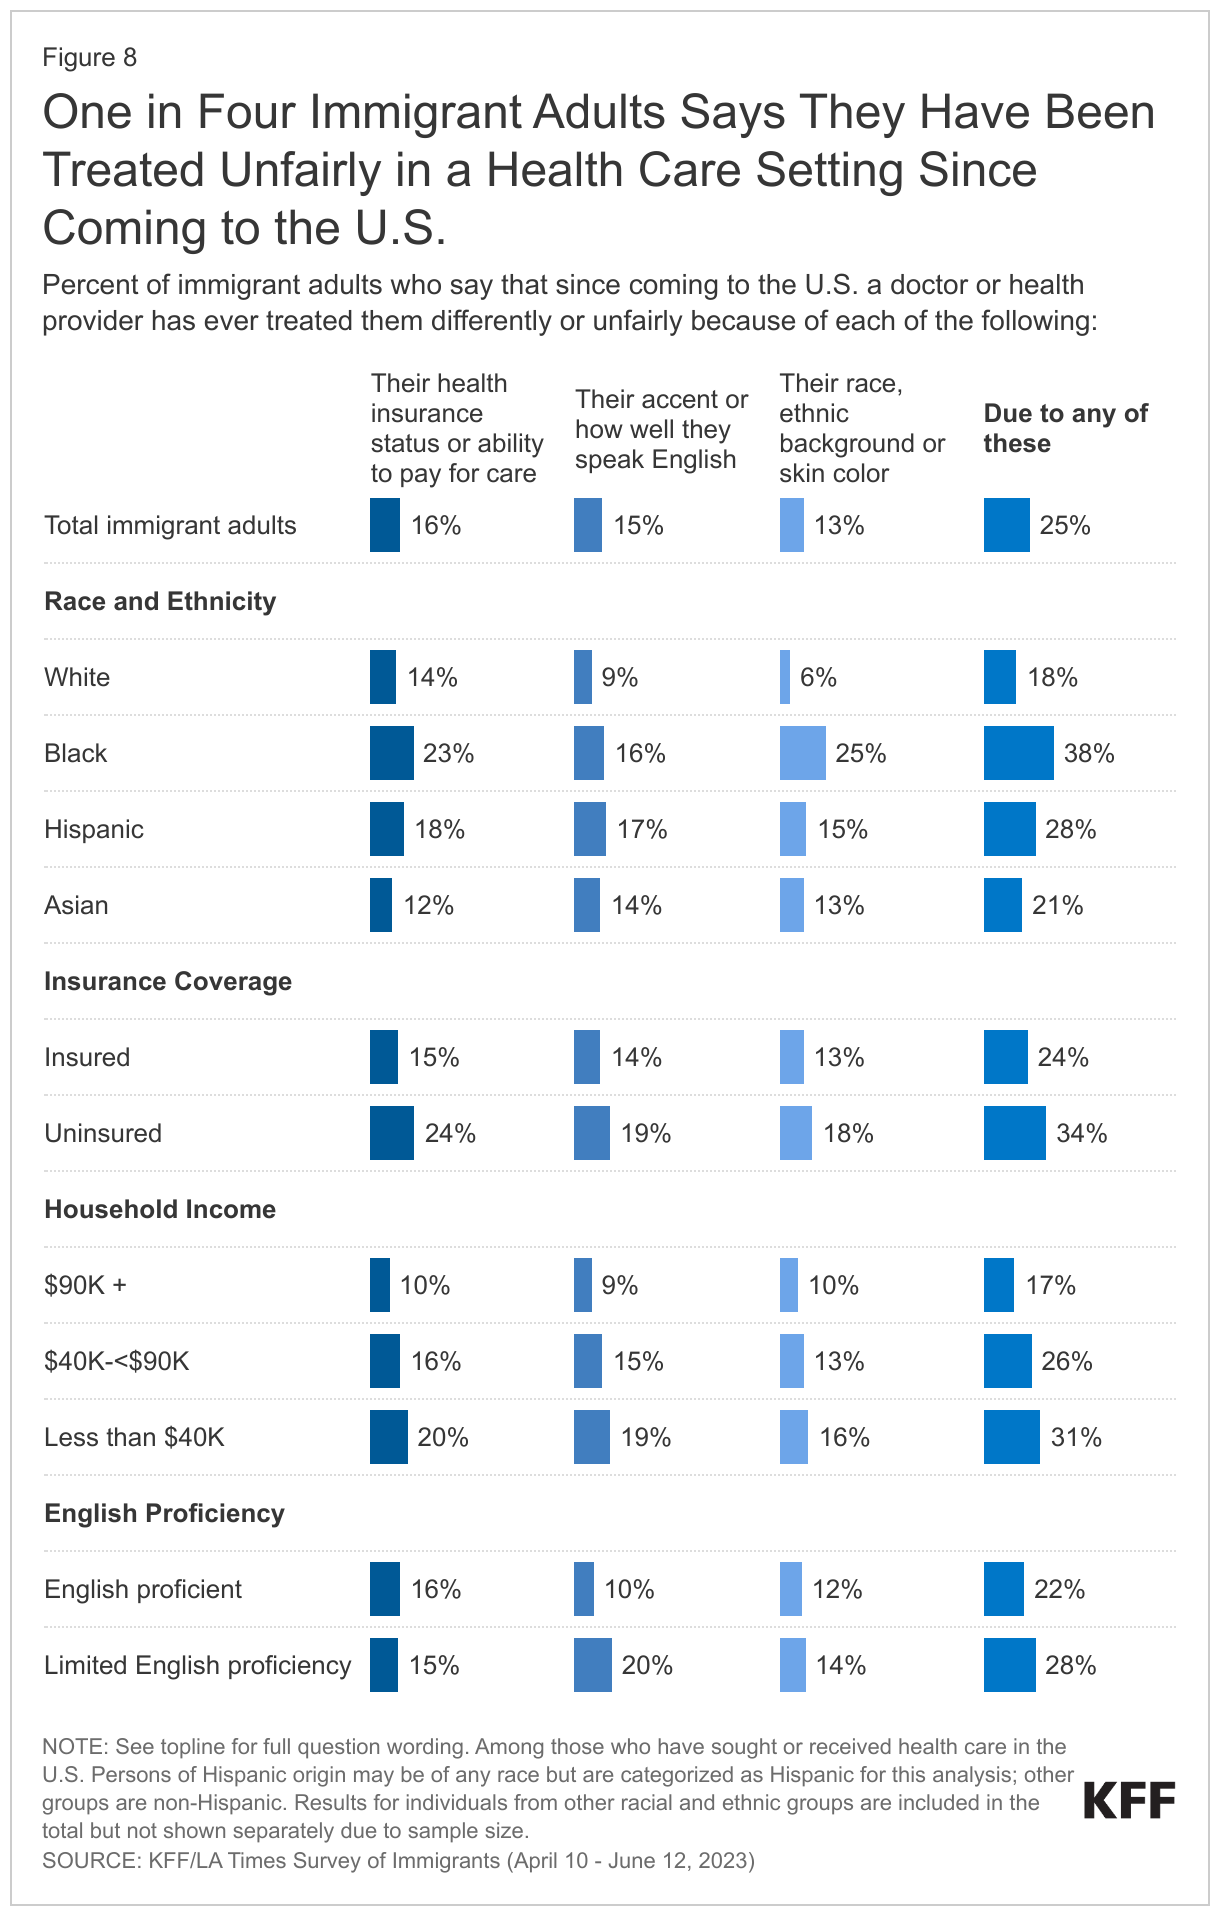
- Among immigrant adults who have received care in the U.S., one in four (25%) reports being treated unfairly by a health care provider because of their insurance status or ability to pay (16%); accent or ability to speak English (15%); and/or their race, ethnicity, or skin color (13%). Black immigrant adults are more than twice as likely as White immigrant adults to report being treated unfairly for at least one of these reasons (38% vs. 18%), and the share is also higher among Hispanic immigrant adults (28%). Black, Asian, and Hispanic immigrant adults are all more likely than their White counterparts to say they have been treated differently by a health care provider because of their race, ethnicity, or skin color as well as due to their accent or ability to speak English, with one in four (25%) of Black immigrants saying they were treated unfairly based on their race, ethnicity, or skin color.
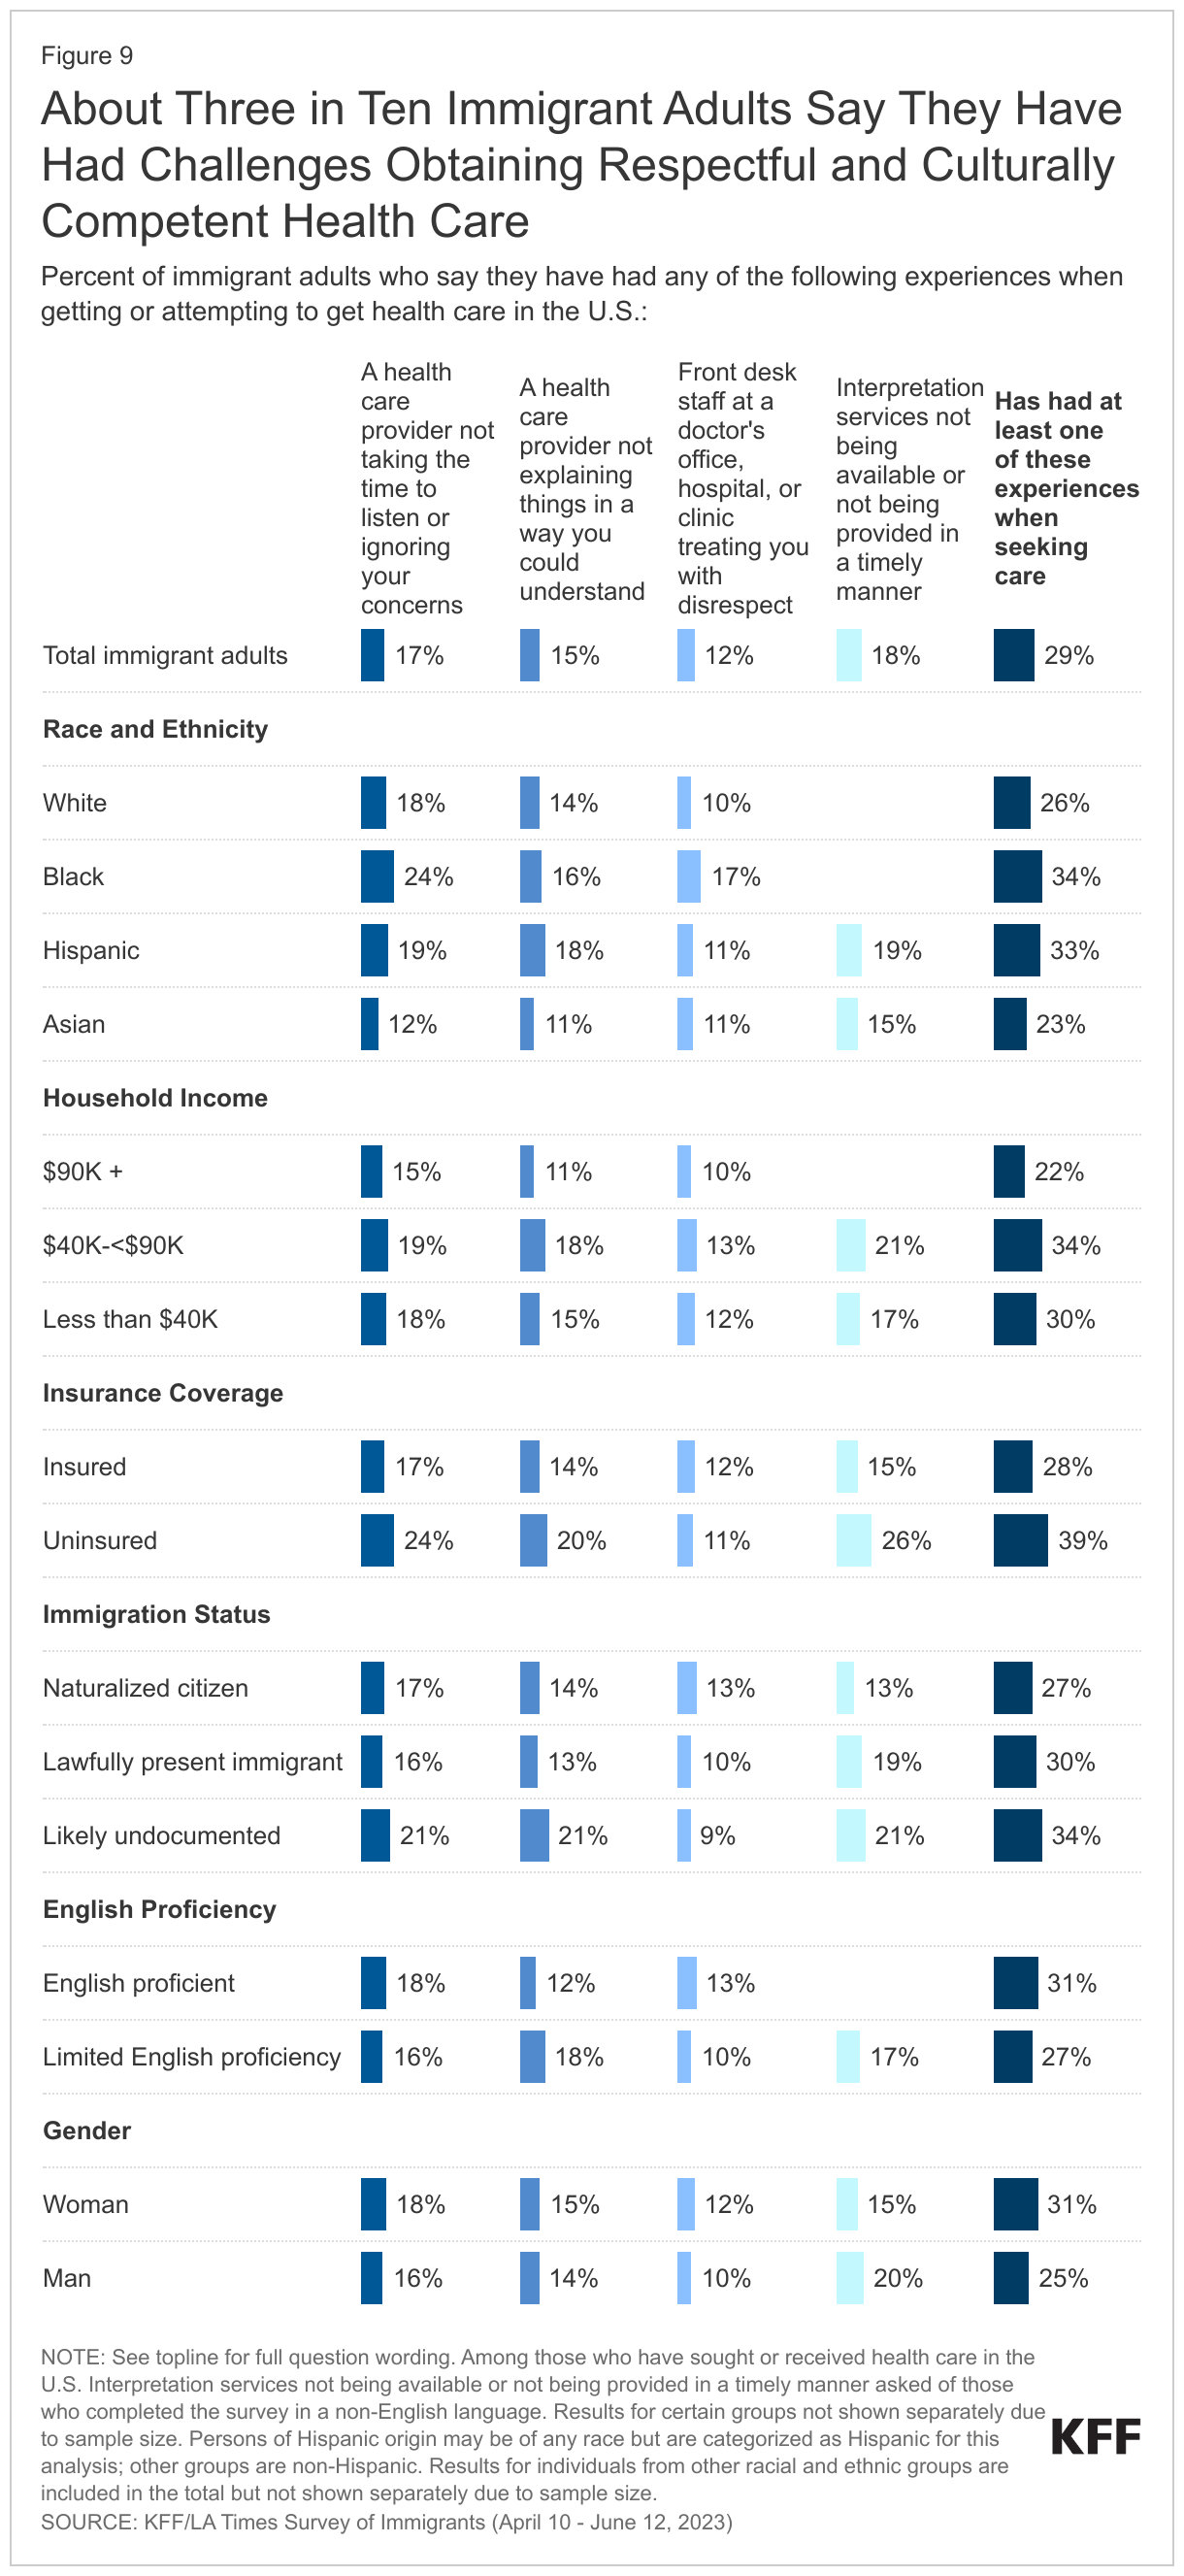
- About three in ten (29%) immigrant adults who have sought care in the U.S. report experiencing at least one of several difficulties obtaining respectful and culturally competent care asked about on the survey. These difficulties include a provider not taking the time to listen or ignoring concerns (17%); a provider not explaining things in a way they could understand (15%); being treated with disrespect by front office staff (12%); and, among those with LEP who completed the survey in a non-English language, interpretation services not available or provided in a timely manner (17%). The shares reporting any of these difficulties are higher among Black (34%), Hispanic (33%), uninsured (39%), and likely undocumented (34%) immigrant adults and those with lower household incomes compared with their White, insured, citizen, and higher income counterparts.
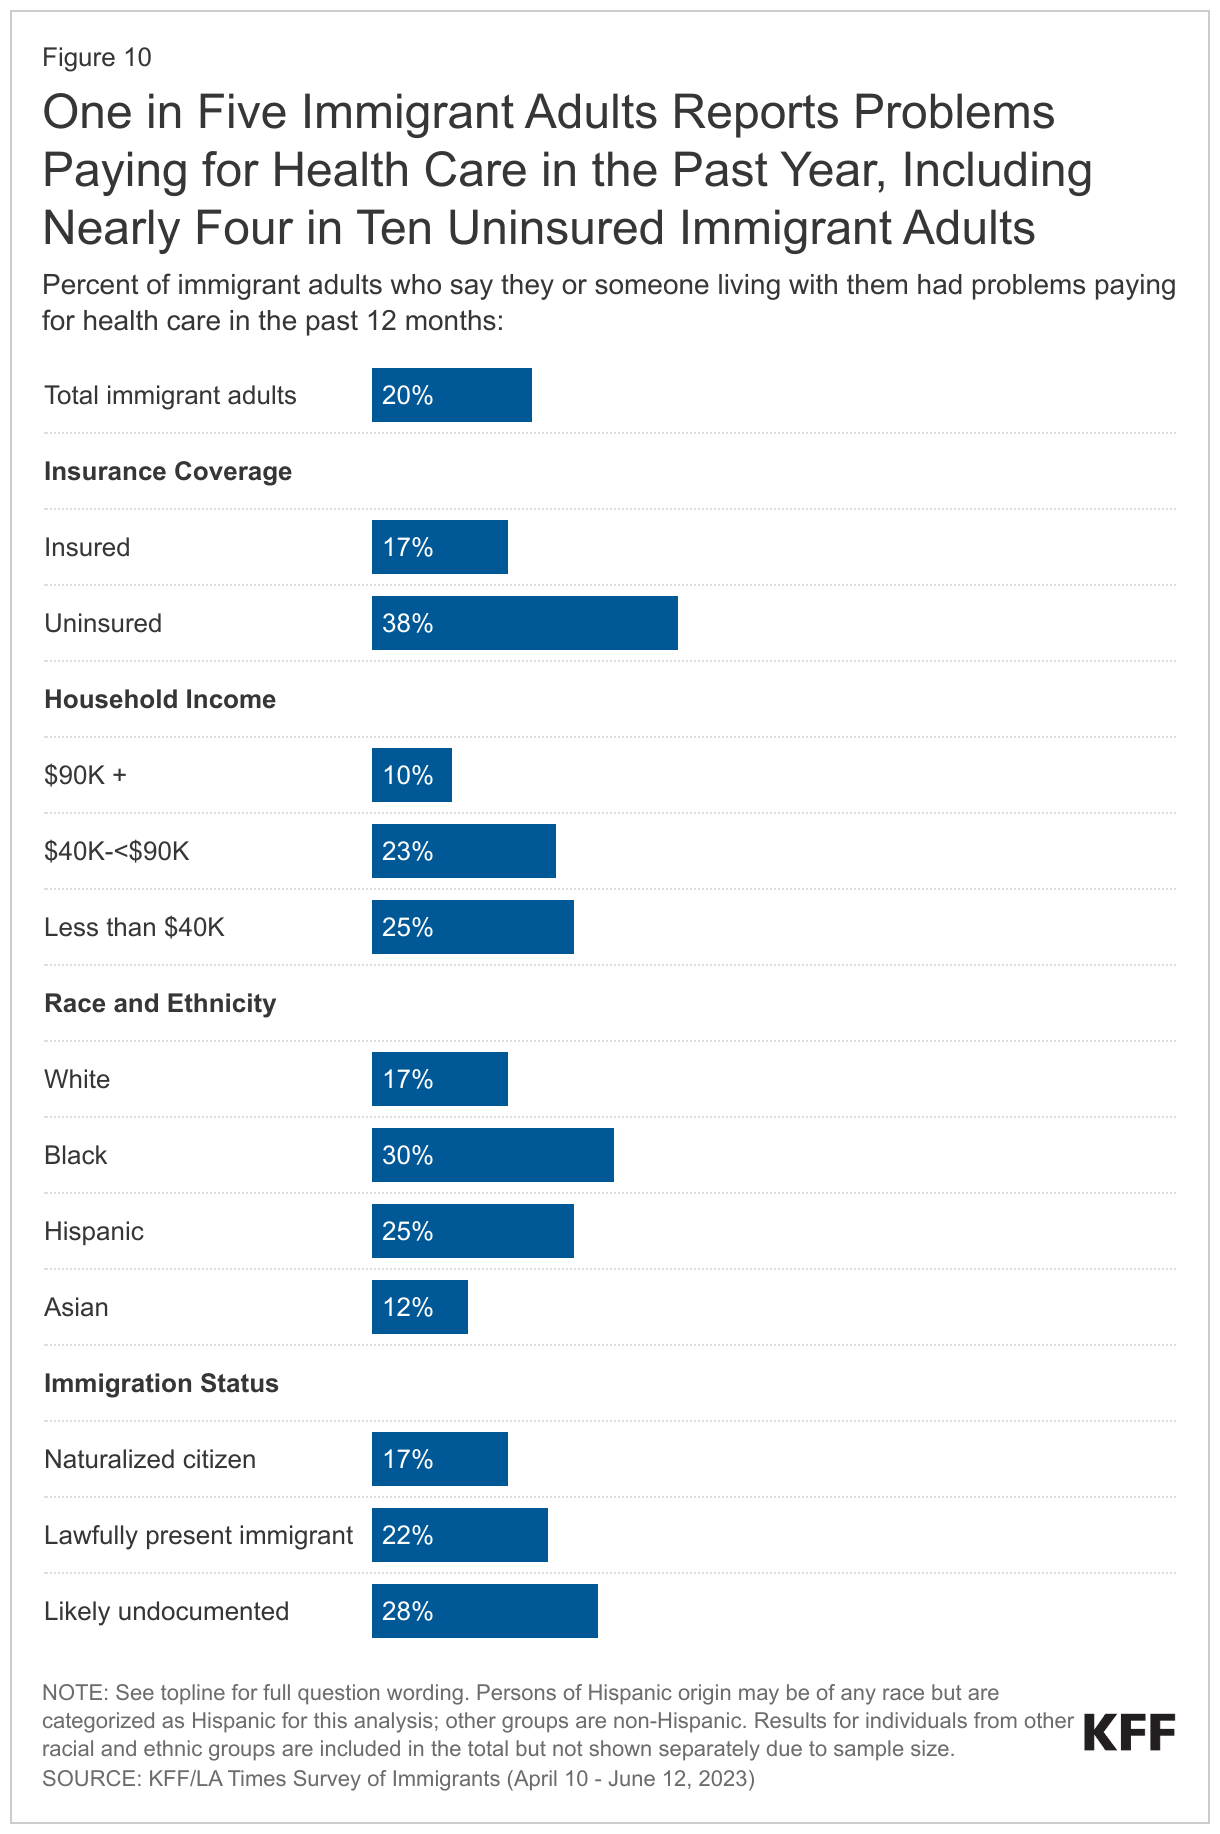
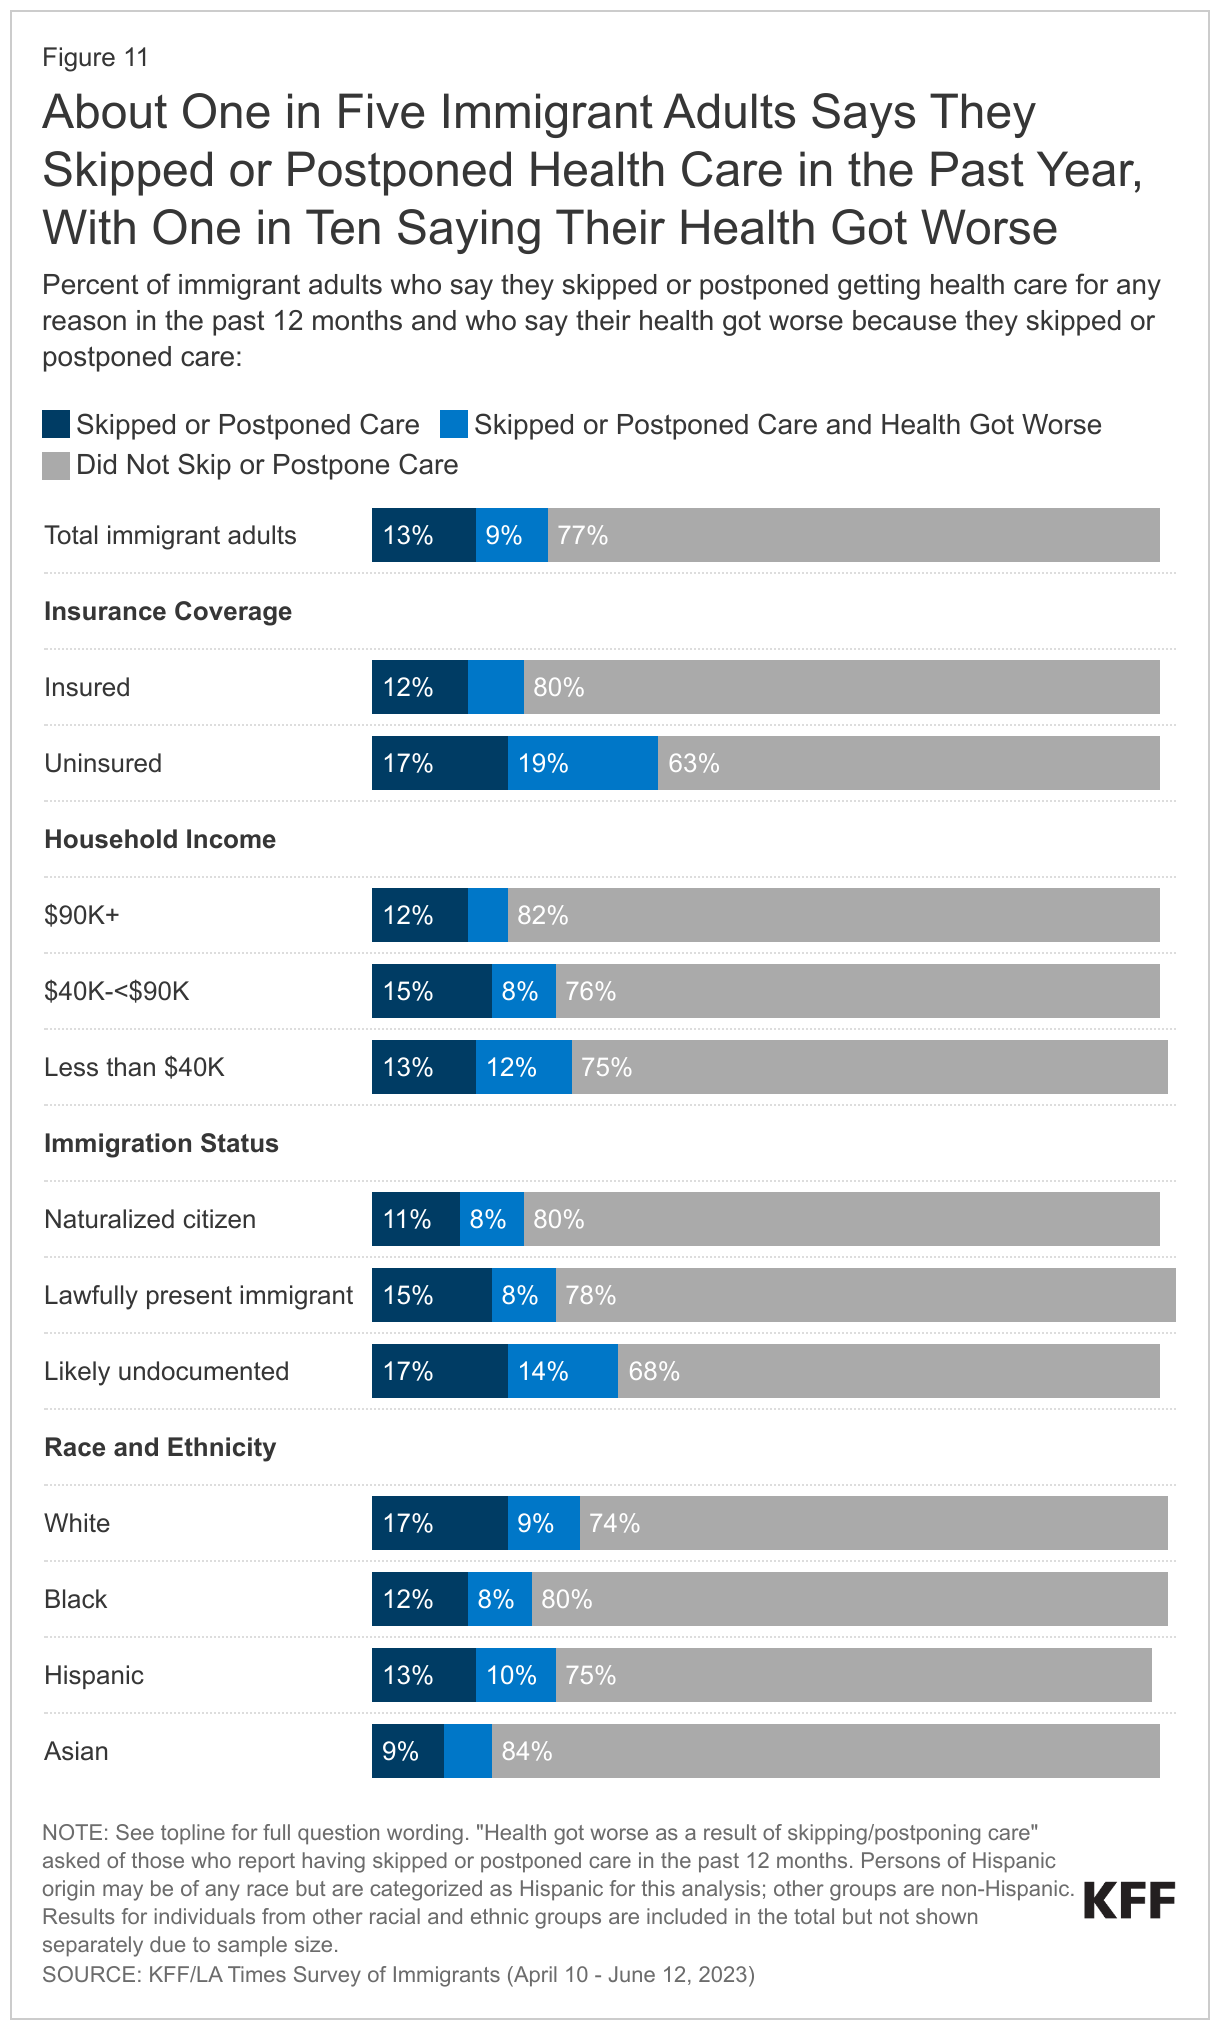
- One in five (20%) immigrant adults reports problems paying for health care in the past year and a similar share (22%) say they skipped or postponed care in the past year, with these shares rising to about a third (36%) among those who are uninsured. About seven in ten (69%) of those who skipped or postponed care (15% of all immigrant adults) say they did so due to cost or lack of health coverage, and about half (49%) (10% of all immigrant adults) say they did so because of services not being available at a convenient time or location. Smaller shares say it was because they didn’t know where to go or how to find the services they needed, or, among those with LEP, not being able to speak to someone in their preferred language or get an interpreter. Overall, 40% of immigrant adults who skipped or postponed care (9% of all immigrant adults) say that their health got worse as a result of skipping or postponing care.
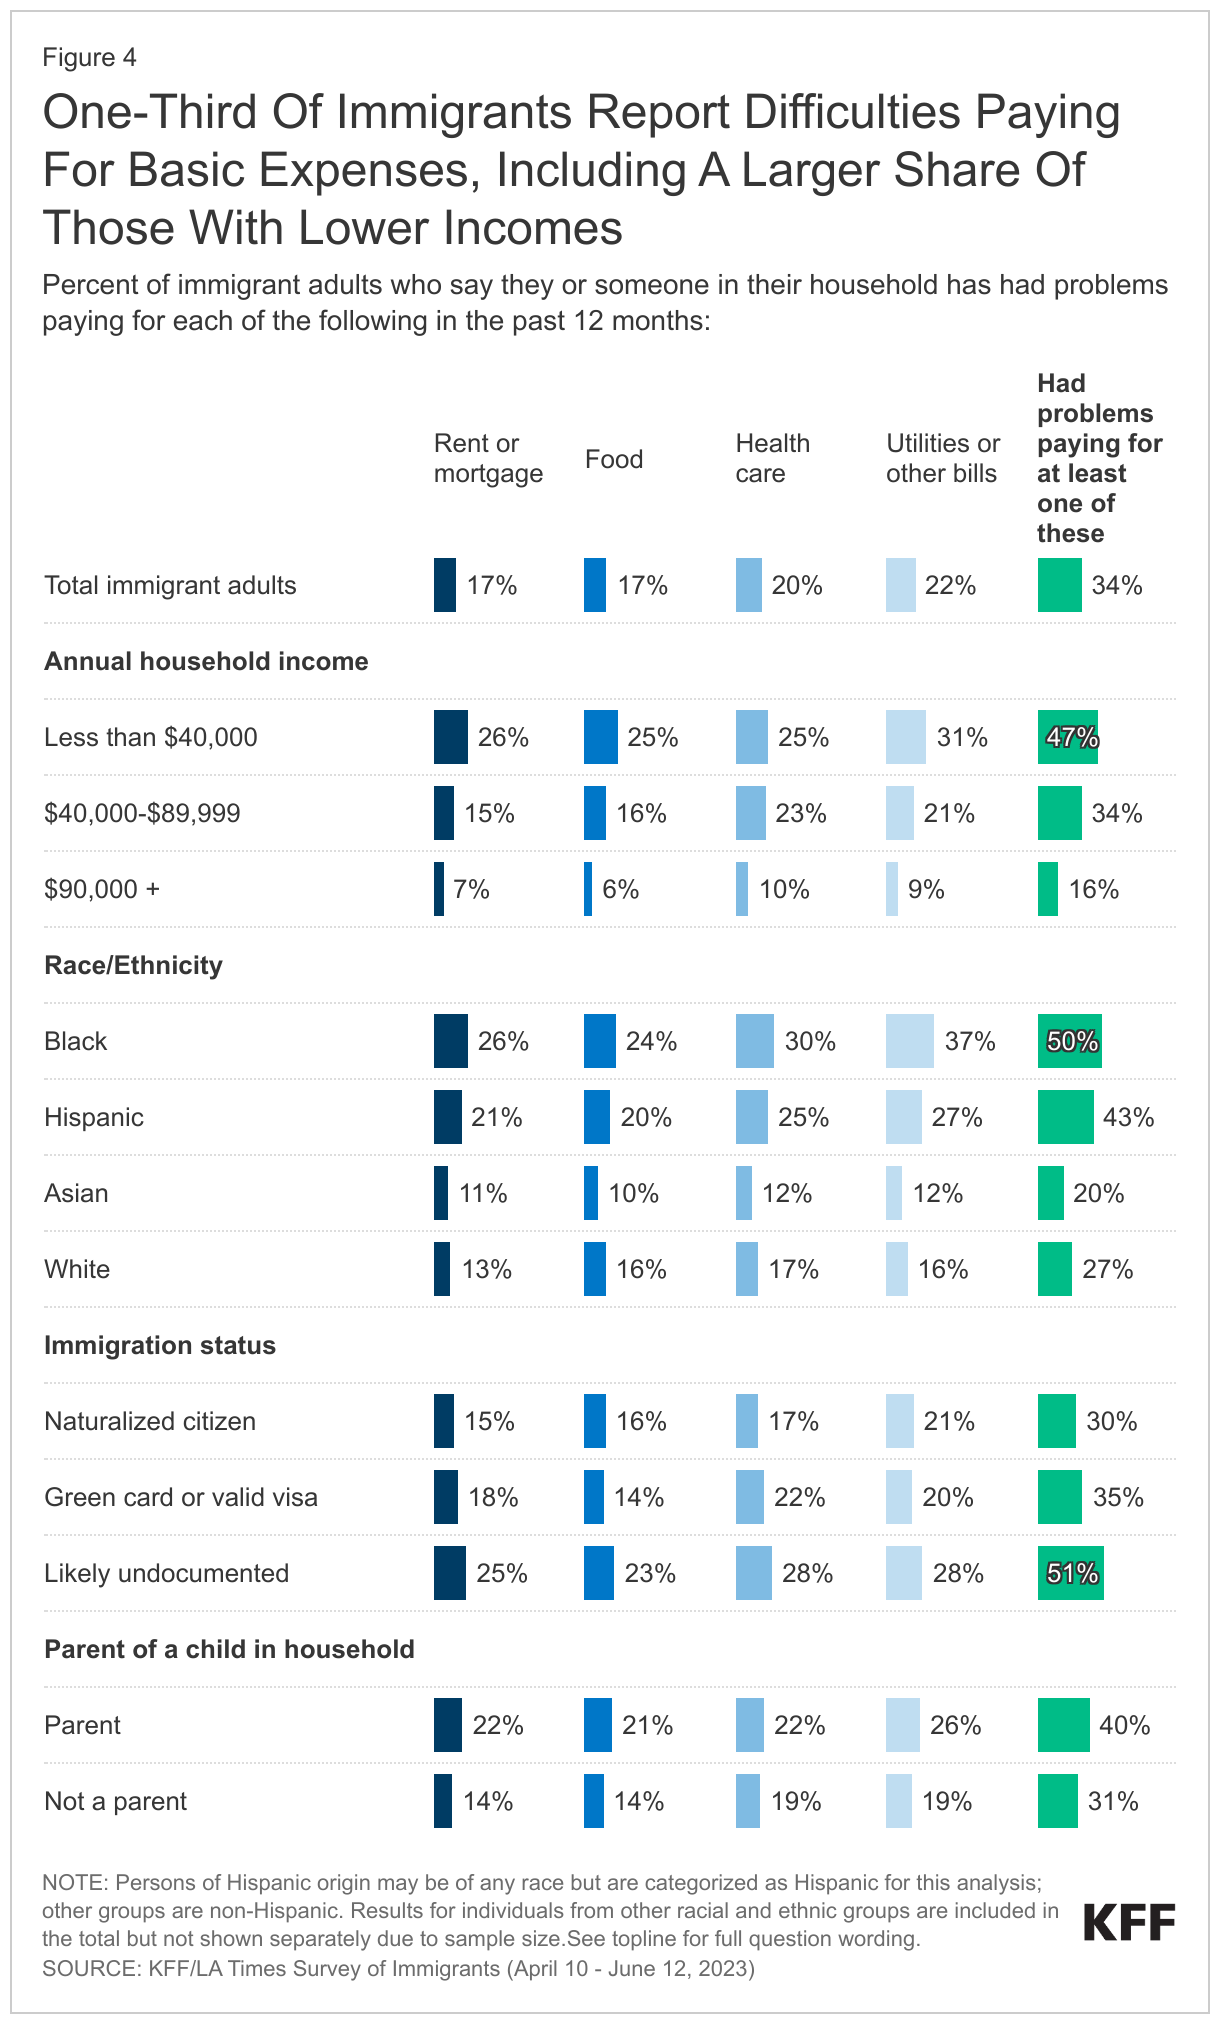
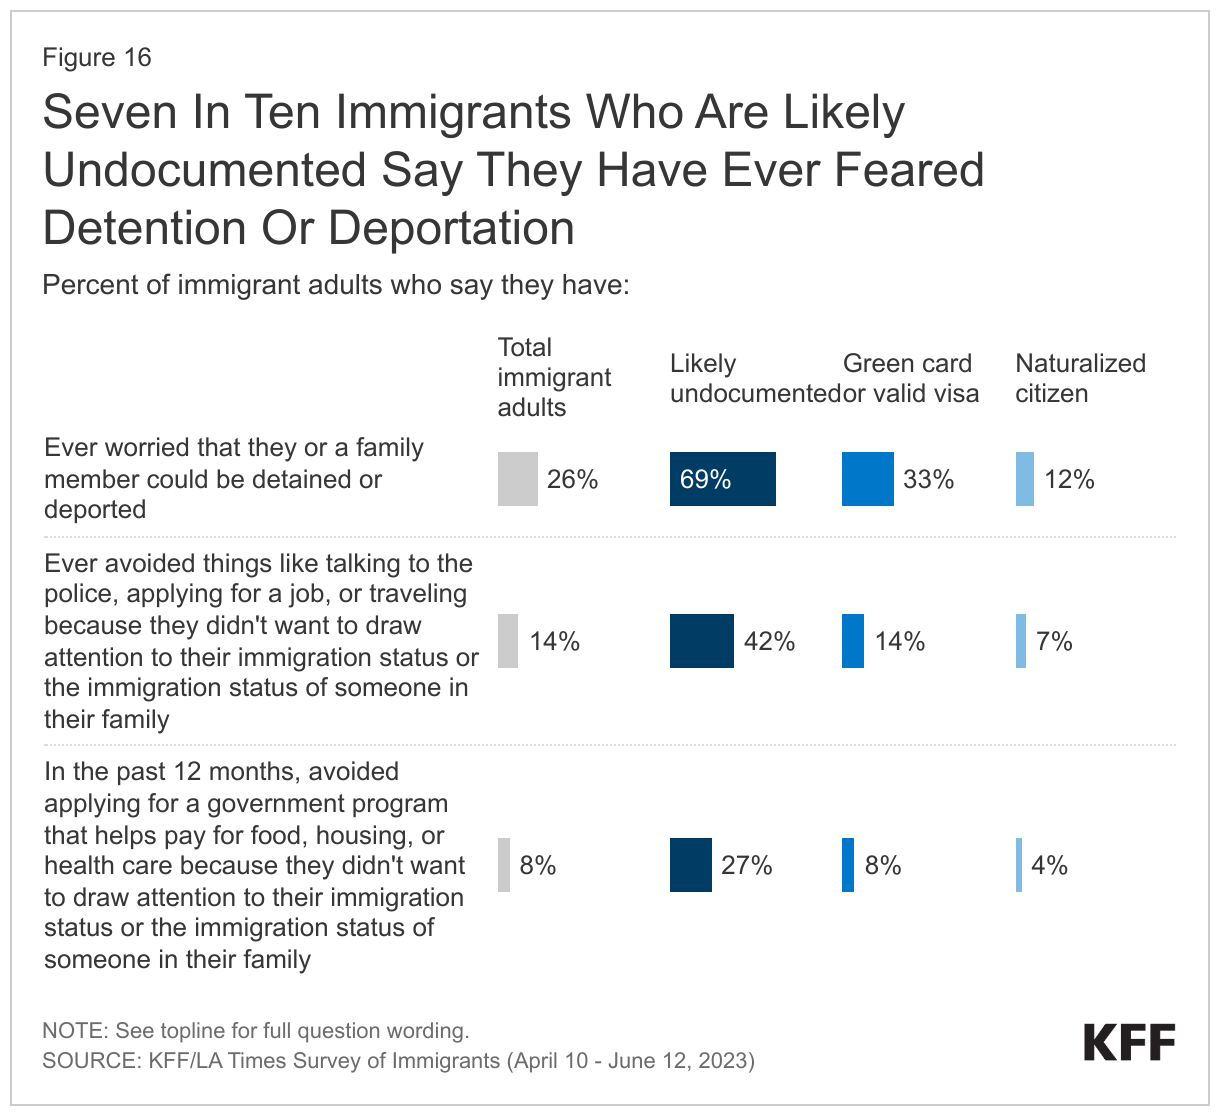
- Many immigrant adults are uncertain about how using assistance for food, housing, and health care may impact their immigration status, and some are fearful of applying for this assistance. Given lower incomes among immigrant families and difficulties paying for basic needs and monthly bills, food, housing, and health care assistance programs could reduce financial stress and facilitate access to care for them and their children. Although many noncitizen immigrants are ineligible for these programs, children in immigrant families are often U.S.-born citizens who may be eligible. However, nearly three-quarters of immigrant adults, including nine in ten of those who are likely undocumented, report uncertainty about how use of these programs may impact immigration status or incorrectly believe use may reduce the chances of getting a green card in the future. About a quarter (27%) of likely undocumented immigrants and nearly one in ten (8%) lawfully present immigrants say they avoided applying for food, housing, or health care assistance in the past year due to immigration-related fears. Partly reflecting this fear as well as language barriers and eligibility restrictions, immigrant adults are no more likely than their U.S.-born counterparts to say they or someone living with them received government assistance with food, housing, or health care despite having lower incomes and facing financial challenges, with 28% of both groups reporting receiving assistance in the past year.2
Box 1: Who Are U.S. Immigrants?
The KFF/LA Times Survey of Immigrants is a probability-based survey that is representative of the adult immigrant population in the U.S. based on known demographic data from federal surveys (see Methodology for more information on sampling and weighting). For the purposes of this project, immigrant adults are defined as individuals ages 18 and over who live in the U.S. but were born outside the U.S. or its territories.
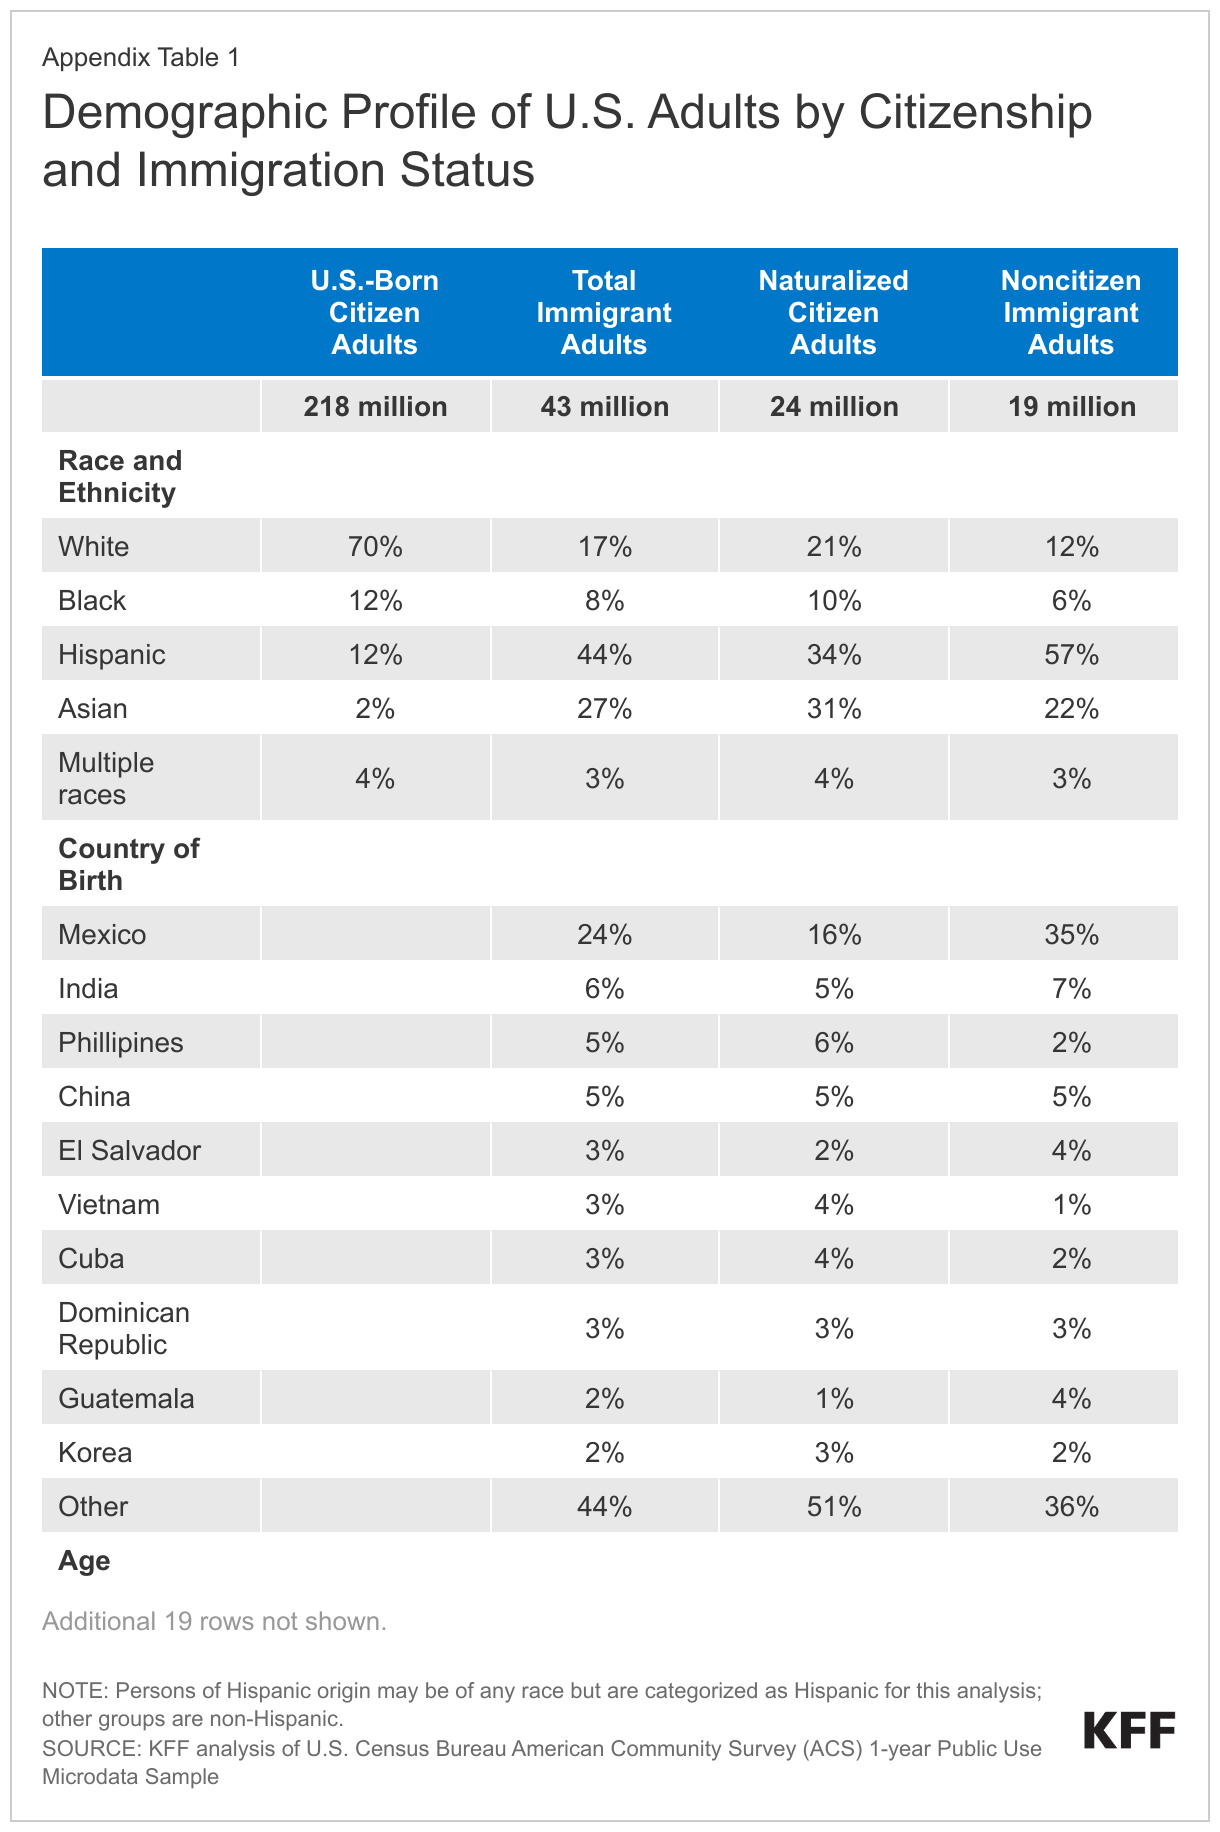
According to 2021 federal data, immigrants make up 16% of the U.S. adult population (ages 18+). About four in ten immigrant adults identify as Hispanic (44%), over a quarter are Asian (27%), and smaller shares are White (17%), Black (8%), or report multiple races (3%). The top six countries of origin among adult immigrants in the U.S. are Mexico (24%), India (6%), China (5%), the Philippines (5%), El Salvador (3%), and Vietnam (3%) although immigrants hail from countries across the world.
The immigrant adult population largely mirrors the U.S.-born adult population in terms of gender. While similar shares of U.S.-born and immigrant adults have a college degree, immigrant adults are substantially more likely than U.S.-born adults to have less than a high school education. About four in ten (40%) immigrants are parents of a child under 18 living in their household, and a quarter (25%) of children in the U.S. have an immigrant parent. Immigrant adults have lower educational attainment levels than U.S. born adults, with over a quarter (25%) having less than a high school degree.
Slightly less than half (47%) of immigrant adults report having limited English proficiency, meaning they speak English less than very well. Regardless of ability to speak English, a large majority (83%) of immigrants say they speak a language other than English at home, including about four in ten (43%) who speak Spanish at home.
A majority (55%) of U.S. adult immigrants are naturalized citizens. The remaining share are noncitizens, including lawfully present and undocumented immigrants. KFF analysis based on federal data estimates that 60% of noncitizens are lawfully present and 40% are undocumented.3
See Appendix Table 2 for a table of key demographics about the U.S. adult immigrant population compared to the U.S.-born adult population.
Box 2: Key Terms Used In This Report
Limited English Proficiency: Immigrants are classified as having Limited English Proficiency if they self-identify as speaking English less than “very well.”
Immigration Status: Immigrants are classified by their self-reported immigration status as follows:
- Naturalized Citizen: Immigrants who said they are a U.S. citizen.
- Lawfully Present Immigrant: Immigrants who said they are not a U.S. citizen, but currently have a green card (lawful permanent status) or a valid work or student visa.
- Likely Undocumented Immigrant: Immigrants who said they are not a U.S. citizen and do not currently have a green card (lawful permanent status) or a valid work or student visa. These immigrants are classified as “likely undocumented” since they have not affirmatively identified themselves as undocumented.
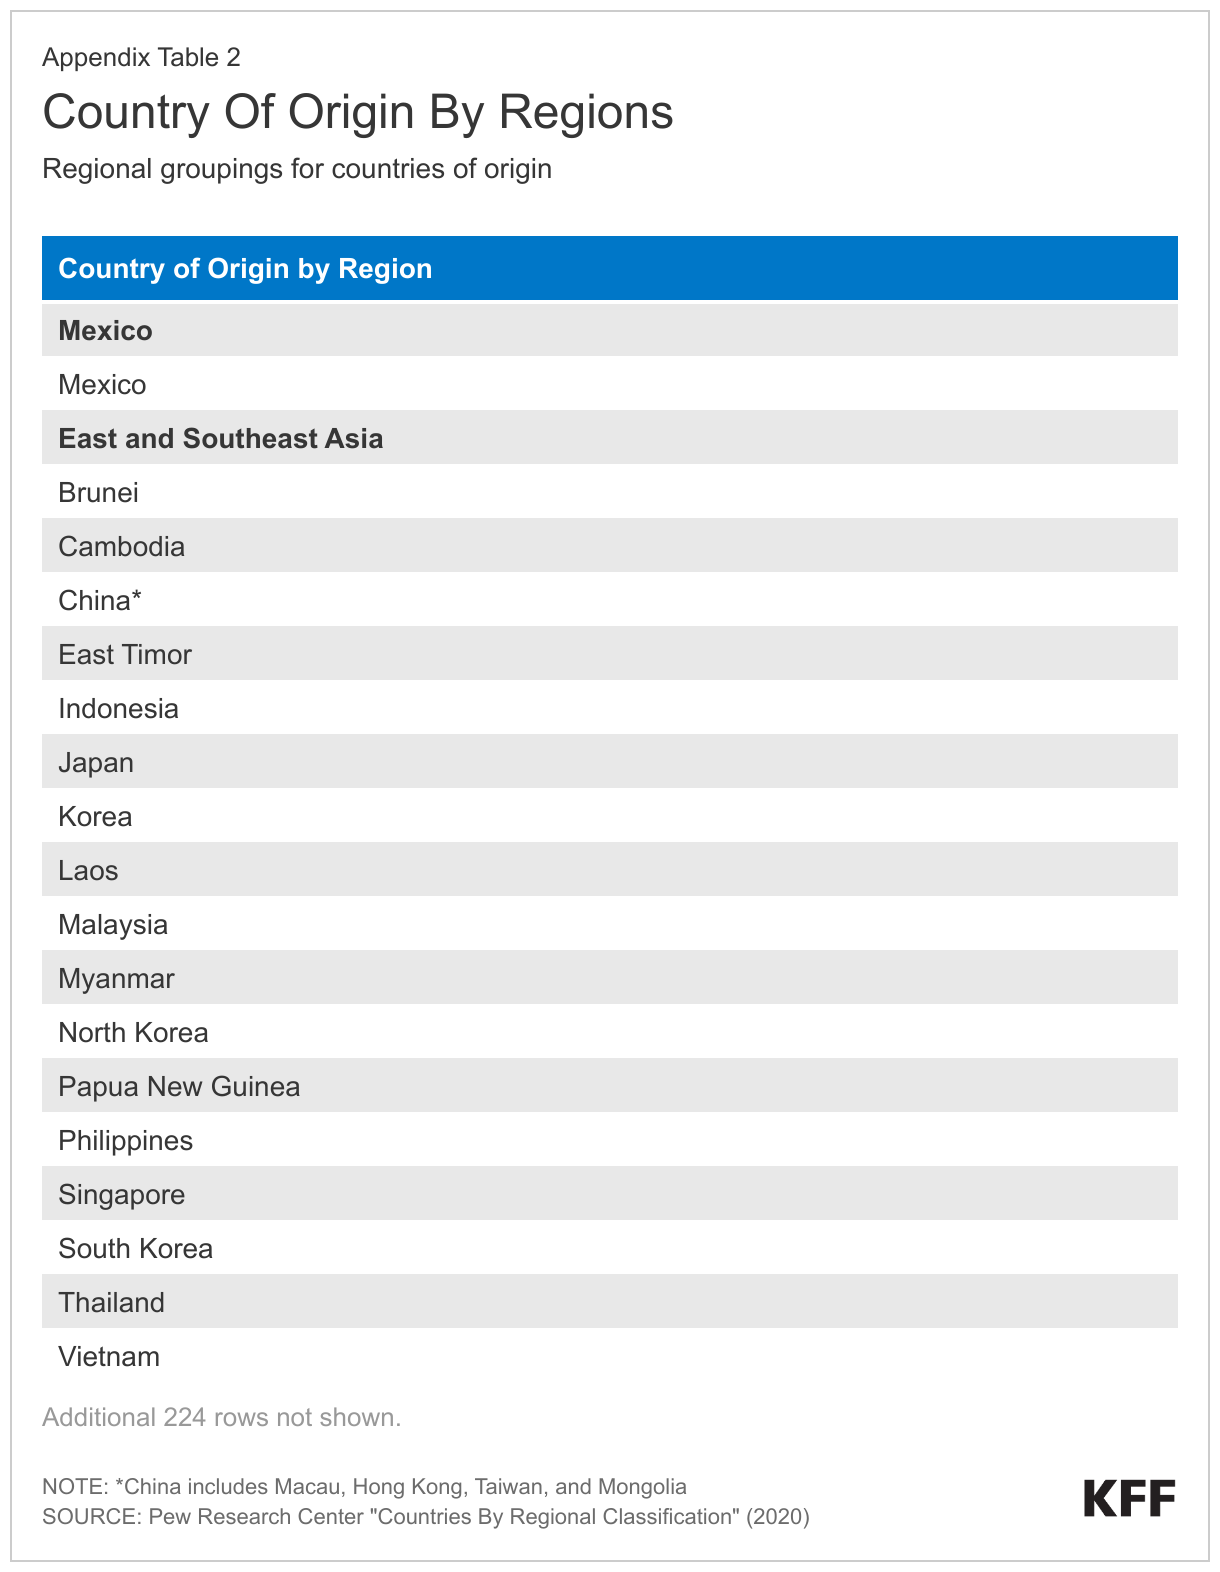
Race and Ethnicity: Data are reported for four racial and ethnic categories: Hispanic, Black, Asian, and White based on respondents’ self-reported racial and ethnic identity. Persons of Hispanic origin may be of any race but are categorized as Hispanic for this analysis; other groups are non-Hispanic. Results for individuals in other groups are included in the total but not shown separately due to sample size restrictions. Given that this report includes a focus on experiences with discrimination and unfair treatment, we often show data by race and ethnicity rather than country of birth. Given variation of experiences within these broad racial and ethnic categories, further reports will provide additional details for subgroups within racial and ethnic groups, including more data by country of origin.
Immigrant Health and Well-being
Most immigrant adults say they are in good to excellent health. Overall, close to eight in ten (79%) immigrant adults report they are in excellent, very good, or good health, while 21% report being in fair or poor health. Roughly eight in ten of the overall U.S. adult population also reports being in excellent, very good, or good health.4 Income is highly associated with self-reported health status as nearly one in three (31%) lower income immigrant adults (household incomes of less than $40,000 per year) report fair or poor health compared with just 7% of those in households with annual income of at least $90,000 (Figure 1). Largely reflecting these income differences, among immigrant adults, those who are Hispanic and are likely undocumented are disproportionately likely to report fair or poor health.
Overall, 14% percent of immigrant adults say they have a health condition that requires ongoing treatment. Consistent with patterns of self-reported health status, nearly one in five (19%) of those with household incomes below $40,000 per year report a health condition that requires ongoing treatment, compared to about one in ten of those with higher incomes.
Health Coverage of Immigrants
Health insurance coverage makes a difference in whether and when people get necessary medical care, where they get their care, and ultimately how healthy they are. Overall, uninsured people are far more likely than those with insurance to not have a usual source of care, to not have had a health care visit in the past year, and to postpone or forgo health care due to cost. Postponed or forgone care can lead to preventable conditions or chronic diseases going undetected and worsening conditions. In addition, for many uninsured people, health care costs create financial stress and can lead to debt as well as difficult choices between health care costs and paying for other needs, like housing, food, and transportation.
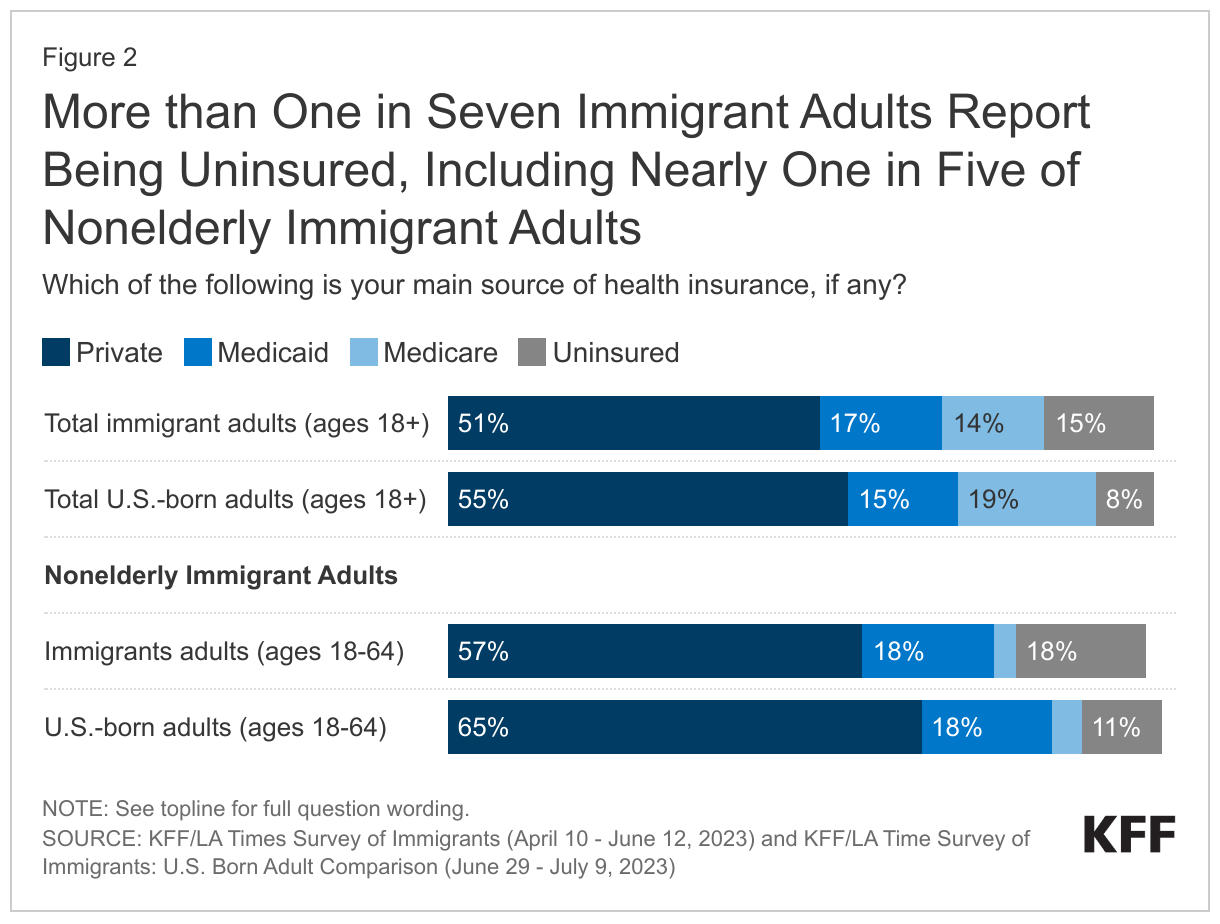
Fifteen percent of immigrant adults 18 and older and nearly one in five (18%) nonelderly adult immigrants (ages 18-64) report being uninsured (Figure 2). In comparison, 8% of U.S.-born adults and 11% of U.S.-born nonelderly adults (ages 18-64) say they lack coverage.5 These higher uninsured rates primarily reflect lower levels of private coverage compared to their U.S.-born counterparts. Medicaid coverage helps offset some but not all of this gap, resulting in higher uninsured rates.
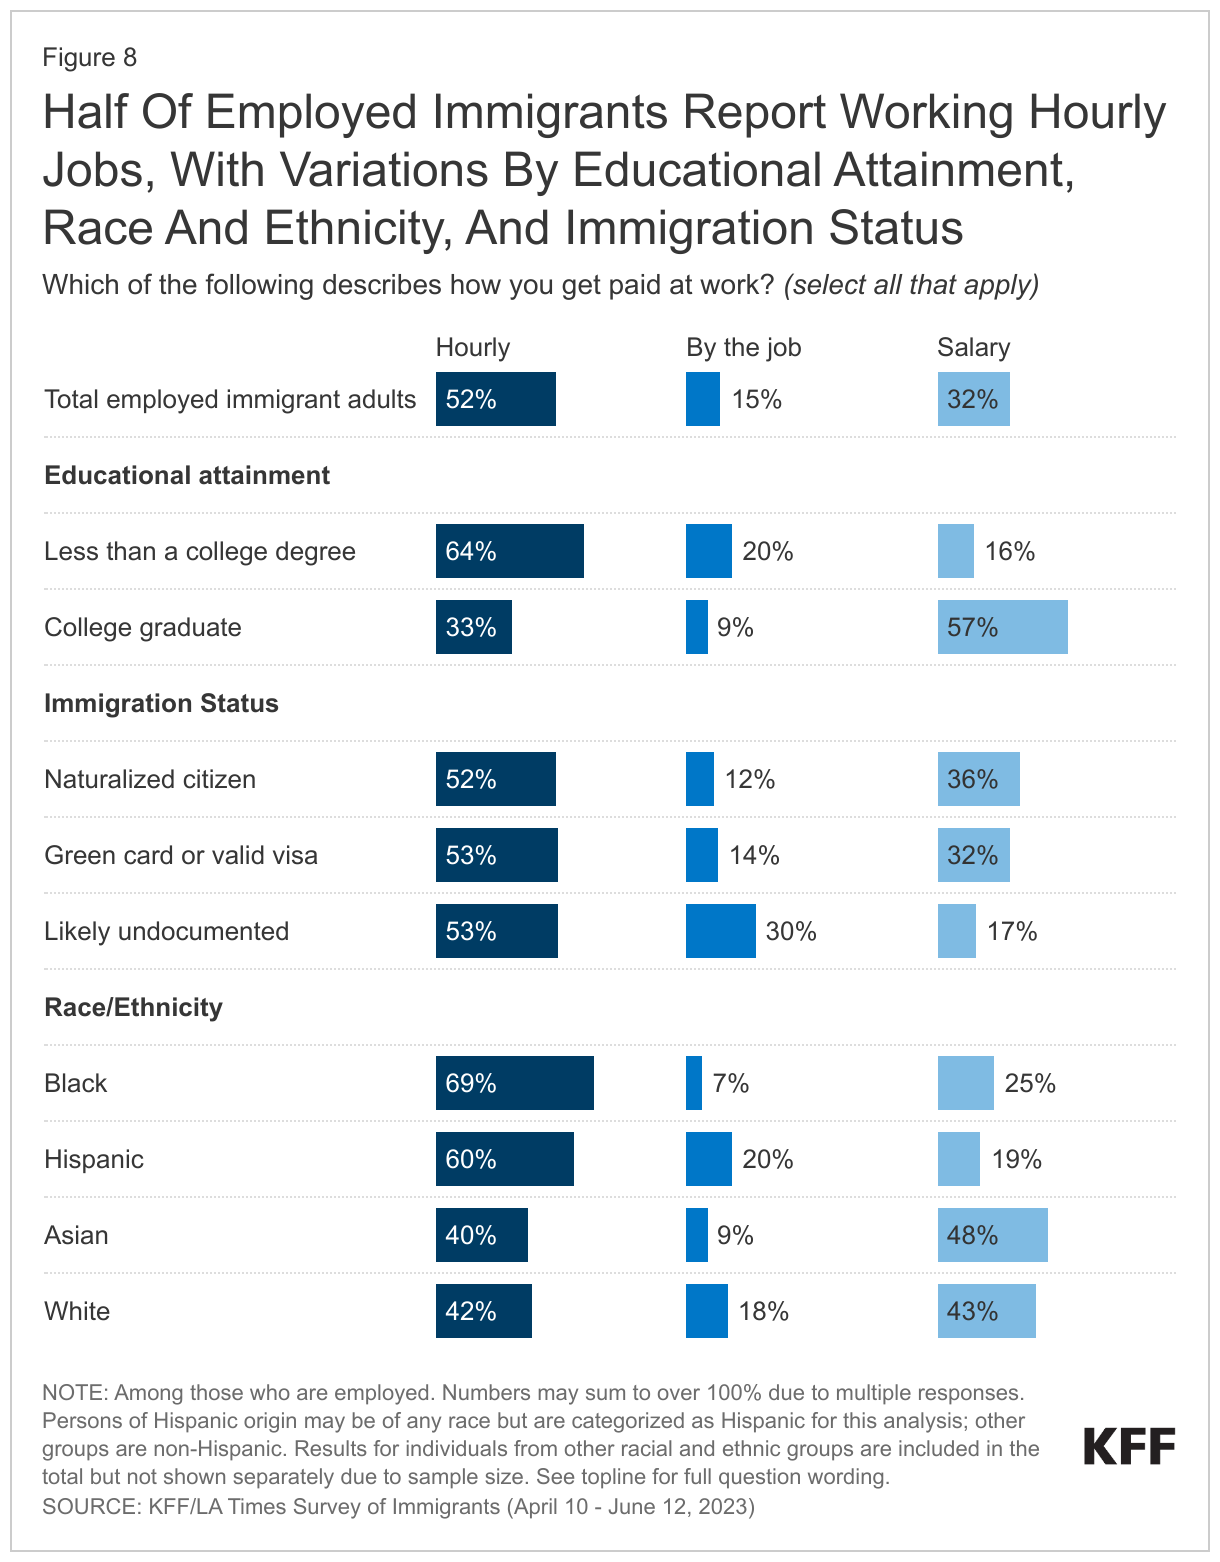
Although most immigrant adults are working, many are employed in lower income jobs and industries that are less likely to offer employer-sponsored insurance, contributing to lower rates of private coverage. Among nonelderly immigrant adults (18-64 years) employed for pay, half (50%) report having employer-sponsored coverage through themselves or a family member. The rate of employer-sponsored coverage is higher among salaried employees (74%) compared with four in ten (43%) of those who are paid hourly and just one in five (18%) who are paid by the job. Reflecting these differences, just 6% of salaried nonelderly immigrant workers say they are uninsured compared with 20% of those who are paid hourly and 38% who are paid by the job.
Although Medicaid coverage helps fill some of the gap in private coverage for immigrant adults, many noncitizen immigrants are subject to eligibility restrictions for federally funded health coverage programs. In general, lawfully present immigrants must have a “qualified” immigration status to be eligible for Medicaid or the Children’s Health Insurance Program (CHIP), and many must wait five years after obtaining qualified status before they may enroll. States can eliminate the five-year waiting period for children and pregnant people. Lawfully present immigrants can purchase ACA Marketplace coverage without a waiting period. Lawfully present immigrants also can qualify for Medicare if they have sufficient work history or if they are lawful permanent residents and have resided in the U.S. for five years immediately prior to enrolling in Medicare, although those without sufficient work history must pay premiums to enroll in Part A. Undocumented immigrants are not eligible to enroll in any federally funded coverage. A small number of states have extended health coverage to some low-income immigrants regardless of immigration status using state-only funds. Even when eligible for coverage, immigrants may face challenges to enrolling due to language barriers or immigration-related fears.
Reflecting more limited access to coverage, half of likely undocumented immigrant adults (50%) and nearly one in five lawfully present immigrant adults (18%) report being uninsured compared with 6% of naturalized citizens (Figure 3). Moreover, roughly one in four (24%) lower income immigrant adults reports being uninsured compared to just 5% of those with annual incomes of $90,000 or more. Having LEP also is associated with a higher uninsured rate, with one in five (21%) immigrant adults with LEP saying they are uninsured compared with one in ten immigrant adults who are English proficient. In addition to including larger shares of noncitizen immigrants, people with LEP may face linguistic barriers to enrolling in coverage when they are eligible.
Hispanic immigrant adults are more than three times as likely as White immigrant adults to be uninsured (Figure 3). About one in four (26%) Hispanic immigrant adults report being uninsured compared with roughly one in ten of Black immigrant adults (10%) and White immigrant adults (8%), and just 4% of Asian immigrant adults. While some of these differences reflect lower incomes and higher rates of noncitizens among Hispanic immigrant adults, Hispanic immigrant adults in higher income households (14%) or who are naturalized citizens (10%) are still more likely than their White higher income (3%) and naturalized citizen (3%) counterparts to be uninsured, suggesting they face additional barriers to coverage, such as language or cultural barriers. There is no significant difference in uninsured rates by gender among immigrant adults, which may reflect immigrant eligibility restrictions for Medicaid. Among the overall U.S. adult nonelderly population, women have a lower uninsured rate than men due to higher Medicaid coverage rates.
Uninsured rates among immigrants also vary based on where they live, as immigrant adults in states that have expanded Medicaid to low-income adults and expanded coverage for immigrants are less likely to report being uninsured. States vary in the coverage they provide for their low-income population overall as well as immigrants specifically. Those that have adopted the ACA Medicaid expansion have broader eligibility for low-income adults overall, but noncitizen immigrants still face eligibility restrictions for this coverage. Some states have expanded coverage for immigrants by eliminating the five-year waiting period in Medicaid and/or CHIP for children and/or pregnant people and/or extending coverage to some immigrants regardless of immigration status through fully state-funded programs. Immigrants in states that have taken up more of these coverage options are less likely to be uninsured. For example, the uninsured rate for immigrant adults in California is less than one-third what it is in Texas (8% vs. 27%) (Figure 4). California has adopted the ACA Medicaid expansion to low-income adults, expanded coverage for recent lawfully present immigrant children and pregnant people in Medicaid and CHIP, and began providing fully state-funded coverage regardless of immigration status to children in 2016 and to some adults in 2019. In contrast, in Texas, Medicaid eligibility for adults remains limited to very low-income parents (16% of the federal poverty level or about $4,000 per year for a family of three), and the state does not provide any state-funded coverage for immigrants. When looking at coverage patterns across states overall, immigrant adults who live in states that provide more expansive coverage for immigrants, including Medicaid expansion and immigrant coverage expansions, are half as likely to be uninsured compared with those living in states with less expansive policies (11% vs. 22%) (see Box 3).
Box 3: Classifying States by Coverage Policies
Health coverage was analyzed by expansiveness of state coverage for immigrants based on state of residence reported by survey respondents. Expansiveness of coverage was classified as follows:
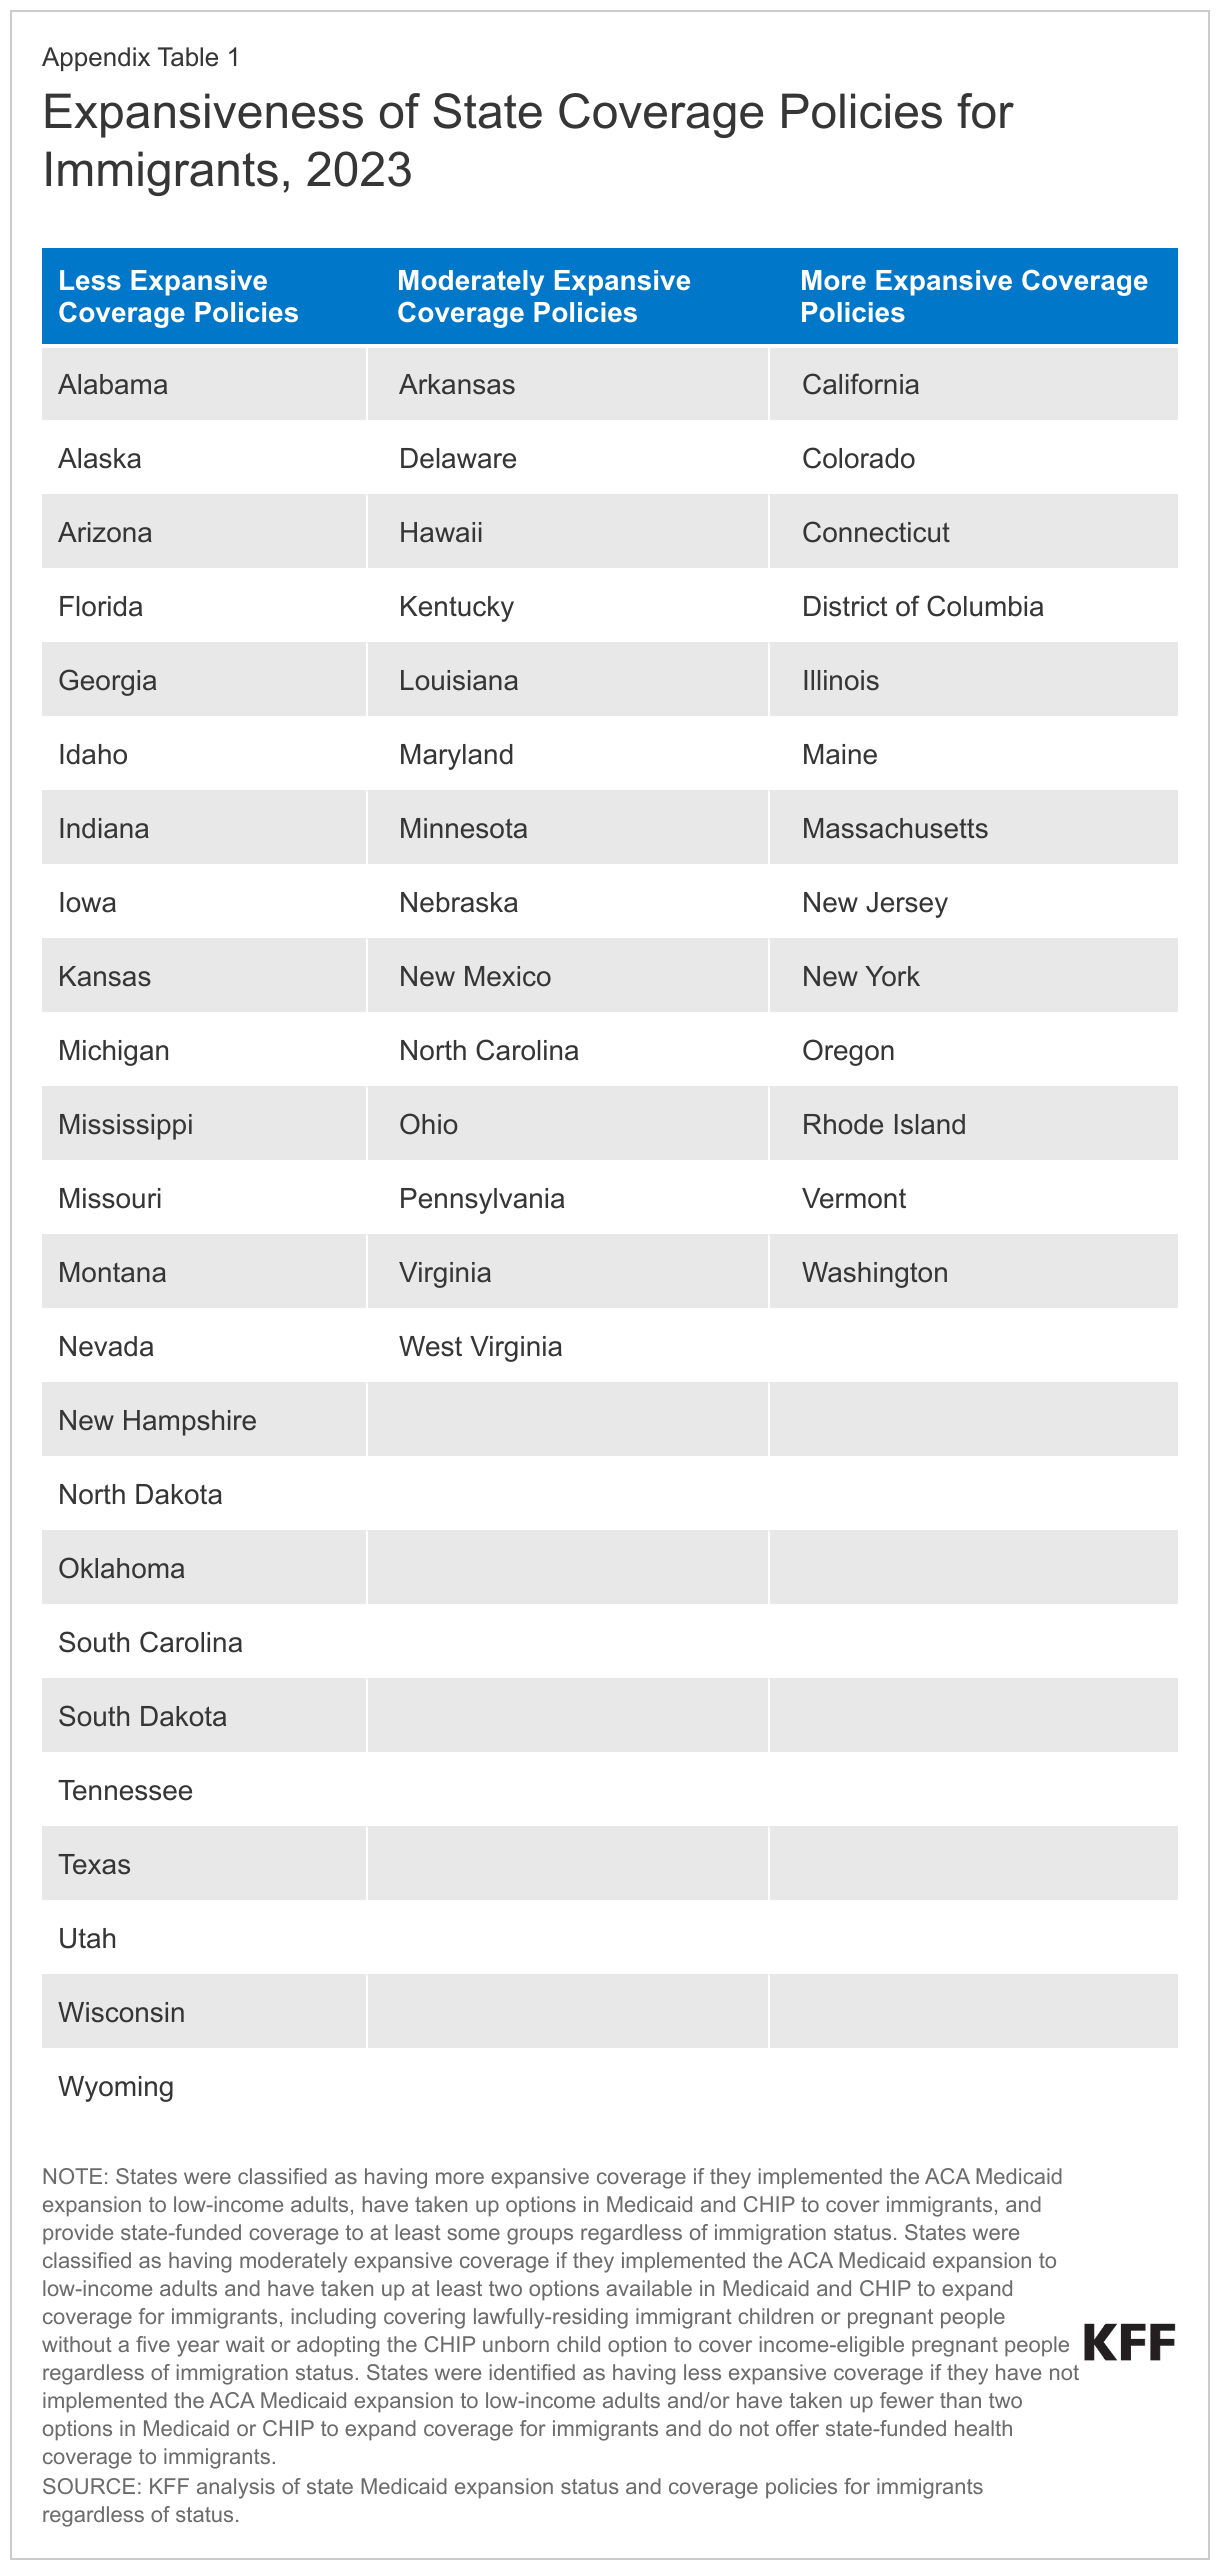
More expansive coverage: States were classified as having more expansive coverage if they have implemented the ACA Medicaid expansion to low-income adults, have taken up options in Medicaid and CHIP to cover immigrants, and provide state-funded coverage to at least some groups (such as children) regardless of immigration status. Even when state-funded coverage is limited to children, the availability of this coverage may reduce fears among immigrant adults about applying for coverage for themselves if they are eligible for other options.
Moderately expansive coverage: States were classified as having moderately expansive coverage if they implemented the ACA Medicaid expansion to low-income adults and have taken up at least two options available in Medicaid and CHIP to expand coverage for immigrants, including covering lawfully-residing immigrant children or pregnant people without a five year wait or adopting the CHIP unborn child option to cover income-eligible pregnant people regardless of immigration status.
Less expansive coverage: States were identified as having less expansive coverage if they have not implemented the ACA Medicaid expansion to low-income adults and/or have taken up fewer than two options in Medicaid or CHIP to expand coverage for immigrants and do not offer state-funded health coverage to immigrants.
See Appendix Table 1 for state groupings by these categories.
Immigrants’ Use of Health Care in the U.S.
A large majority (84%) of immigrant adults report they have received or tried to receive medical care in the U.S., and most say they saw a health care provider in the past year (77%) (Figure 5). Roughly eight in ten of U.S.-born adults also say they had a health care visit in the past year.6 For many immigrants, seeking and obtaining health care in the U.S. requires learning how to navigate a new health care system that differs from the system in their country of birth, which can present challenges. Aside from financial and logistical challenges to accessing care (discussed below), prior experiences in their country of birth and/or cultural differences may also affect use of and experiences with care in the U.S.
In Ther Own Words: Perspectives on the U.S. Health Care System Compared to their Country of Birth from Focus Group Participants
In focus groups, some participants pointed to both positive and negative distinctions between the U.S. health care system and health care in their countries of birth.
“I can tell you that in Mexico, if you don’t have money for the so-called deposit, they basically let you die. Not here, though. They take care of you here.” – 37-year-old Mexican immigrant man in Texas
“…What makes me feel more comfortable in the U.S. is that once I go to the hospital, they do not care if I have a lot of money or not… Everything else is for later. They focus on saving me first.” – 59-year-old Vietnamese immigrant woman in California
“I have insurance here, and I went and got a checkup in Mexico…because I have my trusted doctor there. I really thought about doing it here, but they take so long. Here, they send you to a specialist about three months out…there, they did everything all in the same day.” – 42-year-old Mexican immigrant woman in Texas
Consistent with patterns among the overall uninsured population, uninsured immigrant adults are less likely than those with coverage to say they have sought or obtained health care in the U.S. Reflecting the important role health coverage plays in facilitating access to care, across coverage types, roughly nine in ten (88%) of immigrant adults with coverage report seeking or using care in the U.S. compared with about seven in ten (68%) uninsured immigrant adults (Figure 5). About half (48%) of uninsured immigrant adults say they had a health care visit in the past year compared with about eight in ten of insured immigrant adults (82%). Among U.S.-born adults, those who are uninsured also are much less likely than those with coverage to have a had health care visit in the past year.7 Although majorities across groups say they have sought or received care in the U.S., the shares of Black and Hispanic immigrant adults saying this are lower than for White immigrants. While this pattern, in part, reflects differences in coverage, these racial differences persist among those who are insured. Noncitizen immigrants, particularly those who are likely undocumented, and those with LEP also are less likely to say they have sought or received health care compared with naturalized citizens and those who speak English very well. In addition to higher uninsured rates among these groups, immigration-related fears and linguistic barriers may also reduce use of care.
Consistent with experiences among the overall adult population8 , most (79%) immigrant adults say they have a usual source of care other than a hospital emergency room, but the share is much lower among uninsured immigrant adults (56%) (Figure 6). Among insured immigrant adults, those with Medicare coverage are the most likely to report having a usual source of care (88%).
About seven in ten immigrant adults say they go to a private doctor’s office (43%) or community health clinic (CHC) (30%) when they are sick or need health advice, but nearly one in five (17%) say they do not have a place other than an emergency room (Figure 6). CHCs are a national network of safety-net primary care providers serving low-income and medically underserved communities, including communities of color, uninsured people, immigrants, and those in rural areas. Research shows that CHCs offer linguistically and culturally competent care to underserved racial and ethnic groups as well as people with LEP and that these services can positively impact patient satisfaction. Reflecting this role, uninsured immigrant adults (37%) and those covered by Medicaid (44%) are more likely to say a CHC is their usual source of care than those with private (26%) or Medicare (24%) coverage. CHCs also serve as a usual source of care for large shares of immigrant adults who are Hispanic (41%), are likely undocumented (42%), have LEP (39%), and are lower income (37%). Even among those with health coverage, Hispanic immigrants and those with LEP are more likely to say a CHC is their usual source of care than their White and Asian counterparts and those who are English proficient.
Immigrants’ Experiences Receiving Health Care in the U.S.
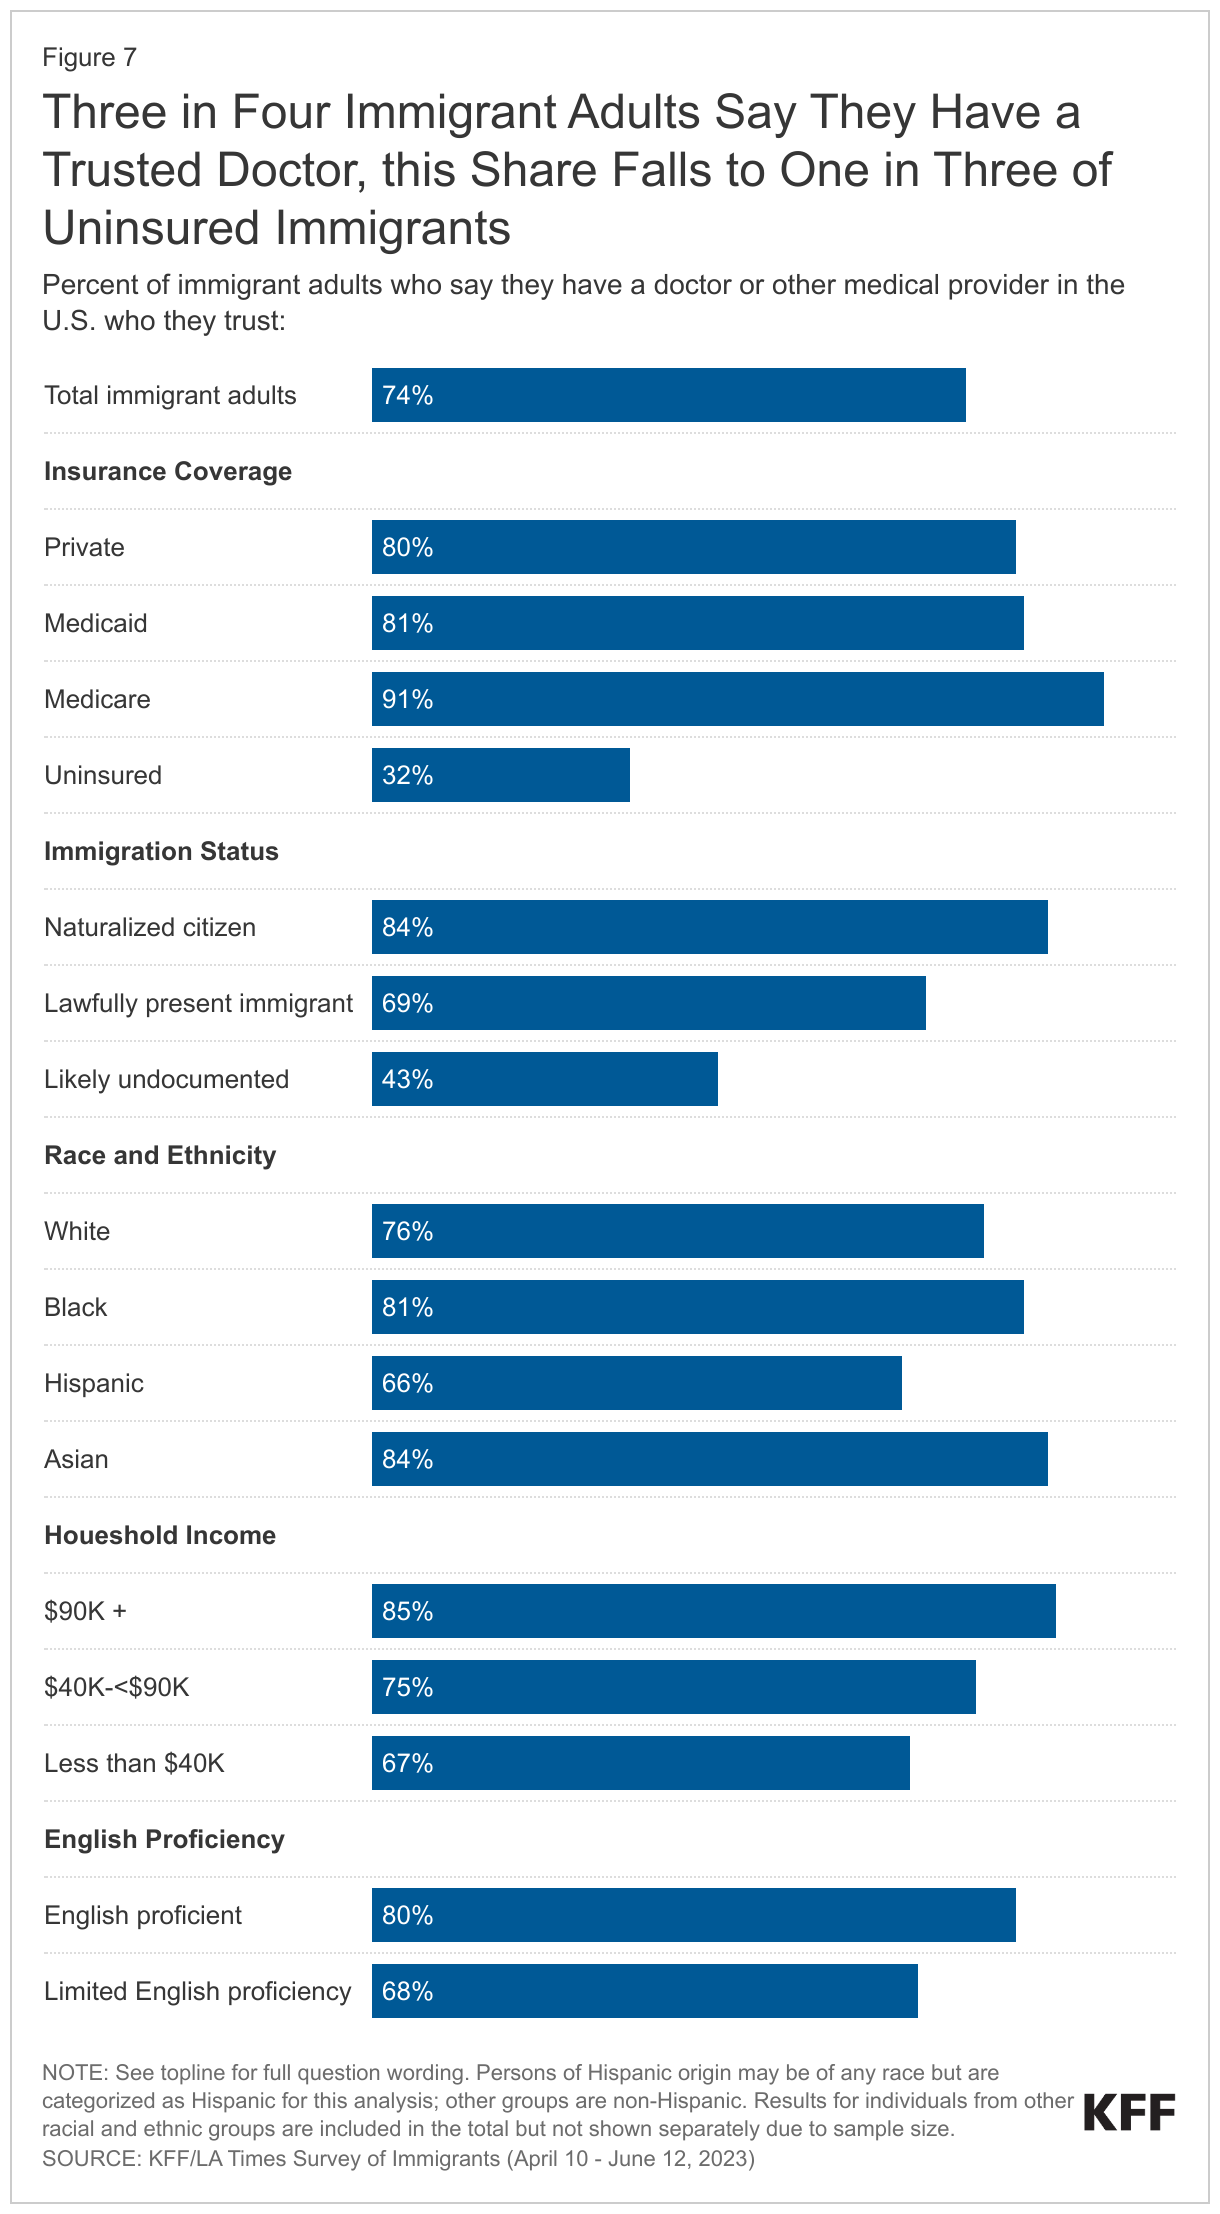
Overall, the majority of immigrant adults say they have a trusted doctor or health care provider in the U.S., but this share falls to 32% among those who are uninsured (Figure 7). About three-quarters (74%) of immigrant adults report having a doctor or other medical provider in the U.S. who they trust to answer questions about their health. This is lower than the share of U.S.-born adults (83%) who say they have a trusted health care provider.9 The share of immigrant adults saying they have a trusted health care provider falls to about one in three (32%) among uninsured immigrant adults compared to about eight in ten of those who are insured. Across coverage types, most insured immigrant adults say they have a trusted doctor, with the share highest among those with Medicare coverage (91%). Given that noncitizen (particularly likely undocumented), Hispanic and lower income immigrants as well as immigrants with LEP have higher uninsured rates, these groups also are less likely to report having a trusted doctor than naturalized citizens, other racial and ethnic groups, those with higher incomes, and those that speak English very well. However, even among adults with private coverage, immigrants with LEP (75%) remain less likely than their English proficient peers (83%) to say they have a trusted doctor.
Among those who received care in the U.S., one in four (25%) immigrant adults reports being treated unfairly by a health care provider based on one of several factors asked about, with Black and Hispanic immigrant adults reporting higher rates of unfair treatment (Figure 8). Overall, 25% of immigrant adults who have received care in the U.S. say they have been treated differently or unfairly by a doctor or other health care provider because of their insurance status or ability to pay (16%); accent or ability to speak English (15%); and/or their race, ethnicity, or skin color (13%). Black immigrant adults are about twice as likely as White immigrant adults to report being treated unfairly for at least one of these reasons (38% vs. 18%), and the share is also high among Hispanic (28%) immigrant adults. Black, Asian, and Hispanic immigrant adults are all more likely than their White counterparts to say they have been treated differently by a health care provider because of their race, ethnicity, or skin color as well as due to their accent or ability to speak English, with one in four (25%) of Black immigrants saying they were treated unfairly based on their race, ethnicity, or skin color. Black immigrant adults also are more likely than their White counterparts say they were treated differently due to their insurance status or ability to pay (23% vs. 14%). In addition, larger shares of immigrants who are uninsured (34%), lower income (31%), and who have LEP (28%) say they have been treated unfairly in at least one of these ways compared with their insured, higher income, and English proficient counterparts.
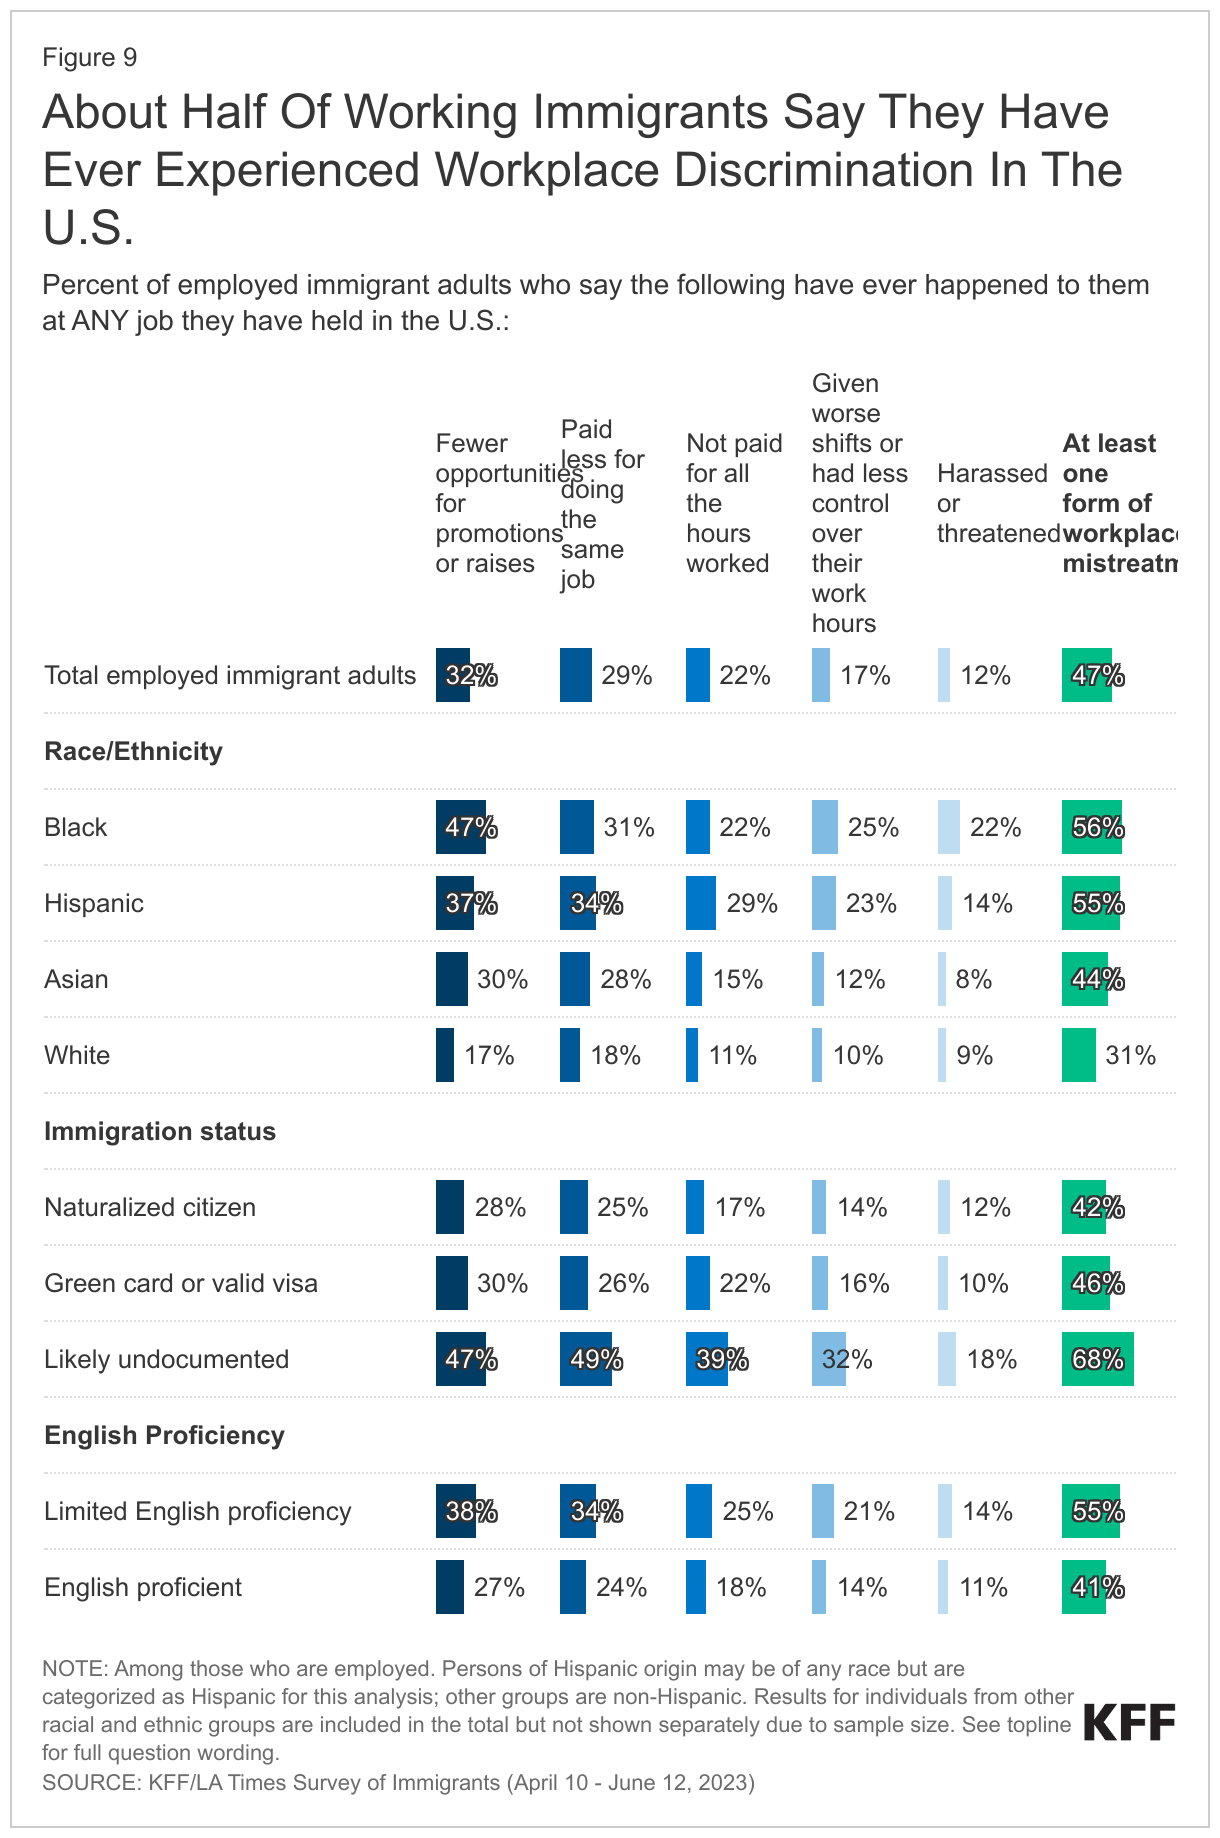
About three in ten (29%) immigrant adults who have sought care in the U.S. report one of several difficulties obtaining respectful and culturally competent care asked about on the survey (Figure 9) These challenges include a provider not taking the time to listen or ignoring concerns (17%); a health care provider not explaining things in a way they could understand (15%); being treated with disrespect by front office staff (12%); and, among those with LEP who completed the survey in a non-English language, interpretation services not available or provided in a timely manner (17%). The shares reporting any difficulties obtaining respectful and culturally competent care are particularly high among Black (34%), Hispanic (33%), uninsured (39%), and likely undocumented (34%) immigrant adults and those with household incomes below $90,000. In particular, about one in four Black (24%) and uninsured (24%) immigrant adults say a provider did not take the time to listen to or ignored their concerns, and about one in five likely undocumented immigrant adults (21%) and immigrant adults with LEP (18%) a say a health care provider did not explain things in a way they could understand. Women are also more likely than men to report experiencing at least one of these challenges (31% vs. 25%).
In Their Own Words: Negative Experiences Obtaining Health Care from Focus Group Participants
In focus groups, some participants described instances of differential and/or unfair treatment and challenges obtaining respectful and linguistically and culturally appropriate care.
“At the hospitals, out of ten interpreters, there would be only two or three who are good enough…. The rest…they really can’t translate. I know they are translating it wrong because I can tell from what the doctor says—it is just my English isn’t good enough to express my ideas.” – 66-year-old Vietnamese immigrant woman in Texas
“Sometimes the receptionist you know they are Hispanic and they keep asking and talking to you in English knowing that you don’t (speak English).” – 63-year-old Mexican immigrant woman in California
“We can’t communicate with [an] American doctor and sometimes if I speak in English maybe the American doctor doesn’t understand the same way.” – 31-year-old Chinese immigrant man in Illinois
Challenges Accessing Health Care Among Immigrants
One in five (20%) immigrant adults, rising to nearly four in ten (38%) among those who are uninsured, report they or someone they live with had problems paying for health care in the past 12 months (Figure 10). The shares reporting problems are also higher among lower income immigrant adults compared with their higher income counterparts. Black and Hispanic and noncitizen immigrant adults are more likely than their White and naturalized citizen peers to report problems paying for care, reflecting higher uninsured rates and lower incomes among these groups. Beyond cost, some also point to problems accessing care due to language barriers. Nearly one in three (31%) of immigrant adults with LEP say they have ever had difficulty getting health care services because of difficulty speaking or understanding English.
Overall, about one in five (22%) immigrant adults report they skipped or postponed health care for any reason in the past 12 months (Figure 11). The share skipping or going without care rises to 36% among uninsured immigrant adults. Lower income and likely undocumented immigrant adults also are more likely to say they skipped or went without care compared with their higher income and naturalized citizen or lawfully present immigrant counterparts. Overall, 9% of immigrant adults (representing 40% of those who skipped or postponed care) say that their health got worse as a result of skipping or postponing care. The share saying their health got worse rises to one in five (19%) of uninsured immigrant adults and 14% of likely undocumented immigrant adults.
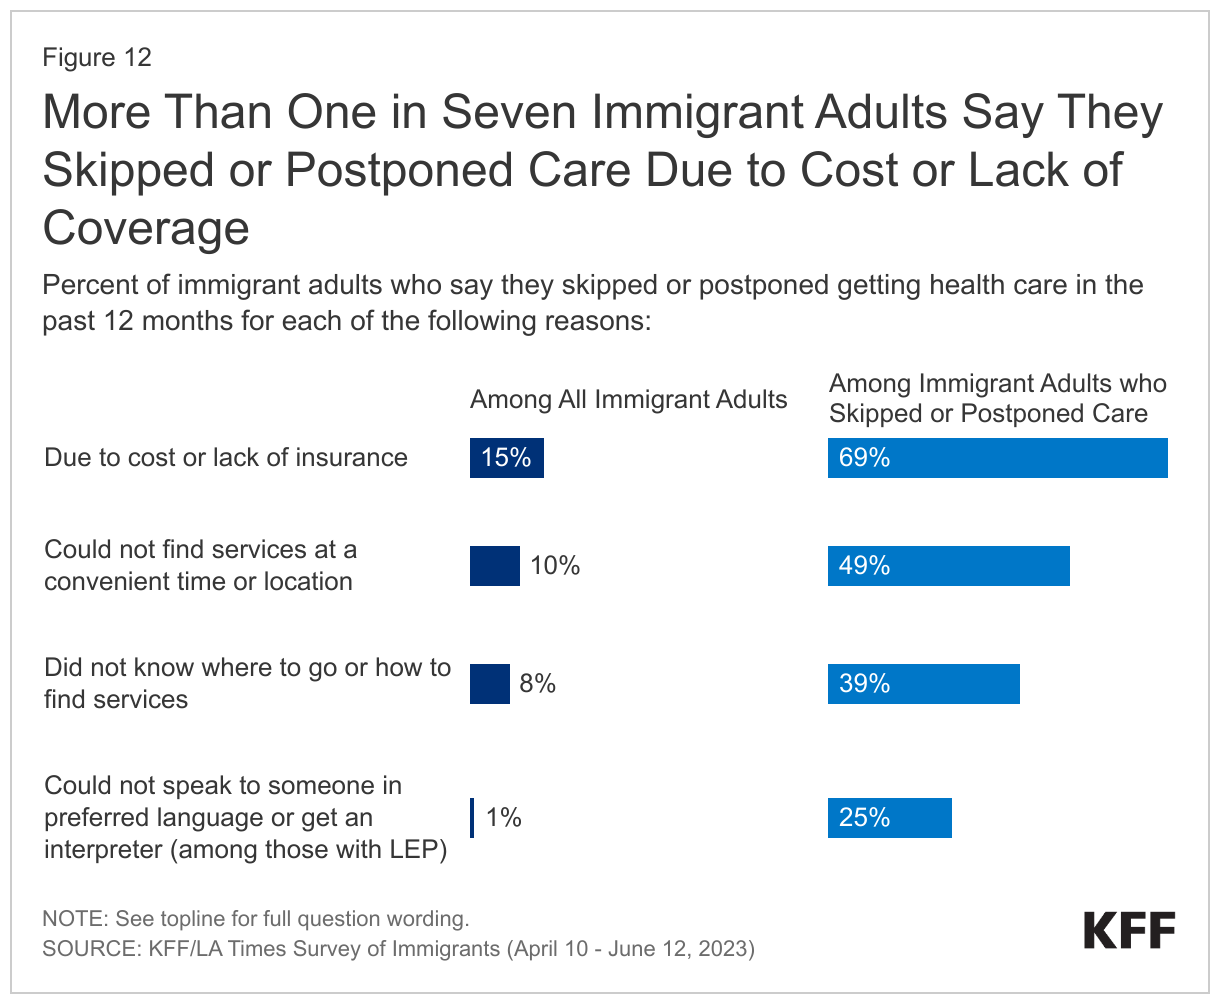
About seven in ten (69%) of immigrant adults who skipped or postponed care in the past year (15% of all immigrant adults) say they did so due to cost or lack of health coverage (Figure 12). Among uninsured immigrant adults, nearly all (95%) of those who skipped or postponed care (34% of all uninsured immigrant adults) cite this as a reason. About half (49%) of immigrant adults who skipped or postponed care (10% of all immigrant adults) say they did so because of services not being available at a convenient time or location, nearly four in ten (39%) (8% of all immigrant adults) say they didn’t know where to go or how to find the services they needed, and, among those with LEP who skipped or postponed care, a quarter (25%) (1% of all immigrant adults with LEP) cited not being able to speak to someone in their preferred language or get an interpreter.
Health Coverage and Care Among Children of Immigrants
Children in immigrant families are often U.S.-born citizens who are not subject to immigrant eligibility restrictions for federally funded health coverage and other assistance programs. Medicaid and CHIP also provide more expansive income eligibility limits for children compared to parents and other adults, contributing to lower uninsured rates for children overall. As such, children in immigrant families may have broader eligibility for coverage than their parents. However, even when their children are eligible for coverage, many immigrant parents may still face barriers to enrolling them in coverage, including lack of information or confusion about eligibility rules, immigration-related fears, and/or language barriers.
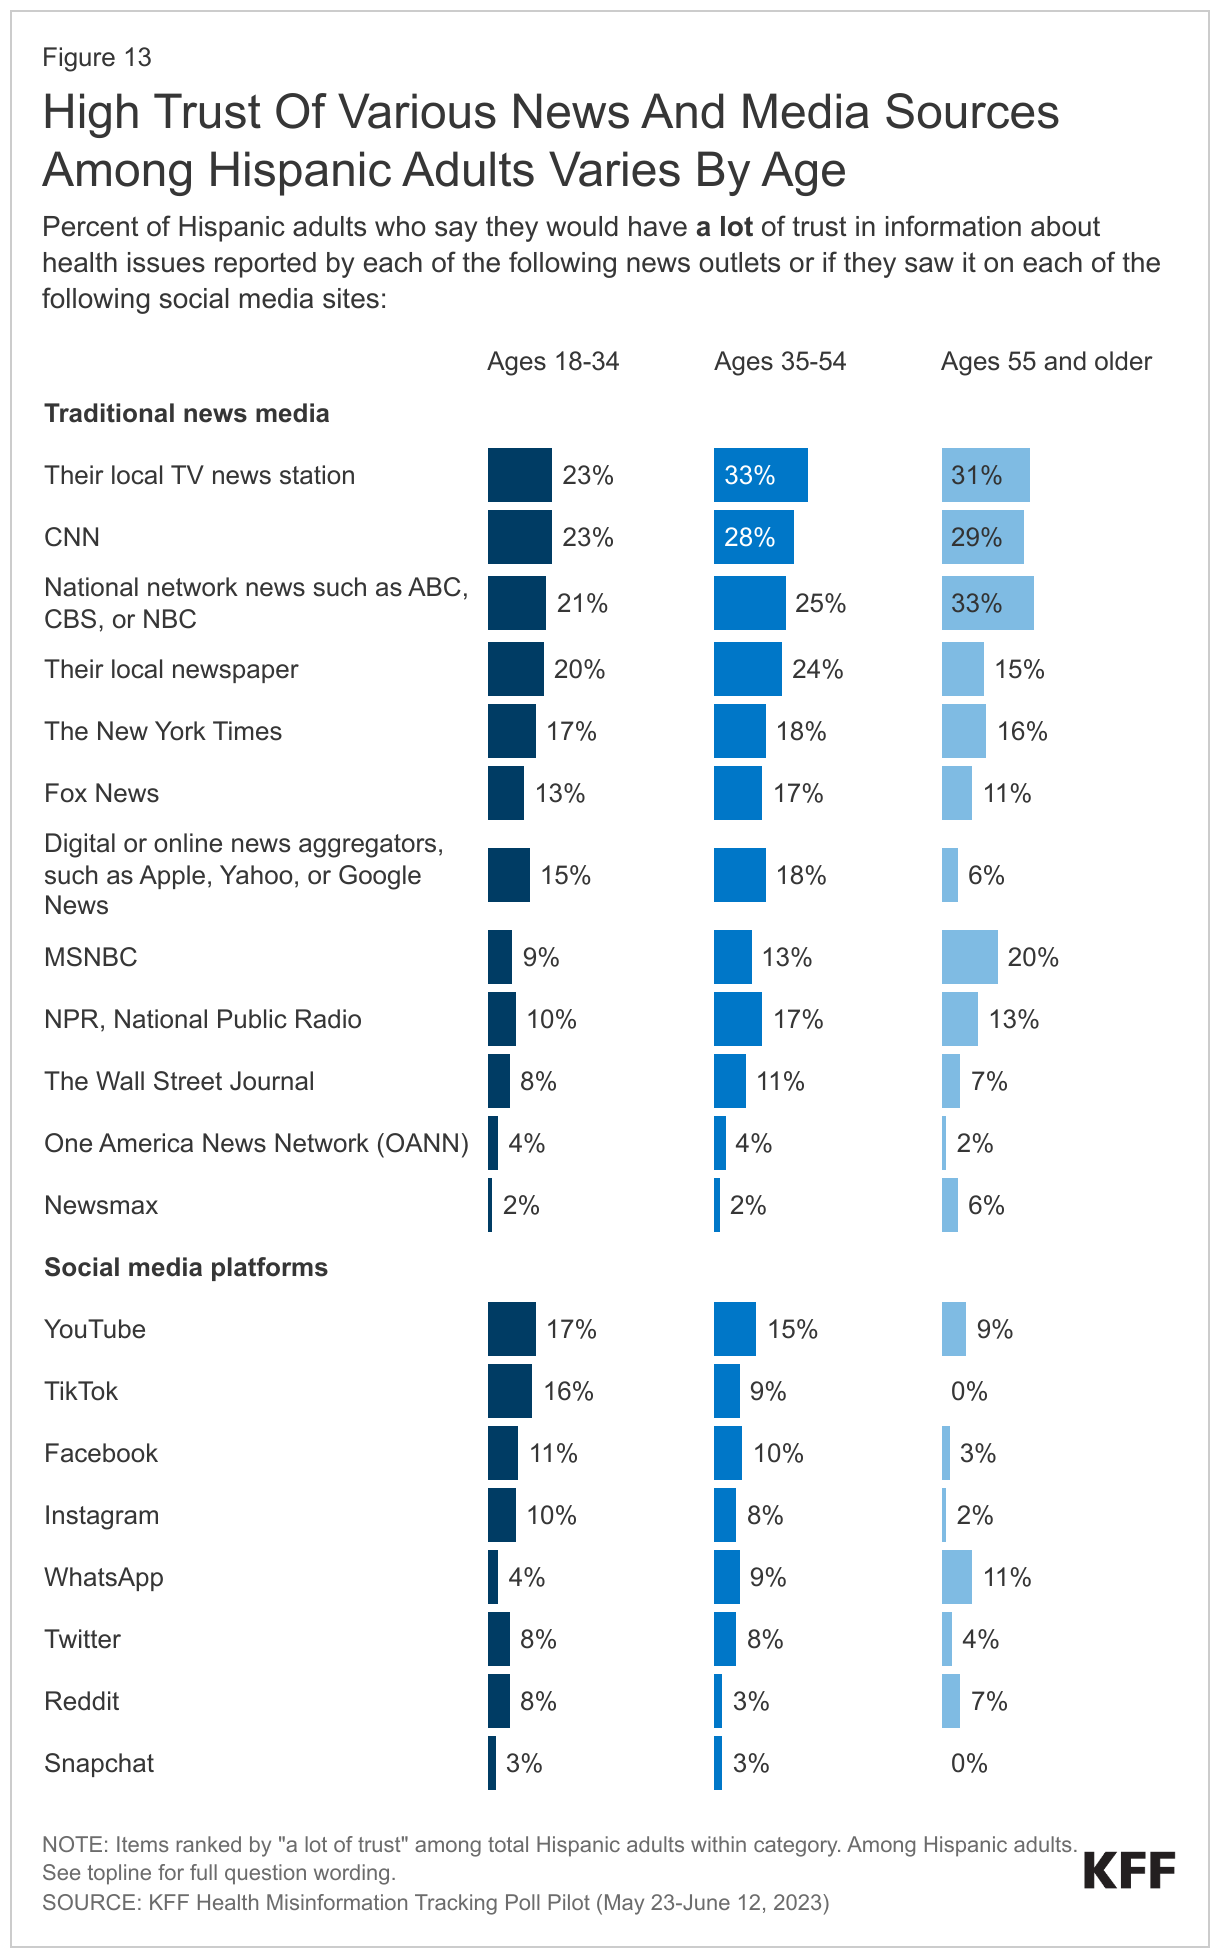
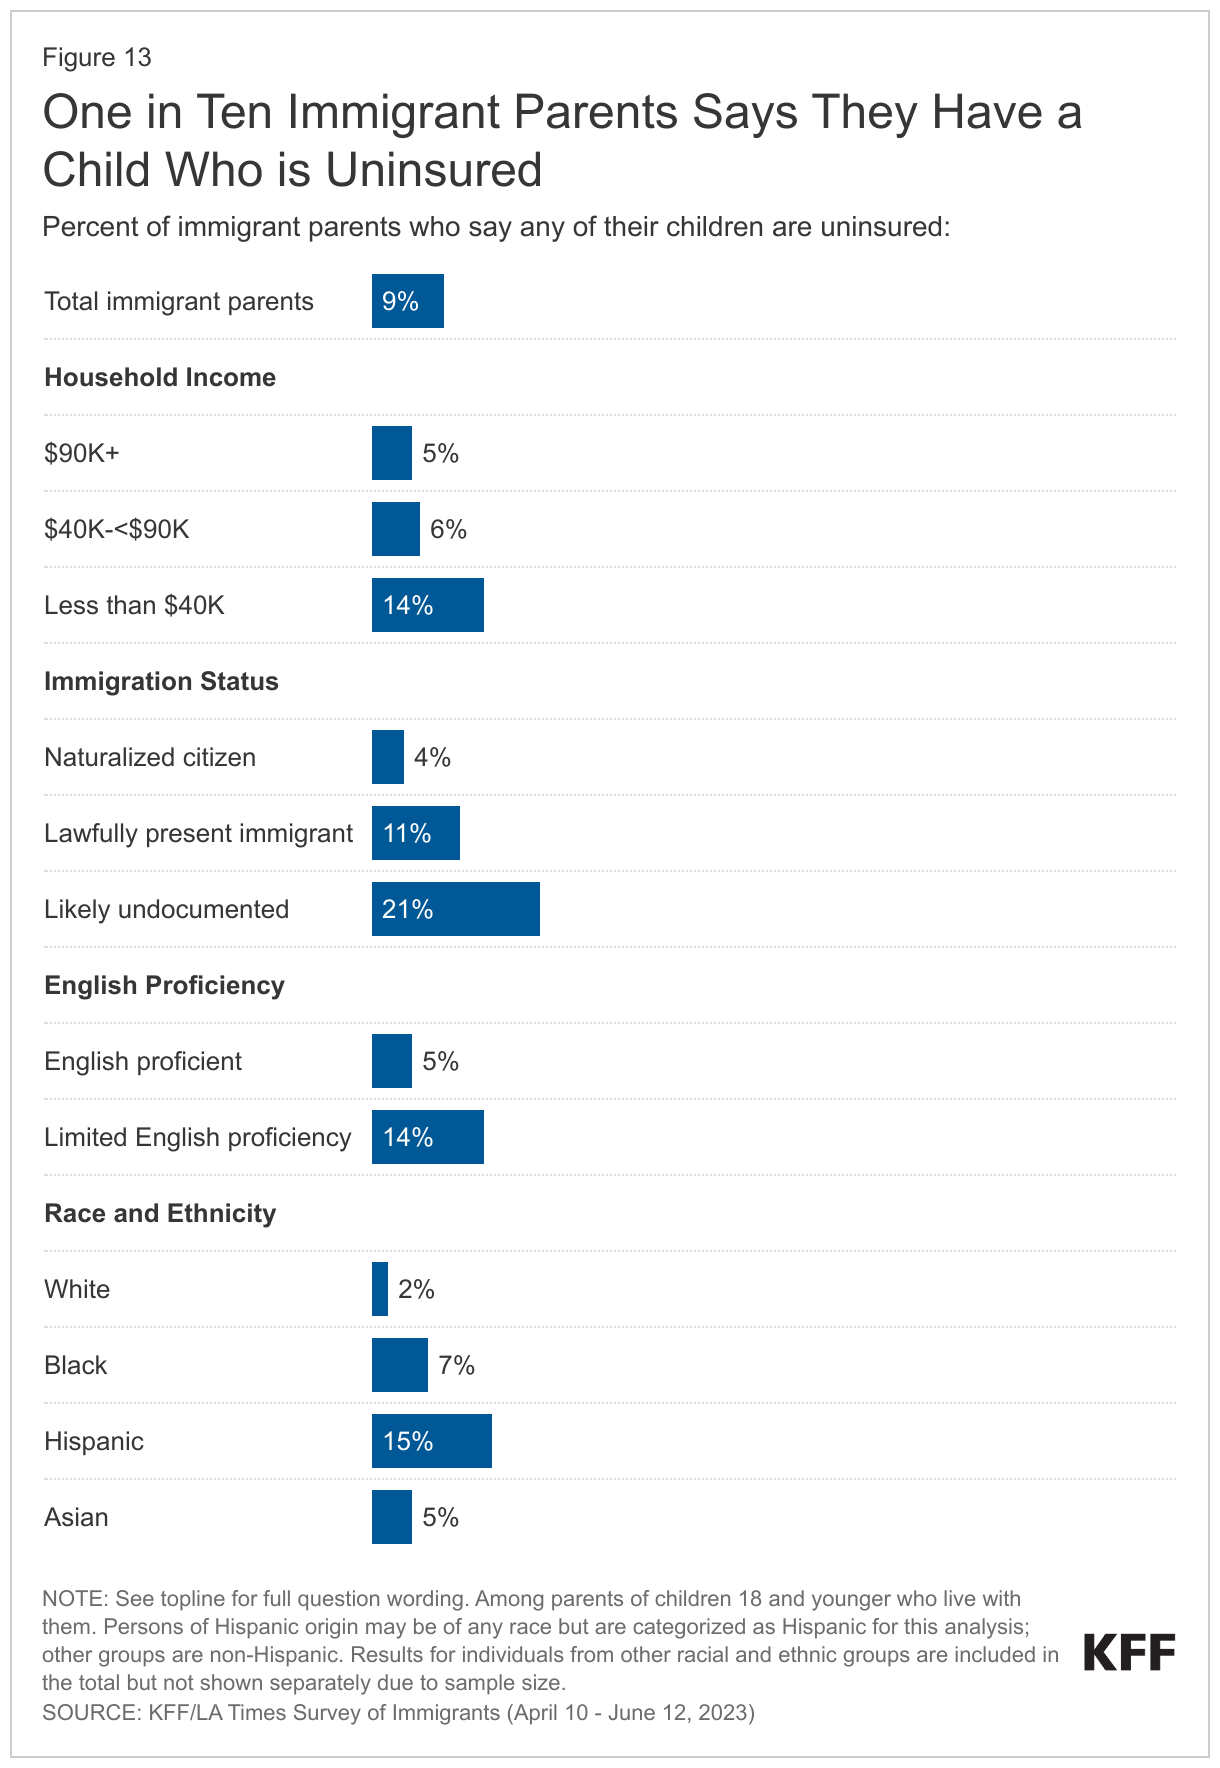
About one in ten (9%) of immigrant parents say at least one child in their household is uninsured (Figure 13). Immigrant parents who have lower incomes, are noncitizens, and have LEP are particularly likely to say at least one child is uninsured. Given that Hispanic immigrant parents are more likely to have lower income, be noncitizens, and have LEP, they are more likely than their White counterparts to report having at least one uninsured child (15% vs. 2%). Reflecting that Medicaid and CHIP offer comprehensive coverage to low-income children across states, about four in ten (41%) immigrant parents say they are lower income (household income of less than $40,000 a year), and many children of immigrants are U.S.-born citizens who are not subject to immigrant eligibility restrictions, nearly half (49%) of immigrant parents say they have at least one child covered by Medicaid or CHIP, including three in four (75%) who are lower income.
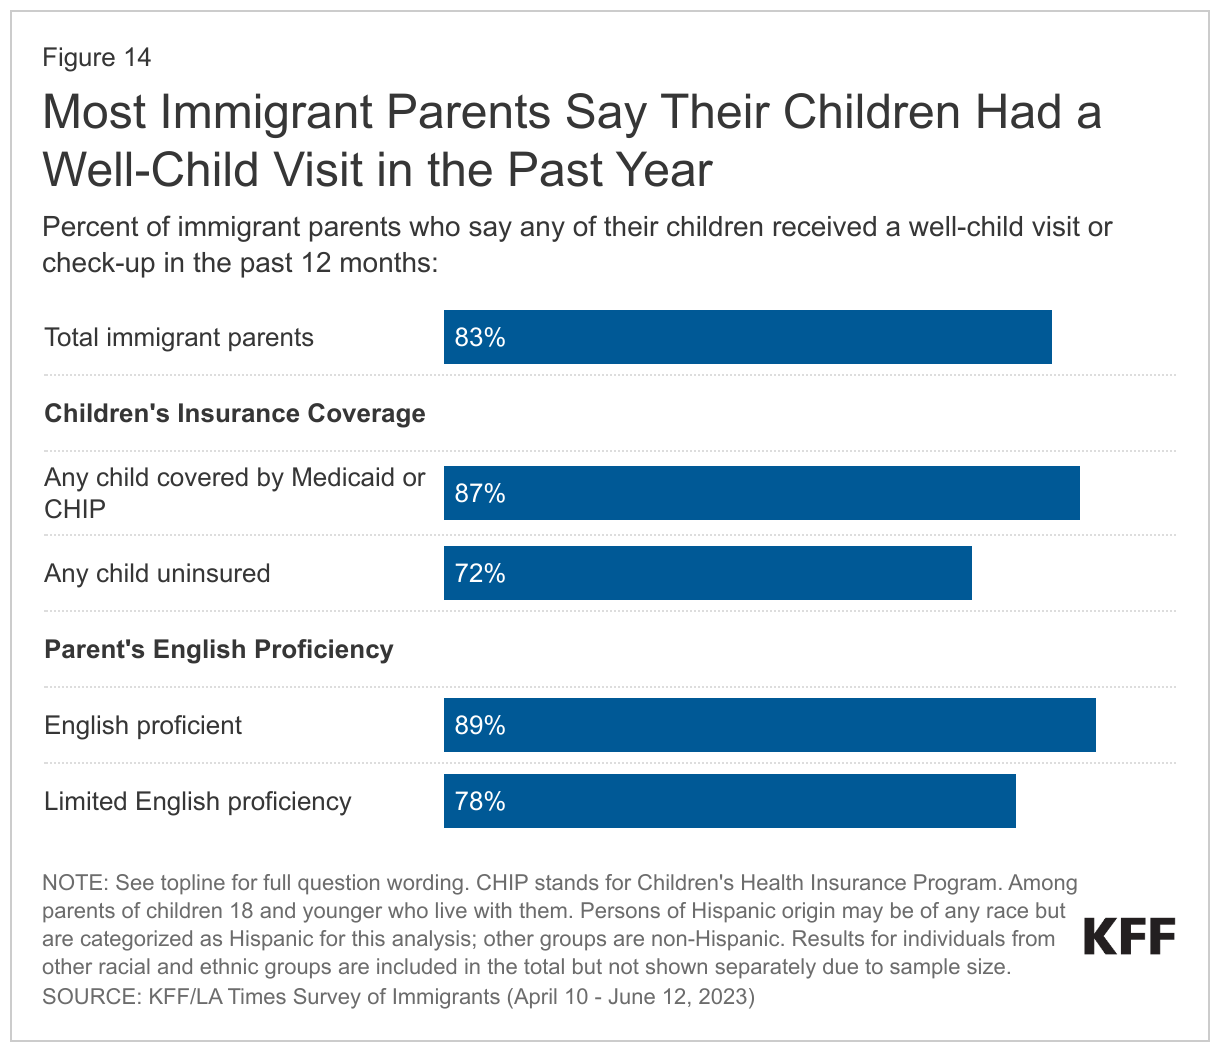
Most immigrant parents (83%) say at least one of their children has received a well-child visit in the past 12 months (Figure 14). There were no significant differences in the share of immigrant parents reporting their child had a check-up in the past year by race and ethnicity, income, or immigration status. However, reinforcing the importance of coverage for facilitating access to care, immigrant parents who have an uninsured child are less likely than those who have a child who is covered by Medicaid or CHIP to say their child received a well-visit in the past 12 months (72% vs. 87%). Beyond coverage, linguistic barriers can also impede access. Immigrant parents with LEP are less likely than those who are English proficient to say their children received a check-up in the past year (78% vs. 89%).
About one in ten immigrant parents say any of their children delayed or skipped health care (7%) or dental care (10%) in the past 12 months due to lack of insurance or cost. Immigrant parents who have an uninsured child are four times more likely than those who have a child covered by Medicaid or CHIP to report that any of their children delayed or skipped health care (32% vs. 8%) or dental care (41% vs. 9%) due to lack of coverage or cost.
Use of Public Assistance and Public Charge Fears
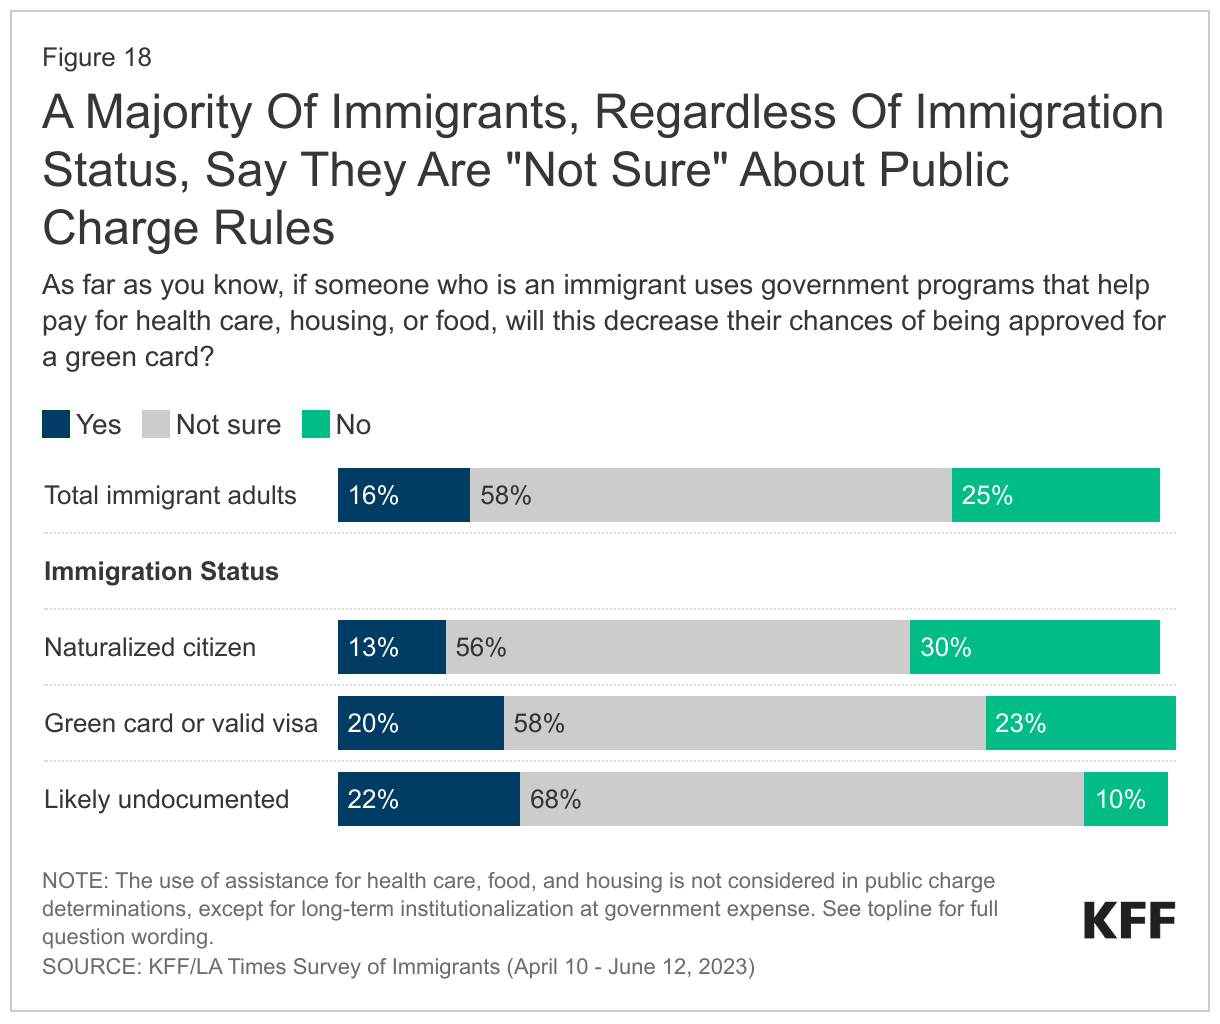
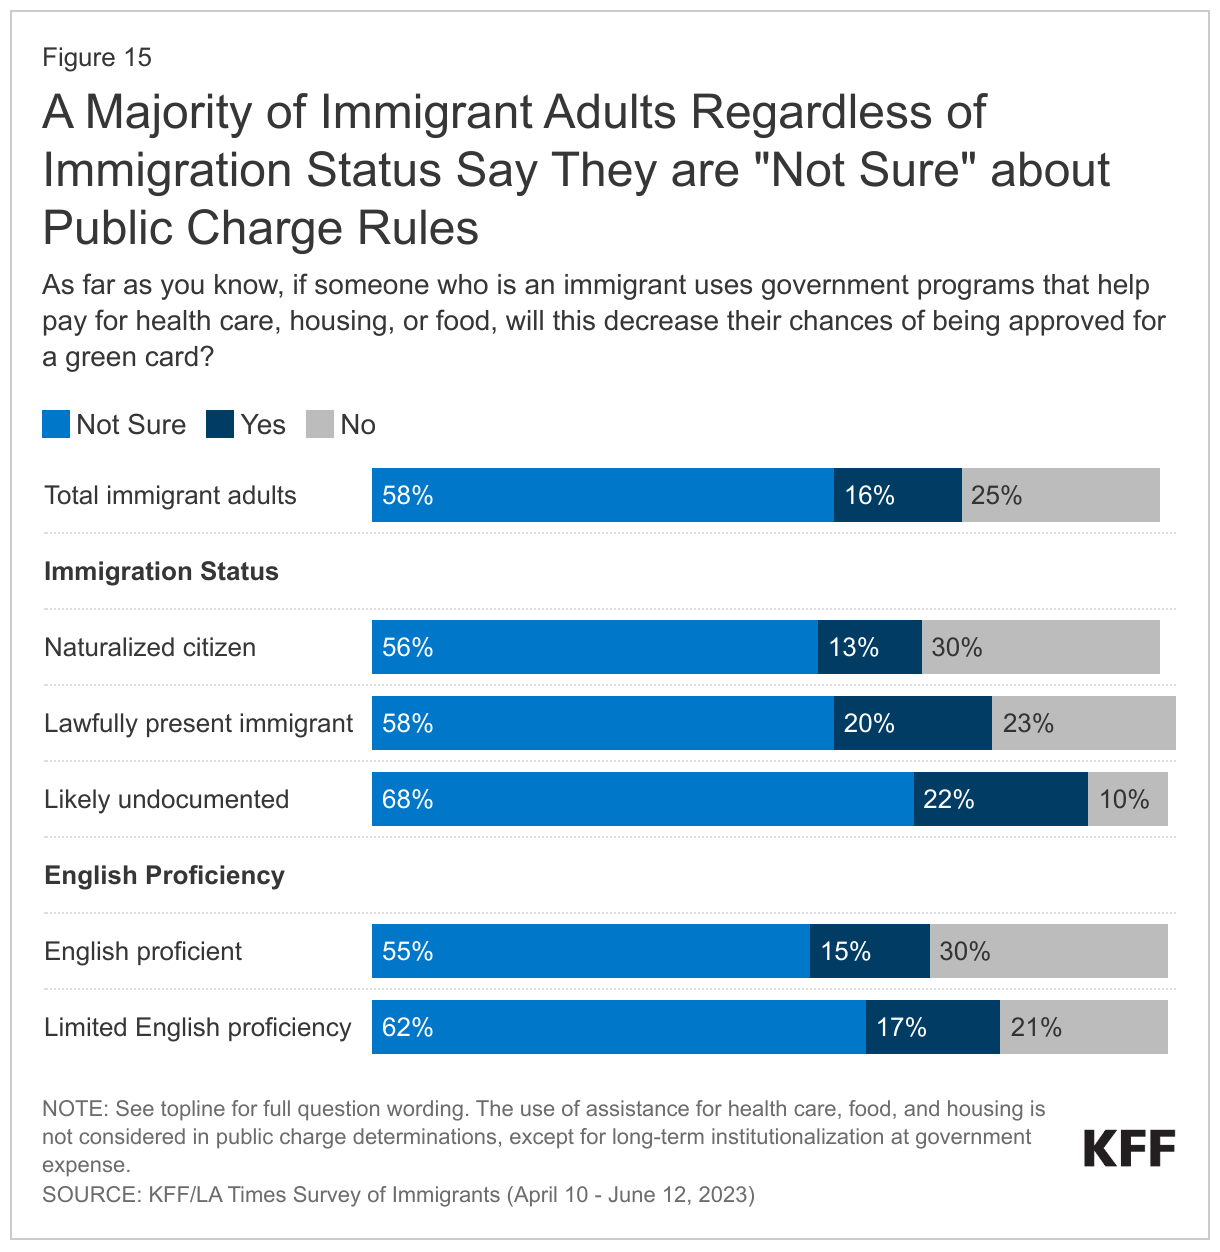
Food, housing, and health care assistance programs could reduce financial stress and facilitate access to health care among immigrant families, but many report confusion or concerns about using these programs. Under longstanding U.S. policy, federal officials can deny an individual entry to the U.S. or adjustment to lawful permanent status (a green card) if they determine the individual is a “public charge” based on their likelihood of becoming primarily dependent on the government for subsistence. In 2019, the Trump Administration made changes to public charge policy that newly considered the use of previously excluded noncash assistance programs for health care, food, and housing in public charge determinations. However, this policy was rescinded by the Biden Administration in 2021, meaning that the use of assistance for health care, food, and housing is not considered for public charge tests, except for long-term institutionalization at government expense. The Biden Administration also has reiterated and clarified that use of these programs by U.S.-born citizen children in immigrant families is not considered in public charge determinations. Although many noncitizen immigrants are ineligible for these programs, their children are often U.S.-born citizens who may be eligible. However, the survey reveals that many immigrants remain confused about public charge rules. About six in ten immigrants say they are “not sure” whether use of public programs that help pay for health care, housing or food can decrease one’s chances for green card approval and another 16% incorrectly believe this to be the case (Figure 15). Among immigrants who are likely undocumented, nine in ten are either unsure (68%) or incorrectly believe (22%) use of these types of programs will decrease chances for green card approval. A higher share of immigrant adults with LEP also report uncertainty or an incorrect understanding about these rules compared with those who are English proficient (79% vs. 70%).
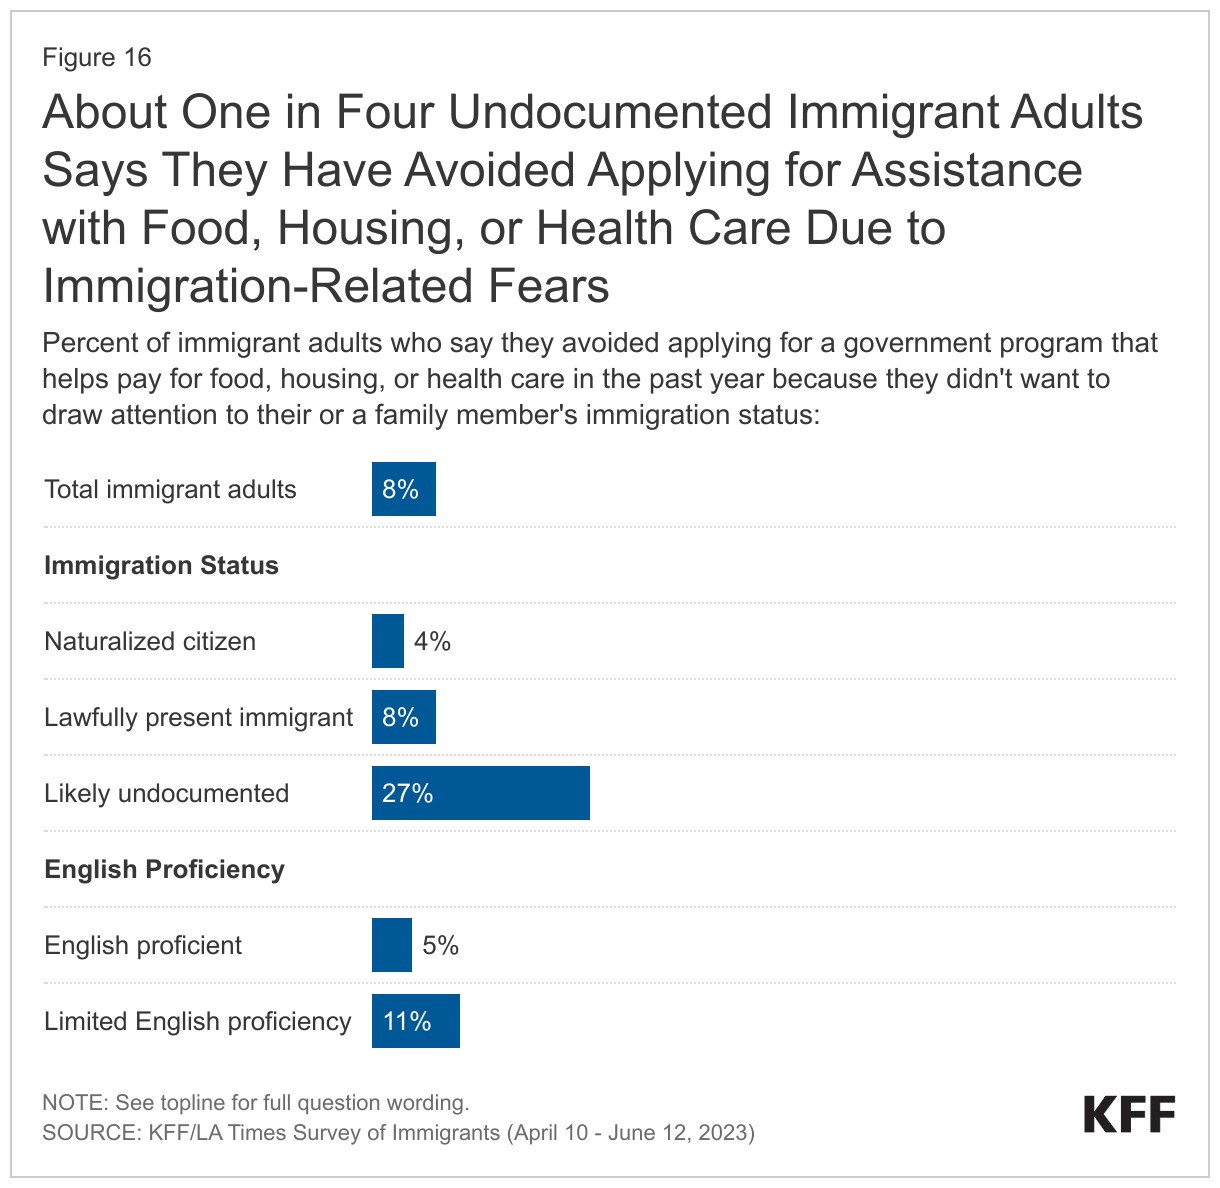
About one in four (27%) likely undocumented immigrants say they have avoided applying for government assistance with food, housing, or health care in the past year due to immigration-related fears (Figure 16). These fears are not limited to likely undocumented immigrants with roughly one in ten (8%) of lawfully present immigrants also saying they avoided applying for this assistance in the past year. Some also report linguistic barriers to accessing assistance. Among immigrant adults with LEP, a quarter (25%) say they had difficulty applying for government help with food, housing, or health coverage because of difficulty speaking or understanding English, and this share rises to 31% among lower income immigrant adults with LEP.
In Their Own Words: Confusion and Misinformation About Public Charge From Focus Group Participants
Participants in focus groups, especially those who are Hispanic, described confusion and misinformation about public charge rules, with several incorrectly believing their children would be liable to pay back the government for the assistance they received.
“They told me that my kids were the ones that it hurt the most because they’d be charged for everything that they gave me. I don’t know if that’s true, but to avoid that, I never asked for any help at all.” – 57-year-old Guatemalan immigrant woman in Texas
“There’s a lot of people who say, ‘Don’t apply for Medi-Cal [Medicaid]. Don’t apply for food stamps, because at some point, when you go in to put in your application, they’ll disqualify you.’ …I haven’t gotten any assistance for that reason.’” – 32-year-old Mexican immigrant woman in California
“Like you just mentioned about the help, I don’t ask for it because I’m afraid that in the future, I’ll want to fix my papers or something because of a job or something, and I won’t be able to because I asked for help.” – 36-year-old immigrant Mexican woman in Texas
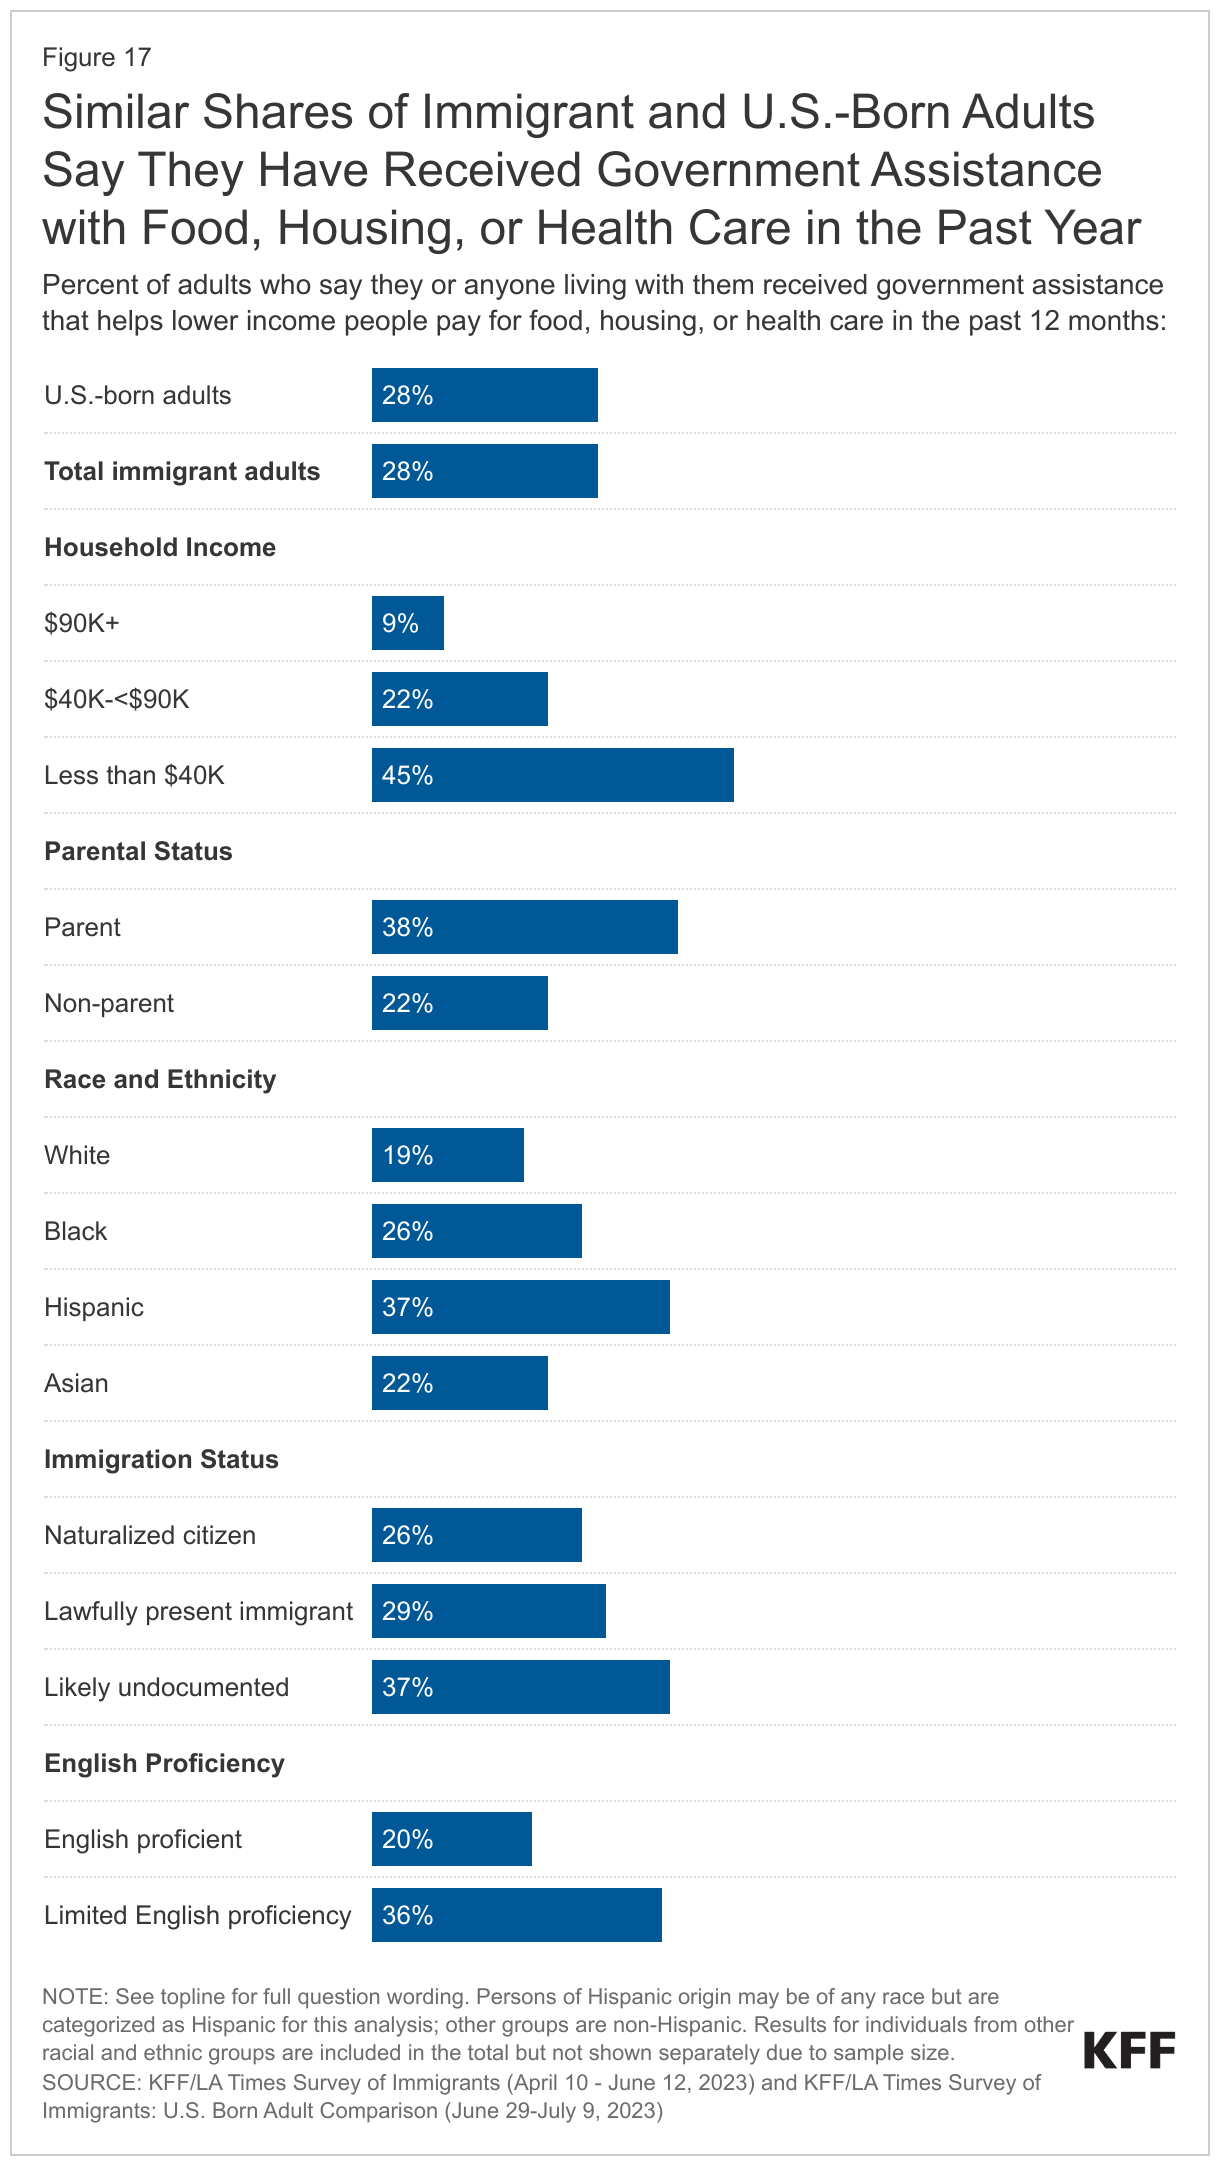
Reflecting this uncertainty and fear as well as language barriers and eligibility restrictions, immigrant adults are no more likely than U.S.-born adults to say they or someone living with them received government assistance with food, housing, or health care in the past year despite having lower household incomes and facing financial difficulties. Overall, 28% of immigrant adults said they or someone living with them received government assistance with food, housing, or health care in the past 12 months, the same share as U.S.-born adults (28%) (Figure 17).10 This share rises to 45% of lower income immigrant adults and is also high among immigrant adults who are parents (38%), are Hispanic (37%), are likely undocumented (37%), and have LEP (36%). In many cases, this assistance is likely going to citizen children in these families, given that lawfully present immigrants face eligibility restrictions for federally funded assistance programs and undocumented immigrants are prohibited from enrolling in them.
In Their Own Words: Reasons for Use of Assistance Programs from Focus Group Participants
Participants in focus groups described how when they receive assistance it is usually to help keep their children safe and healthy.
“I was talking to a social worker because she was offering it to us, and she was like, ‘You can take it. You have your kids. You’re not a burden on the government. Why? Because your kids are receiving it. If you apply for it, they’re not going to give it to you, but your kids are the ones they’re giving it to, not you,’ she said.”- 37-year-old Mexican immigrant woman in California
“I don’t apply for food stamps because I am still healthy, I can still work and earn…. But regarding healthcare, for example, my child’s health care, if there is a good insurance program for my child, I would still apply for it.” – 49-year-old Vietnamese immigrant woman in Texas
“I have a daughter who was born with different health issues… I have to because I don’t have the money to pay for the surgeries that my daughter has needed. I don’t have it, so it is either my daughter’s health or something else and I prefer her health.” – 40-year-old Venezuelan immigrant woman in Florida
Conclusion
Despite the majority of immigrant adults in the U.S. being employed and in good health and reporting generally improved situations as a result of moving to the country, many face barriers to accessing health coverage and health care. Access to health coverage and care varies significantly across immigrants, with some groups facing larger challenges, including those who are likely undocumented, who have lower incomes, who are Black and Hispanic, and who have LEP. The survey data also underscore the major role that coverage plays in access to health care, as, consistent with the overall uninsured population, uninsured immigrants report significantly larger barriers to accessing and utilizing care compared to their insured counterparts.
Half of likely undocumented immigrant adults and nearly one in five lawfully present immigrant adults say they are uninsured, reflecting lower rates of private coverage and eligibility restrictions on federally funded coverage for many noncitizen immigrants. The survey data show that availability of public coverage options for immigrants makes a difference in their coverage rates, with lower uninsured rates among immigrant adults in states that have adopted more expansive coverage policies. The survey data also point to other barriers to coverage, including immigration-related fears and language barriers. Coverage gaps among immigrants may grow as they may be at particular risk for coverage losses amid the unwinding of the Medicaid continuous enrollment provision established during the COVID-19 public health emergency due to potential language barriers and/or lack of information or confusion around eligibility rules.
The data further underscore the major role that coverage plays in immigrant adults’ ability to access health care. Consistent with trends in the overall population, compared to their insured counterparts, uninsured immigrant adults are less likely to receive health care, to have a regular source of care aside from an emergency room, and to have a trusted doctor. They also are more likely to report problems paying for health care in the past year, to say they skipped or postponed care, and to say that their health got worse as a result of going without or delaying care. Some groups of immigrant adults, including Hispanic and Black immigrants, lower income immigrants, likely undocumented immigrants, and immigrants with LEP also are more likely to experience these challenges, largely reflecting higher uninsured rates among these groups. However, in some cases, differences persist even among those with coverage.
Among immigrants who have used health care in the U.S., some report experiencing differential or unfair treatment and challenges accessing respectful and culturally competent care. A quarter of immigrant adults report being treated differently or unfairly by a health care provider, with particularly high shares of immigrant adults who are Black, Hispanic, likely undocumented, and have LEP reporting unfair treatment. About three in ten immigrant adults report one of several difficulties obtaining respectful and culturally competent care including a provider not taking the time to listen or ignoring concerns; a health care provider not explaining things in a way you could understand; being treated with disrespect by front office staff; and, among those with LEP, interpretation services not available or provided in a timely manner. The shares reporting any difficulties obtaining respectful and culturally competent care are particularly high among Black, Hispanic, uninsured, and likely undocumented immigrant adults and those with lower household incomes.
Given lower incomes among immigrant families and difficulties paying for basic needs such as monthly bills, food, housing, and health care assistance programs could reduce financial stress and facilitate access to care for them and their children. Although many noncitizen immigrants remain ineligible for these programs, their children are often U.S.-born citizens who may be eligible. However, the majority of immigrant adults across immigration statuses report uncertainty about how use of these programs may impact immigration status or incorrectly believe use may negatively affect the chances of getting a green card in this future. About a quarter of likely undocumented immigrants say they avoided applying for assistance for food, housing, or health in the past year due to immigration-related fears. Partly reflecting this fear as well as language barriers and eligibility restrictions, immigrant adults are no more likely than their U.S.-born counterparts to say they or someone living with them received government assistance with food, housing, or health care despite having lower incomes and facing financial challenges.