Key Takeaways
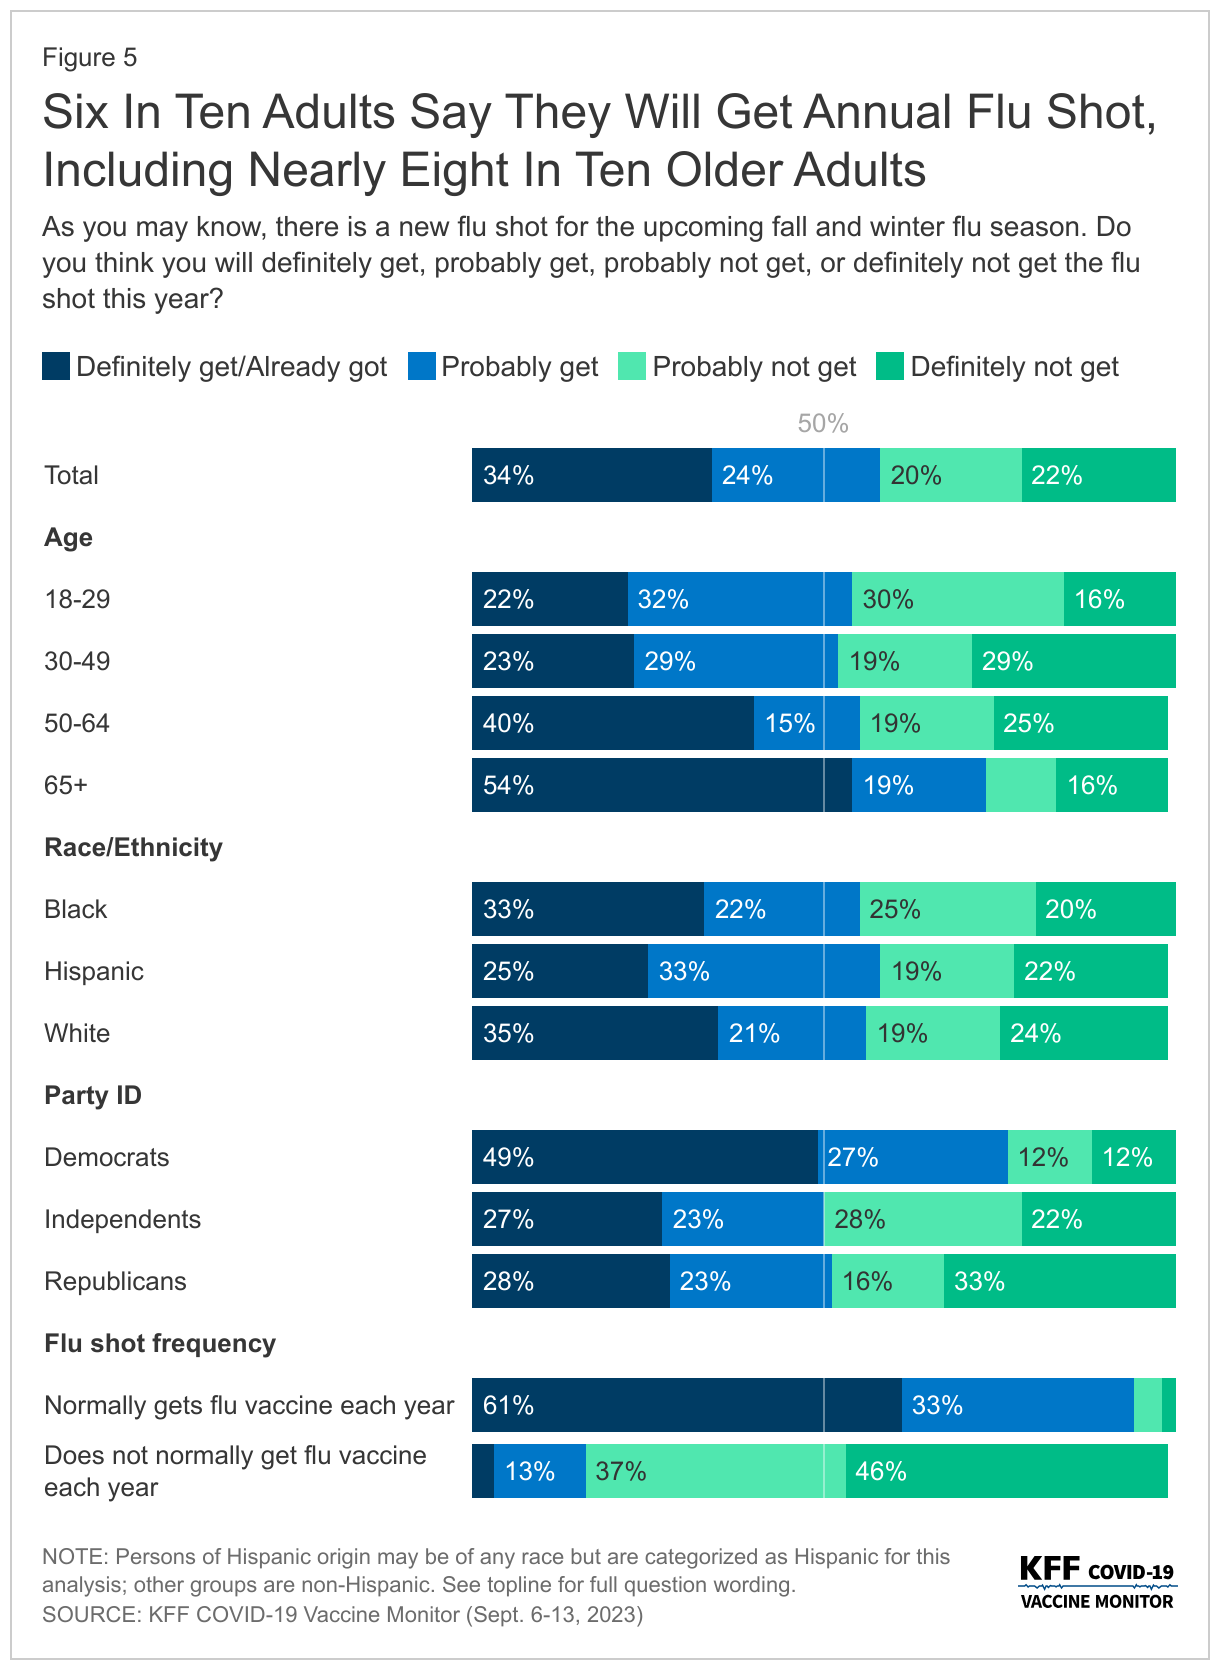
- The fall season has become synonymous with increased concerns over the spread of three respiratory viruses: COVID-19, the flu, and RSV. A “tripledemic,” the scenario in which all three of these viruses peak at the same time, could strain the country’s health care system and impact millions of people with, for some, life-threatening illnesses. Yet, there are vaccines available, including an updated COVID-19 vaccine and a new RSV vaccine, to help prevent people from getting seriously sick. In the latest COVID-19 Vaccine Monitor, a majority of adults (58%), including three-quarters of adults ages 65 and older, say they will get a flu shot this year including some who say they have already received it. In addition, 58% of adults 60 and older say they will either “definitely get” or “probably get” the new RSV vaccine recommended for their age group.
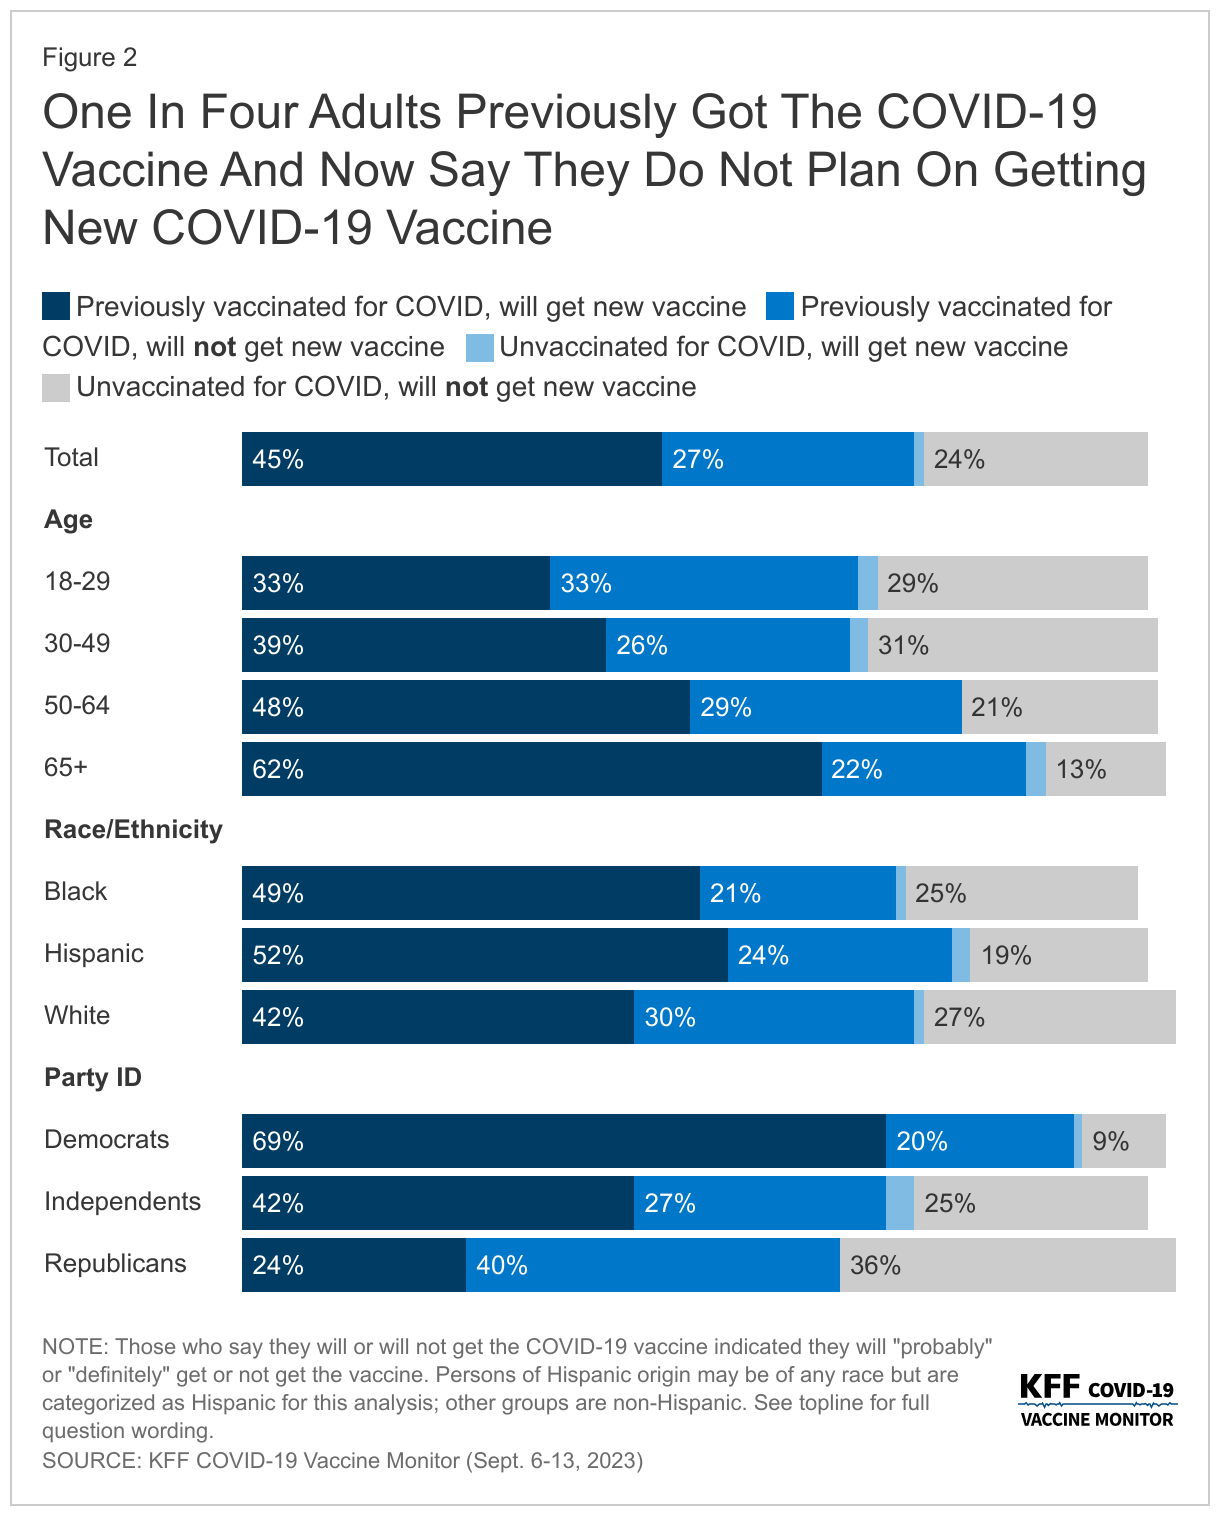
- Compared to the flu and RSV vaccines, a somewhat smaller share of adults (47%) say they plan to get the new COVID-19 vaccine, which was recommended by the CDC on September 12th while the poll was in the field. While most (61%) of those who were previously vaccinated for COVID-19 say they will get the new vaccine, almost four in ten (37%) of this group say they “probably” or “definitely” will not get the new vaccine. This means one quarter (27%) of all adults have previously received a COVID-19 vaccine and say they will not get the new vaccine. The vast majority of previously unvaccinated adults say they also will not get the latest COVID-19 vaccine, with just 5% of this group saying they may get the new vaccine. One in four (24%) of all adults have not received any previous COVID-19 vaccine and do not intend to get the newest vaccine available.
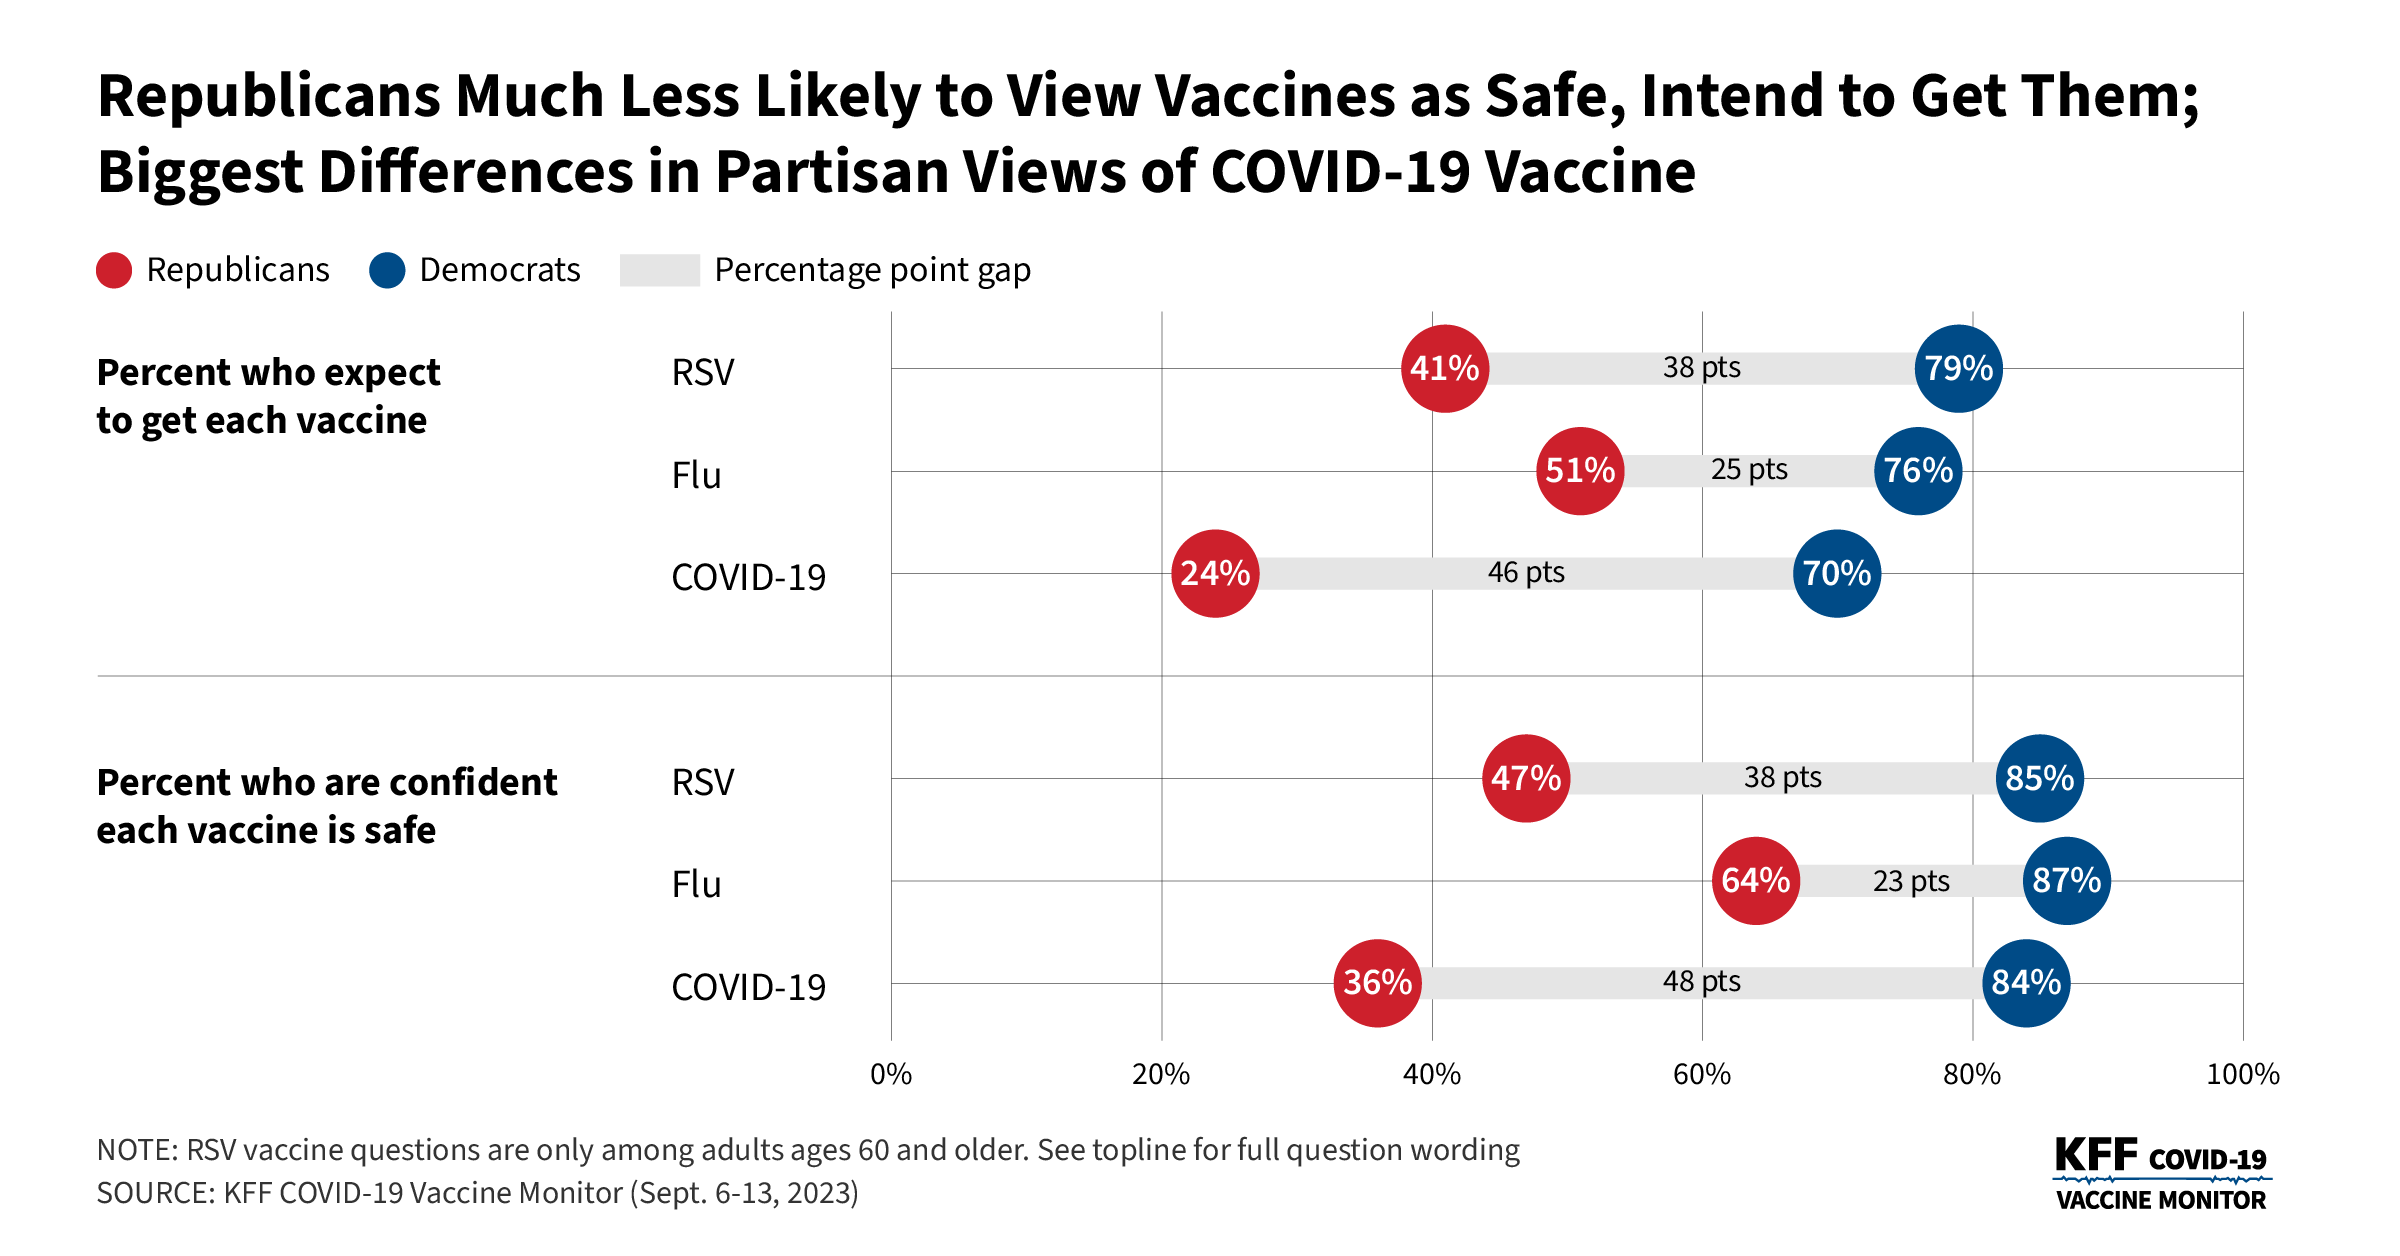
- Reflecting patterns seen throughout the COVID-19 pandemic, intended uptake is largely divided along party lines. Seven in ten Democrats say they will get the latest COVID-19 vaccine compared to about a quarter of Republicans. Confidence in safety of the new vaccine is also largely partisan. More than eight in ten Democrats (84%) say they are confident in the safety of the COVID-19 vaccine, compared to one in three (36%) Republicans. Overall views of the safety of the COVID-19 vaccine (57%) lag behind the other two vaccines (RSV, 65%; flu, 74%) – largely driven by the views of Republicans who are more confident in the safety of the other two vaccines.
- Majorities of groups who are most at risk for getting seriously sick from COVID-19 say they intend to get the latest vaccine available including two-thirds (64%) of adults ages 65 and older and most (56%) of those with a serious health condition. In addition, at least half of Hispanic adults (54%) and Black adults (51%) say they will get the COVID-19 vaccine compared to four in ten (42%) White adults.
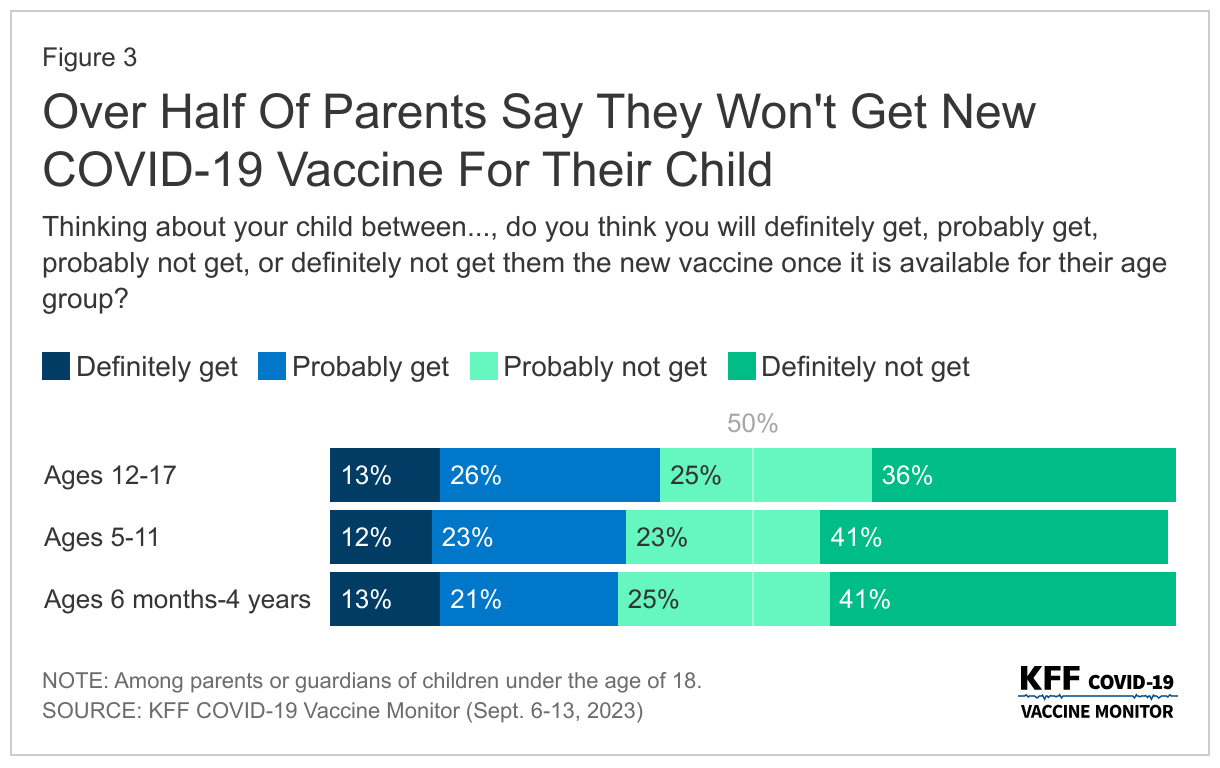
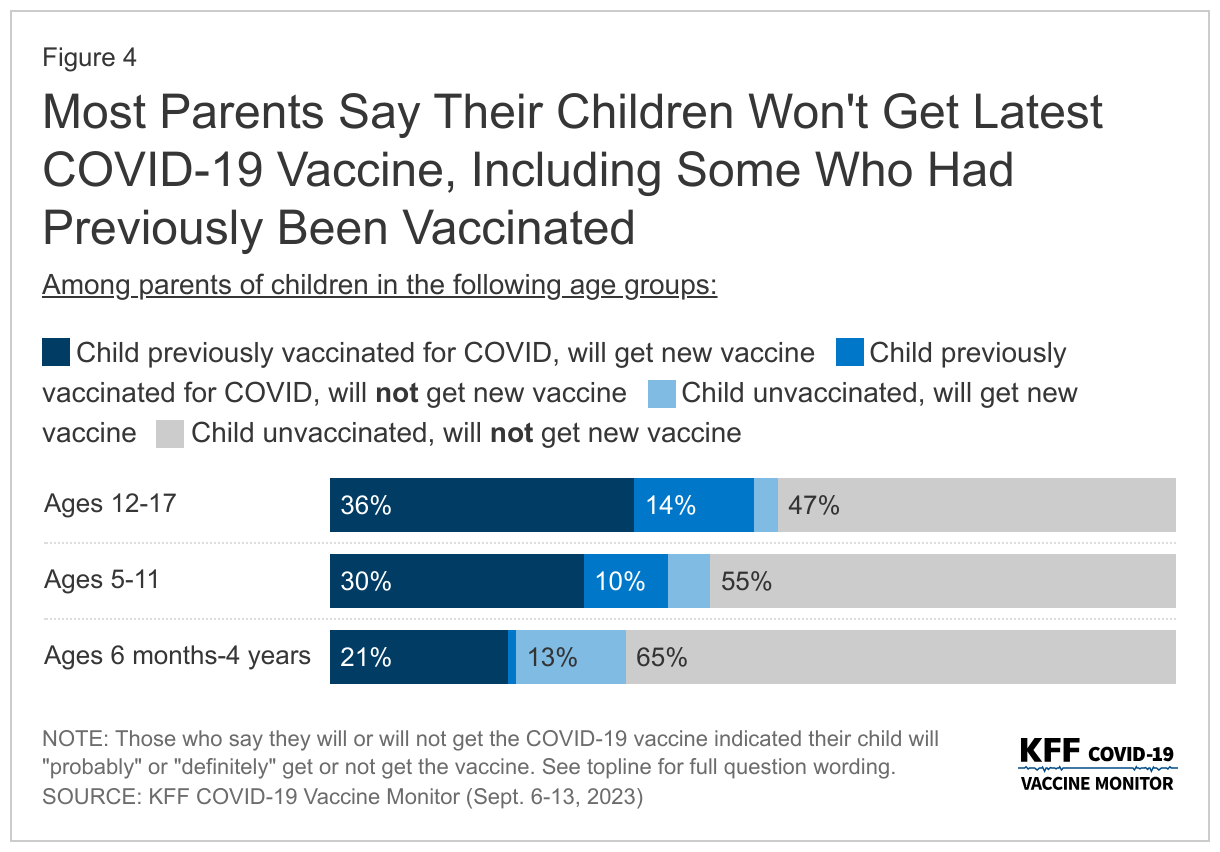
- Since COVID-19 vaccines first became available for children, uptake has lagged behind that of adults, particularly at younger ages. In the latest survey, most parents say they will not get their child the new COVID-19 vaccine including six in ten parents of teenagers (those between the ages of 12 and 17), and two-thirds of parents of children ages 5 to 11 (64%) and ages 6 months to 4 years old (66%). One in seven (14%) parents of teenagers say their teen was previously vaccinated but they aren’t planning on getting them the most recent vaccine. More than half of parents of children ages 5 and younger say their child has never received a COVID-19 vaccine and they do not plan on getting them the newest COVID-19 vaccine. Similar to adults overall, larger shares of parents say they are confident in the safety of both the flu vaccine (68%) and the RSV vaccine (63%) compared to the COVID-19 vaccine (48%).
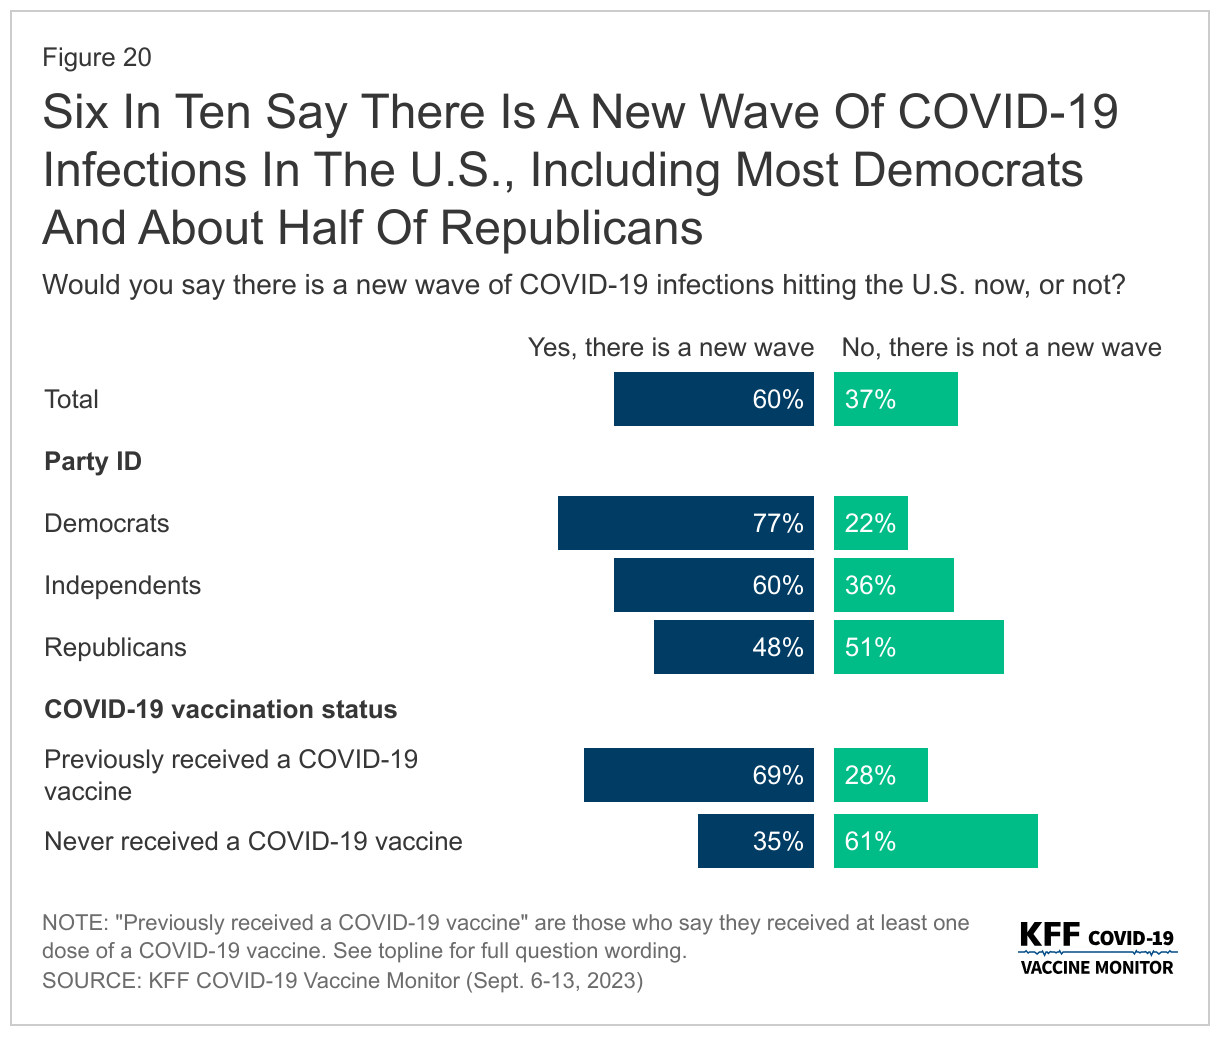
- Mirroring the partisan differences in views on vaccines, there is a persistent partisan divide on overall views of COVID-19, the current caseload in the U.S., whether they could be sick from COVID, and changes to behavior – including willingness to take a diagnostic test when sick. Democrats are more likely to report changing their behaviors because of recent news of increases in COVID-19. More than half of Democrats (58%) say they’ve recently modified their behavior to be more COVID-conscious compared to 16% of Republicans. Democrats (19%) are also more than twice as likely as both independents (8%) and Republicans (9%) to say that in the past three months they have had symptoms they thought could be COVID-19, and therefore took a COVID-19 diagnostic test. Most Democrats (77%) also say there is a new wave of COVID-19 infections hitting the U.S. now, while half of Republicans (51%) disagree.
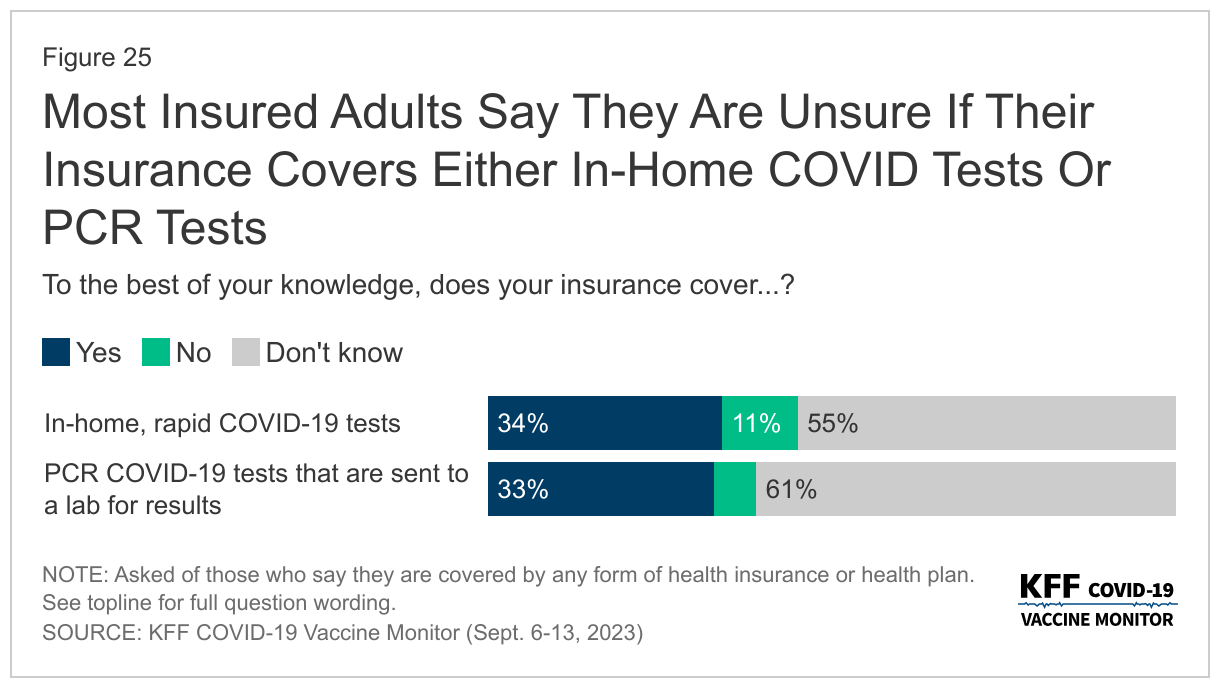
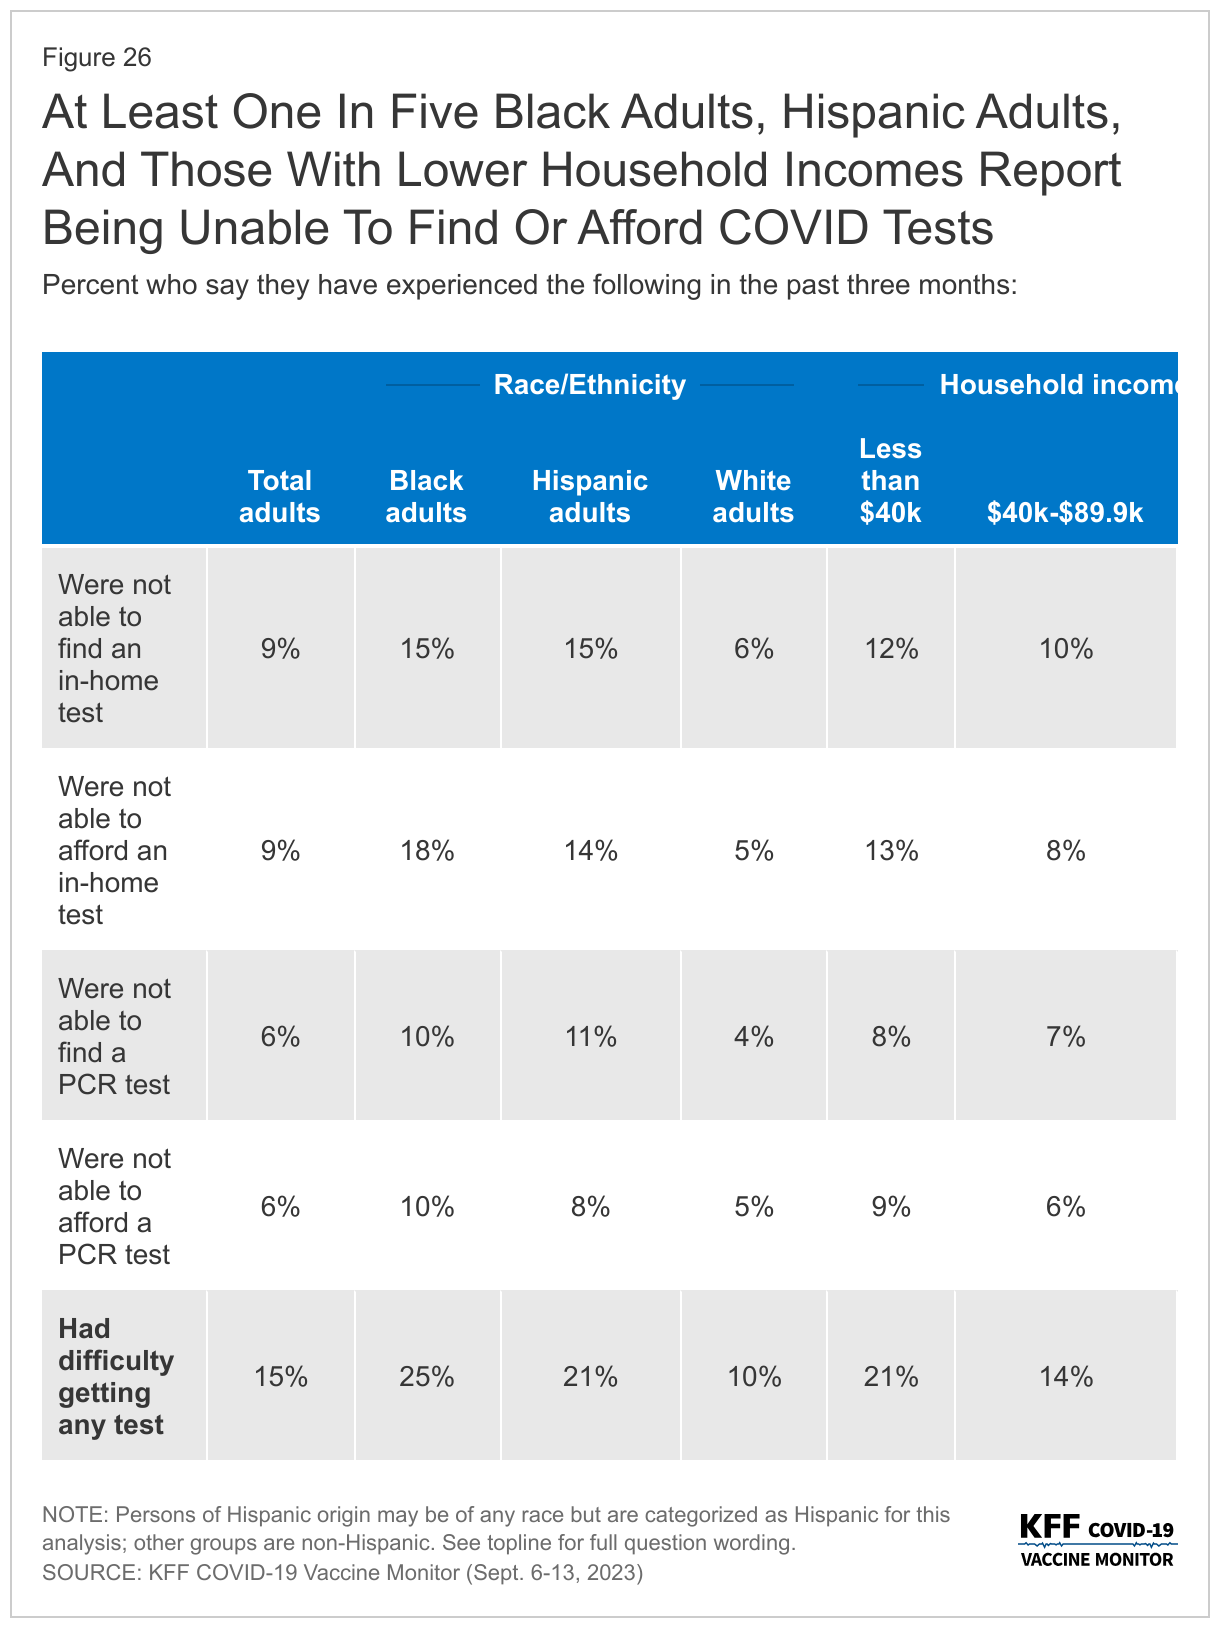
- Most insured people now say they are unsure whether their health insurance covers either in-home, rapid COVID-19 tests (55%) or PCR COVID-19 tests that are sent to a lab for results (61%). This confusion likely reflects the changing coverage landscape for tests since the public health emergency ended more than three months ago as most people no longer have coverage of in-home tests and will likely face cost-sharing for PCR tests. And while most adults do not report difficulty accessing testing, 15% overall say there was a time in the past three months when they wanted a COVID-19 test and they were not able to find or afford one, rising to more than one in four Black adults and one in five Hispanic adults. HHS announced on September 20th that free in-home tests will soon be available again on a limited basis from the federal government.
COVID-19, Flu, and RSV Vaccine Intentions and Perceived Safety
The September KFF COVID-19 Vaccine Monitor asks the public about their intention to get the flu vaccine and the updated COVID-19 vaccine, both of which are recommended by the CDC for people ages 6 months and older. The poll was in the field when the latest COVID-19 vaccine was recommended by the Centers for Disease Control and Prevention (CDC) but largely before it was available to the public. The CDC issued recommendations for everyone 6 months and older to get the annual flu vaccination on June 29th. Older adults, those 60 and older, were also asked questions about other vaccines recommended for their age group including the pneumonia vaccine, the shingles vaccine, and the new RSV vaccine which the CDC also recently recommended for this group.
Intentions To Get New COVID-19 Vaccine Lags Behind Initial Vaccine Uptake Among Adults And Children
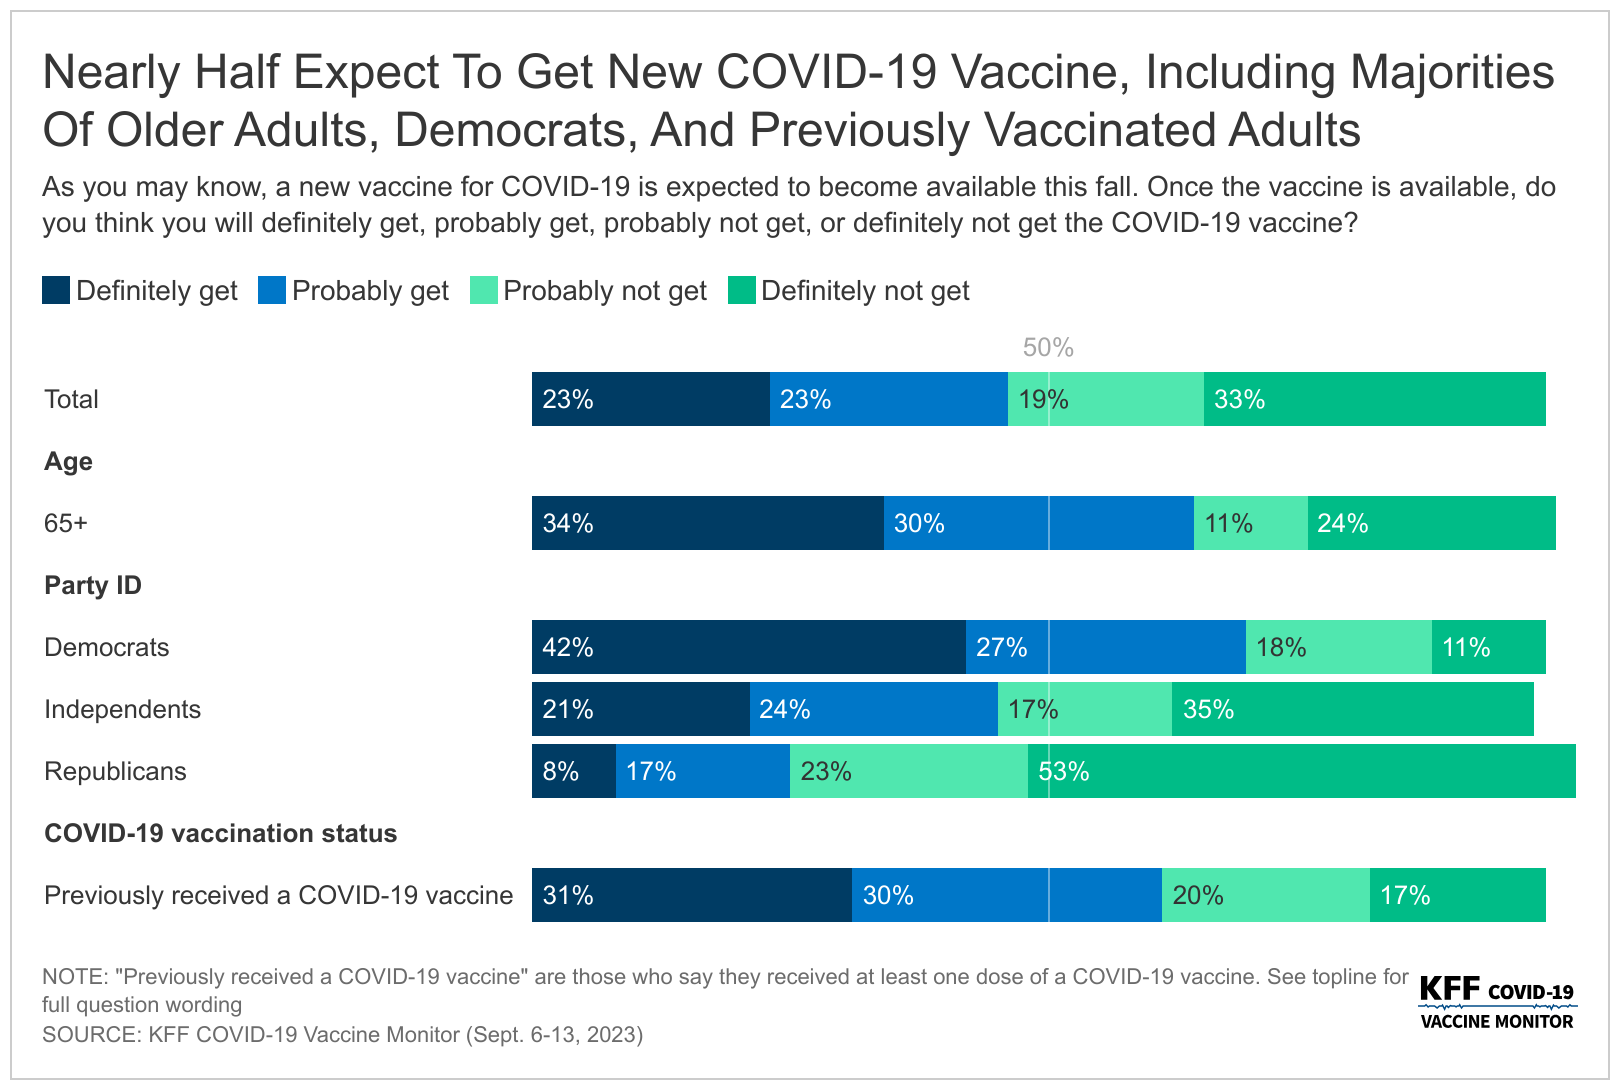
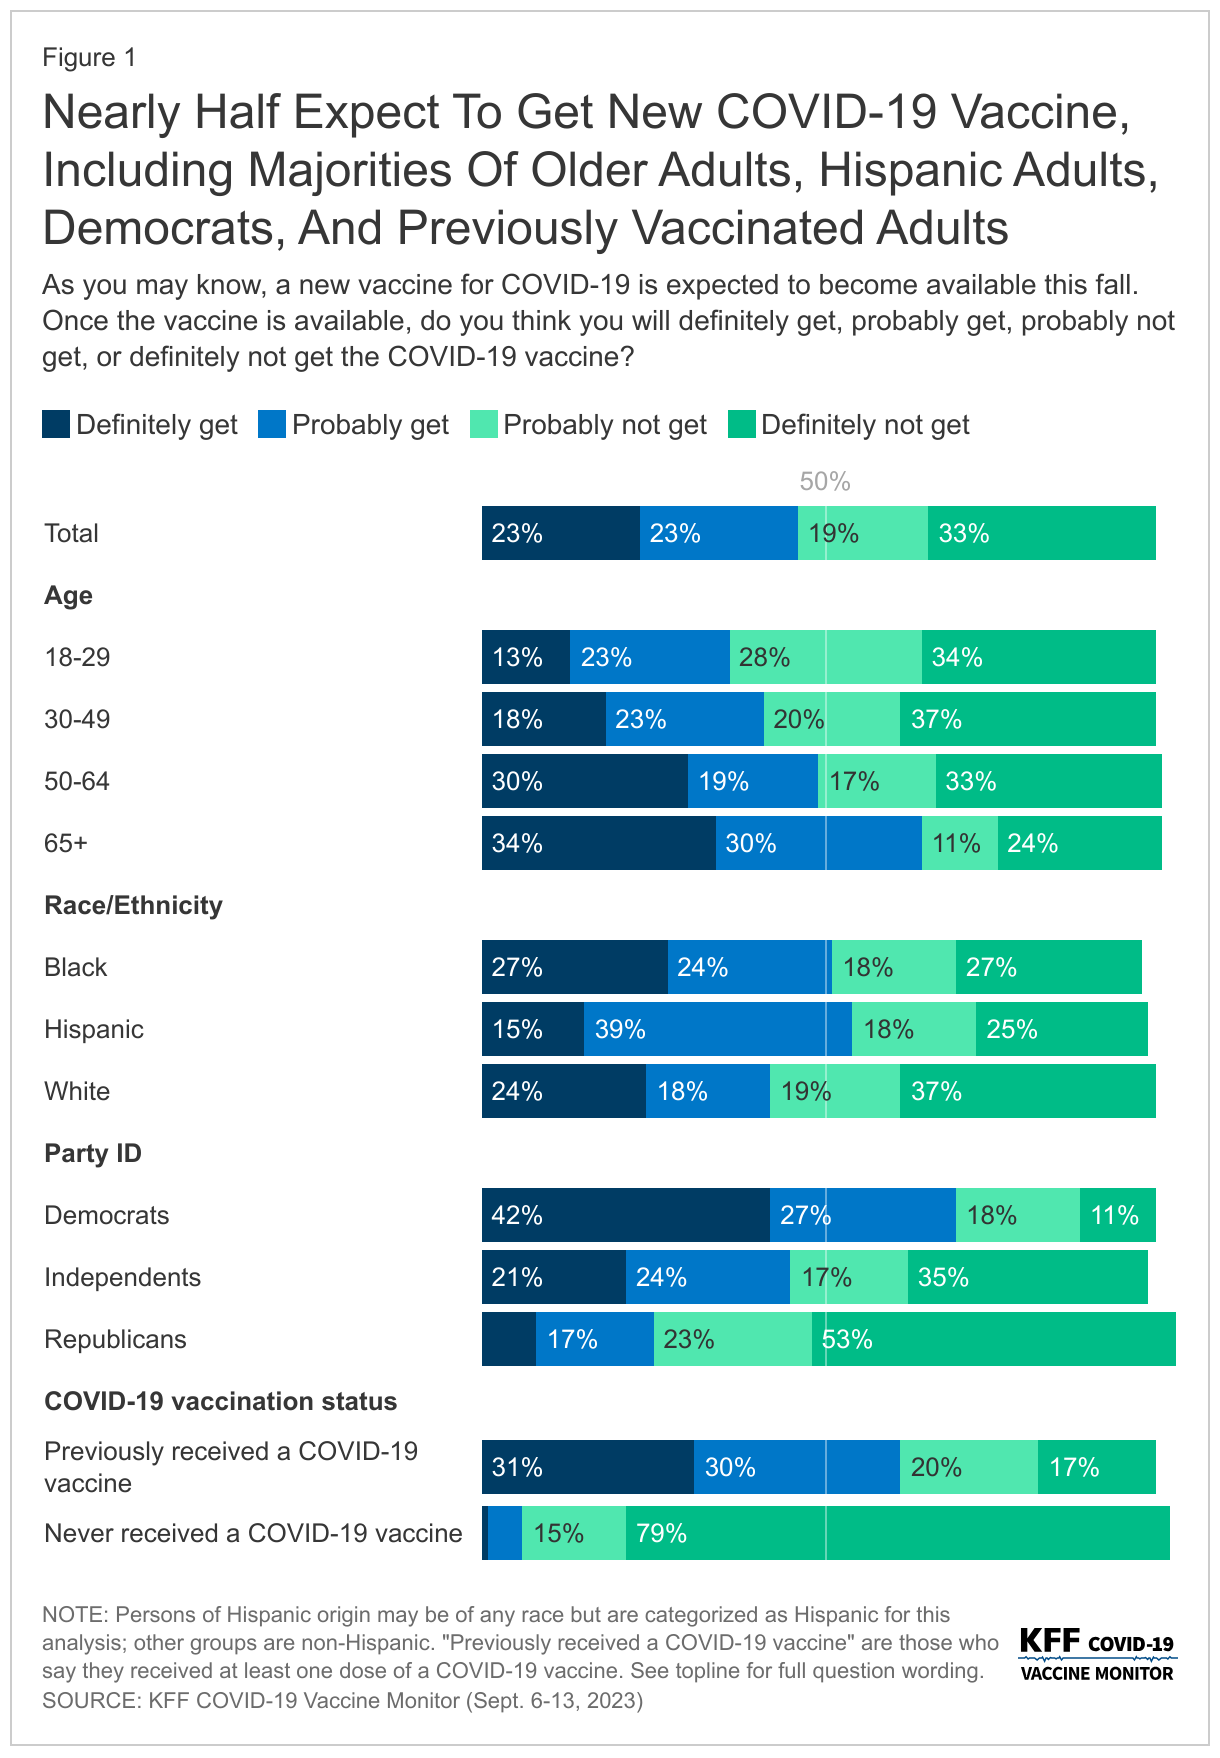
Half of adults say they either will “definitely get” (23%) or “probably get” (23%) the new vaccine for COVID-19 that was approved by the CDC on September 12th. One in three adults say they will “definitely not get” the new COVID-19 vaccine, and another 19% say they will “probably not get” the vaccine. Reflecting patterns in COVID-19 vaccine uptake throughout the pandemic, the share who say they will get the new COVID-19 vaccine is largest among adults age 65 and older (64%) and Democrats (70%). In addition, at least half of Hispanic adults (54%) and Black adults (51%) say they will get the COVID-19 vaccine compared to four in ten (42%) White adults.
Larger shares of those with a serious health condition (56%), such as high blood pressure, heart disease, lunch disease, cancer, or diabetes, say they will get the new COVID-19 vaccine compared to 42% of those who do not have a chronic condition. Similar to previous trends, almost half (44%) of those with insurance who are under the age of 65 report that they will get the new COVID-19 vaccine compared to three in ten (30%) of those who are uninsured and under 65 years old.
While most (61%) of those who were previously vaccinated for COVID-19 say they will get the new vaccine, almost four in ten (37%) of this group say they probably or definitely won’t get it. Very few (5%) of those who have not received a previous COVID-19 vaccine dose say they will get the new vaccine.
Intentions to get the initial booster, the bivalent booster, and now the latest vaccine available measured in the KFF COVID-19 Vaccine Monitor have not matched initial vaccine uptake. And while a smaller share of adults say they intend to get the latest vaccine compared to initial vaccine rollout (in which more than three in four adults received at least one dose), intentions to get this vaccine outpaces both intentions to get previous boosters and actual vaccine uptake measured by the CDC. Overall, about half of adults (45%) have received a COVID-19 vaccine and say they plan to get the latest vaccine, but about a quarter of adults (27%) say they have previously received a COVID-19 vaccine and now say they will not be getting the new vaccine available.
COVID-19 vACCINE Intent Among Parents Of Teenagers anD Kids
The KFF COVID-19 Vaccine Monitor has been tracking vaccine uptake for children across various age groups since the vaccines became available. The surveys have consistently shown COVID-19 vaccine uptake has been higher among older kids with about half of parents of teenagers saying their child has received at least one dose of the COVID-19 vaccine, compared to about a quarter of parents of kids between 6 months and 4 years old. Parents have cited safety concerns, lack of testing or research, and side effects as their main reasons for not getting the youngest cohort vaccinated.
The new version of the COVID-19 vaccine is recommended for all children ages 6 months and older and unlike previous COVID-19 vaccines, most parents say they will either “probably not get” or “definitely not get” their child, regardless of age, vaccinated. Six in ten parents of teenagers (those between the ages of 12 and 17) say they will not get their child the new COVID-19 vaccine as do two-thirds of parents of children ages 5 to 11 (64%) and ages 6 months to 4 years old (66%).
About a third of parents of teenagers say their child was previously vaccinated and they will get their child vaccinated with the most recent vaccine available, while a notable share (14%) say their teenager was previously vaccinated but they aren’t planning on getting them the most recent vaccine. More than half of parents of children younger than five years old say their child has never received a COVID-19 vaccine and they do not plan on getting them the newest COVID-19 vaccine.
Majority Of Adults Say They Will Get Annual Flu Shot And Most Older Adults Plan To Get RSV Vaccine
Six in ten adults (58%) say they will get a flu shot this year including 2% who say they have already gotten their flu shot. This includes nearly eight in ten adults ages 65 and older, as well as three in four Democrats. Those who report normally getting a flu shot (53% of all adults) are nearly six times as likely as those who do not normally get a flu shot to say they will get it this year. About half of Republicans (51%) and independents (49%) say they will get their annual flu shot or have already gotten it.
While public health officials say getting the flu vaccine and the COVID-19 vaccine at the same time is safe and initially thought to be preferred in order to reduce burden, only about half (53%) of those who intend to get both say they plan to get it at the same time.
Most Older Adults Say They Will Get RSV Vaccine
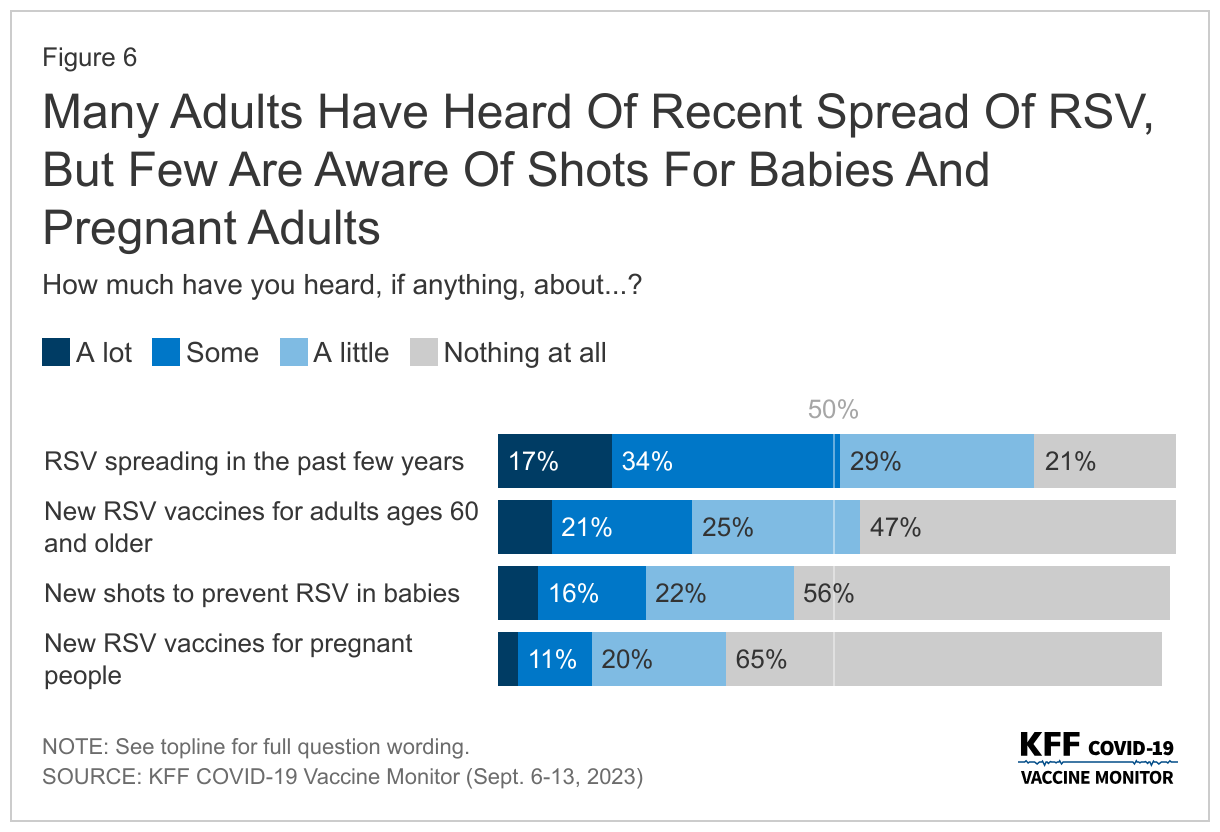
Half of people say they have heard either “a lot” or “some” about RSV spreading in the past few years, but considerably smaller shares have heard about the vaccines aimed at preventing at-risk groups from getting seriously sick from the respiratory virus. Three in ten adults (28%) say they have heard at least some about the new RSV vaccine for adults 60 and older, one in five (22%) say they have heard about the new shots to prevent RSV in babies, and one in seven (14%) have heard about the new recommended RSV vaccines for pregnant people.
Awareness of both the vaccines for adults ages 60 and older, and the new shots to prevent RSV in babies is higher among groups that are at risk. Four in ten adults ages 60 and older say they have heard about the new RSV vaccines for their age group and one in three parents of children less than two years old say they have heard about the shots for this age group.
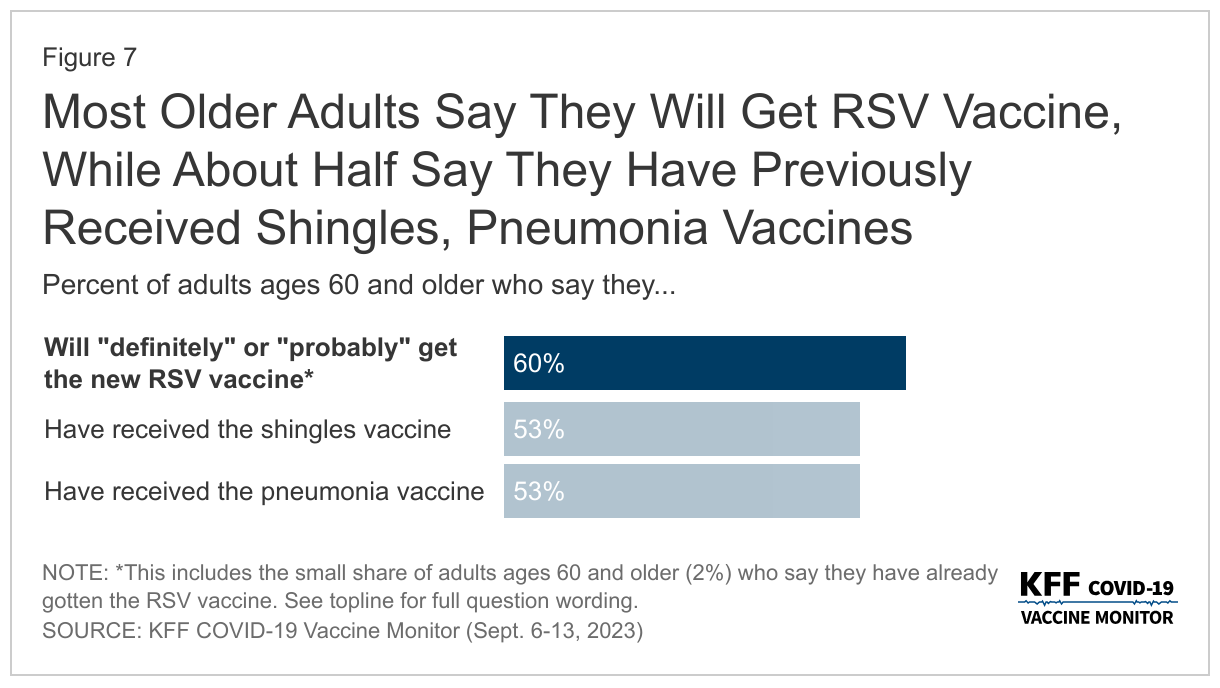
The share of adults ages 60 and older who say they will either “definitely get” or “probably get” the new RSV vaccine matches vaccine uptake for other key vaccines for this age group, notably the shingles vaccine and the pneumonia vaccine. More than half of older adults say they have received the pneumonia vaccine (53%), the shingles vaccine (53%), and plan to get the new RSV vaccine (58%). An additional 2% of older adults say they have already gotten the RSV vaccine.
As Virus Season Approaches, Most Are Confident In Vaccine Safety
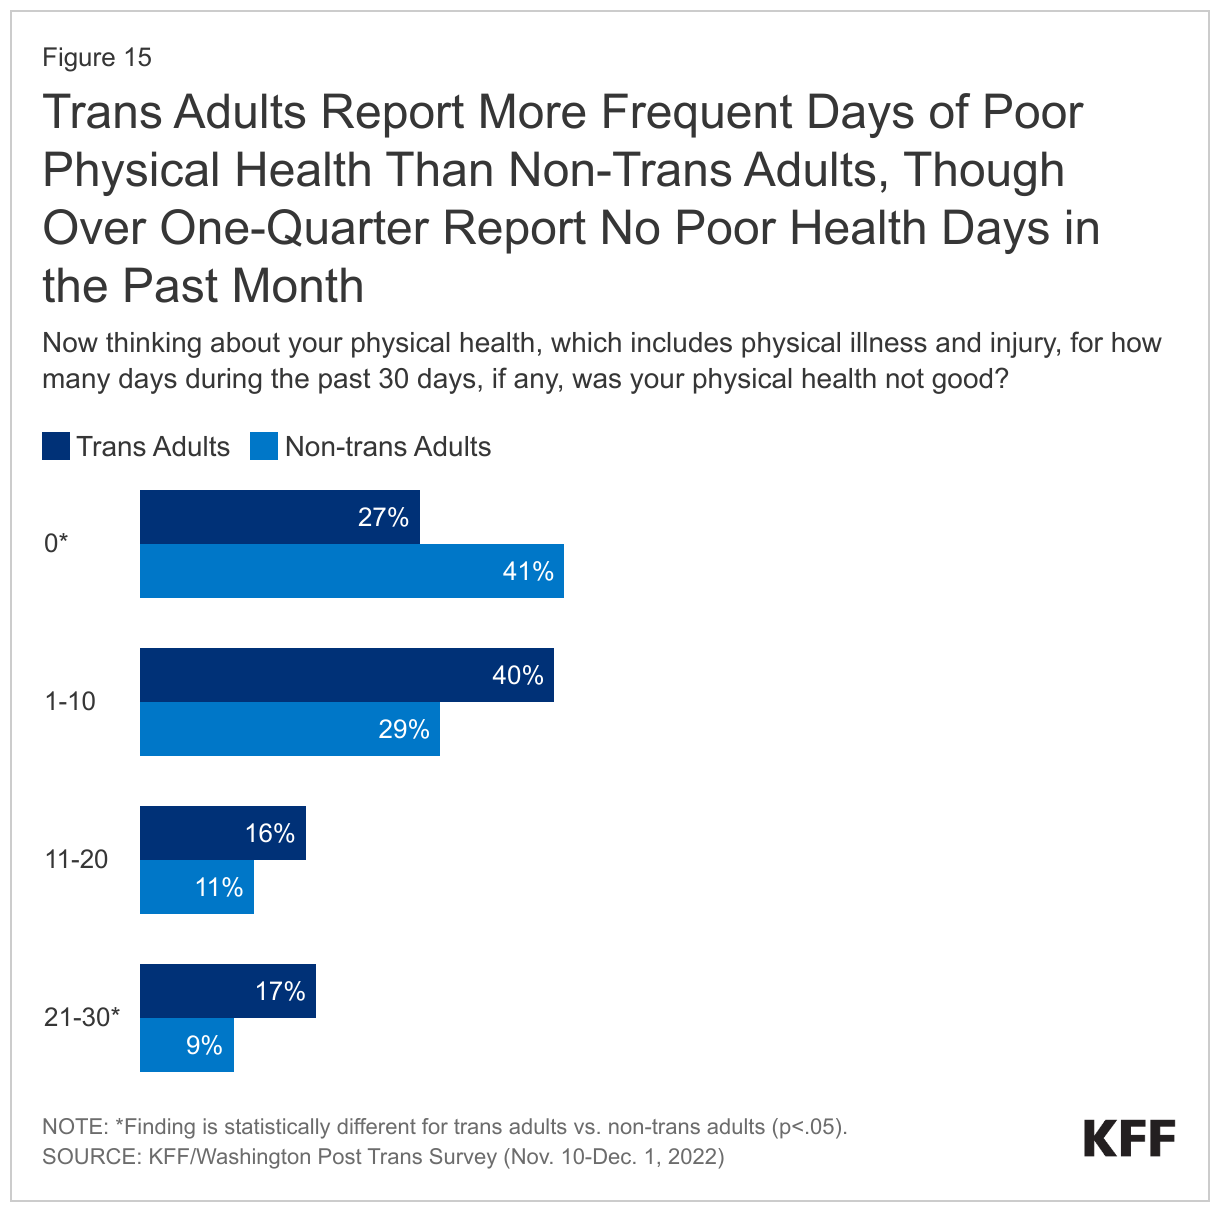
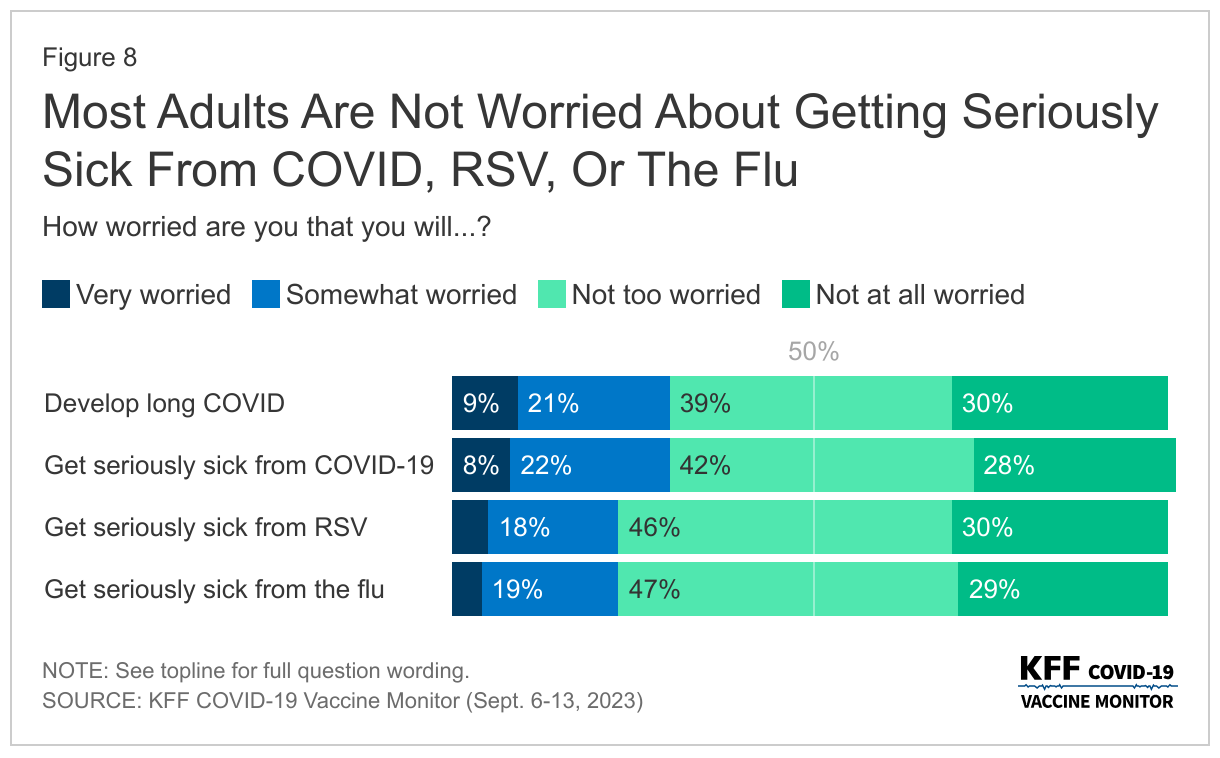
Public health officials have raised concerns about a possible “tripledemic” with COVID-19, the respiratory illness RSV (respiratory syncytial virus), and the flu all hitting peaks this fall as people are more likely to be indoors and gathering together. About three in ten adults say they are worried about developing long COVID (31%) or getting seriously sick from COVID-19 (30%). About one in four are worried about getting seriously sick from the flu (23%) or from RSV (23%).
Those with a serious health condition (such as high blood pressure, heart disease, lung disease, cancer, or diabetes) are more likely than those without a serious health condition to be worried about the impending virus season. About four in ten of those with a chronic health condition say they are worried about getting seriously sick from COVID-19 (38%) or developing long COVID (38%), and three in ten are worried about getting seriously sick from RSV (29%) or the flu (28%).
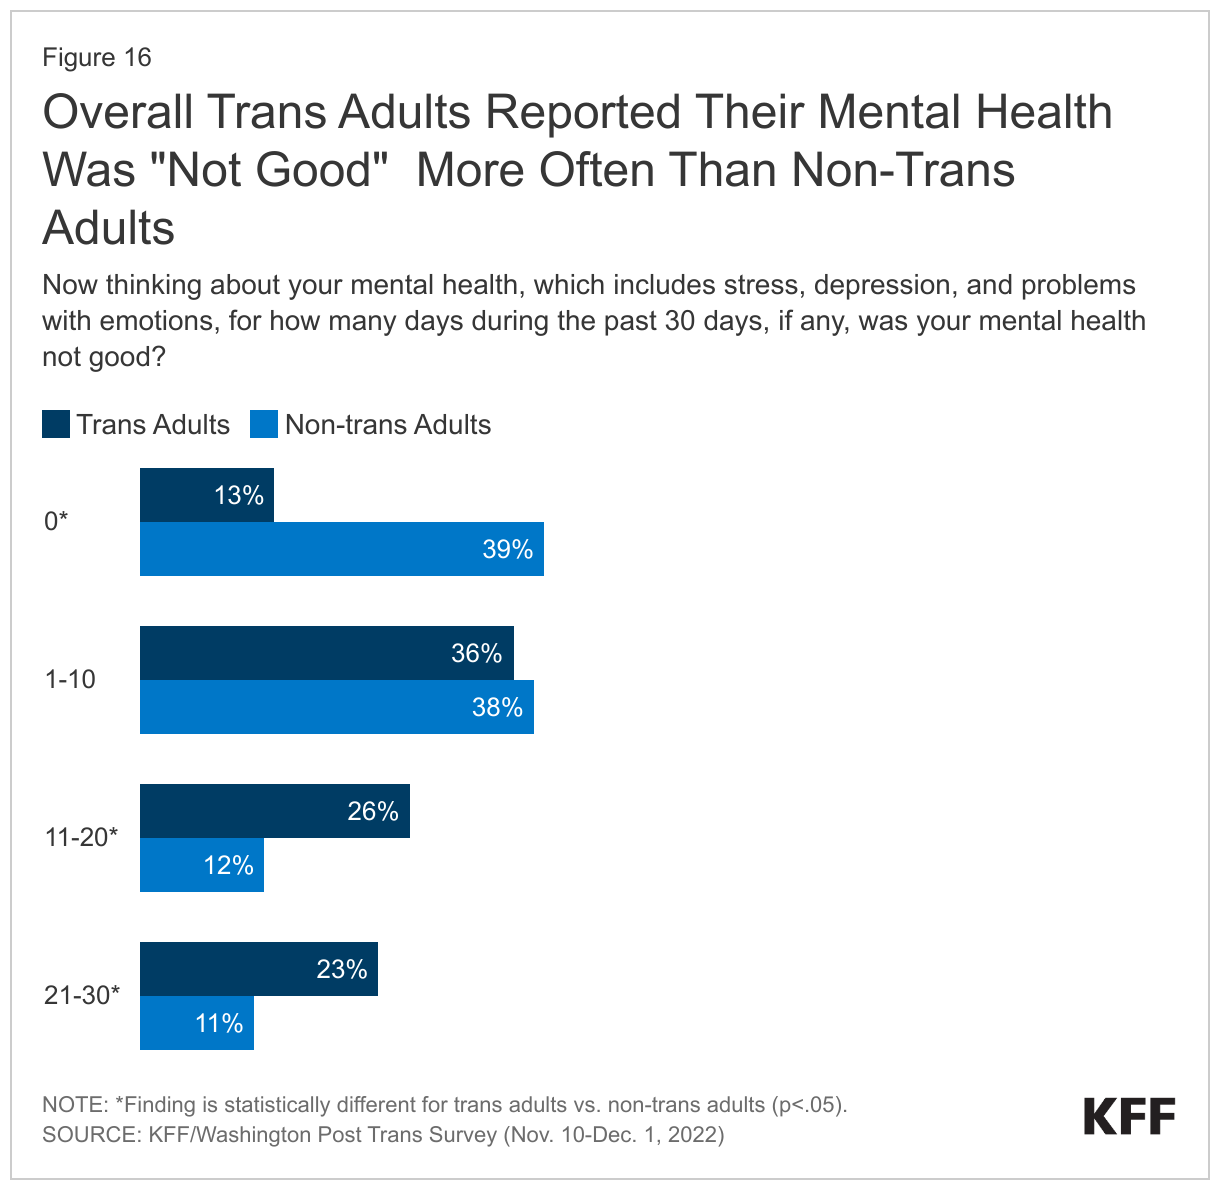
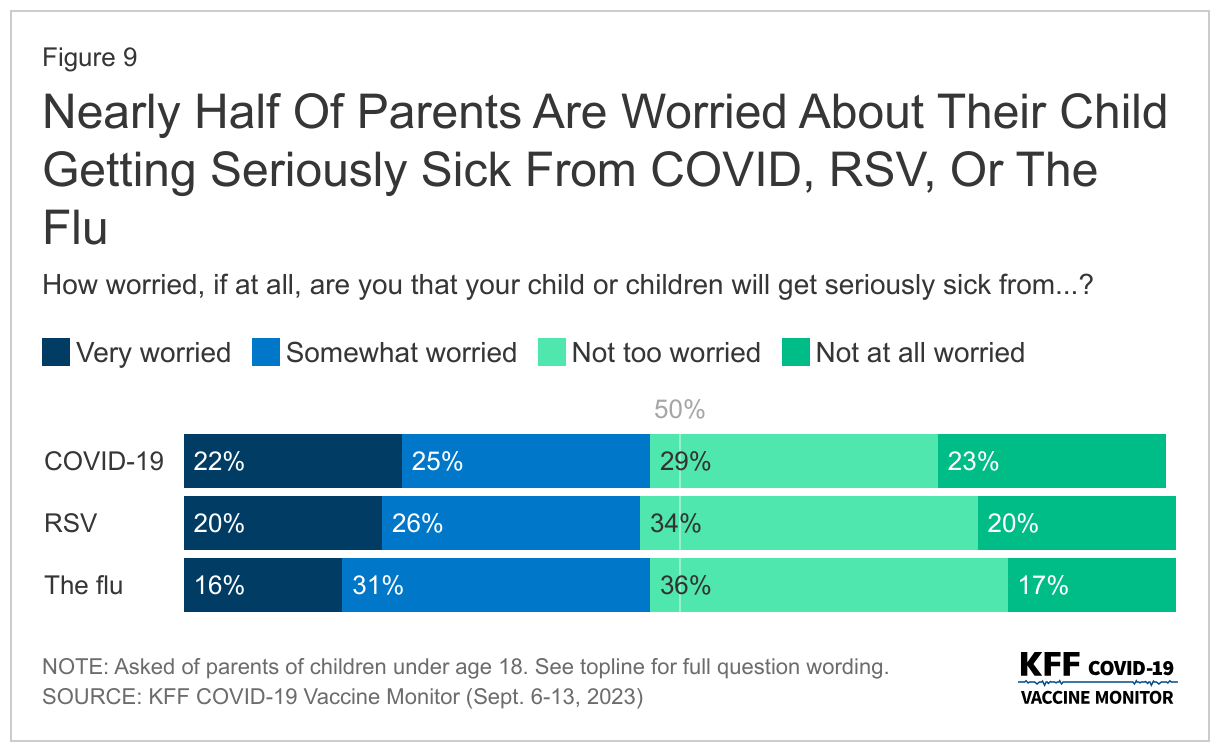
Nearly half of parents say they are worried that their child or children will get seriously sick from COVID-19 (48%), the flu (47%), or RSV (46%).
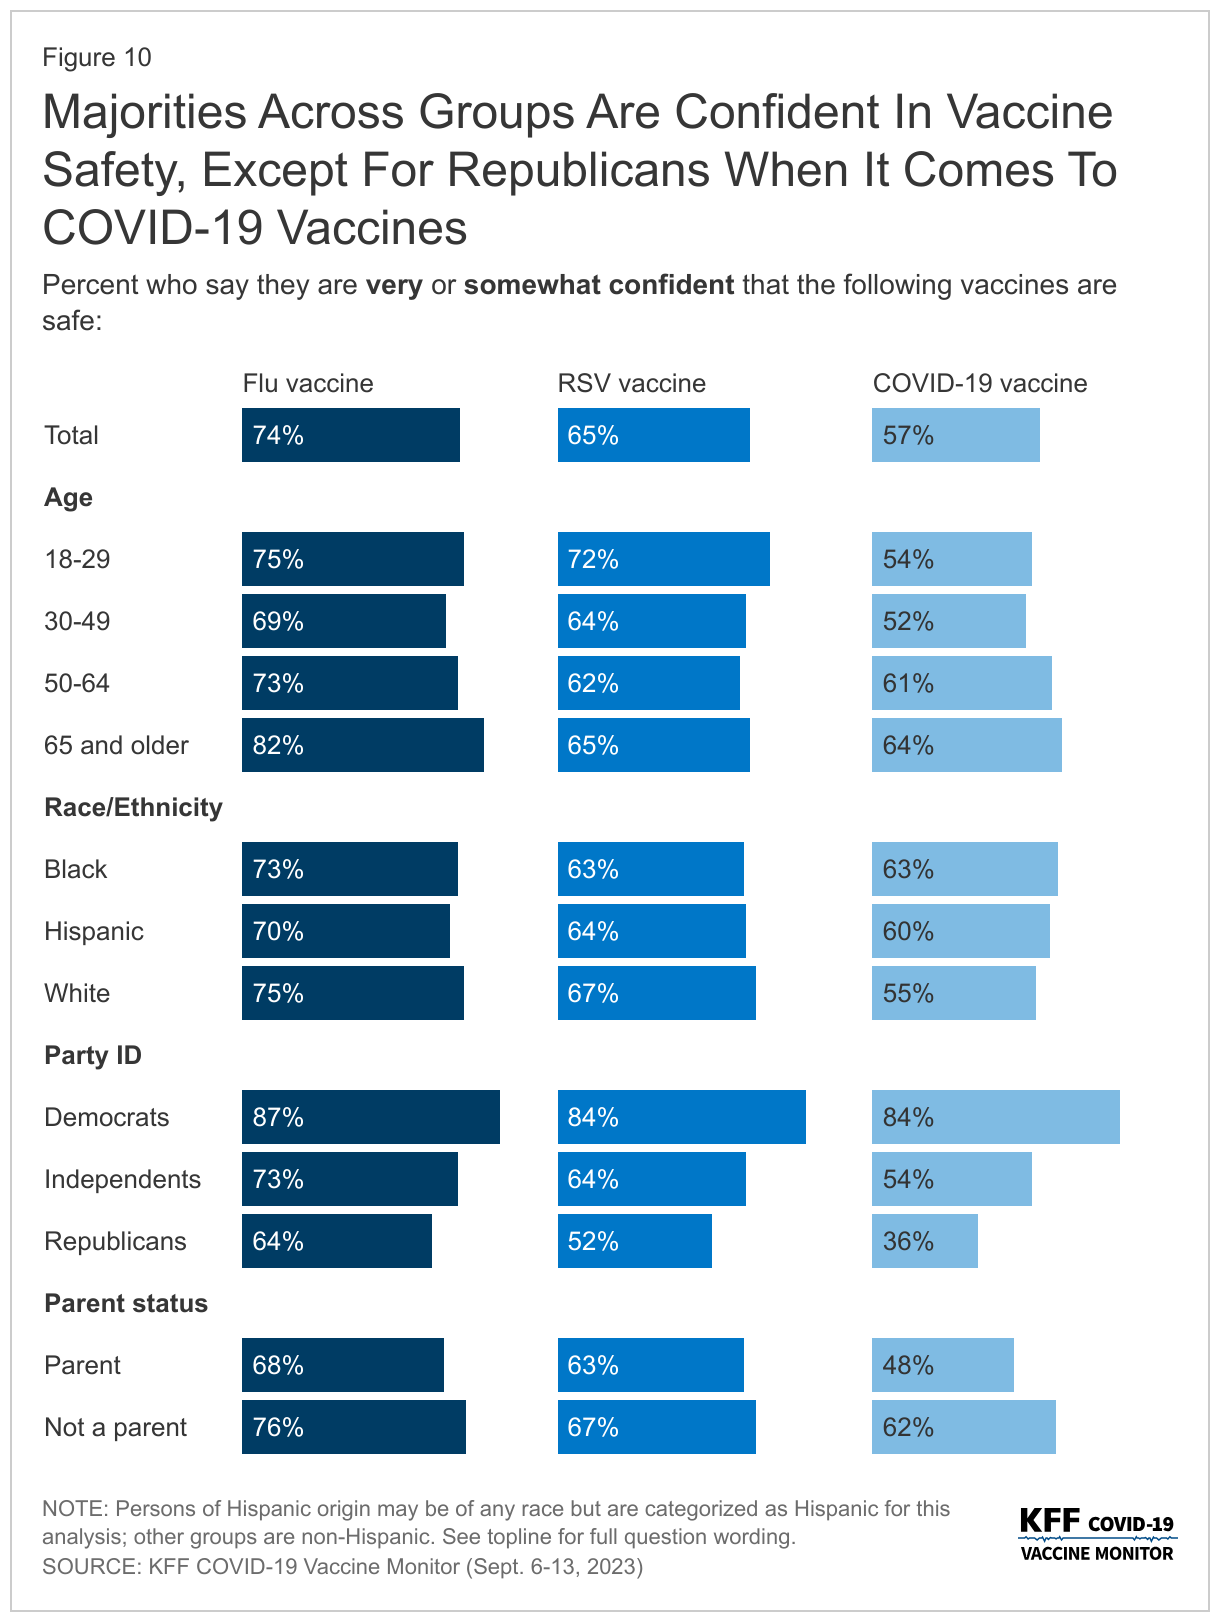
Amidst news of the impending virus season, most adults think that the vaccines developed to combat these viruses are safe. While a majority of adults are confident in the safety of the COVID-19 vaccine (57%), it lags slightly behind confidence in the RSV vaccine (65%) and the flu vaccine (74%).
Majorities across age groups, racial and ethnic identities, and partisanship are confident in the safety of all three vaccines – with one notable exception. About one in three Republicans say they are “very confident” or “somewhat confident” in the safety of the COVID-19 vaccine (36%), compared to more than half of Republicans who are confident the RSV vaccine is safe (52%) and nearly two-thirds who are confident in the safety of the flu vaccine (64%). These views reflect the partisan gap in COVID-19 vaccine confidence throughout the more than two years of COVID-19 vaccine rollout.
Similarly to adults overall, parents are more confident in the safety of both the flu vaccine (68%) and the RSV vaccine (63%), than the COVID-19 vaccine (48%).
Trust In Vaccine Information
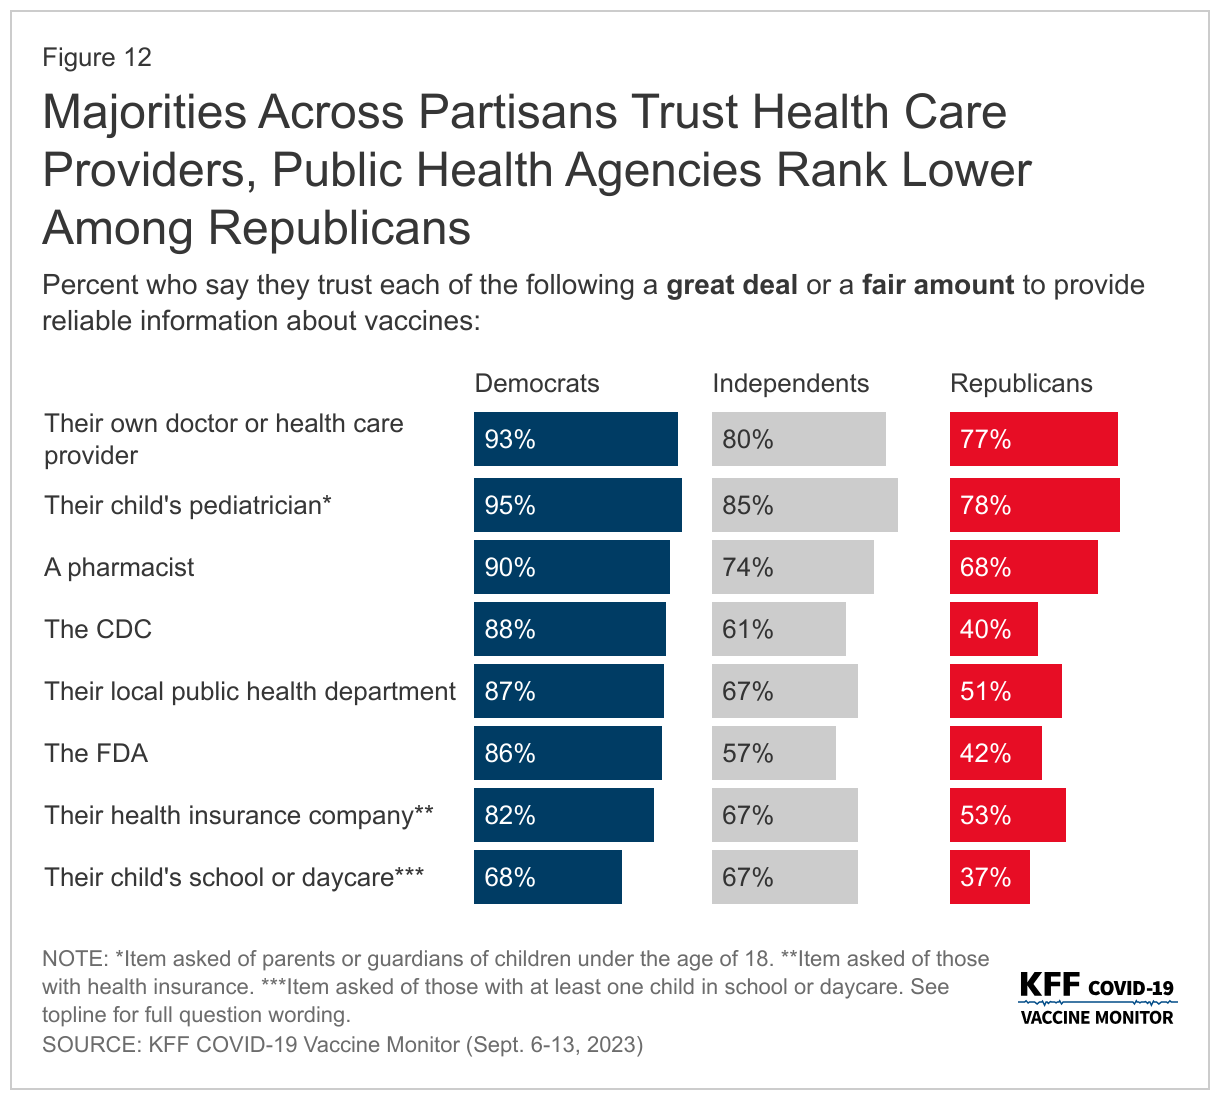
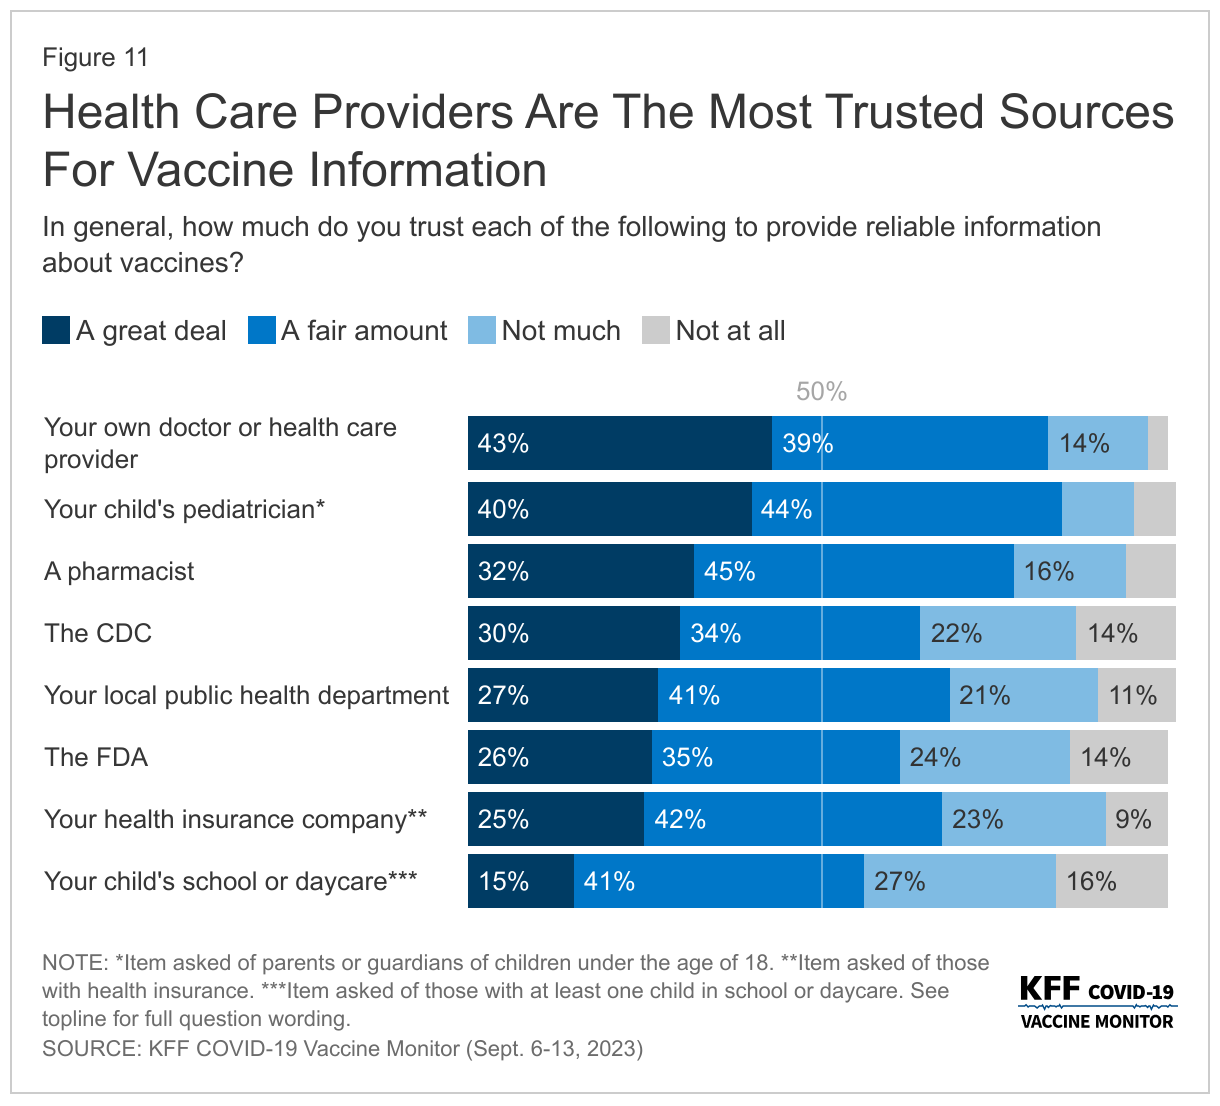
As the CDC Director Mandy Cohen continues her efforts to combat the lingering vaccine skepticism from the COVID-19 pandemic, the public continues to rank their own doctors as the most trusted source of information about vaccines. More than eight in ten adults (82%) say they trust their own doctor or health care provider at least a fair amount when it comes to providing reliable information about vaccines. A similar share of parents (84%) has the same level of trust in their child’s pediatrician. About three-quarters of adults (77%) say they trust pharmacists to provide reliable information. A smaller share, but still a majority, say they trust public health government agencies like their own local public health department (68%), the Centers for Disease Control and Prevention (CDC) (63%), or the U.S. Food and Drug Administration (FDA) (61%). This is similar to the share of insured adults (68%) who say they trust their health insurance company. Schools and daycares rank below other groups asked about with slightly more than half (56%) of parents with children attending school or daycare saying they trust them to provide reliable information about vaccines.
The ranking of trusted sources on reliable information about vaccines is similar to the sources the public trusts specifically on COVID-19 vaccines measured last year, and partisan differences are still very apparent. While large majorities across partisans say they trust their own doctor or child’s pediatrician, government sources of information like the CDC, local public health departments, and the FDA fare much worse among Republicans. About four in ten Republicans say they trust the FDA (42%) or the CDC (40%) to provide reliable information about vaccines, and about half of Republicans (51%) say the same about their local public health departments. Large majorities of Democrats and more than half of independents say they trust each of these organizations at least a fair amount.
Understanding How And Why To Get Vaccines
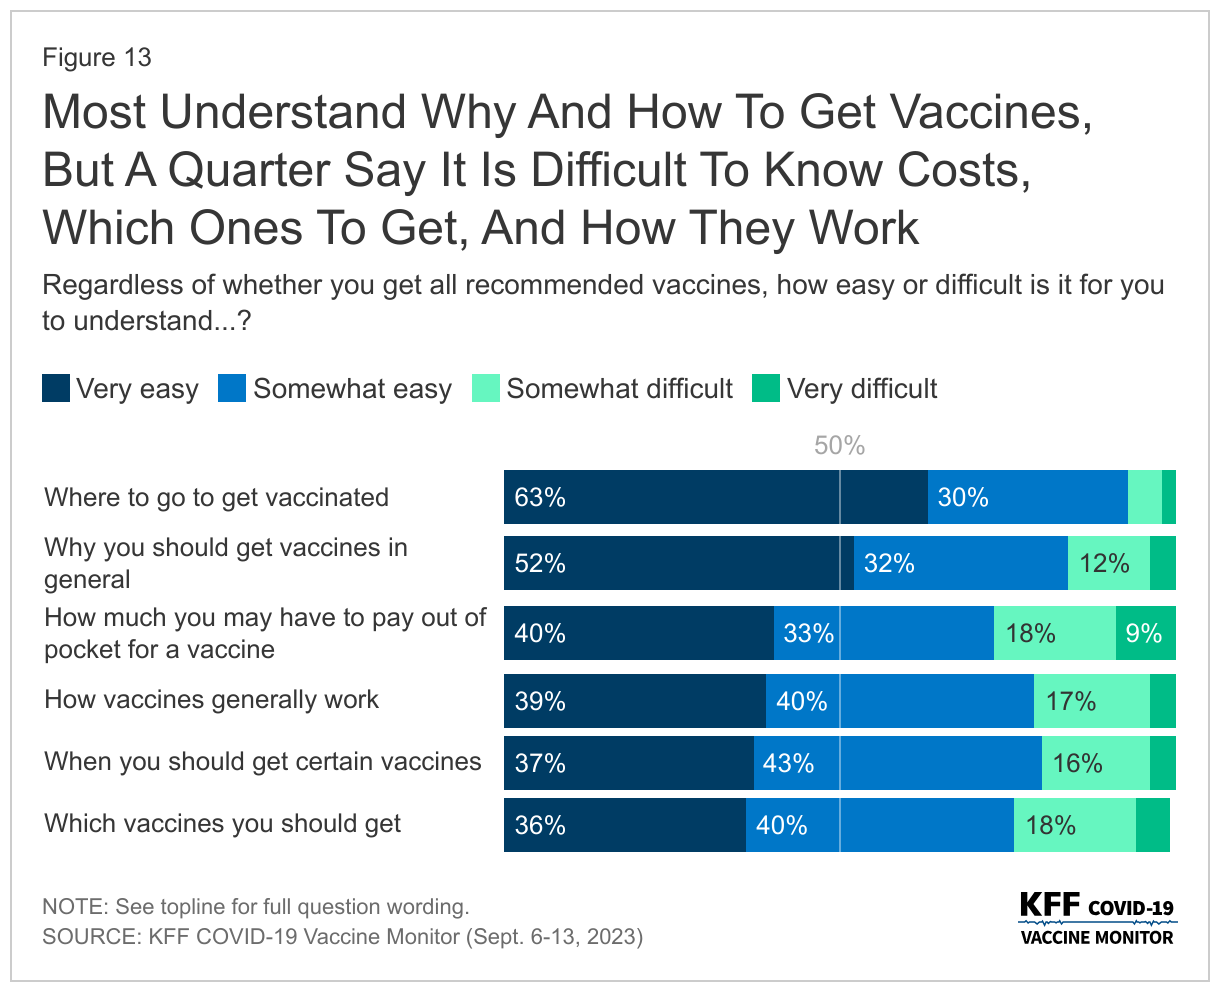
Nearly all adults (93%) say it is easy for them to understand where to go to get vaccinated, including six in ten (63%) who say it is “very easy.” At least three-quarters of adults also say it is easy for them to understand why they should get vaccines (84%), when they should get them (79%), how vaccines work (78%), which vaccines they should get (77%), and how much they may have to pay for a vaccine (63%).
While most adults say it is easy for them to understand the reasoning behind vaccines and the logistics of how to get them, at least one in five of adults still say some of these aspects are difficult to understand. This includes understanding which vaccines they should get (23%), how vaccines generally work (22%), or understanding when they need to get certain vaccines (20%). More than one in four adults say it is difficult to know how much they may have to pay out-of-pocket (27%), even as most people with health insurance will not have to pay any out-of-pocket costs for recommended vaccines.
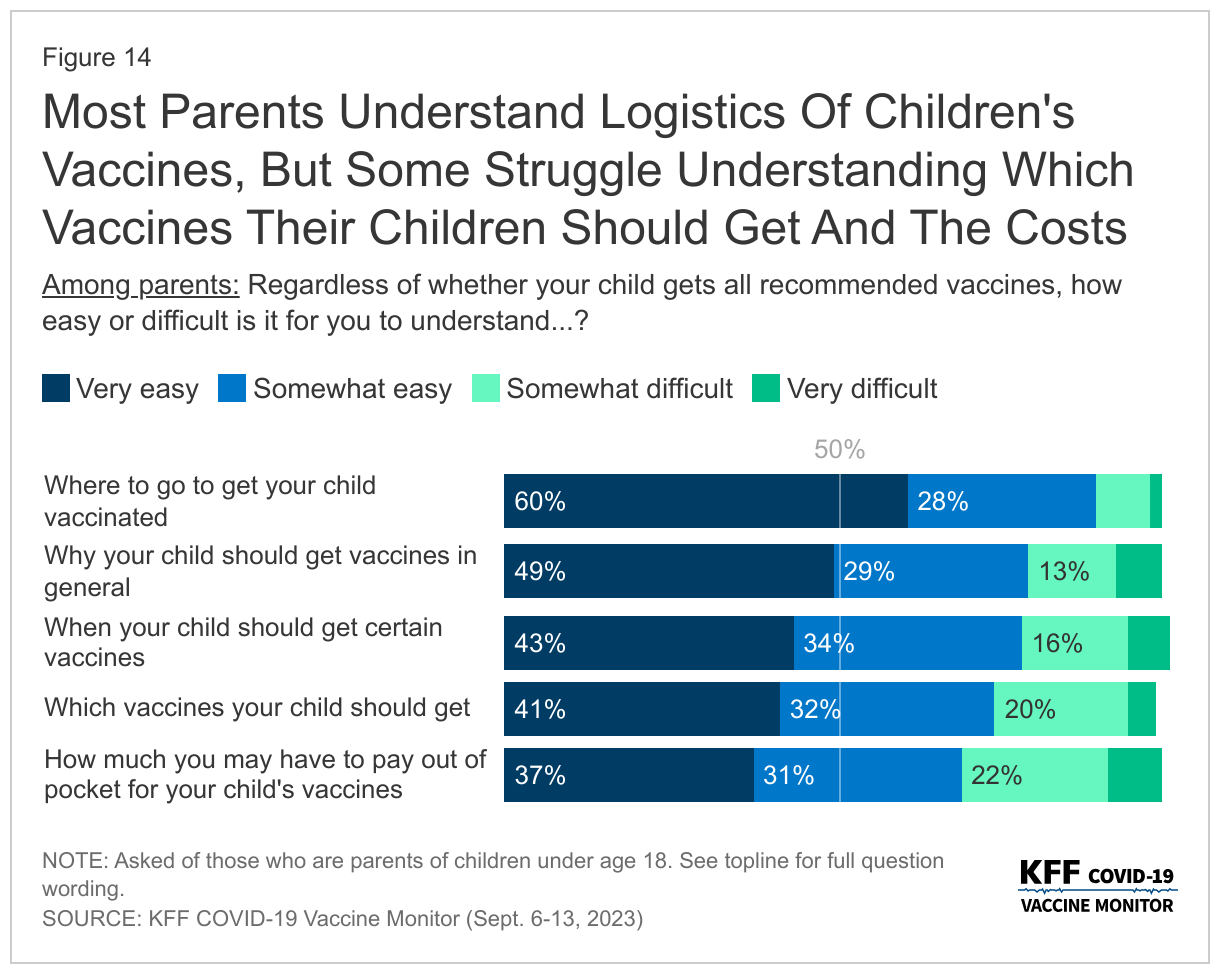
Similarly, most parents report that it is easy to understand the logistics of their vaccinations, such as when and where to get the shots and why their child should get vaccinated. Nearly nine in ten (88%) parents say it is easy to know where to go to get their children vaccinated and about three-fourths of parents say the same about why their children should get vaccines in general (78%), when their child should get certain vaccines (77%), or which vaccines their child should get (73%). Two-thirds (68%) say it is easy for them to understand how much they have to pay out-of-pocket for their child’s vaccines. Most insurance coverages require no out-of-pocket costs for recommended vaccines for children.
Most adults say they get vaccines recommended by Their doctors
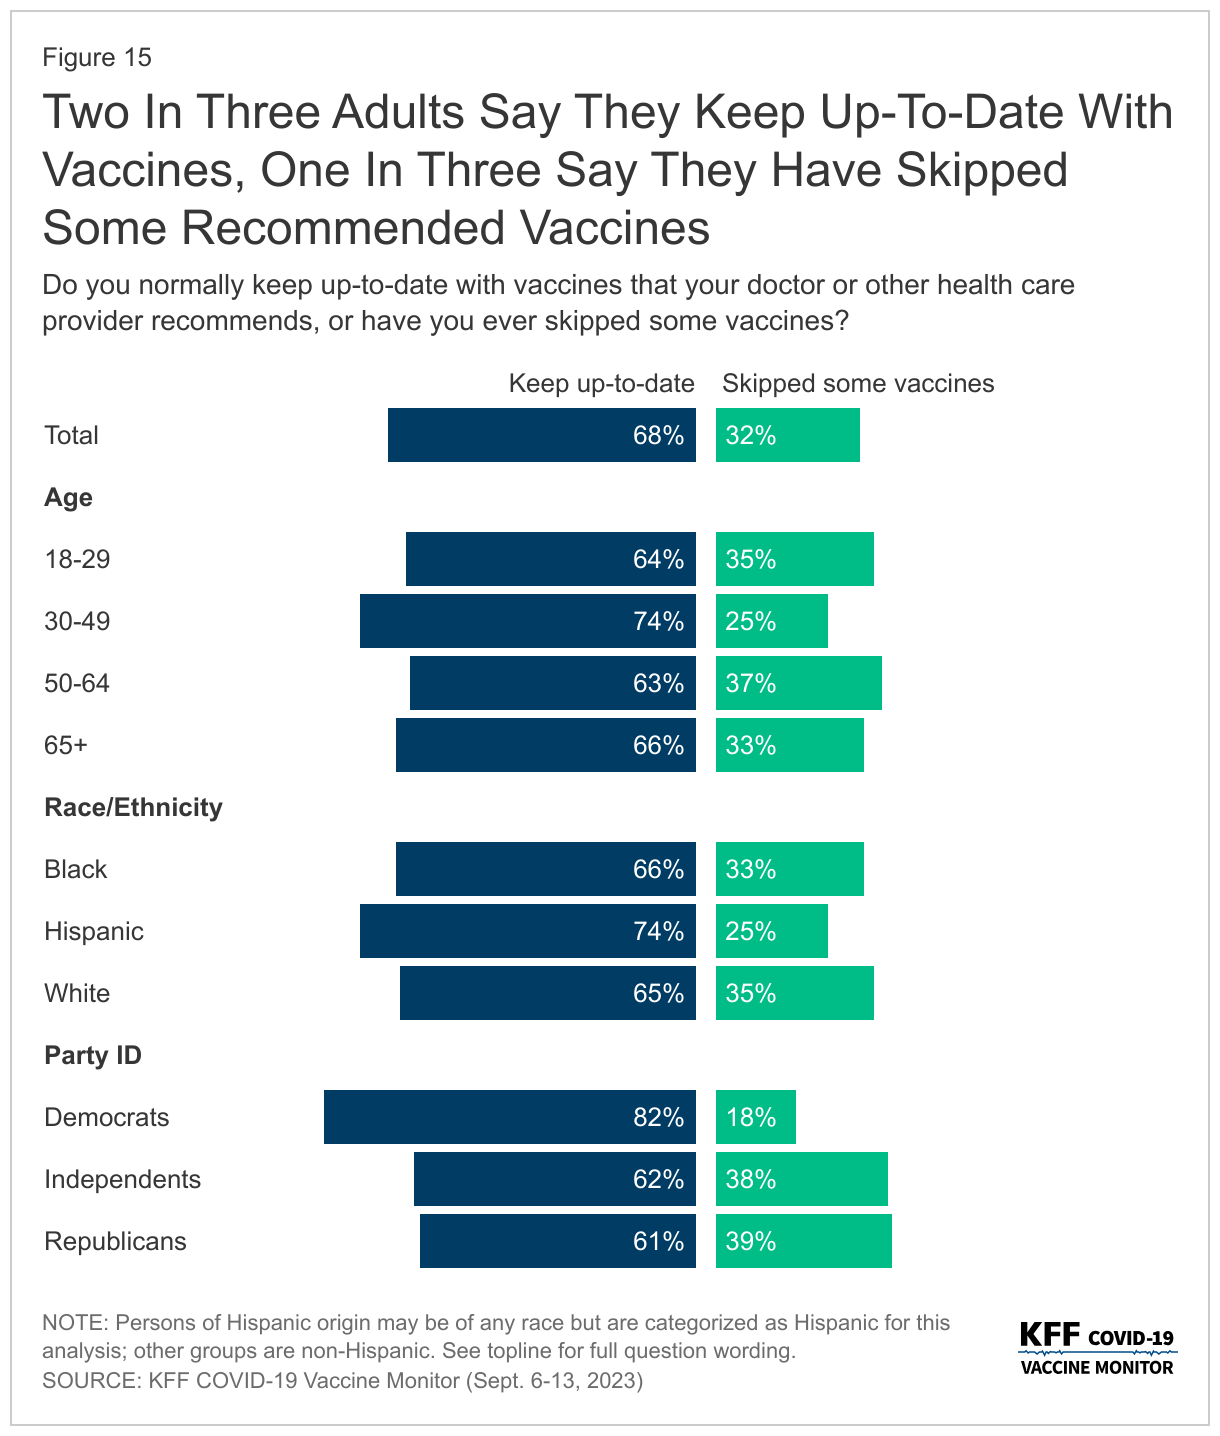
With health care providers as the most trusted sources of information about vaccines, most adults (68%) say they normally keep up-to-date with the vaccines that their health care provider recommends for them, while one-third (32%) say they have skipped some recommended vaccines. The share who say they have skipped some recommended vaccines is lowest among Democrats with one in five (18%) saying they have skipped some vaccines, compared to four in ten independents (38%) and Republicans (39%). At least one in three Black adults (33%) and White adults (35%) say they have skipped some vaccines, as have one in four Hispanic adults.
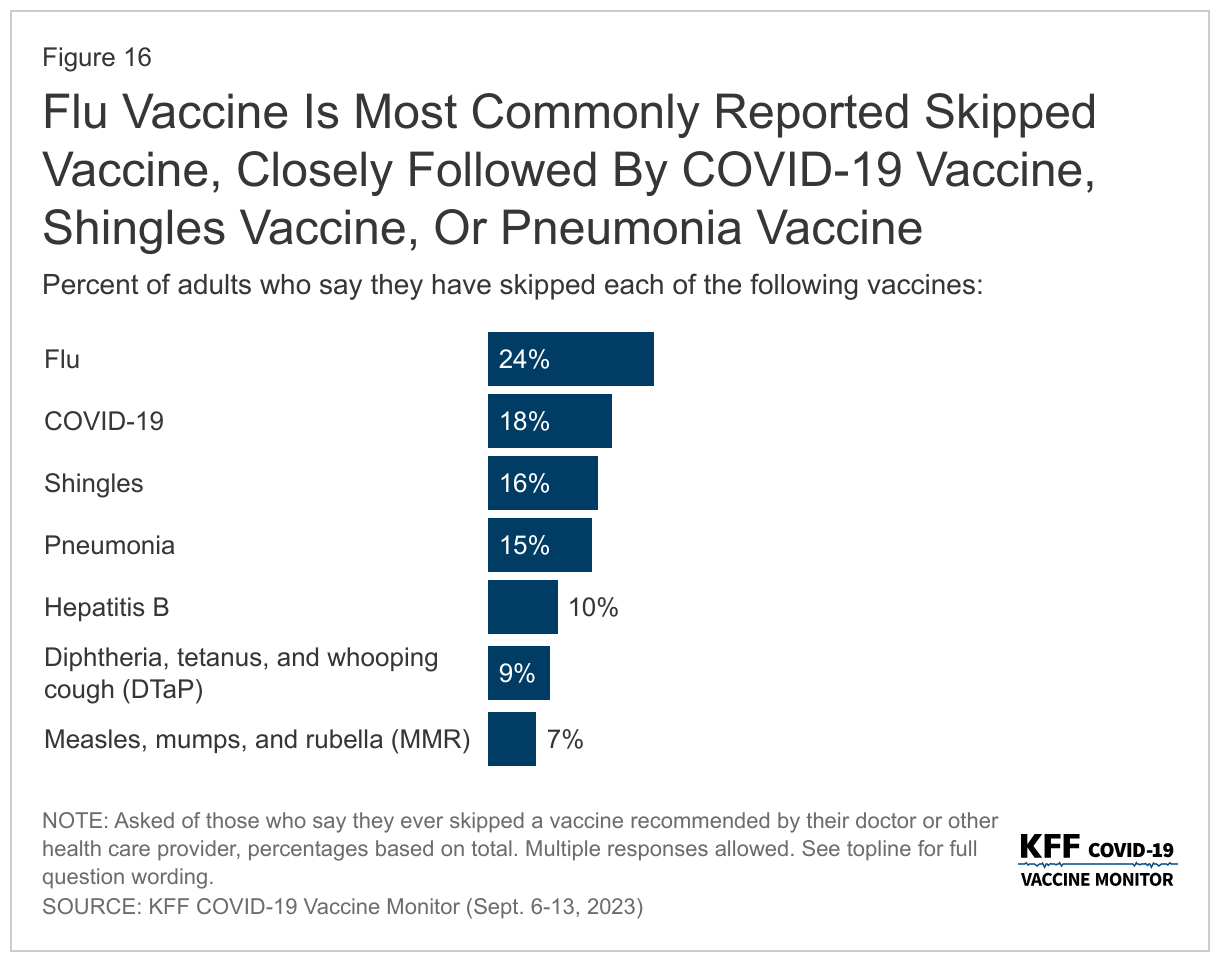
The flu vaccine is the most commonly reported skipped vaccine with one in four adults overall saying they have ever skipped a flu vaccine. About one in six adults say they have skipped a COVID-19 vaccine (18%), the shingles vaccine (16%), or the pneumonia vaccine (15%) when it was recommended by their provider. Previously, both the pneumonia and shingles vaccines were generally recommended for older adults and only recently has the shingles vaccine recommendations expanded to include some adults with certain ongoing health needs, and the pneumonia vaccine is now recommended for children as well as adults 65 and older. The flu vaccine and the COVID-19 vaccine are recommended for everyone age 6 months and older.
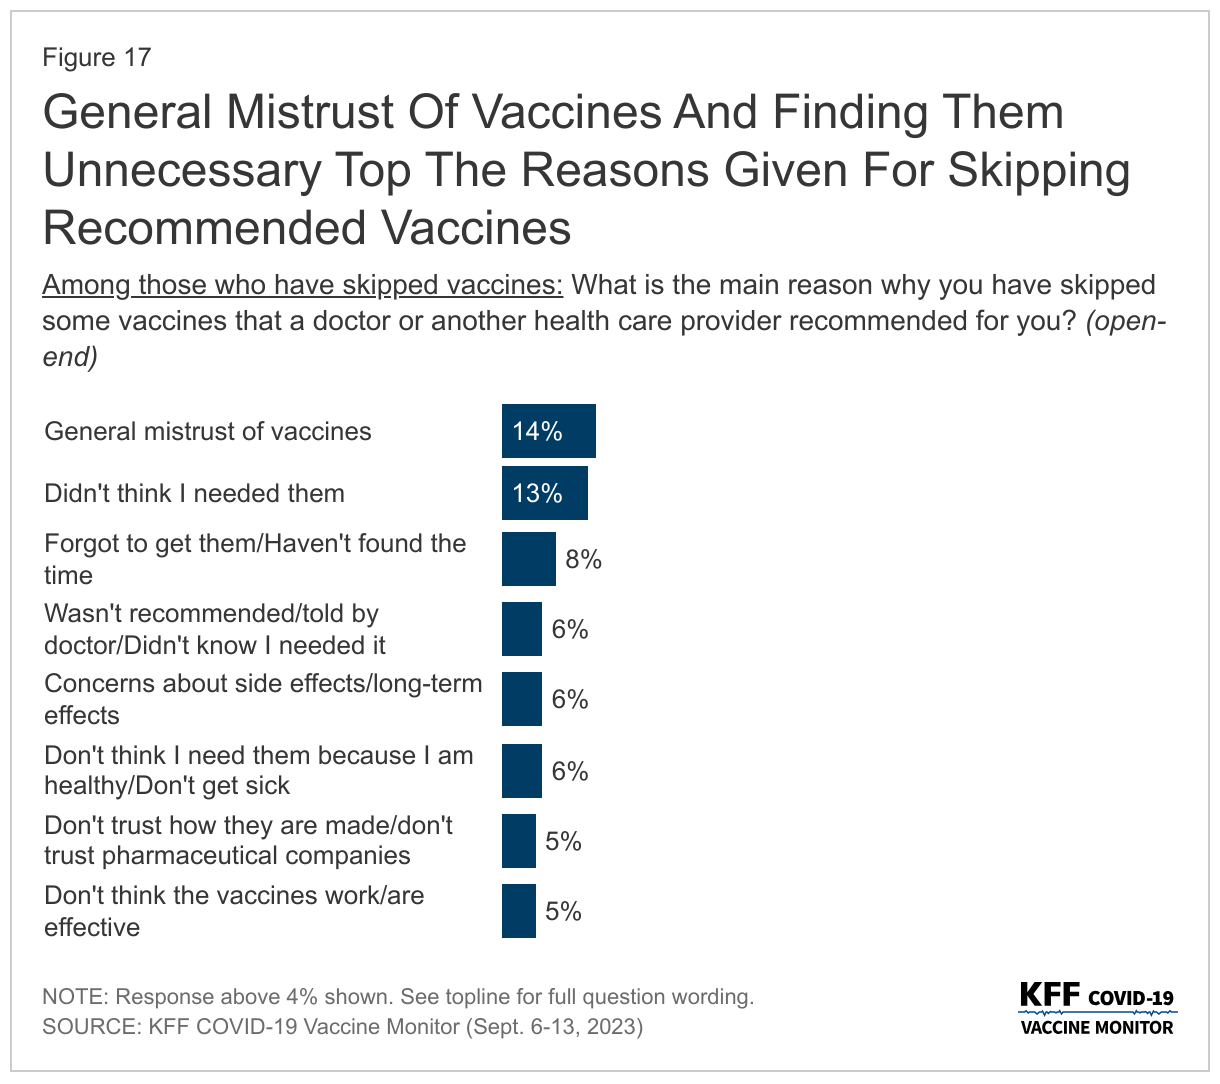
When asked the main reasons for skipping some recommended vaccines, the most commonly provided responses focus on general mistrust of vaccines (14%), or people not thinking they needed them (13%). Another one in ten offer responses focused on not finding the time or forgetting they needed to get them (8%). Other commonly reported responses include a doctor not recommending them or they not knowing they needed them (6%), concerns about side effects or long-term effects (6%), and not thinking they needed them specifically because they are healthy and do not typically get sick (6%). Small but significant shares also offer responses related to mistrust in the vaccines and pharmaceutical companies (5%) or thinking the vaccines do not work or are not effective (5%).
In Their Own Words: Why Have You Skipped Some Recommended Vaccines?
“I have no confidence in the safety or efficacy of vaccines. I believe they are unnecessary for generally healthy individuals.” – 62 year-old White woman, Florida
“Haven’t had a chance to go to local pharmacy to get one.” – 74 year-old Hispanic woman, New Jersey
“I don’t believe I will get sick, I don’t have insurance, visiting the doctors is a hassle, finding affordable or free healthcare assistance takes more time out of my schedule then I’ve had.” – 27 year-old Black individual (“other” gender selected), Georgia
“It’s inconvenient, and I’m completely broke.” – 24 year-old White woman, Missouri
“I trust my body to heal.” – 50 year-old White man, Montana
Most Parents get Recommended vaccines for children
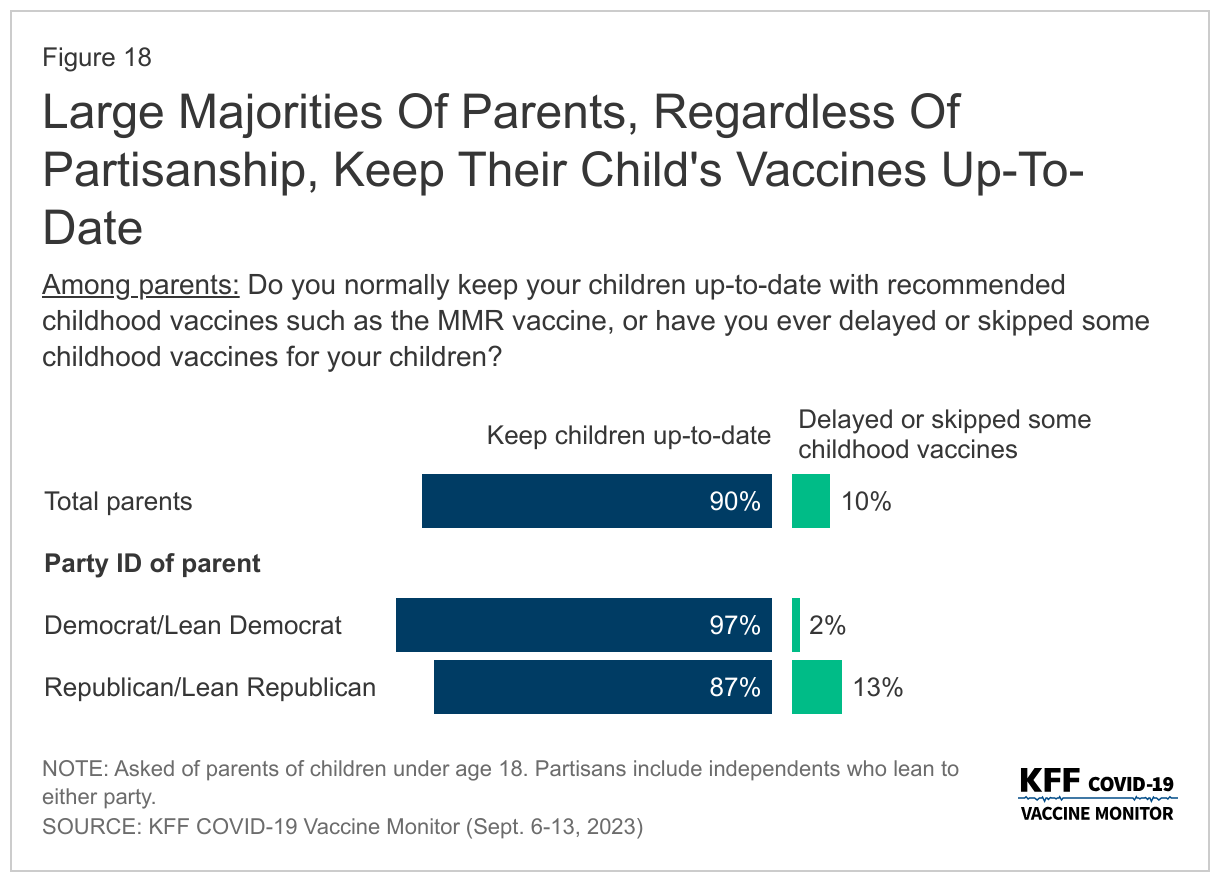
Adherence to recommended vaccines is higher among children than adults overall. Nine in ten parents say they normally keep their child or children up-to-date with recommended childhood vaccines, such as the MMR vaccine, while one in ten say they have delayed or skipped some of their child’s vaccines.
Large majorities of parents, regardless of partisanship, race and ethnicity and income, say they keep their child up-to-date including nearly all Democratic and Democratic-leaning parents (97%) and about nine in ten Republican or Republican-leaning parents.
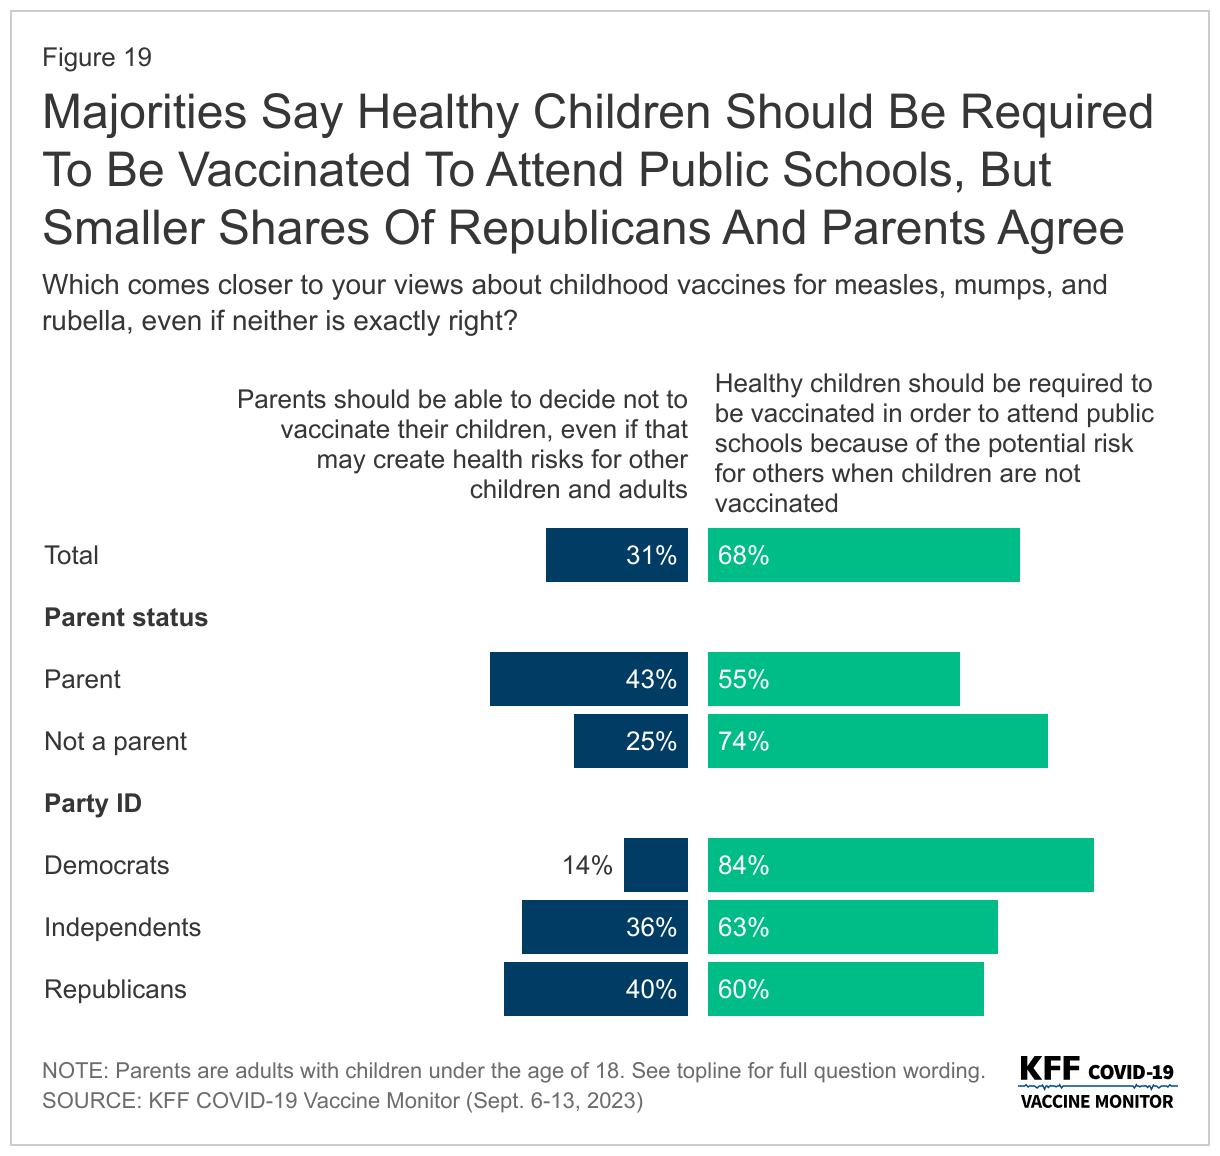
The share of parents who report keeping their child updated with vaccines is unchanged since July 2021. While confidence in vaccines, such as the measles, mumps, and rubella, or MMR vaccine, remains high, the debate over COVID-19 vaccines and some government mandates has spilled over into attitudes towards requiring vaccines for public schools. Currently, all states and the District of Columbia require children to be vaccinated against certain diseases, including measles, mumps, and rubella, in order to attend public schools, though exemptions are allowed in certain circumstances.
Most adults (68%)1 say healthy children should be required to be vaccinated against MMR in order to attend public schools because of the potential risk for others when children are not vaccinated, compared to three in ten (31%) who say parents should be able to decide not to vaccinate their children, even if that may create risks for other children and adults. Parents are more likely than adults without children under the age of 18 in their home to say parents should be able to decide whether or not to vaccinate their children (43% compared to 25%). A majority of parents (55%) still say vaccines should be required to attend public school.
Among all adults, a larger share but still a minority of Republicans (40%) say parents should be able to decide, while a large majority of Democrats say healthy children should be required to be vaccinated.
Late-Summer COVID-19 Wave and Who Is Still Taking COVID-19 Tests
Although the COVID-19 wave is difficult to track with the end of federal COVID-19 case tracking, earlier this month the CDC reported on an increase in virus-related hospitalization rates and deaths suggesting a late-summer COVID-19 wave.
Six in ten adults believe there is a new wave of COVID-19 infections hitting the U.S now, while nearly four in ten (37%) say there is not a new COVID-19 wave. Larger shares of Democrats and those who have received at least one COVID-19 vaccine say there is a new wave hitting the U.S., with three in four Democrats (77%) and seven in ten (69%) vaccinated adults saying they think there is a COVID-19 wave. Republicans are more equally divided with similar shares saying there is (48%) and is not (51%) a new COVID-19 wave. Most unvaccinated adults (61%) say there is not a new wave of COVID-19 infections hitting the U.S.
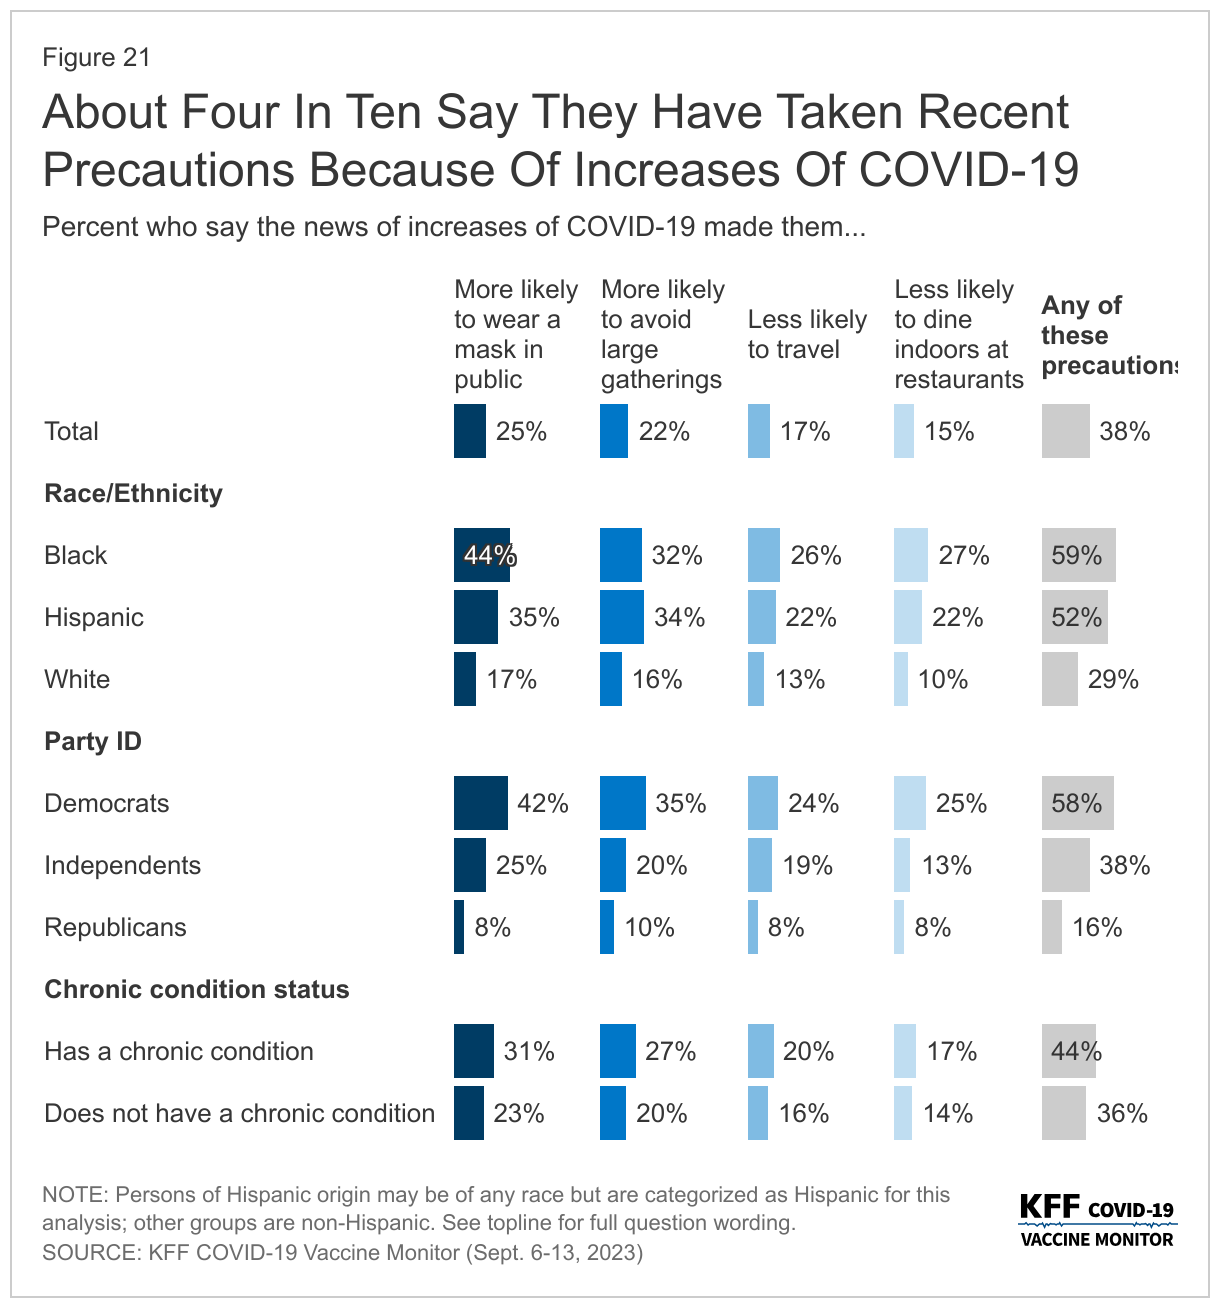
Groups that are more likely to say there is a current wave of COVID-19 cases are also more likely to report changing their behaviors because of the news of increases in COVID-19. Overall, four in ten (38%) adults say they have modified their behavior to be more COVID-conscious due to the news of the increases. This includes a quarter of adults who say they are more likely to wear a mask in public (25%) or avoid large gatherings (22%). Another one in six say the news of increases has made them less likely to travel (17%) or dine indoors at restaurants (15%).
Larger shares of Black adults (59%), Democrats (58%), Hispanic adults (52%), and people with a chronic condition (44%) say they have modified their behavior in at least one of these ways because of news of increases of COVID-19. Comparatively, smaller shares of White adults (29%), Republicans (16%), and people without a chronic condition (36%) report doing the same.
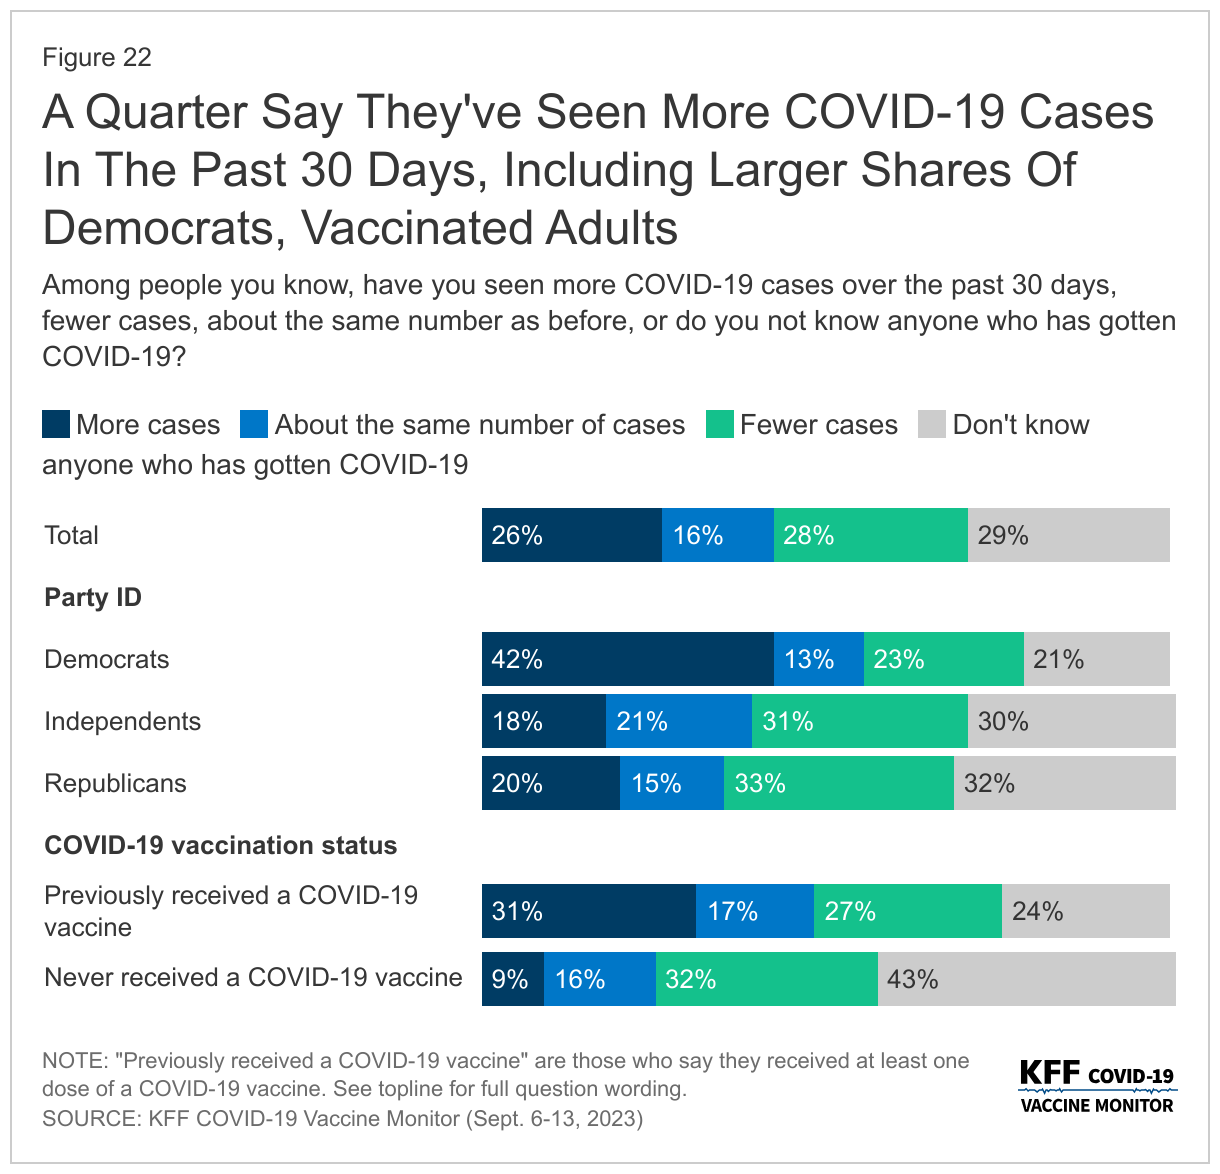
About a quarter (26%) of adults say they have personally seen “more cases” among people they know in the past 30 days. However, a similar share (28%) say they have seen “fewer cases” of COVID-19 in the past 30 days. About one in seven (16%) say they have seen the same number of cases among people they know, while three in ten (29%) say they do not know anyone who has gotten COVID-19.
Democrats (42%) and vaccinated adults (31%) are more likely to say they have seen more COVID-19 cases among people they know in the past 30 days, compared to one in five Republicans and a small share (9%) of those who have never gotten a COVID-19 vaccine.
COVID-19 Testing
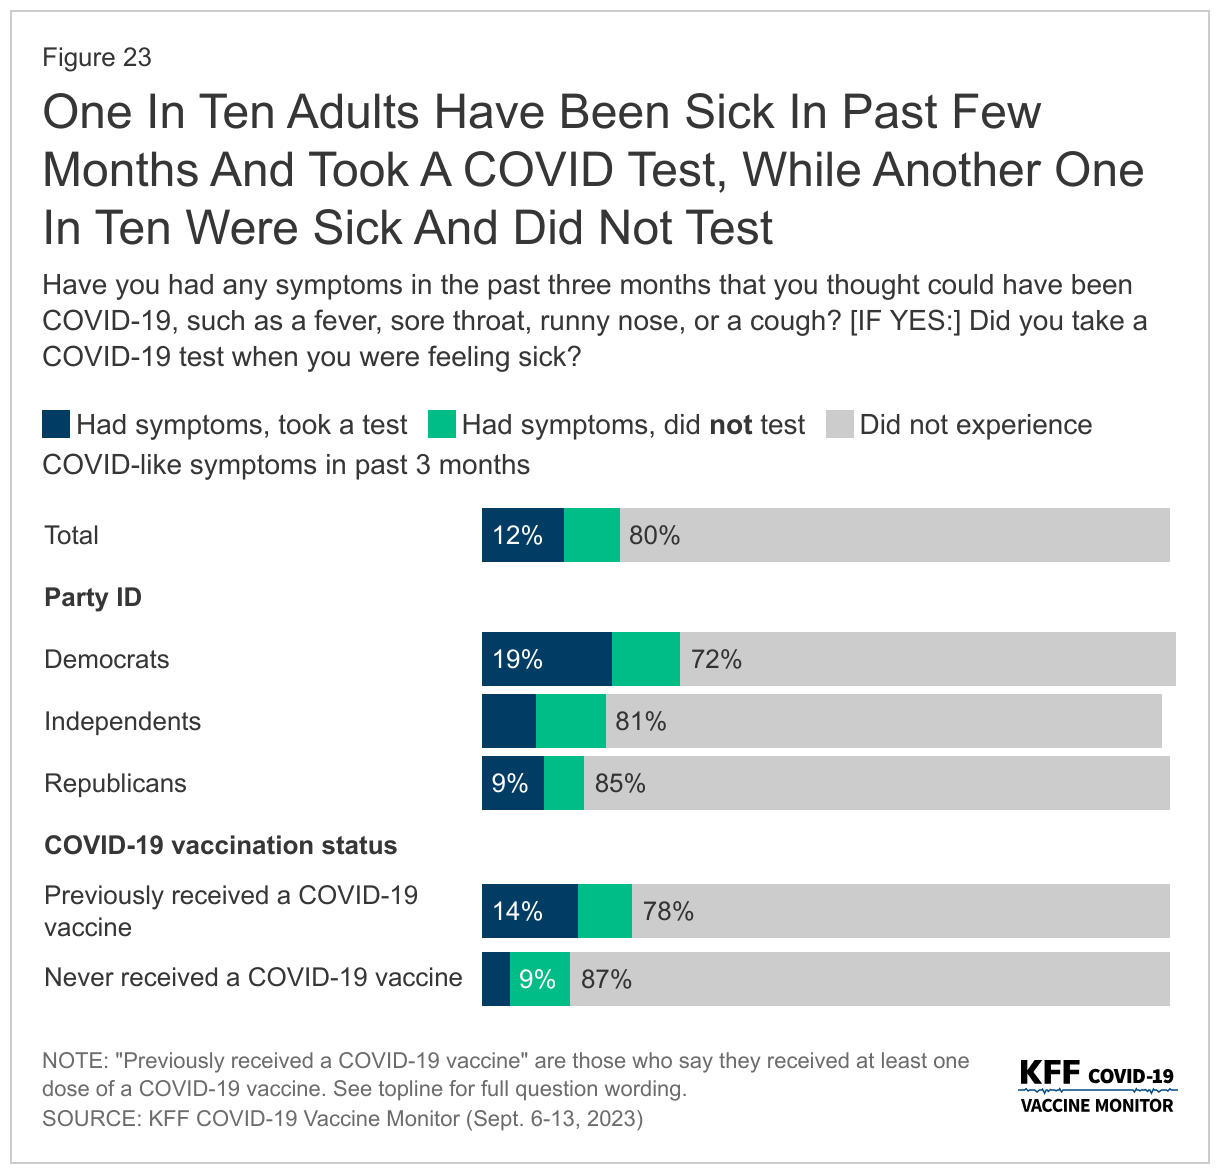
Partisanship and vaccine status are also strong drivers in the share of people who say they have taken a COVID-19 test, most likely because they are more likely than their counterparts to identify any possible symptoms of COVID. One in five adults say they have had symptoms in the past three months they thought could be COVID-19, such as a fever, sore throat, runny nose, or a cough. Among those who had such symptoms, over half say they took a test (12% of all adults), and a similar share did not take a test (8% of all adults). Democrats are more than twice as likely as both independents and Republicans to say they felt like they had COVID-19 symptoms and took a test, 19% compared to 8% and 9% respectively.
These partisan and vaccine status differences in perceptions of cases and testing for the virus are consistent with overall views of the pandemic that KFF has been tracking for the past three years. Republicans are more than three times as likely as Democrats to say the news has “generally exaggerated” the seriousness of the coronavirus (71% compared to 18%), while most Democrats say either that the news of the seriousness of COVID-19 has been generally correct (65%) or even “generally underestimated” (18%).
Some Concerns Over Costs Of Diagnostic COVID-19 Tests
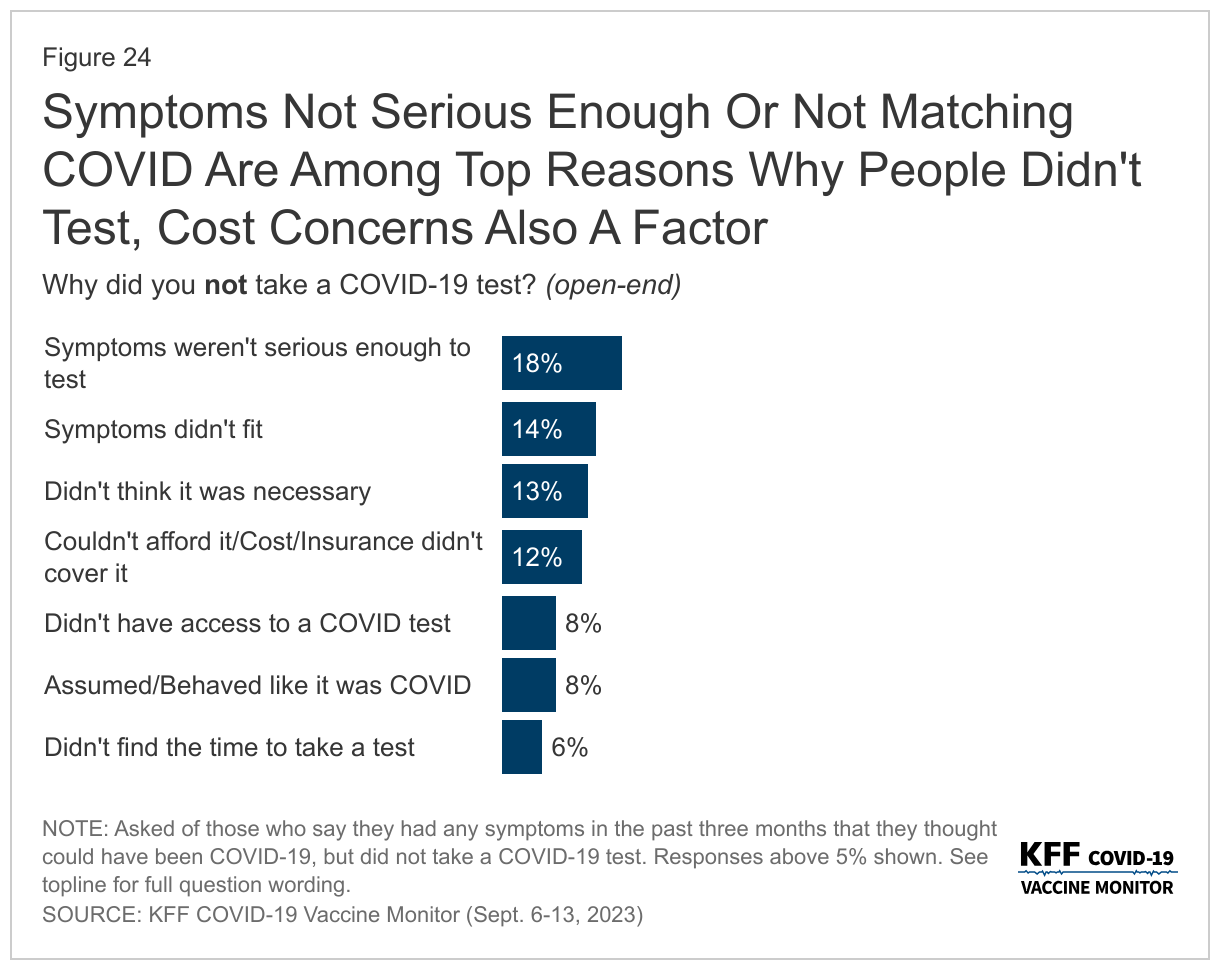
When those who said they were experiencing symptoms and did not take a test were asked why they did not get tested, the most common reasons provided were that they didn’t feel like their symptoms were serious enough to test (18%), they did not think their symptoms fit COVID-19 (14%), they did not think it was necessary for them to test (13%), or they had costs concerns about tests (12%).
These concerns over the costs of COVID-19 tests come more than three months since the end of the public health emergency and national emergency declarations related to the COVID-19 pandemic, which were put in place in early 2020 and provided some free COVID tests for people regardless of health insurance status.
Most insured people now say they are unsure whether their health insurance covers either in-home, rapid COVID-19 tests (55%) or PCR COVID-19 tests that are sent to a lab for results (61%).
While most adults do not report difficulty accessing COVID-19 tests, 15% say there was a time in the past three months when they wanted either an in-home rapid COVID-19 test or a PCR COVID-19 test and they were not able to find or afford one. The shares who report difficulty accessing and affording testing are even higher among Black and Hispanic adults and those with lower incomes. A quarter (25%) of Black adults and two in ten (21%) Hispanic adults say they had difficulty getting a test in the last three months, a larger share than the one in ten (10%) White adults who say the same. Similarly, another two in ten (21%) of those with a household income of less than $40,000 a year had difficulty, compared to smaller shares of those with higher incomes.
Overall, more than one in three adults say they would use a test they already have at home if they wanted to take a COVID-19 test (37%), while one in five say they would purchase one at a pharmacy (22%) or get one at a doctor’s office (19%). One in ten adults (11%) say they are unsure where they could get a COVID-19 test.
Note: The title on Figure 5 was updated on November 29, 2023, to better characterize the data on older adults’ intentions for getting a flu shot.