Experiences of Adults Who Have Been Incarcerated: Findings from the KFF Survey on Racism, Discrimination, and Health
Findings
Introduction
This report, based on analysis of KFF’s 2023 Racism, Discrimination, and Health Survey, focuses on the experiences of people who have been previously incarcerated and examines their social and economic circumstances as well as their physical and mental health and access to health care. The findings aim to fill in a gap in publicly available data on the experiences of people who were previously incarcerated. The goal is to provide increased understanding of the health and other basic needs of people who were previously incarcerated, rather than identifying the role incarceration plays in driving these and other outcomes.
The analysis shows that people with previous experience with incarceration have significant health needs and limited access to resources, including health care, and experience more social isolation. Some key findings include:
- Adults with prior incarceration experience report many financial challenges, including half who say they have problems affording basic living expenses. These financial hardships are particularly pronounced among previously incarcerated adults who are lower income (household incomes below $40,000) (66%), women (62%), or Black (57%). Yet, the experiences are not solely explained by the fact that many previously incarcerated adults have lower household incomes than their counterparts. When comparing the experiences among the lowest income individuals in both groups, previously incarcerated adults are more likely than those with similar incomes but no incarceration experience to report difficulty affording expenses.
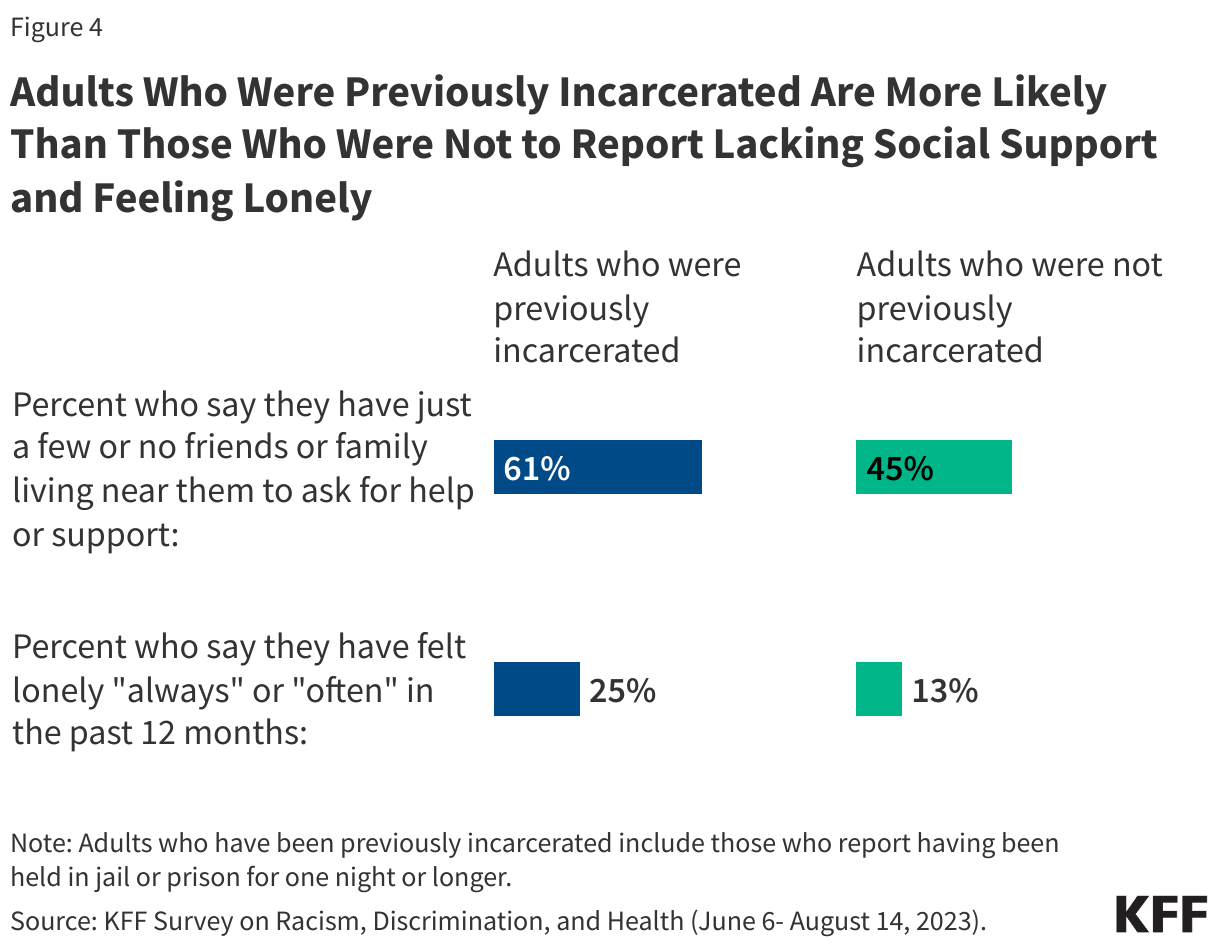
- Social support networks may be particularly important for people who have interactions with the criminal justice system, yet six in ten (61%) of those with prior incarceration experience say they have just a few or no friends or family living near them to ask for help or support. In addition, a quarter of previously incarcerated individuals say they have felt lonely either “always” or “often” in the past twelve months, almost twice the share among those without previous incarceration experience (13%).
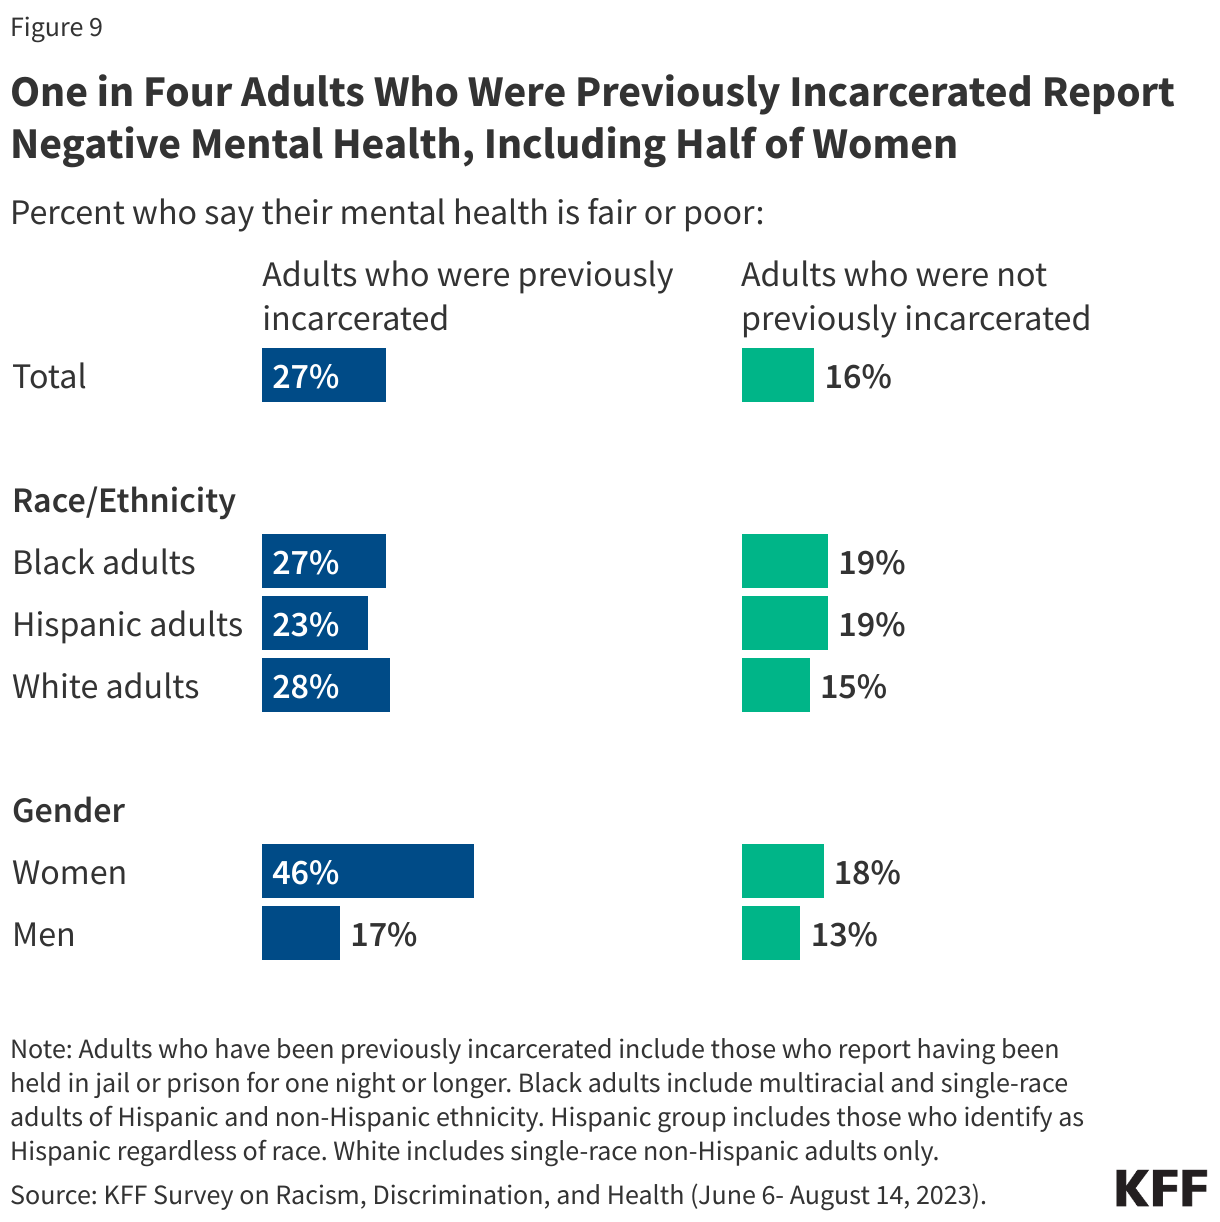
- A substantial share of adults who have been previously incarcerated report “fair” or “poor” physical health and mental health, and the disparity between those with incarceration experience and those without is even more pronounced among women. Overall, a quarter of those who have been incarcerated say their physical health is “fair” or “poor,” increasing to four in ten (39%) among women who have spent a night in jail or prison. One in four (27%) previously incarcerated adults say their mental health is “fair” or “poor,” increasing to almost half (46%) of women who have been previously incarcerated.
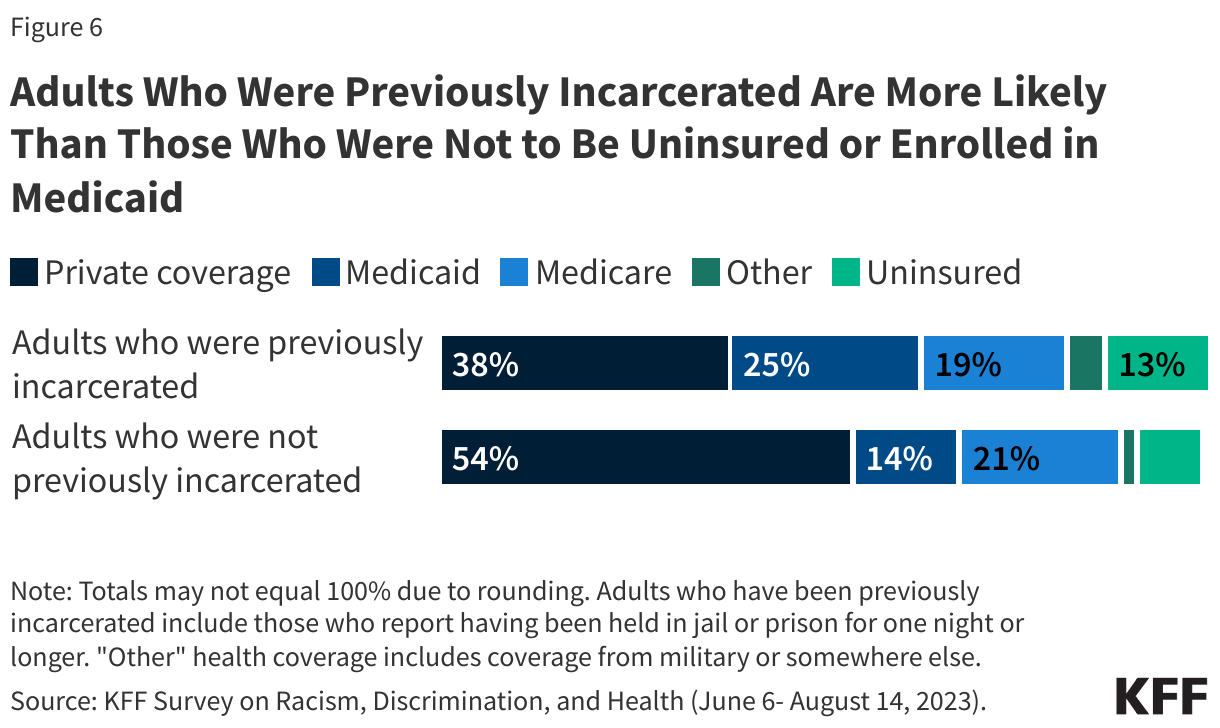
- Reflecting their lower income levels, Medicaid covers about a quarter (25%) of previously incarcerated adults compared with 14% of adults without previous incarceration experience. Although Medicaid coverage helps to fill gaps in private coverage for previously incarcerated adults, they also remain more likely than adults without incarceration experience to report being uninsured (13% vs. 8%).
- Despite significant health needs, one in five (22%) adults with previous incarceration experience say they do not have a usual source of care or go to the emergency room when they are sick or need advice about their health. One in three of those with previous incarceration experience say they skipped or postponed health care because of costs in the past year. This includes nearly four in ten (37%) women with prior incarceration experience.
- About three in ten (31%) adults with previous incarceration experience say they have received mental health services from a doctor, counselor, or other mental health professional in the last 3 years. Among those with incarceration experience, women are more than twice as likely as men to say they have received such services (53% vs. 20%), likely reflecting the higher share of women in this group who report mental health challenges. But there are still unmet needs, with almost half of those previously incarcerated who report having fair or poor mental health saying there was a time in the past three years when they needed mental health services or medication but didn’t get them.
Who Are Previously Incarcerated Adults?
One in seven (14%) U.S. adults say they have ever been held in jail or prison for one night or longer. This broad definition of previously incarcerated adults encompasses a range of experiences, including variations in how long people were incarcerated (from a single night to months or even years) and variations in how recently this experience occurred. Notably, it excludes adults who are currently incarcerated and should not be interpreted as representative of that population.
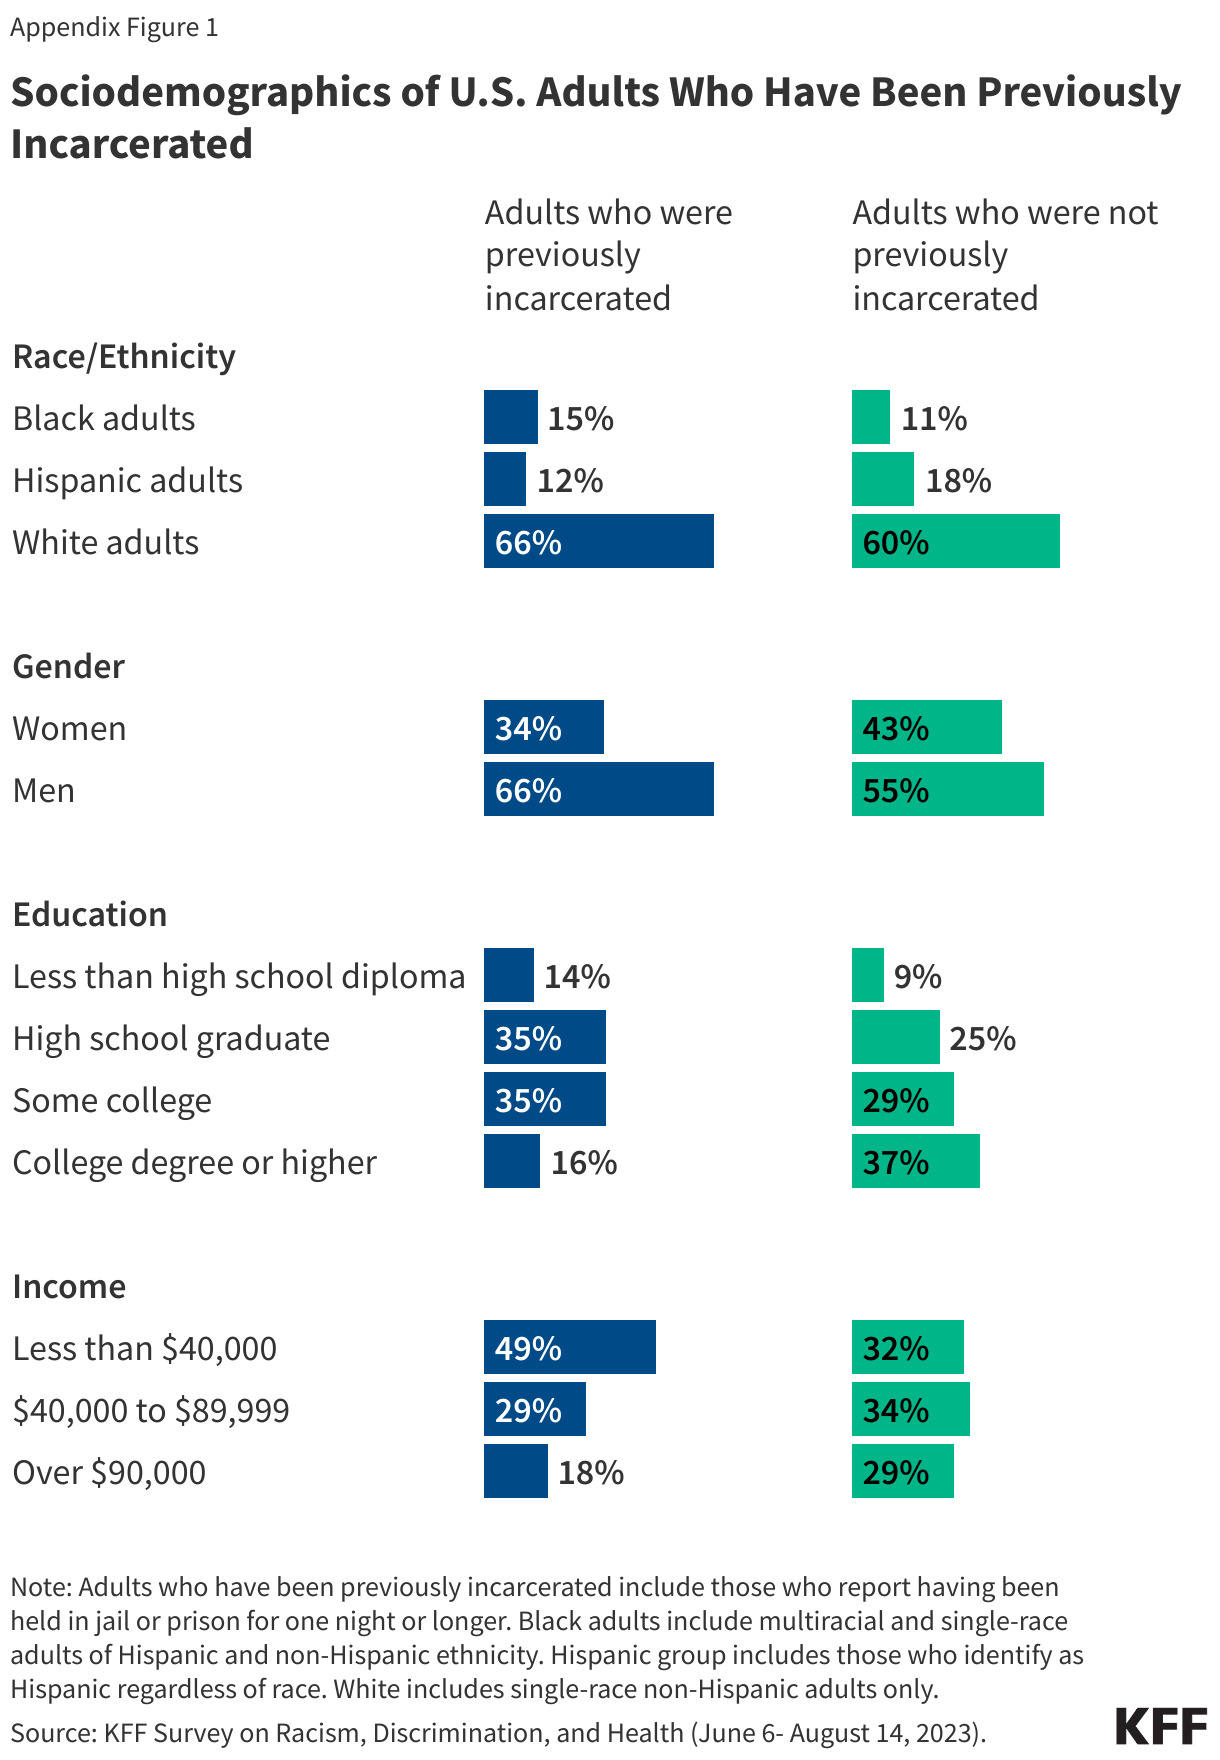
People with previous incarceration experience are more likely to identify as Black and/or American Indian and less likely to identify as Asian compared to those with no incarceration experience. While Black and Hispanic people make up disproportionate shares of the currently incarcerated population, these patterns are less pronounced among the group with any previous incarceration experience. This may be due to racial and ethnic disparities in federal sentencing.
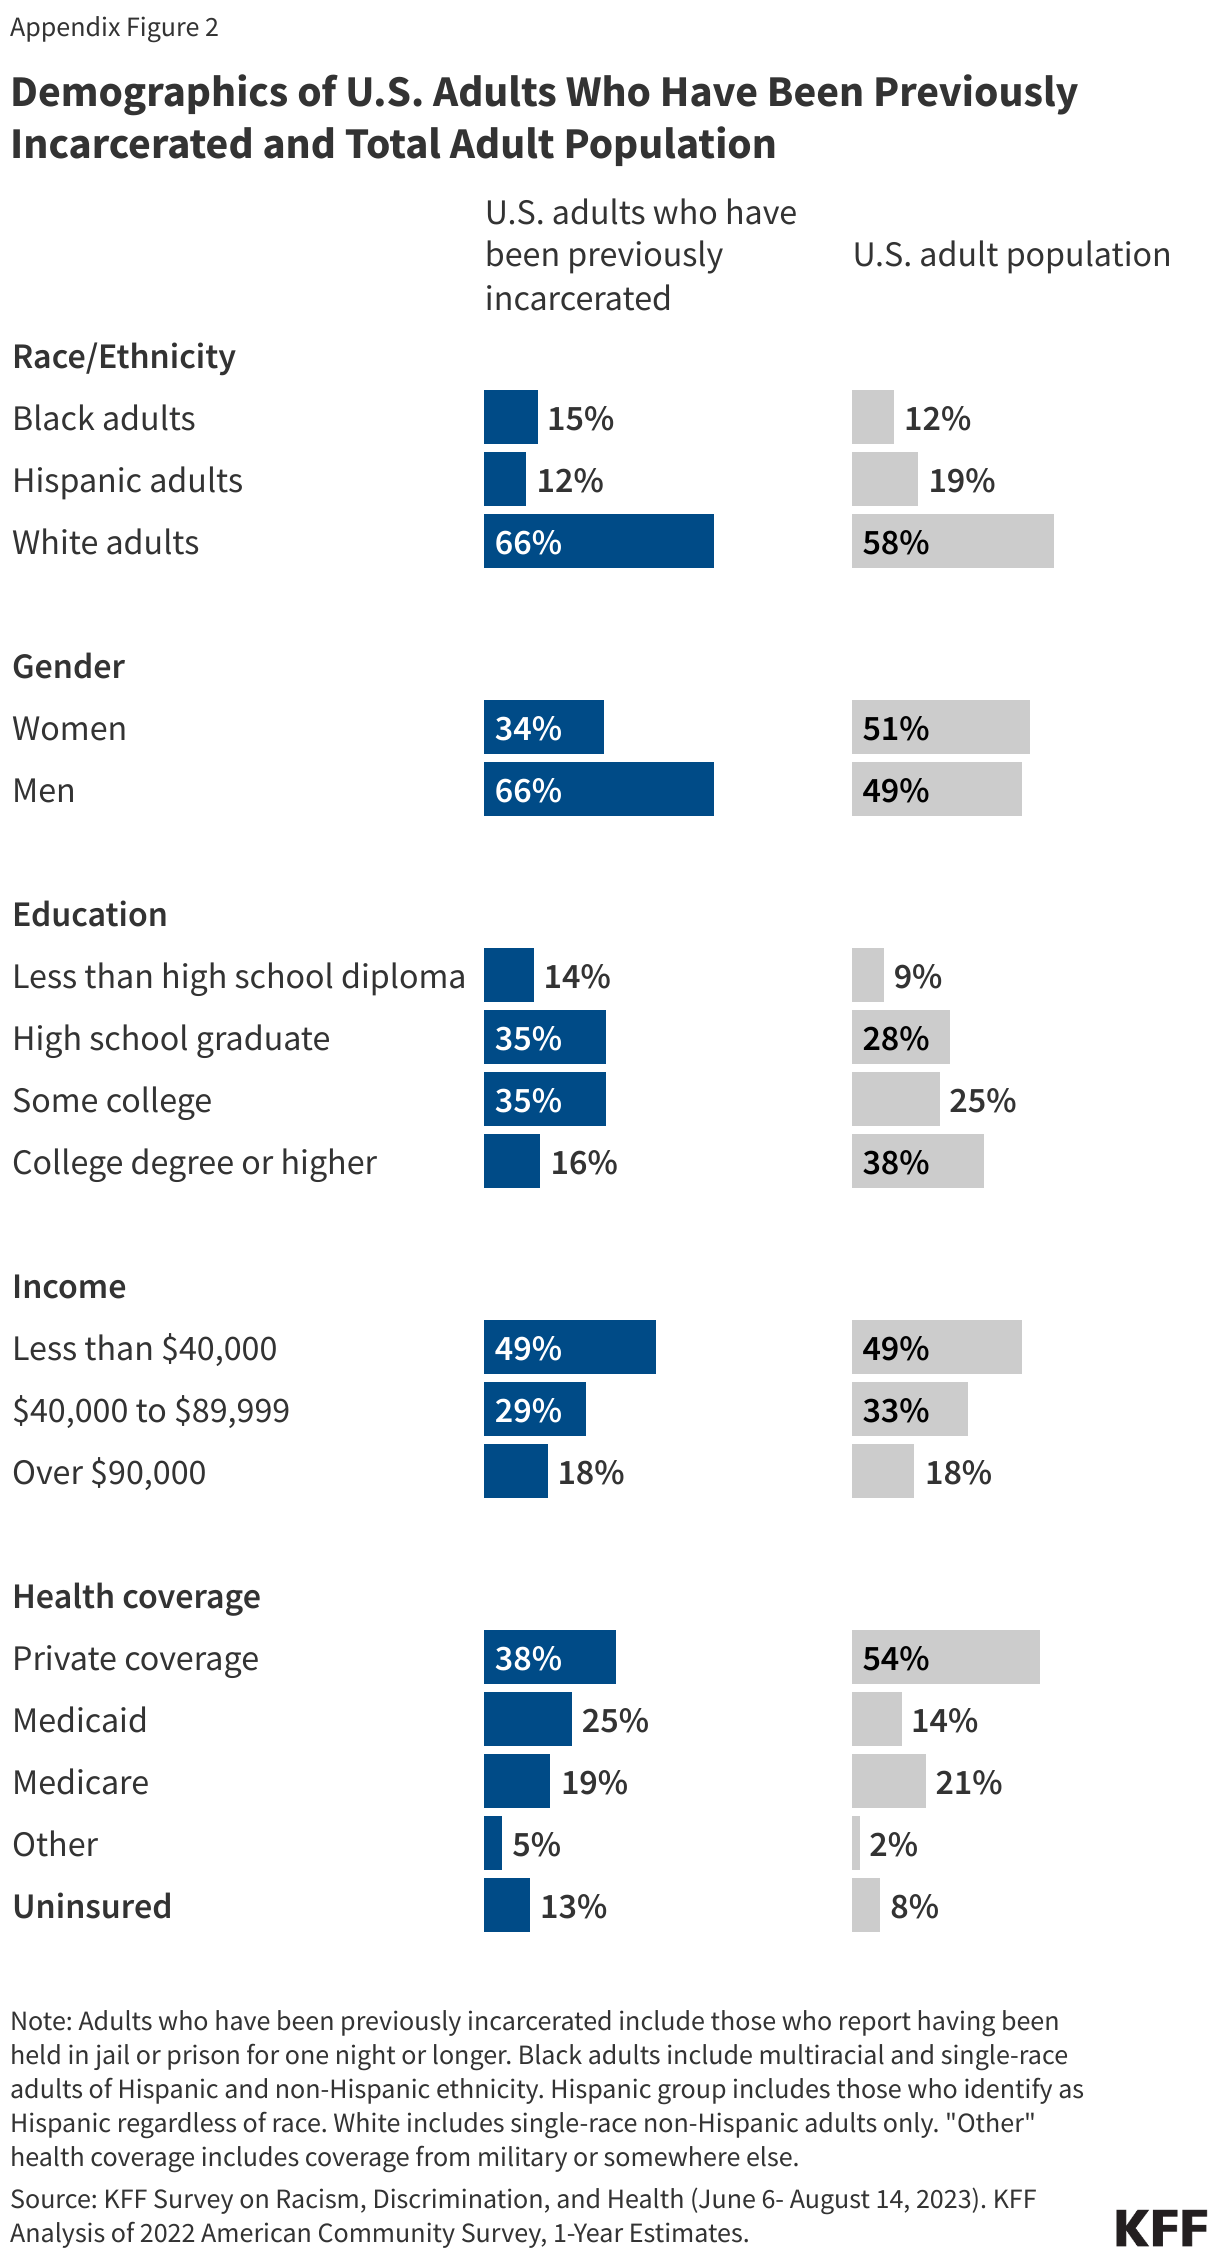
People who have been incarcerated are disproportionately male (66%), without a college degree (84%), and have incomes under $40,000 (49%). See Appendix Figure 1 for more details on the demographic profile of the population included in this analysis. Appendix Figure 2 compares estimates of this previously incarcerated definition across key demographic groups.
Economic and Social Challenges
Many adults with prior incarceration experience report facing financial challenges, including difficulty affording basic needs and paying their monthly bills. These challenges are particularly pronounced among certain groups of adults who previously incarcerated including those with lower incomes, those who are Black adults, and those who are women.
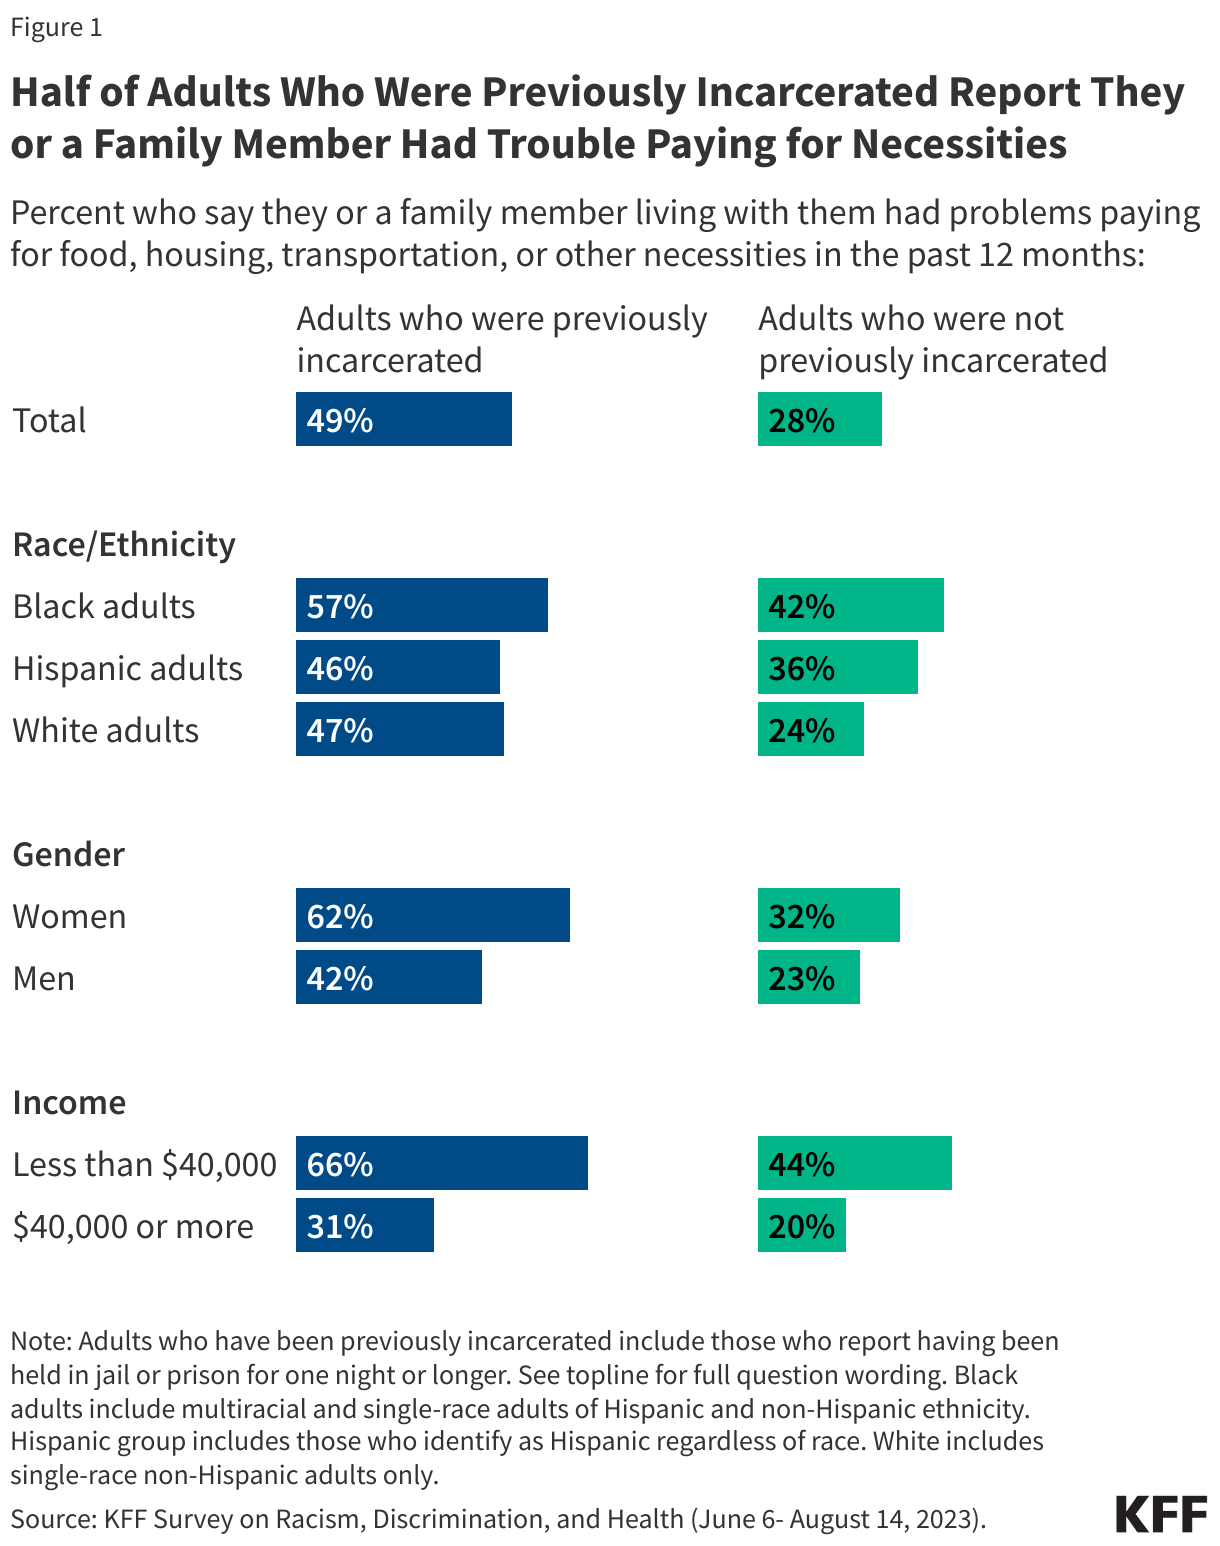
Half of adults who have been previously incarcerated say they or a family member living with them have had problems paying for food, housing, transportation, or other necessities in the past 12 months. The share rises to 57% of Black adults and 62% of women with prior incarceration experience. Overall, adults who have previously been incarcerated are more likely than those who have not to report problems paying for basic needs. While this in part reflects their lower incomes, even among adults with household incomes of less than $40,000, those who have been incarcerated are more likely to report problems paying for basic necessities than those who have not (66% vs. 44%).
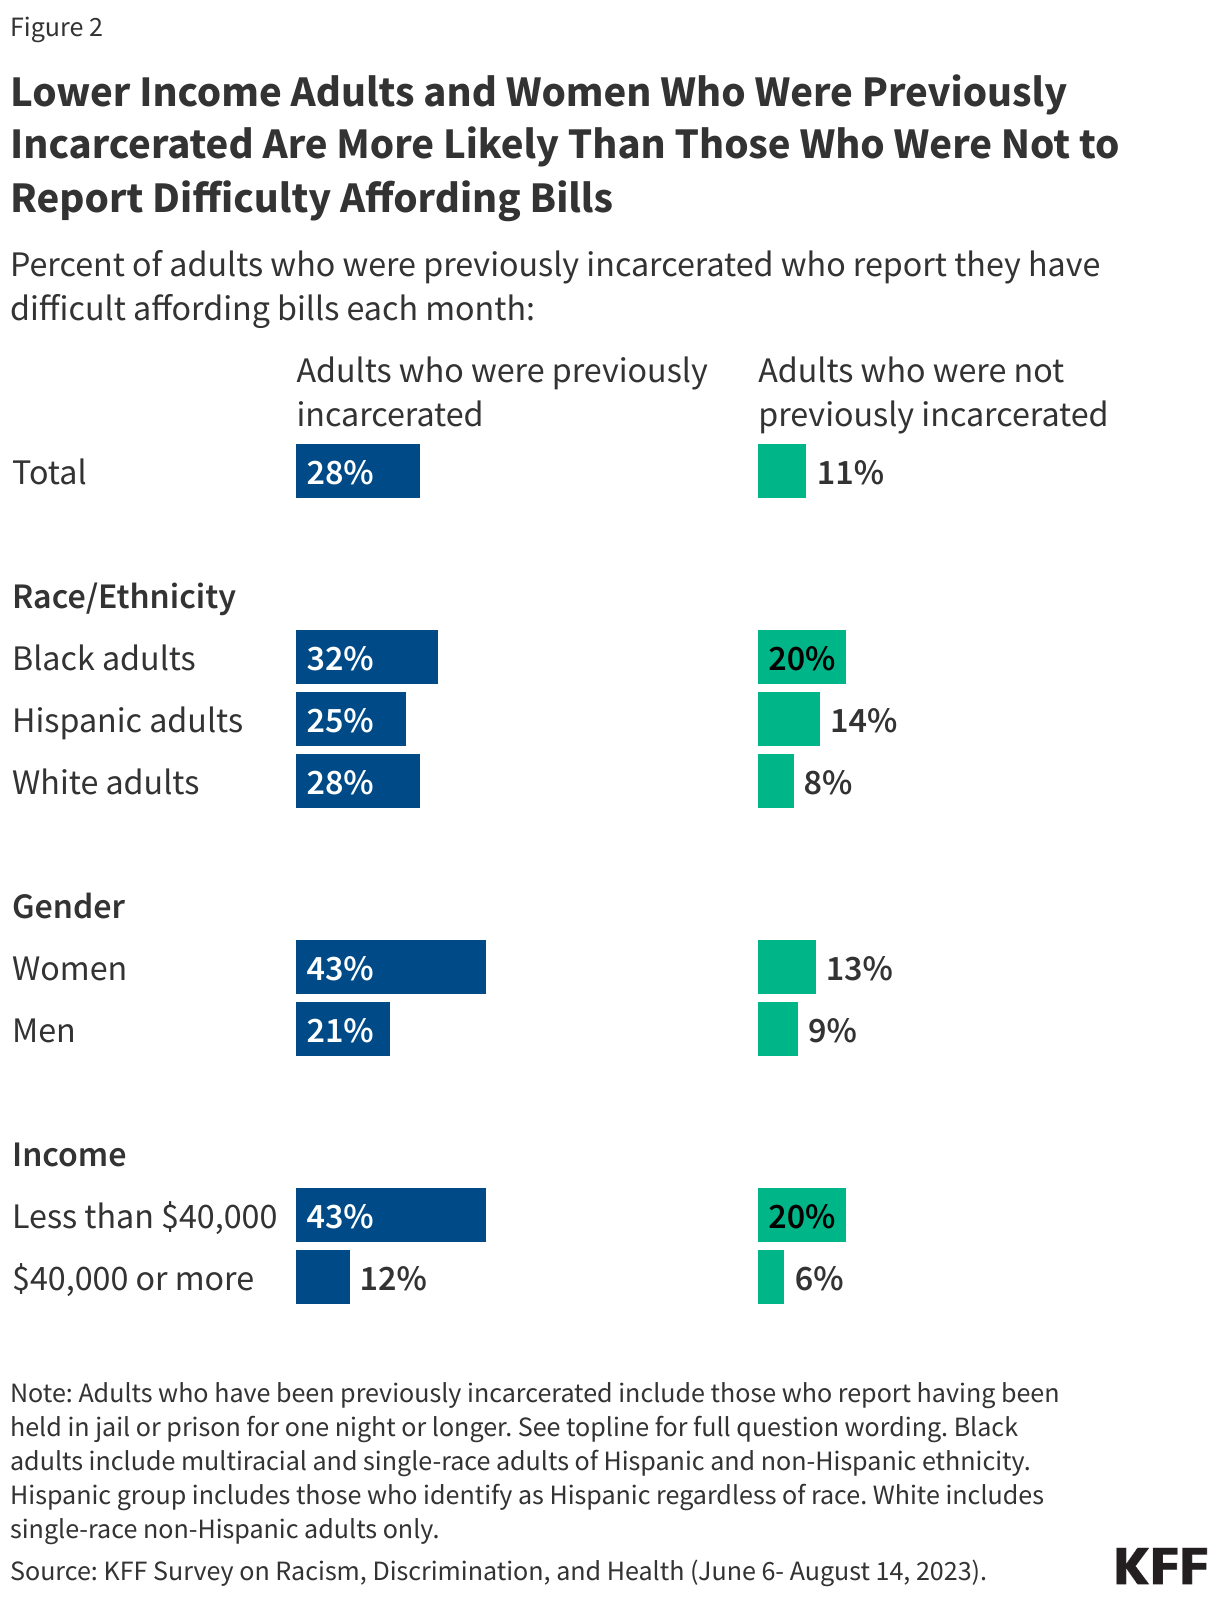
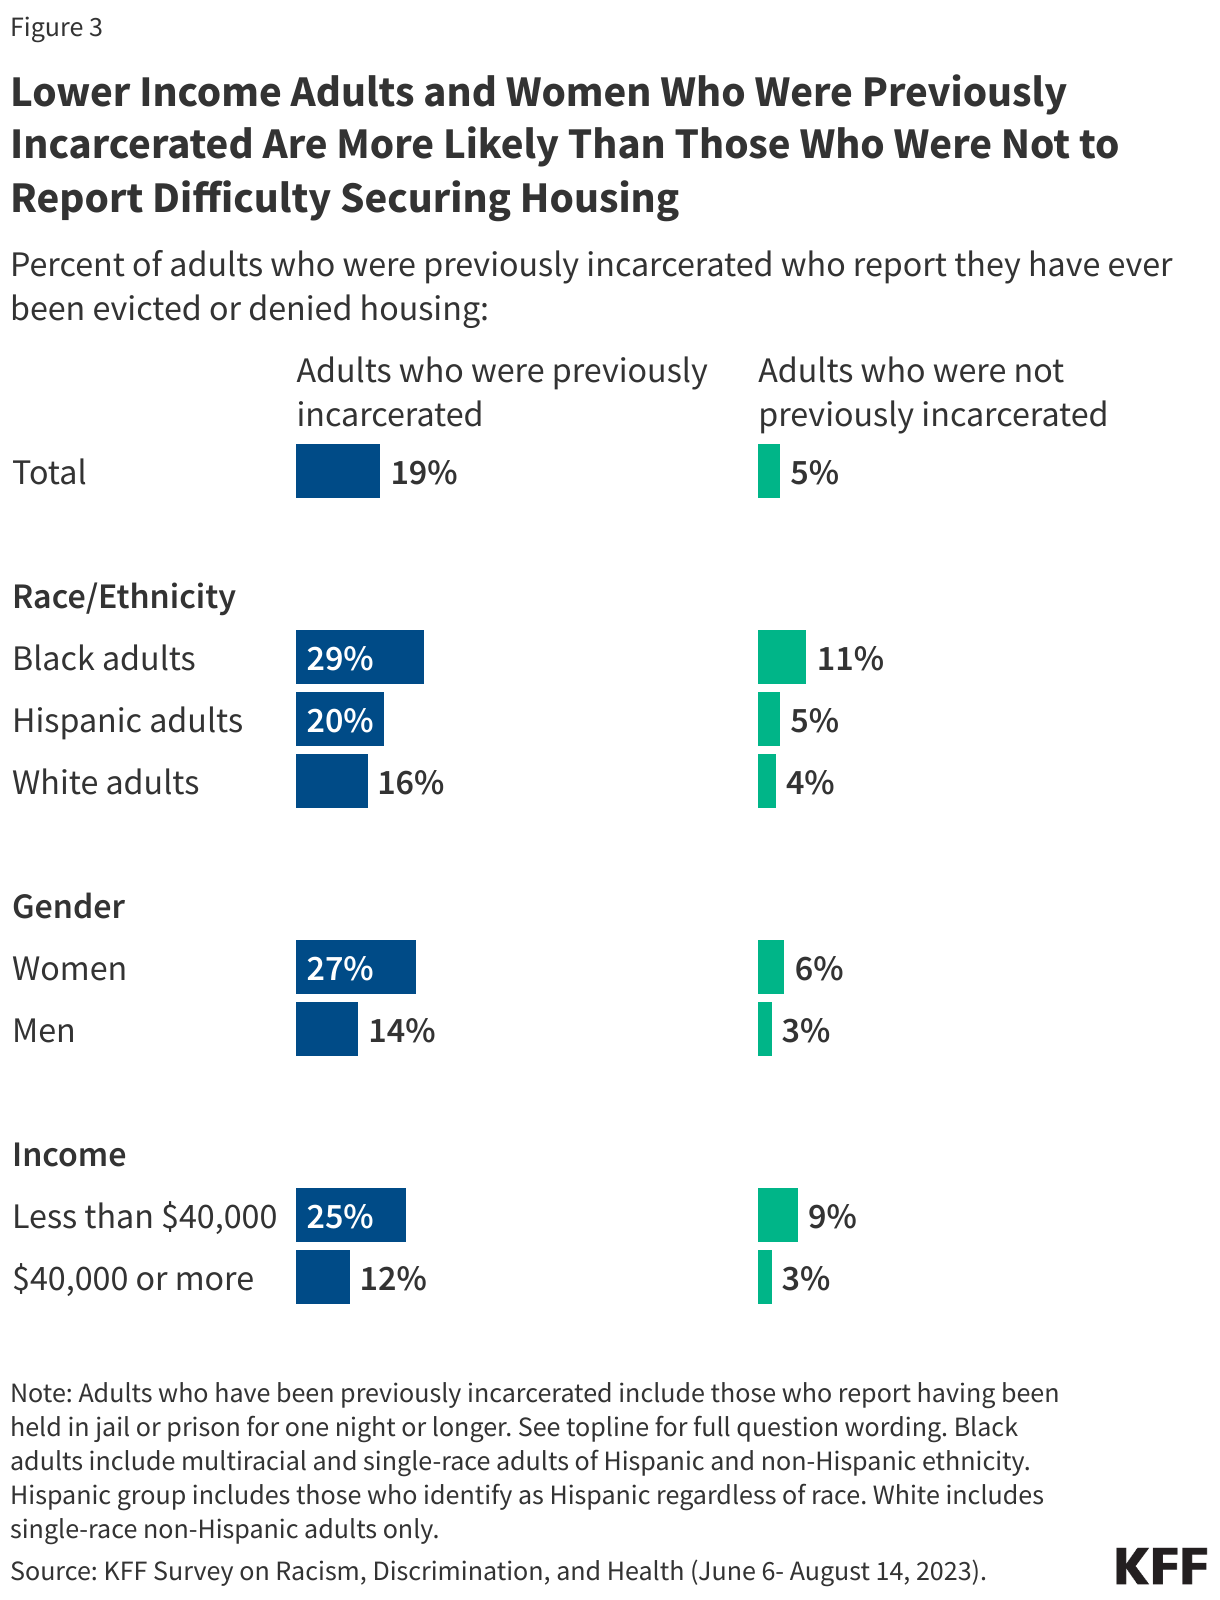
Lower-income adults and women with previous experience with being incarcerated report difficulties affording expenses and securing housing.
More than one in four adults who have been previously incarcerated say they have difficulty affording their bills each month rising to more than four in ten (43%) of those who have been previously incarcerated and have household incomes under $40,000. One in five (20%) of those earning similar incomes without incarceration experience say the same.
About one in five adults with previous experience being incarcerated report they have been evicted or denied housing, nearly four times the share of those without incarceration experience (19% v. 5%). This share rises among those with lower incomes, with one in four of those with household incomes under $40,000 saying they have been evicted or denied housing (compared to one in ten of those with similar income levels but without previous incarceration experience).
More than four in ten women with previous experience being incarcerated report difficulty affording their monthly bills and more than a quarter say they have ever been evicted or denied housing. The share of women who report such experiences is higher than the share of men with incarceration experience who report the same.
At least a quarter of previously incarcerated adults across race and ethnicity groups said they had difficulty affording bills each month (25% of Hispanic adults, 28% of White adults, and 32% of Black adults). About three in ten Black adults who were previously incarcerated also reported ever being evicted or denied housing as did one in five Hispanic adults and 16% of White adults.
Difficulty affording monthly bills or getting housing may reflect problems getting or keeping a job. One in four of those who have been previously incarcerated say in the past 12 months they or a family member living with them have had problems getting or keeping a job and 14% say they are currently unemployed.
Social Supports
Social support networks may be particularly important for people who have interactions with the criminal justice system, yet six in ten (61%) of those with prior incarceration experience say they have just a few or no friends or family living near them to ask for help or support. In addition, a quarter of previously incarcerated individuals say they have felt lonely either “always” or “often” in the past twelve months, almost twice the share among those without previous incarceration experience (13%). The share who report feeling lonely at least often increases to 42% of Black women who were previously incarcerated (compared to 20% of Black women with no incarceration experience).
Health and Health Care Access
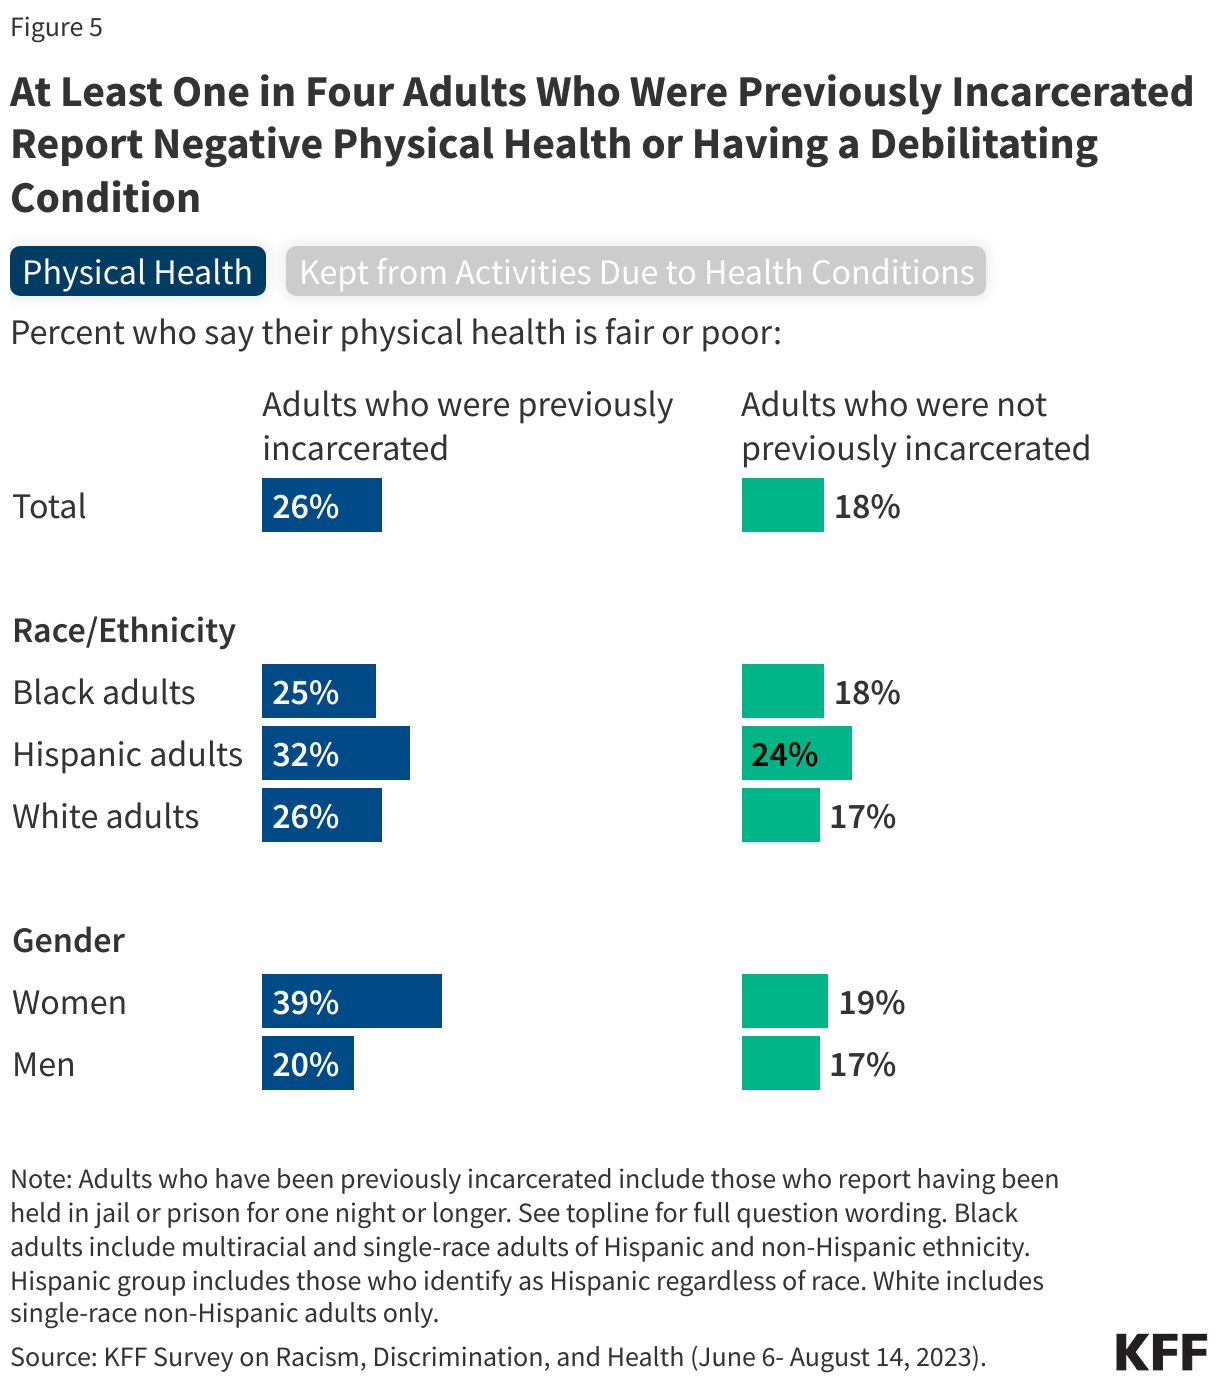
One in four adults with previous incarceration experience report being in fair or poor physical health, and three in ten report having a disability or condition that prevents them from participating fully in work or other activities, including much higher shares among women than men.
About a quarter of those who have been incarcerated say their physical health is “fair” or “poor.” The share of previously incarcerated adults who report negative physical health increases to four in ten (39%) among women, twice the share of women without such experience who say the same (19%). About one in five men, regardless of their experience being incarcerated, report the same. Similarly, while three in ten of those who have been previously incarcerated report having a physical or mental health condition or disability that keeps them from participating fully in work, school housework or other activities, it rises to four in ten among women who have been previously incarcerated.
Reflecting their lower incomes, adults with prior incarceration experience are disproportionately likely to be covered by Medicaid or uninsured. Medicaid covers a quarter (25%) of previously incarcerated adults compared with 14% of adults without previous incarceration experience. Although Medicaid coverage helps to fill gaps in private coverage for previously incarcerated adults, they remain more likely than other adults to report being uninsured (13% vs. 8%).
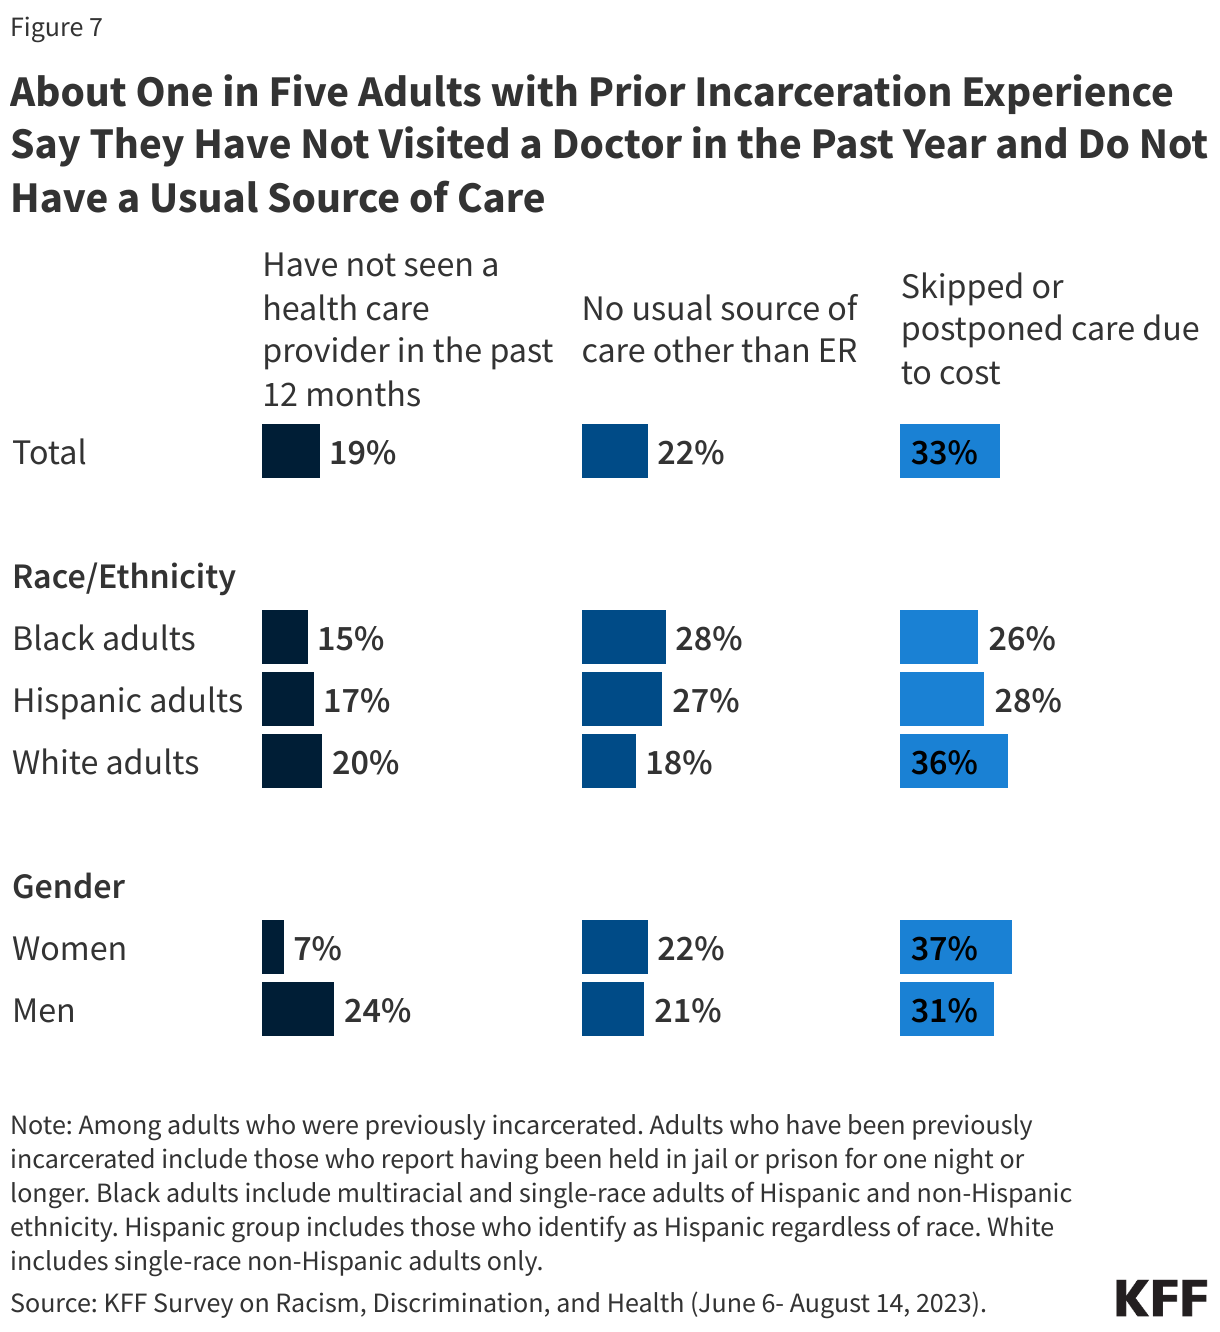
Despite their reported health care needs, about one in five (19%) people with experience being incarcerated say they have not gone to a doctor or any other health care provider about their own health in the past 12 months.
In addition, one in five adults (22%) with previous incarceration experience say they do not have a usual source of care or go to the emergency room when they are sick or need advice about their health. One in three of those with previous incarceration experience say they skipped or postponed health care because of costs in the past year. This includes nearly four in ten (37%) women and nearly a third of men (31%).
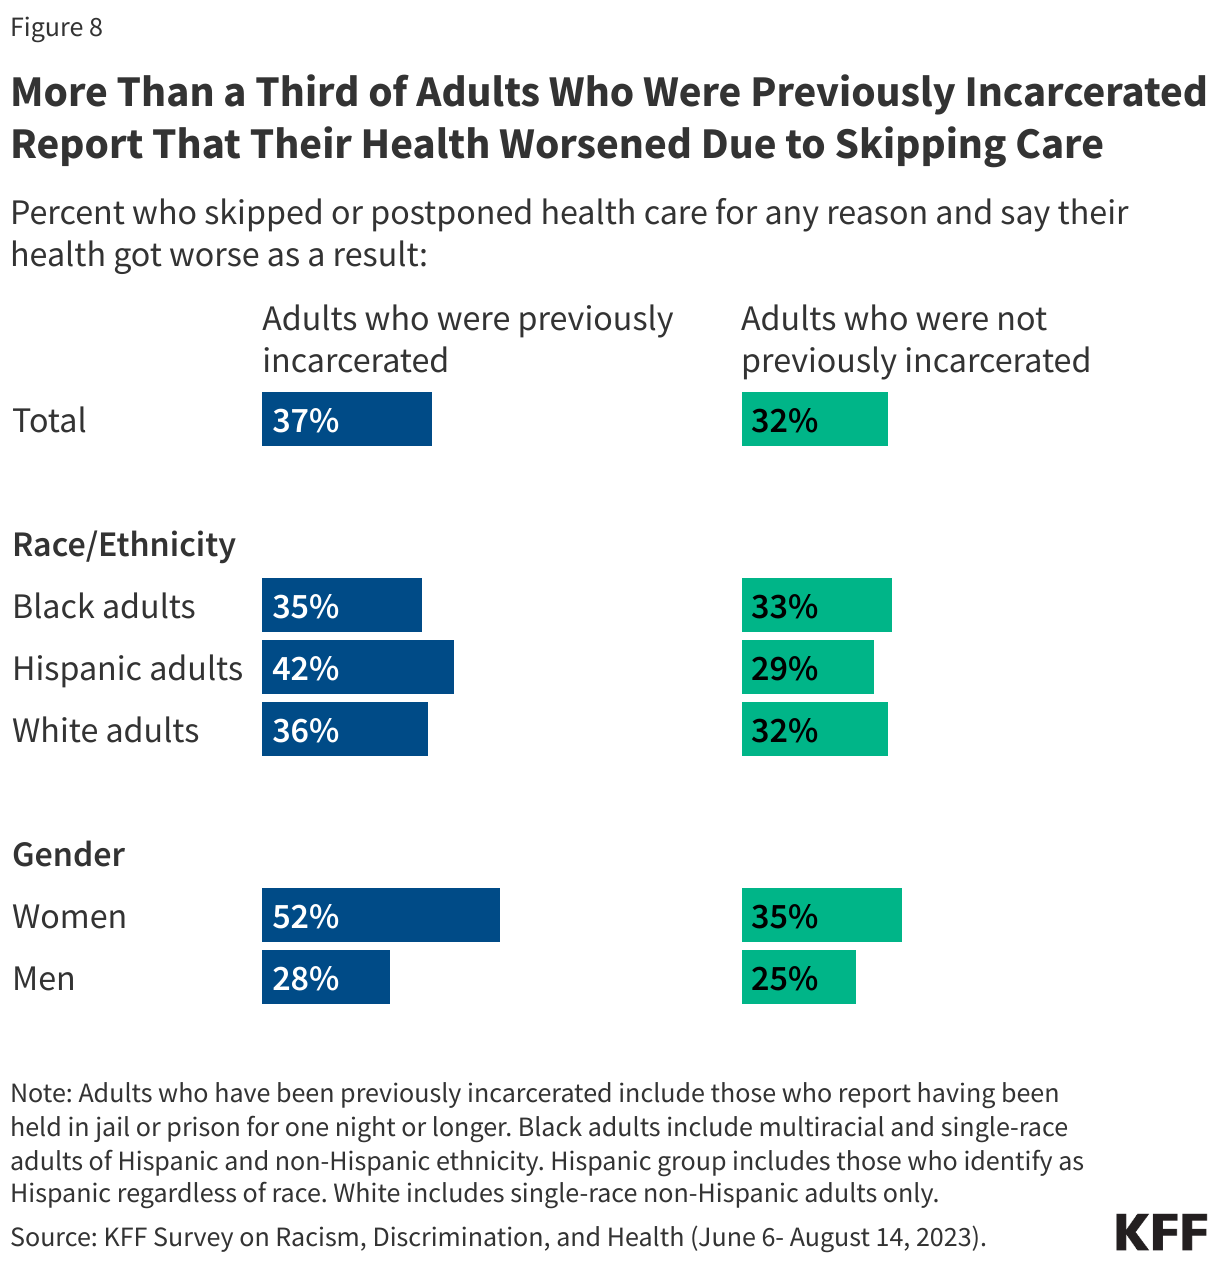
In all, 37% previously incarcerated individuals say they skipped or postponed care for any reason and their health got worse because of it, rising to half (52%) of women with previous incarceration experience.
While previously incarcerated individuals are less likely to report using health care compared to those with no incarceration experience, this does not necessarily reflect a lack of concern about their health. One in five previously incarcerated individuals say they experienced worry or stress related to their health almost every day or even more often than that in the past 30 days, including one in ten (10%) who say they experienced it every day.
Mental Health Care
A substantial share of previously incarcerated adults, including even larger shares of women, report difficulties with their mental health and barriers to accessing mental health care.
One in four (27%) previously incarcerated adults say that their mental health is “fair” or “poor,” increasing to almost half (46%) of women who have been previously incarcerated. That includes about a quarter of previously incarcerated adults across and racial and ethnic groups.
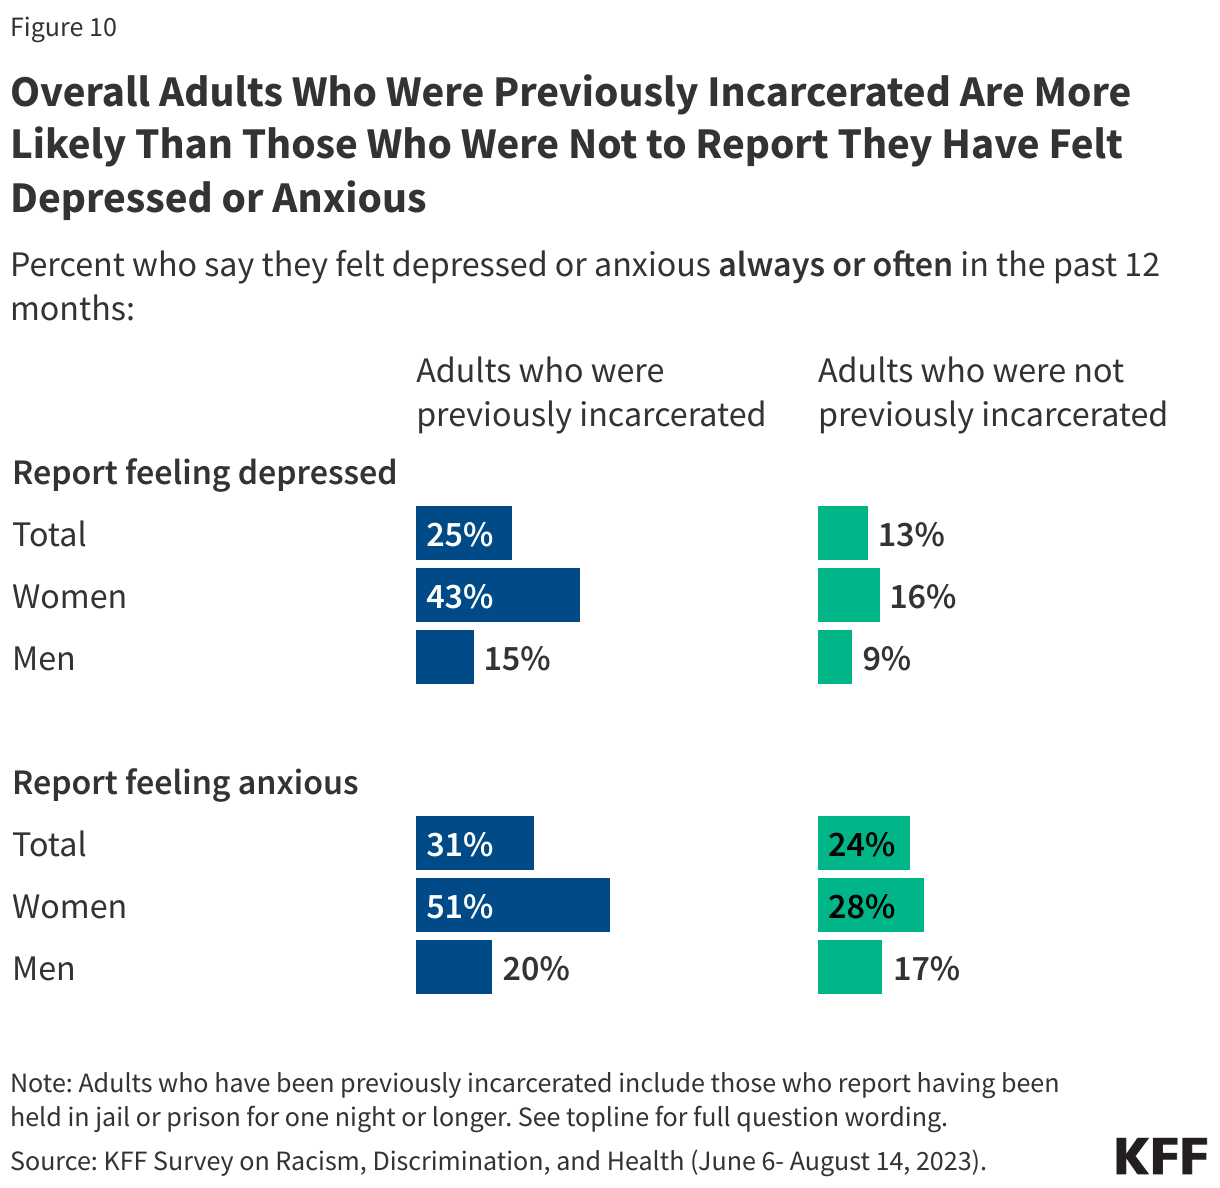
In addition, one in four previously incarcerated individuals say they have felt depressed always or often in the past 12 months, increasing to 43% of previously incarcerated women. Nearly one in three say they have felt anxious always or often in the past 12 months, once again increasing to half of previously incarcerated women.
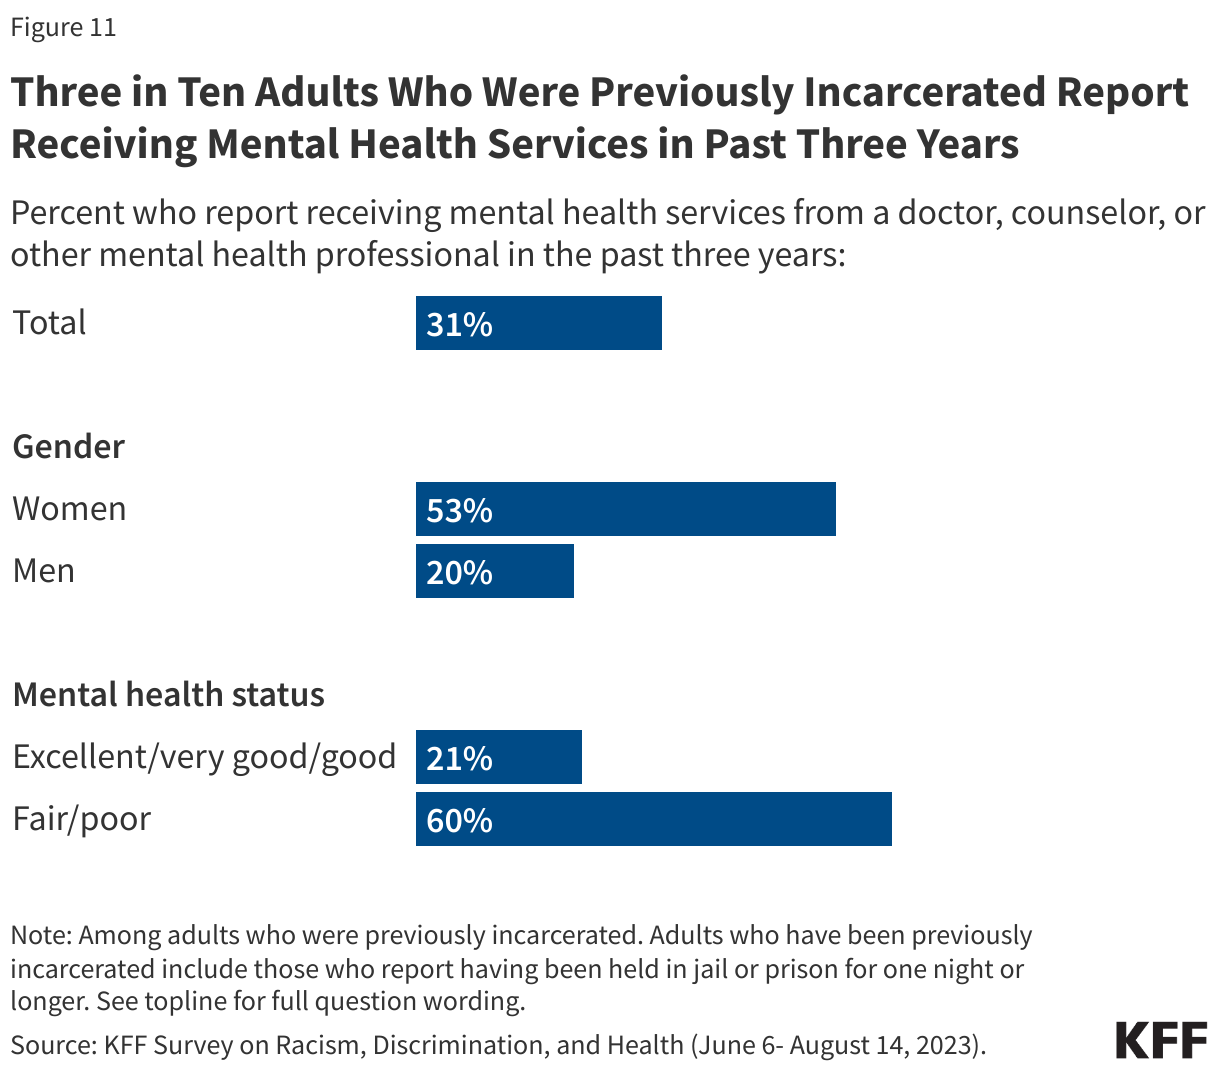
About three in ten (31%) adults with previous incarceration experience say they have received mental health services from a doctor, counselor, or other mental health professional in the last 3 years. Among those with incarceration experience, women are more than twice as likely as men to say they have received such services, likely reflecting the higher share of women in this group who report mental health challenges. In addition, six in ten previously incarcerated adults who report having fair or poor mental health say they have received mental health care services in the past three years.
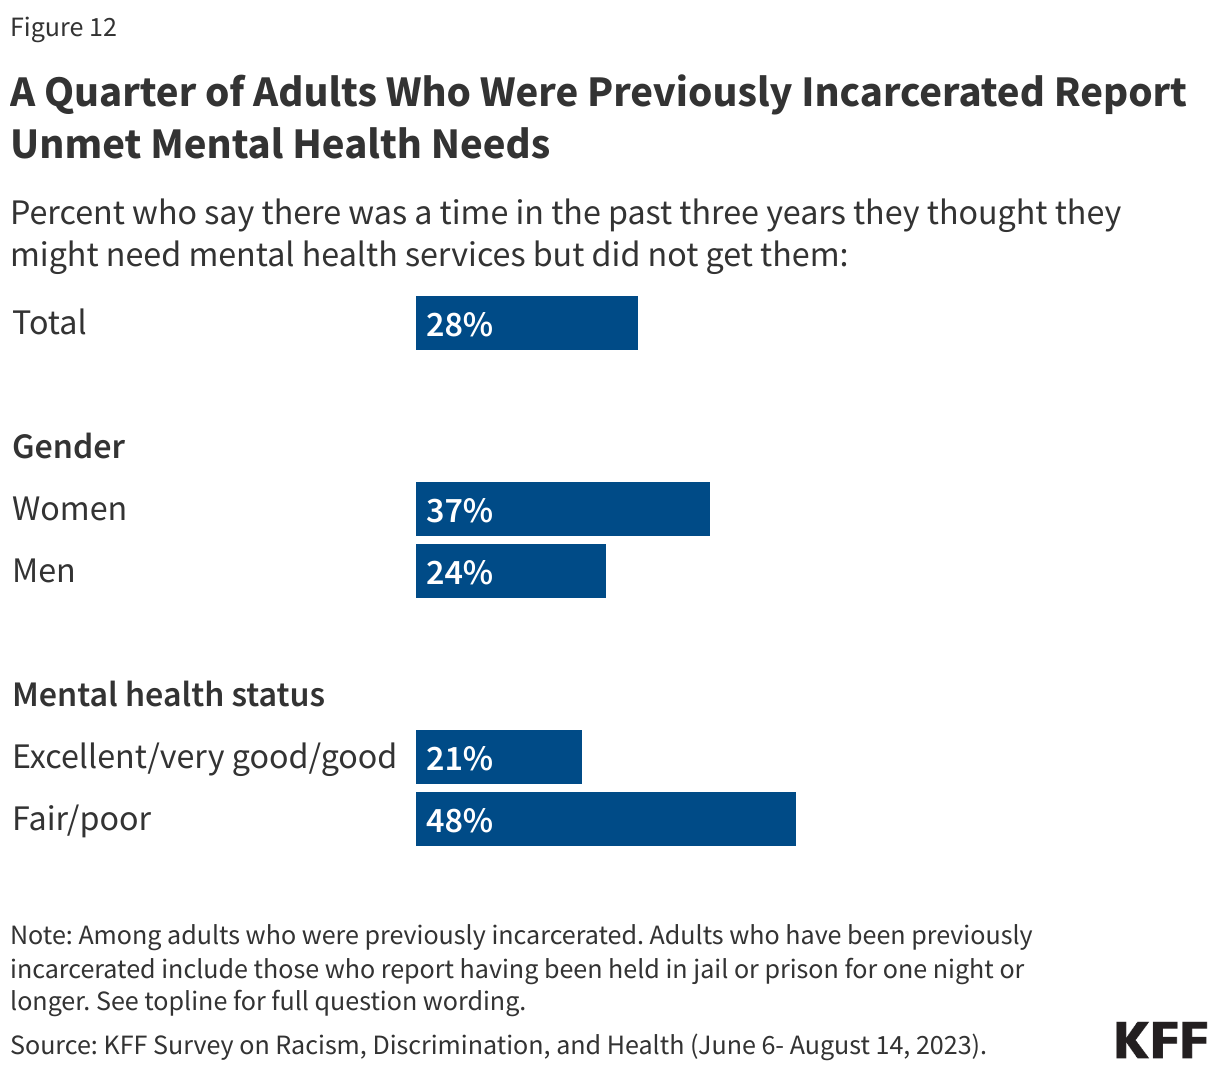
But there are still unmet needs with about a quarter saying they didn’t receive mental health services or medications they needed in the past three years. The share who report this increases to nearly half (48%) of those previously incarcerated who report having fair or poor mental health and women (37%).
Methodology
The Survey on Racism, Discrimination, and Health was designed and analyzed by researchers at KFF. The survey was conducted June 6 – August 14, 2023, online and by telephone among a nationally representative sample of 6,292 U.S. adults in English (5,706), Spanish (520), Chinese (37), Korean (16), and Vietnamese (13).
The sample includes 5,073 adults who were reached through an address-based sample (ABS) and completed the survey online (4,529) or over the phone (544). An additional 1,219 adults were reached through a random digit dial telephone (RDD) sample of prepaid (pay-as-you-go) cell phone numbers. Marketing Systems Groups (MSG) provided both the ABS and RDD sample. All fieldwork was managed by SSRS of Glen Mills, PA; sampling design and weighting was done in collaboration with KFF.
Sampling strategy:
The project was designed to reach a large sample of Black adults, Hispanic adults, and Asian adults. To accomplish this, the sampling strategy included increased efforts to reach geographic areas with larger shares of the population having less than a college education and larger shares of households with a Hispanic, Black, and/or Asian resident within the ABS sample, and geographic areas with larger shares of Hispanic and non-Hispanic Black adults within the RDD sample.
The ABS was divided into areas (strata) based on the share of households with a Hispanic, Black, and/or Asian resident, as well as the share of the population with a college degree within each Census block group. To increase the likelihood of reaching the populations of interest, strata with higher incidence of Hispanic, Black, and Asian households, and with lower educational attainment, were oversampled in the ABS design. The RDD sample of prepaid (pay-as-you-go) cell phone numbers was disproportionately stratified to reach Hispanic and non-Hispanic Black respondents based on incidence of these populations at the county level.
Incentives:Respondents received a $10 incentive for their participation, with interviews completed by phone receiving a mailed check and web respondents receiving a $10 electronic gift card incentive to their choice of six companies, a Visa gift card, or a CharityChoice donation.
Community and expert input:Input from organizations and individuals that directly serve or have expertise in issues facing historically underserved or marginalized populations helped shape the questionnaire and reporting. These community representatives were offered a modest honorarium for their time and effort to provide input, attend meetings, and offer their expertise on dissemination of findings.
Translation:After the content of the questionnaire was largely finalized, SSRS conducted a telephone pretest in English and adjustments were made to the questionnaire. Following the English pretest, Cetra Language Solutions translated the survey instrument from English into the four languages outlined above and checked the CATI and web programming to ensure translations were properly overlayed. Additionally, phone interviewing supervisors fluent in each language reviewed the final programmed survey to ensure all translations were accurate and reflected the same meaning as the English version of the survey.
Data quality check:A series of data quality checks were run on the final data. The online questionnaire included two questions designed to establish that respondents were paying attention and cases were monitored for data quality including item non-response, mean length, and straight lining. Cases were removed from the data if they failed two or more of these quality checks. Based on this criterion, 4 cases were removed.
Weighting:The combined cell phone and ABS samples were weighted to match the sample’s demographics to the national U.S. adult population using data from the Census Bureau’s 2021 Current Population Survey (CPS). The combined sample was divided into five groups based on race or ethnicity (White alone, non-Hispanic; Hispanic; Black alone, non-Hispanic; Asian alone, non-Hispanic; and other race or multi-racial, non-Hispanic) and each group was weighted separately. Within each group, the weighting parameters included sex, age, education, nativity, citizenship, census region, urbanicity, and household tenure. For the Hispanic and Asian groups, English language proficiency and country of origin were also included in the weighting adjustment. The general population weight combines the five groups and weights them proportionally to their population size.
A separate weight was created for the American Indian and Alaska Native (AIAN) sample using data from the Census Bureau’s 2022 American Community Survey (ACS). The weighting parameters for this group included sex, education, race and ethnicity, region, nativity, and citizenship. For more information on the AIAN sample including some limitations, adjustments made to make the sample more representative, and considerations for data interpretation, see Appendix 2.
All weights also take into account differences in the probability of selection for each sample type (ABS and prepaid cell phone). This includes adjustment for the sample design and geographic stratification of the samples, and within household probability of selection.
The margin of sampling error including the design effect for the full sample is plus or minus 2 percentage points. Numbers of respondents and margins of sampling error for key subgroups are shown in the table below. Appendix 1 provides more detail on how race and ethnicity was measured in this survey and the coding of the analysis groups. For results based on other subgroups, the margin of sampling error may be higher. All tests of statistical significance account for the design effect due to weighting. Dependent t-tests were used to test for statistical significance across the overlapping groups.
Sample sizes and margins of sampling error for other subgroups are available by request. Sampling error is only one of many potential sources of error and there may be other unmeasured error in this or any other public opinion poll. KFF public opinion and survey research is a charter member of the Transparency Initiative of the American Association for Public Opinion Research.
| Group | N (unweighted) | M.O.S.E. |
| Total | 6,292 | ± 2 percentage points |
| Race/Ethnicity | ||
| White, non-Hispanic (alone) | 1,725 | ± 3 percentage points |
| Black (alone or in combination) | 1,991 | ± 3 percentage points |
| Hispanic | 1,775 | ± 3 percentage points |
| Asian (alone or in combination) | 693 | ± 5 percentage points |
| American Indian and Alaska Native (alone or in combination) | 267 | ± 8 percentage points |
Appendix