ACA Preventive Services Are Back at the Supreme Court: Kennedy v. Braidwood

Authors: Laurie Sobel, Alina Salganicoff, and Mabel Felix
Published: Jul 17, 2025

On June 27,2025, the U.S. Supreme Court issued the opinion for Kennedy v. Braidwood Management, finding that the ACA requirement that most private insurers and Medicaid expansion programs cover preventive services recommended by the United States Preventive Services Preventive Task Force (USPSTF) with no cost-sharing is constitutional. In its decision, the Court affirmed that USPSTF members are appointed constitutionally, and the Secretary of Health and Human Services can remove USPSTF members at-will and directly review and block Task Force recommendations before they take effect.

In this case, the Supreme Court narrowly considered whether the structure of USPSTF violates the Appointments Clause, but did not review the litigants’ other claims about the Advisory Committee on Immunization Practices (ACIP), and the Health Resources and Services Administration (HRSA). The federal district court will now resume briefing on the consideration of the plaintiffs’ claim that the Secretary of Health and Human Services’ ratification of HRSA and ACIP recommendations violates the Administrative Procedure Act. For more analysis of the Court’s decision please see Kennedy v. Braidwood: The Supreme Court Upheld ACA Preventive Services but That’s Not the End of the Story.

On April 21, 2025, the Supreme Court is hearing oral arguments in Kennedy v. Braidwood Management. In this case, Braidwood Management, Christian owned businesses and six individuals in Texas, have challenged the Affordable Care Act’s (ACA) requirement to cover preventive services. The Supreme Court is narrowly considering whether the structure of the US Preventive Services Task Force (USPSTF) — an independent entity convened by the federal government that makes recommendations for preventive services that nearly all private insurances must cover without cost-sharing — violates the U.S. Constitution’s Appointments Clause. That provision states that “officers of the United States” may only be appointed by the president, subject to the advice and consent of the Senate and the litigants are claiming that the USPSTF does not have the authority to set coverage requirements. The Supreme Court is not considering the litigants’ other claims including those that the recommendations violate the Religious Freedom Restoration Act (RFRA), or their Appointment’s Clause claims about the Advisory Committee on Immunization Practices (ACIP), or the Health Resources and Services Administration (HRSA).

Even though President Trump had supported ACA repeal in his first term, his administration is  defending the lawsuit. On its face this may seem unexpected, but the outcome of the case could give the administration broader latitude to shape the recommendations issued by the entities that were originally established with the goal of providing independent analysis and review. This brief provides an overview of the most recent ACA case under review at the Supreme Court and discusses the implications of the potential rulings by the high court.

The ACA and Preventive Services

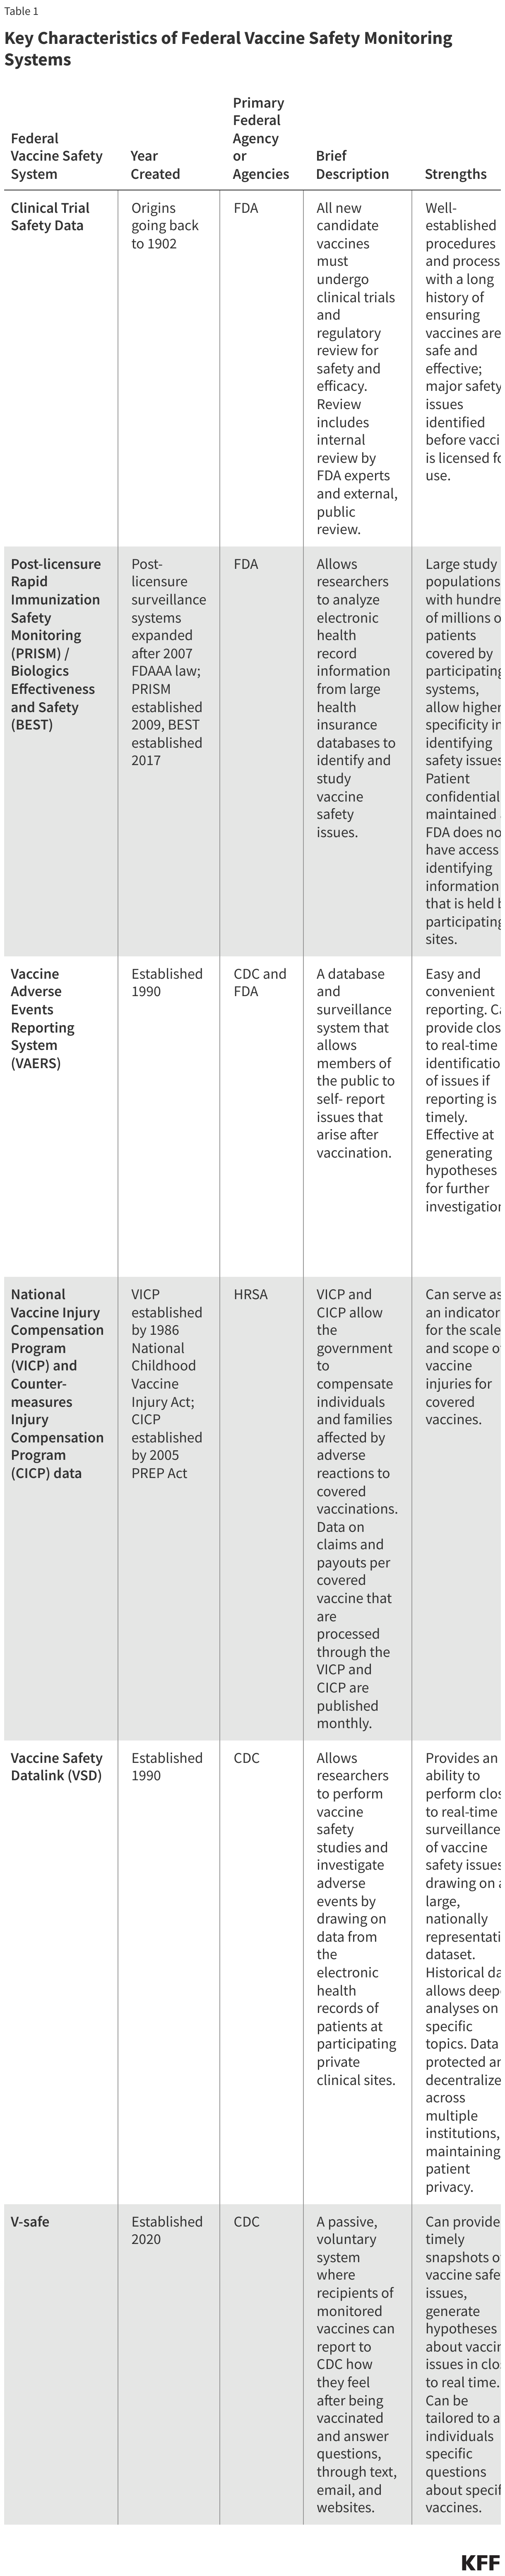
Section 2713 of the ACA requires most private health insurance plans and Medicaid expansion programs to cover a range of recommended preventive services without any patient cost-sharing. Preventive services include a range of services such as screening tests, immunizations, behavioral counseling, and medications that can prevent the development or worsening of diseases and health conditions. Preventive services that must be covered are those receiving an A or B grade by the U.S. Preventive Services Task Force (USPSTF), vaccines recommended by the Advisory Committee on Immunization Practices (ACIP), and the Health Resources and Services Administration (HRSA) recommendations issued by the Women’s Preventive Services Initiative and the Bright Futures for Children program. All of these entities review new recommendations and conduct periodic updates of existing recommendations.

What Is the Case?

In the original case, filed in 2022, the respondents claimed that the preventive services requirements for private health insurance are unconstitutional and also that the requirement to cover pre-exposure prophylaxis treatment (PrEP) (medication to prevent getting HIV from sex or injection drug use for those at risk) violates the Religious Freedom Restoration Act (RFRA). The respondents are six individuals and Christian-owned businesses. Braidwood Management, a for-profit closely held organization, owned by a trust, with Dr. Steven F. Hotze, as the sole trustee and beneficiary. Braidwood is self-insured and provides health insurance to its 70 employees. The other respondent is Kelley Orthodontics, who identify themselves as a “Christian professional association” owned by respondent, John Kelley. The respondents assert both economic harm for having to pay more money for a health plan that includes services they do not want or need, and religious harm for having to include services they object to.

In 2022, the District Court, agreeing with Braidwood’s arguments, ruled that the appointment of members to USPSTF violated the Appointments Clause and that the requirement to cover PrEP violates RFRA. However, the Court also found that the ACA’s delegation to ACIP and HRSA is not in violation of the Appointments Clause since the Secretary of HHS effectively has the authority to ratify or not the ACIP and HRSA recommendations. In 2023, the District Court issued a ruling striking down the ACA’s requirement for no cost coverage of preventive services recommended or updated by USPSTF on or after March 23, 2010. This ruling, however, was subsequently paused as the case made its way through the appeals process

In June 2024, the 5th Circuit Court of Appeals affirmed the district court’s ruling that the ACA’s requirement to cover without cost-sharing services recommended by United States Preventive Services Task Force (USPSTF) is unconstitutional. However, they ruled that a nationwide remedy was not proper and that only the plaintiffs are permitted to exclude USPSTF recommended services from their plans. The Appeals Court sent back to the district court the plaintiffs’ claim that the Secretary of Health and Human Services’ ratification of HRSA and ACIP recommendations violates the Administrative Procedure Act for further briefing and a judgment. The Supreme Court is considering only the arguments regarding whether the structure of USPSTF violates the Appointment’s Clause, not the other bodies that make preventive services recommendations, nor the religious harm included in the original case. However, a separate set of claims regarding HRSA and ACIP are still being considered by the district court and could be before the Supreme Court at a future date.

What Is the Supreme Court Considering?

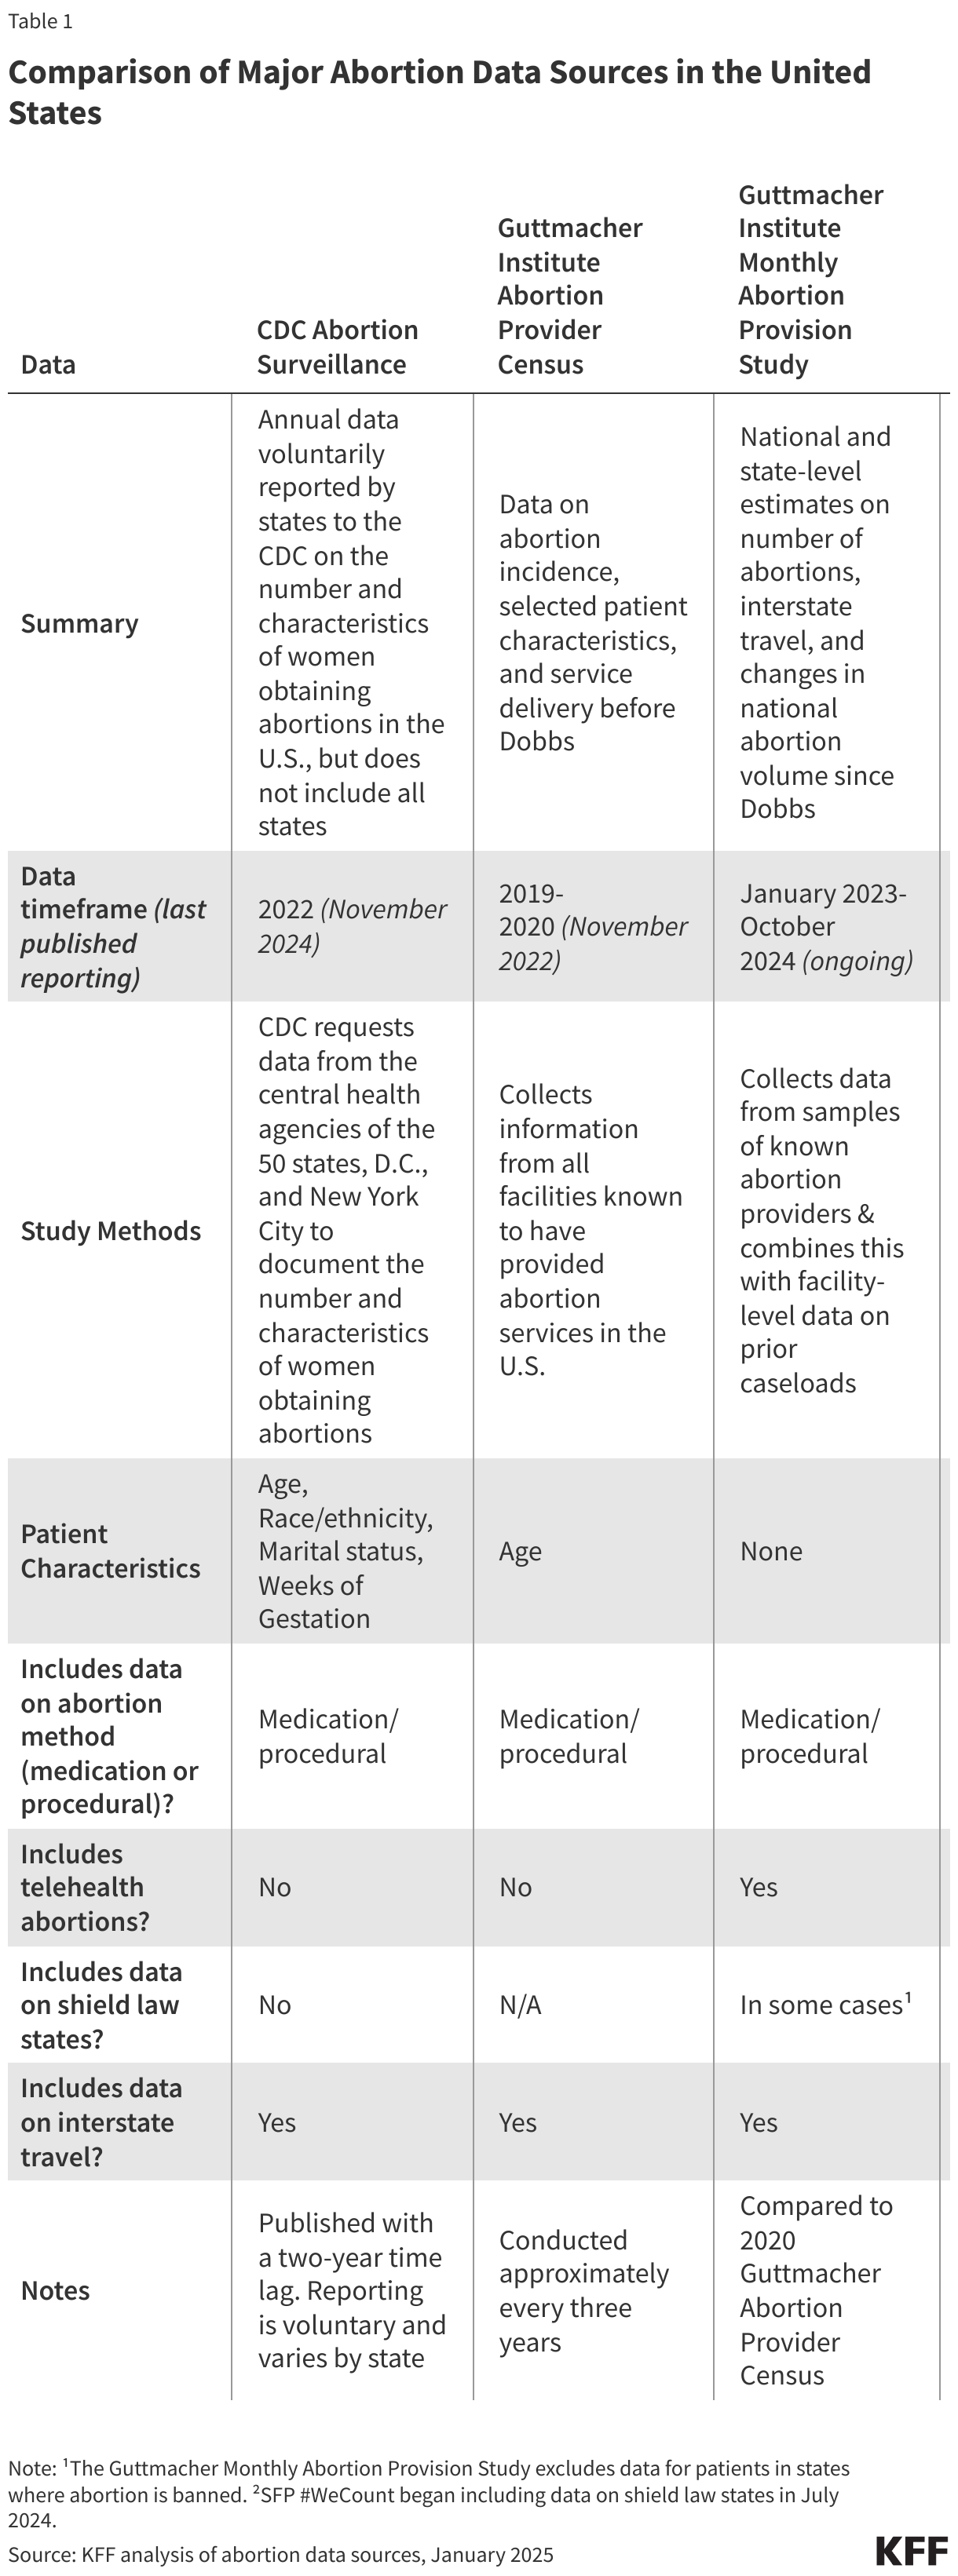
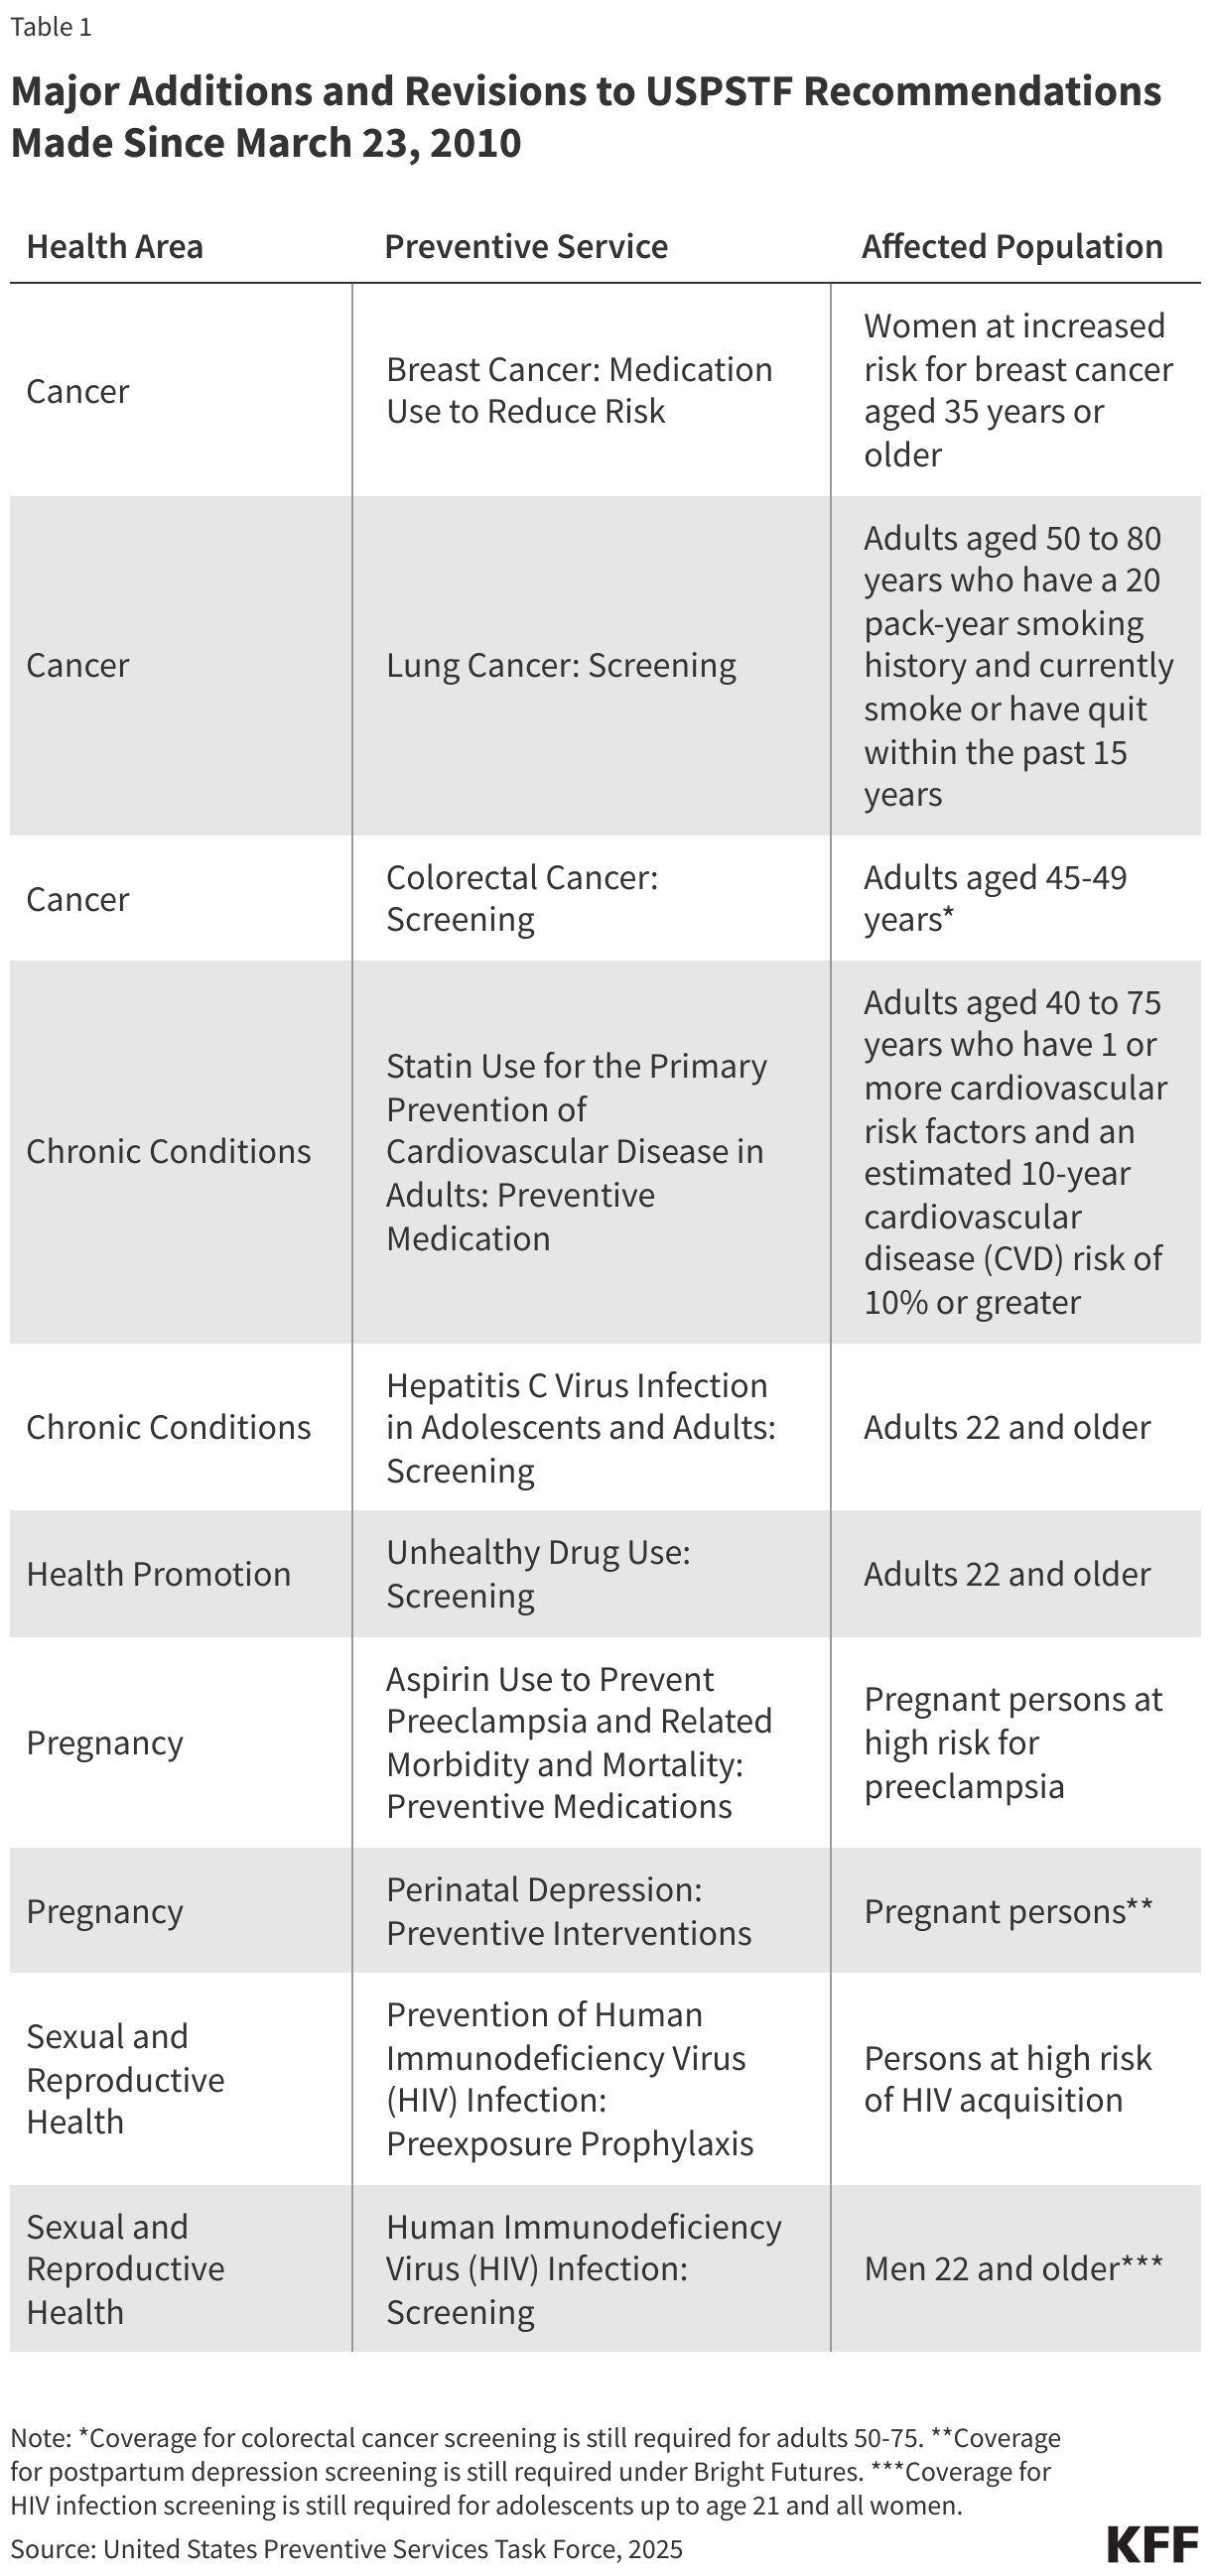
The current case before the Supreme Court is reviewing the 5th Circuit Court of Appeals decision holding that appointments of individuals to the USPSTF and the recommendations made by the USPSTF after the enactment of the Affordable Care Act in 2010 (see Table 1) violate the Appointments Clause of the U.S. Constitution since they were not appointed by the President and confirmed by the Senate.

Braidwood et al. contend that the requirement for health plans to cover preventive services recommended or amended by USPSTF since the enactment of the ACA in March 2010 violates the Appointments Clause of the Constitution. They argue this is unconstitutional since the ACA does not allow the Secretary of HHS to reject the recommendations made by the Task Force or require it to make specific recommendations, meaning that USPSTF members have the capacity to unilaterally determine the preventive care that private insurers must cover and act as officers of the United States. Additionally, they contend the Secretary lacks the authority to remove USPSTF members at will. They argue that for USPSTF’s structure and recommendations to be constitutional, members would have to be appointed by the president and Senate.

The federal government argues that the HHS Secretary has constitutionally appropriate oversight over USPSTF because they may remove members at will and determine when health insurance issuers must start providing coverage for new recommendations. HHS additionally argues that if the Court holds that capacity to remove members at will is not sufficient oversight, it can remedy this by construing federal law to allow the Secretary to review USPSTF recommendations directly, which would address any remaining questions of oversight. This degree of supervision by the Secretary of HHS, the agency argues, would mean that members of the Task Force are “inferior officers,” who may be appointed or removed by the Secretary and would not require appointment by the president and Senate.

Major Additions and Revisions to USPSTF Recommendations Made Since March 23, 2010

Potential Impact on Coverage

If the Court rules in favor of Braidwood, private health insurers would no longer be required to cover, without cost sharing, preventive services recommended by USPSTF after 2010 when the ACA was enacted. Any new service that was recommended or updated by USPSTF after March 2010 (and is not also recommended by HRSA or ACIP) would no longer be required to be covered without out-of-pocket costs. For example, services and medications like statins to prevent heart disease, lung cancer screening, and PrEP to prevent HIV could be subject to copays, deductibles, or coinsurance, potentially deterring access to these services. This essentially means that the standards and recommendations that the federal government would be able to enforce would not reflect current or future standards and evidence, locking required preventive services in place as of the state of the science in 2010.

Although many of the friend of the court briefs presented to the Supreme Court for this case focus on the impact of coverage of USPSTF recommendations with no cost-sharing, a ruling in favor of the federal government does not guarantee that coverage will be required for these preventive services. As the federal government argues, HHS Secretary Robert F. Kennedy Jr. has the power to remove USPSTF members at will and to review the recommendations they issue. This means that the Trump administration could change the membership of the USPSTF in ways that may significantly alter the recommendations it issues. Additionally, in their briefs, the Trump Administration’s HHS contends the Secretary can direct that the implementation of recommendations issued by USPSTF can be delayed indefinitely and that the Secretary may have additional authority to supervise and veto Task Force recommendations. In their brief they state, “In addition to removing Task Force members at will, the Secretary may supervise and review their recommendations directly.”

The Supreme Court is expected to issue its ruling in June. Regardless of how the Court rules in this specific case, it will likely not be the final word on the ACA required coverage of preventive services recommended by USPSTF, ACIP and HRSA.

Explaining Litigation Challenging the ACA’s Preventive Services Requirements: Braidwood Management Inc. v. Becerra

Published: Jul 17, 2025

On June 27,2025, the U.S. Supreme Court issued the opinion for Kennedy v. Braidwood Management, finding that the ACA requirement that most private insurers and Medicaid expansion programs cover preventive services recommended by the United States Preventive Services Preventive Task Force (USPSTF) with no cost-sharing is constitutional. In its decision, the Court affirmed that USPSTF members are appointed constitutionally, and the Secretary of Health and Human Services can remove USPSTF members at-will and directly review and block Task Force recommendations before they take effect.

In this case, the Supreme Court narrowly considered whether the structure of USPSTF violates the Appointments Clause, but did not review the litigants’ other claims about the Advisory Committee on Immunization Practices (ACIP), and the Health Resources and Services Administration (HRSA). The federal district court will now resume briefing on the consideration of the plaintiffs’ claim that the Secretary of Health and Human Services’ ratification of HRSA and ACIP recommendations violates the Administrative Procedure Act. For more analysis of the Court’s decision please see Kennedy v. Braidwood: The Supreme Court Upheld ACA Preventive Services but That’s Not the End of the Story.

Since the enactment of the Affordable Care Act (ACA) in 2010, more than 2,000 legal challenges have been filed in state and federal courts contesting part or all of the ACA. The most recent challenge involves the ACA requirement that most private insurance plans cover recommended preventive care services without cost sharing. In this case, Braidwood Management v. Becerra, Christian owned businesses and six individuals in Texas assert that (1) the requirements in the law for specific expert committees and a federal government agency to recommend covered preventive services is unconstitutional, and that (2) the requirement to cover preexposure prophylaxis (PrEP), medication for HIV prevention, violates their religious rights. If the plaintiffs prevail on either the constitutional or the religious claims, the government’s ability to require insurance plans to cover evidence-based preventive services without cost-sharing may be limited.

On September 7, 2022, Judge Reed O’Connor at the US District Court in the Northern District of Texas ruled partly in favor of the plaintiffs and partly in favor of the Department of Health and Human Services (HHS), which is defending the ACA. On March 30, 2023, Judge O’Connor issued a ruling for the remedy in this case, Braidwood Management v. Becerra, striking down part of the ACA’s requirement for no cost coverage of preventive services recommended or updated by the U.S. Preventive Services Task Force (USPSTF) on or after March 23, 2010 and finding that the requirement to cover PrEP medications for HIV prevention violates the rights of the plaintiffs who have religious objections to PrEP. The federal government appealed this decision and on May 15, 2023 the 5th Circuit Court of Appeals issued an administrative stay of the district court’s ruling. This means that the federal government can continue enforcing the preventive services requirement while the 5th Circuit considers the Department of Justice’s motion for a stay pending appeal. This brief explains the preventive services coverage requirements, the basis of the lawsuit, next steps in the litigation, and the potential implications.

Preventive Services Provision

The ACA requires most private health insurance plans to cover a range of recommended preventive services without any patient cost-sharing. Preventive services include a range of services including screening tests, immunizations, behavioral counseling, and medications that can prevent the development or worsening of diseases and health conditions. The preventive services that private plans and Medicaid expansion programs must cover are based on those receiving an A or B level recommendation by the U.S. Preventive Services Task Force (USPSTF), vaccines recommended by the Advisory Committee on Immunization Practices (ACIP), and the Health Resources and Services Administration (HRSA) based on recommendations issued by the Women’s Preventive Services Initiative and issued by the Bright Futures for Children program. As new recommendations are issued or updated, coverage must commence in the next plan year that begins on or after exactly one year from the recommendation’s issue date.

Judge Reed O’Connor has heard multiple challenges to the ACA

U.S District Judge Reed O’Connor, an appointee of President George W. Bush, has been the “go-to” judge for plaintiffs challenging the ACA. In 2018, he ruled that the entire ACA was unconstitutional because Congress zeroed out the tax penalty. The Supreme Court ultimately ruled the other way and upheld the ACA. In June 2019, Judge O’Connor issued a permanent injunction against the ACA’s contraceptive coverage requirement, blocking the federal government from enforcing it against employers and individuals who object to contraceptive coverage. Judge O’Connor has also ruled in favor of the plaintiffs in challenges to the ACA Section 1557.

Preventive Services Litigation

In the current case, Braidwood Management Inc. v. Becerra, the plaintiffs claim that the preventive services requirements for private health insurance are unconstitutional and the requirement to cover PrEP-specific coverage requirement violates the Religious Freedom Restoration Act (RFRA) (Table 2). The plaintiffs are six individuals and Christian owned businesses. Braidwood Management, a for-profit closely held organization, owned by a trust, with Dr. Steven F. Hotze, a religious Christian, as the sole trustee and beneficiary. Braidwood is self-insured and provides health insurance to its 70 employees. The other plaintiff is Kelley Orthodontics, a Christian professional association owned by plaintiff John Kelley. The plaintiffs are asserting both economic harm for having to pay more money for a health plan that includes services they do not want or need, and religious harm for having to include services they object to.

Plaintiff Claims

Position 1: The Preventive Services Provision violates the Appointments Clause

The plaintiffs contend that the ACA provisions violate the Appointments Clause of the US Constitution, which provides that “officers of the United States” may only be appointed by the president, subject to the advice and consent of the Senate. They claim that the members of USPSTF, ACIP and HRSA are “officers of the United States” who have not been appointed in conformity with the Appointments Clause because they were not nominated by the President and approved by the Senate. Rather, members of these bodies are appointed by the heads of agencies within HHS (Table 1). The plaintiffs are asking the court to declare all preventive-care mandates based on recommendations or guidelines issued by USPSTF, ACIP or HRSA after March 23, 2010 (the day the ACA was signed into law) as unconstitutional. The plaintiffs contend that the ACA does not allow the Secretary of HHS or the directors of the agencies within HHS to reject the recommendations made by the committees and is thus insufficient oversight.

Conversely, HHS contends that “there are numerous statutes that incorporate by reference independent recommendation without creating any requirements that the heads of the recommending bodies be appointed as officers of the United States.” They cite examples such as a public health regulation related to water standards for consumer products that outsources the development of those standards to a non-governmental organization. Similarly, they cite a law requiring states and designated database providers to use a format for an electronic database approved by an expert panel that is not subject to approval by the head of a federal agency.

Table 1: Committees Issuing Recommendations for Preventive Services
Recommending EntityRole of the AgencyProcess for Appointments and Oversight
United States Preventive Services Task Force (USPSTF)The U.S. Preventive Services Task Force is an independent, volunteer panel of national experts in disease prevention and evidence-based medicine. The Task Force works to improve the health of people nationwide by making evidence-based recommendations about clinical preventive services.
  • USPSTF members appointed by the Director of AHRQ to serve 4-year terms.
  • USPSTF recommendations are not subject to AHRQ oversight or approval.
Advisory Committee on Immunization Practices (ACIP)The ACIP shall provide advice and guidance to the Director of the CDC regarding use of vaccines and related agents for effective control of vaccine-preventable diseases in the civilian population of the United States.
  • The Secretary of the U.S. Department of Health and Human Services selects the members following an application and nomination process.
  • Recommendations made by the ACIP are reviewed by the CDC Director, and if adopted, are published as official CDC/HHS recommendations which determines insurance coverage policy.
Health Resources and Services Administration (HRSA) – Women’s Preventive Services InitiativeHRSA is an agency of the U.S. Department of Health and Human Services that operates programs intended to provide equitable health care to people who are geographically isolated and economically or medically vulnerable.
  • HRSA contracts with an external organization, currently ACOG, to convene a panel of experts, the Women’s Preventive Services Initiative (WPSI) to make and update recommendations for women’s preventive services.
  • HRSA can accept or reject recommendations which determines insurance coverage requirements.
HRSA — Bright Futures for ChildrenHRSA (see above)
  • HRSA uses the guidelines developed by The Bright Futures Program to identify evidence-informed guidelines for preventive care screenings and routine visits for newborns through adolescents up to age 21. The American Academy of Pediatrics (AAP) convenes experts in pediatric care with support from HRSA to review scientific evidence and recommend updates.
Plaintiff Position 2: The Preventive Services Provision violates the Nondelegation Doctrine

The plaintiffs contend the ACA’s preventive services provisions violate the nondelegation doctrine – based on the theory that since Article I of the Constitution vests legislative power in Congress, there are limits to the authority that Congress can delegate to federal administrative agencies. The current caselaw precedent requires statutes that delegate authority to agencies to supply an “intelligible principle” to guide and provide a boundary or limit on the agency’s discretion. The plaintiffs contend that an “intelligible principle” is lacking: “Yet there is nothing in the text of section 300gg-13(a) that purports to guide the discretion of [US]PSTF, ACIP or HRSA when choosing the preventive care that private insurance must cover.” The plaintiffs contend that this constitutional nondelegation problem can be averted if the phrase “current recommendations is construed to refer to the recommendations that existed when the ACA was signed into law.”

The plaintiffs point to comments in the Supreme Court’s opinion in Little Sisters of the Poor, as evidence that the current majority believes there could be a constitutional issue with delegation to HRSA for preventive services for women, including contraception: “On its face, then, the provision grants sweeping authority to HRSA to craft a set of standards defining the preventive care that applicable health plans must cover. But the statute is completely silent as to what those “comprehensive guidelines” must contain, or how HRSA must go about creating them. The statute does not, as Congress has done in other statutes, provide an exhaustive or illustrative list of the preventive care and screenings that must be included.” While the Little Sisters case, challenging the contraceptive coverage regulations, was not decided based on the nondelegation doctrine, there is growing speculation that the Supreme Court is poised to revisit the nondelegation doctrine to make it more difficult for Congress to delegate authority to federal agencies to address major policy details.

Plaintiff Position 3: The Preventive Services Provision violates the Religious Freedom Restoration Act

The plaintiffs assert the requirements to cover PrEP violates the Religious Freedom Restoration Act. Relying on the Supreme Court’s ruling in Burwell v. Hobby Lobby, the plaintiffs contend that employers are left with a “Hobson Choice” to provide health insurance that covers these medications and services that violate their religious beliefs or refuse to offer any health insurance to its employees. Notably, the plaintiffs state the requirement to cover PrEP “imposes a substantial burden on the religious freedom of those who oppose homosexual behavior on religious grounds” claiming further that PrEP drugs “facilitate and encourage homosexual behavior, prostitution, sexual promiscuity, and intravenous drug use.” The plaintiffs also contend the provision violates individuals who have religious objections and wish to purchase health insurance without PrEP coverage.

District Court’s Decision

Finding that Braidwood has standing to pursue its claims, on September 7, 2022, Judge O’Connor ruled that that the ACA’s delegation to U.S. Preventive Services Task Force violates the Appointments Clause because the Secretary cannot direct USPSTF to give a specific preventive service an “A” or “B” rating . The Court finds that the Secretary does not have any authority to direct which services are covered under § 300gg-13(a)(1) and concludes that USPSTF members are officers of the United States and that their selection does not comply with the Appointments Clause procedures. However, the Court also found that the ACA’s delegation to ACIP and HRSA are not in violation of the Appointments Clause since the Secretary of HHS effectively has the authority to ratify or not the ACIP and HRSA recommendations.

The court rejected the plaintiff’s nondelegation doctrine claims stating that the preventive care law met the criteria set out in prior Fifth Circuit cases on when Congress has properly provided an “intelligible principle” to guide agency discretion. Judge O’Connor noted that the Supreme Court might soon “reexamine or revive” the nondelegation doctrine, but it’s too early to predict a change in the nondelegation criteria from comments made in the Little Sisters case.

Relying on the reasoning in the Supreme Court’s decision in Hobby Lobby, the District Court also found that the requirement to cover PrEP violates Braidwood’s religious rights under the Religious Freedom Restoration Act (RFRA).

On March 30, 2023, District Court Judge O’Connor issued a ruling for the remedy in the case, Braidwood Management v. Becerra, striking down part of the ACA’s coverage requirement for preventive services. Effective immediately nationwide, the ruling blocks the federal government from requiring health plans to cover services recommended or updated by the U.S. Preventive Services Task Force (USPSTF) on or after March 23, 2010. The ruling did not affect coverage requirements for USPSTF services recommended prior to that date and also did not affect the requirement for plans to cover Women’s Preventive Services recommended by Health Resources and Services Administration (HRSA) or vaccines recommended by the CDC’s Advisory Committee on Immunization Practices (ACIP). Additionally, the judge ruled that the requirement to cover PrEP medications for HIV prevention violates the rights of the plaintiffs who have religious objections to PrEP. The federal government has appealed this decision to the United States Court of Appeals for the 5th Circuit. On May 15, 2023 the 5th Circuit Court of Appeals issued an administrative stay of the district court’s ruling. This means that federal government can continue enforcing the preventive services requirement while the 5th Circuit considers the Department of Justice’s motion for a stay pending appeal.

Implications for Coverage and Access to Preventive Services in Private Health Insurance

Even if the Court’s ruling upholds the authority of HRSA and ACIP, USPSTF recommendations include a broad range of services across multiple populations and health conditions. This includes cancer screenings, preventive medications for chronic conditions such as cardiovascular disease, counseling on health behaviors related to nutrition and weight management, alcohol and drug use, tobacco cessation services, screening for depression, and prenatal services, Elimination of the coverage requirements for USPSTF recommendations would invalidate the requirement to cover all of these services without cost sharing.

Religious Objections to PrEP Coverage

The ACA’s contraceptive coverage provision has been one of the most litigated parts of the law, with three cases brought by employers who object to the coverage on religious grounds reaching the Supreme Court. The Court’s ruling on the PrEP coverage requirement is the first time a court has ruled in favor of plaintiffs challenging another preventive service based on religious objections.

If employers who object to including coverage for PrEP in their plans are allowed to exclude the coverage, employees could lose coverage for a medication that could prevent the transmission of HIV and HIV related morbidity and mortality. PrEP reduces the risk of acquiring HIV by approximately 99% through sex and 74% through injection drug. Given that over 80% of PrEP users are covered by commercial insurers, this could have significant ramifications for cost and access should the ruling be applied broadly. The cash price for generic PrEP (Emtricitabine / Tenofovir), which is about 99% effective at preventing HIV through sex, is approximately $30 per month. This compares to an estimated lifetime HIV treatment cost of $420,285 ($1,079,999 undiscounted).

In addition, allowing employers to exclude PrEP because of religious objections has the potential to open the door to employers objecting to other services, such as vaccines.

Implications for Access to Preventive Services in Medicaid & Medicare

While the plaintiffs in Braidwood are only challenging the preventive services required in private health insurance plans, Medicaid and Medicare also have requirements for coverage of preventive services. States that have expanded Medicaid eligibility under the ACA must cover Essential Health Benefits (EHBs) as defined by the ACA. One of the categories of EHBs is preventive services, which CMS has defined to include the same services as required for private insurance plans. As a result, all states must cover the preventive services recommended by USPSTF, ACIP and HRSA for enrollees who qualify through the Medicaid expansion pathway. If this litigation is successful in challenging any of the preventive services required in private health insurance plans, the requirement for preventive services for enrollees who qualify through the Medicaid expansion pathway would be left to individual states to determine based on their state private insurance benchmark plan, which may not include all the services currently required.

While Medicaid relies on the same agencies to determine the recommended services as private insurance plans must cover, the process is slightly different under Medicare. In that case, under the national coverage determination process, the Secretary of HHS has the authority to determine coverage for preventive services for Medicare beneficiaries. The ACA eliminated Medicare cost sharing, including coinsurance and deductibles, for most preventive benefits that are rated A or B by the USPSTF, beginning in 2011, and authorized the Secretary of HHS to add coverage for new preventive services, using the national coverage determination process, if they are: reasonable and necessary for prevention or detection of illness; rated A or B by the USPSTF; and appropriate for Medicare beneficiaries. Coverage under Medicare for several preventive services, including some rated A or B by the USPSTF, predated the ACA and is specified in statute, and therefore would not be affected by any ruling on the current litigation.

The current litigation is brought by employers and individuals who allege economic and religious harm from the preventive services requirements in private health insurance. Any litigation challenging the preventive services requirements under Medicaid or Medicare would need to be brought by plaintiffs who suffer a tangible harm to establish legal standing.

Broader Implications

Overturning the preventive services requirement broadly would have significant implications for coverage of a broad range of clinical preventive services. Should the final decision for this case be found in favor of the plaintiffs, and applied nationwide, then millions of people may be vulnerable to loss of guaranteed coverage of preventive services without cost sharing. It will again be at the discretion of plans and employers to determine what preventive services will be covered and whether they will charge cost-sharing, lowering premiums in some cases, but likely creating a patchwork of coverage for these services. This could widen access barriers for groups that already face increased barriers dure to cost, including low-income people and people of color.

Should this case reach the US Supreme Court, the broader implications of a final decision in favor of the plaintiffs will depend on the basis for the ruling. The Court could rule in favor of the plaintiffs based on the Appointments Clause argument, similar to Judge O’Connor’s decision, finding that USPSTF members are officers of the United States who have not been properly appointed.

The potential implications are much broader, however, if the Supreme Court revisits and revises the nondelegation doctrine and restricts Congress’ ability to delegate the development of very precise standards to federal agencies. Without allowing the agencies to update the recommended preventive services, Congress would have to pass a new law every time the USPSTF recommends a new preventive service in order for it to be covered without cost-sharing. Any decision that changes the standard for Congress’ delegation could limit agency discretion to address a broad range of health and other issues through regulation.

Beyond preventive care, much of health policy and law has been developed through the delegation of authority to federal agencies to develop standards to address complex public policy and technical requirements—from the prescription drug approval process of the FDA to the apparatus set up to review and annually update the Medicare fee schedule. The ACA itself specifically left it up to the Secretary of HHS to define the essential health benefits that insurers must cover in the individual and small group insurance markets within the framework of the ten categories of items and services that Congress set out. The authority Congress gave to HHS to temporarily waive certain healthcare requirements during the COVID public health emergency is probably the best example of how delegated authority has functioned to benefit public health as well as access to public and private health insurance coverage. Any movement by the Court to restrict Congress’ authority to delegate in these areas could have a profound effect on the daily lives of Americans.

We do not know how quickly the United States Court of Appeals for the 5th Circuit will rule on this case. Ultimately, the parties are likely to appeal to the Supreme Court.

Table 2: Braidwood v. Becerra: Litigation Challenging the ACA’s Preventive Services Provision:Summary of the Plaintiffs’ and Government’s Position
Claim: The ACA preventive services provisions (42 U.S.C. § 300gg-13(a)(1)–(4)) Violate The Appointments Clause because the members of the committees act as “officers of the United States” and have not be properly appointed

The Appointments Clause provides: [The President] shall have Power, by and with the Advice and Consent of the Senate, to . . . appoint Ambassadors, other public Ministers and Consuls, Judges of the supreme Court, and all other Officers of the United States, whose Appointments are not herein otherwise provided for, and which shall be established by Law: but the Congress may by Law vest the Appointment of such inferior Officers, as they think proper, in the President alone, in the Courts of Law, or in the Heads of Departments.

U.S. Const. art. II § 2. Y

Plaintiffs’ Position:
  • 42 U.S.C. § 300gg-13(a)(1) – (4) allow the members of the U.S. Preventive Services Task Force, the Advisory Committee on Immunization Practices, and the Health Resources and Services Administration to unilaterally determine the preventive care that private insurers must cover
  • These individuals are “officers of the United States,” because they “occupy a continuing position established by law” and exercise “significant authority pursuant to the laws of the United States.” Yet none of these officers have been appointed in conformity with the Appointments Clause.
Government’s Position:
  • The secretary’s ratification of the current preventive services coverage requirements defeats plaintiffs’ appointments clause claim
  • HRSA and the CDC (which ACIP Advises) are components of the HHS that exercise the secretary’s power and are under the secretary’s control.
  • The USPSTF is an independent body that does not exercise Executive Power. Its independent recommendations about the quality of evidence backing the effectiveness of certain preventive services is separate from any judgment about what should or should not be covered by health insurance, which latter judgment was made by Congress.
Claim: The ACA preventive services provisions (42 U.S.C. § 300gg-13(a)(1)–(4)) violate the nondelegation doctrine because Congress did not provide any details to guide the recommendations for preventive services
Plaintiffs’ Position:
  • There is nothing in the text of section 300gg-13(a) that purports to guide the discretion of USPSTF, ACIP or HRSA when choosing the preventive care that private insurance must cover.
Government’s Position:
  • “Delegations are constitutional so long as Congress ‘lay[s] down by legislative act an intelligible principle to which the person or body authorized [to exercise the authority] is directed to conform.”
  • The grants of authority under 42 U.S.C. § 300gg-13(a) fall well within the wide range of delegations approved by the Supreme Court and the Fifth Circuit and are consistent with established limits on Congress’s power to delegate.
  • Congress did not “delegate” power to PSTF at all but instead incorporates its work.
Claim: Certain provisions of the ACA’s preventive services coverage requirements violate the Religious Freedom Restoration Act: requires the government to show the law in question, in this case the requirement that plans include coverage of PrEP without cost sharing, furthers a “compelling interest” in the “least restrictive means” when it “substantially burdens a person’s exercise of religion.”
Plaintiffs’ Position:
  • The compulsory coverage of PrEP drugs, the HPV vaccine and the screenings and behavioral counseling for STDS and drug use violate the Religious Freedom Restoration Act (RFRA).
  • Plaintiffs are opposed for religious reasons to sexual activity outside of marriage between one man and one woman.
  • Requiring for providing Coverage of PrEP drugs facilitates and encourages homosexual behavior, intravenous drug use and sexual activity outside of marriage between one man and one woman.
Government’s Position:
  • The plaintiffs have failed to demonstrate the PrEP coverage requirement substantially burdens their religious beliefs.
  • The plaintiffs cannot identify any impact on their health insurance premiums arising from the requirement to cover PrEP drugs.
  • Even if the plaintiffs could show a substantial burden, the government has a compelling interest in countering the spread of HIV infections, and the plaintiffs have not argued that there is a less restrictive way of meeting this compelling interest (requiring private health insurance to cover PrEP without cost sharing).

How Does the Federal Government Monitor Vaccine Safety?

Published: Jul 16, 2025

Introduction

Vaccines are essential tools for public health that help prevent millions of hospitalizations and deaths each year in the U.S. alone. Vaccines are also overwhelmingly safe, with serious negative side effects from vaccinations being very rare. Even so, side effects and adverse events do happen, which makes it important to continually monitor vaccine safety and to investigate and respond to serious events that are detected, and to assess whether they are linked to vaccination. For this reason, the federal government has multiple systems in place that track vaccine safety. At the same time, the issue of vaccine safety in the U.S. has been increasingly contested, and is currently facing growing scrutiny, including from Trump administration officials. For example, Department of Health and Human Services (HHS) Secretary Robert F. Kennedy, Jr. has raised questions about vaccine safety, saying he believes the federal government is not doing enough to monitor adverse events and has not been transparent about the data on vaccine safety that it does have. Prior to becoming HHS Secretary, Kennedy said that the federal government had failed to conduct comprehensive studies on vaccine safety and said he believes the federal vaccine safety system captures only a tiny fraction of adverse events from vaccinations. As Secretary, Kennedy has also said he wishes to overhaul the federal government’s approach to vaccine safety monitoring, including by creating a division at the Centers for Disease Control and Prevention (CDC) to focus on vaccine-related injuries and implementing an automated system to track such injuries. In addition, members of the Advisory Committee on Immunization Practices (ACIP), a key vaccine advisory committee for the federal government that was newly constituted by Kennedy in June 2025, have echoed some of these same concerns about vaccine safety and have pledged to revisit vaccine safety issues through ACIP. Further, the safety of COVID-19 vaccines and the ability of the federal government to detect adverse events from vaccination has been questioned by the newly appointed chief medical and scientific officer at the Food and Drug Administration (FDA).

Experts within and outside the government have disputed claims about the lack of sufficient federal vaccine safety monitoring, saying the federal government does in fact have systems in place that can track the safety of vaccines, and that these systems are collectively able to identify important safety signals or significant adverse events from vaccinations. These systems include reviews of data collected during the regulatory review process both before and after vaccines are approved for use, analysis of self-reported vaccine injuries from the public, and ongoing surveillance and analysis of data from patient records at a national level. In most cases, these systems have been in place for decades and have been able to identify past vaccine safety issues.

To provide background and help inform current discussions, this brief provides an overview of the main federal systems and databases that monitor vaccine safety.

Background

Safety monitoring of vaccine products has been subject to federal regulatory oversight for over a century. Federal regulation of vaccine safety began formally with the passage of the “Biologics Control Act of 1902”, which authorized federal review of pharmaceutical products in development and which was created in response to a number of deaths caused by the unregulated use of a diphtheria anti-toxin vaccine in 1901. Subsequent laws expanded and clarified the federal role in protecting the public’s health and regulating the safety of drugs and vaccines, spurred on in some cases by safety events. For example, the Federal Food, Drug, and Cosmetic Act passed in 1938 following a number of deaths caused by sulfanilamide (a drug developed to treat streptococcal infections) expanded federal regulatory oversight of the manufacturing, testing, promotion, and distribution of pharmaceuticals. In 1944, the Public Health Service Act (PHSA) was enacted to consolidate and affirm the roles of federal agencies in protecting the public’s health, including review and regulation of pharmaceutical products, and has served as a foundation for continued federal public health efforts.

For many decades, vaccines were regulated primarily by the National Institutes of Health (NIH), but in 1972 Congress moved much of the responsibility for regulatory review of vaccine research and development to the U.S. Food and Drug Administration (FDA). CDC established an early vaccine adverse event tracking system in 1978, called the Monitoring System for Adverse Events Following Immunizations (MSAEFI), which collected reports of adverse events from parents receiving publicly funded vaccines. A major expansion of the vaccine safety monitoring infrastructure took place with the passage of the National Childhood Vaccine Injury Act in 1986, which was passed in response to a growing number of lawsuits filed against vaccine manufacturers claiming serious adverse events linked to administration of the diphtheria-tetanus-pertussis (DPT) vaccine (links not established by epidemiological studies). The law created a requirement for vaccine safety reporting to HHS and led to many of the systems for post-licensure vaccine safety monitoring still in place today and described further below. For example, in 1990, the more robust VAERS system replaced CDC’s MSAEFI system, and the same year the Vaccine Safety Datalink program at CDC was established. In subsequent years, the federal government has expanded these programs and added more, including the 2007 FDA Amendments Act (FDAAA) which required FDA to establish more robust pharmaceutical safety tracking systems. In response, the FDA established several programs drawing information from large administrative insurance databases to identify and analyze safety issues, including the PRISM and BEST initiatives described below, with the latter initially scaled up to track the safety of 2009 H1N1 pandemic influenza vaccines. During the COVID-19 pandemic, the federal government added additional vaccine safety tracking tools, including V-Safe.

Current Federal Vaccine Safety Monitoring Systems

Safety Data from Clinical Trials – FDA

Before being approved and licensed for use in the U.S., all new vaccines must be tested in clinical trials by vaccine developers, and the data from these trials must be submitted to the FDA for regulatory review. (Updates to already licensed vaccines do not necessarily go through the same set of clinical trials, though updated vaccine formulations are still subject to regulatory review and must be approved by FDA). In its clinical trial review, which covers multiple stages of the research and development process, the FDA’s primary considerations are determining that candidate vaccines are safe and effective. As such, reports of adverse reactions or other safety issues are closely monitored and any adverse safety signals are investigated. During later-stage, larger clinical trials, monitoring and evaluation of safety is a key component of data collection and review. Review of vaccine clinical trial data includes internal, confidential review by experts on staff at FDA, as well as external, public review provided typically through the Vaccines and Related Biological Products Advisory Committee (VRBPAC). Based on the conclusions and recommendations from these internal and external experts, the FDA Commissioner decides whether to approve candidate vaccines.

The 2007 FDAA required information from all clinical trials supported with public funds to be recorded in a public database (ClinicalTrials.gov) and set up requirements that trial results also be included in the public database, although raw data from trials is not typically made public as it is considered proprietary under FDA regulations. In addition, data hosted on the ClinicalTrials.gov database relies on investigators and sponsors choosing to submit such information and some, but not all submissions, include study results.

While the clinical trial system has a long history of ensuring that pharmaceutical products licensed for use in the U.S. are safe and effective, and major safety issues are able to be identified before a vaccine is licensed for use, clinical trials are performed in relatively small numbers of people compared to a whole population that might receive a vaccine. Therefore, very rare safety events might be harder to identify during the trials process. This is one reason post-licensure surveillance has been expanded, as required by the FDAA (see below).

Post-licensure Rapid Immunization Safety Monitoring (PRISM) / Biologics Effectiveness and Safety (BEST) – FDA

FDA also monitors safety of medical devices, drugs, and vaccines after they become available on the market. For many of the products it regulates, including vaccines, FDA has often required manufacturers to perform post-licensure safety reviews and submit that information to FDA for review. The 2007 FDAAA law required FDA to expand its post-licensure surveillance capabilities and develop a robust system that used health care data from clinical sites to track safety. In response, FDA created the Sentinel Initiative in 2008, which over time, has grown into a electronic surveillance system that is capable of tracking safety data for over 100 million individual members served by a broad set of health care organizations and clinical sites nationwide. In 2009, HHS initiated the Post-licensure Rapid Immunization Safety Monitoring (PRISM) to help monitor the safety of the H1N1 pandemic influenza vaccine; in 2010, PRISM became an immunization safety component within the Sentinel system and has expanded to include other vaccines. The FDA’s Center for Biologics Evaluation and Research (CBER) oversees another post-licensure vaccine safety program called Biologics Effectiveness and Safety (BEST), which was also created in response to the 2007 FDAAA requirements and launched in 2017. As part of its vaccine safety monitoring efforts, FDA also partners with the Centers for Medicare and Medicaid Services (CMS) to analyze Medicare claims data in order to track safety events among persons aged 65 or older. Using CMS data, FDA is able to perform regular, ongoing analyses looking for pre-specified adverse events following vaccination, as well as perform more specific analyses as needed.

PRISM, BEST, and FDA-CMS have access to large datasets, with hundreds of millions of patients covered by participating systems. These larger study populations allow for more specificity when trying to identify vaccine safety issues but can present challenges when studying longer-term safety issues because individuals may move in and out of different insurance plans over time. It may also take time for data in some of these systems to be made available for analysis (FDA reports a three month average data lag time for the BEST system, for example). To protect confidentiality, FDA does not have direct access to identifying information on patients, with private clinical sites and health insurers that partner with PRISM and BEST retaining their data locally behind firewalls.

Vaccine Adverse Events Reporting System (VAERS) – FDA and CDC

VAERS is a national vaccine safety surveillance program which allows the federal government to collect, analyze, and report on adverse reactions or other safety issues related to vaccines. It was created after the passage of the 1986 National Childhood Vaccine Injury Act and formally established in 1990. VAERS is jointly administered by the FDA and CDC.

VAERS is a “passive” surveillance system, as it depends on individuals submitting voluntary reports of issues that arise after vaccination. Anyone can submit reports to VAERS including healthcare providers, representatives from vaccine manufacturers, and the public. Since 1990, there have been over 2 million reports submitted to VAERS. Prior to 2020, there were on average about 40,000 to 50,000 reports submitted annually, and after COVID-19 vaccinations became available, the number of reports increased significantly, with over 1 million reports submitted in 2021 alone. FDA and CDC scientists monitor the VAERS database for possible signals of problems with vaccines. Most submissions report mild side effects after vaccinations, such as fever. Very rarely, more serious adverse events are reported and identified through VAERS. When staff at these agencies determine there may be a serious concern about a specific report or set of reports, additional information may be requested of the individual(s) that submitted the information such as clinical records or other evidence to corroborate the information in the report.

While anyone can submit to VAERS, which makes it easier and more convenient to report through this system, initial reports are not verified and, as with all passive surveillance, the population submitting reports to VAERS may not be representative of the population of people receiving vaccinations. Further, in some cases health issues reported by individuals following vaccination could be coincidental rather than causal. This is one reason additional information may be requested and further investigation triggered by serious VAERS reports. As a result, analyzing and interpreting VAERS data requires care and an understanding of its limitations. VAERS can be useful to generate hypotheses and indicate possible concerns but may not be suitable for determining definitive causal relationships between vaccines and safety issues. Because of these inherent weaknesses and difficulties working with VAERS data, some have used the data to draw misleading conclusions, or even actively misinform about links between vaccinations and adverse events. Regarding transparency, almost all data in VAERS is made public on the CDC website, including all initial and subsequent reports from the public. However, more sensitive follow-up information collected through VAERS during further review by federal officials is not made available due to privacy considerations.

Systems related to or similar to VAERS have been maintained at other federal agencies as well, including the Indian Health Service, the Department of Veteran’s Affairs, and the Department of Defense.

Vaccine Injury Compensation Data – HRSA

The Health Resources and Services Administration (HRSA) oversees the National Vaccine Injury Compensation Program (VICP). This program was one of several vaccine safety systems created by the 1986 National Childhood Vaccine Injury Act, and was designed to be a “no-fault alternative to the traditional tort system” for vaccine injury claims. Congress passed the 1986 law following a series of lawsuits against vaccine manufacturers and healthcare providers that had threatened the supply of vaccines in country. The system removes the liability burden from manufacturers for vaccine-related injuries, and allows for the government to compensate individuals and families affected by adverse reactions to childhood vaccinations. HRSA hosts the VICP, conducts medical reviews of submitted petitions, and makes any Court-ordered compensation payments to petitioners. The U.S. Court of Federal Claims is responsible for final decisions regarding whether compensation is warranted, and the amount and type of compensation from the government. Payments are funded through an excise tax on each dose of a childhood vaccine. To be included in VICP a vaccine must be: 1) recommended by the CDC for routine administration to children or pregnant women, 2) subject to the excise tax that funds VICP, and 3) must have been added to the official VICP Vaccine Injury Table by the Secretary of HHS. Each month, HRSA publishes an updated summary of claims and payouts, per covered vaccine, processed through the VICP. A total of 28,673 petitions have been filed with VICP between 1988 and 2025, and 12,019 (42%) were found to be compensable under the program. HRSA reports that over the period from 2006 to 2023, CDC estimates over 5 billion doses of VICP covered vaccines were distributed, and over the same time period 9,675 individuals were compensated for vaccine injuries, or about 1 compensable petition per 1 million doses distributed.

HRSA also oversees another injury compensation program, the Countermeasures Injury Compensation Program (CICP), initially created through the 2005 PREP Act. Like the VICP, the CICP provides compensation for adverse events following the administration or use of certain vaccines (along with diagnostics or other countermeasures). However, CICP differs from VICP in a number of important ways, such as: CICP only covers vaccines administered in the context of a public health emergency or security threat; CICP claims are adjudicated via an administrative process rather than a judicial process, and; there is no judicial appeals allowed under CICP (while VICP allows court-based appeals). Currently, COVID-19 vaccine injury compensation cases are evaluated and compensated under CICP rather than VICP, at least through December 2029 as presently authorized by Congress. HRSA provides monthly updates on CICP-related vaccine compensation cases and compensated amounts. According to this data, between fiscal years 2010 and 2025 CICP has received 14,413 claims and has reached a decision on 4,979 of those claims. 4,864 claims were denied, while 115 claims (or less than 1% of petitions) have been found to be eligible for compensation through June 2025.

While VICP and CICP compensation data do not constitute a traditional database or surveillance system for tracking vaccine safety, they can serve as an indicator of sorts for the scale and scope of vaccine injuries. However, not all vaccine injuries will be adjudicated through these systems, and there have been issues with delays in reaching decisions and settlements. In particular, the CICP’s more limited scope, administrative review process, and surge of claims related to COVID-19 vaccines since 2021 has led to long case review times. CICP also has a rejection rate that appears much higher than that of the VICP. Also, a re-organization of several HHS offices and agencies, including HRSA, has been announced by Secretary Kennedy, raising some questions about where these two compensation programs will reside and what support they will receive as part of the proposed “Administration for Health America” (AHA).

The Vaccine Safety Datalink (VSD) is an “active” vaccine adverse event surveillance program, created after the passage of the 1986 National Childhood Vaccine Injury Act and formally established by CDC in 1990. VSD is a collaboration between the CDC Immunization Safety Office and several health care system sites spread across various regions of the U.S. At its start, VSD worked with four sites, but the number of sites has expanded; CDC reports that there are presently 11 participating clinical sites (and two additional sites providing subject matter expertise), covering an estimated population of about 15 million health plan participants annually across all age groups, with an annual birth cohort of approximately 115,000 births.

VSD is designed to allow investigators to perform vaccine safety studies and investigate vaccine adverse events, drawing on data from the electronic health records (EHRs) of patients at participating sites. VSD investigators may include CDC and other federal government employees, as well as external experts. VSD data is used for active surveillance of vaccine safety issues through weekly analyses comparing rates of predefined adverse events following specific vaccines to rates in a comparison group. The data is also used to test hypotheses and perform more specific analyses or look further into potential vaccine-related adverse events identified in VSD or elsewhere. For data security and privacy reasons, since 2001 VSD EHR data is not centrally hosted by the federal government but rather decentralized across participating sites and held in secure servers. When needed, de-identified data from these sites can be shared with CDC for analysis.

VSD provides an ability to perform close to “real-time” surveillance of vaccine injuries drawing from a large national dataset, and also allows for deeper analyses on specific topics using historical data in VSD. Even so, VSD data may be limited when identifying or investigating extremely rare safety events. Because the data is decentralized across multiple institutions, coordinating and accessing a complete dataset for analysis is more cumbersome, but the structure also maintains privacy more effectively. As with other data sources relying on information from commercial insurers, it can be challenging to study medium- or long-term safety issues because patients frequently change insurance plans and health care providers.

Over the past several years, VSD has been a target of some criticism from anti-vaccine groups, which have raised concerns about supposed misuse of its data and a lack of transparency. During Senate hearings in May, HHS Secretary Kennedy said there have been “allegations of fraud” and “so much information that’s disappeared from [VSD].” However, there is no evidence this is the case, and current and former federal health officials familiar with VSD have pushed back on these statements. Recently, Kennedy appointed a controversial researcher to analyze VSD data to identify links between childhood vaccines and autism – even though that is a link disproven through many other studies across many years, including through published studies using VSD data.

V-Safe – CDC

V-safe is a vaccine safety monitoring system originally launched in December 2020 to help monitor the safety of COVID-19 vaccines. Subsequently, the system has also been used to track safety of mpox (starting in November 2022) and RSV vaccines (starting in May 2023). Currently, the system monitors for events following COVID-19 and RSV vaccinations across the U.S. (mpox monitoring has been discontinued). V-safe is a passive, voluntary system where recipients of monitored vaccines can report to CDC how they feel after being vaccinated. Individuals may choose to sign up with V-safe after their vaccination, and the system will send text or email messages asking questions about symptoms or side effects they may or may not be experiencing. The reported data is collected and kept confidential at CDC. If participants report experiencing serious side effects or adverse events following a vaccination, they may be prompted to complete a VAERS report as well.

V-safe data has been used in multiple studies of adverse events following COVID-19, mpox, and RSV vaccinations. De-identified data from V-safe is made public by CDC on its data download website.

While V-safe can provide CDC with timely snapshots of vaccine safety issues through its text/email-based reporting approach, it is a voluntary, opt-in system so the population reporting through V-safe may not be representative of the population receiving a particular vaccines. In addition, initial reports through V-safe are self-reported and not verified. Therefore, analyzing and interpreting V-safe data requires care and an understanding of its limitations. The data can be useful to generate hypotheses and indicate possible concerns, but may not be suitable for determining definitive causal relationships between vaccines and safety issues.

Clinical Immunization Safety Assessment (CISA) – CDC

The Clinical Immunization Safety Assessment (CISA) Project was established in 2001 by CDC. It is a national-level network of vaccine safety experts drawn from CDC, medical research centers, and other partners. Providers who have questions or concerns about vaccine safety can submit information to CISA and request a consultation with its experts, which is provided free of charge. For example, CISA experts can provide clinical case consultations that help answer complex vaccine safety questions regarding individual patients, conduct research on vaccine safety issues, and help providers and organization with responses to vaccine safety issues. CISA participants have authored many published articles on vaccine safety, drawing on this expertise and the inquiries submitted to CISA.

CISA is not a vaccine safety surveillance system per se, but rather, serves as a resource for clinicians and others around the country to draw on when complex or unfamiliar issues come up when evaluating vaccine injuries in patients. This resource can help speed the identification of issues that do arise, and provide expert context to investigations and analyses of vaccine safety. CISA does not provide a systematic database of analyses and results, but has a record of academic articles published that address a broad set of vaccine safety concerns.

Conclusion

Federal vaccine safety monitoring spans regulatory oversight during clinical trials, through to post-licensure surveillance systems that include tracking of population-level outcomes at a broad scale. It includes passive systems that rely on individuals to report vaccine adverse reactions and active systems that can tap into data in almost real-time to identify issues. No single system can comprehensively address all vaccine safety monitoring needs, but this combination of systems provides a foundation for tracking and understanding vaccine safety issues.

Even so, concerns have been raised about whether these systems are sufficiently robust, and recent statements from Trump Administration officials reflect a broader debate about whether and how these systems could be improved and whether additional steps need to be taken to assure the public about the safety of current vaccines. Already, we’ve seen concerns about safety used to justify changes to vaccine recommendations at FDA and CDC, even without new evidence that vaccines are unsafe. The extent to which such concerns will lead to changes in federal tracking and reporting on vaccine safety is unknown.

Key Characteristics of Federal Vaccine Safety Monitoring Systems

Recent State Actions Impacting Immigrants’ Access to State-Funded Health Coverage and Other Public Programs

Published: Jul 16, 2025

In 2025, states have enacted or proposed a range of legislation that will impact immigrants’ access to state-funded health coverage and other public programs. Several states have proposed rolling back state-funded health coverage programs that expand coverage to immigrants regardless of status as part of broader state actions to reduce budget deficits amid economic uncertainties. At the same time, Congressional Republicans passed the budget reconciliation bill, which would reduce federal health program funding by more than $1 trillion over the next decade for states according to estimates from the Congressional Budget Office (CBO). These funding cuts could exacerbate financial pressure on states to eliminate state-funded coverage programs despite the potential for higher demand due to provisions limiting immigrants’ eligibility for Medicaid, Medicare, and Affordable Care Act (ACA) Marketplaces. States have also enacted laws expanding immigration enforcement that reflect the Trump administration’s increased interior enforcement activities to support mass deportation. More limited access to health coverage options and increased immigration enforcement activities may increase fear and uncertainty among immigrant families and have negative physical and mental health implications, including for their citizen children.

In contrast, some states have moved to limit interior enforcement activities and increase immigrants’ access to certain public benefits. While some states are seeking to enhance protections for immigrants, the Trump administration signed an executive order directing federal agencies to suspend federal grants and contracts with states or local jurisdictions identified as obstructing enforcement of federal immigration laws, or “sanctuary jurisdictions”, which may limit states’ ability to implement protections for immigrants.

This policy watch summarizes recent proposed actions by states related to state-funded health coverage for immigrants and trends in other legislation enacted during the 2025 session that have implications for immigrants. It is based on KFF analysis of publicly available materials and the National Conference of State Legislatures’ Immigration Legislation Database.

Access to State-Funded Health Coverage and Other Programs

As of June 2025, of the 14 states that offer state-funded health coverage to at least some immigrants regardless of status, three states (California, Illinois, and Minnesota) plus D.C. have proposed or enacted budgets to end or limit new enrollment of adults in these programs as part of broader efforts to reduce state budget deficits. Economic uncertainties and federal funding reductions that may reduce state revenues and the rising costs of health care and social services have driven states across the country to consider measures to reduce spending. California plans to maintain coverage for existing enrollees in their state-funded health coverage program but pause new enrollment for immigrant adults ages 19 and older starting in January 2026, end state-funded dental benefits starting in July 2026, and charge $30 monthly premiums to currently enrolled adults ages 19-59 starting in July 2027. Illinois plans to end their state-funded health coverage program for all immigrant adults ages 42 to 64 regardless of immigration status enrolled in the Health Benefits for Immigrant Adults (HBIA) program starting July 2025. This is in addition to Illinois’ previously announced pause in new enrollment in the Health Benefits for Immigrant Seniors (HBIS) program, which provides state-funded health coverage for immigrants 65 and older regardless of status. Minnesota plans to end their state-funded health coverage program for all undocumented immigrant adults ages 18 and older by 2026. The D.C. mayor’s proposed budget, subject to council approval, proposes ending coverage of immigrant adults 21 and older regardless of status in their locally-funded Healthcare Alliance program. Losing health coverage may have negative impacts on health care access and health outcomes as research suggests that coverage expansions for immigrants are associated with lower uninsured rates and improved access to care.

As of June 2025, states have also enacted legislation that would limit immigrant access to certain public benefits. In March 2025, Idaho enacted legislation that decreases the maximum income refugees in Idaho can earn to remain eligible for the Refugee Medical Assistance program from 150% to 133% of the federal poverty level (FPL). Idaho also enacted legislation in April 2025 preventing undocumented immigrants from accessing public benefits that were previously exempt from immigration status verification, including publicly-funded vaccinations, communicable disease testing, prenatal and postnatal care for women, crisis counseling, and food assistance for children. In May 2025, Tennessee enacted legislation that would hold churches and charitable organizations liable for providing housing aid to immigrants without legal status who commit crimes, which may reduce the services available to immigrants.

In contrast, several states have enacted legislation in 2025 to increase access to certain public benefits, the health care workforce, and educational opportunities for immigrants. In February 2025, Massachusetts enacted legislation requiring resettlement agencies to coordinate the provision of services to immigrant and refugee families and pregnant women. In February 2025, New York enacted legislation to direct their Military Immigrant Family Legacy Program to connect noncitizen military members and their families to immigration legal assistance. In March 2025, Utah enacted legislation to create a new Refugee Services Office to coordinate services and benefits available to refugees. Washington and Oklahoma enacted legislation in April and May 2025, respectively, that would allow international medical graduates to practice in health care facilities in certain situations. In May 2025, Oregon enacted legislation exempting asylum seekers enrolled in the state’s public universities from paying non-resident tuition and fees, and Colorado enacted legislation that removed a requirement for immigrants to attest that they have applied or will apply for lawful presence when applying for in-state tuition at the state’s public universities.

Immigration Enforcement

Several states have enacted legislation in 2025 to enhance law enforcement against undocumented immigrants and implement increased immigration verification requirements for driver’s licenses and voting. Some states have enacted legislation related to law enforcement actions against immigrants, continuing trends in recent years on immigration enforcement. For example, Indiana enacted legislation in May 2025 which would enhance criminal sentencing if the individual is an undocumented immigrant, and Missouri enacted legislation in March 2025 that would require law enforcement to submit immigration status data to a statewide database. Some states also have prohibited local level policies that would limit cooperation with federal immigration enforcement authorities. For example, legislation enacted in North Dakota in April 2025 and in New Hampshire in May 2025 prohibit state and local government entities from adopting sanctuary policies. Several states have also continued passing driver’s licensure laws impacting immigrants. For example, Wyoming enacted legislation in February 2025 limiting noncitizens’ access to driver’s licenses. Kansas and Tennessee enacted legislation in April 2025 that would create a database of noncitizens holding driver licenses. States have also enacted legislation related to voting, such as in Alabama in May 2025 that prevents foreign driver’s licenses from being used as voter identification and in Wyoming in March 2025 that would allow the state to verify immigration status during voter registration.

In contrast, some states have also enacted legislation that may limit federal immigration enforcement in certain settings. In March 2025, Connecticut and Delaware enacted legislation requiring every school to have a designated administrator and a plan for interacting with federal immigration authorities and prohibiting public schools from sharing student information without a warrant. In May 2025, Maryland enacted legislation prohibiting sensitive locations such as schools and libraries from allowing federal immigration enforcement officials entry, with some exceptions. In May 2025, Colorado enacted legislation that would limit sharing of immigration status with federal immigration authorities and increase protections for immigrants in public facilities from enforcement.

Key Facts About Medicare Part D Enrollment, Premiums, and Cost Sharing in 2025

Authors: Juliette Cubanski and Anthony Damico
Published: Jul 16, 2025

The Medicare Part D program provides an outpatient prescription drug benefit to more than 50 million older adults and people with long-term disabilities in Medicare who enroll in private plans, including stand-alone prescription drug plans (PDPs) to supplement traditional Medicare and Medicare Advantage prescription drug plans (MA-PDs) that include drug coverage and other Medicare-covered benefits. This brief analyzes Medicare Part D enrollment and costs in 2025 and trends over time, based on data from the Centers for Medicare & Medicaid Services (CMS).

Highlights for 2025

  • Enrollment in Medicare Part D stand-alone PDPs remained stable at 23 million in 2025, despite monthly premium increases in some PDPs of up to $35, the maximum increase allowed for plans participating in the Part D premium stabilization demonstration, which included measures intended to stabilize the PDP market as major changes to the Part D benefit took effect in 2025, including a new $2,000 out-of-pocket spending cap.
  • Medicare Advantage continues to be the primary source of Part D drug coverage for people with Medicare, with close to 32 million enrollees. Overall, Part D enrollment is concentrated in a handful of large plan sponsors, including UnitedHealth, Centene, Humana, and CVS Health.
  • Enrollment in the Part D Low-Income Subsidy (LIS) decreased in 2025, from 13.7 million to 13.1 million, the first decrease in enrollment since 2007, the first full year of the Part D program. This decrease is likely related to Medicaid disenrollment among dual-eligible individuals that stemmed from the unwinding of the Medicaid continuous enrollment provision in place during the COVID-19 pandemic
  • Average monthly premiums decreased for both PDPs and MA-PDs in 2025, but the average monthly premium for Part D coverage is still substantially higher for PDPs than for MA-PDs ($39 versus $7), mainly because most MA-PD enrollees are in zero-premium plans, which is related to the ability of Medicare Advantage plan sponsors to reduce their Part D premiums using rebates, which are not available to PDP sponsors.
  • Median cost-sharing amounts for drugs covered on some formulary tiers are the same or similar in PDPs and MA-PDs, but PDP enrollees are more likely than MA-PD enrollees to face coinsurance for preferred brands and non-preferred drugs, while MA-PD enrollees face higher median coinsurance for specialty tier drugs.

Part D Enrollment

Medicare Advantage drug plans continue to enroll more beneficiaries than stand-alone drug plans, but PDP enrollment has stabilized

More than half (58%) of all Part D enrollees in 2025 are in Medicare Advantage drug plans, continuing a trend of increasing enrollment in Medicare Advantage plans (Figure 1). Despite some concerns about the stability of the stand-alone PDP market as changes to the Part D benefit took effect in 2025 and an overall reduction in the number of PDPs for 2025, that decline did not result in lower overall PDP enrollment in 2025. In fact, the number of PDP enrollees has increased by 1 million since 2023. MA-PD enrollment growth was more than three times larger over the same period, however, with enrollment in MA-PDs increasing by 3.3 million between 2023 and 2025.

More Medicare Part D Enrollees Are in Medicare Advantage Drug Plans Than in Stand-alone Prescription Drug Plans, but PDP Enrollment Has Stabilized

Part D Low-Income Subsidy enrollment is tilted even more towards Medicare Advantage drug plans than overall Part D enrollment, but overall LIS enrollment decreased in 2025

The Medicare Part D Low-Income Subsidy (LIS) provides financial assistance with drug plan premiums and cost sharing for low-income enrollees. Two-thirds of LIS enrollees – 8.8 million out of 13.1 million – are enrolled in Medicare Advantage drug plans in 2025 (Figure 2). Six million LIS enrollees are enrolled in Medicare Advantage Special Needs Plans (SNPs), nearly all of whom are in plans designed specifically for dual-eligible individuals (Table 1). LIS enrollment in MA-PDs has increased over time in tandem with overall enrollment of Medicare beneficiaries in Medicare Advantage plans.

At the same time, Part D LIS enrollment overall decreased in 2025, from 13.7 million to 13.1 million – the first decrease in enrollment since 2007, the first full year of the Part D program. This decrease is likely due to Medicaid disenrollment among dual-eligible individuals that stemmed from the unwinding of the Medicaid continuous enrollment provision in place during the COVID-19 pandemic. Medicare beneficiaries with Medicaid coverage (dual-eligible individuals) automatically qualify for LIS, meaning a loss of Medicaid coverage would lead to a loss in LIS unless eligible individuals apply and enroll separately.

Two-Thirds of Beneficiaries Receiving the Part D Low-Income Subsidy Are Enrolled in Medicare Advantage Drug Plans in 2025

Five firms cover nearly three-fourths of Part D enrollees in 2025

Part D enrollment is concentrated in a handful of top plan sponsors, with 5 firms covering 73.5% of all Part D enrollees in 2025, or 40.2 million out of 54.8 million enrollees (Figure 3). Nearly 1 in 4 enrollees (12.6 million) are in Part D plans sponsored by UnitedHealth, including both stand-alone PDPs and MA-PDs. CVS, Humana, and Centene each have around 15% of the Part D market, with enrollees in both types of Part D plans.

Centene is the top firm in the PDP market, with one-third (34%) of all PDP enrollees, followed by CVS Health (18%) and UnitedHealth (15%), while UnitedHealth is the top firm in the MA-PD market, with 29% of all MA-PD enrollees, followed by Humana (17%) and CVS Health (11%).

The Top 5 Firms Cover Nearly Three-Fourths of Part D Enrollees in 2025

Nearly 5 million PDP enrollees – more than 1 in 4 – are enrolled in the lowest-premium PDP in 2025

Among the 12 national PDPs available in 2025, only one – Wellcare Value Script – has an average monthly premium less than $10 and, likely for this reason, has attracted a substantial share of all PDP enrollees, with more than 1 in 4, or 5 million, PDP enrollees in 2025 (Figure 4). Between 2024 and 2025, Wellcare Value Script gained 1.2 million PDP enrollees, as several other national PDPs experienced smaller increases and some PDPs lost enrollment, even after taking plan consolidations into account (Table 2).

Nearly 5 Million PDP Enrollees - More Than 1 in 4 - Are In the Lowest-Premium PDP in 2025; Fewer Are Enrolled in PDPs With the Highest Premiums

The number and share of LIS enrollees in national PDPs vary considerably, which is related to the fact that only 5 of these 12 plans are benchmark PDPs, meaning they are available to Part D enrollees receiving LIS for no premium. For example, a majority of all enrollees in Wellcare Classic (83% or 2.1 million) are receiving LIS; this is a benchmark plan in 33 of 34 PDP regions (Table 3). More than two-thirds of enrollees in Cigna Healthcare Assurance Rx, a benchmark plan in 12 regions, are LIS enrollees (69% or 0.7 million). In contrast, only 3% of the 5 million enrollees in Wellcare Value Script are LIS enrollees; despite its low average premium, this is an enhanced PDP and therefore does not qualify to be a benchmark plan.

Overall, 15% (0.6 million) of the 4.2 million PDP enrollees receiving LIS (excluding those in employer group plans) are enrolled in non-benchmark PDPs. LIS enrollees in non-benchmark plans are required to pay a portion of the plan’s premium for the cost of basic benefits that exceeds the LIS benchmark amount in their region or if their plan charges a premium for enhanced benefits.

Part D Premiums

Average monthly premiums decreased for both PDPs and MA-PDs in 2025, but the average monthly premium for Part D coverage is still substantially higher for PDPs than for MA-PDs

The Part D premium demonstration for stand-alone PDPs established by the Biden administration in 2024 worked as intended to stabilize PDP premiums, with the average monthly PDP premium decreasing 9% between 2024 and 2025 from $43 to $39, despite monthly premium increases in some PDPs of up to $35, the maximum increase allowed for plans participating in the premium stabilization demonstration.

The $39 average monthly PDP premium, based on current enrollment after the end of the open enrollment season for 2025, is lower than the estimated $45 monthly PDP premium for 2025, which was based on enrollment in June 2024 and did not account for plan switching by current enrollees or plan choices by new enrollees during the open enrollment period. Taking into account plan switching and new enrollment into lower premium plans resulted in the lower enrollment-weighted average monthly premium for 2025.

On average, PDP enrollees continue to pay substantially more each month for their Part D drug coverage than enrollees in Medicare Advantage drug plans. The $39 average monthly PDP premium is nearly 6 times higher than the $7 average monthly premium for drug coverage in MA-PDs (weighted by enrollment) (Figure 5). (The total average premium for MA-PDs, including all Medicare-covered benefits, is $13 per month in 2025.) The weighted average MA-PD premium decreased by 25% between 2024 and 2025 (down from $9 to $7).

The difference between average monthly premiums for drug coverage offered by PDPs and MA-PDs has been growing larger, with the average PDP premium rising and the average MA-PD premium falling. The average premium for drug coverage in MA-PDs is heavily weighted by zero-premium plans because MA-PD sponsors can use rebate dollars from Medicare payments to lower or eliminate their Part D premiums. Rebates to Medicare Advantage plans have doubled since 2018 and now exceed $2,000 per year per beneficiary.

The Average Monthly Premium for Part D Drug Coverage is Nearly 6 Times Larger for Stand-Alone Drug Plans Than for Medicare Advantage Drug Plans in 2025

Eight in 10 MA-PD enrollees without low-income subsidies pay no monthly premium for Part D coverage compared to 3 in 10 PDP enrollees

Nearly 80% of MA-PD enrollees without low-income subsidies (15.1 million) pay no monthly premium for Part D coverage in 2025, compared to 31% of PDP enrollees without LIS (4.3 million). For 2025, Medicare beneficiaries had access to 29 zero-premium MA-PD plans on average, whereas only 1 PDP – Wellcare Value Script – was available for zero premium for non-LIS enrollees in most PDP regions (29 out of 34), and 6 other PDPs were available for zero premium in 5 or fewer PDP regions.

Just over half of PDP enrollees without LIS (51%) pay $30 or more – including 1 in 7 PDP enrollees without the LIS (14%) who pay at least $100 per month for their Part D plan (Figure 6). In contrast, less than 10% of MA-PD enrollees pay $30 or more per month for Part D coverage, and less than 1% pay $100 per month or more.

Interactive DataWrapper Embed

Out-of-Pocket Costs

Most Part D enrollees are in plans that charge a deductible for drug coverage in 2025, including 60% of MA-PD enrollees and 85% of PDP enrollees

Among MA-PD enrollees, 60% (12.3 million) are in a plan that charges a deductible for drug coverage – an increase from 2024, when only 23% of MA-PD enrollees were in a plan charging a drug deductible. In 2025, 12% of MA-PD enrollees are in a plan that charges the standard deductible of $590 (up from 3% in 2024) and 49% face a partial deductible averaging $328 (Figure 7).

A large majority of PDP enrollees (85% or 15.3 million) are in a plan that charges a drug deductible in 2025, including more than three-fourths (77%) in a plan that charges the standard deductible of $590 and 8% facing a partial deductible averaging $495. (These estimates include Part D enrollees receiving Low-Income Subsidies, who do not pay a deductible regardless of whether their plan

Most Part D Enrollees Are in Plans That Charge a Deductible for Drug Coverage in 2025, Including 60% of MA-PD Enrollees and 85% of PDP Enrollees

PDP enrollees are more likely than MA-PD enrollees to face coinsurance for preferred brands and non-preferred drugs, while MA-PD enrollees face higher median coinsurance for specialty tier drugs

As in previous years, Part D enrollees face low copayments for generic drugs and higher cost-sharing amounts for preferred brands, non-preferred drugs, and specialty drugs, regardless of whether they are in PDPs or MA-PDs (Figure 8). Median copayments for drugs covered on generic tiers are the same in PDPs and MA-PDs, but for preferred brands and non-preferred drugs, PDP enrollees are much more likely than MA-PD enrollees to pay coinsurance, or a percentage of a drug’s price. Whereas most MA-PD enrollees face a median copayment of $47 for preferred brands, most PDP enrollees face median coinsurance of 21%. For non-preferred drugs, a somewhat larger share of MA-PD enrollees face median coinsurance of 42% than a copayment of $100, while all PDP enrollees face coinsurance for non-preferred drugs, with a median rate of 40%.

Median coinsurance for specialty tier drugs (those that cost over $950 in 2025) is higher for MA-PD enrollees than PDP enrollees – 30% vs. 25%. Plans that waive some or all of the standard deductible, which most MA-PDs do, are permitted to set the specialty tier coinsurance rate above 25%.

These cost-sharing amounts apply when beneficiaries fill prescriptions in the initial coverage phase of the Part D benefit. Under a provision in the Inflation Reduction Act, beneficiaries no longer face cost sharing in the catastrophic coverage phase of the Part D benefit. In 2025, Medicare beneficiaries will pay no more than $2,000 out of pocket for prescription drugs covered under Part D.

Part D Enrollees Face Similar Cost-Sharing Amounts for Some Covered Drugs in PDPs and MA-PDs in 2025, But a Larger Share of PDP Enrollees Face Coinsurance for Preferred Brands and Non-Preferred Drugs

Among the 12 PDPs offered nationwide, most charge $0 for preferred generics but only 2 charge flat copayments for preferred brands and all charge coinsurance for non-preferred drugs

Part D enrollees in 8 of the 12 national PDPs face a median copayment of $0 for preferred generics, while median copays for drugs on the standard generic tier range from $0 to $10 (Figure 9). For preferred brands, 10 of 12 national PDPs charge coinsurance, with median amounts ranging from 15% to 25%, and only 2 national PDPs charge copays. All 12 national PDPs charge coinsurance for non-preferred drugs, ranging from 31% to 50% at the median, and coinsurance for specialty tier drugs ranging from 25% to 33%.

Among the 12 PDPs Offered Nationwide, Most Charge $0 for Preferred Generics but Only 2 Charge Flat Copayments for Preferred Brands and All Charge Coinsurance for Non-preferred Drugs
Medicare Part D and Part D Low-Income Subsidy Program Enrollment, by Plan Type, 2006-2025
Enrollment and Premiums for Medicare Part D Stand-Alone Prescription Drug Plans Offered Nationwide in 2024 and 2025
Enrollment in Medicare Part D Stand-Alone Prescription Drug Plans Offered Nationwide in 2025, By Low-Income Subsidy Status

Juliette Cubanski is with KFF. Anthony Damico is an independent consultant.


The Uncertain Future of Medicare’s Stand-Alone Prescription Drug Plan Market and Why It Matters

Published: Jul 16, 2025

Ahead of Medicare’s annual mid-year announcement about the national average premium for Part D prescription drug coverage in 2026 and other plan details, two questions loom large for the insurers that sponsor Part D stand-alone prescription drug plans (PDPs) and the 23 million people in traditional Medicare who are currently enrolled in these plans: Will the Trump administration continue Medicare’s Part D premium stabilization demonstration for a second year, and what will the PDP market look like in 2026 and in subsequent years? The answer to the first question could determine whether monthly PDP premiums remain at a relatively affordable level and whether PDP availability remains stable in 2026. The answer to the second question has larger implications for the viability of traditional Medicare as an option for beneficiaries nationwide but especially for beneficiaries who live in rural areas. This is because rural Medicare beneficiaries are more likely to be enrolled in traditional Medicare and rely more on drug coverage from stand-alone PDPs than Medicare Advantage plans.

Why does the stability of the PDP market matter?

For Medicare beneficiaries who are enrolled in traditional Medicare, which is just under half of all people with Medicare, getting Medicare Part D prescription drug coverage means enrolling in a stand-alone PDP. For Medicare beneficiaries who qualify for the Part D Low-Income Subsidy (LIS), enrolling in certain PDPs provides the only guaranteed option for premium-free drug coverage and lower cost sharing. In recent years, the overall number of PDPs has declined, with the number of PDPs available to the average beneficiary decreasing from 30 in 2021 to 14 in 2025 (Figure 1). The number of premium-free (“benchmark”) plans for LIS enrollees is even lower and decreased from 8 benchmark PDPs in 2021 to 2 in 2025. Over this period, the average number of Medicare Advantage drug plans (MA-PDs) increased from 27 to 34.

The Number of Part D Stand-Alone Prescription Drug Plan Options for the Average Medicare Beneficiary Has Fallen by Half in Recent Years, While Medicare Advantage Drug Plan Options Have Increased

Ultimately, the erosion of the PDP market – fewer plans coupled with rising premiums – could diminish the ability of Medicare beneficiaries in traditional Medicare to obtain affordable Medicare Part D drug coverage, leaving them with little choice but to enroll in Medicare Advantage, a choice that comes with tradeoffs. While Medicare Advantage plans typically charge zero premium beyond the standard Part B premium and offer extra benefits than what is covered under traditional Medicare, they also have more limited provider networks and greater use of prior authorization than in traditional Medicare. The erosion of the PDP market could also further reduce premium-free stand-alone drug plan choices for low-income Medicare beneficiaries.

Why is PDP market stability an issue for rural Medicare beneficiaries in particular?

While most people with Medicare live in urban areas, a majority of Medicare beneficiaries who live in the nation’s most rural areas are enrolled in traditional Medicare, not Medicare Advantage, and six in 10 of these beneficiaries are enrolled in stand-alone PDPs in 2025 (Figure 2).

Nearly 6 in 10 Medicare Part D Enrollees Who Live in the Nation's Most Rural Areas Are Enrolled in Stand-Alone Prescription Drug Plans

If rural Medicare beneficiaries in traditional Medicare are unable to obtain affordable Medicare drug coverage through PDPs, they could be left with no option but to enroll in Medicare Advantage if they want Part D coverage. However, beneficiaries living in rural areas have far fewer Medicare Advantage plan options than those in urban areas, often with more limited provider networks.

What was the impetus for the Part D premium stabilization demonstration?

The Part D premium demonstration was established in 2024 ahead of a major redesign of the Part D benefit that took effect in 2025, including a new $2,000 out-of-pocket drug spending cap and changes that significantly shifted benefit costs from the federal government to Part D plan sponsors. Sponsors of Part D stand-alone drug plans projected greater variability in the impact on their benefit costs than sponsors of Medicare Advantage drug plans, and the voluntary demonstration, established under the federal government’s Section 402 demonstration authority, provided additional premium subsidies to stand-alone PDPs to prevent substantial premium increases along with other measures designed to help stabilize the PDP market.

What was the effect of the PDP stabilization demonstration in 2025?

The demonstration worked as intended to stabilize premiums, with the average monthly PDP premium holding steady at under $40 in 2025, despite monthly premium increases in some PDPs of up to $35, the maximum increase allowed for plans participating in the premium stabilization demonstration. Even as the number of PDPs dropped from 709 to 464, enrollment in stand-alone PDPs remained stable for 2025, suggesting that the demonstration helped to minimize disruption in the PDP market that might otherwise have occurred.

How much did the PDP stabilization demonstration cost the federal government?

The Congressional Budget Office (CBO) estimated that the demonstration would cost $5 billion in 2025. Some GOP members of Congress criticized these additional subsidies to PDPs as shifting costs from plan sponsors and enrollees to taxpayers. However, these subsidies are being offered to PDPs on a temporary demonstration basis. By comparison, through the existing statutory Medicare Advantage payment system, the government is providing additional Part D subsidies to Medicare Advantage plans in the form of rebates that total more than $500 per year for each MA-PD enrollee in 2025. This amounts to close to $11 billion in additional federal subsidies that MA-PD sponsors are using to lower or eliminate their Part D premiums and offer Part D supplemental benefits in 2025. As a result, most MA-PD enrollees pay no premium for their Medicare Advantage Part D drug coverage.

In response to a 2024 request from members of the House and Senate GOP, the U.S. Government Accountability Office (GAO) recently issued a legal decision that the Part D premium stabilization demonstration is consistent with the authority granted to the HHS Secretary under Section 402 of the Social Security Act to conduct Medicare payment demonstrations. GAO’s official assessment of the legality of the demonstration may take some of the wind out of the sails of its critics, but it doesn’t bind the Trump administration to continuing the demonstration beyond 2025.

What comes next?

The Trump administration has not provided a clear signal as to whether it will continue the PDP premium stabilization demonstration for 2026 and if so what the specific parameters will be. That announcement is expected at the end of July. For Medicare beneficiaries in traditional Medicare, and rural Medicare beneficiaries in particular, continuation of the Part D premium stabilization demonstration could be key to ensuring access to relatively affordable Part D coverage through PDPs in 2026.

Plan-level Part D premiums for 2026 are not yet known and will be announced in the fall. Premiums are expected to vary across plans, with lower monthly premiums for MA-PDs than PDPs, on average. If so, this would be consistent with 2025, when average monthly premiums are $7 for MA-PDs and $39 for PDPs. The lower average MA-PD premium is heavily weighted by zero-premium plans, with MA-PD sponsors using rebates to reduce their Part D premiums.

The premium differential in 2026 could be even greater, however, if the Trump administration decides to scale back or terminate the PDP premium stabilization demonstration. Doing so could also result in further reductions in PDP availability, which would have implications for access to Part D drug coverage among Medicare beneficiaries enrolled in PDPs. If PDP options become less numerous and more expensive, that could hasten the shift of enrollees from traditional Medicare to Medicare Advantage. With the federal government spending more per beneficiary in Medicare Advantage than traditional Medicare, that would mean even higher federal spending over time.

This work was supported in part by Arnold Ventures. KFF maintains full editorial control over all of its policy analysis, polling, and journalism activities.

Key Facts on Abortion in the United States

Published: Jul 15, 2025

Introduction

Note: This brief was updated on July 15, 2025 to incorporate new data on abortion statistics.

The Supreme Court’s 2022 ruling in Dobbs v. Jackson Women’s Health Organization overturned the constitutional right to abortion that had been in place for nearly 50 years under Roe v. Wade. Prior to the Dobbs ruling, abortions were permitted up to fetal viability in all states. That federal standard was eliminated under Dobbs, allowing states to ban or restrict abortion before viability. KFF is tracking and updating the status of abortion access and availability, with some states banning almost all abortions and some states protecting abortion access.

This issue brief answers some key questions about abortion in the United States and presents data collected before and since the Dobbs ruling.

What is abortion?

Abortion is the medical termination of a pregnancy. It is a common medical service that many women obtain at some point in their life. There are different types of abortion methods, which the National Academy of Sciences, Engineering, and Medicine (NASEM) places in four categories:

  • Medication Abortion – Medication abortion, also known as medical abortion or abortion with pills, terminates a pregnancy by oral medications. There are two widely accepted protocols for medication abortion. In the U.S., the most common protocol involves the drugs mifepristone and misoprostol. Typically, an individual takes mifepristone first, followed by misoprostol 24-48 hours later. The U.S. Food and Drug Administration (FDA) has approved this abortion protocol up to the first 70 days (10 weeks) of pregnancy. Another medication abortion protocol uses misoprostol alone, which is also recommended for up to 70 days (10 weeks) of pregnancy, but it is not currently approved by the FDA and is more commonly used in other countries.

The Guttmacher Institute estimates that in 2023, medication was used for almost two thirds (63%) of all abortions. Many have confused emergency contraception (EC) pills with medication abortion pills, but EC does not terminate a pregnancy. EC is a contraceptive that prevents pregnancy by delaying or inhibiting ovulation and will not affect an established pregnancy.

  • Aspiration, a minimally invasive and commonly used gynecological procedure, is the most common form of procedural abortion. It can be used to conduct abortions up to 14-16 weeks of gestation. Aspiration is also commonly used in cases of early pregnancy loss (miscarriage).
  • Dilation and evacuation abortions (D&E) are usually performed after the 14th week of pregnancy. The cervix is dilated, and the pregnancy tissue is evacuated using forceps or suction.
  • Induction abortions are rare and conducted later in pregnancy. They involve the use of medications to induce labor and delivery of the fetus.

What does research show about the safety of abortions?

Decades of research have shown that abortion is a very safe medical service.

Despite its strong safety profile, abortion is the most highly regulated medical service in the country and is now banned in several states. Additionally, many states impose other limitations on abortion that are not medically indicated, including waiting periods and parental notification and consent requirements that typically delay receipt of services.

  • NASEM completed an exhaustive review on the safety and effectiveness of abortion care and concluded that complications from abortion are rare and occur far less frequently than during childbirth.
  • NASEM also concluded that safety is enhanced when the abortion is performed earlier in the pregnancy. State level restrictions such as waiting periods, ultrasound requirements, and gestational limits that impede access and delay abortion provision likely make abortions less safe.
  • When medication abortion pills are administered at or before 9 weeks gestation, the pregnancy is terminated successfully 99.6% of the time, with a 0.4% risk of major complications, and an associated mortality rate of less than 0.001 percent.
  • Studies on procedural abortions, which include aspiration and D&E, have also found that they are very safe, with the rate of major complications less than 1% for aspiration abortions. Abortion medications and procedures are also often used for people experiencing miscarriages and stillbirths and can improve safety by preventing delays when a loss is inevitable.
  • Most OBGYN physicians say that the Dobbs decision has had a negative impact on maternal health and patient safety. In a national KFF survey of OBGYNs, more than six in ten say that racial and ethnic inequities in maternal health (70%), management of pregnancy-related medical emergencies (68%), and pregnancy-related mortality have all worsened (64%) since the Dobbs

What is the status of abortion policy in the U.S.?

Since the 2022 Dobbs ruling, abortion has been banned in 12 states, and another 6 states have implemented early gestational limits between 6 and 12 weeks. Most other states allow abortion to the point of fetal viability, which is generally considered around 24 weeks gestation.

Status of Abortion Bans in the United States as of June 2, 2025

All states that ban abortion have exceptions if an abortion is needed to prevent the death of the pregnant person. Additionally, some state bans make exceptions when the pregnancy is threatening the pregnant person’s health, when the pregnancy is the result of rape or incest, and when there is a lethal fetal anomaly. However, in practice, these exceptions have proven to be unworkable except in the most extreme circumstances. Furthermore, eight states that ban abortion do not make exceptions for cases of rape or incest and six do not have exceptions to protect the health of pregnant people.

How common are abortions?

The most recent data estimates that more than one million abortions (1,141,830) occurred in the U.S. in 2024.

Three different organizations currently track abortion volume at the state and the federal levels: the federal Centers for Disease Control and Prevention (CDC), the Guttmacher Institute, and the Society for Family Planning (SFP). The CDC has been collecting abortion data for decades, but several states do not provide data to the federal government (reporting to the CDC is voluntary) and there is a two-to-three-year time lag until the data become publicly available.

Since the Dobbs ruling, the Guttmacher Institute’s Monthly Abortion Provision Study and the SFP’s #WeCount have been tracking state level changes in abortion volume based on data provided by abortion clinics and providers. Both studies provide national and state-level estimates on procedural and medication abortions but differ in some methodologic details. The Guttmacher study compares current abortion rates to 2020, while #WeCount compares rates to the months immediately before Dobbs in 2022. Neither source includes data on self-managed abortions, which are abortions that a pregnant person can do on their own by taking medication abortion pills without clinical supervision. For more details about data sources, see KFF’s issue brief on abortion trends.

For most of the decade prior to the Dobbs ruling, there was a steady decline in abortion rates nationally, but there was a slight increase in the years just before the ruling. Immediately following the Dobbs ruling, the number of abortions in the U.S. dropped as more states enforced bans and restrictions.

Paradoxically, the most recent data show that the abortion volume in the U.S. slightly increased overall in the two years following the Dobbs ruling.

In 2024, the national abortion volume averaged 95,200 abortions per month, higher than the monthly averages in 2023 and before the Dobbs decision. This overall increase in the number of abortions nationally can be largely attributed to the growth of telehealth for medication abortion, increased availability of lower cost medication abortion pills through virtual clinics, and in particular shield law abortions, where clinicians in legal states are mailing pills to individuals residing in states with bans and restrictions. Additionally, in several states without bans, there has been increased interstate travel for abortion access, expanded capacity to see patients, increased measures to protect abortion rights and improve coverage of abortion care for residents and out-of-state patients, and the broader availability of low-cost abortion medication.

However, the small upswing nationally obscures the massive declines in abortion access to in-state providers in states with bans and restrictions as well as the hardships that many pregnant people experience in accessing abortion care. Additionally, there are month-to-month variations in all states, and changes in policy can cause larger shifts. For example, in May 2024 Florida implemented a ban on abortions after six weeks gestation (previously permitted up to 15 weeks), and subsequently there was a noticeable decline in abortions in the state and nationally.

While the Overall Number of Abortions in the U.S. Increased in the Two Years After Dobbs, There is Great Variation Between States That Permit and Ban Abortion

Who gets abortions?

Most of the information about people who receive abortions comes from CDC data. In 2022, the most recent year CDC data are available, women across a range of age groups, socioeconomic status, and racial and ethnic backgrounds obtained abortions, but the majority were obtained by women who were in their twenties, low-income, and women of color.

  • Women in their twenties accounted for more than half (57%) of abortions. Nearly one-third (31%) were among women in their thirties and a small share were among women in their 40s (4%) and teens (9%).
  • Information on the race and ethnicity of people who obtain abortions is particularly limited, but based on available data, more than half of abortions were among women of color in 2022. Black women comprised 40% of abortion recipients, 32% were provided to White women, 21% to Hispanic women, and 7% were among women of other races/ethnicities. Additionally, White, Black, and American Indian and Alaska Native women are disproportionately represented among women ages 18-49 in states that have banned abortion compared to states that provide broader access to abortion. Many women who sought abortions have children. Approximately six in 10 (59%) abortion patients in 2022 had at least one previous birth.
Most Abortion Patients in 2022 Were in Their 20s and Had at Least One Previous Birth

The vast majority (93%) of abortions occur during the first trimester of pregnancy according to data available from before the Dobbs decision.

Before the 2022 ruling in Dobbs, there was a federal constitutional right to abortion before the pregnancy is considered to be viable, that is, can survive outside of a pregnant person’s uterus. Viability is generally considered around 24 weeks of pregnancy. Most abortions, though, occur well before the point of fetal viability. When people have abortions later in pregnancy, it is often because the fetus is not viable and the pregnancy may endanger the pregnant person’s life.

  • Data from 2022 found that four in ten (40%) abortions occurred by six weeks of gestation, another four in ten (39%) occurred between seven and nine weeks, and 14% at 10-13 weeks. Just 7% of abortions occurred after the first trimester.
The Vast Majority of Abortions in 2022 Occurred Prior to 10 Weeks of Gestation

Where do people get abortion care?

Abortions can be provided in a variety of settings. Recent data on site of abortion care are limited, but historically the majority of abortions have been provided at brick and mortar clinics that specialize in provision of reproductive health care. Some private office-based physicians also offer abortion services and in more recent years, there has been an emergence of virtual only clinics that offer medication abortions.

Brick-and-mortar clinics vary, but they can offer medication abortion, procedural abortions, and services for abortions later in pregnancy. Many clinics in states where abortion is restricted or banned stopped offering abortion services shortly after the Dobbs ruling and the overall number of brick-and-mortar independent clinics in the US has decreased over the years, with over 75 independent abortion clinics shutting down between 2022 and 2024. Contrary to expectations though, the number of abortions from these clinics increased overall since the Dobbs ruling. The distribution of facilities that offer abortion care varies widely by state and geographic region, and the increase is largely driven by the expansion of virtual abortion clinics. While virtual clinics can remove geographic barriers for those seeking abortion care, their services are limited to medication abortion which is only available to those seeking abortions early in pregnancy. Even prior to the ruling in Dobbs, access to abortion services was very uneven across the country. The proliferation of restrictions in many states, particularly in the South, greatly constrained the availability of services in some areas. In the wake of overturning Roe v. Wade, these geographic disparities have only widened.

Telehealth

Telehealth has grown as a delivery mechanism for abortion services. While procedural abortions must be provided in person in a clinical setting, medication abortion can be provided in a clinical setting or via telehealth without an in person visit. An estimated one in four abortions were provided via telehealth in the last quarter of 2024. Access to medication abortion via telehealth was limited for many years by an FDA policy that permitted only certified clinicians to dispense mifepristone within a health care setting. In December 2021, however, the FDA permanently revised this policy and no longer requires clinicians to dispense the drug in person. Additionally, in January 2023, the FDA finalized a policy change that allows retail pharmacies to dispense medication abortion pills to patients with a prescription. These policy changes opened the door to using telehealth for medication abortion.

  • Telehealth can be administered by providers from traditional brick-and-mortar clinics or by virtual-only clinics. Virtual clinics began to proliferate after the FDA revised its in-person dispensing requirement in 2021, rising from no virtual clinics in 2020 to 226 clinics in 2023 (representing 24% of facilities that offer medication abortion).
  • In a telehealth abortion, the patient typically completes an online questionnaire to assess (1) confirmation of pregnancy, (2) gestational age and (3) blood type. If determined eligible by a remote clinician, the patient is mailed the medications. This model does not require an ultrasound for pregnancy dating if the patient has regular periods and is sure of the date of their last menstrual period (in line with ACOG’s guidelines for pregnancy dating). If the patient has irregular periods or is unsure how long they have been pregnant, they may need to obtain an ultrasound to confirm the weeks of gestation and rule out an ectopic pregnancy and send in the images for review before receiving medications. The follow-up visit with a clinician can also happen via a telehealth visit.
  • Research has found that the provision of medication abortion via telehealth is as safe and effective as the provision of the pills at an in person visit. Yet, in some states that have not banned abortion, telehealth may not be available because of state-level restrictions enacted prior to the Dobbs ruling that require patients to take the pills at a physical clinic, require ultrasounds for all abortions, or directly ban telehealth for abortion care. Of the 36 states that have not banned abortion, 12 had at least one of these restrictions as of March 2024.
  • Medication abortion has emerged as a major legal and legislative front in the battle over abortion access across the nation. Multiple cases have been filed in federal and state courts regarding aspects of the FDA’s regulation of medication abortion as well as the mailing of medications.
  • Some states have passed shield laws, designed to reduce the legal risks for clinicians who provide abortion care to patients who live in states where abortion is banned or restricted. The shield laws bar the clinicians’ resident state from extraditing them if a restrictive state attempts to prosecute the clinician for performing an abortion that is otherwise legal in their home state. As of September 2024, 8 states have shield laws in place that explicitly protect providers regardless of patient location.
  • Data from SFP’s latest #WeCount report show that one in four (25%) abortions were provided via telehealth towards the end of 2024. These telehealth abortions include those provided by brick-and-mortar clinics, virtual clinicians, and clinicians in states with shield laws who prescribe medication abortion to patients in states with bans or telehealth restrictions.
One in Four Abortions Are Now Provided Via Telehealth

Self-Managed Abortions

Self-managed abortions typically involve obtaining medication abortion pills from an online pharmacy that will send the pills by mail or by purchasing the pills from a pharmacy in another country, usually without the involvement of a physician or advanced practice clinician. While this can involve asynchronous contact with non-US-based clinicians, it does not typically involve a direct consultation with a clinician either in person or via telehealth.

It is difficult to track the volume of self-managed abortions since they are outside of the formal health care system, and it is unknown if all people who receive medication pills take them. One study estimated that at least 26,000 additional self-managed medication abortions took place in the six months following the Dobbs ruling. More than half of self-managed medication abortions pills were distributed through volunteers in community networks, while others were provided by telehealth organizations outside the formal U.S. health care system and online vendors.

Interstate Travel

The Guttmacher Institute Monthly Abortion Provision Study is the only data source so far to provide in-depth information on interstate travel pre- and post-Dobbs. Guttmacher estimates that prior to Dobbs, nearly one in ten people obtained an abortion by traveling across state lines in 2020. Even before Roe v Wade was overturned, abortion was highly restricted in many states. The latest data show that 155,000 patients traveled out of state for abortion care in 2024, a slight drop from 170,000 in 2023 but nearly double the number of travelers in 2020 (81,000). This has been offset by an increase in patients who are getting abortion pills via telehealth.

The states with the highest number of people traveling inbound for abortion care border at least one state where abortion is banned, including Illinois (35,470 patients), North Carolina (16,640 patients), Kansas (15,930 patients), and New Mexico (12,730 patients).

States With the Highest Number of Inbound Abortion Patients Border at Least One State Where Abortion Is Banned

How much do abortions cost?

The costs of abortion services vary widely depending on the method, facility, and gestational age; the costs can be as low as $25 through virtual clinics but typically exceed $1,000 for abortions later in pregnancy.

  • Obtaining an abortion can be costly. On average, the costs are higher for abortions in the second trimester than in the first trimester. The state bans and restrictions enacted since Dobbs can also result in additional nonmedical expenses for transportation, childcare, lodging, and lost wages. Many people pay for abortion services out of pocket, but some people can obtain assistance from local abortion funds, or coverage through their insurance plan or with state funds in some states.
  • Among all abortion-providing facilities in 2023, the median costs for people paying out of pocket in the first trimester were $563 for a medication abortion and $650 for a procedural abortion. For people with low incomes, who are more likely to seek abortion care, these costs are often unaffordable. The costs of abortion are higher in the second trimester compared to the first, with median self-pay reaching $1000. In the second trimester, more intensive procedures may be needed and local options are more limited in many communities that have fewer facilities.
  • Abortion funds are independent organizations that help pay for some of the costs of abortion services, typically medical care, travel, and accommodations if needed. Most abortion funds are regional and have connections to clinics in their area, but they do not reach all people seeking services. Since Dobbs, these networks received a reported 39% more requests for support, and while donations to these networks rose immediately following Dobbs, the frequency of donations slowed, and the resources available to funds have begun to taper.
  • The costs for abortion services through virtual clinics, such as AidAcess and Abuzz, as well as self-managed sites, are typically lower than in person services. In 2023, the median cost of medication abortion from virtual clinics was $150. Costs at online pharmacies listed on Plan C range from a low of $25 for abortion pills by mail without clinician consultation, to upwards of $150 for abortion by mail with a clinical consultation.
In 2023, the Median Cost of Abortion Services Exceeded $500

Does private insurance or Medicaid cover abortions?

Insurance coverage for abortion services is heavily restricted in certain private insurance plans and public programs like Medicaid and Medicare.

Among women of reproductive age, approximately one in three are covered by private insurance, one in five are covered by Medicaid, and one in ten are uninsured. States regulate fully-insured private plans in their state, whereas the federal government regulates self-funded plans. States can choose whether abortion coverage is included or excluded in private plans that are not self-funded. Increasingly, states that support abortion rights have enacted laws that mandate coverage in both Medicaid and state-regulated plans.

Prior to the Dobbs ruling, several states had enacted private plan restrictions and banned abortion coverage from ACA Marketplace plans. Currently, there are 10 states that have policies restricting abortion coverage in private plans and 25 that ban coverage in any Marketplace plans. Since the Dobbs ruling, some of these states have also banned the provision of abortion services altogether. Conversely, 12 states require private plans to cover abortion, nine of which require no cost-sharing for abortion.

The Majority of States Have At Least One Restriction on Health Insurance Coverage for Abortion Services

For decades, the Hyde Amendment has banned the use of federal funds for abortion in Medicaid, Medicare and other public programs unless the pregnancy is a result of rape, incest, or if it endangers the pregnant persons’ life. States have the option to use state-only funds to cover abortions under other circumstances for those on Medicaid, which 20 states do currently.

Data from 2021, prior to Dobbs, estimated that a quarter (26%) of abortion patients used Medicaid to pay for abortion services, 11% used private insurance, and 60% paid out of pocket. People in states with more restrictive abortion policies were more likely to pay out of pocket compared to people living in less restrictive states.

How does the public view abortion?

KFF’s national polls have consistently found that a majority of the public did not want to see Roe v. Wade overturned and that most people feel that abortion is a personal medical decision. Similarly, findings from the 2024 KFF Women’s Health Survey show 70% of women of reproductive age—the age group that is most directly impacted by state abortion policies—support a nationwide right to abortion.

Majority of Women in the U.S. Support a Law Establishing a Nationwide Right to Abortion and Oppose a Law Establishing a Nationwide Ban at 15 weeks

Furthermore, much of the public supports access to abortions for patients who are experiencing pregnancy-related emergencies (88%), a patient’s right to travel for abortion care (79%), and protecting doctors who perform abortions from legal penalties (67%).

Majority of Women Support Laws Protecting Patients' Rights to Access Abortions in Emergencies, Travel for Abortion Care

Abortion Trends Before and After Dobbs

Published: Jul 15, 2025

Note: This brief was updated on July 15, 2025 to incorporate new data on abortion statistics.

  • In the two years since the Supreme Court ruling that overturned Roe v. Wade, the total number of abortions nationally has slightly increased. The most recent data from the Society for Family Planning’s #WeCount project show that there were 1.14 million abortions in 2024, up from 1.05 million abortions in 2023. For most of the decade prior to the Dobbs ruling, there was a steady decline in abortion rates nationally, with a slight uptick in the years just before the ruling.
  • The upward trend in abortion volume is likely due to multiple reasons, including expanded telehealth capacity, the ability to mail medication abortion pills to patients, and the lower costs for telehealth abortions through virtual clinics compared to in-person care. Medication abortion via telehealth now accounts for 25% of all abortions.
  • In contrast to the abortion bans, several states have passed laws to protect abortion access for their residents and expand access to people seeking abortions from other states which have contributed in part to the increased the number of abortions in those states compared to pre-Dobbs time frame. Twelve (12) states require state-regulated private plans to cover abortion, many without cost-sharing, and 20 Medicaid programs use state-only funds to cover nearly all medically necessary abortions. Twenty-three (23) states passed shield laws intended to reduce the legal risks for clinicians who provide abortion care to patients who live in states where abortion is banned or restricted.
  • The upward trend in abortion volume can also be attributed to increased interstate travel. The travel rate for abortion care across state lines nearly doubled from 2020 to 2024, with Illinois, North Carolina, New Mexico, and Kansas experiencing the highest volume of out-of-state abortion patients last year.

Following the 2022 ruling in Dobbs v. Jackson Women’s Health Organization, it was generally expected that the abortion rate would drop due to the number of states that rapidly adopted abortion bans (12 states) and early gestational restrictions (6 states). There is no doubt these policies have made abortion access much more challenging or even impossible for those seeking abortion who live in restrictive states; yet, contrary to expectations, recent data show that the number of abortions in the U.S. overall has slightly increased in two years following the Supreme Court ruling. The combination of growth in telehealth availability for abortion care, lower telehealth costs, increased legal reproductive health care protections through state efforts, and higher rates of interstate travel, all likely contributed to the unexpected trajectory in abortion volume. However, the possibility of more state bans and restrictions combined with the ongoing legal challenges seeking to further restrict access may reverse this trend. Additionally, future actions that the Trump administration could take at the federal level could further limit abortion availability and access even in states that have enshrined the right to abortion, particularly if the administration restricts the distribution of medication abortion pills through the Comstock Act or targets the provision of telehealth abortions through regulatory revisions at the Food and Drug Administration.

This brief reviews the different sources of abortion data in the U.S., the factors that have affected abortion rates across the country before and after Dobbs, and what we may see as the Trump administration, Republican majorities in the House and Senate, and a conservative federal judiciary shape policy in the coming years.

How is abortion tracked at the state and federal level?

Three major organizations collect and report national and state-level data on abortion volume and rates: the federal Centers for Disease Control and Prevention (CDC), the Guttmacher Institute, and most recently, the Society of Family Planning through its (SFP) #WeCount project.

For decades, the federal CDC Abortion Surveillance System has requested data from the central health agencies of the 50 states, D.C., and New York City to document the number and characteristics of women obtaining abortions. Reporting to the CDC is voluntary and not all states participate in the surveillance system. Notably, California, Maryland, and New Hampshire have not reported data on abortions to the CDC system for years. Most states collect and report data on the demographic characteristics of patients, gestational weeks, and type of abortion procedure. CDC publishes data from the surveillance system annually, with the most recent data on abortions in 2022, reflecting a 2-year lag. As of April 2025, following the termination of federal staff from the Reproductive Health Division, it is unclear whether the CDC will continue to update its Abortion Surveillance System which currently presents data from 2022 that was released in November 2024.

Prior to the Dobbs ruling, the Guttmacher Institute, an independent research and advocacy organization, periodically conducted the Abortion Provider Census (APC), collecting data on abortion incidence, abortion facilities, and patient characteristics. Data from the APC are based primarily on questionnaires completed by known facilities that provide abortion in the country, information from state health departments, and Guttmacher estimates for a small portion of facilities. The most recent APC reports data from 2020. Following the Dobbs ruling, the Guttmacher Institute established an additional data collection initiative, the Monthly Abortion Provision Study, to track abortion volume within the formal U.S. health care system. This ongoing effort collects data on and provides national and state-level estimates on abortions while also tracking the changes in national abortion volume since 2020.

While the CDC and Guttmacher APC data differ in terms of collection methods, timeframe, and completeness, both have shown similar trends in abortion rates over the past decade. One notable difference is that Guttmacher’s survey has included continuous reporting from all states, which explains at least in part the higher abortion volume in their data.

Society of Family Planning’s (SFP) #WeCount is a newer national reporting initiative that measures changes in abortion access following the Dobbs ruling. The project provides semiannual reports on the monthly number of abortions by state and includes data on abortions provided through in-person health care settings and through telehealth. The #WeCount report started collecting data in April 2022 and has published two full years of abortion data since Dobbs.

Comparison of Major Abortion Data Sources in the United States

How has the abortion rate changed over time?

For most of the decade prior to the Dobbs ruling, there was a steady decline in abortion rates nationally, but there was a slight increase in the years just before the ruling.

The most recent CDC data are from 2022, the same year as the Dobbs decision, and show that abortion rates declined from 2013 through 2017 and remained steady in the years leading up to the court decision (Figure 1). CDC reported 609,360 abortions in 2022 and a rate of 11.2 abortions per 1,000 women (excludes CA, DC, MD, NH, and NJ). In contrast, the Guttmacher Institute reported 930,160 abortions in 2020 and a rate of 14.4 abortions per 1,000 women. Guttmacher’s study showed a slight upward trend in abortion from 2017 to 2020 whereas CDC’s report showed a stable rate in abortions from 2017 to 2022 except for a slight uptick in 2019 and 2021.

Experts generally attribute the long-term decline in abortion rates to increased use of more effective methods of contraception. The slight increase in the years leading up to the Dobbs decision could be due to greater state-level coverage of Medicaid enrollees that made abortion access more affordable in some states as well as broader financial support from abortion funds to help individuals pay for the costs of abortion care.

Before the Dobbs Decision, the Number of Abortions Had Started to Rise Slightly Following a Decade-Long Decline

Even prior to the Dobbs ruling, abortion rates varied widely between states.

National averages can mask local and more granular differences. Some of the variation in abortion volume and rates has been due to the wide differences in state policies that have shaped the availability of abortion, with some states historically placing restrictions on abortion (such as targeted regulations of abortion providers, requirements for multiple visits, and mandatory waiting periods), that constrained abortion access and availability. In some states, there were only one or two abortion providers even before Dobbs.

Abortion Rates Varied Widely by State Prior to the Dobbs Decision

What has happened to abortion volume since Dobbs?

The SFP and Guttmacher Institute data both find that while the number of abortions in the U.S. dropped immediately following Dobbs, the total number of abortions nationally has increased two years following the ruling. However, the consistency observed at the national level obscures wide state-level variation and sharp declines in the number of abortions in states with bans and early gestational restrictions.

The latest SFP’s #WeCount data show that in 2024, there were an estimated 1.14 million abortions, slightly up from 1.05 million in 2023. The monthly average number of abortions increased from 88,000 abortions per month in 2023 to 95,200 in 2024 (Figure 3).

While the Overall Number of Abortions in the U.S. Increased in the Two Years After Dobbs, There is Great Variation Between States That Permit and Ban Abortion

Why did the number of abortions increase after states instituted bans?

While it was not a total surprise that states without abortion bans had an increase in abortions following the Dobbs ruling, the reasons behind this increase are complex. The upward trend is likely due to a combination of increased interstate travel for abortion access by people coming from abortion ban states, the presence of state-level laws in states that protect providers who offer abortion services, lower costs associated with telemedicine medication abortions, and expanded virtual/telehealth capacity and the ability to mail medication abortions pills to patients among both bricks-and-mortar and telemedicine-only providers.

The Rise of Medication Abortion, Telehealth, and Virtual Clinics

While procedural abortions are only performed in a clinical setting, medication abortion can be provided either in a clinical setting or remotely via telehealth. Medication accounts for nearly two thirds (63%) of abortions nationally. Approved by the U.S. Food and Drug Administration (FDA) in 2000, medication abortion has a solid safety and effectiveness record regardless of whether the pills are dispensed in person by a clinician (either medical doctor or advanced practice clinician) or via telehealth and mailed or dispensed through a retail pharmacy. Medication abortion successfully terminates the pregnancy 99.6% of the time, with a 0.4% risk of major complications, and an associated mortality rate of less than 0.001 percent (0.00064%). The latest Guttmacher data show that in states without bans, medication accounted for the majority of abortions in 2023 (Figure 4). In five states (MT, WY, NE, GA, and VT), more than eight in ten abortions were medication abortions.

Medication Abortion Accounted for the Majority of Abortions in 2023 in States Without Bans

Access to medication abortion via telehealth had been historically limited by an FDA policy (Risk Evaluation Mitigation Strategy or REMS) that had permitted only physicians in a health care setting to dispense mifepristone in person. This resulted in a restriction on the ability to mail the pills or for retail pharmacies to dispense. In December 2021, the FDA revised this policy lifting the requirement that clinicians dispense the drug only in-person. This was done, in part, to alleviate the burden placed on the health care delivery system during the COVID-19 public health emergency. In January 2023, the FDA finalized a policy change that allows retail pharmacies to dispense medication abortion pills to patients with a prescription. These changes opened the door to greater use of telehealth for medication abortions.

The increase in telehealth abortions has also been driven in part by the rise in the number of virtual abortion clinics. The number of virtual clinics began to rise after the FDA revised its in-person dispensing requirement in 2021 and now accounts for a quarter (24%) of facilities that offer medication abortion services.

SFP’s #WeCount study breaks out monthly averages for telehealth abortions, and the most recent report shows that telehealth abortions accounted for 25% of all abortions in the last quarter of 2024 (Figure 5). The latest #WeCount reports distinguish between telehealth abortions provided by brick-and-mortar facilities from those provided under shield laws that give some legal protections to clinicians who provide abortion care via telehealth to people living in states with bans and restrictive policies. More than half of these telehealth abortions were performed under shield laws (53%), 7% of abortions were from online services offered by clinics that traditionally operate from physical locations (brick-and-mortar facilities), and four in ten (41%) were from virtual-only clinics. The provision of telehealth abortions varies widely across states, ranging from 7% of all abortions in some states and reaching 40% of all abortions in other states.

Costs for Telemedicine Abortions

The median price of medication abortion offered through brick-and-mortar clinics increased from $580 in 2021 to $600 in 2023. In contrast, the median price of medication abortions via virtual clinics decreased from $239 in 2021 to $150 in 2023, which is 75% less than the cost of in-person care (Figure 6). Virtual clinics do not incur many of the costs of a physical clinic, such as building maintenance, meeting regulations for surgical centers, and security to handle protesters. The increased availability of telehealth and virtual clinics has lowered the costs of care and reduced financial barriers resulting from abortion services as well as travel and other related expenses.

Costs for some have also been offset by the availability of financial assistance and logistical support from national and local networks of abortion funds. Since Dobbs, these networks received a reported 39% more requests for abortion support and financially supported more than 100,000 individuals seeking abortion care. While donations to these networks increased immediately following Dobbs, the frequency of donations has slowed, and funds have begun to taper. Some organizations recently reported suspending operations altogether, signaling that abortion volume may consequently dwindle as demand outpaces donations.

Medication Abortion Costs 75% Less When Offered Through Virtual Clinics Compared to Brick and Mortar Clinics

State-Level Protections

Over the past several years, some of the states where abortion remains legal have passed laws to protect abortion access for their residents and expand access to people seeking abortions from other states. For example, residents in California are protected from civil liabilities for providing or receiving abortion services, and providers are protected from professional discipline. Policies that have been implemented include using state funds to cover abortions under Medicaid beyond federal limitations, raising Medicaid reimbursement rates for abortion services, requiring state-regulated private plans to cover abortion, and enacting shield laws to protect clinicians who provide abortions in their states either in person or via telemedicine.

Today, 12 states require state-regulated private plans to cover abortion, some without any cost-sharing (Figure 7).

State actions to use their own revenues to pay for abortions have also expanded access to abortion services. States are not restricted by the federal Hyde Amendment (which bans the use of federal funds for abortion in Medicaid, Medicare and other public programs unless the pregnancy is a result of rape, incest, or if it endangers the woman’s life) and have the option to use state-only funds to cover abortions under other circumstances for women on Medicaid, which 20 states do currently.

Twelve States Require State-Regulated Private Insurance Plans to Cover Abortion

A growing number of states passed shield laws to reduce the legal risks for clinicians who provide abortion care to patients who live in states where abortion is banned or restricted. While the details of these laws vary state to state, some policies protect clinicians from professional discipline for offering health care that is criminalized in another state, and others protect clinicians who provide care to patients across state lines, such as by prescribing and mailing abortion pills via telehealth services to patients in their state of residence. Some states also passed broader shield laws to protect patients and people assisting with reproductive services from civil and criminal consequences. As of February 2025, 22 states and Washington D.C. have enacted shield laws, with 8 states extending explicit protections to clinicians regardless of patient location or state of residence (Figure 8).

Many States Have Shield Laws for Reproductive Health Care Services

Interstate Travel

The Guttmacher Institute Monthly Abortion Provision Study is the only data source so far to provide in-depth information on interstate travel pre- and post-Dobbs. Guttmacher estimates that prior to Dobbs, nearly one in ten people obtained an abortion by traveling across state lines in 2020. Even though abortion was legal, there were considerable restrictions in many states that made abortion access very limited, which led to the need for interstate travel for abortion care for some people. The latest data show that 155,000 patients traveled out of state for abortion care in 2024, a slight drop from 170,000 in 2023 but nearly double the number of travelers in 2020 (81,000). The states with the highest number of people traveling inbound for abortion care border at least one state where abortion is banned, including Illinois (35,470 patients), North Carolina (16,640 patients), Kansas (15,930 patients), and New Mexico (12,730 patients) (Figure 9).

The volume of interstate travel into Florida and North Carolina is especially notable as they were two of the last southern states in 2023 where abortion was legal beyond six weeks of gestation. However, the policies in these two states became more restrictive. North Carolina went from a 20-week ban to a 12-week ban in July 2023, and Florida’s 15-week ban changed to a 6-week ban in May 2024. The volume of interstate travel into Florida declined from 9,100 travelers in 2023 to 4,010 travelers in 2024 (data not shown). Conversely, the volume of interstate travel into North Carolina increased from 14,860 in 2023 to 16,640 in 2024 (data not shown). This is largely due to Florida’s stricter gestational stage ban, which curtailed abortion access in the region and has resulted in patients in southern states having to travel elsewhere for abortion care.

States With the Highest Number of Inbound Abortion Patients Border at Least One State Where Abortion Is Banned

While the data show that abortions slightly increased one full year after Dobbs, ongoing and impending legal challenges, state legislative efforts, and federal executive actions could further alter the reproductive care landscape and have impacts beyond abortion counts. A recent JAMA study, for instance, found that fertility rates have increased in states with complete or 6 week abortion bans, namely among populations with the greatest structural disadvantages and barriers to obtaining abortion care. A concurrent study showed infant mortality rates have also risen in these states, many of which are already experiencing some of the worst maternal, infant, and child health outcomes in the U.S. The findings from these studies underscore the widespread repercussions of policy efforts aimed at restricting abortion access.

Demand for 988 Continues to Grow at Third Anniversary

Published: Jul 14, 2025

On July 16, 2022, the federally mandated crisis number988, became available to all phone users at no charge. This three-digit number connects users–via phone, text, or chat–to a network of over 200 local and state-funded crisis call centers that provide access to crisis counseling, resources, and referrals through the 988 Suicide & Crisis Lifeline. The introduction of 988 came against the backdrop of rising suicide rates. Between 2013 and 2023, more than half a million lives (509,115) were lost to suicide, with increases observed nationally and across most states. Firearms have been the predominant suicide method, accounting for over half of all suicide deaths and contributing to a record high number of suicides in 2022.

988 enters its third year amid significant legislative changes to Medicaid and other health programs, projected by the CBO to reduce federal Medicaid spending by $1 trillion dollars and result in 11.8 million people losing health coverage (from Medicaid and Marketplace changes) over the next 10 years. These changes could disrupt access to mental health care and create ripple effects across the broader mental health system. The HHS budget has proposed maintaining current 988 funding levels, much of which supports 988’s federal infrastructure. At the same time, the substantial federal Medicaid spending reductions in the recently-passed 2025 tax cuts and domestic policy bill could lead states to scale back spending, including on behavioral health services. The recent elimination of the specialized 988 service for LGBTQ+ young people—which previously handled about 10% of all 988 contacts—raises concerns about the mental health support for LGBTQ+ youth, a population already experiencing high rates of suicidal ideation and attempt.

Taken together, these changes could simultaneously increase mental health needs and reduce available support, potentially leading to higher rates of suicide attempts or deaths in coming years. This policy watch examines 988 on its third anniversary, drawing from the latest Lifeline data available through May 2025 and suicide death data from CDC WONDER for the period 2013 to 2023.

988 received 16.5 million contacts since its launch in July 2022, including 11.1 million calls, 2.9 million texts, and 2.4 million chats. Monthly contact volume has steadily increased, consistently surpassing 500,000 contacts per month over the past year and approaching or exceeding 600,000 per month since early 2025—double the contacts recorded before launch (303,332 in May 2022). Public awareness of the 988 service was low in 2023 but may have since improved, potentially contributing to the increases in contact volume. These 988 metrics do not include suicide hotline contacts from centers operating outside of the 988 network. As of 2022, fewer than half of all hotline call centers (about 200 of 544) participated in the 988 network.

Over 16 Million Calls, Texts, and Chats Received by 988 Crisis Service Since July 2022 Launch

Most states now answer 80% or more of 988 calls in-state, a significant improvement compared to before 988’s launch. In May 2025, 42 states answered at least 80% of calls locally, up from 23 states just before 988’s launch. In-state answer rates in May 2025 ranged from 58% (Arkansas) to 99% (Rhode Island). Calls not answered in-state are redirected to national backup centers, where counselors answer the crisis call but may be less familiar with local resources. Nationally, 91% of 988 calls, texts, and chats are answered, while 9% are disconnected—for reasons that may include the person ending the contact or technical issues. This compares to a 30% disconnection rate before 988’s launch in May 2022. Federal funds supported 988’s launch, including some initial funding to support state infrastructure and local call centers, but ongoing funding for these call centers largely falls to states. Currently, 12 states passed legislation to help fund 988 through telecom fees (similar to 911 funding), with early-adopting states raising between $8 and $44.3 million in CY2023. Several other states have appropriated funds for 988, related crisis services, or efforts to improve interoperability across crisis response systems—and Medicaid, along with other payers in some cases, may also help finance 988 and related crisis services.

Most States Now Answer at Least 80% of Their 988 Calls Through In-State Call Centers

The overall number of suicide deaths remained stable from 2022 to 2023 (49,476 to 49,316), though it is too soon to fully determine the impact of 988. This stability was driven by small declines in non-firearm (other) suicides, while firearm suicides increased slightly (Figure 3). These patterns were generally consistent across demographic groups, including several of those previously experiencing increases over longer periods. Provisional CDC data suggest this stabilization may be continuing into 2024 (48,796), though these data are preliminary and may be incomplete. While there is no direct way to measure the effect of 988 on these rates, it could be a factor.

The Overall Number of Suicide Deaths Remained Stable From 2022 to 2023

If you or someone you know is considering suicide, call or text the 988 Suicide & Crisis Lifeline at 988

Most Medicare Advantage Markets are Dominated by One or Two Insurers

Published: Jul 14, 2025

Enrollment in Medicare Advantage, the private plan alternative to traditional Medicare, has increased steadily since 2010. The average beneficiary has access to 34 Medicare Advantage plans with prescription drug coverage in 2025, double the number available in 2018. On average, Medicare beneficiaries have access to plans offered by 8 firms, a slight increase from 2018. One goal of offering Medicare coverage through private plans is to leverage competition with the idea that insurers will compete to provide better benefits and lower costs to attract and retain enrollees. However, recent analysis finds that Medicare Advantage markets are highly concentrated, suggesting that the growth in enrollment and plan availability has not occurred in the context of a competitive market.

Higher market concentration in Medicare Advantage insurance markets may lower the incentive for insurers to compete for potential enrollees by making plans more appealing through more comprehensive benefits or lower costs. However, the competitiveness, or lack thereof, of Medicare Advantage markets has not been a priority of policymakers or regulators, especially in recent years. The most recent activity at the federal level occurred in 2017 when the Department of Justice blocked a merger between insurers Aetna and Humana, arguing if it went through it would significantly raise market concentration in the Medicare Advantage market. More recently, the conversation regarding competition in health care has revolved around increased consolidation in provider markets, especially hospitals and health systems.

To examine the competitiveness of Medicare Advantage markets, this analysis uses publicly available, county-level Medicare Advantage plan information and enrollment data for all 50 states, D.C., and Puerto Rico, published by the Centers for Medicare and Medicaid, to calculate the Herfindahl-Hirshman Index (HHI) for each market (a county is considered a Medicare Advantage market because plans are offered at the county level). The HHI uses the relative market shares of all Medicare Advantage insurers offering plans in a county to create a measure of market concentration. Counties are then classified as unconcentrated, moderately concentrated, highly concentrated, or very highly concentrated markets. These categories align with guidelines published by the Federal Trade Commission and U.S. Department of Justice, except in that a fourth category (very highly concentrated) is added to further discern differences within the most concentrated markets. This analysis also examines how often one or two Medicare Advantage insurers enrolled at least half of all enrollees within a county, which provides an alternative illustration of market concentration (See Methods for more details).

Key Takeaways

  • Virtually all counties were highly concentrated (79%) or very highly concentrated (18%) in 2024. Less than 1% were moderately concentrated and 0% of counties were unconcentrated. (2% of counties had low or no Medicare Advantage enrollment.)
  • Most (89%) Medicare Advantage enrollees were in highly concentrated markets, with another 4% of Medicare Advantage enrollees in very highly concentrated markets.
  • Medicare Advantage markets were more concentrated in rural counties than in urban counties: 39% of the most rural counties were very highly concentrated in 2024 compared with 15% of rural counties that were near urban areas and 6% of urban counties.
  • Nine in ten (90%) Medicare beneficiaries lived in a county where at least half of all Medicare Advantage enrollees were in plans sponsored by one or two insurers in 2024.
  • UnitedHealthcare (41%) or Humana (25%) had the highest enrollment in two-thirds of counties, which comprised 59% of all Medicare Advantage enrollment, in 2024. Among all Medicare Advantage insurers, UnitedHealthcare was the dominant insurer in the largest share of highly concentrated markets (41%) and very highly concentrated markets (50%) in 2024.
  • In more than four in ten counties (44%), comprising 22% of all Medicare Advantage enrollment, a single Medicare Advantage insurer had at least 50% of enrollment in 2024, including 22% of counties where UnitedHealthcare had at least 50% of enrollment and 10% of counties where Humana had at least 50% of enrollment. Some large counties where one insurer had at least 50% of enrollment include Dallas County, Texas (55%), Salt Lake County, Utah (52%), and Milwaukee County, Wisconsin (64%).

Virtually all Medicare Advantage insurance markets were highly concentrated (79%) or very highly concentrated (18%) in 2024.

In 2024, virtually every county was a highly concentrated or very highly concentrated market for Medicare Advantage (Figure 1). A total of 2,524 counties (79%) were highly concentrated markets and 574 counties (18%) were very highly concentrated markets (Figure 2). Just 30 counties (<1%) were moderately concentrated markets. No counties were unconcentrated. (In 2024, 72 counties (2%) did not have sufficient Medicare Advantage enrollment to have a market concentration classification.)

Most Medicare Advantage Markets Are Highly Concentrated (79%) or Very Highly Concentrated (18%)

Most Medicare Advantage enrollees were in a highly concentrated (89%) or very highly concentrated market (4%) in 2024.

Most Medicare Advantage enrollees lived in a highly concentrated or very highly concentrated market: 28.9 million out of 32.3 million Medicare Advantage enrollees (89%) lived in a highly concentrated market, while 1.1 million lived (4%) lived in a very highly concentrated market in 2024 (Figure 2). Of the remaining Medicare Advantage enrollees, 2.3 million (7%) lived in moderately concentrated markets. No Medicare Advantage enrollees were in unconcentrated markets.

Most Medicare Advantage Enrollees Lived in a County That Was Highly Concentrated or Very Highly Concentrated

Since 2010, the share of counties that were either highly concentrated or very highly concentrated Medicare Advantage markets has changed little (94% of counties in 2010 compared to 97% in 2024). However, there have been shifts within markets at the highest levels of concentration. Specifically, the share of counties that are very highly concentrated markets declined from 36% in 2010 to 18% in 2024, while the share of counties that are highly concentrated has increased from 58% in 2010 to 79% in 2024 (Appendix Table 1).

Medicare Advantage markets were more concentrated (and less competitive) in rural than urban counties.

On average, Medicare Advantage markets in rural areas were more concentrated than those in urban areas in 2024 (data not shown). Consistent with this finding, substantially more counties were very highly concentrated in the most rural areas (39%), compared with rural counties near urban areas (15%), and counties in urban areas (6%) (Figure 3).

Almost 4 in 10 of the Most Rural Counties (39%) Were Very Highly Concentrated in 2024

A much larger share of Medicare Advantage enrollees living in the most rural counties were in very highly concentrated markets than either rural adjacent or urban counties: 16% of Medicare Advantage enrollees in the most rural counties lived in very highly concentrated markets, compared to 6% of Medicare Advantage enrollees in rural counties near urban areas and approximately 3% of Medicare Advantage enrollees in urban areas.

Nine in ten (90%) Medicare beneficiaries lived in counties where more than half of all Medicare Advantage enrollees were in plans sponsored by one or two firms in 2024.

In 2024, 90% of eligible Medicare beneficiaries – 54.3 million out of 60.5 million – lived in a county where at least 50% of Medicare Advantage enrollees in that county were in plans sponsored by one or two insurers (Figure 4). This represents a small decrease since 2010, when 96% of eligible beneficiaries – 41.4 million out of 43.5 million – lived in a county where at least half of Medicare Advantage enrollees were in plans sponsored by one or two insurers.

There has been a sharper decline in the share of Medicare beneficiaries living in counties where at least 75% of Medicare Advantage enrollment was in plans sponsored by one or two insurers. In 2010, 50% of Medicare beneficiaries lived in counties where the two largest firms comprised at least 75% Medicare Advantage enrollment compared with 25% in 2024.

UnitedHealthcare or Humana was the largest Medicare Advantage insurer in over half of counties in 2024.

UnitedHealthcare had the highest market share in more counties (41%) than any other Medicare Advantage insurer in 2024 – meaning that for 38% of all Medicare Advantage enrollees nationwide, UnitedHealthcare was the largest insurer in their county (Figure 5). Humana was the largest insurer in 25% of all counties in 2024; for 21% of all Medicare Advantage enrollees nationwide, Humana was the largest insurer in their county. UnitedHealthcare and Humana have consistently been the two largest insurers in the Medicare Advantage market, and comprised nearly half (47%) of all Medicare Advantage enrollment across the country in 2024.

In 2024, 90% of Medicare Beneficiaries Lived in a County Where at Least Half of Medicare Advantage Enrollment was in Plans Sponsored by One or Two Insurers

UnitedHealthcare and Humana’s dominance was especially prominent in the least competitive markets: UnitedHealthcare was the largest Medicare Advantage insurer in 50% of all very highly concentrated counties and in 41% of highly concentrated counties in 2024, while Humana was dominant in 22% of very highly concentrated counties and in 26% of highly concentrated counties.

Other insurers enrolled the largest number of Medicare beneficiaries in a smaller number of counties. BlueCross BlueShield (BCBS) affiliates were the largest Medicare Advantage insurer in 11% of all counties, followed by CVS Health (8%), and Elevance Health (4%). In 2% of counties there was not sufficient Medicare Advantage enrollment to examine enrollment by insurer.

In More Than Half of All Counties, UnitedHealthcare (41%) or Humana (25%) Was the Largest Medicare Advantage Insurer

A single insurer comprised at least half of Medicare Advantage enrollment in 44% of counties in 2024.

In 44% of counties, comprising 22% of all Medicare Advantage enrollment, a single insurer enrolled at least 50% of all Medicare Advantage enrollees in 2024. In half of these counties (22%), UnitedHealthcare was the single insurer with a market share of at least 50%, including in Dallas County, Texas (55%), Salt Lake County, Utah (52%), Milwaukee County, Wisconsin (64%), Boulder County, Colorado (52%), and the District of Columbia (64%) (Appendix Table 2).

Humana enrolled at least half of all Medicare Advantage enrollees in 10% of counties, BCBS affiliates in 5% of counties, CVS Health in 3% of counties, and Elevance Health in less than 1% of counties (Appendix Table 3). Other insurers had at least 50% of Medicare Advantage enrollment in 3% of counties.

Appendix

Total Number and Share of Counties Per Market Concentration Classification

Top 20 Largest Counties Where UnitedHealthcare's Medicare Advantage Market Share Is At Least 50%

op 20 Largest Counties Where Humana's Medicare Advantage Market Share Is At Least 50%

Methods

This analysis uses data from the Centers for Medicare & Medicaid Services (CMS) Medicare Advantage Enrollment, Benefit and Landscape files for 2010 to 2024. Enrollment data is only provided for plan-county combinations that have at least 11 beneficiaries. Connecticut is excluded from the at the county level due to a change in FIPS codes that are in the Medicare Enrollment Dashboard data but are not yet reflected in the Medicare Advantage plan information and enrollment data. KFF calculates the share of eligible Medicare beneficiaries enrolled in Medicare Advantage, meaning they must have both Part A and B coverage.

This analysis categorizes counties by market concentration by calculating each county’s Herfindahl-Hirschman Index (HHI) for Medicare Advantage enrollment, combining all enrollment for plans offered by an insurer in a county. HHI, which ranges from 0 to 10,000, is calculated by summing the squares of the market share of each firm in a market. An HHI closer to 10,000 indicates a more concentrated and less competitive market – an HHI of 10,000 defines a pure monopoly. For example, a market where two firms each have a market share of 50% would result in an HHI of (50^2) + (50^2) = 5,000, while a market where one firm has a market share of 75% and another firm has a market share of 25% would result in an HHI of (75^2) + (25^2) = 6,250.

Counties are classified by geography type using the 2024 Urban Influence Codes published by the USDA, Economic Research Service as follows: Urban (UIC codes 1 and 4), Rural adjacent to urban areas (UIC codes 2, 3, 5, and 6), and Rural non-adjacent to urban areas (UIC codes 7, 8, and 9). Rural counties that are non-adjacent to urban areas are considered the most rural counties.

This work was supported in part by Arnold Ventures and AARP. KFF maintains full editorial control over all of its policy analysis, polling, and journalism activities.