News Release

Lower-Income People with Employer Coverage are More Likely to Report Negative Outcomes Due to Insurance Problems Than Their Higher-Income Peers

Published: Dec 19, 2023

Lower-income adults with employer coverage are more likely than their higher-income peers to report negative outcomes due to problems using their insurance, a new KFF analysis shows.

Drawing on data from the KFF Survey of Consumer Experiences with Health Insurance, the analysis shows that similar shares of lower- and higher-income adults with employer coverage report having common problems with their insurance such as denied claims or prior authorization issues.

At the same time, those with lower incomes are more likely than their higher-income peers to say they suffered adverse consequences due to insurance problems. This includes experiencing a significant delay in getting needed care or being unable to get recommended medical treatment. In addition, nearly three times as many of those with lower incomes report suffering a moderate or serious decline in their health compared to those with higher incomes.

In addition, about three-in-10 people with employer coverage also say that they had problems paying for medical care in the past year (31%), more than double the share among those with higher incomes (13%).

The analysis also examines differences among lower- and higher-income adults with employer coverage in their satisfaction with their coverage and plan’s provider networks, and in the ease of signing up and comparing their coverage options.

Lower Income Adults with Employer Sponsored Insurance Face Unique Challenges with Coverage Compared to Higher Income Adults

Published: Dec 19, 2023

The KFF Consumer Survey assessed consumers’ experiences with their health insurance coverage, their understanding of their coverage, problems they may face with their insurance, and if they believe that their insurance coverage is adequately meeting their needs. This Data Note examines the experiences of lower income adults with their current employer sponsored insurance (ESI) — including their reported satisfaction with the costs, quality, and availability of network providers — in comparison to higher income adults with ESI coverage. Lower income adults in our survey were defined as adults with reported household incomes below 200% the federal poverty line (FPL). This is any income below $27,180 for a single adult or $46,060 for a family of three. Higher income adults are defined as those with household incomes at or above 200% of FPL. Lower income adults with ESI were as likely to report insurance problems as higher income adults with ESI. However, lower income adults with ESI were more likely to report problems paying for health care, delayed treatment, and a decline in health as a result of insurance problems. Lower income adults with ESI were also more likely to say the availability and quality of health care professionals covered by their insurance was fair or poor, and were more likely to report difficulty in signing up for coverage and comparing options.

Lower income adults with ESI were more likely to report problems paying for health care services compared to higher income adults.

Among those with ESI coverage, lower income adults (31%) were over twice as likely to report trouble paying for medical bills compared to higher income adults (13%).

Lower Income Adults With ESI Were More Likely To Report Problems Paying For Medical Care

Lower income adults with ESI were just as likely to report insurance problems as higher income adults with ESI, but were more likely to delay treatment and report a decline in health as a result of insurance problems.

Lower income adults with ESI were as likely as higher income adults with ESI to report having common problems with their insurance over the past year, such as prior authorization issues (16% for lower income adults and 15% for higher income adults) and denied claims (22% for lower income adults and 21% for higher income adults). However, lower income adults were more likely than higher income adults to report negative outcomes as a result of experiencing insurance problems. Among those with ESI who had a problem with their current insurance in the past year, lower income adults were more likely to report a significant delay in treatment or care (26%) as a result of insurance problems compared to higher income adults (14%). Additionally, one in four lower income adults reported being unable to receive medical treatment recommended by a medical provider as a direct result of the problems they had with their current health insurance, compared to 13% of higher income adults. Lower income adults were also more likely to report a moderate to serious decline in health as a result of insurance problems compared to those with higher income. Over twice as many lower income adults (30%) reported a moderate or serious decline in health as a direct result of insurance problems compared to higher income adults (11%).

Lower Income Adults With ESI Were More To Likely Experience Negative Outcomes As A Result Of Insurance Problems

Lower income adults with ESI were more likely to rate the availability and quality of providers within their network as “fair or poor.”

Lower income adults with ESI were more likely to rate the overall performance of their current health insurance as “fair” or “poor” (31%) compared to higher income adults with ESI (17%). Additionally, lower income adults with ESI were more likely to grade the availability and quality of in-network providers within their health insurance as fair or poor overall compared to adults with higher incomes. About a quarter (23%) of lower income adults with ESI rated the availability of health care professionals covered by their insurance as “fair” or “poor,” compared to about one in eight (13%) of adults with higher incomes. In addition, one in five (21%) lower income adults rated the quality of health care professionals covered by their insurance as “fair” or “poor” compared to one in seven (14%) higher income adults. A quarter of lower income adults with ESI also gave fair or poor ratings on the availability of mental health professionals covered by their health insurance.

Lower Income Adults With ESI Were More Dissatisfied With The Availability And Quality Of Medical Providers Covered By Insurance Compared To Higher Income Adults With ESI

Lower income adults with ESI reported more difficulty in signing up for coverage and comparing plans compared to higher income adults with ESI.

Lower income adults with ESI (20%) were twice as likely to state that the application process for insurance was somewhat or very difficult compared to higher income adults (10%). Additionally, three in ten (29%) lower income adults reported more difficulty in comparing the monthly premium among insurance options, compared to 17% of those with higher incomes. Lower income adults were also twice as likely to report difficulty finding a health plan that met their needs (29%) than higher income adults (14%).

Lower Income Adults With ESI Reported More Difficulty In Signing Up For Coverage And Comparing Plans Compared To Higher Income Adults With ESI.

Discussion

Lower income adults face unique financial barriers to health care that could negatively affect their health outcomes. Lower income adults with ESI in our survey were much more likely to report financial difficulties in paying for medical bills, aligning with past research that shows lower income adults tend to spend a higher share of their income on health care costs compared to higher income adults. Many lower income adults do not have a safety net or savings to pay for medical costs and are disproportionately burdened by medical debt. High health care costs may deter lower income adults with ESI from seeking the medical care they need, leading to worse health outcomes. Lower income adults often cannot afford to lose income to see their health care provider if their job does not offer enough sick leave or paid time off, which could also lead to worse health outcomes down the line. Some lower income individuals are denied care due to outstanding medical bills, which could worsen any illness or condition that they have. Additionally, lower income adults are more likely to be exposed to occupational hazards within the workplace that can lead to injury or disease, which could also lead to unexpected, pricy medical costs or a reduction in wages.

Some lower income adults with ESI may end up paying more for “affordable” insurance through their employer than they would pay for other types of coverage. For example, some lower income adults are eligible for cost-sharing reductions and premium assistance that would greatly lower the percentage of monthly income they would be expected to contribute towards their monthly premium (as low as 0 to 2% for those with incomes less than 200% FPL) for a Marketplace plan, but cannot take advantage of this financial assistance if the employer plan they are being offered meets an affordability threshold under by the ACA (a premium contribution of 8.39% of income for 2024). Additionally, adults who are eligible for Medicaid or state premium assistance programs in their state would typically face lower out-of-pocket spending with these coverage types compared to if they enrolled in ESI coverage, although these options may not available to single adults who live in states that did not expand Medicaid or have not established a state premium assistance program.

Nearly six in ten employers reported that they have a moderate or high level of concern regarding cost-sharing for their employees. Some employers have attempted to reduce health care costs for adults with ESI, specifically for those with lower incomes, through use of different health care plan designs such as:

  • Salary based premium programs: These are programs that base the monthly premium amount an enrollee is expected to pay on their annual salary. Salary-based premium programs lower monthly premium costs but may not contain costs for other out-of-pocket expenses like deductibles.
  • Co-pay plans: These plans offer flat fees for routine doctor visits and typically have low deductibles. Co-pay plans may be beneficial for those who use insurance primarily for routine visits, but may also be financially burdensome for those who need care outside of routine health care services, as these may lead to higher health care costs.
  • High deductible health plans (HDHPs): These are health plans that have higher deductibles but low premium costs. HDHPs are typically beneficial for those who can contribute or meet the deductible by enrolling in a Health Savings Account (HSA), a benefit sometimes offered to those enrolled in HDHPs where they can set aside money on a pre-tax basis to pay for out-of-pocket healthcare costs or a Health Reimbursement Account (HRA) where ESI enrollees can be reimbursed for paying for certain medical expenses. Lower income adults with ESI sometimes do not have enough money to meet the deductible, even when a savings option such as an HSA or HRA is available. In addition, tax-preferred HSAs and HRAs are of less value to lower income people in lower tax brackets.

Uptake of health plans designed to lower cost-sharing for ESI enrollees is unknown. Ten percent of large firms reported implementing a program that lowers premium costs for lower income enrollees, and five percent offered programs that help lower cost sharing for lower income enrollees overall. One brokerage firm survey found that 39% of employers surveyed offered co-pay plans to their enrollees, and 19% offered a salary based premium program.

Lower income adults with ESI reported more problems in accessing timely and quality behavioral health services compared to higher income adults with ESI. Ensuring timely and adequate access to behavioral health care is an issue for those with ESI coverage, but the survey findings indicate that this may be an even bigger problem for lower income adults with ESI, who are more likely than their higher income counterparts to rate their insurance coverage negatively in terms of the availability of mental health providers. It is not clear whether lower income adults with ESI are more challenged by time and distance to in-network providers, lack of available appointments, high demand, difficulties in accessing providers using public transportation or other issues, such as fewer providers regardless of in-network status who they trust with their care. Studies have shown that many individuals with employer coverage must access behavioral health care through out-of-network providers, paying the higher out-of-network rates or paying the entire cost of the care. This may simply not be an option for a lower income adult with the same ESI coverage. Also, lower income adults with ESI may be more likely to choose an ESI coverage option with a narrower network than other available plan options because it is the lowest cost option available. Proposed updates to the Mental Health Parity and Addiction Equity Act would require health plans, including employer-sponsored plans, to collect and evaluate information related to the status and breadth of their behavioral health networks, including utilization of out-of-network behavioral health.

Lower income adults reported that they were more likely to experience difficulty in signing up for coverage and this could lead to worse health outcomes and medical debt. Lower income respondents with ESI in our survey were more likely than those with higher incomes to report having a difficult time comparing plan options and signing up for coverage that best met their needs. This could be related to more complex needs, as well as lower levels of education. Signing up for coverage and comparing options can be complicated for consumers. While Human Resources (HR) departments can be helpful, HR professionals, especially those working in small firms, might not always have the time or expertise needed to assist employees. Also, signing up for coverage can also be especially challenging for those who are eligible for coverage options outside of ESI (e.g., adults who are eligible for Medicaid in their state) or for consumers who are switching to ESI coverage as a result of the unwinding of the Medicaid continuous enrollment requirement and must navigate complications that come with the ESI enrollment process, such as enrolling in coverage in alignment with special enrollment period deadlines.

It may be difficult for lower income adults with ESI to find assistance outside of Human Resources that will help them with the enrollment process, including comparing available choices between ESI and public programs. Insurance brokers might provide assistance for those eligible for Marketplace coverage, but, according to a 2022 KFF Assister survey, brokers were less likely than other assisters to provide help with Medicaid enrollment, and did not always have the same ability to work with those who needed language assistance.  There is no longer any federally supported program that is designed to offer resources to those with ESI as there was under the Consumer Assistance Program (CAP). CAP was established under the ACA and offered federal funding for states to create programs to assist consumers with insurance problems and identify their best options for health coverage. Unlike the Navigator program that was specifically created to assist Marketplace, Medicaid, and CHIP consumers, the CAP program was able to assist consumers with ESI coverage as well as those with other types of coverage, for those states that chose to participate. 35 states and the District of Columbia signed up for CAP in 2010, but the grant was not renewed for federal funding, eliminating the only federally funded program that could assist those with ESI coverage. Many states have continued their CAP programs through their own funding, but others have discontinued their operations.

Methodology

This KFF Survey of Consumer Experiences with Health Insurance was designed and analyzed by public opinion researchers at KFF. The survey was designed to reach a representative sample of insured adults in the U.S. The survey was conducted February 21–March 14, 2023, online and by telephone among a nationally representative sample of 3,605 U.S. adults who have employer sponsored insurance plans (978), Medicaid (815), Medicare (885), Marketplace plans (880), or a Military plan (47).

The margin of sampling error for adults with employer-sponsored insurance is plus or minus 4 percentage points. For the 213 adults with employer-sponsored insurance with a household income under 200% of the federal poverty line the margin of error is plus or minus 8 percentage points. For the 758 adults with employer-sponsored plans and household incomes of 200% of the federal poverty line or greater, the margin of sampling error is plus or minus 4 percentage points.

The sample includes 2,595 insured adults reached through the SSRS Opinion Panel either online or over the phone (n=75 in Spanish). Another 504 respondents were reached online through the Ipsos Knowledge Panel. Another 289 (n=10 in Spanish) interviews were conducted from a random digit dial (RDD) of prepaid cell phone numbers (n=190) and landline telephone numbers (n=99). An additional 217 respondents were reached by calling back respondents who said they were insured in previous KFF probability-based polls.

Respondents were weighted separately to match each group’s demographics using data from the 2021 American Community Survey (ACS). Weighting parameters included gender, age, education, race/ethnicity, and region.

For full details on the survey methodology, see the Methodology tab of the KFF Survey of Consumer Experiences with Health Insurance.

This work was supported in part by a grant from the Robert Wood Johnson Foundation. The views and analysis contained here do not necessarily reflect the views of the Foundation. KFF maintains full editorial control over all of its policy analysis, polling, and journalism activities.

An Update on ACA Medicaid Expansion: What to Watch in North Carolina and Beyond

Published: Dec 18, 2023

North Carolina started implementation of the ACA Medicaid expansion on December 1, 2023, after becoming the 41st state to adopt the Affordable Care Act (ACA) Medicaid expansion when Governor Roy Cooper signed legislation earlier this year. Expansion will be implemented in conjunction with other major delivery system reforms and activities to address social determinants of health and reduce disparities. North Carolina is the first state since Virginia in 2018 to adopt Medicaid expansion through a legislative process; the last six states after Virginia (Idaho, Missouri, Nebraska, Oklahoma, South Dakota, and Utah) adopted expansion through ballot initiatives. North Carolina is the largest state since Pennsylvania in 2015 to expand Medicaid.

As North Carolina starts implementation of the ACA Medicaid expansion, CMS under the Biden administration urges the 10 remaining non-expansion states to adopt the ACA Medicaid expansion, though the administration has little power to encourage expansion. At the same time, former President Trump announced he would renew efforts to replace the ACA if elected again, which could put coverage and financing under the Medicaid expansion at risk. If all remaining states adopted the Medicaid expansion, approximately 3.5 million uninsured adults would become newly eligible for Medicaid. This policy watch examines implications for expansion in North Carolina as well as key issues to watch in North Carolina and across other states.

How many adults could be covered under Medicaid expansion in North Carolina?

An estimated 600,000 adults are newly eligible for full Medicaid coverage under the Medicaid expansion. Coverage expanded to nearly all nonelderly adults with incomes up to 138% of the Federal Poverty Level (FPL) ($34,307 for a family of three in 2023) on December 1 in North Carolina. Prior to expansion, North Carolina Medicaid income eligibility limits were 37% FPL for parents ($9,198 for a family of three in 2023) and 0% for other adults. KFF estimates that 173,000 uninsured adults fell into the coverage gap (because they had income above Medicaid limits but below poverty and were therefore not eligible for premium subsidies in the ACA Marketplace). Recent estimates from the state show that the 600,000 people eligible under expansion include 200,000 individuals not currently enrolled in Medicaid, 300,000 individuals who were enrolled in family planning-only benefits (which provides enrollees limited coverage of reproductive health services), and 100,000 individuals who may have lost full Medicaid coverage in the absence of expansion as the state resumed redeterminations due to the unwinding of the continuous enrollment provision. In November, individuals in family planning coverage were automatically moved to full coverage to be able to receive full coverage on December 1.

North Carolina is using an array of communication and outreach strategies to help enroll eligible individuals in expansion. The state is working with community partners to help people get enrolled in coverage. In October, the North Carolina Department of Health and Human Services launched a new website with basic information about expansion including who is eligible, what benefits are covered, and how to apply, as well as a toolkit of English- and Spanish-language resources for providers and organizations to conduct outreach about the state’s expansion of Medicaid. The toolkit includes flyers, social media graphics and posts, a video on how to apply for coverage online, and other resources. The state is also providing outreach training, volunteer opportunities, and other tools, such as deliveries of printed materials for people who want to conduct outreach in their communities. In November, the state started sending text messages, phone calls, and emails to notify up to 300,000 Family Planning program enrollees about their automatic enrollment in full coverage.

What factors contributed to North Carolina expanding Medicaid?

Expansion had longstanding support from Governor Cooper but took a few years to gain consensus in the state legislature. In prior years, Cooper proposed Medicaid expansion in his state budget proposals; however, the Republican-controlled legislature did not include expansion in the final budgets. In 2019, debate over Medicaid expansion resulted in a budget impasse. In 2021, the budget omitted expansion but established a legislative committee to study Medicaid expansion. In 2022, both chambers of the legislature, under Republican leadership and with near unanimous support from both parties, passed bills related to Medicaid expansion; however, neither bill advanced due to disagreements between the two chambers on unrelated provisions.

Financial incentives from the federal government helped to gain new support from Republican legislators. Under the ACA, states receive a 90% federal matching rate (FMAP) for adults covered through the ACA expansion, a higher share than it does for traditional Medicaid enrollees. In 2021, the temporary fiscal incentive under the American Rescue Plan Act (ARPA) reignited discussion around Medicaid expansion in a  few  non-expansion states, including North Carolina. Under ARPA, states that newly adopt expansion are eligible for an additional 5 percentage point increase in the state’s traditional FMAP for two years, resulting in a temporary net fiscal benefit for these states. New support for adopting Medicaid expansion among Republican lawmakers was attributed to the fiscal incentives among other reasons for their change in opinion. At the time of passage of the state budget, the Joint Conference Committee estimated the ARPA incentive would bring a fiscal benefit of about $1.5 billion over two years and appropriated many of these funds to health-related initiatives. Additionally, the legislation adopting Medicaid expansion authorized the Healthcare Access and Stabilization Program (HASP), a directed payment program funded through increased hospital assessments that provides eligible hospitals with supplemental payments. According to the state, Medicaid expansion and HASP will allow the state to receive more than $8 billion each year from the federal government.

The substantial body of research pointing to largely positive effects of expansion may have also been a consideration in adopting expansion. Although it appears financial incentives were a primary motivator for state legislators formerly opposed to Medicaid, the Joint Legislative Committee on Access to Healthcare and Medicaid Expansion was presented with findings on the impact of Medicaid expansion. KFF reports published in 2020 and 2021 reviewed more than 600 studies and concluded that expansion is linked to gains in coverage, improvement in access and health, and economic benefits for states and providers. More recent studies generally find positive effects related to more specific outcomes such as improved access to care, treatment and outcomes for cancer, chronic conditions, sexual and reproductive health, and behavioral health. Studies also point to evidence of reduced racial disparities in coverage and access, reduced mortality, and improvements in economic impacts for providers (particularly rural hospitals) and economic stability for individuals.

What to watch moving forward?

How will expansion intersect with other ongoing and planned reforms in North Carolina? In addition to Medicaid expansion, North Carolina is also implementing major delivery system reforms and activities to address social determinants of health and reduce disparities. Beginning July 1, 2021, North Carolina implemented its first Medicaid managed care organization (MCO) program with the launch of MCO “Standard Plans,” offering integrated physical and behavioral health services statewide, with mandatory enrollment for most population groups; most expansion enrollees will receive coverage through Standard Plans. The state also recently submitted an 1115 waiver extension request that includes requests to cover a set of pre-release services for justice-involved individuals and to expand the Healthy Opportunities Pilots program that covers non-medical services that address specific social needs linked to health outcomes. The implementation of Medicaid expansion extends Medicaid coverage to more North Carolinians who could be eligible for these services.

How will Medicaid expansion intersect with unwinding of the continuous enrollment provision and what will be the effect on the uninsured? All states are currently conducting redeterminations for all Medicaid enrollees due to the unwinding of pandemic-related eligibility protections. During unwinding, states will disenroll those who are no longer eligible or who may remain eligible but are unable to complete the renewal process. North Carolina began Medicaid disenrollments in July 2023, and as of November 2023, 181,375 enrollees were disenrolled. Without expansion, adults disenrolled from Medicaid with incomes below poverty may have fallen into the coverage gap but now could be eligible for expansion coverage. Managing the unwinding in conjunction with implementing expansion may require additional eligibility and enrollment staff to help manage the volume of renewals and new applicants simultaneously. While many states may experience increases in the number of people uninsured as people are disenrolled from Medicaid coverage, North Carolina could see reductions in the uninsured as more adults become eligible and enroll in expansion coverage.

What does this mean for other non-expansion states? Looking ahead expansion could be a federal election issue as the Biden administration continues to encourage states to adopt expansion and has also proposed measures to cover people in states that do not expand. At the same time, Republican presidential candidates, including former President Trump and Governor Ron DeSantis, have called for renewed efforts to repeal and replace the ACA. In addition, Governor DeSantis of Florida and former Governor of South Carolina Nikki Haley have opposed Medicaid expansion in their states. While a number of states have been able to adopt expansion through a ballot measure, that option is not available to most other non-expansion states. At the state level, Medicaid expansion was a topic in the recent Mississippi gubernatorial race, but Governor Tate Reeves was re-elected in 2023, taking expansion off the table. Expansion is unlikely to be a major issue in upcoming statewide gubernatorial elections, as none of the remaining non-expansion states have a gubernatorial election in 2024; however, there could be changes in the make-up of state legislatures. Some states to watch include Kansas and Wisconsin, where Democratic governors have continued to support expansion. Kansas’ governor recently re-initiated discussion of Medicaid expansion, but it is unclear if the state legislature will take-up the proposal.

News Release

Updated Health Spending Explorer Features the Latest National Data on How Much People Spend and Who Pays the Bills

Published: Dec 15, 2023

The latest data on U.S. health spending are now available on the Health Spending Explorer, an interactive tool that allows users to explore trends in health spending by federal and local governments, insurers, nursing care, hospital, and other service providers, and consumers.

The tool captures just-released 2022 data from the federal government, when national health expenditures totaled nearly $4.5 trillion. Overall spending rose 4.1% in 2022, with almost all categories of health spending experiencing growth. This rise was muted by lower federal public health spending related to the pandemic. Meanwhile, consumers’ out-of-pocket costs rose 6.6%, a large but less dramatic increase than in 2021.

The tool allows users to build and download custom charts, with spending broken out for hospitals, nursing care, prescription drugs, and more and other services and payments broken out for Medicare, Medicaid and CHIP, private insurance, and consumers’ out-of-pocket costs. 

The data are based on the latest national health spending report from actuaries at the Centers for Medicare & Medicaid Services, covering the years from 1960 through 2021. Custom-made charts can be easily shared through social media and email. In addition to the interactive, the new data is also reflected in an updated chart collection on changes to U.S. healthcare spending over time. The KFF-Peterson Health System Tracker is an online information hub dedicated to monitoring and assessing the performance of the U.S. health system.

Poll Finding

KFF Misinformation Poll Snapshot: Public Views Misinformation As A Major Problem, Feels Uncertain About Accuracy Of Information On Current Events

Published: Dec 15, 2023

Findings

As part of KFF’s ongoing effort to identify and track the rise and prevalence of misinformation in the U.S, KFF released the Health Misinformation Tracking Poll Pilot earlier this year. The pilot poll found that adults across demographics were uncertain about the accuracy of many health-related false and inaccurate claims and had limited trust in both traditional and social media as sources of health information1 . The latest poll examines the public’s view of misinformation as a problem and their perception of the accuracy of information on four major news topics in the U.S. today.

The findings suggest two potential scenarios both of which likely exist to some extent. On one hand, since so many people are dubious of the information they see including any false and misleading claims, perhaps these claims do not sink in as often as they are identified, therefore limiting the impact of misinformation on people who are skeptical of most of the information they come across. On the other hand, people, without a strong sense of what to trust, might be more susceptible to misinformation and disinformation. Regardless, the poll suggests an opportunity to help the public get more clarity on how to know when to trust a source or piece of information.

Large Majorities Across Groups See Misinformation As A “Major Problem”

The latest KFF poll finds a vast majority of adults (83%) say the spread of false and inaccurate information in the United States is a “major problem,” which is relatively unchanged since June.

At least three-quarters of Black adults (84%), Hispanic adults (76%), and White adults (85%) say the spread of false and inaccurate information is a “major problem” in the U.S. In an area of partisan agreement, large majorities of Democrats and Democrat-leaning independents (88%), Republicans and Republican-leading independents (81%), and independents (78%) say the same.

Majorities of adults across educational levels also agree that the spread of false and inaccurate information is a “major problem,” though a somewhat smaller share (79%) of adults with a high school education or less say this compared to adults with a college degree or higher (88%).

About Eight In Ten Adults Say The Spread Of False Information Is A Major Problem In The United States

Most Are Uncertain About Information They Come Across On Current News Topics

With majorities across demographic groups saying the spread of false information is a problem in the U.S., the latest polling from KFF finds that a majority of adults express uncertainty about the accuracy of information they come across relating to four major news topics.

Most of the public say they feel uncertain about the accuracy “all or most of the time” or “sometimes” when they come across information on the four news topics asked about, with at least one in four saying they feel uncertain about the accuracy of information “all or most of the time” regarding the conflict in Gaza and Israel (32%), the upcoming 2024 presidential election (31%), and COVID-19 (27%). A smaller share, roughly one-fifth of adults (18%), say the same regarding information about abortion and reproductive health-related issues.

On the other hand, one in four or fewer adults say they are “rarely” uncertain about the accuracy when they come across information about abortion and reproductive health (23%), COVID-19 (19%), the conflict in Gaza and Israel (13%), and the presidential election (10%). Even smaller shares, fewer than one in ten, say they are “never” uncertain about the accuracy of information about each issue.

At Least One-Fourth Of Adults Express Persistent Uncertainty About The Accuracy Of Information Surrounding The Conflict In The Middle East, The Presidential Election, And COVID-19

Some Groups Are More Likely To Express Uncertainty About Information About Specific News Topics

While a majority of the public say they feel uncertain at least “sometimes” about the accuracy of information they come across on all these topics, there are some differences by key groups. Namely, Republicans and Republican-leaning independents are far more likely than Democrats and Democratic-leaning independents to say they feel uncertain “all or most of the time” about the accuracy of information around the 2024 presidential election, COVID-192 , and abortion and reproductive health issues.

Republicans and Republican-leaning independents are nearly four times as likely to say they feel uncertain about the accuracy of COVID-19 information “all or most of the time” (43%) compared to Democrats and Democratic-leaning independents (11%). About three in ten (29%) independents report the same. A third of Democrats (34%) and one-fourth (25%) of independents say they feel uncertain about the accuracy of COVID-19 information they come across “rarely” or “never,” compared to 14% of Republicans.

Republicans are also more likely to report feeling uncertainty about the accuracy of information related to the presidential election. About four in ten (39%) Republicans and Republican-leaning independents say they feel uncertain “all or most of the time” about the accuracy of information on this news topic, compared to a quarter of Democrats and Democratic-leaning independents. Three in ten independents say they feel uncertain “all or most of the time” about the accuracy of presidential election-related information.

Republicans More Likely Than Democrats To Question The Accuracy Of Information About The Upcoming Presidential Election And COVID-19

Uncertainty about the accuracy of information people come across about COVID-19 is also related to COVID-19 vaccination status. Adults who have never received a COVID-19 vaccine are about twice as likely as adults who have received at least one dose of a COVID-19 vaccine to say that they are uncertain “all or most of the time” about the accuracy of information pertaining to the virus (46% vs 22%, respectively).

Unvaccinated Adults Twice As Likely As Vaccinated Adults To Feel Uncertain All Or Most Of The Time About The Accuracy Of COVID-19 Information

About one in five (18%) adults say they feel uncertain “all or most of the time” when it comes to the accuracy of information they come across about abortion and reproductive health issues. Uncertainty about the accuracy of information on this issue is similar for adults across age, educational attainment, and race and ethnicity, as well as of whether they live in a state where abortion is restricted or even banned. However, women of reproductive age (ages 18-49), for whom information about abortion and reproductive health is particularly relevant, are more likely than men in their same age group to say the feel uncertain “all or most of the time” about the accuracy of information about those topics (21% vs. 13%, respectively).

When asked about information they come across about the conflict in Gaza and Israel, 35% of adults ages 18-49 say they feel uncertain about the accuracy “all or most of the time,” a larger share than their older counterparts (27%).

The findings suggest potential scenarios about the current information environment. Since so many people are dubious of the information they see including any false and misleading claims, perhaps these claims do not sink in as often as they are identified, therefore limiting the impact of misinformation on people who are skeptical of most of the information they come across. On the other hand, people, without a strong sense of what to trust, might be more susceptible to misinformation and disinformation. Regardless, the poll suggests an opportunity to help people get more clarity on how to know when to trust a source or piece of information.

Methodology

This KFF Health Tracking Poll/COVID-19 Vaccine Monitor was designed and analyzed by public opinion researchers at KFF. The survey was conducted October 31- November 7, 2023, online and by telephone among a nationally representative sample of 1,301 U.S. adults in English (1,222) and in Spanish (79). The sample includes 1,016 adults (n=52 in Spanish) reached through the SSRS Opinion Panel either online (n=991) or over the phone (n=25). The SSRS Opinion Panel is a nationally representative probability-based panel where panel members are recruited randomly in one of two ways: (a) Through invitations mailed to respondents randomly sampled from an Address-Based Sample (ABS) provided by Marketing Systems Groups (MSG) through the U.S. Postal Service’s Computerized Delivery Sequence (CDS); (b) from a dual-frame random digit dial (RDD) sample provided by MSG. For the online panel component, invitations were sent to panel members by email followed by up to three reminder emails.

Another 285 (n=27 in Spanish) interviews were conducted from a random digit dial telephone sample of prepaid cell phone numbers obtained through MSG. Phone numbers used for the prepaid cell phone component were randomly generated from a cell phone sampling frame with disproportionate stratification aimed at reaching Hispanic and non-Hispanic Black respondents. Stratification was based on incidence of the race/ethnicity groups within each frame.

Respondents in the phone samples received a $15 incentive via a check received by mail, and web respondents received a $5 electronic gift card incentive (some harder-to-reach groups received a $10 electronic gift card). In order to ensure data quality, cases were removed if they failed attention check questions in the online version of the questionnaire, or if they had over 30% item non-response, or had a length less than one quarter of the mean length by mode. Based on this criterion, one case was removed.

The combined cell phone and panel samples were weighted to match the sample’s demographics to the national U.S. adult population based on parameters derived from the Census Bureau’s 2022 Current Population Survey (CPS), 2021 Volunteering and Civic Life Supplement data from the CPS, and the 2023 KFF Benchmarking survey with ABS and prepaid cell phone samples. The demographic variables included in weighting for the general population sample are sex, age, education, race/ethnicity, region, education, civic engagement, internet use, and political party identification by race/ethnicity. The sample of registered voters was weighted separately to match the U.S. registered voter population using the parameters above plus recalled vote in the 2020 presidential election by county quintiles grouped by Trump vote share. Both weights take into account differences in the probability of selection for each sample type (prepaid cell phone and panel). This includes adjustment for the sample design and geographic stratification of the cell phone sample, within household probability of selection, and the design of the panel-recruitment procedure.

The margin of sampling error including the design effect for the full sample and registered voters is plus or minus 4 percentage points. Numbers of respondents and margins of sampling error for key subgroups are shown in the table below. For results based on other subgroups, the margin of sampling error may be higher. Sample sizes and margins of sampling error for other subgroups are available by request. Sampling error is only one of many potential sources of error and there may be other unmeasured error in this or any other public opinion poll. KFF public opinion and survey research is a charter member of the Transparency Initiative of the American Association for Public Opinion Research.

GroupN (unweighted)M.O.S.E.
Total1,301± 4 percentage points
Total Registered Voters1,072± 4 percentage points
Republican Registered Voters342± 7 percentage points
Democratic Registered Voters333± 7 percentage points
Independent Registered Voters296± 7 percentage points
 
Race/Ethnicity
White, non-Hispanic719± 5 percentage points
Black, non-Hispanic218± 9 percentage points
Hispanic247± 8 percentage points

Endnotes

  1. The Health Misinformation Tracking Poll Pilot asked about the traditional and social media sources that the public regularly uses, as well as the level of trust in health-related information from each source. This KFF Misinformation Poll Snapshot asks how often the public is uncertain when they come across information on four news topics, without specifying the source of that information. ↩︎
  2. Past KFF COVID-19 Vaccine Monitor surveys from 2021 and 2022, as well as the KFF Health Misinformation Tracking Poll Pilot, found that significant shares of adults were uncertain about false claims pertaining to COVID-19, including, but not limited to: the effectiveness of COVID-19 vaccines and various treatments such as Ivermectin, the effect of vaccines on pregnancy and fertility, and the U.S. government’s reporting of COVID-19 related-deaths. ↩︎
News Release

Who Decides When a Patient Qualifies for an Abortion Ban Exception? Doctors vs. the Courts

Published: Dec 14, 2023

Earlier this week, the Texas Supreme Court overturned a lower court order that would have allowed a Texas woman—who was more than 20 weeks pregnant carrying a fetus diagnosed with a fatal condition—to get an abortion in the state. The woman has reportedly travelled out of Texas to obtain an abortion.

A new KFF brief examines the difficulties presented by the vagueness and narrowness of exceptions in state abortion bans, which leave physicians in limbo, uncertain about what they can and cannot do. 

The case in Texas highlights the dilemma in which many doctors and patients find themselves when faced with a pregnancy that they believe qualifies for an exception while fearing criminal prosecution and penalties if they provide an abortion. The brief describes the circumstances underpinning the Texas case, as well as medical exceptions in other states with abortion and gestational bans currently in effect. 

The Texas abortion ban specifies that the physician must determine that the abortion is necessary based on their “reasonable medical judgement.” The brief also explores the tensions between “reasonable medical judgment” and “good faith” standards, which leave physicians legally vulnerable and reluctant to certify that a patient qualifies for an abortion ban exception.

Who Uses Medicaid Long-Term Services and Supports?

Published: Dec 14, 2023

Introduction

KFF estimates that nearly 6 million people receive Medicaid long-term services and supports (LTSS) for assistance with activities of daily living (such as eating, bathing, and dressing) and instrumental activities of daily living (such as preparing meals, managing medication, and housekeeping). LTSS are provided to people who need such services because of aging, chronic illness, or disability and may be provided in institutional settings such as nursing facilities (1.6 million people) or in people’s homes and the community (4.2 million people). This analysis examines the characteristics of Medicaid enrollees who use LTSS, how enrollees who use LTSS differ from those who do not use LTSS, and how enrollees who use different types of LTSS differ from each other. For details on methods, please see KFF’s previous data note, which described the number of people who use LTSS and how much Medicaid spends on those people.

Key takeaways include:

  • Age, Sex, and Race: Over half (56%) of Medicaid enrollees who use LTSS broadly are under 65, but the age distribution varies by type of service. Most enrollees who use Medicaid home- and community-based services (HCBS) are under age 65, while most enrollees who use institutional LTSS are ages 65 and older. Among enrollees who use LTSS, males are generally younger than females. Over twice as many males are under the age of 18 compared with females (16% vs. 8%). Just over half (51%) of all Medicaid enrollees who use LTSS are White, 19% are Black, and 14% are Hispanic.
  • Eligibility Group: Over two-thirds (70%) of enrollees who use LTSS and are under 65 qualify for Medicaid because of a disability. The Affordable Care Act (ACA) Medicaid expansion has expanded access to LTSS: 1 in 5 enrollees under 65 who use institutional LTSS and 1 in every 10 enrollees under 65 who use Medicaid HCBS are eligible for Medicaid through the ACA expansion.
  • Medicare Coverage: 62% of Medicaid enrollees that use LTSS are also enrolled in Medicare, and the share is higher among those who use institutional LTSS (79%) compared with those who use HCBS (56%).
  • Health Conditions: Enrollees who use LTSS are much more likely to be diagnosed with ongoing health conditions than enrollees who do not use LTSS, with the highest rates of diagnoses among older enrollees who use institutional LTSS.

What are the demographic characteristics of Medicaid enrollees who use LTSS?

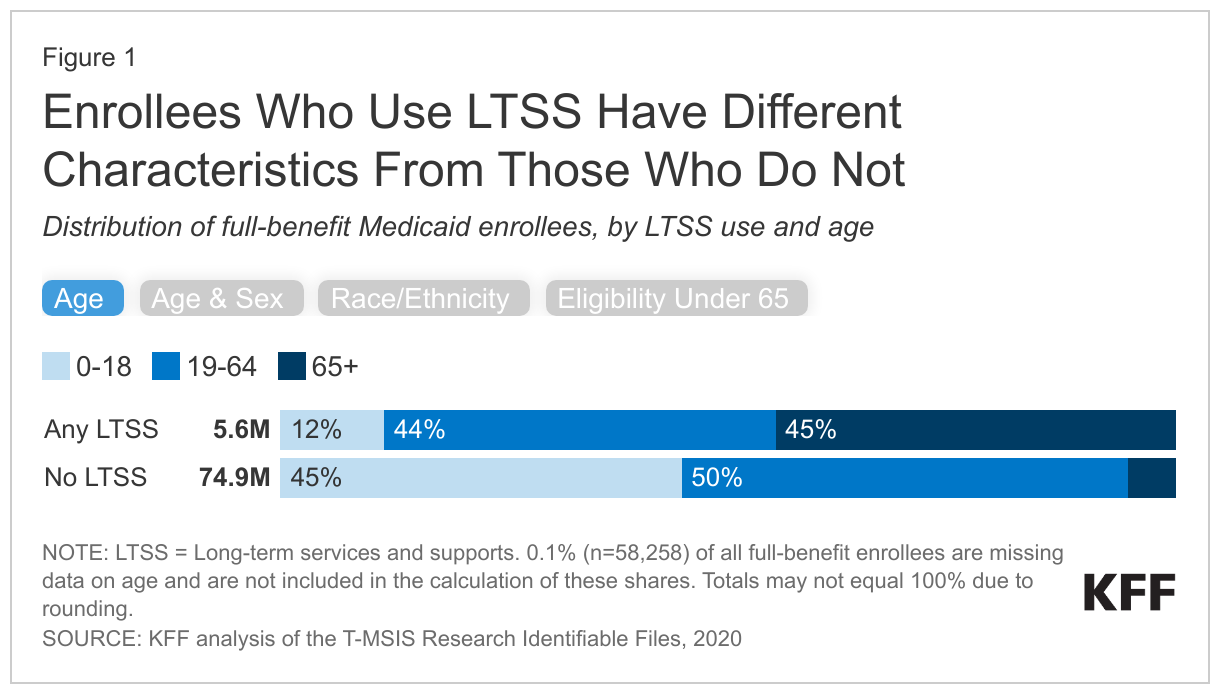
Over half (56%) of Medicaid enrollees who use LTSS are under 65, but those who use LTSS are still older than those who do not use LTSS (Figure 1). LTSS are commonly associated with people ages 65 and older, but many younger enrollees use LTSS because of chronic illness or disability. The remaining 45% of enrollees who use LTSS are 65 and older. In comparison, only 5% of Medicaid enrollees who do not use LTSS are ages 65 and older.

Male Medicaid enrollees who use LTSS are more likely to be under 65 and twice as likely to be under 18 as female enrollees who use LTSS (Figure 1). The younger age distribution of males may be related to higher rates of diagnoses of intellectual and developmental disabilities among young boys than among young girls. Male enrollees who use LTSS may also be younger than female enrollees who use LTSS since women generally live longer than men.

Medicaid enrollees who use LTSS are more likely to be White and less likely to be Hispanic compared to those who don’t use LTSS (Figure 1). These data are from the 31 states that reported “low/medium concern” data quality levels with their race and ethnicity data in 2020. People who are White comprise just over half (51%) of all Medicaid enrollees who use LTSS, but only 39% of enrollees who don’t use LTSS. People who are Hispanic comprise just 14% of all Medicaid enrollees who use LTSS, but 25% of enrollees who don’t use LTSS. This pattern may, in part, reflect differences in age distribution across racial and ethnic groups, with over half (53%) of Hispanic enrollees under age 19 compared with 37% of White enrollees (data not shown). The share of enrollees who are Black is similar among those who use LTSS and those who do not (19% and 20% respectively).

Just over two-thirds (70%) of people who use Medicaid LTSS and are under age 65 qualify for Medicaid because of a disability (Figure 1). Among Medicaid enrollees under age 65 who do not use LTSS, only 12% are eligible for Medicaid because of a disability. The remaining 30% of enrollees who use LTSS are eligible through the child eligibility group, the Affordable Care Act (ACA) expansion group, or through another adult eligibility group.

Enrollees Who Use LTSS Have Different Characteristics From Those Who Do Not

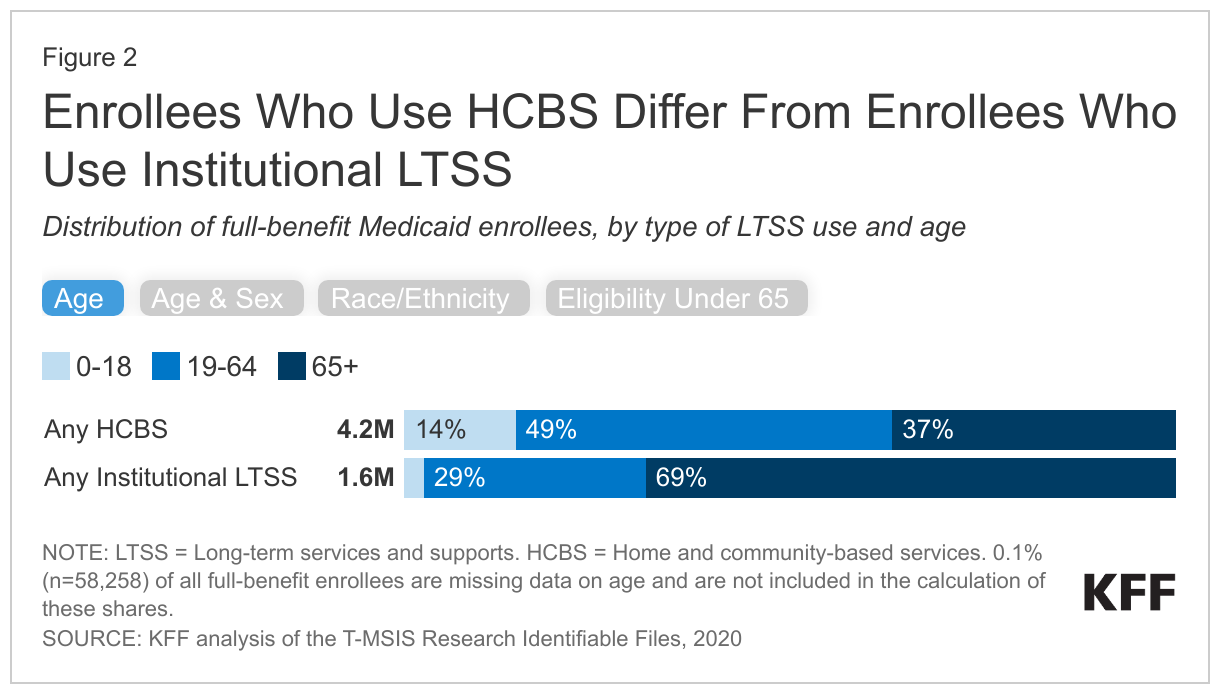
Enrollees who use Medicaid HCBS are more likely to be younger, Black or Hispanic, and receive Medicaid because of a disability when compared to enrollees who use institutional LTSS (Figure 2). There are notable differences in the characteristics of people who use HCBS and institutional LTSS. Among people who use HCBS, 14% are under age 19, and 49% are ages 19-64, whereas over two-thirds of people who use institutional LTSS are ages 65 and older. Among both groups, females who use LTSS have an older age distribution than males who use the same type of LTSS. Enrollees who use HCBS are more likely to be Black or Hispanic (36%) than enrollees who use institutional LTSS (24%). People who are White comprise 47% of people who use HCBS but 64% of people who use institutional LTSS. These differences likely reflect to the younger age distribution of Hispanic enrollees who use any LTSS: 19% of Hispanic enrollees who use LTSS are ages 0-18 compared with 10% of White enrollees (data not shown). Among both enrollees who use institutional LTSS or HCBS, most people under the age of 65 are eligible for Medicaid because of a disability, but the percentage of people eligible for Medicaid through an ACA expansion is 10% among people who use HCBS and 20% among people who use institutional LTSS.

Enrollees Who Use HCBS Differ From Enrollees Who Use Institutional LTSS

What share of Medicaid enrollees who use LTSS are also enrolled in Medicare?

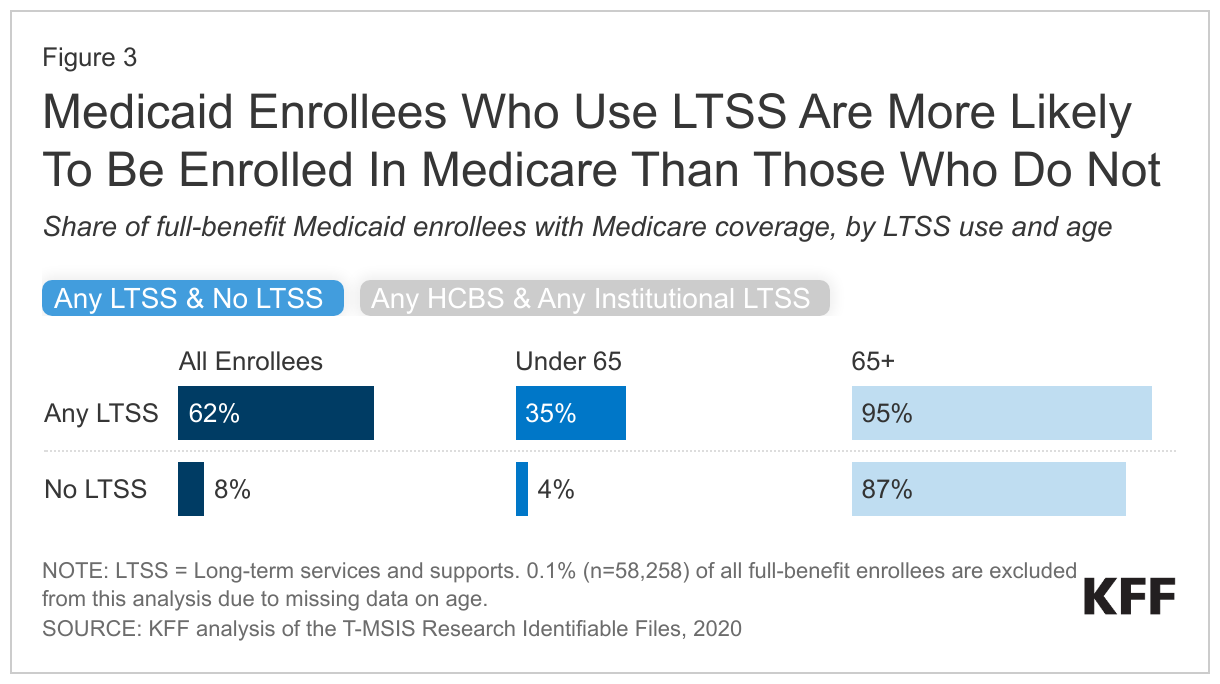
Most (62%) Medicaid enrollees who use LTSS are also enrolled in Medicare (“dual-eligible individuals”) (Figure 3). Only 8% of Medicaid enrollees who don’t use LTSS have Medicare. The high rate of Medicare coverage among Medicaid enrollees who use LTSS reflects the older age distribution of enrollees who use LTSS and high rates of eligibility for Medicaid based on a disability. To be eligible for Medicare, people must generally be ages 65 and older, or have a disability that qualifies them for the federal disability insurance program (people in that program are only eligible for Medicare after a 2-year waiting period). Nearly all enrollees over age 65 are enrolled in Medicare regardless of whether they use LTSS. Enrollees under 65 who use LTSS have higher rates of Medicare coverage when compared to those who do not use LTSS (35% compared with 4%).

The percentage of enrollees with Medicare is higher among those who use institutional LTSS (79%) compared with those who use HCBS (56%) (Figure 3). 34% of enrollees who are under 65 and use HCBS also have Medicare coverage, compared to 40% of enrollees who are under 65 and use institutional LTSS. Nearly all enrollees over 65 who use either HCBS or institutional LTSS have Medicare coverage.

Medicaid Enrollees Who Use LTSS Are More Likely To Be Enrolled In Medicare Than Those Who Do Not

What share of Medicaid enrollees who use LTSS have a diagnosis of at least one ongoing health condition?

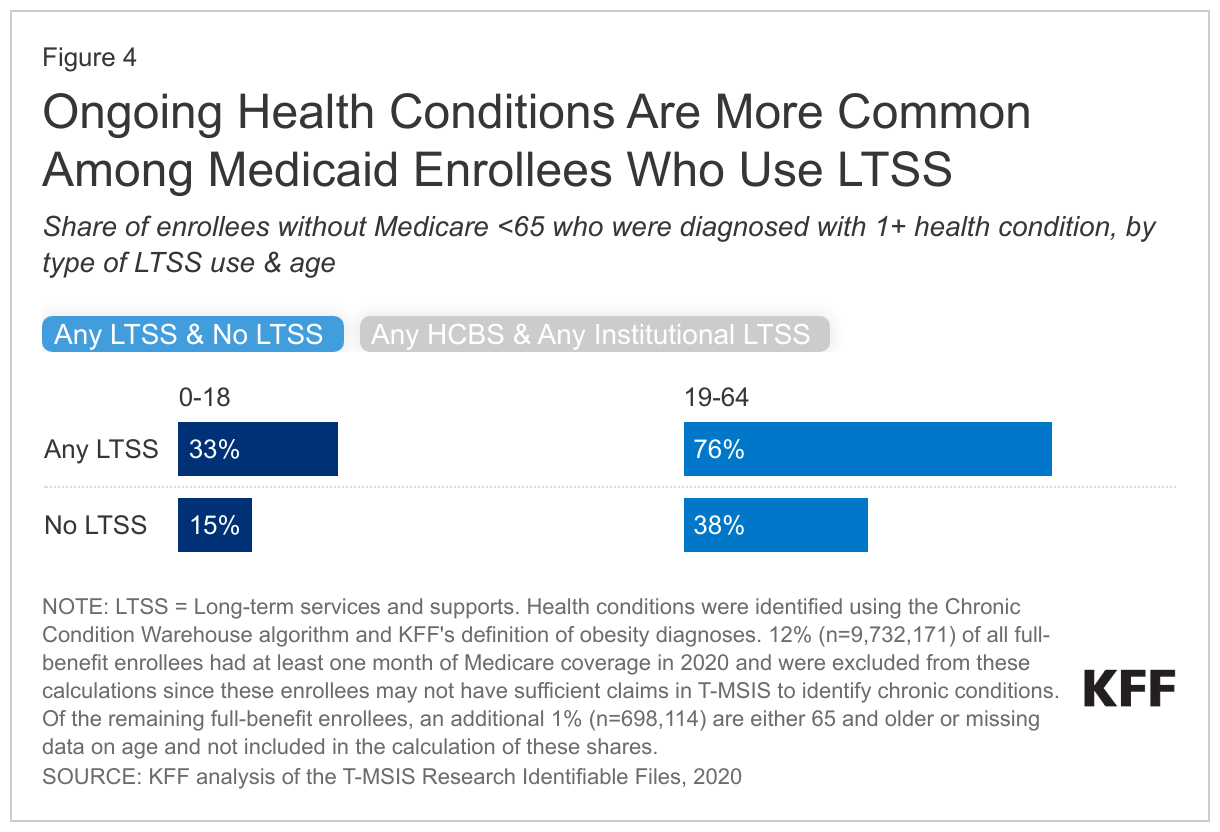
Rates of ongoing health conditions are higher among Medicaid enrollees under 65 without Medicare who use LTSS compared with those who don’t use LTSS (Figure 4). Rates of chronic conditions are only available for Medicaid enrollees who do not have Medicare because for dual-eligible individuals, Medicare is the primary payer of acute care services and health conditions may not show up in the Medicaid data (Box 1). All enrollees 65 and older are also excluded because fewer than five percent of people 65 and older do not have Medicare. Health conditions include a list of 30 chronic conditions maintained by the Centers for Medicare & Medicaid Services and an indicator for whether enrollees had an obesity diagnosis in the Medicaid claims data (defined as ICD-10 diagnosis codes within E66.0, E66.1, E66.2, E66.8, E66.9, Z68.3, Z69.4, and Z68.54.)

Among enrollees under 65 without Medicare, 33% of enrollees ages 0-18 who use LTSS have a diagnosis of at least one ongoing health condition compared with 15% of those who don’t use LTSS. Similarly, 76% of those 19-64 who use LTSS have a diagnosis of at least one ongoing health condition compared to 38% who do not use LTSS. Enrollees who do not have a diagnosis for an ongoing health condition may receive LTSS for any number of other reasons, including frailty. Frailty is a complex health state that describes the decline in health and increased physical vulnerability that comes with aging, chronic and progressive illness, or in the aftermath of a major accident or stroke. People with frailty may not have a diagnosis for any ongoing health conditions, but frailty is a significant reason that people need help with daily personal care activities such as bathing or dressing.

Rates of health conditions are only slightly higher among those who use institutional LTSS compared with those who use HCBS (Figure 4). For enrollees who use HCBS, 33% of those ages 0–18 have a chronic condition compared with 74% of those ages 19-64. These rates are only slightly lower than enrollees who use institutional LTSS. For enrollees who use institutional LTSS, 37% of enrollees ages 0–18 have a chronic condition compared with 89% of enrollees ages 19-64.

Ongoing Health Conditions Are More Common Among Medicaid Enrollees Who Use LTSS

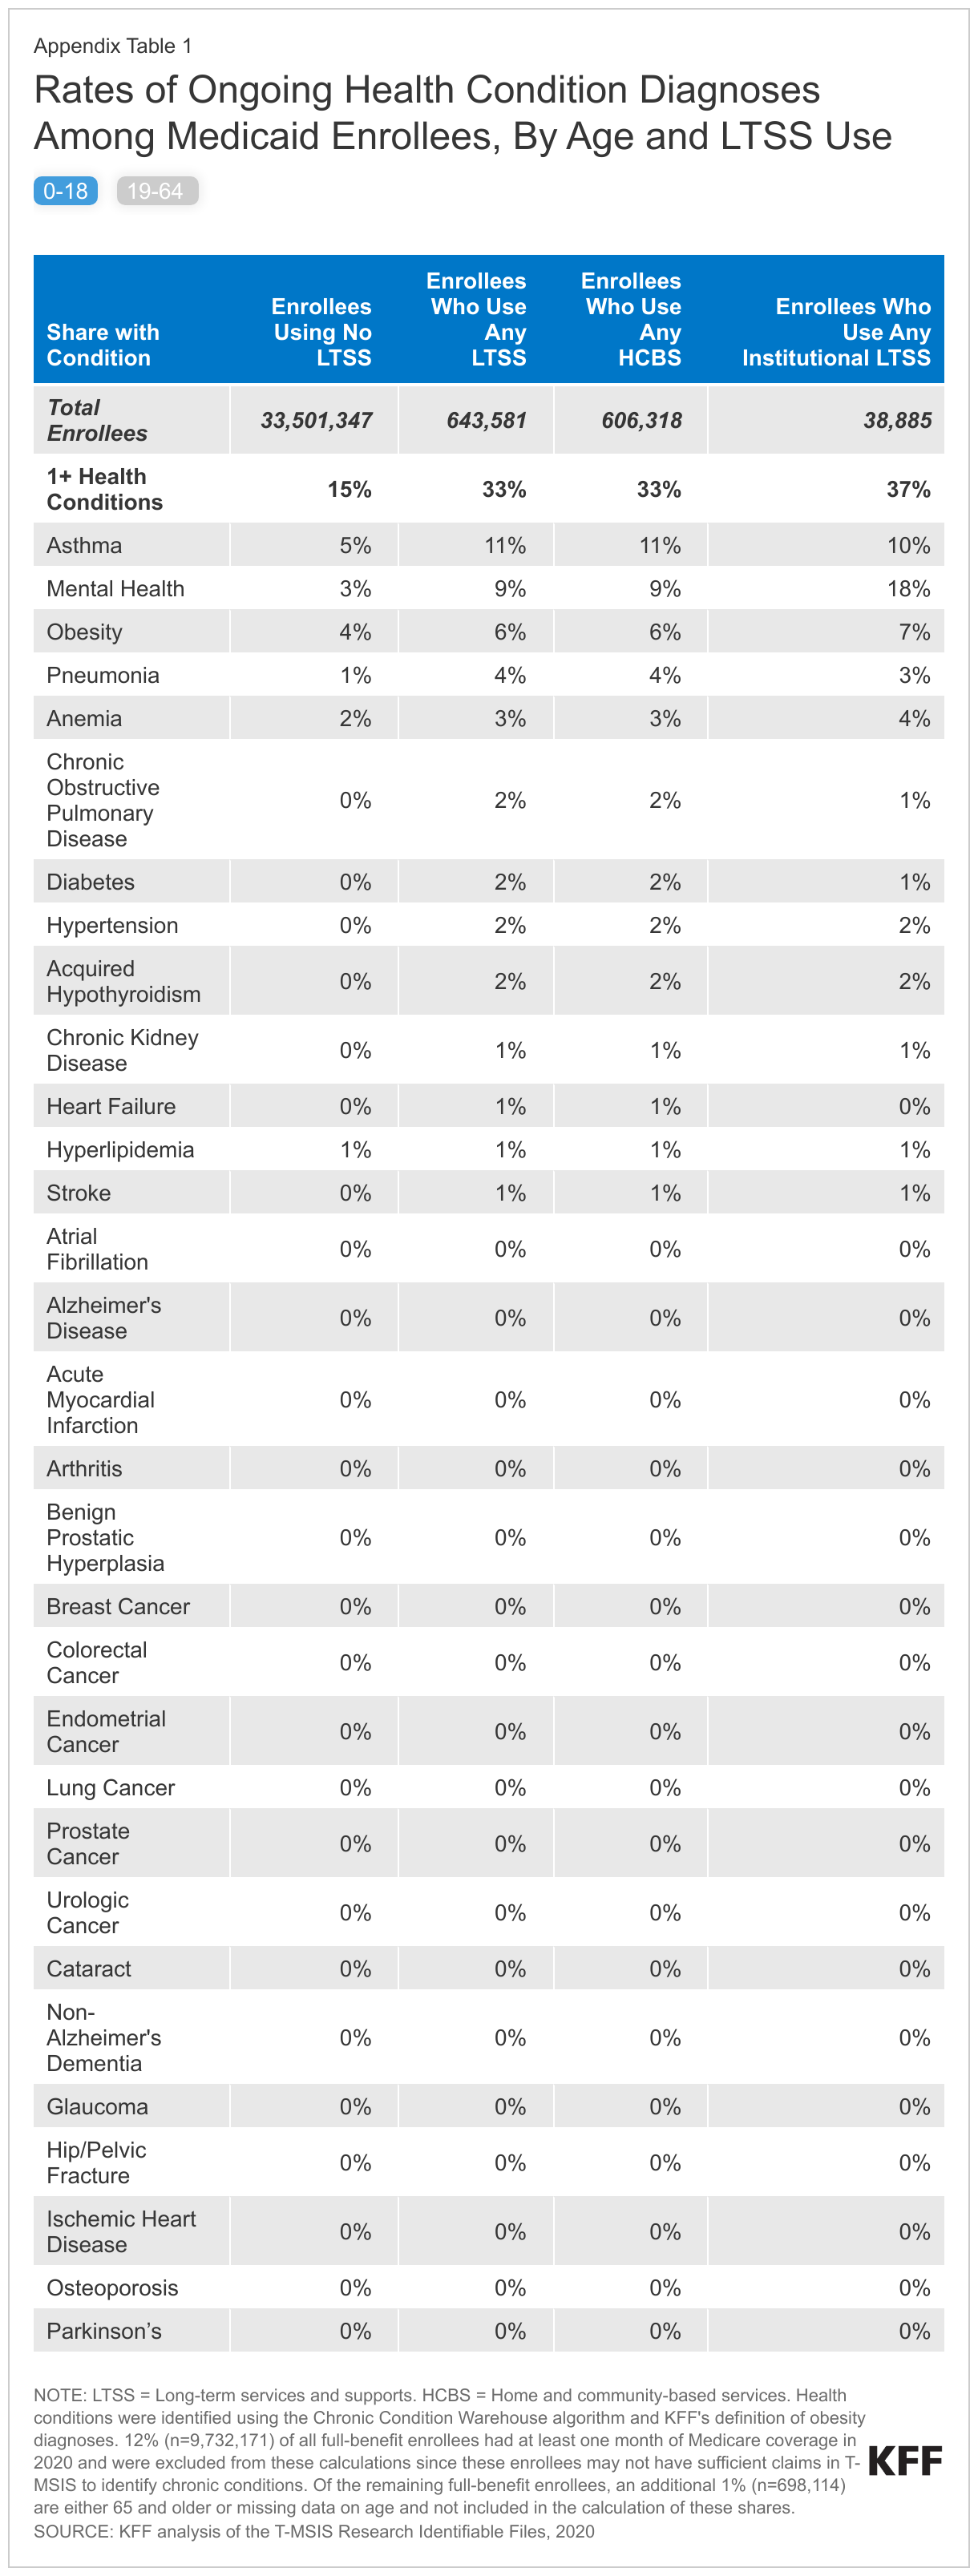
Among Medicaid enrollees under age 65, certain health conditions, in particular, are higher among those who use LTSS than among those who don’t (Appendix Table 1). Among enrollees ages 0-18, 9% of enrollees without Medicare who use LTSS have a mental health diagnosis compared with only 3% of those who don’t use LTSS. Similarly, among enrollees 19-64, 33% of enrollees who use LTSS have a mental health condition compared with only 12% of those who don’t use LTSS; and 18% of enrollees who use LTSS have an obesity diagnosis compared with 8% of enrollees who don’t. Other health conditions, such as pneumonia (10% vs 2%) and diabetes (27% vs 7%), are similarly more common among enrollees ages 19-64 using LTSS when compared to those who don’t.

For Medicaid enrollees under age 65 who use LTSS, the most common chronic conditions are similar for people who use HCBS and institutional care, although the rates of those conditions are somewhat higher among people who use institutional care (Appendix Table 1). Among enrollees under age 19, the three most common conditions include: mental health conditions (affecting 9% of children who use HCBS and 18% of children who use institutional LTSS), asthma (affecting 11% of children who use HCBS and 10% of children who use institutional LTSS), and obesity (affecting 6% of children who use HCBS and 7% of people who use institutional LTSS). Among enrollees ages 19-64, the most common conditions include hypertension (affecting 36% of adults who use HCBS and 57% of adults who use institutional LTSS), mental health conditions (affecting 31% of adults who use HCBS and 45% of adults who use institutional LTSS), and diabetes (affecting 26% of adults who use HCBS and 35% of adults who use institutional LTSS).

Box 1: Identifying Health Conditions Among Medicaid Enrollees

KFF identifies people’s health conditions through diagnosis codes on Medicaid claims and encounter data. Claims are records of bills submitted by providers in order to be reimbursed by the state Medicaid program. Encounter data are records of the services received by people who are enrolled in Medicaid health plans. Unlike claims, they do not include payment information because the health plans pay providers instead of the state Medicaid program.

Some Medicaid enrollees—known as dual-eligible individuals—also have Medicare and for those people, Medicare is the primary payer for most health care services. Medicaid pays for Medicare premiums and in most cases, cost sharing. For dual-eligible individuals who are eligible for full Medicaid, Medicaid also covers supplemental benefits such as LTSS and non-emergency medical transportation. In many cases, there will be no Medicaid claims or encounter data when services are covered by Medicare. Without claims, there are no diagnosis codes for dual-eligible individuals. As a result, it is impossible to accurately identify rates of health conditions in Medicaid data for dual-eligible individuals. Approximately 9.7 million full-benefit duals are excluded from the calculations in Figure 4.

What key issues may impact those who use Medicaid LTSS?

Are there sufficient workers to meet the higher staffing levels sought in proposed rules? Long-standing staffing shortages in long-term care facilities predate the COVID-19 pandemic, but the pandemic exacerbated them and the number of workers employed at skilled nursing care and elderly care facilities was still below pre-pandemic levels in October 2023. The federal government recently released a proposed rule that would create new requirements for nurse staffing levels in nursing facilities. KFF analysis finds that fewer than 1 in 5 could currently meet the required number of hours for registered nurses and nurse aides, but facilities will have several years to come into compliance and the proposed rule includes hardship exemptions. For HCBS, the Biden Administration recently released a proposed rule aimed at ensuring access to Medicaid services, which has several notable provisions aimed at addressing HCBS workforce challenges. States would be required to report payment rates for certain HCBS, to demonstrate that payment rates are “adequate” to provide the level of services in enrollees’ personalized care plans, and to ensure at least 80% of payments are passed through to worker compensation for certain types of HCBS.

Will there be additional barriers to accessing Medicaid HCBS as public health emergency authorities end and enhanced federal funding runs out? Recognizing the importance of keeping people out of congregate settings and that HCBS workforce challenges were exacerbated during the COVID-19 public health emergency, the federal government provided states with new authorities and funding to maintain access to HCBS during the public health emergency (PHE). States used the additional funding and flexibility to increase payment rates, pay family caregivers, and expand access to HCBS. Although many states are working to make the PHE changes permanent, KFF findings indicate that some states will revert to their pre-PHE policies, potentially reducing access to HCBS or payments to providers. Funding made available by the American Rescue Plan Act to “enhance, expand, and strengthen” HCBS is also set to expire in March 2025, although states may exhaust the additional funding before that time.

As the population continues to age and more people need Medicaid LTSS, how might policy makers aim to expand access to care? As the 25th anniversary of the Olmstead court decision—which requires people with disabilities to be served in the most integrated setting that is appropriate—nears, there may be increased attention on the extent to which integration has occurred and where further integration is still needed. Along those lines, a recent proposed rule clarifies the obligation for states to provide services in the most integrated setting appropriate—codifying the Olmstead decision and clarifying that failing to provide services in the most integrated setting appropriate is a form of discrimination. Data describing the differences between people who are using institutional LTSS and HCBS helps illuminate which populations are most likely to receive integrated care and which are still served in primarily segregated settings. Beyond the people who are currently using Medicaid LTSS, there are close to 0.7 million people on waiting lists or interest lists for Medicaid HCBS. While these data are an imperfect measure of unmet need, they do suggest there has been consistent unmet need for these services and have been described as contributing to the risk of unnecessary institutional for people with disabilities. Recent research also finds that there are disparities in HCBS spending, access, and outcomes among communities of color, including higher rates of unmet LTSS needs.
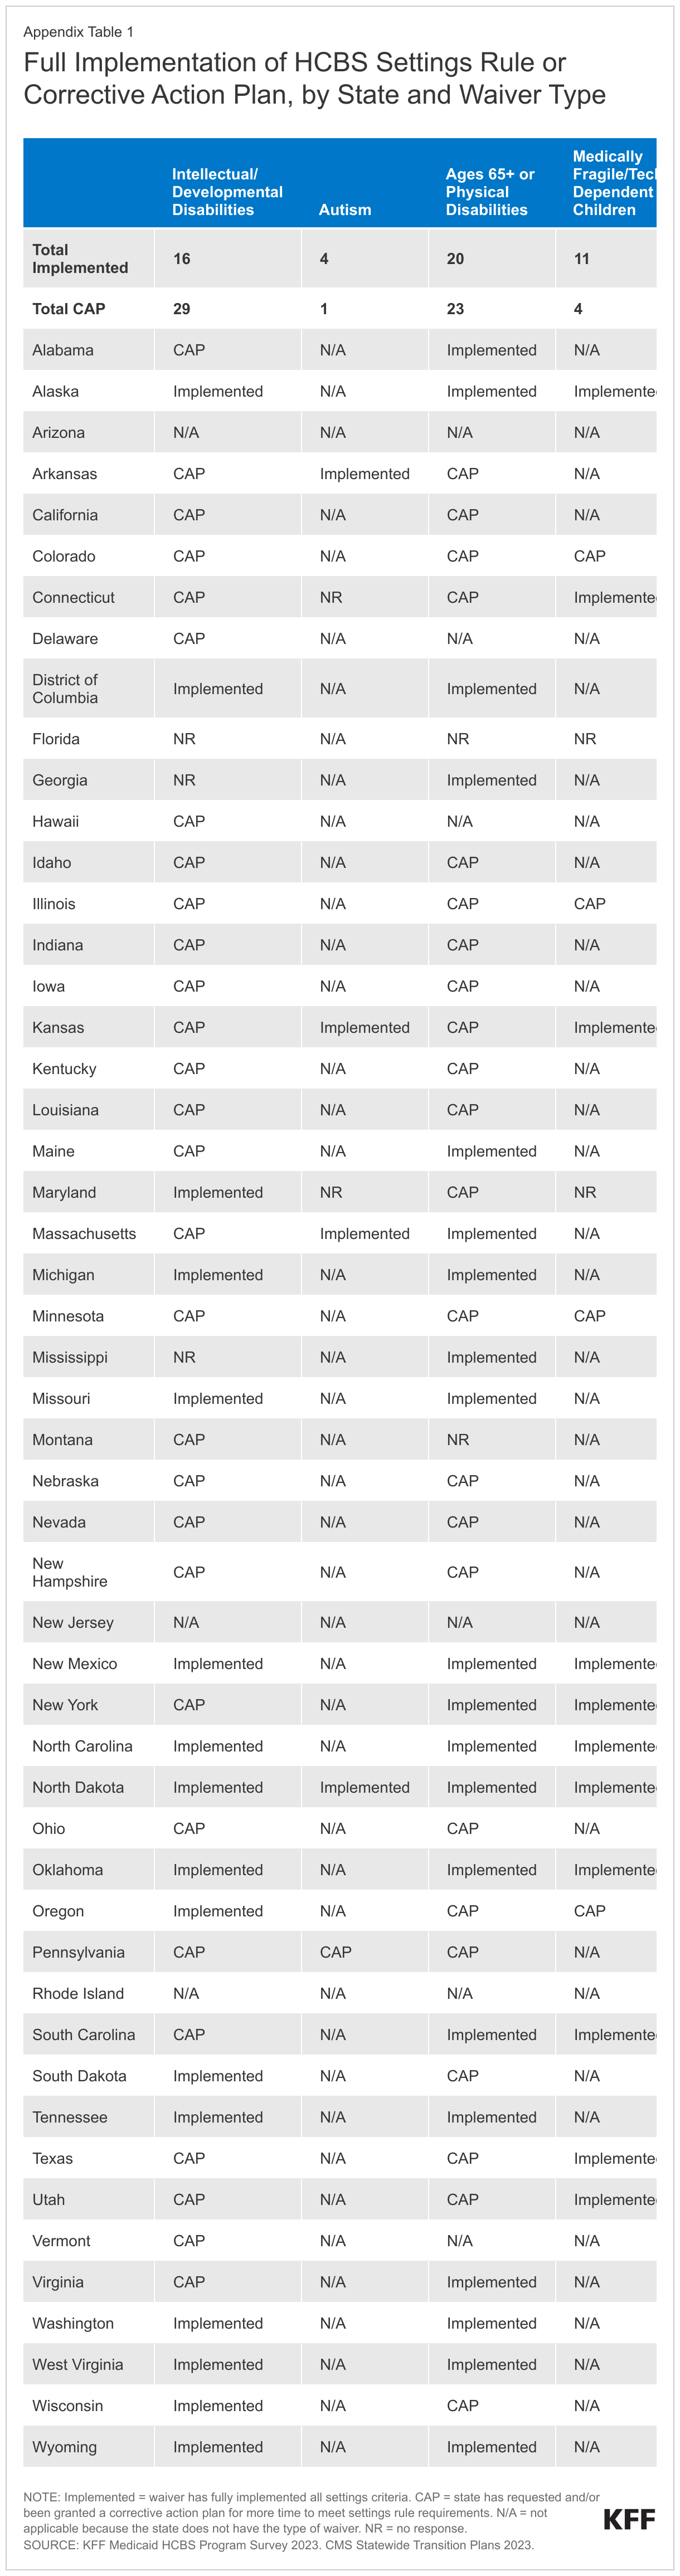
Appendix Table

Rates of Ongoing Health Condition Diagnoses Among Medicaid Enrollees, By Age and LTSS Use

Who Decides When a Patient Qualifies for an Abortion Ban Exception? Doctors vs. the Courts

Authors: Laurie Sobel, Mabel Felix, and Alina Salganicoff
Published: Dec 14, 2023

While all eyes were on Texas and the recent case of Kate Cox, a woman seeking a court order allowing her abortion under an exception to the Texas abortion ban, the conflict could have played out in many states. Like many physicians in states with abortion bans, Ms. Cox’s physician and the hospital where she practices did not want to risk criminal and professional penalties by providing an abortion without obtaining a court order that it qualified for an exception. The KFF 2023 National OBGYN survey found that over half of OBGYNs practicing in states where abortion is banned reported being concerned about their legal risk when making decisions about patient care and the necessity for abortions. The risk to doctors is so high that many doctors are hesitant to provide life-saving abortion care unless the threat to life is imminent. The difficulties presented by the simultaneous vagueness and narrowness of the exceptions in state abortion bans are exacerbated by the lack of deference given to clinicians’ medical judgment to determine when an abortion falls under an exception. This leaves pregnant people who require abortion care in a potentially untenable situation, not just in Texas but any state that has a narrow exception to their abortion ban.

The case in Texas highlights the impossible situation that many doctors and patients find themselves in when faced with a pregnancy that may qualify for an exception. Fearing prosecution for providing abortion care that she believed it fit under the abortion ban’s exception based upon her good faith medical judgement, Ms. Cox’s physician asked a Texas District Court to determine that providing the abortion was not a violation of the state’s ban. After that court effectively signed off on the physician’s judgement by issuing an order blocking the Texas Attorney General from enforcing the abortion ban against Ms. Cox’s physician and hospital, the Attorney General wrote a letter to the hospital stating that his office would still enforce the state abortion ban if the abortion care was provided. The Texas Supreme Court soon overruled the district court order by stating that it did not want to get involved in medical judgments and it is the doctor, not the courts, who decide who qualifies for an abortion. However, if doctors are prosecuted for providing abortions under an exception, the courts will nonetheless end up determining whether the abortions qualified for an exception and physicians will still be vulnerable to having their judgment second-guessed by judges and juries. Unable to get a determination from a court ahead of providing care, yet vulnerable to prosecution after providing care, doctors and their patients caught in a “Catch-22.” In this case, Ms. Cox was reportedly able to leave the state to receive the abortion care her doctor believed she needed, but others may not have the resources to travel out of state to get medically-indicated care.

Medical Exceptions in State Abortion Bans Are Vague

All 20 states with abortion and gestation bans currently in effect contain exceptions to “prevent the death” or “preserve the life” of the pregnant person. Like Texas, these exceptions are not clear how much risk of death or how close to death a pregnant patient may need to be for the exception to apply, and the determination is not explicitly up to the physician treating the pregnant patient.

Exceptions to State Abortion Bans and Early Gestational Limits in Effect, as of December 13, 2023

Five states with abortion bans in effect (Arkansas, Idaho, Mississippi, Oklahoma, and South Dakota) do not have any exceptions for the “health” of the pregnant person, only to preserve “life.” The remaining 15 states with bans and restrictions in effect contain a health exception. Most of these exceptions permit abortion care when there is a serious risk of substantial and irreversible impairment of a major bodily function. The ability to operationalize these exceptions, however, is limited by the lack of specific clinical definitions of the conditions qualifying for the exception. Arizona’s ban explicitly defines the bodily functions that may be considered “major.” Most other states that use this language in their bans do not define what constitutes a “major bodily function,” nor what constitutes a “substantial impairment” to a major bodily function. This vague language can put physicians providing care to pregnant people in an untenable situation should their patients need an abortion to treat a condition jeopardizing their health, and ultimately can leave the determination of whether an abortion can be legally provided to lawyers for the institution in which the clinician practices or the courts.

‘Reasonable Medical Judgment’ vs. ‘Good Faith’

The Texas abortion ban specifies that the physician must determine that the abortion is necessary based on their “reasonable medical judgement.” This standard leaves physicians in a legally vulnerable situation and understandably reluctant to certify a pregnancy as qualifying for a life or health exception. This reluctance stems from the concern of being found guilty of violating the law if the court relies on the testimony of other medical experts that say that the treating physician didn’t meet the standard for “reasonable medical judgement.” Due to the concern that a court would later second-guess her judgment, in the Texas lawsuit, Ms. Cox’s physician requested an order from the court allowing her to perform the abortion on the basis of her “good faith” belief that her patient fell under the exception. Additionally, she was unsure how close to death Ms. Cox needed to be before she would be permitted to legally perform the abortion in the state and sought the court’s confirmation. While the District court agreed with the plaintiffs that the case qualified for an exception, the Texas Supreme Court did not. They did not rule specifically on the medical situation facing the patient. Instead, they found that the physician’s “good faith belief” was insufficient to qualify for the exception, and only abortions that are certified to be necessary under the “reasonable medical judgement” standard are allowable under Texas law. A similar situation could arise in the other states that have narrow life or health exceptions and don’t grant deference to the physician’s judgment.

Currently, most states with health or life exceptions require a physician to exercise “reasonable medical judgement” to determine if the exception applies, though a few do not specify a standard. Arizona, however, requires only that a physician make the determination based on their “good faith clinical judgment.” Some states with more than one abortion ban or restriction on the books have different standards in each of these laws, further complicating what a doctor needs to do to certify that an abortion qualifies for an exception

While the case in Texas garnered national attention, this situation will inevitably arise again in states with abortion bans or restrictions. People seeking abortion care – even when their physicians believe they may qualify for an exception – will likely have to travel out of state if they are able, risk their health, or wait until the pregnancy jeopardizes their life.

Poll Finding

KFF COVID-19 Vaccine Monitor: MAGA Republicans’ Relationship With COVID-19 Vaccines

Published: Dec 14, 2023

Findings

The KFF COVID-19 Vaccine Monitor has been tracking intentions to get a COVID-19 vaccine since December 2020, when the initial vaccine first became available. Throughout the past three years, partisanship has continued to play an outsized role in predicting both intentions to get a COVID-19 vaccine as well as other pandemic-related attitudes and behaviors. With the latest COVID-19 vaccine rollout, Republicans are once again among the groups least likely to report having gotten the updated shot. This data note examines how vaccine attitudes and uptake differ between Republicans who sit on different sides of a particular ideological divide within Republican Party – support of the Make America Great Again (MAGA) movement.

The MAGA movement has attracted many Republicans and Republican-leaning independents, with six in ten (58%) saying they support the MAGA movement, representing about one quarter (23%) of all U.S. adults, according to the latest KFF Tracking Poll.

Generally, MAGA supporting Republicans tend to be older and have lower levels of education than Republicans who do not support the MAGA movement, with a larger share of MAGA Republicans being ages 50 and older (58% vs. 41%) and having less than a college degree (81% vs. 53%). MAGA supporting Republicans and Republicans who do not support the MAGA movement look similar across gender, race, and ethnicity.

MAGA Supporting Republicans Tend To Be Older, Less Educated Than Those Who Don't Support The MAGA Movement

MAGA Supporters Are Among Groups Least Likely To Get Updated COVID-19 Vaccine

Majorities of adults across partisan groups have reported receiving at least one dose of the COVID-19 vaccine that has been on the market since December 2020, though larger shares of Republicans compared to Democrats and independents remained resistant, with at least a quarter saying they would “definitely not” get a COVID-19 vaccine throughout the three years of KFF COVID-19 Vaccine Monitor surveys.

The November COVID-19 Vaccine Monitor finds that among Republicans and Republican-leaning independents, similar majorities of both those who support the MAGA movement (60%) and those who do not support the MAGA movement (70%) say they have received at least one dose of a COVID-19 vaccine (10 percentage points is within the margin of sampling error).

However, Republicans under 50 years old who support the MAGA movement are particularly resistant to getting a COVID-19 vaccine, with about four in ten saying they have received at least one dose, 20 percentage points lower than their non-MAGA supporting counterparts (39% vs. 59%). Given the increased vulnerability of adults ages 50 and older to the virus, and consistent with our findings that across party lines, older people have been more likely to get the COVID-19 vaccine, large majorities of older MAGA and non-MAGA supporting Republicans ages 50 and older report having gotten a COVID-19 dose.

Younger Republicans Who Support The MAGA Movement Are Less Likely Than Those Who Don't To Have Gotten A Dose Of A COVID-19 Vaccine

The newest COVID-19 vaccine recently became available in September of this year, with somewhat muted uptake compared to initial vaccine uptake. As of early November, two in ten adults say they have gotten the updated vaccine including one in three Democrats (32%), 16% of independents, and 12% of Republicans. Among Republicans, alignment with the MAGA movement is a strong predictor of vaccine intentions with supporters of the MAGA movement the fiercest in their opposition to the latest shot.

Among Republicans and Republican-leaning independents, about one in four (26%) of those who do not support MAGA say they have gotten or “probably” or “definitely” will get the latest updated COVID-19 vaccine, compared to about one in six (17%) of those who support MAGA saying they have gotten or plan to get the vaccine.

Most Republicans, regardless of MAGA support, say they will not get the latest updated COVID-19 vaccine with nearly two-thirds (63%) of MAGA Republicans saying they will “definitely not” get the newest vaccine, a slightly larger share than the half of their non-MAGA counterparts (52%) who say the same. The difference between Republican MAGA supporters and non-supporters in the share who have gotten the updated COVID-19 vaccine or say they will persists even after controlling for other demographics of age, gender, community type (such as urban, rural, or suburban communities), education, and household income.

In addition to being among the least likely to be vaccinated against COVID-19 at all, younger MAGA Republicans are among the most adamant that they will “definitely not” get the updated vaccine. Seven in ten (70%) MAGA supporting Republicans under age 50 say they will “definitely not” get the updated shot, compared to 54% of Republicans and leaners in this age group who do not support the MAGA movement (and 34% of the public overall).

Two-Thirds Of Republicans Who Identify As Part Of The MAGA Movement Say They Will "Definitely Not" Get The Updated COVID-19 Vaccine

MAGA Republicans Are Also Less Likely To Get The Flu Shot Or View Other Vaccines As Safe

As of September, almost six in ten (57%) non-MAGA identifying Republicans said they had already gotten or definitely will get the flu shot this season, compared to 43% of MAGA supporting Republicans. Interestingly, Republicans who do not identify with the MAGA movement are not significantly more likely than MAGA Republicans to say they normally get an annual flu shot. This could suggest that the MAGA impact on vaccine uptake could be a relatively new phenomenon that public health officials may be facing in the years to come.

Larger Shares Of Republicans Who Don't Identify With MAGA Have Gotten Or Will Get Their Flu Shot This Year

The differences between Republican MAGA supporters and non-supporters are not only evident in their uptake of vaccines, but also in their assessment of the safety of different types of vaccines. Republicans and Republican-leaning independents who support the MAGA movement are less likely than their non-MAGA counterparts to express confidence in the safety of COVID-19 vaccines (29% vs. 44%), respiratory syncytial virus, or RSV, vaccines (41% vs. 61%), and flu vaccines (53% vs. 74%).

MAGA Supporting Republicans Are Less Likely To Be Confident In The Safety Of Vaccines, Especially The COVID-19 Vaccine

Methodology

This KFF Health Tracking Poll/COVID-19 Vaccine Monitor was designed and analyzed by public opinion researchers at KFF. The survey was conducted October 31- November 7, 2023, online and by telephone among a nationally representative sample of 1,301 U.S. adults in English (1,222) and in Spanish (79). The sample includes 1,016 adults (n=52 in Spanish) reached through the SSRS Opinion Panel either online (n=991) or over the phone (n=25). The SSRS Opinion Panel is a nationally representative probability-based panel where panel members are recruited randomly in one of two ways: (a) Through invitations mailed to respondents randomly sampled from an Address-Based Sample (ABS) provided by Marketing Systems Groups (MSG) through the U.S. Postal Service’s Computerized Delivery Sequence (CDS); (b) from a dual-frame random digit dial (RDD) sample provided by MSG. For the online panel component, invitations were sent to panel members by email followed by up to three reminder emails.

Another 285 (n=27 in Spanish) interviews were conducted from a random digit dial telephone sample of prepaid cell phone numbers obtained through MSG. Phone numbers used for the prepaid cell phone component were randomly generated from a cell phone sampling frame with disproportionate stratification aimed at reaching Hispanic and non-Hispanic Black respondents. Stratification was based on incidence of the race/ethnicity groups within each frame.

Respondents in the phone samples received a $15 incentive via a check received by mail, and web respondents received a $5 electronic gift card incentive (some harder-to-reach groups received a $10 electronic gift card). In order to ensure data quality, cases were removed if they failed attention check questions in the online version of the questionnaire, or if they had over 30% item non-response, or had a length less than one quarter of the mean length by mode.  Based on this criterion, one case was removed.

The combined cell phone and panel samples were weighted to match the sample’s demographics to the national U.S. adult population based on parameters derived from the Census Bureau’s 2022 Current Population Survey (CPS), 2021 Volunteering and Civic Life Supplement data from the CPS, and the 2023 KFF Benchmarking survey with ABS and prepaid cell phone samples. The demographic variables included in weighting for the general population sample are sex, age, education, race/ethnicity, region, education, civic engagement, internet use, and political party identification by race/ethnicity.  The sample of registered voters was weighted separately to match the U.S. registered voter population using the parameters above plus recalled vote in the 2020 presidential election by county quintiles grouped by Trump vote share. Both weights take into account differences in the probability of selection for each sample type (prepaid cell phone and panel). This includes adjustment for the sample design and geographic stratification of the cell phone sample, within household probability of selection, and the design of the panel-recruitment procedure.

The margin of sampling error including the design effect for the full sample and registered voters is plus or minus 4 percentage points. Numbers of respondents and margins of sampling error for key subgroups are shown in the table below. For results based on other subgroups, the margin of sampling error may be higher. Sample sizes and margins of sampling error for other subgroups are available by request. Sampling error is only one of many potential sources of error and there may be other unmeasured error in this or any other public opinion poll. KFF public opinion and survey research is a charter member of the Transparency Initiative of the American Association for Public Opinion Research.

GroupN (unweighted)M.O.S.E.
Total1,301± 4 percentage points
Total Registered Voters1,072± 4 percentage points
Republican Registered Voters342± 7 percentage points
Democratic Registered Voters333± 7 percentage points
Independent Registered Voters296± 7 percentage points
 
Race/Ethnicity
White, non-Hispanic719± 5 percentage points
Black, non-Hispanic218± 9 percentage points
Hispanic247± 8 percentage points


How are States Implementing New Requirements for Medicaid Home- and Community-Based Services?

Authors: Maiss Mohamed, Alice Burns, and Molly O’Malley Watts
Published: Dec 13, 2023

In January 2014, the Centers for Medicare and Medicaid Services (CMS) published a final rule that created new requirements for Medicaid home- and community-based services (HCBS) programs. That rule has been informally called the “settings rule.” Enforcement of the rule was delayed multiple times, so the requirements only took effect this year, nearly a decade after the rule was originally finalized. States are still coming into compliance with the rule’s provisions. It will have significant effects on how HCBS are delivered to the four million people using Medicaid HCBS services, and on the states implementing the rule. In 2023, 47 states provided HCBS through a combined 258 1915(c) waivers and 14 provided HCBS through an 1115 waiver, all of which are required to comply with the settings rule.

The settings rule aims to ensure that individuals receiving services through HCBS programs are integrated into the community and creates tangible requirements for what it means to provide Medicaid HCBS through the most integrated setting that is appropriate, as is required under the Supreme Court’s Olmstead ruling. As the 25th anniversary of Olmstead nears, the Administration released a proposed rule that would codify the Olmstead decision more broadly and apply to services beyond those covered in the settings rule. States’ challenges—and successes—in implementing the settings rule may foreshadow barriers to more widespread integration and promising practices to overcome those barriers.

In KFF’s 2023 survey of state Medicaid HCBS programs, 10 states reported that compliance with the rule was the top priority for one or more of their HCBS programs, and an additional 22 states reported that it was the second priority for one or more of their programs. This issue brief describes the settings rule, implementation of the rule across states and HCBS waivers, and what to watch as implementation continues. Key takeaways include:

  • The settings rule establishes new requirements for HCBS settings, including full integration of individuals into the community and rights to privacy, dignity, and autonomy for people receiving services.
  • 24 states report full implementation of the settings rule among all HCBS waivers, and 19 states report partial implementation of criteria across waivers.
  • Most 1915(c) and 1115 waivers serving people with intellectual or developmental disabilities, seniors or people with physical disabilities, and people with traumatic brain or spinal cord injuries have components of the settings rule that they are still working to implement.

What is the settings rule?

The HCBS Settings Rule made numerous changes to Medicaid HCBS programs, the most notable of which include updating the requirements for the settings in which HCBS are provided. For HCBS that are provided under sections 1915(c) and 1115, the rule requires all HCBS settings to:

  • Be integrated into the larger community with individuals having full access to community resources and opportunities;
  • Be selected by the individual seeking care among different options;
  • Ensure rights to privacy, dignity, respect, and freedom from coercion and restraint;
  • Optimize autonomy and independence of residents and participants; and
  • Provide people with choices of services and providers.

There are additional requirements for provider-owned or controlled settings, which include: a lease or other legally enforceable agreement for residents, privacy in the unit with lockable doors, freedom to choose roommates and furnish the unit, control of schedule, access to food at any time, allowance of visitors at any time, and physical accessibility.

Beyond establishing requirements for the settings in which HCBS are provided, the rule made other changes intended to improve people’s access to HCBS. Such changes include:

  • Allowing states to streamline the administration of programs by combining multiple waivers into one,
  • Requiring HCBS programs to use a person-centered approach when establishing plans of care for participants and ensuring that participant goals and preferences guide the delivery of services, and
  • Implementing section 1915(i) of the Affordable Care Act, which allows states to provide optional HCBS through their state Medicaid plans and establish new eligibility categories for people who need HCBS.

The rule was finalized in 2014, but only took effect in March 2023 and many states are continuing to implement some of the rule’s requirements. The rule went into effect in March 2014 and states were initially given one year to submit a transition plan for existing services and five years to come into compliance. In total, states had until 2020 to implement the requirements. However, in 2017, CMS extended the compliance period until 2022 in recognition that states had many reforms underway, but would also need more time to complete the transition. In 2020, CMS once again extended the transition period to 2023 to account for the impact of the COVID-19 pandemic.

In May 2022, CMS updated the implementation strategy and introduced the option for states to request corrective action plans (CAPs). The new strategy required states to receive approval on their final Statewide Transition Plan and to implement all settings criteria not impacted by the COVID-19 public health emergency. Some examples of settings criteria that states may have needed more time to comply with include ensuring that individuals have access to the broader community, facilitating opportunities for employment, and providing the option for a private housing unit or choice of roommate. CMS encouraged states to apply for CAPs if they needed additional time to achieve full compliance.

Which HCBS waivers are most likely to have fully implemented the settings rule?

In KFF’s most recent survey of state HCBS programs, 43 states reported that at least one HCBS waiver had fully implemented the settings rule, and of those states, 24 reported full implementation by all waivers. In contrast, only 7 states report that no waivers have fully implemented the criteria. Most states (37) have requested or been granted a CAP for at least one waiver and among those states, the timelines for full implementation range from July 2023 to January 2026.

Use of CAPs was most common for waivers serving people with intellectual or developmental disabilities and people who are ages 65 and older or have physical disabilities (Figure 1, Appendix Table 1). Among the 45 states with waivers for people who have intellectual or developmental disabilities that responded, 16 states had fully implemented the rule and 29 had CAPs. Among the 43 states with waivers for people who are over age 65 or have physical disabilities that responded, 20 had fully implemented the rule and 23 had CAPs.

Full Implementation of the HCBS Settings Rule Varies by Waiver Type

What to watch as states implement the settings rule?

What have been states’ biggest challenges in implementing the rule? Some of the biggest challenges for states in implementing the settings rule stem from the requirement for waivers to determine compliance for all HCBS providers that serve waiver participants. Several states indicated that full implementation was pending because only one provider or agency was yet to be deemed compliant, including Montana’s waiver for people with intellectual or developmental disabilities and Connecticut’s waiver serving people who are ages 65 and older. For other states, the biggest challenges have been tied to the COVID-19 pandemic, which particularly affected the HCBS workforce. New York reported that the state applied for a corrective action plan because they needed time to hire sufficient staff to support community integration on account of workforce challenges, and 9 states reported full implementation of all settings criteria except for those impacted by the pandemic.

How is the settings rule expected to affect the services received by people with disabilities through the Medicaid program? The settings rule is intended to provide people with disabilities with greater autonomy and independence while they receive HCBS in the most integrated community settings, as is required by the Olmstead ruling. People affected by the rule note that it improves their quality of life in a number of areas, including rights to work a job, choose one’s schedule, and privacy within one’s home. However, some have raised concerns with the rule including its generalization of the needs of all people receiving HCBS and the impracticality of states being able to implement all criteria. States’ progress on implementing the settings rule and addressing these challenges could have implications for a new proposed rule on discrimination, that may apply the principals of the settings rule to more Medicaid HCBS settings.

Full Implementation of HCBS Settings Rule or Corrective Action Plan, by State and Waiver Type