News Release

With More than Half of Medicaid Enrollees Awaiting their Renewal Process, New Report Highlights Lessons Learned that Can Inform State Efforts and Reduce Disenrollments for “Procedural” Reasons

Interviews in Four States Suggest Strategies to Improve Enrollee Communication and Boost Number of Medicaid Enrollees Moving to Marketplace Coverage

Published: Jan 10, 2024

At the beginning of 2024, nine months into states’ efforts to unwind the Medicaid continuous enrollment provision and reverify enrollees’ eligibility, states have completed renewals for less than half of all enrollees.

To gain a better understanding of what challenges states are facing and the effects of different unwinding strategies, KFF interviewed state Medicaid officials in Arizona, Indiana, and Pennsylvania, as well as others involved, including representatives from Medicaid, managed care plans, legal aid organizations, and Marketplace navigators in Arizona, Florida, Indiana, and Pennsylvania. A new report highlights some key insights stemming from those interviews. For example:

  • The volume of renewals, systems issues, and staffing shortages have posed significant challenges to states and, in turn, enrollees. In response, states have taken steps to streamline renewal processes and increase automated renewals. As of December, all study states except Florida had adopted waivers to increase automated renewal rates, and state officials noted that flexibilities related to verifying income and assets were most helpful at increasing those rates.
  • States have also used an array of outreach strategies and partnered with multiple entities involved in the unwinding to reach Medicaid enrollees. All four states have increased communications with enrollees using emails, texts, and phone calls in addition to mailed notices. However, participants in the states said Medicaid renewal and termination notices can be difficult to understand, and long call center wait times hinder the ability of enrollees to get needed help.
  • Some individuals who are disenrolled from Medicaid for procedural reasons are re-enrolling after a gap in coverage. While data on the share of people reenrolling are limited, study states are conducting additional outreach to enrollees who have been procedurally disenrolled to encourage them to complete the renewal process so they can reenroll if still eligible. Interview participants reported that, even with enhanced Affordable Care Act Marketplace premium subsidies, affordability remains a barrier to enrollment for people trying to transition from Medicaid to Marketplace coverage. The number of people disenrolled from Medicaid who enroll in Marketplace coverage remains modest in all four states, according to the people interviewed.

Nationally, the latest KFF tracking shows nearly 14.4 million people have been disenrolled and nearly 27 million reenrolled in Medicaid coverage. While many who are disenrolled may churn back onto Medicaid or transition to other coverage, many will likely become uninsured.

The report, Unwinding of Medicaid Continuous Enrollment: Key Themes from the Field, is available here.

Unwinding of Medicaid Continuous Enrollment: Key Themes from the Field

Authors: Bradley Corallo, Amaya Diana, Jennifer Tolbert, Anna Mudumala, and Robin Rudowitz
Published: Jan 10, 2024

Executive Summary

During the COVID-19 pandemic, states kept people continuously enrolled in Medicaid in exchange for enhanced federal funding. With the end of continuous enrollment on March 31, 2023, states are required to complete an eligibility renewal for all Medicaid and CHIP enrollees by May 2024 – a process commonly referred to as “unwinding.” KFF survey data show that despite outreach, as of early November more than one-third (36%) of Medicaid enrollees had heard nothing at all about unwinding. As of January 2024, states had renewal outcomes for more than four in ten enrollees with over 14 million people disenrolled and more than 27 million reenrolled in Medicaid coverage. In December 2023, growing concern over loss of Medicaid coverage for children prompted federal officials to issue additional guidance with strategies to protect coverage and to write letters to nine states with large declines in Medicaid child enrollment, urging them to take up additional policy options to prevent disenrollments due to paperwork, or procedural, issues.

Data are important to help monitor how unwinding is going across states, but trackers and dashboards only tell part of the unwinding story. Medicaid eligibility is complex, and outcomes are the result of federal and state policy decisions but also the result of how those policies are implemented and how well eligibility and other systems work. This brief examines the perspectives of state officials and others involved in the unwinding process. KFF worked with PerryUndem to conduct interviews with representatives from Medicaid managed care plans, primary care associations, legal aid and other advocacy organizations, and navigator organizations in four states: Arizona, Florida, Indiana and Pennsylvania. In addition, the report draws on broader state input from interviews with Medicaid officials as part of the 23rd annual budget survey of Medicaid officials conducted by KFF and Health Management Associates (HMA) from June to September 2023 (early in the unwinding process). The brief provides information on outreach and engagement, renewal processes and coverage transitions, providing lessons for the ongoing unwinding process, as well as for how to conduct more effective Medicaid renewals generally in the future. Key takeaways include the following:

Communication and Engagement

States have used an array of outreach strategies and partnered with multiple entities involved in unwinding to reach Medicaid enrollees. All states reported using traditional communication campaigns with mailers and paid advertising, and some states have added text messaging and targeted outreach to certain populations, including users of long-term services and supports and people with limited English proficiency. To encourage consistent messaging and information, all four study states have developed toolkits for partner organizations that included printable and digital materials. Study states credited new strategies to update contact information, such as using the National Change of Address database and accepting updated contact information from managed care organizations (MCOs), with reductions in returned mail. While enhanced outreach efforts were generally viewed as positive, some participants said enrollees have been overwhelmed by the volume of contact they have received and, in some cases, unclear messages have led to confusion.

State engagement with those involved with unwinding was described as a positive aspect of unwinding, and feedback loops have helped identify early problems. Many states, including three of the study states, increased engagement and coordination with others involved in unwinding, holding regular meetings to provide updates and review data. In the study states, participants noted these meetings have provided an opportunity to create feedback loops to alert states to potential problems and build relationships in the process. In contrast, limited state engagement and communication contributed to more reports of problems with the unwinding process and frustration among groups involved with the unwinding.

Renewal Processes

The volume of renewals, systems issues, and staffing shortages have posed significant challenges to states. Across many states, older systems that require manual workarounds to meet federal requirements have exacerbated staffing shortages and negatively impact the processing of renewals. While systems are generally working well in Arizona and Indiana, Pennsylvania’s system was not designed to conduct ex parte renewals for a large number of Medicaid enrollees, increasing the burden on eligibility staff to manually process most renewals. Study state officials noted that staffing shortages and inexperienced staff have contributed to backlogs and disenrollments of people who are likely still eligible early in the process; these states responded with additional training and other efforts to increase staff.

States have taken steps to streamline renewal processes and increase ex parte, or automated, renewals. As of January 2024, all study states except Florida had adopted a range of 1902(e)(14) waivers and other flexibilities to increase ex parte rates and streamline renewals. Guidance from CMS in December 2023 announced these waivers will be available through the end of 2024 unless approved for a longer duration. A number of states, including Indiana, have also taken steps to increase ex parte renewals for people who qualify on the basis of disability or over age 65, referred to as non-MAGI populations. When asked about the most helpful flexibilities, states most often pointed to those allowing use of Supplemental Nutrition Access Program (SNAP) data to renew Medicaid, streamlining renewals for those with no and low income, and waiving the asset limit test. Officials in the study states have prioritized ex parte renewals, both automated and manual, as a strategy for reducing procedural disenrollments.

All four study states have increased the number of communication touch points with enrollees. In an effort to improve response rates, study states increased the number of enrollee contacts during the renewal process. For example, Pennsylvania went from sending one mailer ahead of the renewal notice to adding 11 enrollee contacts. States have also expanded communication modes to include emails, texts, and phone calls in addition to mailed notices.

Participants in all four study states reported that Medicaid renewal and termination notices can be difficult to understand. Participants described a variety of problems with notices, from lack of clarity on what actions or documentation are needed for renewal to misleading or incorrect information. Issues with notices were most acute in Florida where advocates have filed a lawsuit, contending notices are confusing, fail to explain why individuals lost Medicaid coverage, and sometimes include incorrect information.

Participants reported challenges getting through to call centers when enrollees needed assistance with their renewals, particularly for people with limited English proficiency. According to study participants, call center wait times are often long and it can be difficult to connect with someone able to assist with complicated cases. Advocates noted wait times were longer for those requesting a language other than English. These problems were echoed by state officials in a number of states.

Coverage Transitions

Some individuals who are disenrolled from Medicaid for procedural reasons are reenrolling after a gap in coverage. While most states are not reporting data on the number of people reenrolling in Medicaid, two study states (Arizona and Pennsylvania) are reporting these data. In Arizona, about half of people who complete their renewal during the 90-day reconsideration period have their coverage reinstated. States have increased communication with people procedurally disenrolled who may be eligible – Arizona and Pennsylvania send letters following disenrollment to let people know they still have time to regain their coverage without completing a new application. Participants noted that when process and systems issues result in disenrollment, it can undermine peoples’ trust in the system and can discourage them from completing their renewal or reapplying.

While children in some states are seamlessly transitioning to CHIP, in other states children are experiencing gaps in coverage. When children in Arizona and Indiana are found to be ineligible for Medicaid, the states automatically enroll them in CHIP, if eligible, without any action required from the family. Participants reported that challenges and glitches with a recent change in Pennsylvania to integrate the CHIP eligibility system with Medicaid have led to some children losing coverage. While information for children determined ineligible for Medicaid is automatically transferred to CHIP, slow processing times may lead to gaps in coverage for some children.

Participants reported that even with enhanced Marketplace premiums, affordability remains a barrier to enrollment. Respondents generally said that account transfers to the Marketplace were happening as expected; however, the number of people disenrolled from Medicaid who enroll in Marketplace coverage remains low in all study states. Participants said that for some people, the deductibles and cost sharing are too high. They also noted that not everyone is aware that Marketplace coverage is an option.

As states continue processing renewals for the more than half of enrollees whose eligibility must be still redetermined, the perspectives of state officials and others involved in unwinding provide valuable insights into what is working well and where there are challenges and room for improvement. States can make changes in the near term to help enrollees maintain Medicaid or transition to other coverage during the unwinding period, but they can also apply the lessons learned to make longer-term improvements to Medicaid renewal processes.

Issue Brief

Introduction

During the COVID-19 pandemic, states kept people continuously enrolled in Medicaid in exchange for enhanced federal funding. With the end of continuous enrollment on March 31, 2023, states began the process of redetermining eligibility for all Medicaid enrollees and disenrolling those who are no longer eligible or whose eligibility could not be determined – a process commonly referred to as “unwinding.” KFF survey data show that despite outreach, as of early November more than one-third (36%) of Medicaid enrollees had heard nothing at all about unwinding. As of January 2024, states had renewal outcomes for more than four in ten enrollees with over 14 million people disenrolled and more than 27 million reenrolled in Medicaid coverage. Data are important to help monitor how unwinding is going across states, but trackers and dashboards only tell part of the unwinding story. Medicaid eligibility is complex, and outcomes are the result of federal and state policy decisions but also the result of how those policies are implemented and how well eligibility and other systems work.

Leading up to unwinding, the federal government issued guidance and provided states with the option to adopt a range of new policies to help promote continuity of coverage (in Medicaid for those who remain eligible or though other coverage for those who are no longer eligible). States have been engaged in unprecedented levels of new outreach, but the volume of redeterminations coupled with workforce shortages and systems issues present challenges. Focus groups with enrollees revealed that while many have been able to successfully renew Medicaid coverage, many were disenrolled due to confusion and barriers to completing the renewal process. While some who were disenrolled transitioned to other coverage, many who were disenrolled faced challenges navigating appeals and also experienced out of pocket costs or gaps in access to needed care. By December 2023, the federal government had issued additional guidance and sent letters to nine states with the largest amounts of children losing Medicaid urging them to do adopt additional federal strategies to prevent families from losing coverage due to paperwork, or procedural, issues. CMS identified the top five actions states could take to reduce procedural disenrollments: improve auto-renewal (or ex parte) rates, adopt additional unwinding waivers, partner with managed care plans, support coverage transitions, and reduce call center wait times.

To gain a better understanding of what is working well during the unwinding and where there may be  opportunities to improve processes, KFF worked with PerryUndem to conduct detailed interviews with state officials in Arizona, Indiana, and Pennsylvania, as well as with others involved in unwinding including representatives from Medicaid managed care plans, primary care associations (PCAs) representing federally qualified health centers (FQHCs), legal aid and other advocacy organizations, and navigator groups in Arizona, Florida, Indiana, and Pennsylvania. These states were selected because they provided early data, have a large and diverse Medicaid population, and, collectively, are geographically and politically diverse (see the Appendix for more information on key policies and characteristics in the study states).

In addition, as part of our Annual Medicaid Budget Survey for State Fiscal Years 2023 and 2024, KFF worked with Health Management Associates (HMA) to survey Medicaid directors in all 50 states and DC, as well as conduct a follow-up telephone interview, with the goal of identifying and tracking trends in Medicaid spending, enrollment, and policymaking. To address current issues, the survey and phone interview included questions regarding Medicaid unwinding. This report synthesizes themes from these interviews and the survey, examining the perspectives of states and other participants on outreach and engagement, renewal processes during the unwinding period, and coverage transitions. See the methods box at the end of this report for more detail.

This report describes state and other participant experiences with Medicaid unwinding to provide additional context for a range of policy options adopted by states through temporary 1902(e)(14) waivers to address unwinding challenges and unwinding data. These perspectives provide examples of innovation, as well as continued challenges, during the first months of unwinding. These interviews occurred over multiple months. State Medicaid unwinding is a quickly evolving landscape, as new data, greater experience, and CMS guidance influence what is happening in the field.

Outreach and Engagement

Broad Takeaways Across All States

Interviews with states about outreach strategies during the unwinding of the Medicaid continuous enrollment provision revealed that most states have used multiple outreach strategies, with states noting it was difficult to isolate the most effective strategies because they have used a “no stone unturned” approach. In addition to more traditional communication campaigns using mailers, billboards, and print/radio/TV advertising, at least 15 states have used text messaging to conduct outreach. Most states were working with a wide range of groups to reach Medicaid enrollees, including MCOs, providers (like community health centers, other primary care providers, and pharmacies), community-based organizations, navigator/assister organizations, and faith-based groups. To increase the capacity of community partners to assist with outreach, some states provided outreach grants to local organizations.

Some states mentioned focusing particular attention on certain populations. Several states described specific outreach to users of long-term services and supports (LTSS) through outbound calls, in-person assistance, and working with nursing facilities and direct care providers to enable them to assist enrollees with renewals. A few states also mentioned outreach targeting people in rural areas, tribal populations, and non-English speaking populations as well as efforts aimed at certain zip codes. While most state interviews took place over the summer, some states mentioned back-to-school outreach or working directly with children’s groups.

Despite various strategies to increase enrollee response, including by making mail more visible using “urgent” stamps or colored envelopes (e.g., a pink letter campaign in Hawaii and yellow envelopes in Texas), states continue to struggle with enrollee nonresponse. However, a few states noted that as a result of aggressive outreach to update contact information and flexibilities to accept contact information from certain partners, they have experienced reduced rates of returned mail.

Outreach Strategies

Study states are using an array of strategies to reach out to enrollees. States have introduced new methods of communications and greatly increased their enrollee outreach, expanding the number of touchpoints before renewal. All four study states offered publicly available communication toolkits for partner organizations to use, which included printable materials like posters, postcards, and handouts, as well as digital materials for social media, email, or content that can be embedded into websites. Indiana has offered to print and distribute these materials to external groups at no cost. Study states have also used traditional press to raise awareness; in Pennsylvania, for example, participants commended the Secretary of the Department of Human Services for travelling across the state and holding numerous unwinding press conferences to raise awareness at the local level. To increase the reach of messaging, state officials referenced strategies such as translating outreach materials for non-English speakers. Arizona officials noted electronic communication as an effective method to reach transient populations.

Many entities involved with unwinding have been conducting outreach to amplify state efforts. Some MCOs, newly able to provide direct outreach to enrollees as a result of 1902(e)(14) waiver flexibilities adopted in three study states (Florida is the only state that has not adopted any of these waivers), mentioned they would like to see these flexibilities become permanent so they can continue this outreach after the unwinding period ends. Innovative approaches to outreach include virtual renewal training events (an Indiana MCO reported thousands of attendees for such an event) and coordination between MCOs and FQHCs so providers can work with individuals due for renewal. Some participants in Arizona and Florida noted that direct local marketing and word of mouth can be more effective than statewide ads.

Targeted outreach messages and multiple strategies to update contact information have helped to reduce returned mail. State officials reported that supplementing their outreach efforts with information from the National Change of Address (NCOA) database has been effective for automatically updating mailing addresses and targeting outreach. Pennsylvania conducted a call campaign to people identified via the database as having a change of address, while Arizona credits the NCOA database for a precipitous drop in returned mail. State officials and MCO representatives both reported that receiving contact information from MCOs has also been helpful. Arizona, Indiana, and Pennsylvania have obtained 1902(e)(14) waivers to obtain updated contact information from MCOs. In Arizona, an MCO representative reported that they are able to check enrollees’ contact information with the state’s files and, if needed, MCO staff can provide the updated information to the state.

Despite significant outreach, navigators and those providing legal aid noted that some messages have created confusion and not all enrollees were aware that Medicaid disenrollments had resumed. In Pennsylvania, participants provided examples of enrollees not receiving phone calls, text messages, or letters even after updating their contact information, leaving them unaware that they need to be on the lookout for renewal paperwork. Similarly, Florida participants encountered individuals who signed up for electronic notifications and then never received an email. An Indiana participant spoke of the opposite issue, however: enrollees were overwhelmed by the large number of calls they were receiving about renewing their coverage. Florida navigators and advocates commented that unclear messaging and poor translations led to confusion about renewals and coverage status for enrollees.

“But we’re also doing things we’ve never done. The level of outreach, engagement, advertising; you know, we have never sent text messages before, we have never sent these emails before, we haven’t done all of these reminder calls.” – Indiana State Official

“We also have met with our MCOs regularly. We started with a series of webinars and then moved to a work group that they, I think, host a every couple of weeks, so that we can continue to ask questions or answer questions about their outreach and their activity with individuals in regard to the unwinding. We provide them direction on the kinds of messaging that we’d like to see, and they submit their own kind of versions to speak to their members. Whether that be text messages, emails, regular mail, phone call, call scripts, call center scripts everything to us, and we process a review of that.” – Pennsylvania State Official

“When they’re talking with a member they’re verifying the address and the phone number on file. If it is not the correct one that is being fed to us on our eligibility file then there is a way to go in, and they can provide that information so that it gets updated through AHCCCS [the state Medicaid agency].” – Arizona Participant

“They were receiving text messages that put them in a panic that like, ‘wait a minute we’re, we’ve lost coverage?…’ The messaging that was sent [to] our community was poor translations and then also confusing.” – Florida Participant

Stakeholder Coordination

Three of the study states hold regular meetings with groups involved in unwinding to coordinate efforts, and participants value this increased engagement. These states convene regular meetings, which began before the start of the unwinding period, to provide updates on unwinding plans, review the latest unwinding data, and share updated outreach materials and messages. Arizona holds large monthly meetings with about 100 participants as well as smaller meetings to focus on unwinding data that resulted in the state expanding its data reporting and developing a comprehensive unwinding dashboard. In Pennsylvania, the stakeholder meetings include multiple officials from the Department of Human Services, which administers Medicaid, and the state-based Marketplace, known as Pennie, and help to promote interagency coordination as well as coordination with stakeholders. Participants in Arizona, Indiana, and Pennsylvania all described the increased engagement with the state Medicaid agency as a bright spot during the unwinding. Florida was the only study state that did not have regular meetings with external groups involved in unwinding, though some study participants reported meeting with state officials individually. In lieu of meetings with the state, participants said they coordinated with each other to share information and experiences.

Feedback loops have helped states identify problems early in the unwinding process. Participants  noted that regular meetings provide a forum for sharing on-the-ground experiences and alerting states to problems people are encountering with the renewal process. State officials said getting input about potential problems enables them to assess the situation and determine whether changes to processes or policies are needed. While participants agreed that states did not address all issues or did not respond as quickly as they wanted in all cases, the willingness of states to communicate about issues and engage over possible solutions helped build trust in the process.

Where there has been limited state engagement and communication, there are more reports of problems with the unwinding process and frustration among others working on unwinding. While participants in Florida indicated they were able to work individually with staff involved in the unwinding to resolve problems with specific cases, they said it has been harder to address issues like long call center wait times and problems with notices at a more systemic level. The reported lack of communication from the state has created a more adversarial situation, leading to a civil rights complaint and a lawsuit. Florida participants also described using press conferences and media calls to raise awareness broadly and for the state without direct access to a state meeting.

“We conduct a routine meeting every month… It’s nonprofit providers groups there, it’s legal services, attorneys there, it’s a healthcare advocates there, and they come to us with many questions about how the process is going and what our policies look like. We do our best to answer them, provide them information, hear what they have to say about our approach and make changes when we feel it’s necessary to do so.” – Pennsylvania State Official

“In Indiana our Medicaid Department is called FSSA, and FSSA has been incredibly transparent in what their plan was and the processes and the waivers that they were going to be applying for.…I also think that FSSA’s willingness to accept criticism and to listen to Hoosiers and stakeholders that, you know, you’re thinking about this process, it’s not working.” – Indiana Participant

Renewal Processes During the Unwinding

Broad Takeaways Across All StatesAll states cited the volume of renewals, systems issues, and staffing shortages as the most significant challenges during the Medicaid unwinding period. At least 11 states reported that their systems were old or difficult to use. A few states noted that it has been difficult to implement systems changes on “clunky” old systems and that the systems were not set up to produce real-time analytics to help inform unwinding efforts. In many states, the system issues exacerbated staffing shortages that states said negatively impacted the processing of renewals. Several mentioned that their staff was not experienced enough to handle the large workload, mostly due to high turnover among eligibility workers. One state cited a 20% staff vacancy rate, and another state pointed to low morale and burn-out among staff.

Most states mentioned they were taking steps to increase ex parte, or automated, renewals to reduce the burden on eligibility staff and enrollees; however, going into unwinding, there was variation across states in their ability to conduct ex parte reviews. In particular, some states that were previously unable to conduct ex parte renewals for non-MAGI populations (those who qualify on the basis of disability or being over age 65) reported newly adding ex parte reviews for some or all non-MAGI groups. As of January 2024, states have adopted a range of 1902(e)(14) waivers and other flexibilities to increase ex parte rates and streamline renewals. When asked about the most helpful flexibilities, states most often pointed to those allowing use of Supplemental Nutrition Access Program (SNAP) data to renew Medicaid, streamlining renewals for those with zero and low income, and waiving the asset limit test.

A few states specifically noted challenges with call centers and reported actions to enhance call center operations. For example, Arkansas upgraded call centers to better track metrics and to reduce call wait times. Virginia is using outbound calls to assist seniors and people with disabilities, and after seeing fewer online renewals than expected, the state began redirecting calls from county offices to the statewide call center to help reduce the burden on local agencies.

Eligibility Systems

While eligibility and renewal systems are generally working well in Arizona and Indiana, Pennsylvania is hampered by an outdated system that requires manual workarounds to comply with federal requirements. Arizona has prioritized automated eligibility processes for many years to help balance efficiency, cost effectiveness, and accountability. Officials noted that the state has added data sources and refined business rules for checking eligibility, which have increased ex parte rates and reduced demands on staff. Pennsylvania’s system, however, cannot conduct ex parte renewals for people enrolled in Medicaid and another program, such as SNAP or Temporary Assistance for Needy Families (TANF), or for non-MAGI enrollees. To address this limitation, the state implemented a mitigation plan requiring manual ex parte reviews before terminating coverage during the unwinding.

Respondents reported both benefits and drawbacks to having Medicaid eligibility systems that are integrated with other benefit programs. Integrated eligibility systems allow people to apply for and renew coverage for multiple benefit programs at once, and all four study states have Medicaid eligibility systems that are integrated with CHIP and social benefit programs like SNAP and TANF. Officials in Arizona and Indiana reported that data sharing across programs has helped improve ex parte renewal rates and simplify renewal processes. However, some Florida participants expressed concern that information provided during SNAP renewals, which occur more frequently than Medicaid renewals, can trigger a Medicaid review and potentially lead to people being disenrolled from Medicaid. State officials also reported that it can be more challenging to make changes to integrated systems because of the need to reconcile complex eligibility rules across programs.

Even where systems are working well, the volume of renewals poses challenges, and most system changes can take time to implement. State officials reported challenges “turning on” normal eligibility functions after three years of continuous enrollment, especially after states implemented changes to their systems during the pandemic that needed to be undone. In Arizona, officials noted that they are continually making changes to their systems, but at the start of the unwinding, the number of needed changes meant they could not test everything before going into production. Officials in Arizona and Indiana discussed having procedures for identifying problems and working closely with their vendors to fix things as they come up. However, because some systems changes can take longer to implement, states reported having to adopt manual workarounds for certain groups while developing more permanent changes.

“We have a weekly system ticket triage where we have policy operations and systems folks from both our vendor and internally, that are looking at ticket issues that are coming up. And we have definitely identified some…We are continually making changes…In the middle of everything else we implemented our 12-month postpartum. We are working on continuous eligibility…We’re trying to do everything at once, and sometimes the testing just can’t catch it all.” – Arizona State Official

Staffing

Respondents cited staffing shortages as an ongoing challenge contributing to slower processing of renewals and backlogs. Indiana officials noted that inexperienced eligibility staff coupled with staffing shortages led to renewal backlogs early in the unwinding, although the number of pending cases at the end of the month has since improved. Some respondents also noted that staffing shortages disproportionately affect certain communities. For example, Pennsylvania officials found that staffing shortages are more concentrated in urban areas where there is greater competition for workers. In Florida, participants echoed reports that staff shortages at call centers have led to longer wait times for Spanish-speakers compared to English-speakers.

Study participants noted that new and inadequately trained staff may be contributing to disenrollments of people who are still eligible. Federal guidance requires states to assess eligibility for all Medicaid pathways before disenrolling someone from coverage. However, according to participants, inexperienced staff may not be doing this full assessment before sending a termination notice. Participants in Pennsylvania noted this problem in counties with high turnover among eligibility workers and began adding information on additional eligibility pathways to paperwork they help people submit. Arizona officials acknowledged that training issues combined with the high volume of renewals each month increased the likelihood that staff would make mistakes or “cut corners” that could lead to incorrect eligibility determinations. They have sought to address this issue by providing additional training.

“We did have some backlog initially, due to we had a lot of new staff or existing staff that hadn’t done this in many years, and then just the people who are not used to doing renewals and so they have a lot of questions, and they want to reach out, which is absolutely what we want them to do. But we’ve made progress in reducing the number of renewals that are not yet completed at the end of the month… We’re definitely monitoring it, but we are seeing a trend in a good direction.” – Indiana State Official

“There’s been some good work on just trying to think through the processes and the impact on the staff. At the same time, I think staff are frustrated, overwhelmed and, you know there’s a lot of new staff who really don’t know the rules or the system very well. So, they’re the ones who are going to miss anything that requires manual review, that’s how things can go wrong.” – Pennsylvania Participant

Streamlining Renewals

States have taken steps to streamline the renewal process and increase their ex parte renewal processes. Arizona and Indiana opted to align renewal dates for all household members to reduce the number of times a family must respond to a renewal request. Three of the study states have also adopted temporary federal flexibilities using 1902(e)(14) waivers to improve ex parte rates, especially for cases where no income or assets are returned from state databases (Table 1). Study states have also taken steps outside of the federal flexibilities to improve ex parte rates. For example, Indiana added the Asset Verification System in 2020, improving the state’s ability to conduct ex parte renewal for non-MAGI enrollees, which, as noted above, is a challenge in many states.

Approved 1902(e)(14) Waivers to Increase Ex Parte Renewal Rates

Most study state officials noted that federal flexibilities related to verifying income and assets have been particularly helpful for increasing ex parte rates. When asked which federal strategies they would like to see made permanent, Arizona and Indiana officials cited the zero- and low-income strategies. These waivers allow states to complete ex parte renewals in cases where no income data are returned from state databases if the state had verified or accepted an attestation of no income or income below 100% of the federal poverty level (FPL) in the past 12 months. Indiana officials said that unemployed people can have trouble producing documentation of zero income. Arizona officials also found that the zero- and low-income strategies are generally low-risk for erroneously renewing coverage for someone who is over-income. Officials argued that it is unusual for someone’s previously verified income to increase a large amount without that person’s higher income appearing in state databases.

While all respondents expressed concern over procedural disenrollment rates, state officials noted that strategies to increase ex parte renewals have helped to lower those rates. Notably, in guidance released in December 2023, federal officials pointed to analysis showing that increasing ex parte rates is the most effect strategy to reducing procedural disenrollments. Procedural disenrollments occur when there is no definitive determination of ineligibility, and high procedural disenrollment rates could mean that some people losing Medicaid may still be eligible. While disenrollment rates across study states are similar, there is greater variation in procedural disenrollment rates; procedural disenrollments as a share of completed redeterminations range from 28% in Indiana to 15% in Arizona (Table 2). In Arizona and Indiana, officials prioritized automated processes as a way to reduce the number of people needing to complete paperwork who could potentially lose coverage for procedural reasons. Similarly, Pennsylvania officials found that the manual ex parte process they have put in place is effective at reducing procedural disenrollments because eligibility workers look at every case before terminating coverage. Notably, Pennsylvania is one of 29 states (but the only study state) that had been conducting ex parte renewals at the household level, rather than the individual level, contributing to some inappropriate procedural terminations (as of December 2023, Pennsylvania has nearly completed reinstatements for affected enrollees). State officials also credited increased outreach efforts as a major factor in reducing procedural terminations.

Cumulative Renewal Outcomes Among Study States

In response to questions about procedural disenrollments, Arizona and Indiana are reporting additional data on the reason for procedural disenrollments on their unwinding dashboards. For example, Arizona added data to their state dashboard showing that roughly three-quarters of procedural terminations were among people who the state had identified as over-income or aging out of coverage. Indiana began adding footnotes to their monthly Centers for Medicare and Medicaid Services (CMS) unwinding reports showing about one-third of procedural terminations also had “a non-procedural” reason for termination (e.g., over the income or asset limit, moving out of state, or death). The differences in the share of people with a non-procedural reason for closure may be partially explained by different data matching procedures in each state. Study participants in both states have also requested data on procedural terminations by zip code, which they believe will help more effectively target outreach. In response, Arizona recently published an interactive map showing zip codes at “low” or “high” risk of disenrollment, but could not provide exact counts out of privacy concerns.

“I think that the zero-income strategy is really helpful. We are working on the SNAP/TANF strategy, so that is number one…I think that all of the ones that we’ve adopted, if CMS were to say these are available permanently now, we would definitely look into, do we want to keep them? They were things that are helpful and common sense.” – Indiana State Official

Enrollee Communication and Notices

All four study states have increased the number of communication touch points when enrollees cannot be renewed via ex parte processes, including sending multiple reminder notices through the mail, email, and text. Pennsylvania, for example, went from just sending a mailer 90 days ahead of renewal to adding 11 “touches,” which include reaching out 90, 60, 30, and five days before a renewal is due. Study participants noted that enrollees who enrolled in Medicaid for the first time during continuous enrollment needed additional reminders and education about completing Medicaid renewals. In Indiana, one participant said that they have begun a consumer campaign focused on encouraging individuals to open letters from the state after hearing from multiple people that they were ignoring incoming letters because they incorrectly assumed no action was needed.

Study participants in all four states reported that Medicaid renewal and termination notices can be difficult to understand and, in some cases, provide misleading or incorrect information. While participants noted myriad issues with notices, Florida advocates were the most critical of the state’s notices. In Florida, advocates have filed a lawsuit over notices, contending that termination notices are confusing, fail to explain why individuals lost Medicaid coverage, and sometimes include incorrect information. Florida participants also described situations where enrollees were requested to provide information or documentation that is not necessary for renewal and noted that it is often unclear which individuals have been denied coverage within a household. Arizona and Pennsylvania participants observed that, for some enrollees, the notices are not clear on what actions or documents are needed for renewal. Other areas of concern include poor translations and notices not being translated into requested languages. An Indiana participant said the notices informing parents that their child has been transitioned to CHIP coverage were confusing because families receive one notice about disenrollment from Medicaid and separate notice indicating enrollment in CHIP. Across multiple study states, participants also said that termination notices included language discouraging people from requesting continued benefits while they appeal their coverage denial.

Some states have made changes to fix incorrect information or to provide additional clarifying information in notices. While changing Medicaid notice language can be a lengthy process, participants reported situations in which states corrected notice language or adopted creative workarounds to improve information shared with enrollees. In Arizona, participants noted that early in the unwinding termination notices included incorrect information about maintaining coverage during an appeal; the state has since corrected the language. In Indiana, at the request of participants, the state added brightly colored inserts to notices that include additional clarifying information.

“Sometimes it’ll come back and say all of the individuals were denied for coverage, right? …And then the next page, this person approved and enrolled. And it’s like; are they all denied, are they enrolled?… Do I have coverage, do I not?” – Florida Participant

Assisting Enrollees with Renewals and Appeals

Participants involved in unwinding reported challenges getting through to call centers when enrollees needed assistance with their renewals, with some enrollees never receiving needed help. According to participants, call center wait times can be lengthy and it can be challenging to be connected to a staffer able to answer questions, especially for complicated cases. One Florida participant said some people will carry their phone on speaker phone for hours waiting to get through to the Florida Department of Children and Families (DCF) and sometimes calls can be disconnected. A Pennsylvania participant also noted long call center wait times for some enrollees. An Indiana participant observed the quality of call center assistance can vary, with some newer employees less able to resolve enrollees’ issues.

Non-English language speakers have experienced more difficulty with call centers. An Arizona advocate observed that individuals with limited English proficiency faced longer wait times and could sometimes have their calls dropped. In Florida, participants noted that while an English speaker may wait 30-45 minutes, a Spanish speaker could end up waiting hours. In Pennsylvania, a participant similarly reported that requesting a language other than English can lead to longer wait times, and occasionally if Spanish interpreter lines are busy, people will be rolled over to the English lines. In Indiana, one navigator noted that some call center staff will not allow bilingual navigators to join calls or speak on behalf of their client, requiring that a call center interpreter be used instead which can create additional confusion.

Some participants in the study states noted challenges with timeframes for responding to renewal notices. Some study state participants noted that the timeframes to respond to a renewal notice or to find other coverage after receiving a termination notice are too short. Florida advocates wanted the state to consider adopting flexibilities offered by CMS to extend the timeframe for renewals to help address this issue. Participants in Pennsylvania also noted that the window to return renewal packets is short and results in difficulty submitting documents by the deadline, especially if there are mail delays.

In Arizona and Indiana, MCOs are able to help their members complete renewals and contract with outside vendors or navigator to provide that assistance. Generally, MCOs are prohibited from assisting enrollees with completing renewals; however, during the unwinding, Arizona and Indiana obtained 1902(e)(14) waivers that allow MCOs to help their members complete renewals. MCO respondents in both states said they are working with vendors because of the scale of the task and compliance concerns. In Arizona, an MCO participant spoke of how they have been able to pass on lists from the state of enrollees coming due for renewal to a vendor to do targeted outreach and education. This vendor collects information over the phone for members, helps gather supporting documents, and submits the renewal on their behalf. In Indiana, one MCO participant also used a vendor to set up an in-house call center for member renewal questions.

“The renewal notices, there is a very short window for them to be returned, and folks who are getting those notices sometimes are not getting them until after the deadline, or after the date that it’s supposed to come back. So, depending on the mail system and depending on when it was date-stamped as to the Department of Human Services, the stamp put on it, and it actually being put in the mail, there’s a little lag time in there we’re starting to see. So, that response time is shortened and then that backs up the entire process.” – Pennsylvania Participant

Coverage Transitions

Broad Takeaways Across All States

At the time of our interviews, it was still relatively early in the unwinding process and most states said data on coverage transitions were limited. States specifically mentioned the lack of information on people reenrolling in Medicaid after being disenrolled, also known as churn, as a factor contributing to uncertainly about overall net Medicaid enrollment projections for the fiscal year. Among the few states able to track reenrollment in Medicaid, churn rates of people reenrolling within a short period varied from about 25% to 40%. The ability of states to track transitions to the Marketplace varied by Marketplace type—all interviewed states operating a state-based Marketplace reported some ability to track information on enrollment in Marketplace plans while states that rely on the federally-facilitated Marketplace were waiting on the release of federal data. Fewer states were able to track transitions to private coverage and did so through indirect means, including surveys and information from MCOs.

‘Churning’ Back on to Medicaid

State officials and other study participants acknowledge that some individuals who are disenrolled from Medicaid for procedural reasons reenroll after a short period. At the time of the interviews, state officials explained they were just getting data on churn among those who were disenrolled for procedural reasons and had not had time to analyze the data. Both Arizona and Pennsylvania are now reporting data on the number of people reenrolling in Medicaid. Pennsylvania state officials mentioned they are considering working with a vendor to identify and follow up with individuals procedurally disenrolled who may still be eligible. Other participants also spoke about their experiences with enrollee churn. An Arizona participant noted that nearly half of individuals who re-apply during the reconsideration period are renewed, indicating that eligible individuals are being dropped and losing coverage. An MCO in Indiana said that the initial files shared by the state made it difficult to analyze churn, though the MCO is currently assessing improved data elements from the state. Study states have also implemented new communication methods to target people who are procedurally disenrolled. Both Arizona and Pennsylvania send letters following disenrollment to let people know they still have time to renew coverage.

Study participants reported that losing Medicaid despite being eligible creates confusion and distrust in the community, leading some people to choose not to reapply. Navigators and advocates described how being dropped from Medicaid, particularly because the state did not process their paperwork before the due date, causes some enrollees to lose trust in the ability of navigators and other to provide needed help and in the program overall. That frustration can lead them to give up on the process and not work to complete a renewal or reapply, if needed. Indiana community outreach groups, including chaplaincy programs, are working on rebuilding trust in the community to assist in getting people reenrolled.

“When people are contacting [AHCCCS], over 50% of them that have been terminated procedurally, are being reinstated. So to us this is concerning because it’s indicative of a potentially high rate of erroneous terminations that are happening.” – Arizona Participant

“What’s happening is when there are barriers, people just give up. There is like, ‘whatever, I just pray I don’t get sick, or I’ll go to the emergency room for care, or I’ll continue to go to my community health center where they’re gonna charge me based on the sliding fee.’  Then, they don’t sign up for Medicaid anymore, whether they qualify or they don’t.” – Pennsylvania Participant

Transitions to CHIP and the Marketplace

Arizona and Indiana auto-enroll eligible children into CHIP ensuring a seamless coverage transition, but other study participants reported gaps in coverage for some children transitioning to CHIP in Florida and Pennsylvania. When children in Arizona and Indiana are found to be ineligible for Medicaid, the states automatically enroll them in CHIP, if eligible, without any action required from the family. Though, as noted above, participants in Indiana said unclear notices about the transition created confusion for some families. Pennsylvania recently integrated CHIP into their Medicaid eligibility system, a project that had been planned for years, but coincided with the start of the unwinding period. Study participants reported that there were challenges with the rollout and system glitches have led to some children losing coverage. In Florida, participants noted that children no longer eligible for Medicaid have their information automatically transferred to CHIP; however, slow processing times lead to gaps in coverage for some children. A December 2023 letter from federal officials to Florida’s governor raised concerns about child disenrollments and encouraged the state to adopt additional strategies to reduce child disenrollments, such as utilizing more federal flexibilities as well as eliminating CHIP premiums and lockout periods, which help with transitions from Medicaid to CHIP.

Although many people who are no longer eligible for Medicaid qualify for subsidized Marketplace coverage, study participants said affordability remains a barrier to enrollment. Respondents generally said that account transfers to the Marketplace were happening as expected; however, the number of people disenrolled from Medicaid who enroll in Marketplace coverage remains low in all study states. Even with heavily subsidized premiums and cost-sharing for the lowest-income enrollees, participants said that for some people, the deductibles and cost sharing are too high. They also pointed out that not everyone is aware of Marketplace coverage as an option and that educating people about premiums, cost-sharing, benefits, and the Marketplace generally is an ongoing need. Awareness of the Marketplace is low in Pennsylvania, which launched its State-Based Marketplace, Pennie, during the pandemic. Pennsylvania’s statewide press campaign has been held jointly between the Department of Human Services and Pennie to increase awareness.

Navigators in states using the Federally-facilitated Marketplace (FFM) described problems with the quality of the contact information they receive through the Medicaid Assister Community (MAC) program. The purpose of the MAC is to provide navigators with lists of people disenrolled from Medicaid whom navigators are expected to contact with information about applying for Marketplace coverage. However, navigators participating in the program in the three study states using the FFM (Arizona, Florida, and Indiana) identified common challenges. They reported outdated or missing contact information, and some data erroneously included minors (who navigators cannot contact) and people who still qualified for Medicaid. The volume of people to contact overwhelmed navigators, with one organization reporting having to contact thousands of consumers each week; however, bad data meant the number of people who enroll in the Marketplace is low.

“I think cost is a barrier. I think that is the problem because the premiums have consistently gone up over the last six to seven years…. It’s a bit of a sticker shock when you go from state insurance to over to the Federal Exchange or even to your employer. Sometimes your employer coverage can be more than Marketplace.” – Indiana Participant

Looking Ahead

At the beginning of 2024, nine months into the unwinding process, states have completed renewals for less than half of all enrollees. While many who are disenrolled may “churn” back to Medicaid or transition to other coverage, many will likely become uninsured. People who are uninsured face more barriers to care, go without needed care and also may experience higher out of pocket costs and medical debt.

Data are important to help monitor how unwinding is going across states, but trackers and dashboards only tell part of the unwinding story. Medicaid eligibility is complex, and outcomes are the result of federal and state policy decisions but also the result of how those policies are implemented and how well eligibility and other systems work. Gaining perspectives from state officials, others involved with unwinding and enrollees provides valuable insights into what is working well and where there are challenges and room for improvement to efficiently identify those who are no longer eligible and help those who are eligible maintain coverage.

With more than half of renewals still to be completed, there is time to learn from experience. Key themes from the interviews include:

  • Efforts to enhance outreach and stakeholder engagement such as:
    • Supplementing broad outreach strategies aimed at raising awareness with targeted messaging that is directed at certain populations who are at greater risk of not completing their renewals may help increase renewal response rates;
    • Use of the NCOA database and partnering with MCOs can help to reduce returned mail;
    • Collaborating with stakeholders to reach enrollees and also to establish feedback loops can help to continue to identify problems even as initial issues are addressed;
  • Efforts to improve renewal processes that include:
    • Adopting federal flexibilities to streamline renewals and increase ex parte rates can simultaneously help to reduce the burden on overloaded staff and reduce procedural disenrollments among those who remain eligible;
    • Improving communication with enrollees, including notices and call center access, can reduce enrollee confusion and increase the likelihood that individuals are able to resolve problems;
  • Efforts to smooth transitions to other coverage such as:
    • Auto enrollment of eligible children into CHIP can support seamless coverage transitions and reduce the number of children experiencing a gap in coverage; and
    • Greater coordination with the Marketplace can increase awareness of that coverage option and improvements to the MAC program, particularly enhancement of data quality, could lead to a greater number of people transitioning from Medicaid to Marketplace coverage.

States will continue the process of unwinding continuous enrollment through much of 2024. Any steps they take in the near term to improve systems and processes to help people who are still eligible maintain Medicaid and those who are no longer eligible transition to other coverage can reduce the number of people who become uninsured. Looking ahead, lessons learned from this experience can be used to inform policy changes and direct resources to more successful outreach and other strategies for reaching and communicating with enrollees and to make longer-term improvements to Medicaid renewal processes.

Methods

A total of 15 interviews were conducted, including one written response, in the four study states between August and November: three with state officials (we did not talk with state officials in Florida), two with managed care organization (MCO) representatives, three with legal aid organizations, and six with state navigators/assisters and primary care associations (PCAs) representing federally qualified health centers (FQHCs) (some PCA organizations also act as navigators and assisters). PerryUndem assisted with the logistics and facilitating interviews. The Medicaid budget survey, conducted by KFF and HMA, was sent to state Medicaid directors in June 2023. Forty-four states participated in a follow-up telephone interview, conducted between July and September 2023. (Florida, Minnesota, and South Carolina did not respond to the 2023 survey or telephone interview, and Alabama, New Hampshire, New Jersey, and Washington did not participate in the follow-up telephone interview.)

Appendix

The appendix tables below summarize some of the key criteria used in selecting study states.

Selected Characteristics of Study States
Medicaid/CHIP Enrollment for Study States, Selected Months
News Release

Most Nonprofit Hospitals and Health Systems Had “Strong” Days of Cash on Hand in 2022, Though About One-in-10 Were “Vulnerable”

Hospitals’ Average Days of Cash on Hand Are at Pre-Pandemic Levels, Down from Recent Peak

Published: Jan 9, 2024

Most nonprofit hospitals and hospital systems had enough cash on hand in 2022 to cover operating expenses for an extended period of time, though about one-in-10 had relatively low levels to cover their expenses, which potentially could leave them vulnerable in a financial crisis, a new KFF analysis finds.The analysis comes as the hospital industry pushes for increases in Medicare and Medicaid reimbursement levels and Congress considers legislation that would reduce hospital revenues, such as through site-neutral payment reform. It looks at “days cash on hand” at 274 nonprofit hospitals and health systems rated by S&P Global, which are estimated to collectively account for more than half of all nonprofit hospitals and about two thirds of nonprofit beds. The measure is one of several that S&P Global uses to assess hospitals’ financial health and determine their credit rating. Those with more days of cash on hand are better able to weather financial challenges, such as low operating margins.

The analysis finds:

  • Nearly three-quarters (73%) of nonprofit hospitals and health systems analyzed had at least “strong” levels of cash on hand based on the S&P’s standard definitions – enough to cover at least 150 days of expenses for health systems or 160 days of expenses for stand-alone hospitals.
  • An additional one-in-six (18%) had “adequate” levels of cash on hand – enough to cover 100-150 days for hospital systems or 110-160 days for stand-alone hospitals.
  • About one-in-10 (9%) analyzed hospitals and health systems had fewer days of available cash on hand, which the ratings agency considers “vulnerable” or “highly vulnerable.” 
  • The total share of non-profit hospitals and health systems with “vulnerable” or “highly vulnerable” levels of days cash on hand may be larger, since the as the S&P data analyzed underrepresents groups that are more likely to face financial challenges, such as small and rural hospitals.
  • Across all analyzed hospitals and hospital systems, the average levels of days cash on hand stood at 218 days in 2022, similar to the levels in 2019 but down from a recent peak during the early years of the COVID-19 pandemic.

TheMost Nonprofit Hospitals and Health Systems Analyzed Had “Adequate” or “Strong” Days of Cash on Hand in 2022, Though About One in Ten Did Not is available as part of KFF’s expanding work examining the business practices of hospitals and other providers, and their impact on costs and affordability.

Most Nonprofit Hospitals and Health Systems Analyzed Had “Adequate” or “Strong” Days of Cash on Hand in 2022, Though About One in Ten Did Not

Published: Jan 9, 2024

Introduction

Policymakers, employers, insurers and others have expressed concern about the cost of hospital care in the United States, which totaled $1.4 trillion in 2022, contributing to higher health insurance premiums; lower wages for workers; and greater out-of-pocket spending, medical debt, and barriers to care for patients. At the same time, hospital industry representatives and others have pointed to recent financial challenges facing the sector and have pushed for increases in Medicare and Medicaid reimbursement levels and lobbied against legislation that would reduce hospital revenues, such as through site-neutral payment reform. Operating margins decreased by a large amount between 2021 and 2022. Industry reports suggest that operating margins have improved in 2023 but tend to remain below pre-pandemic levels.

However, operating margins capture only one component of the financial health of hospitals and health systems. This data note examines “days cash on hand”—another measure of financial standing that estimates the number of days that an entity could cover their cash expenses using available reserves.  Hospitals and health systems with more days of cash on hand are better able to weather financial challenges, such as low operating margins. This analysis includes nonprofit hospitals and health systems from 2019 through 2022 based on data from S&P Global, a credit rating agency. The S&P data in this analysis include an estimated 56 percent of all nonprofit hospitals and 65 percent of all nonprofit hospital beds but underrepresent entities that are likely to be more financially vulnerable, such as relatively small hospitals, rural hospitals, and hospitals with relatively low commercial prices. See Methods for more details. Highlights include the following:

  • In 2022, most nonprofit hospitals and health systems analyzed (73%) had at least “strong” days of cash on hand, though about one in ten (9%) had “vulnerable” or “highly vulnerable” levels. This is based on S&P’s standard categories for days cash on hand, which it uses along with other financial measures, such as operating margins and debt burden, to assign credit ratings to nonprofit hospitals and health systems.
  • The majority of nonprofit hospitals and health systems with negative margins in this analysis (60%) had at least “strong” days cash on hand. As might be expected, most nonprofit hospitals and health systems with “vulnerable” or “highly vulnerable” days cash on hand in this analysis (81%) had negative operating margins.
  • The average days of cash on hand among nonprofit hospitals and health systems analyzed was similar in 2022 (218 days) to pre-pandemic levels (225 days in 2019).
  • The financial reserves (unrestricted cash and investments) of nonprofit hospitals and health systems analyzed increased early in the pandemic before falling in 2022; the latter trend coincided with decreases in the value of stocks and other investments that have likely stabilized or increased with 2023 market improvements.

Discussions about hospitals’ financial challenges often focus on operating margins, though days of cash on hand provide different and complementary information about the financial standing of hospitals and health systems. Operating margins provide useful information about the short-term financial standing of a given hospital or health system, i.e., the extent to which they are earning a profit on patient care and other operating activities. However, two entities with the same operating margins in a given year may be in a much different financial position depending, for example, on their days of cash on hand. Hospitals and health systems with more days of cash on hand are better able to weather financial challenges, such as low operating margins for a period of time. This may be especially salient in the aftermath of the pandemic. Hospitals and health systems with more days of cash on hand also have access to more resources internally that can be used to invest in operations, and they may be able to qualify for lower interest rates when borrowing money, all else equal, both of which may facilitate their growth and competitiveness over the long term. Although having a high level of days cash on hand points to one source of financial strength, it is possible that a given hospital or health system may also have challenges that are captured by other metrics, such as low operating margins or a high debt burden.

Results

In 2022, most nonprofit hospitals and health systems analyzed (73%) had at least "strong" levels of days cash on hand, though about one in ten (9%) had "vulnerable" or "highly vulnerable" levels.

In 2022, most nonprofit hospitals and health systems analyzed (73%) had at least “strong” levels of days cash on hand, though about one in ten (9%) had “vulnerable” or “highly vulnerable” (less than “adequate”) levels. Days of cash on hand is defined as financial reserves (unrestricted cash and investments) divided by daily cash expenses. Categories of this measure (e.g., “strong”) are based on S&P’s standard rubric for evaluating days cash on hand, which it uses along with other financial measures to assign credit ratings to nonprofit hospitals and health systems. Credit ratings indicate the likelihood that entities will be able to repay their long-term debt. S&P’s categories correspond to a range of days cash on hand. For example, “strong” levels correspond to 150-200 days for systems (160-205 days for stand-alone hospitals) and “adequate” levels correspond to 100-150 days for systems (110-160 days for stand-alone hospitals) (See Methods for the complete list). S&P may adjust these categories based on other available information, such as reports that a system is planning to spend some of its reserves on upcoming infrastructure projects.

The total share of nonprofit hospitals and health systems that are “vulnerable or highly vulnerable” in the US is likely to be larger than this estimate derived from S&P data because certain types of hospitals that are more likely to have financial challenges are underrepresented, such as small hospitals, rural hospitals, and hospitals with relatively low commercial prices (see Methods for details about the sample).

The majority of nonprofit hospitals and health systems with negative operating margins in this analysis had at least “strong” levels of days cash on hand in 2022, though, as might be expected, having fewer days of cash on hand among nonprofit hospitals and health systems was associated with negative operating margins in 2022. Sixty percent of the nonprofit hospitals and health systems with negative operating margins in this analysis had at least “strong” levels of days cash on hand in 2022. Hospitals and health systems with more days of cash on hand are better able to weather operating losses, all else equal. Nonetheless, about four out of five (81%) nonprofit hospitals and health systems in this analysis with “vulnerable” or “highly vulnerable” days of cash on hand had negative operating margins in 2022.

Average days of cash on hand among nonprofit hospitals and health systems analyzed was similar in 2022 to pre-pandemic levels.

Average days of cash on hand among nonprofit hospitals and health systems analyzed was similar in 2022 to pre-pandemic levels. The nonprofit hospitals and health systems in this analysis had an average of 225 days of cash on hand in 2019 and nearly the same number, 218 days of cash on hand, in 2022, when weighting entities by their daily cash expenses. In the years between, average days cash on hand increased (from 225 days in 2019 to 267 days 2021) before decreasing to an amount close to pre-pandemic levels. To put this in context, S&P generally considers 218 days to be a “very strong” level of days cash on hand. As noted above, it is likely that this analysis excludes nonprofit hospitals and health systems with relatively few days of cash on hand on average, though the hospitals in this analysis encompass a large portion of the nonprofit sector, including an estimated 56 percent of nonprofit hospitals and 65 percent of nonprofit hospital beds.

Financial reserves and daily cash expenses among nonprofit hospitals and health systems analyzed increased by a similar rate from 2019 to 2022. Financial reserves are defined to include all cash and investments (such as stocks) that are “unrestricted” (i.e., available for any purpose), while daily cash expenses reflect annual operating expenses minus non-cash expenses (i.e. depreciation and amortization), divided by 365 (see Methods for more on definitions). From 2019 to 2022, total financial reserves and daily cash expenses among nonprofit hospitals and health systems grew by a similar rate: 23% and 27%, respectively (data not shown). Daily cash expenses increased throughout this period likely due in part to increases in labor costs and increases in the cost of medical and other supplies as a result of high inflation rates. Financial reserves increased at a faster rate than expenses in 2020 and 2021 before dropping in 2022. Financial reserves may grow due to many factors, including profits from patient care and other operating activities, income from investments (such as stock dividends), increases in the market value of investments, profits from the sale of investments, income from selling off nonfinancial assets (such as property or joint venture businesses), and new loans (to the extent that they exceed the amount repaid on existing loans). Financial reserves may decrease for similar but opposite reasons and other factors, such as spending on new buildings, medical equipment, and information systems. Growth in the size of hospitals and health systems through mergers and acquisitions could also contribute to increases in both financial reserves and daily cash expenses over time.

Financial reserves for nonprofit hospitals and health systems analyzed fell with the value of stocks and other investments in 2022 that have likely stabilized or increased with 2023 market improvements.

Financial reserves for nonprofit hospitals and health systems analyzed fell with the value of stocks and other investments in 2022 that have likely stabilized or increased with 2023 market improvements. Financial reserves fell by $64 billion in 2022 among the nonprofit hospitals and health systems in this analysis while the market value of their stocks and other financial investments decreased by $70 billion. If stocks and other financial investments had instead retained their value in 2022, then financial reserves would have increased by $6 billion rather than decreasing by $64 billion among the nonprofit hospitals and health systems in this analysis (and average days of cash on hand would have fallen by 22 days rather than 49 days in that year).

The value of financial investments among nonprofit hospitals and health systems have likely stabilized or increased with 2023 market improvements. For example, the S&P 500 increased by 24 percent in calendar year 2023 after decreasing by 20 percent in calendar year 2022. Nonetheless, data are not yet available to provide a full picture of how nonprofit hospital and health system stock portfolios and other investments have performed in 2023.

While financial reserves decreased in 2022, they increased by a larger amount earlier in the pandemic, leading to an overall increase from $446 billion in 2019 to $548 billion in 2022 among the nonprofit hospitals and health systems in this analysis, a $102 billion change. Hospitals and health systems received large amounts of government relief during the COVID-19 pandemic that may have contributed to this increase in financial reserves. Had hospitals not received pandemic relief dollars, operating losses, as applicable, would need to have been covered with existing financial reserves or cash obtained through other means (such as by taking out new loans or selling assets, like property). Pandemic relief dollars and other one-time sources of operating revenue, together known as “nonrecurring operating revenues”, totaled $52 billion from 2019 through 2022 among the nonprofit hospitals and health systems in this analysis, most of which, $29 billion, was received in 2020. It is likely that pandemic relief dollars made up the large majority of these nonrecurring operating revenues, as totals jumped from $13 million in 2019 to $29 billion in 2020 (i.e., the beginning of the pandemic) among the nonprofit hospitals and health systems in this analysis (before falling to $14 billion in 2021 and $8 billion in 2022).

Discussion

Many nonprofit hospitals and health systems had at least “strong” levels of days cash on hand in 2022, and averages among a large number of nonprofit entities were similar in 2022 to pre-pandemic levels. This result adds some nuance to recent stories about the financial challenges facing hospitals and health systems, which have informed policy debates about government reimbursement and funding for these entities. Although operating margins dropped by a large amount in 2022—likely due to the erosion of pandemic relief funds, costs associated with labor shortages, and increased supply expenses due to high inflation rates, among other factors—many nonprofit hospitals and health systems had a large financial cushion as of 2022 to help weather these challenges. Reports suggest that operating margins have improved in 2023—perhaps due to decreases in labor expenses and increases in volume and reimbursement rates, among other factors—but that they tend to remain below pre-pandemic levels. As hospitals continue to adjust to these financial challenges, those with more days of cash on hand will be better positioned to absorb operating losses, all else equal.

About ten percent of nonprofit hospitals and health systems in this analysis had “vulnerable” or “highly vulnerable” levels of days cash on hand in 2022, and it is likely that the percent would be higher if the analysis included all nonprofit hospitals and health systems in the US. While this analysis includes more than half of all nonprofit hospitals, it underrepresents certain types of hospitals that may be more likely to have financial challenges, such as small hospitals, rural hospitals, and hospitals with relatively low commercial prices. About four in five of the entities in this analysis with “vulnerable” or “highly vulnerable” levels of days cash on hand also had negative operating margins. This subset of nonprofit hospitals and health systems could be especially challenged to maintain current services or remain open. At the same time, 60 percent of the nonprofit hospitals and health systems in this analysis with negative operating margins had at least “strong” days cash on hand, suggesting some capacity to manage through challenging times.

Better, more complete, and standardized information about the days of cash on hand at hospitals and health systems could provide policymakers with a greater understanding of the financial status of these entities and which entities have a weaker or stronger footing. The federal government does not currently collect standardized information about days of cash on hand, which is why this analysis relies on data provided by S&P. Information about profitability is often based on cost reports submitted by many hospitals to the federal government, but cost reports are less standardized than the data used for this analysis and are missing key details that are necessary to provide reliable information about days of cash on hand. Some states have begun to fill in gaps in financial data by requiring that hospitals and health systems report additional and more standardized information. Such information would improve the understanding of how financially vulnerable hospitals are performing and inform policy pertaining to hospital costs and finances.

Methods

Data. We obtained financial data for a large number of nonprofit entities from S&P Global RatingsDirect, which collects and standardizes information from audited financial statements as part of their process for generating credit ratings. These financial data typically encompass every component of a given health system, including hospitals, other providers, and, in some cases, health plans (the largest example being Kaiser Permanente). Hospitals and health systems use different reporting periods for their audited financial statements in a given year. For 2022, the three most common reporting periods accounted for the large majority (96%) of hospitals and health systems in our analysis: January 2022 to December 2022 (39% of hospitals and health systems), July 2021 to June 2022 (33%), and October 2021 to September 2022 (25%). When focusing on entities with calendar year reporting periods, we found a slightly larger decrease in average days of cash on hand (from 226 to 214 days).

In some instances, S&P data may include entities with overlapping financial data (e.g., a health system and a subset of the health system that was recently acquired and continues to receive a credit rating), which would lead to double-counting. We attempted to identify these cases by flagging: (1) entities with the same ultimate parent organization in S&P’s data and (2) entities that were matched to the same health system based on information from the American Hospital Association (AHA) Annual Survey Database (see below). In those rare instances, we retained the larger entity.

We relied on the American Hospital Association (AHA) Annual Survey Database to help create and describe our sample (see below). We matched S&P entities to AHA data using a combination of name, ZIP code, and state. We linked S&P entities that could not be matched based on these variables through a manual review process. Our matches could be inaccurate in some instances for a variety of reasons. For example, S&P and AHA data could identify system membership differently in certain scenarios, in which case we may include some hospitals that are not part of the financial data for a given system or exclude some hospitals that are.

Measures. Our analysis focuses on days of cash on hand, which equals financial reserves divided by daily cash expenses. Financial reserves are defined to include all unrestricted cash and investments (such as stocks) but to exclude restricted cash and investments, which are legally constrained to serve a particular purpose (such as to fund the construction of a new facility). Daily cash expenses are defined as (operating expenses – depreciation and amortization) / 365. Categories of days cash on hand are based on S&P’s standard rubric (though the agency may adjust these categories based on other available information, such as reports that a system is planning to spend some of its reserves on upcoming infrastructure projects). Categories include the following:

  • Extremely strong: >275 days for standalone hospitals; >250 days for systems
  • Very strong: 205-275 days for standalone hospitals; 200-250 days for systems
  • Strong: 160-205 days for standalone hospitals; 150-200 days for systems
  • Adequate: 110-160 days for standalone hospitals; 100-150 days for systems
  • Vulnerable: 80-110 days for standalone hospitals; 70-100 days for systems
  • Highly vulnerable: <80 days for standalone hospitals; <70 days for systems

Our analysis includes average days of cash on hand weighted by daily cash expenses as well as some total dollar amounts (e.g., aggregate financial reserves). Larger health systems, by definition, contribute more to weighted averages and total dollar amounts. For example, the five largest health systems accounted for 22% percent of total daily cash expenses in 2022. The number of and trends in days of cash on hand were similar when looking at medians (224 in 2019 and 217 in 2022), which do not give additional weight to larger health systems. Similarly, most nonprofit hospitals and health systems in this analysis trended in the same direction as aggregate dollar amounts, with most exhibiting overall increases in financial reserves and daily cash expenses from 2019 and 2022 (84% and 98% of entities, respectively). Although there tended to be an increase in cumulative financial reserves from 2019 through 2022, most entities (88%) experienced decreases in financial reserves in 2022 and in the market value of financial investments (94% of entities) in that year. Nearly half (46%) of those with decreases in financial reserves in 2022 also had larger decreases in the market value of financial investments.

From 2020 through 2022, days cash on hand was higher than it otherwise would have been by what was likely a small number of days due to the deferral of Social Security payroll taxes under the Coronavirus, Aid, Relief and Economic Security (CARES) Act. In particular, employers were allowed to defer their share of these taxes that would otherwise have been due from March 27 through December 31, 2020. They were required to pay at least half of the deferred amount by December 31, 2021 and any remainder by December 31, 2022. We evaluated the magnitude of this benefit based on cleaned financial data for eight health systems in Massachusetts with October to September reporting periods. Among these health systems, the payroll tax deferral had the largest effect on days cash on hand in 2021 (ranging from zero to six days for an average of four days) and the smallest effect in 2022 (ranging from zero to three days for an average of one day). About four in ten (39%) hospitals and health systems evaluated in this data note had calendar year reporting periods; the payroll tax deferral should not have affected days cash on hand for these entities in 2022 if it were fully repaid by December 31, 2022, as required. S&P data on financial reserves and days cash on hand do not include Medicare advance payments.

Sample. We excluded some S&P hospitals and health systems from our analysis. First, we dropped for-profit hospitals and health systems. For-profit entities tend to maintain low financial reserves—and therefore have low days of cash on hand—as they face pressure to return excess cash to stockholders through dividends. Second, we excluded public hospitals and health systems, as there are a relatively small number of these entities in S&P data. Third, we excluded hospitals and health systems that were missing data for at least one year from 2019 through 2022. Fourth, we excluded hospitals and health systems when most of the reporting period for a given year fell in the prior calendar year (e.g., April 2021 to March 2022 reporting periods for 2022). Fifth, we dropped a small number of entities that appeared to overlap with others. Sixth, we dropped a small number of entities based in the US Territories. Finally, we dropped entities that we were unable to match to AHA data, which helped us narrow the sample to private, nonprofit hospitals and health systems. We defined nonprofit systems as those in which a majority of member hospitals were nonprofit.

After these changes, our analysis included 274 nonprofit hospitals and health systems. Based on our match to AHA data, these entities accounted for an estimated 56 percent of nonprofit hospitals in 2021 and 65 percent of nonprofit hospital beds.

Our analysis encompasses a large portion of nonprofit hospitals and health systems, but it excludes, among other entities, those that have not applied for a credit rating through S&P. To evaluate how representative our data are, we compared the characteristics of nonprofit hospitals with cost report data that could and could not be matched to S&P entities based on: (1) RAND Hospital Data, which is a cleaned and processed version of annual cost report data submitted by Medicare-certified hospitals to the Healthcare Cost Report Information System (HCRIS), (2) the RAND Price Transparency Study, and (3) AHA data. We found that our sample underrepresents small hospitals, rural hospitals, hospitals that are not part of a multihospital system, and hospitals with relatively low commercial prices. Excluded hospitals also had lower operating margins on average in 2022 but appeared to be similar to included hospitals based on Medicaid inpatient discharge shares. Our analysis excluded government hospitals, which tend to have lower days of cash on hand, as well as for-profit hospitals, which tend to maintain less financial reserves due to their organizational structure.

Although our analysis includes a distinct set of hospitals and health systems, it also encompasses a large portion of the nonprofit sector. Other, more comprehensive hospital data, such as HCRIS or AHA survey data, do not include reliable information about days of cash on hand. For example, cost reports collect information at the hospital level, but financial reserves are often held at the system level. In those scenarios, cost report data would understate the financial reserves that are available to the hospital.

This work was supported in part by Arnold Ventures. KFF maintains full editorial control over all of its policy analysis, polling, and journalism activities.

Nancy Kane, an independent consultant, provided input for this analysis.

How Do Health Expenditures Vary Across the Population?

Published: Jan 5, 2024

In a given year, a small portion of the population is responsible for a very large percentage of total health spending. This slideshow explores the variation in health spending across the population through an analysis of the 2021 Medical Expenditure Panel Survey (MEPS) data. The analysis finds that, in 2021, 5% of the population accounted for nearly half of all health spending. At the other end of the spectrum, the 50% of the population with lowest total health spending accounted for only 3%.

It also examines spending variation by age, gender, race, insurance status and presence of certain health conditions.

The chart collection is part of the Peterson-KFF Health System Tracker, an online information hub dedicated to monitoring and assessing the performance of the U.S. health system.

News Release

3 Charts: Asian Immigrants’ Experiences in the United States

Published: Jan 4, 2024

Like other immigrants to the U.S., Asian immigrants overwhelmingly say they emigrated for the opportunity to build a better life for themselves and their children. They come from more than 30 countries, and their experiences – their economic circumstance, how safe they feel, and the discrimination they face – vary greatly once here, including differences by income level, immigration status and country of origin.

These three charts explore the diversity of the Asian immigrant experience, drawing on findings from a new KFF report based on data from the KFF-Los Angeles Times Survey of immigrants:

1) Most Asian immigrants are faring relatively well financially, though there’s variation by region of origin, with immigrants from South Asia doing notably better than those from East or Southeast Asia. And one-in-three low-income Asian immigrants struggle to pay their bills.

2) One-in-six Asian immigrants, including one-in-three of those born in China, say they feel less safe due to their move to the United States. One-in-five Asian immigrants – and a higher share of those from China – also say that the COVID-19 pandemic has negatively impacted how they are treated in the United States, likely reflecting anti-Chinese rhetoric amidst the pandemic.

3) One-in-five Asian immigrants who sought health care in the U.S. say they have been treated unfairly by a health care provider at some point due to their accent or ability to speak English, their racial or ethnic background or skin color, or their ability to pay. The shares are higher among those with lower incomes or limited English proficiency.

For more about Asian immigrants’ experiences beyond these three charts, including their reasons for coming, their employment and financial situation, their experiences with discrimination and health care, and their understanding of immigration policies, read our new report, “Understanding the Diversity in the Asian Immigrant Experience in the U.S.: The 2023 KFF/LA Times Survey of Immigrants.”

Working-Age Adults with Disabilities Living in the Community

Authors: Patrick Drake and Alice Burns
Published: Jan 4, 2024

In September 2023, the National Institutes of Health designated people with disabilities as a population experiencing health disparities, which will help ensure that people with disabilities are represented in research funded by the National Institutes. Also in September of 2023, the Biden Administration proposed a new rule that would update the requirements for nondiscrimination on the basis of disability. Among other changes, the proposed rule would codify the Olmstead court decision, which requires people with disabilities to be served in the most integrated setting that is appropriate. The new designation and proposed rule may reflect, in part, an increased awareness of the challenges and health disparities faced by people with disabilities, many of which were exacerbated by the COVID-19 pandemic and its aftermath.

In this analysis, KFF examines the characteristics of people with disabilities who are living in the community from the American Community Survey. State-level data are also available on State Health Facts.

Key takeaways include: 

  • Over one in ten (11%) working-age adults ages 18-64 living in the community reported having a disability on the 2022 American Community Survey, which is defined as having a difficulty with hearing, vision, cognition, ambulation, self-care, or independent living.
  • Those 21.8 million working-age adults report difficulties with a range of different activities and are lower-income than working-age adults who did not report a disability.
  • Adults with disabilities are over twice as likely to have Medicaid as adults without disabilities, but fewer than a third receive income from the social security disability programs.

1. What are the demographic characteristics of working-age adults with disabilities?

People with disabilities tend to be older than other working-age adults, but the racial and gender distributions of people with disabilities are like those of people without disabilities (Figure 1). Nearly half (47%) of working-age adults with a disability are 50 years old or older, compared with only 30% of working-age adults without a disability. Smaller percentages of people with disabilities are ages 18-29, 30-39, and 40-49 than among adults without disabilities. Although the racial and ethnic distributions of working-age adults are similar for people with and without disabilities, among people with disabilities a smaller percent are Hispanic (17% compared to 20%) and Asian (3% compared to 7%), and a larger percent are Black (15% compared to 12%). Among working-age adults, roughly half are female regardless of disability status.

Nearly Half of Working-Age Adults With Disabilites are Ages 50-64, Compared With Fewer Than One-Third of Other Adults

2. What types of difficulties do working-age adults with disabilities report?

Among adults ages 18-64 with a disability, nearly half report a cognitive difficulty and nearly half report having more than one difficulty (Figure 2). Of the 21.8 million adults ages 18-64 who report having a disability, nearly half report difficulties with cognition, which is defined as difficulty concentrating, remembering, or making decisions; over two-fifths report difficulties with ambulation (defined as difficulty with walking or climbing stairs); and over a third report difficulties living independently (defined as difficulty doing errands alone such as visiting a doctor’s office or shopping). Fewer working-age adults report difficulties seeing, hearing, and with self-care (defined as difficult dressing or bathing). Among working-age adults with a disability, 44% report having more than one difficulty, with 9% reporting four or more difficulties.

Among Adults Ages 18-64 With a Disability, Cognition was the Most Commonly Reported Difficulty

3. What is the income and employment status of working-age adults with disabilities?

Working-age adults with disabilities are almost twice as likely to have income below 200% Federal Poverty Level (FPL) compared with adults without disabilities (Figure 3). The income distribution of working-age adults with disabilities is lower than that of working-age adults without disabilities. One in four working-age adults with a disability have incomes below FPL ($14,880 for an individual, and $23,280 for a family of three on average in 2022). Income is generally higher for working-age adults without disabilities with only 10% reporting incomes below FPL and almost half having incomes above 400% FPL.

Working-Age Adults With Disabilities Are Almost Twice as Likely to Have Income Less Than 200% FPL as Those Without

The percentage of working-age adults with disabilities who do not work is over three times greater than the percentage of working-age adults without disabilities who do not work (Figure 4). Lower income is likely related to lower levels of employment among working-age adults with disabilities: Almost half of people with disabilities do not work and one third work full time (35 or more hours per week). In comparison, over 64% of adults without a disability work full time and 16% do not work at all.

Working-Age Adults with Disabilities are Less Likely to Work Than Other Adults

4. How do working-age adults with disabilities access health insurance coverage?

The percentage of people with Medicaid is over two times higher among working-age adults with disabilities compared with those without disabilities (Figure 5). Among working-age adults with disabilities, 38% have Medicaid, which includes 30% who have Medicaid only and an additional 8% who have Medicaid and Medicare (dual-eligible individuals). Among those without a disability, 13% have Medicaid and 1% have Medicare and Medicaid. Notably, the majority of Medicaid enrollees with disabilities qualify on the basis of low income rather than on the basis of disability. The Medicaid expansion under the Affordable Care Act (ACA) – which all but 10 states have taken up – is based only on income. Qualifying for Medicaid based on disability status generally involves a complex application process to determine the extent of the disability and typically includes an asset test. To be eligible for Medicare, people must generally be ages 65 and older, or have a disability that qualifies them for the federal disability insurance program (DI). For most people ages 64 and younger, Medicare coverage begins only after waiting a 2-year waiting period which starts after they have been approved for DI benefits. As a result, 8% of working-age adults with disabilities have Medicare as their only source of coverage compared with only 1% of adults without a disability. 

All other coverage—including coverage through an employer, direct purchase, VA—accounts for 41% among working-age adults with disabilities compared with 74% of those without disabilities. Rates of employer coverage are nearly twice as high among adults without disabilities compared to those with (64% to 33% respectively). Uninsured rates are similar among working-age adults with and without a disability (10% and 11% respectively).

Rates of Medicaid Coverage Are Almost Three Times Higher for Working-Age Adults with Disabilities Compared to Those Without

5. How many adults with disabilities receive income from the social security disability programs?

Fewer than a third of working-age adults with disabilities receive any income from the social security programs, including Social Security Disability Insurance (DI) and Supplemental Security Income (SSI). Social security income includes income from several programs that support people who are retired, have qualifying disabilities, are survivors of people who died and had paid into the system, or who have limited financial resources and either a qualifying disability or are age 65 and older. The two primary programs include SSI and DI: 

  • SSI is a federal program administered by the Social Security Administration (SSA) that ensures a minimum level of income for poor people who are elderly or disabled. To qualify, SSI enrollees must have low income, limited assets, and either be age 65 or older or have an impaired ability to work at a substantial gainful level according to strict federal rules. Unlike DI, SSI is available to people regardless of their work history. As a result of strict SSA disability determination rules, not all people with disabilities qualify for SSI.
  • DI is a separate program from SSI also administered by the SSA. Unlike SSI, there are no income or asset limits for DI eligibility. Instead, to qualify for DI, enrollees must have a sufficient work history (generally, 40 quarters) and meet the strict federal disability rules. The amount of DI benefits is based on the person’s earnings history.

People receive both DI and SSI when their incomes (including DI benefits) are less than the maximum SSI payments. Among working-age adults with disabilities, fewer than one-third receive social security income: (14% receive DI, 12% receive SSI, and 3% receive benefits from both programs) (Figure 6).

Fewer Than One-Third of Working-Age Adults With Disabilities Receive Social Security Income


Looking Ahead, what are key issues to watch?

What new challenges will emerge now that the COVID-19 public health emergency has ended? Working-age adults with disabilities are a heterogenous group that may be facing unique challenges as the nation emerges from the COVID-19 public health emergency. These challenges include higher rates of long COVID than among people without disabilities, and disruptions in access to ongoing services and supports including telehealth services and Medicaid home- and community-based services. Recognizing the importance of home- and community-based services (HCBS) for people with disabilities during the pandemic and the workforce shortages during that time, the federal government provided new funding and flexibilities for states when delivering HCBS. In many states, those policies are ending which may create additional barriers to accessing HCBS in some states. More broadly, Medicare, Medicaid, and private insurers increased access to telehealth services during the pandemic, which may have enabled people with disabilities to access medical care more easily than in-person visits. Broad Medicare coverage of telehealth is set to expire at the end of 2024 and other payers may also limit their coverage, which could reduce the increased access to care.

Long COVID may have disproportionately affected people with disabilities, but it may also cause higher rates of disability moving forward. Long COVID can create or exacerbate challenges in meeting basic needs and a December 2022 survey found that substantial numbers of people with long COVID—many of whom also had other disabilities—were having difficulty paying their bills are accessing sufficient food.

How are people with disabilities accessing the supports and services they need when average wait times for disability claims are at an all-time high and clerical errors result in missing benefits or notices that people must repay prior years’ benefits? Long wait times make it difficult for people to access benefits when they need them creating unique challenges for the 21.8 million working-age adults living with disabilities in the United States. For those that receive disability benefits through the social security programs, many are finding their benefits reduced on account of overpayments they owe because of past errors on the part of the Social Security Administration. The Administration has been sending overpayment notices to more than 2 million people each year, which ask recipients to repay the government within 30 days. In many cases, those payments had been made years earlier without the recipients’ knowledge. By the time they had been identified, the overpayment amounts may be far larger than people can repay, measured in tens or even hundreds of thousands of dollars. When beneficiaries are unable to repay the money, the government may reduce their monthly benefits. The Senate Finance Committee is expanding oversight of the Social Security Administration to address such issues, but it’s unclear how long it will take to sort through the prior clerical errors and to address the wait times.

How will Medicaid redeterminations affect coverage for people with disabilities? Medicaid plays an important role in helping working-age adults to access the health and long-term services and supports they need and the next year or so may present difficulties as states redetermine Medicaid eligibility for the first time in over three years. At the start of the pandemic, Congress enacted the Families First Coronavirus Response Act, which required states to keep people continuously enrolled as a condition of receiving additional federal funding, but that requirement ended March 31, 2023, and states have begun disenrolling people who are no longer eligible or who do not submit complete and timely paperwork, resulting in many millions of people losing Medicaid coverage. Although Medicaid renewals are challenging for all types of enrollees, redeterminations may require more paperwork for people who are eligible on the basis of disability; and the loss of health coverage is especially likely to disrupt access to ongoing health care.

How might a new proposed rule regarding nondiscrimination based on disability be finalized and when finalized, affect people with disabilities? On September 7, 2023, the Office of Civil Rights within the Department of Health and Human Services published a proposed update to the regulations that prohibit discrimination based on disability by recipients of federal funding. The proposed rule is the first comprehensive update of the regulations since they were established more than 40 years ago and the new requirements would strengthen protections for people with disabilities. The proposed rule would address discrimination in medical treatment and child welfare programs, establish accessibility standards for web and mobile delivery of health and human services benefits, and establish enforceable standards for accessible medical equipment. It would also codify the Olmstead court decision that requires services to be provided in the most integrated setting appropriate. Often, the most appropriate settings are financed through Medicaid home- and community-based services, but many of those programs have waiting lists for people to access care. It is unknown how the final requirements will compare to the proposed rule, but the new regulation is intended to help people with disabilities better access health care and social services.


How might a proposed change to the definition of disability in the American Community Survey affect people with disabilities and funding for programs that provide housing, transportation, health care, and education? Currently, the survey asks people whether they have difficulty with hearing, vision, cognition, ambulation, self-care, or independent living using a yes/no answer option. The proposed change would tweak the wording of the questions, but the biggest change is that respondents would be given four answer options instead of two: no difficulty, some difficulty, a lot of difficulty, and cannot do at all. The new questions and answers were developed in recognition that disability is a complex topic that may be difficult to define with a yes or no framework, to better identify people who may be at risk of restricted social participation, and to enable international comparisons. Under the proposal, people would be counted as having a disability if they reported they cannot do something at all or have a lot of difficulty, which could reduce the percentage of people with disabilities by 40%, raising concerns among people with disabilities, advocates for programs serving people with disabilities, and researchers using the data. Advocates and researchers note that the American Community Survey data are used for enforcing civil rights and allocating federal funding, which means changing the questionnaire could have significant policy implications.

News Release

What 2024 Could Bring for Working-Age Adults with Disabilities 

Published: Jan 4, 2024

As the 25th anniversary of Olmstead nears, more than one-in-10 working age adults have a disability and most do not receive public disability income. 

Over one-in-10 working-age adults reported having a disability in 2022. A disability is defined as having difficulty with hearing, vision, cognition, ambulation, self-care, or independent living, according to KFF’s examination of data on people with disabilities from the American Community Survey.

Fewer than a third of working-age adults with disabilities receive any income from social security programs, including Social Security Disability Insurance and Supplemental Security Income. Meanwhile, they are almost twice as likely to have income below 200% Federal Poverty Level compared with adults without disabilities. They are also more likely to have Medicaid and could face greater paperwork challenges during Medicaid redeterminations.

In many states, COVID-era policies that increased access to home and community-based services are ending, which may create additional barriers to care for some people with disabilities. 

As people with disabilities struggle to access and maintain the supports and services they need, average wait times for disability claims are at an all-time high and current recipients may be missing benefit payments on account of past clerical errors. 

A new proposed rule could address discrimination against people with disabilities in medical treatment and child welfare programs, establish accessibility standards for web and mobile delivery of health and human services benefits, and establish enforceable standards for accessible medical equipment. It would also codify the Olmstead court decision that requires services to be provided in the most integrated setting appropriate.

Poll Finding

Understanding the Diversity in the Asian Immigrant Experience in the U.S.: The 2023 KFF/LA Times Survey of Immigrants

Published: Jan 4, 2024

Findings

Executive Summary

Asian immigrants represent a significant and growing share of the U.S. population, contributing to the country’s communities and economy and representing dozens of countries of birth and languages spoken. Many come to the U.S. on H-1B visas, which are used by the U.S. government to employ immigrants in highly specialized and often technical fields, or on student visas for higher education. Reflecting these immigration pathways, as a broad group, Asian immigrants typically fare well on socioeconomic measures. However, contrary to the model minority myth, the experiences of Asian people in the U.S., including Asian immigrants, are not monolithic, with some subgroups facing significant socioeconomic challenges. Moreover, the U.S. has a long history of exclusionary policies focused on Asian immigrants, contributing to ongoing anti-Asian sentiment and the “perpetual foreigner” stereotype, which intensified during the COVID-19 pandemic and with some recent laws restricting the actions of Chinese immigrants in particular. Increased data on Asian immigrant experiences is important for understanding their diversity of experiences and focusing initiatives, policies, and resources to address the challenges they face.

This report examines experiences of Asian immigrant adults in the U.S. and how they vary across different factors such as region or country of origin, income, and English proficiency. It is based on The Survey of Immigrants, conducted by KFF in partnership with the Los Angeles Times during Spring 2023, the largest and most representative survey focused on immigrants living in the U.S. to date. With its sample size of 3,358 immigrant adults1 , the survey provides a deep understanding of immigrant experiences, reflecting their varied countries of origin and histories, citizenship and immigration statuses, racial and ethnic identities, and social and economic circumstances. KFF also conducted focus groups with immigrants from an array of backgrounds, which expand upon information from the survey (see Methodology for more details). Other reports from this survey include an overview report, a health and health care experiences report, and a report on politics and policy. Key takeaways from this report include:

A majority of Asian immigrants in the U.S. are from China, India, or the Philippines, are long-term U.S. residents, and are college-educated and employed; yet some face socioeconomic and language challenges. Asian immigrants include people born in China (21%), India (21%), the Philippines (17%), as well as smaller shares from other East, Southeast, South, and Central Asian countries. Three in four (74%) Asian immigrants have been in the U.S. for ten or more years and two-thirds (66%) are naturalized citizens. However, South Asian immigrants (including those from India) are more likely than East and Southeast Asian immigrants (including those from China and the Philippines) to be recent immigrants (15 vs. 7%) and less likely to be citizens (55% vs. 71%). Overall, four in ten (41%) Asian immigrants live in households with annual incomes of at least $90,000, with immigrants from South Asia (51%) more likely to have higher household incomes than immigrants from East and Southeast Asia (36%), likely reflecting differences in the shares with a college degree (71% vs. 48%). About half (49%) of Asian immigrants have limited English proficiency (LEP), including seven in ten (71%) Chinese immigrants.

Like immigrants overall, most Asian immigrants come to the US for better opportunities for themselves and their children and most feel that their lives are better as a result of coming, although they are somewhat less likely than other immigrants to say their safety is better off. Among Asian immigrants, those from China are particularly less likely to say that their safety is better as a result of immigrating to the U.S. with just one in three (34%) saying it is better as compared to at least half of Indian (52%) and Filipino (59%) immigrants. This may, in part, reflect increases in anti-Chinese sentiment during COVID-19 and recent laws targeting Chinese immigrants.

About one in three (36%) Asian immigrants report facing at least one form of discrimination or harassment in the community. These experiences include being treated worse than U.S.-born people in stores or restaurants (27%), in interactions with the police (17%), or when buying or renting a home (14%). One in five (20%) also say that the COVID-19 pandemic changed the way they are treated as an immigrant in a bad way, including about a quarter (27%) of Chinese immigrants. About four in ten (45%) with LEP also say that difficulty speaking or understanding English has made it hard for them to access health care or public assistance services or complete certain activities such as getting or keeping a job or interacting with the police.

While most Asian immigrants are faring well in employment and finances, reflecting higher educational attainment levels than other immigrant groups, those with lower household incomes face challenges. One in five (19%) living in households with lower incomes (less than $40,000 per year) have difficulty paying their bills each month, and one in three (32%) lower income Asian immigrants say they had problems paying for necessities such as housing, health care, utilities, or food in the past 12 months. Four in ten (44%) employed Asian immigrants, including half of those living in households with lower incomes, report experiencing at least one form of workplace discrimination asked about in the survey.

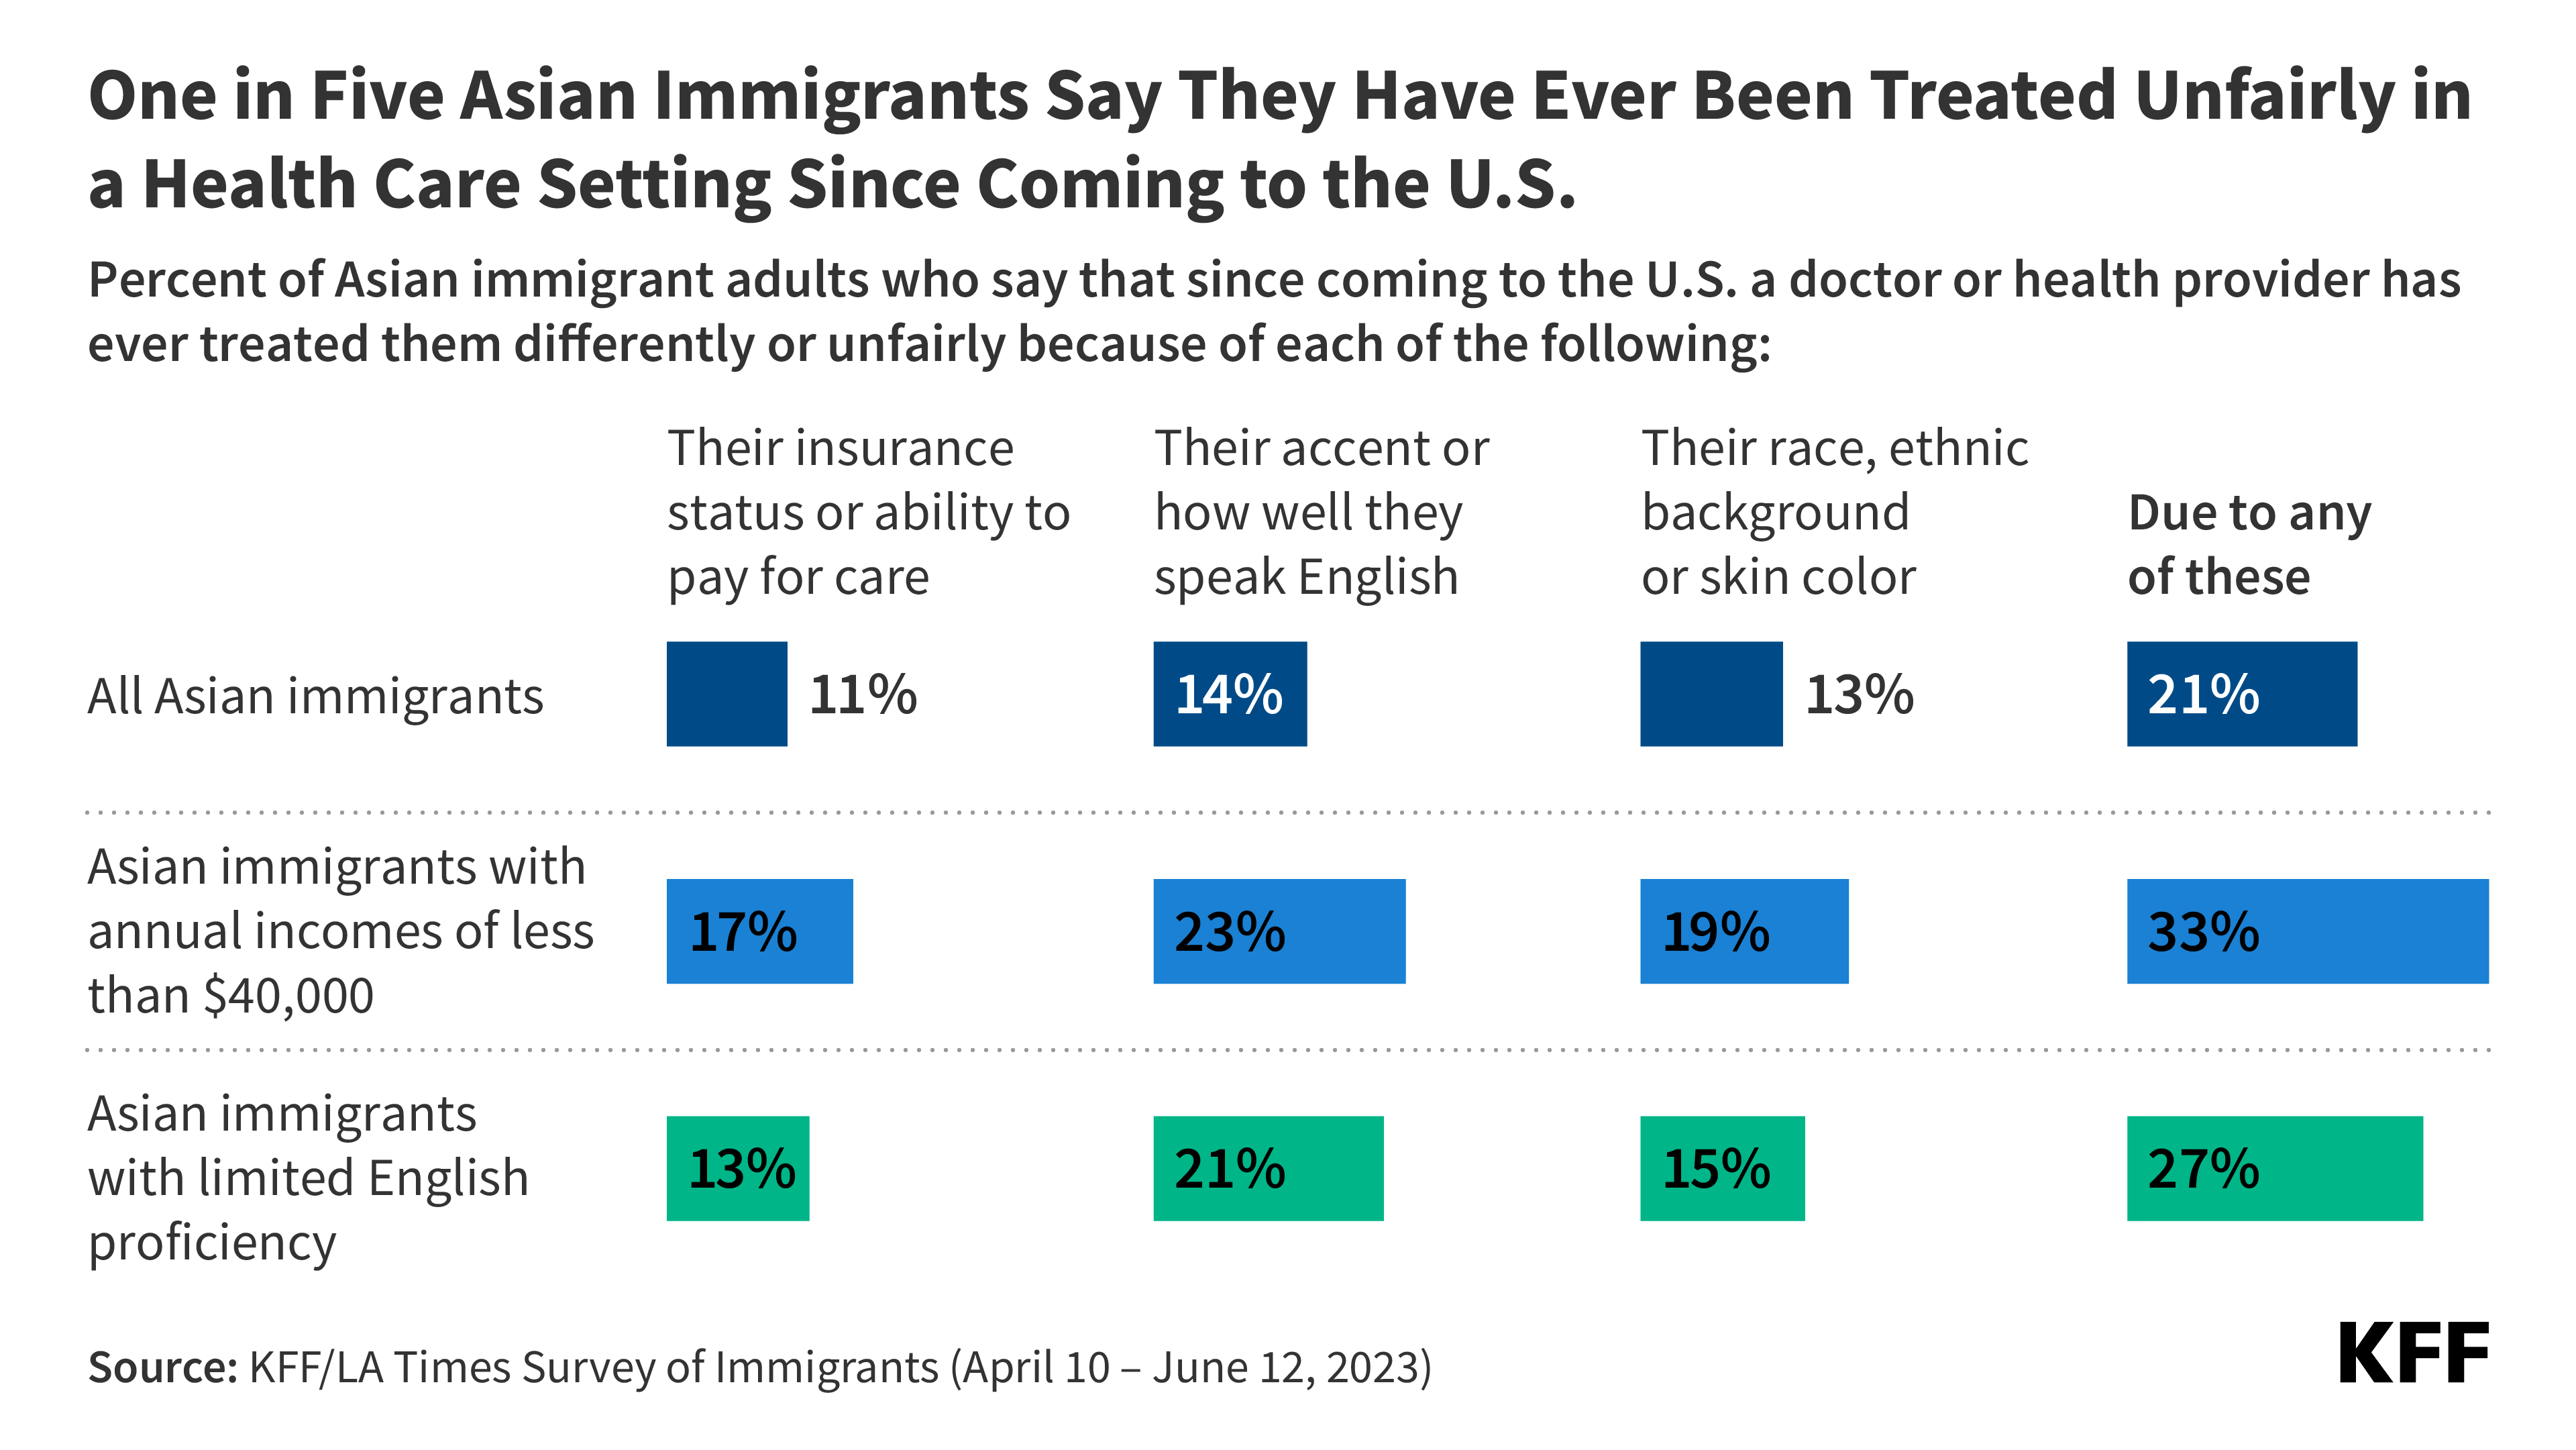
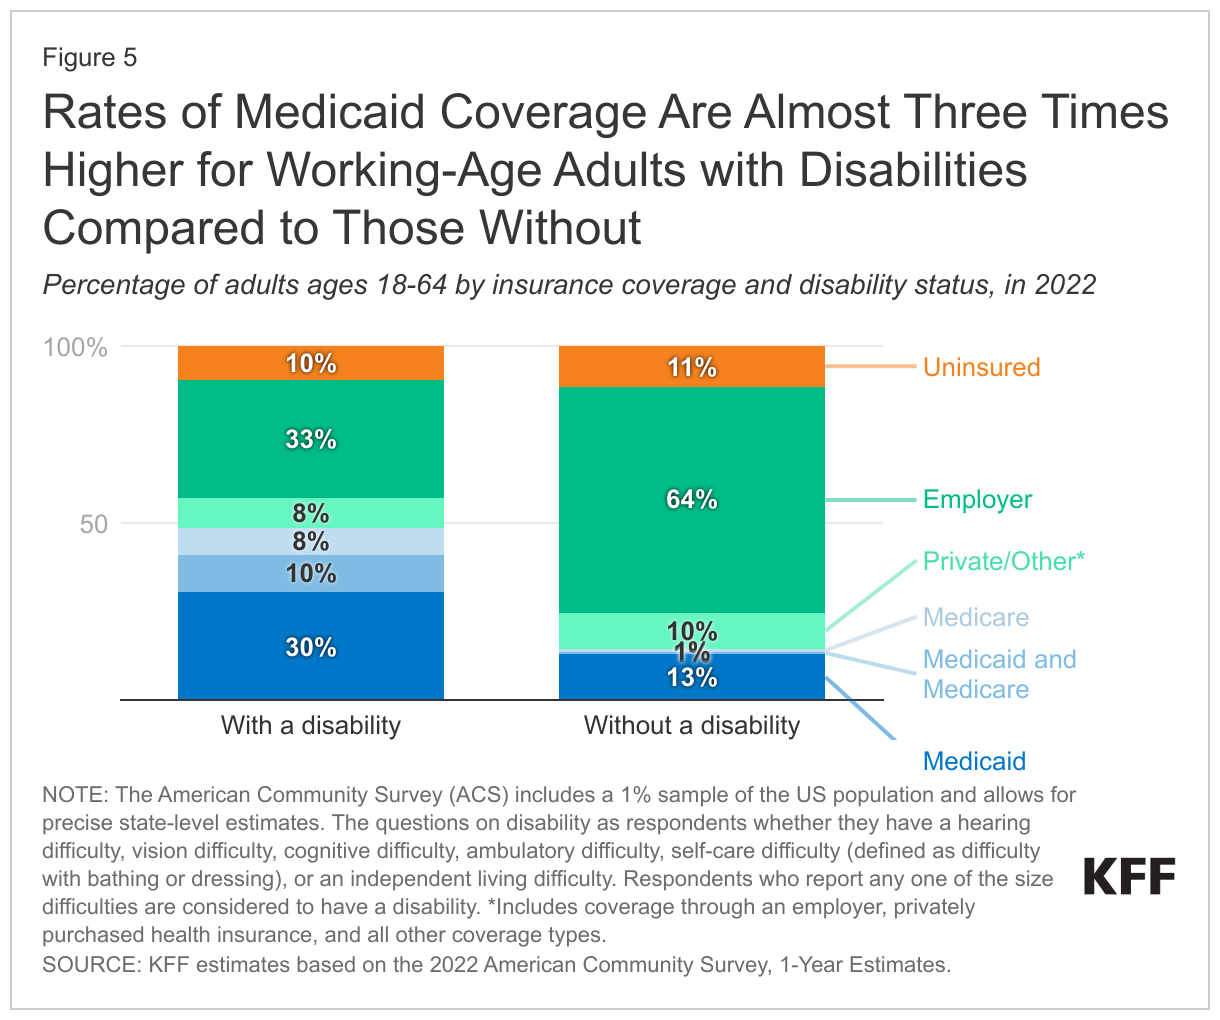
Reflecting their job patterns and higher incomes, a majority (64%) of Asian immigrant adults say they have private health coverage and only 4% report being uninsured. Highlighting the important role that coverage plays in access to health care, over eight in ten Asian immigrants say they have a usual source of care (86%) and a trusted doctor in the U.S. (84%) and only one in six (16%) report skipping or postponing health care for any reason in the past year. However, one in five (21%) report experiencing discrimination or unfair treatment in a health care setting due to their insurance status or ability to pay, their accent or ability to speak English, or their race, ethnicity, or skin color.

Four in ten (42%) of Asian immigrants say they don’t have enough information about U.S. immigration policies to understand how they impact their family, and many remain confused about how use of assistance for health care, housing, or food can impact immigration status. Among Asian immigrants with LEP, half (49%) say they do not have enough information about U.S. immigration policy. Seven in ten Asian immigrants, say they are unsure (55%) whether the use of non-cash benefits to help pay for health care, housing, or food can impact the likelihood of being approved for a green card or incorrectly believe this to be the case (15%). The share who incorrectly believe this to be the case is higher among noncitizens and immigrants who have been in the U.S. for less than 10 years as compared to their naturalized citizen and 10+ year resident counterparts.

Who Are Asian Immigrants?

Country/Region of Origin: One in five (21%) Asian immigrants in the U.S. are from China, an additional 17% are from the Philippines and 29% from other East and Southeast Asian countries (such as Korea, Japan, and Thailand).2  About one in five (21%) are from India with an additional 7% hailing from other South Asian countries (such as Bangladesh, Pakistan, and Sri Lanka). Asian immigrants also include those from Central Asia (including Kazakhstan, Uzbekistan, and others). See here for a list of regional groupings.

Census Region: Four in ten Asian immigrants live in the West (43%), a quarter (24%) live in the South, one in five (21%) live in the Northeast and a smaller share (12%) live in the Midwest. Almost half of Asian immigrants live in one of three U.S. states: California (31%), New York (9%), or Texas (8%).

Time in country: Similar to the overall immigrant population, most Asian immigrants are long-term U.S. residents. About three in four (74%) have lived in the U.S. for ten or more years, 14% have been in the U.S. for five to nine years, while one in ten (10%) have been in the U.S. for less than five years. Higher shares of immigrants from India have been in the U.S. for less than five years (16%) as compared to immigrants from the Philippines (6%) and this is also true for South Asian immigrants overall (15%) as compared to East and Southeast Asian immigrants (7%).

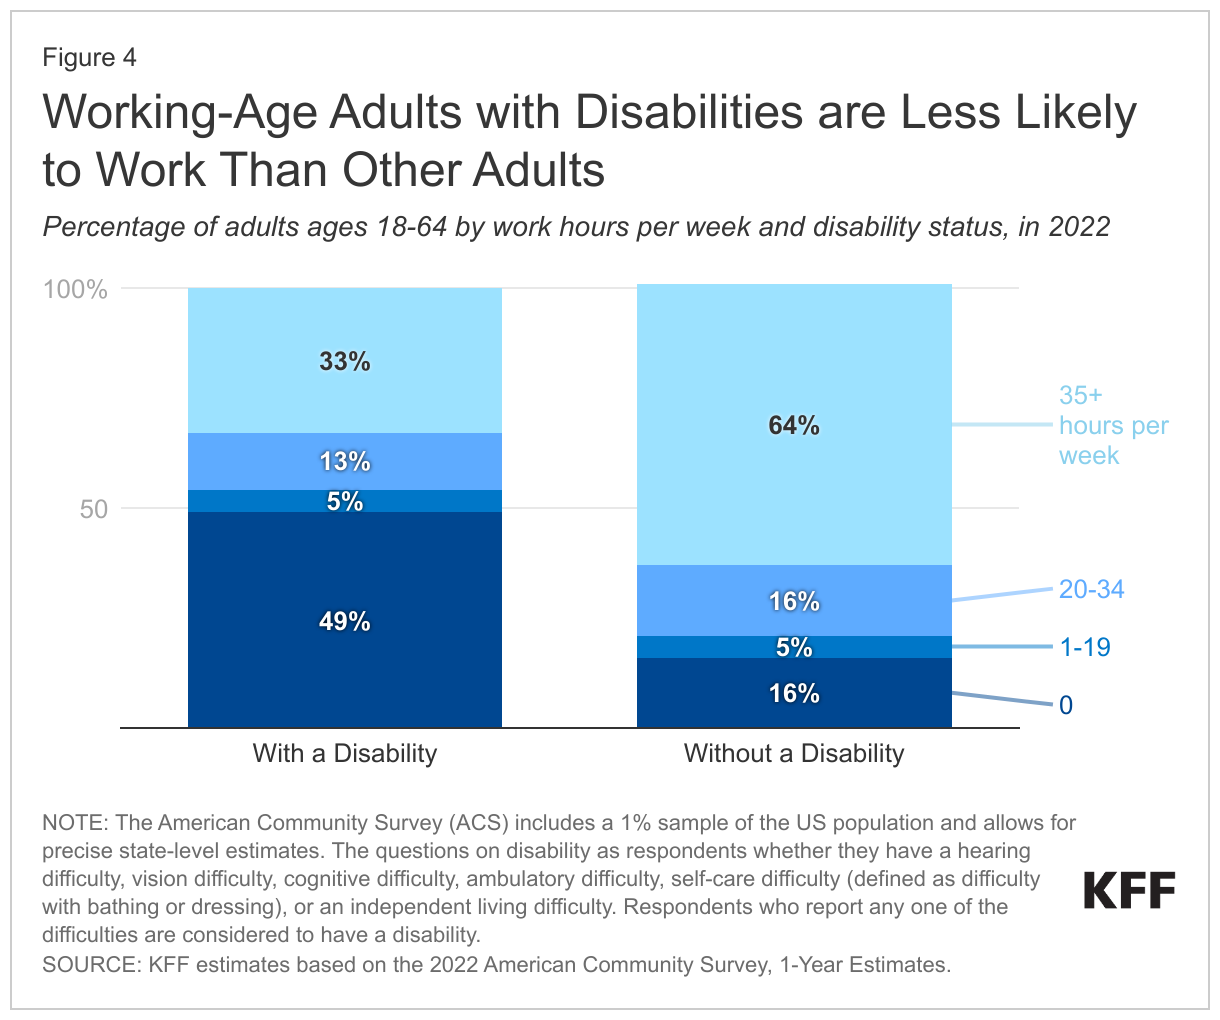
Employment: Similar to the overall immigrant population, two-thirds (64%) of Asian immigrants are currently employed for pay, including three-quarters (74%) of those ages 18-64; 17% of employed Asian immigrants are self-employed or the owner of a business.

Parental Status: About one in three (34%) Asian immigrants are the parent of a child under 18 living in their household, and the vast majority (81%) of this group say at least one of their children was born in the U.S.

English Proficiency: Similar to the total immigrant population, almost half (49%) of Asian immigrants have limited English proficiency (LEP, defined as speaking English less than very well), with shares with LEP about twice as high (71%) among immigrants from China as compared to their counterparts from India (32%) and the Philippines (34%). LEP rates are also higher among immigrants from East and Southeast Asia overall (56%) as compared to immigrants from South Asia (38%). About one in three Asian immigrants say they speak English very well (32%) and an additional one in five (19%) say they speak English exclusively. Asian immigrants speak a wide variety of languages at home, including one in five (21%) who speak some form of Chinese, one in ten (13%) who speak Filipino or Tagalog, and one in ten (10%) who speak Vietnamese. Other languages spoken by Asian immigrants include Urdu, Hindi, Korean, Japanese, and many others.

Immigration Status: Two-thirds (66%) of Asian immigrants are naturalized U.S. citizens, while about three in ten (29%) say they have a valid visa or green card, and 5% are likely undocumented. Among Asian immigrants, those from the Philippines have the highest shares (80%) of naturalized citizens followed by immigrants from China (60%); immigrants from India include lower shares of naturalized citizens (49%) which could in part be due to 16% of them being more recent immigrants (less than five years). In general, the shares of Asian immigrants who are naturalized citizens are higher among immigrants from East and Southeast Asia (71%) as compared to those from South Asia (55%).

Educational Attainment: A majority (54%) of Asian immigrants have a college degree or higher, about one in six have completed some college (18%), and about a quarter (26%) have a high school education or less. Those with a college degree or higher include much higher shares of immigrants from India (83%) as compared to immigrants from China (56%) or the Philippines (52%) and this is also true for South Asian immigrants overall (71%) as compared to East and Southeast Asian immigrants (48%).

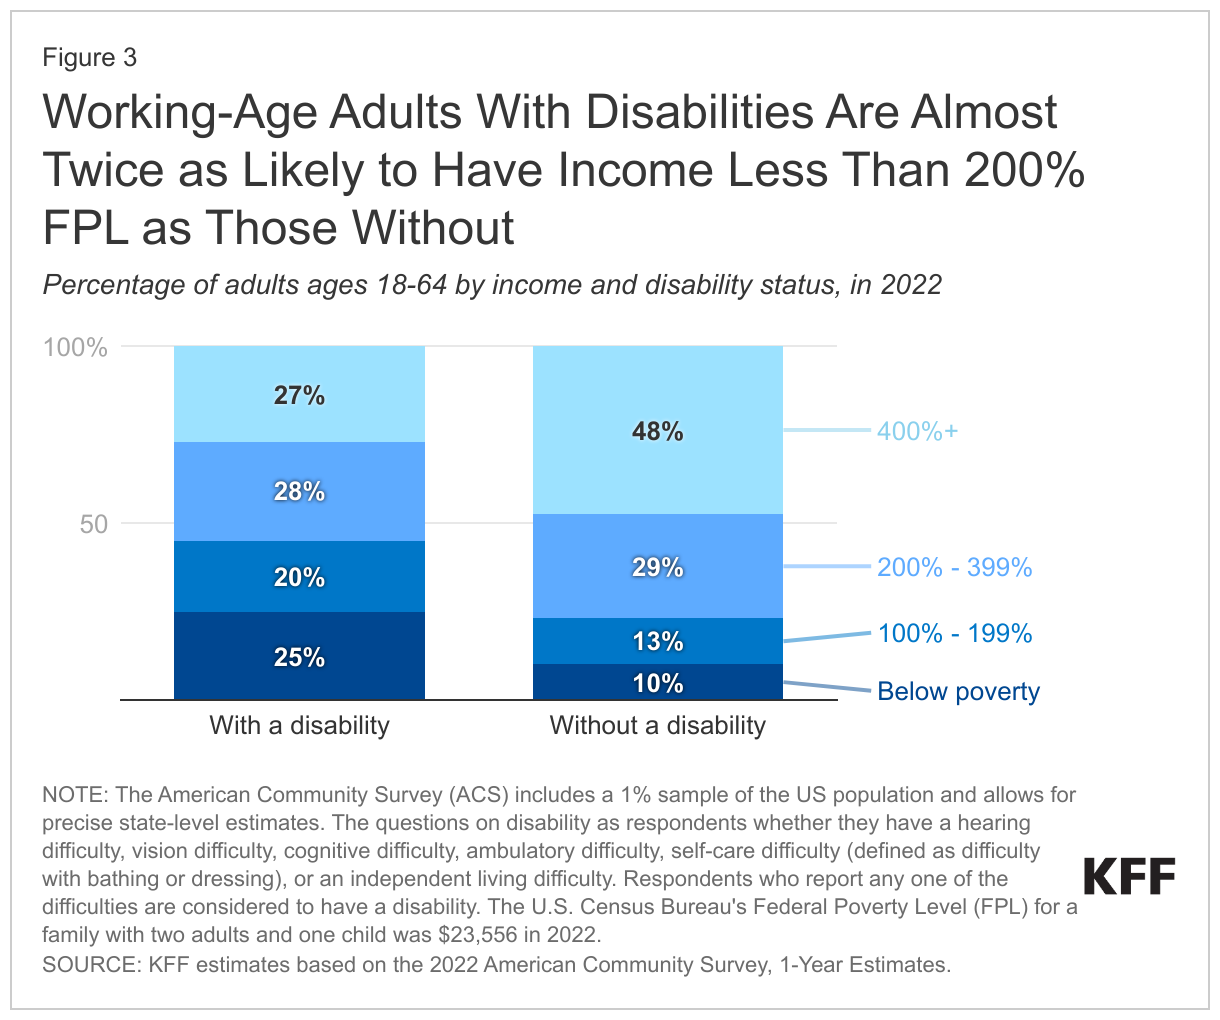
Household Income: Four in ten (41%) Asian immigrants live in households with annual incomes of at least $90,000, and another 29% live in households with annual incomes of $40,000 to less than $90,000. About one in four (27%) live in households with lower incomes (less than $40,000 per year). Immigrants from India (62%) are much more likely to have higher household incomes compared with immigrants from China (41%) and the Philippines (37%), reflecting differences in educational attainment. Overall, immigrants from South Asia (51%) are more likely than immigrants from East or Southeast Asia (36%) to have higher household incomes.

Reasons For Coming And Life In The U.S.

Like immigrants overall, a majority of Asian immigrants cite better opportunities and a better future for their children as reasons for moving to the U.S., with high shares of immigrants from East and Southeast Asia also citing having more rights or freedoms as a reason. Among Asian immigrants, at least three in four say better economic and job opportunities (86%), educational opportunities (79%), and a better future for their children (75%) are a reason they moved to the U.S. Smaller shares say they came to the U.S. to have more rights or freedoms (66%), to join or accompany family members (51%), or to escape violent or unsafe conditions (34%). However, the share citing more rights and freedoms as a reason is higher among immigrants from East and Southeast Asia (71%) compared with those from South Asia (52%).

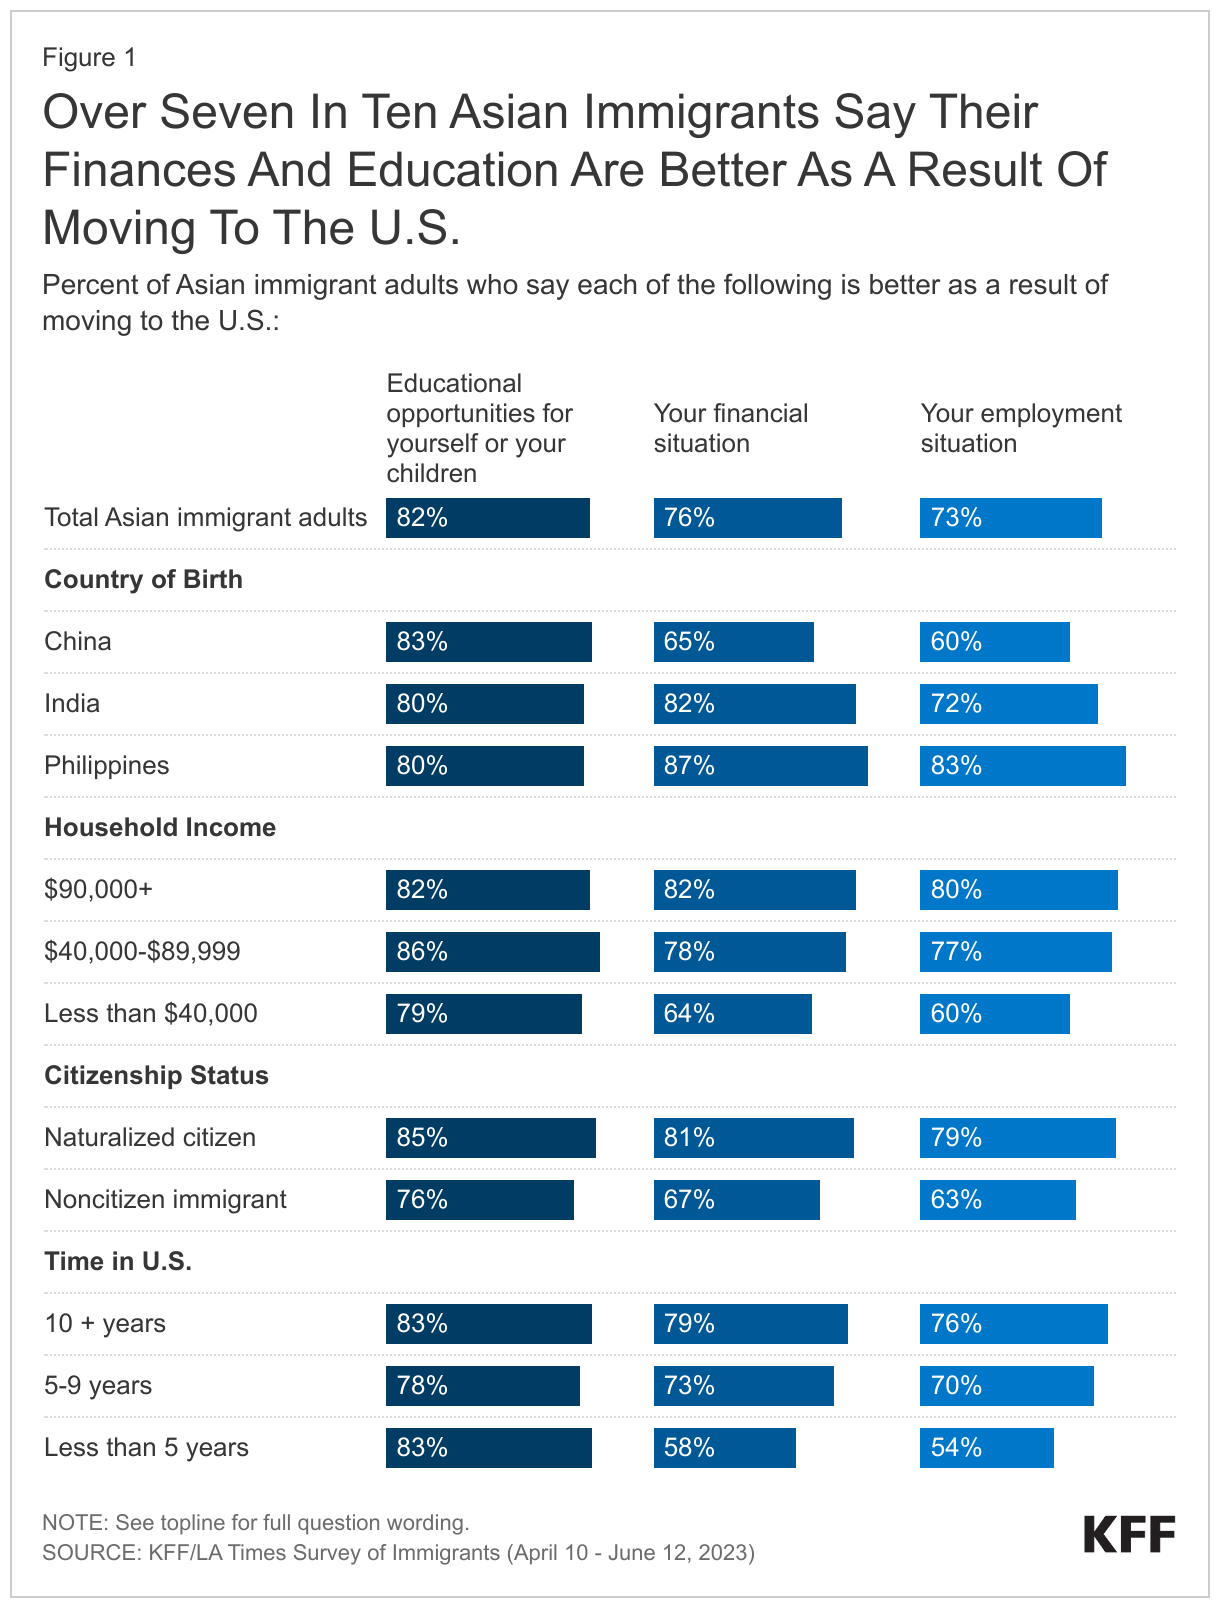
Majorities of Asian immigrants feel that their educational and financial situations are better as a result of moving to the US, even among those with lower incomes and those who are noncitizens (Figure 1). Overall, more than seven in ten Asian immigrants say their financial (76%) and employment (73%) situation are better, and eight in ten (82%) say their or their children’s educational opportunities are improved. Regardless of immigration status, income, or time in the U.S., a majority of Asian immigrants report they are doing better on these measures. However, the shares reporting they are doing better in terms of finances and employment are somewhat lower among noncitizens, more recent immigrants, and those with lower incomes (less than $40,000 per year) compared to their citizen, longer-term immigrant (10+ years), and higher income (at least $90,000 per year) counterparts. Moreover, those from China are less likely to say they are doing better on financial and employment measures than those from India and the Philippines.

Over Seven In Ten Asian Immigrants Say Their Finances And Education Are Better As A Result Of Moving To The U.S.

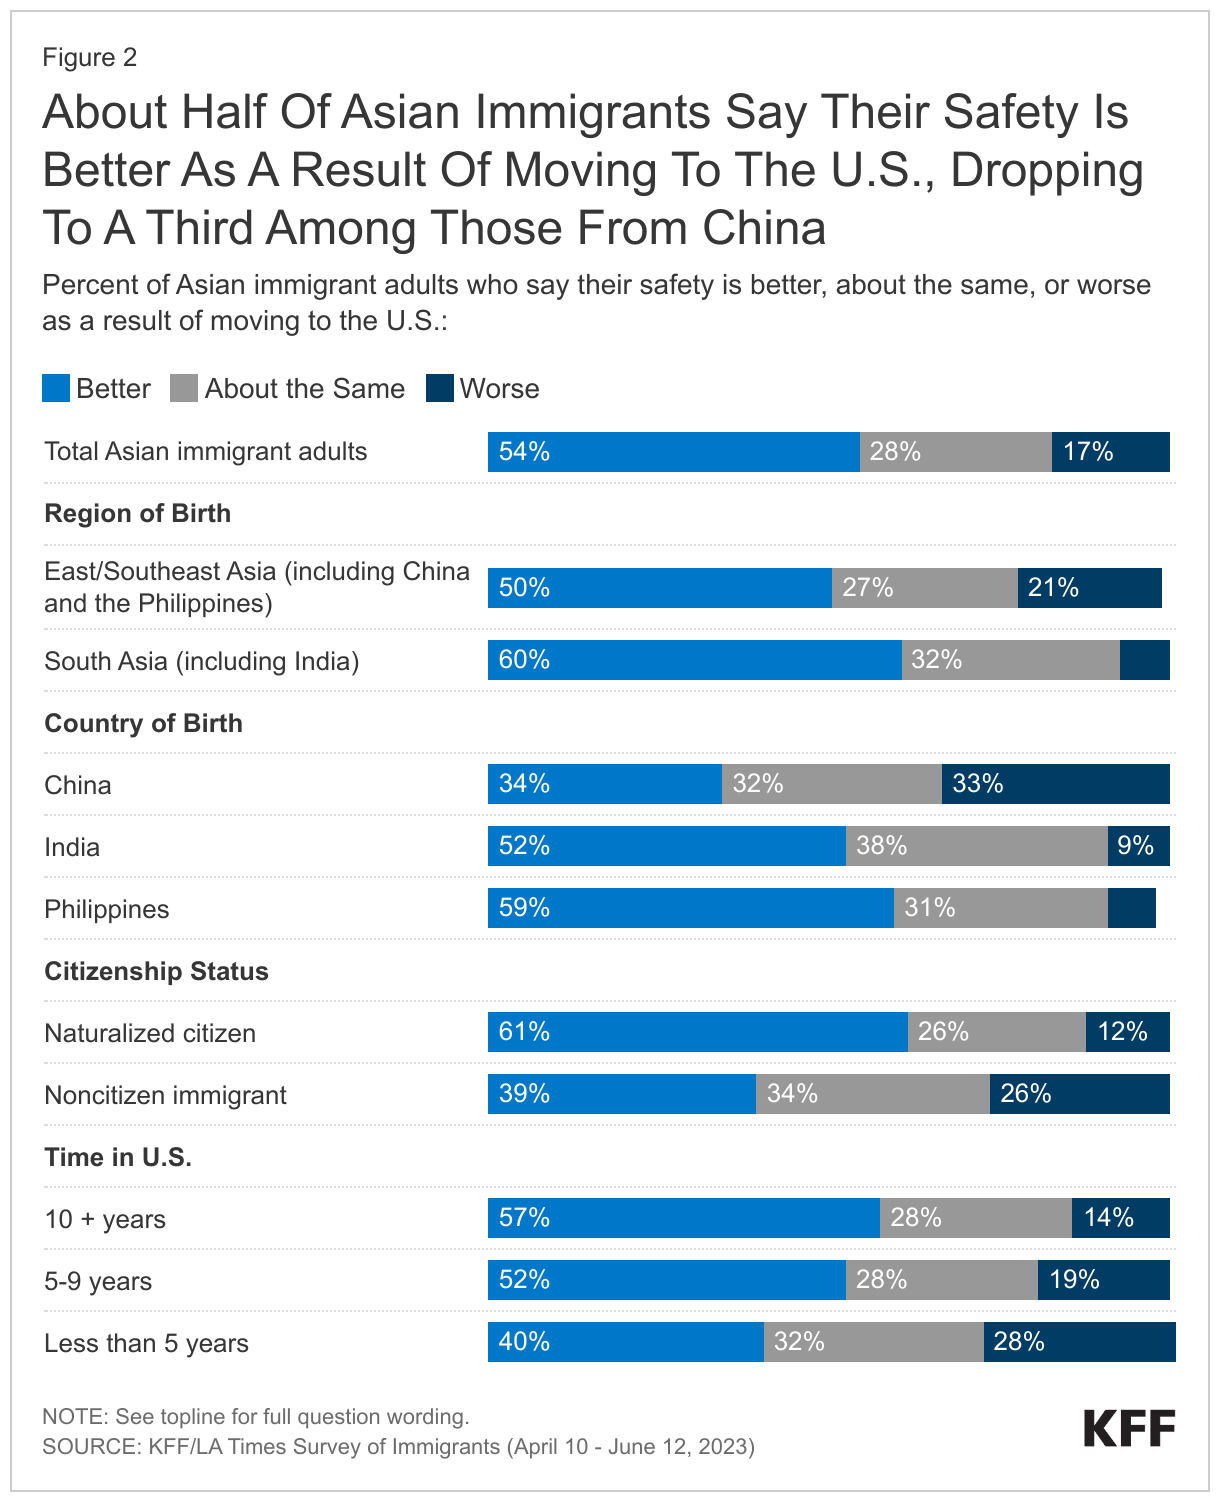
About half (54%) of Asian immigrants say their safety is better as a result of moving to the U.S.  and roughly one in five (17%) say it is worse, with those from East and Southeast Asia, noncitizens, and recent immigrants more likely to say it is worse (Figure 2). In comparison, among immigrants overall, about two in three (65%) say their safety is better as a result of immigrating. Asian immigrants from East and Southeast Asia are about twice as likely as those from South Asia to say their safety is worse (21% vs. 7%), a pattern largely driven by the one-third (33%) of immigrants from China who say this. In addition, noncitizens (26%) and recent immigrants (less than five years) (28%) are about twice as likely as naturalized citizens (12%) and longer-term immigrants (10+ years) (14%), respectively, to say that their safety is worse because of moving to the U.S. These feelings about safety may, in part, reflect the rise in anti-Asian hate incidents during the COVID-19 pandemic.

About Half Of Asian Immigrants Say Their Safety Is Better As A Result Of Moving To The U.S., Dropping To A Third Among Those From China

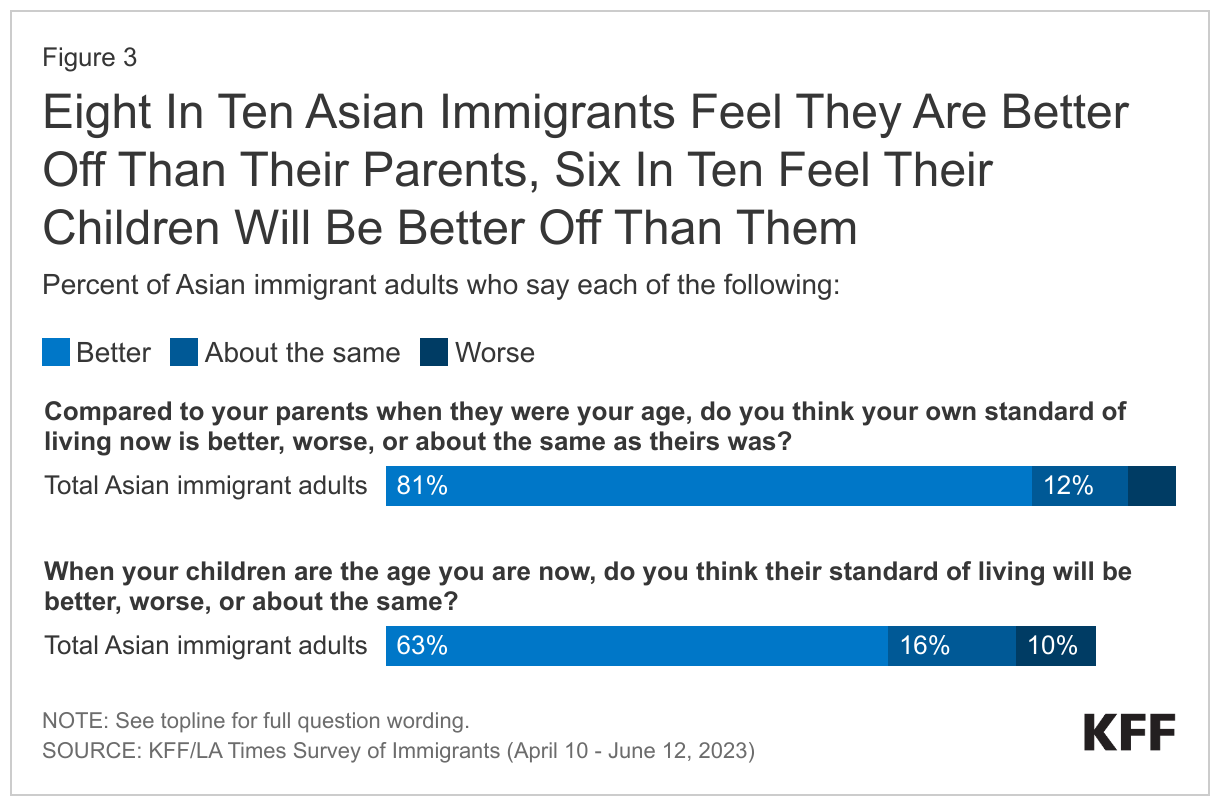
Eight in ten (81%) Asian immigrants, regardless of country or region of birth, citizenship status, and length of time in the country, feel that their standard of living is better than their parents’ was at their age, and six in ten (63%) feel that their children’s standard of living will be better than theirs (Figure 3). Optimism for their children’s future standard of living is higher among Asian immigrants with lower educational attainment (high school or less) (69%) and LEP (69%) compared with those who have completed college (58%) and are English proficient (57%).

Eight In Ten Asian Immigrants Feel They Are Better Off Than Their Parents, Six In Ten Feel Their Children Will Be Better Off Than Them

Experiences With Discrimination And Unfair Treatment

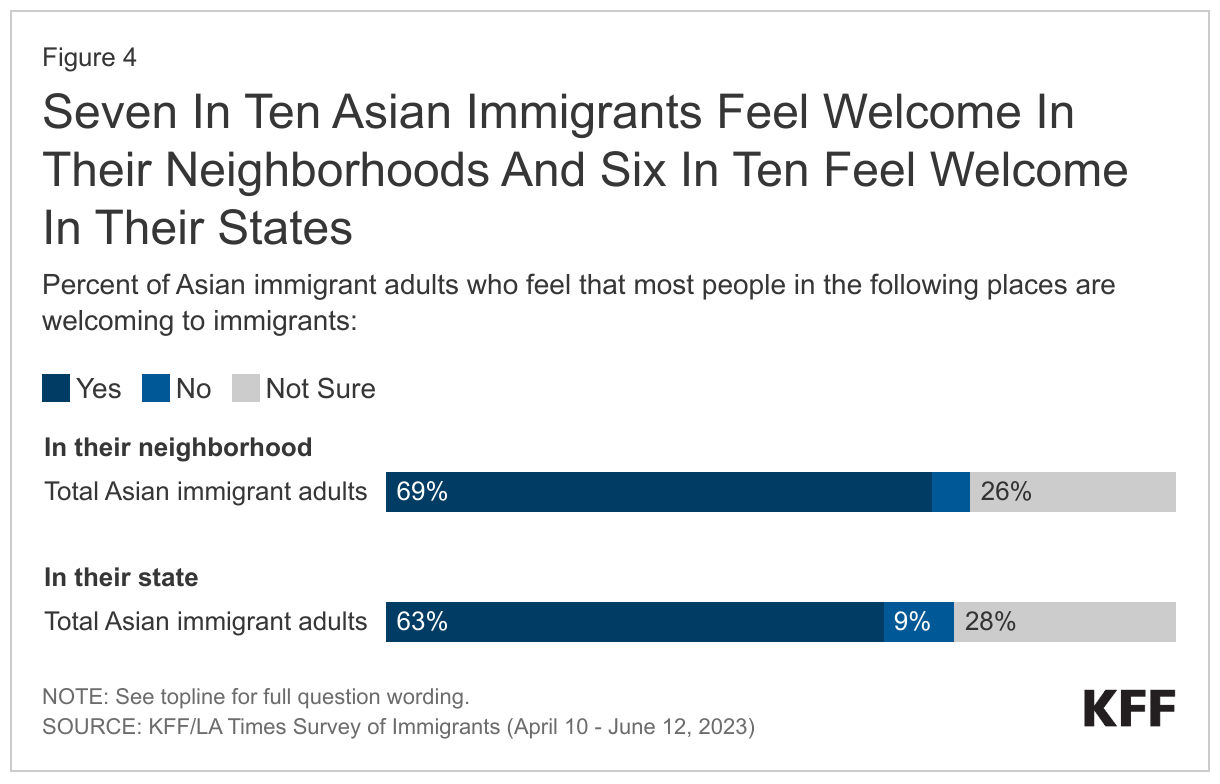
Like immigrants overall, a majority of Asian immigrants feel most people in their neighborhood (69%) and the state (63%) they live in are welcoming to immigrants (Figure 4). Overall, 5% say that most people in their neighborhood are not welcoming to immigrants, and about one in ten (9%) say that people in their state are not welcoming. The remaining shares say they are unsure if people in their neighborhood (26%) and state (28%) they live in are welcoming to immigrants.

Seven In Ten Asian Immigrants Feel Welcome In Their Neighborhoods And Six In Ten Feel Welcome In Their States

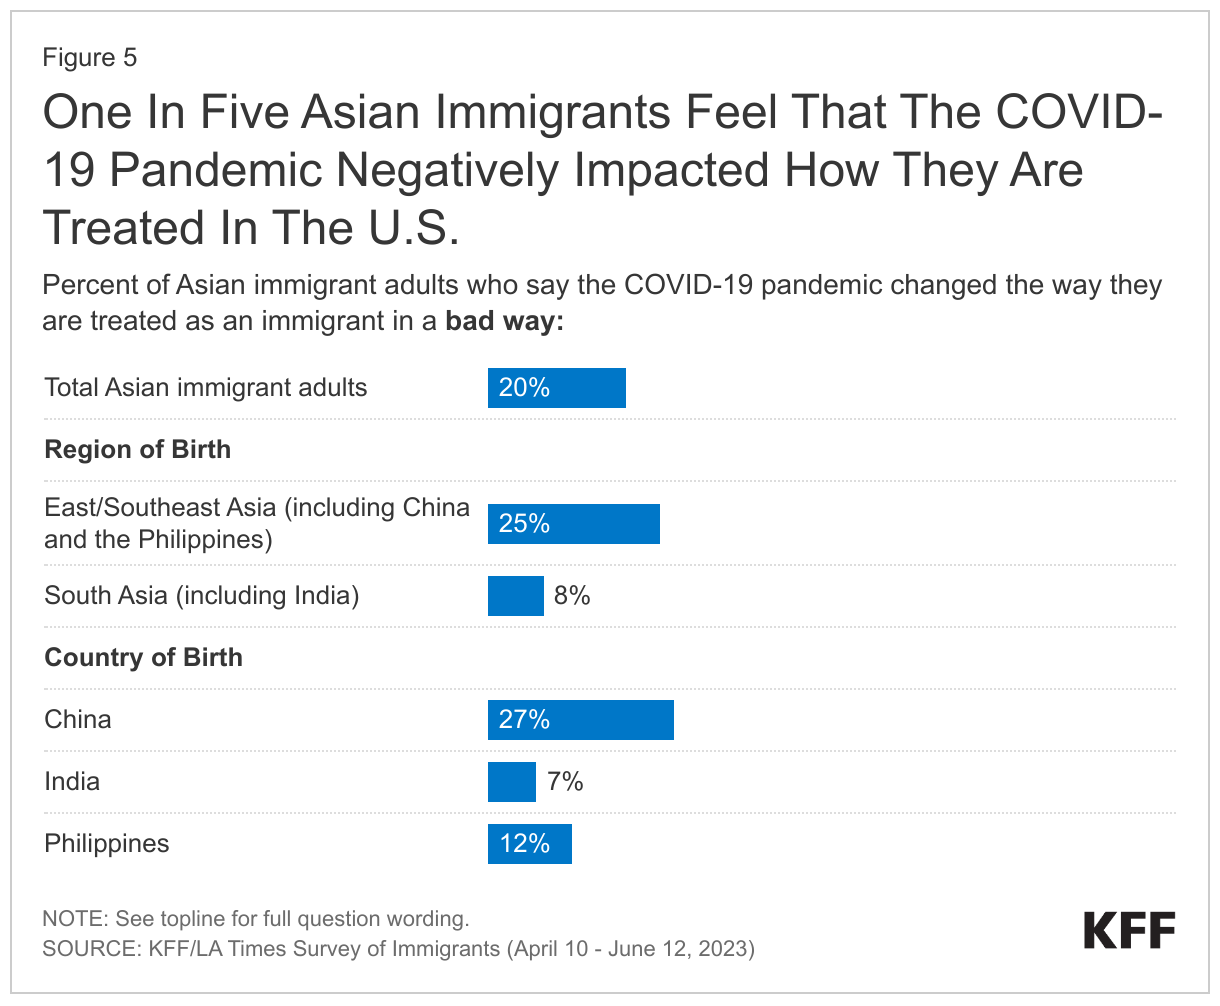
One in five (20%) Asian immigrants feel the COVID-19 pandemic has negatively impacted the way that they are treated as an immigrant, higher than the shares for Black (11%), Hispanic (9%), and White immigrants (7%). Immigrants from East and Southeast Asia (25%) are much more likely than those from South Asia (8%) to say that the pandemic changed how they are treated as an immigrant in a bad way, largely driven by the 27% of Chinese immigrants who say this compared with about one in ten Indian (7%) and Filipino (12%) immigrants (Figure 5). These patterns likely reflect the strong anti-Chinese rhetoric perpetuated by the Trump Administration, which repeatedly blamed China for the spread of the COVID-19 pandemic.

One In Five Asian Immigrants Feel That The COVID-19 Pandemic Negatively Impacted How They Are Treated In The U.S.

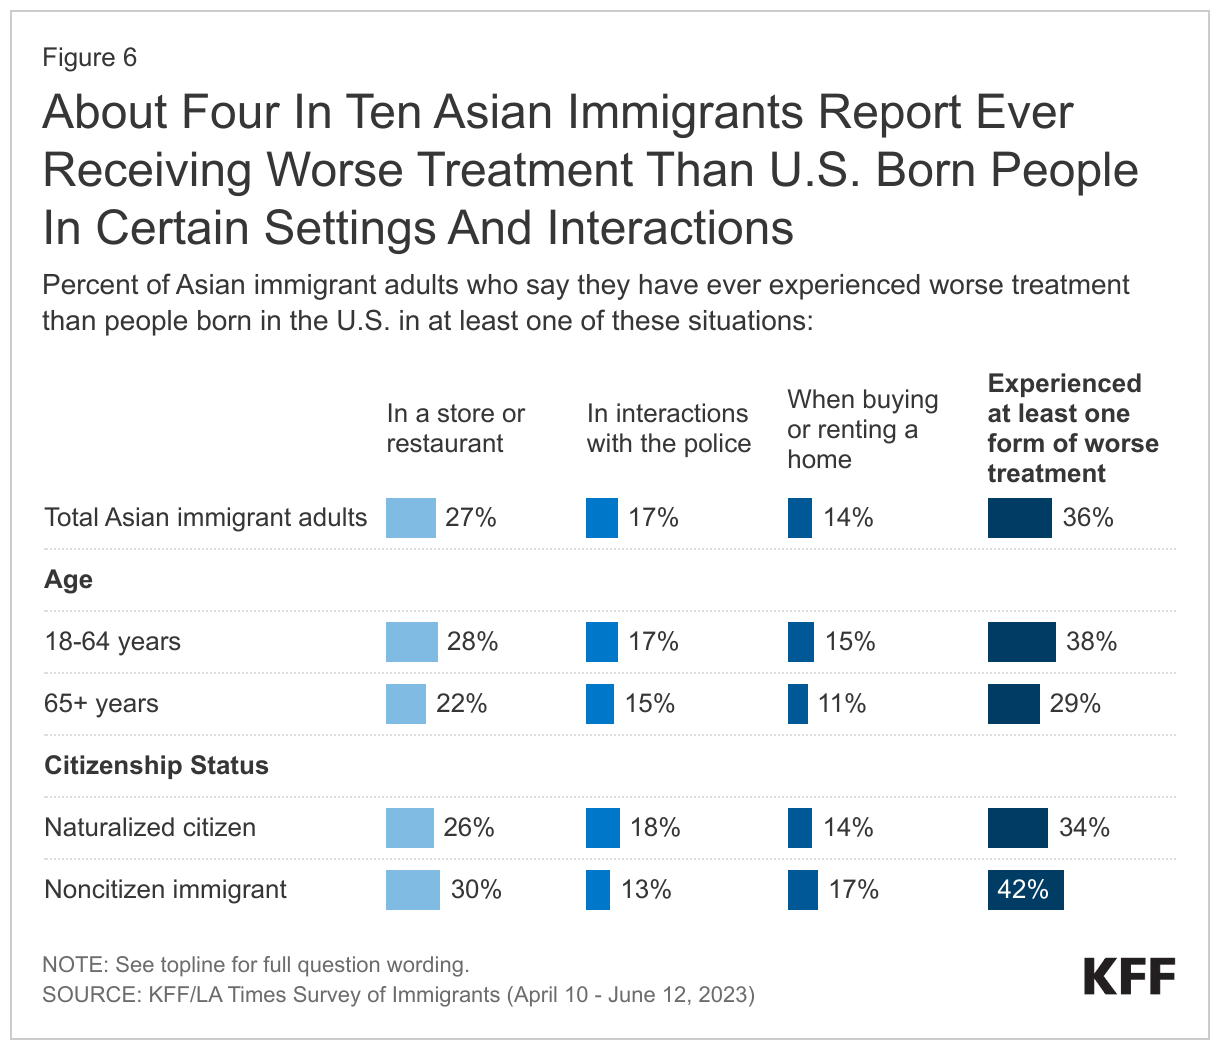
About one in three (36%) Asian immigrants say they have ever received worse treatment than U.S.-born people in stores or restaurants (27%), in interactions with the police (17%), or when buying or renting a home (14%), with those under age 65 and who are noncitizens particularly likely to report these experiences (Figure 6). Asian immigrant adults younger than 65 (38%) are more likely than their older counterparts (29%) to say they have ever experienced at least one form of worse treatment, as are noncitizen Asian immigrants (42%) compared with those who are naturalized citizens (34%).

About Four In Ten Asian Immigrants Report Ever Receiving Worse Treatment Than U.S. Born People In Certain Settings And Interactions

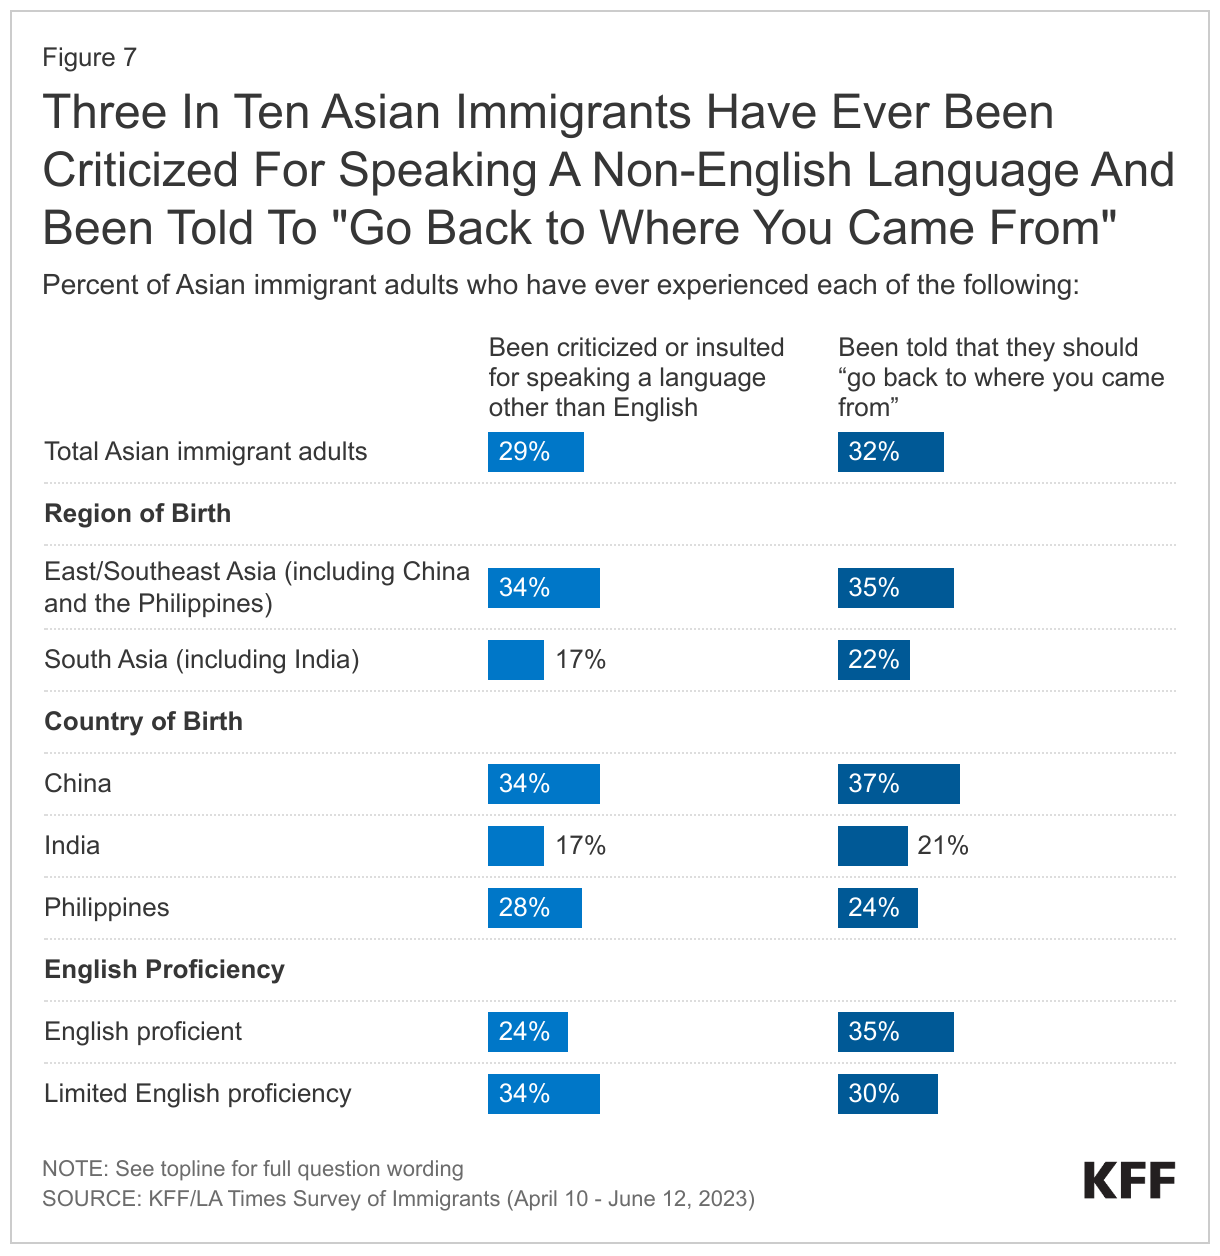
About three in ten Asian immigrants say they have ever experienced anti-immigrant harassment such as being told to go back to where they came from (32%) or being criticized for speaking a language other than English (29%), with higher shares of Chinese immigrants and those with LEP reporting harassment (Figure 7). About one in three East and Southeast Asian immigrants say they have ever been criticized or insulted for speaking a language other than English (34%) or were told to “go back to where you came from” (35%) compared with about one in five South Asian immigrants (17% and 22%, respectively). Chinese immigrants are more likely than Indian and Filipino immigrants to report experiencing these forms of harassment, which may in part, reflect the growth in anti-Chinese rhetoric during the COVID-19 pandemic as well as recent laws restricting actions among Chinese immigrants. In addition, Asian immigrants with LEP (34%) are more likely than their English proficient counterparts (24%) to say they were criticized for speaking a language other than English, although there are no differences in the share saying they have been told “they should go back where you came from” by English proficiency. Roughly twice as many Chinese immigrants (71%) have LEP than do Filipino (34%) or Indian (32%) immigrants, which could further explain some of the differences in experiences of harassment by country of origin.

Three In Ten Asian Immigrants Have Ever Been Criticized For Speaking A Non-English Language And Been Told To &quot;Go Back to Where You Came From&quot;

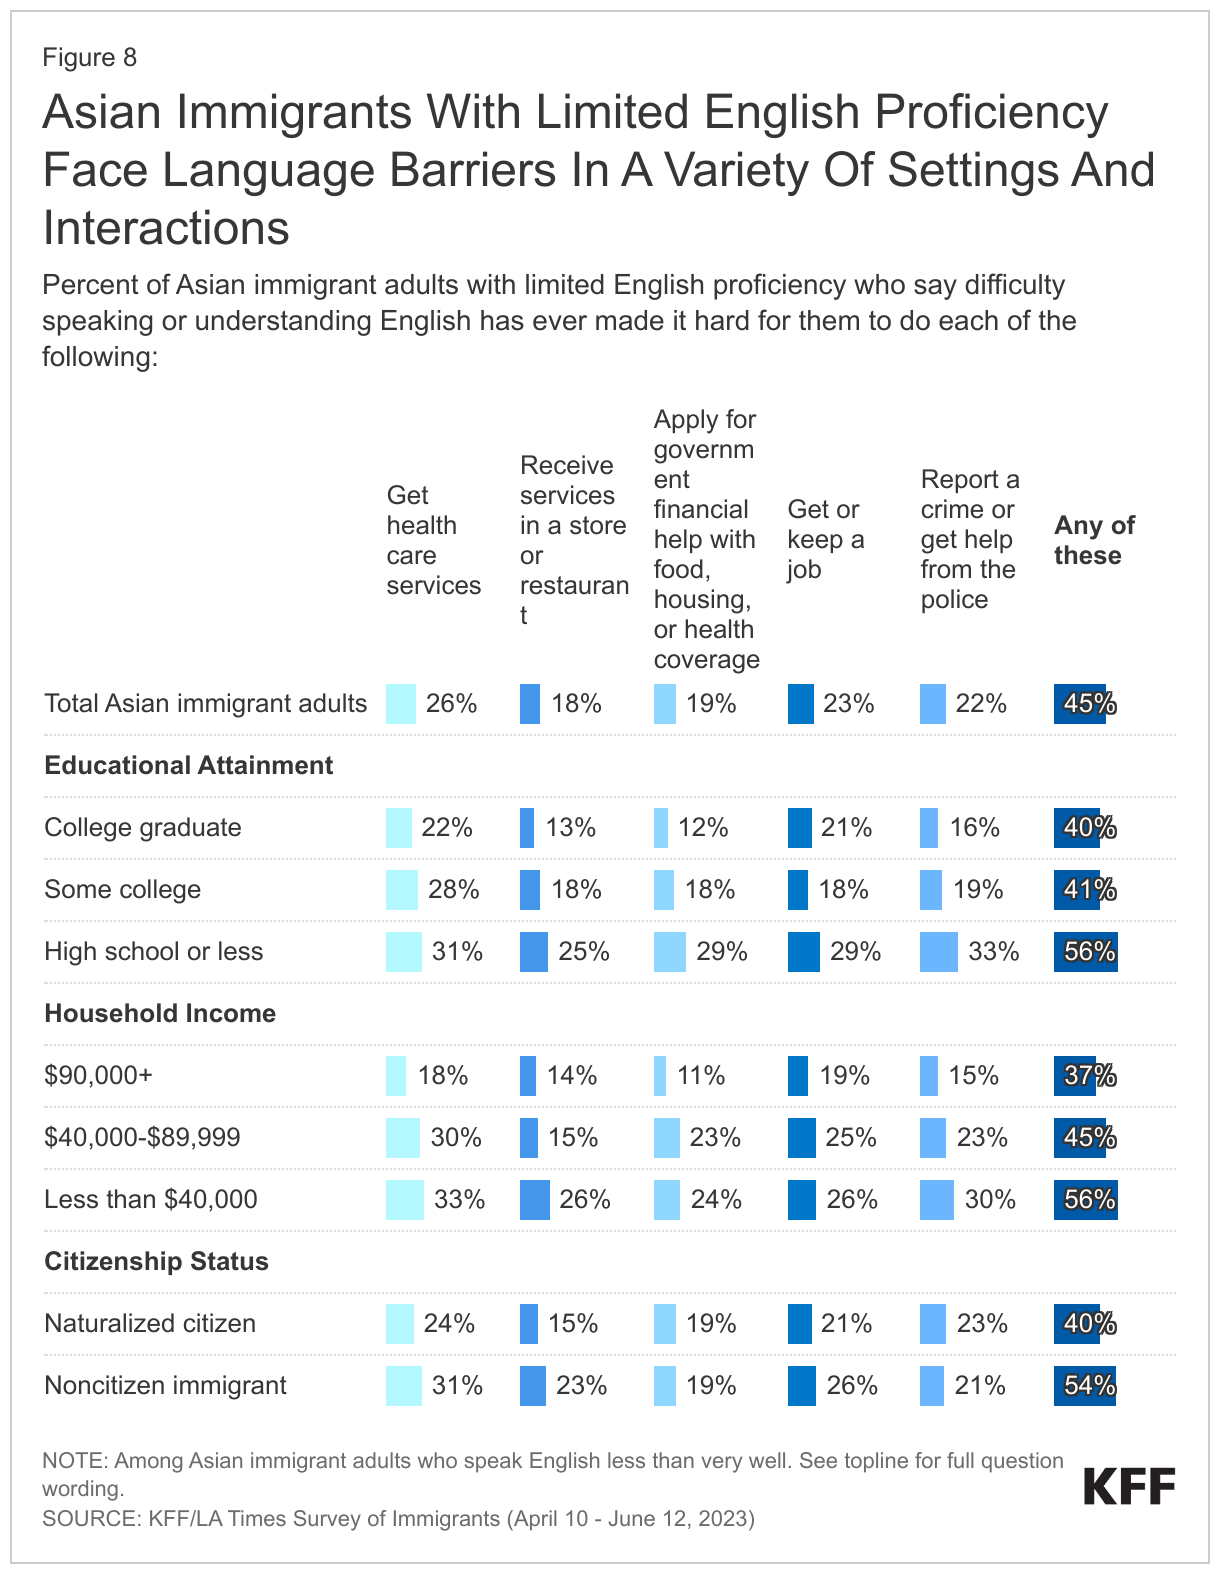
About four in ten (45%) Asian immigrants with LEP say that difficulty speaking or understanding English has made it hard for them to access certain services or complete certain activities, with this share rising to over half among those with LEP who also have lower educational attainment, lower incomes, or are noncitizens. About half (49%) of Asian immigrants have LEP, meaning they speak English less than very well, including 71% of immigrants from China. Among this group, about four in ten(45%) say that difficulty speaking or understanding English has ever made it hard for them to do at least one of the following: get health services (26%), get or keep a job (23%), or get help from the police (22%), apply for government help with food, housing, or health coverage (19%), or receive services in a store or restaurant (18%), (Figure 8). Among Asian immigrants with LEP, those with lower educational attainment, lower incomes (less than $40,000 per year), and who are noncitizens face disproportionate language challenges with over half of these groups experiencing at least one of these difficulties.

Asian Immigrants With Limited English Proficiency Face Language Barriers In A Variety Of Settings And Interactions

Employment and Financial Situation

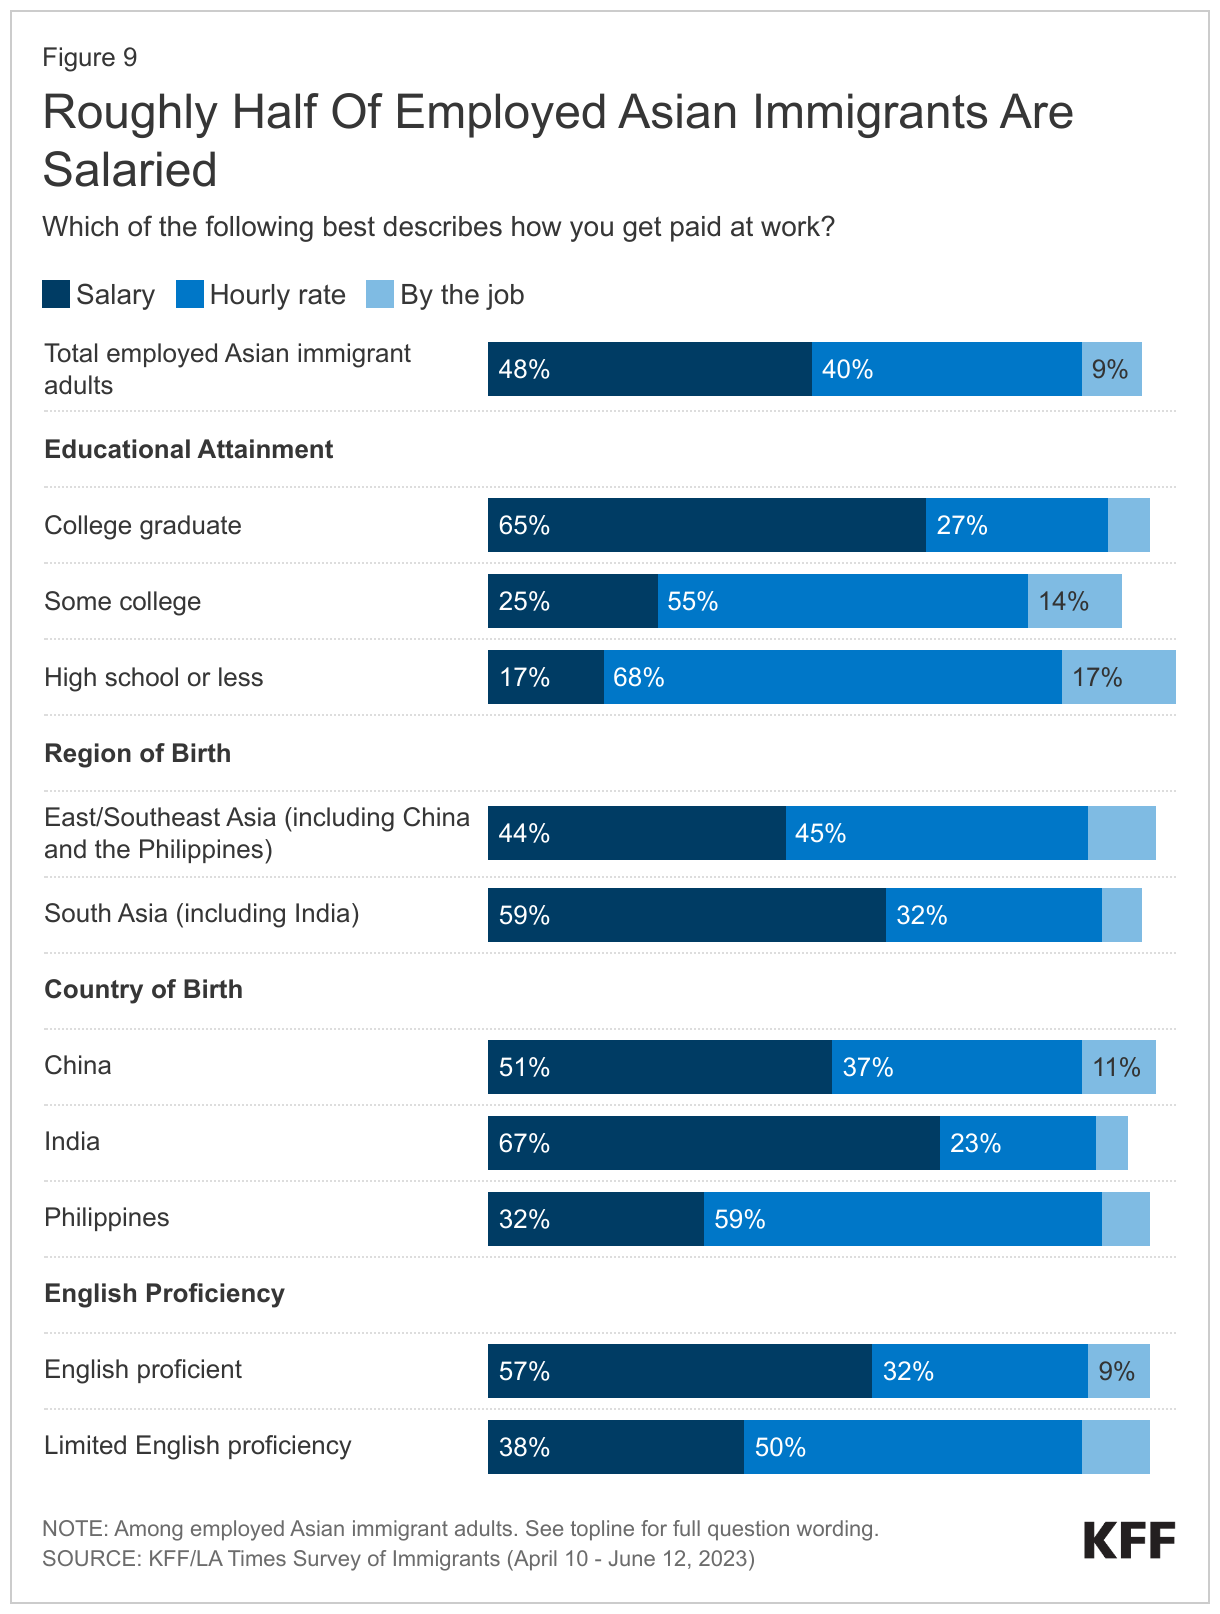
Most Asian immigrants are employed, predominantly in salaried jobs. Two-thirds (64%) of Asian immigrants are employed for pay, including three-quarters (74%) of those ages 18-64. About one in five (17%) of employed Asian immigrants are self-employed or the owner of a business. Asian immigrants are more likely than immigrants overall to be salaried, with about half receiving a salary (48%), four in ten (40%) being paid an hourly rate, and one in ten (9%) being paid by the job (Figure 9). However, pay type varies starkly among Asian immigrants, largely driven by differences in educational attainment. Among Asian immigrants, those who are college graduates are about four times as likely as those with a high school diploma or less (65% vs. 17%) to be in a salaried position. Reflecting these differences, pay type also varies by region and country. For example, about eight in ten (83%) Indian immigrants have a college degree compared with about half of Chinese (56%) and Filipino (52%) immigrants, and consequently are more likely to be salaried (67% vs. 51% vs. 32%, respectively). English proficiency also makes a difference, with half of Asian immigrants with LEP working hourly jobs, compared to about one in three (32%) who are English proficient.

Roughly Half Of Employed Asian Immigrants Are Salaried

About one in five (22%) employed Asian immigrants say they are overqualified for their current jobs, that is, having more skills and education than the job requires, including about three in ten (31%) lower income Asian immigrants. Employed Asian immigrants with a college degree or higher (22%) or with some college education (33%) are more likely to feel overqualified than those with a high school education or less (9%). Similarly, those with lower incomes (less than $40,000 per year) (31%) are more likely to feel this way compared those with higher incomes (at least $90,000 per year) (18%). These data likely reflect some Asian immigrants taking jobs different from their previous work or training in their countries of origin, as described by some focus group participants.

In Their Own Words: Feelings of Being Overqualified among Asian Immigrant Focus Group Participants

In focus groups, Asian immigrants described taking jobs that required less skills and education compared to those they held in their country of birth.

“I used to work a white-collar job, now I do manual labor. My major [college course program] used to hurt my mind, now it’s my arms and legs.” – 41-year-old Vietnamese immigrant woman in Texas

“When I was in Vietnam, I owned a business, but when I moved here, I worked in a dentist’s office, I had to learn from scratch.” – 58-year-old Vietnamese immigrant woman in California

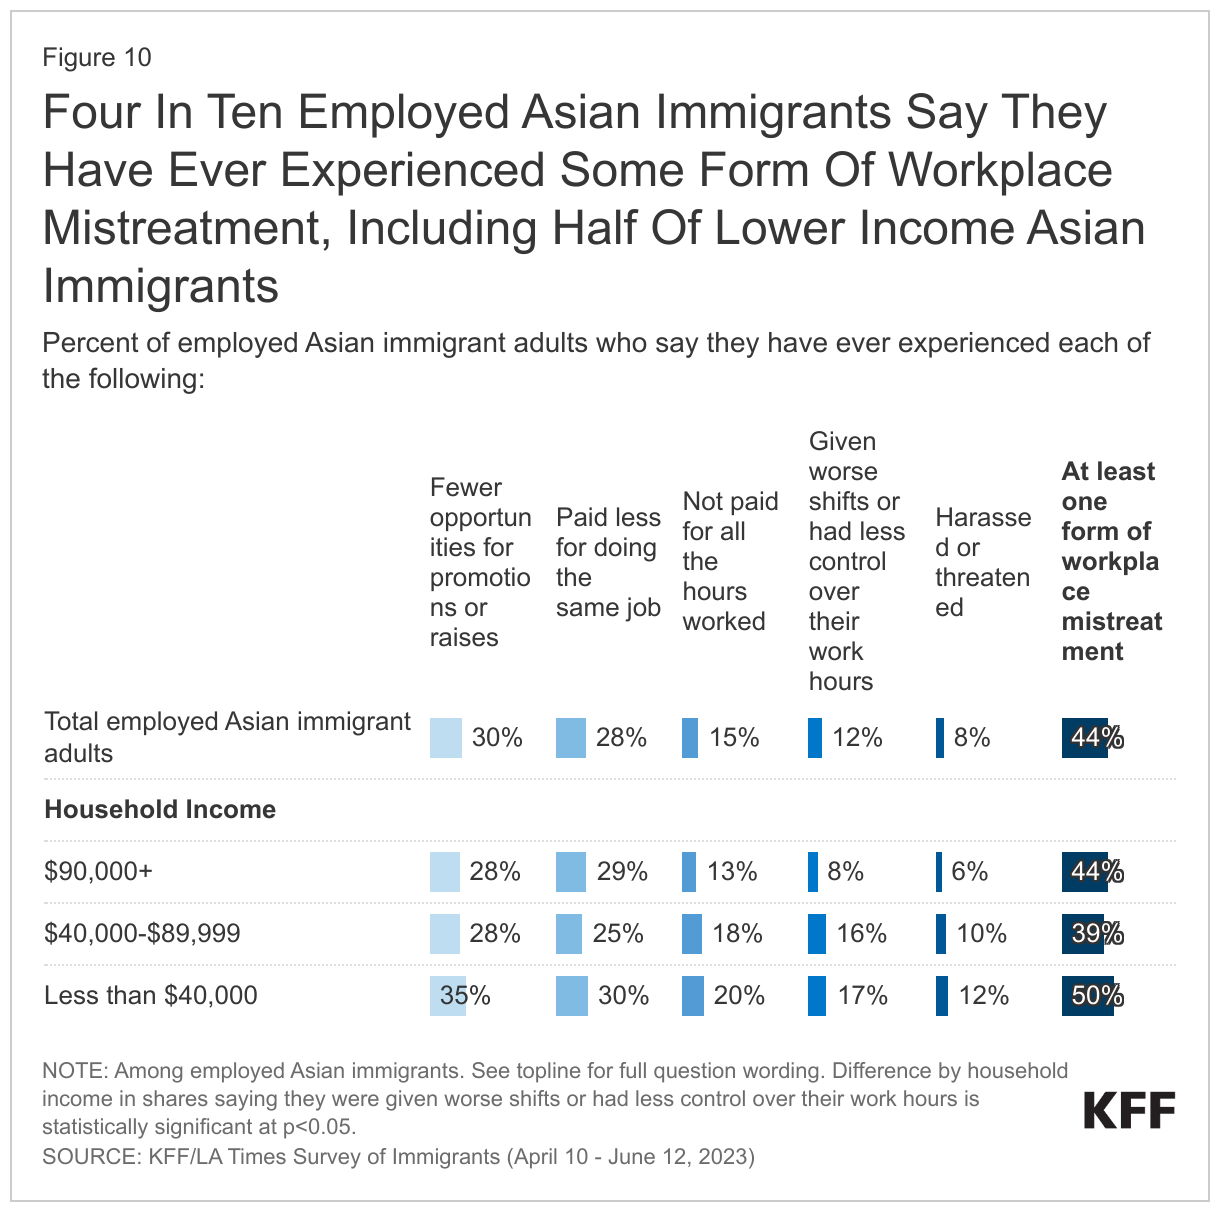
About four in ten (44%) employed Asian immigrants say they have ever experienced at least one form of workplace mistreatment in the U.S. asked about in the survey. These include being given fewer opportunities for promotion (30%), being paid less (28%), not getting paid for all the hours they worked or for overtime (15%), being given worse shifts (12%) than their U.S.-born counterparts, or being harassed or threatened in the workplace because they are an immigrant (8%) (Figure 10). The share who say they were given worse shifts or had less control over their work hours is about twice as high for lower income Asian immigrants (less than $40,000 per year) compared to their higher income counterparts (at least $90,000 per year) (17% vs. 8%).

Four In Ten Employed Asian Immigrants Say They Have Ever Experienced Some Form Of Workplace Mistreatment, Including Half Of Lower Income Asian Immigrants

Asian immigrants have higher incomes than immigrants overall, but income varies widely among subgroups in part due to variations in educational attainment. Many Asian immigrants come to the U.S. on H-1B visas, which are used by the U.S. government to employ immigrants in highly specialized and often technical fields, which has a direct impact on the types of industries Asian immigrants work in as well as on their incomes. Consequently, about four in ten (41%) Asian immigrants live in households with annual incomes of at least $90,000 and an additional one in three (29%) live in households with annual incomes of $40,000 to less than $90,000. About one in four (27%) live in households with lower incomes (less than $40,000 per year). However, income varies widely among Asian immigrants. Those from India (62%) are much more likely to have higher household income (at least $90,000 per year) compared with those from China (41%) and the Philippines (37%). Overall, immigrants from South Asia (51%) are more likely than immigrants from East or Southeast Asia (36%) to have higher household incomes (at least $90,000 per year). This pattern likely reflects differences in educational attainment as about eight in ten Indian immigrants are college graduates compared with about half of Chinese and Filipino immigrants.

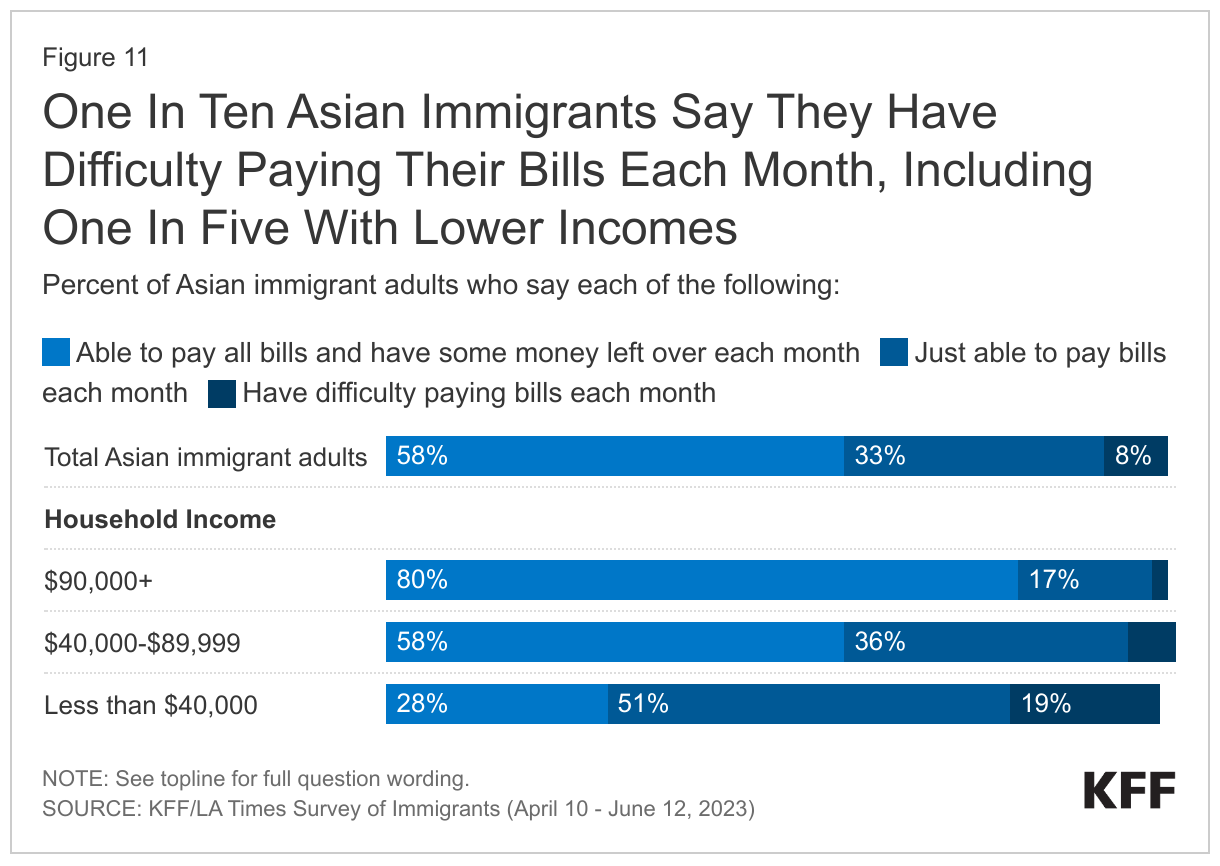
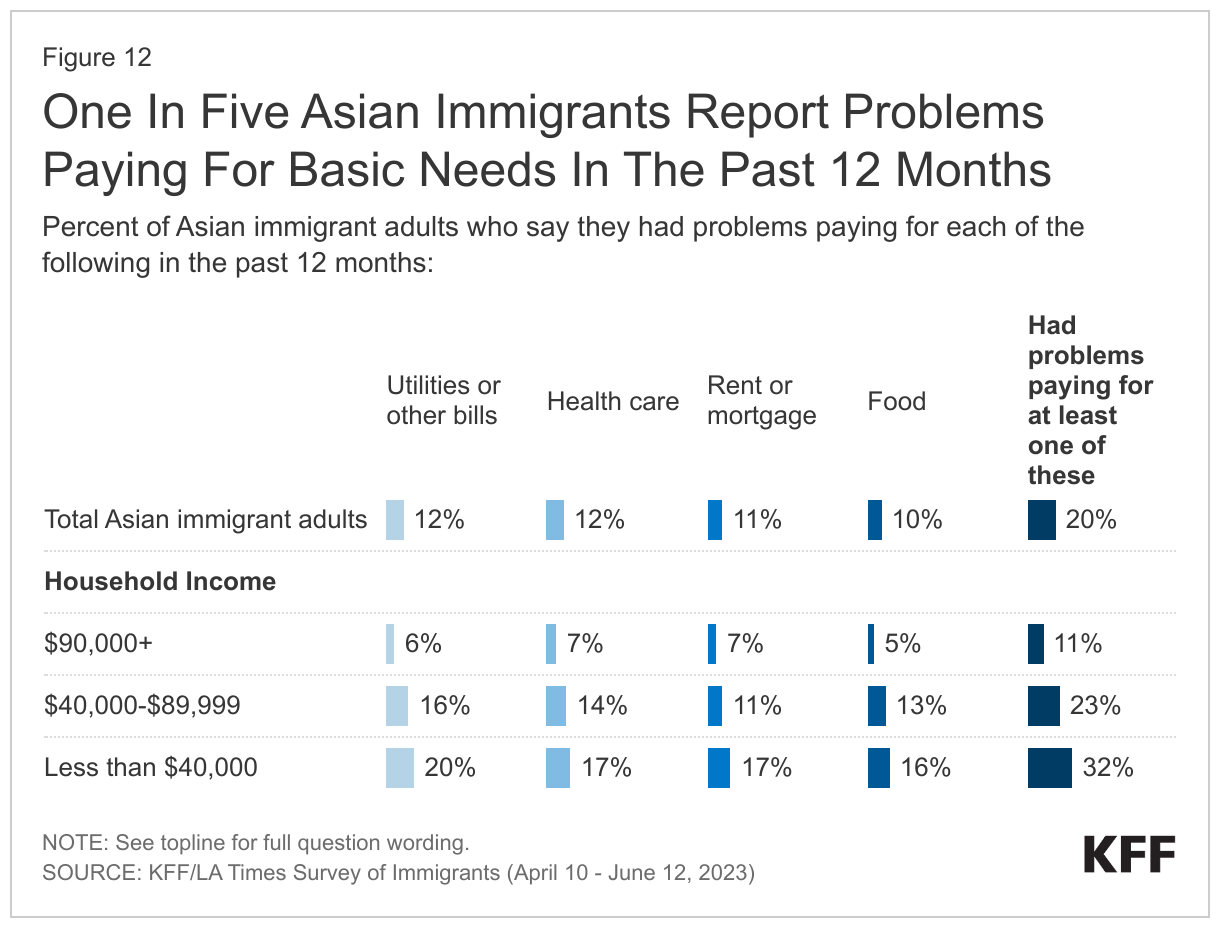
Reflecting these income patterns, most Asian immigrants do not report problems paying for basic needs or monthly bills, but those with lower incomes report more financial difficulties. Most (58%) Asian immigrants say they are able to pay all their monthly bills and have some money left over, (33%) say they are just able to pay their monthly bills, and about one in ten (8%) say they have difficulty paying their bills each month. However, the share who say they have difficulty paying their monthly bills rises to about one in five (19%) among those with lower household incomes (less than $40,000 per year) (Figure 11). Similarly, one in five (20%) Asian immigrants overall say they had problems paying for necessities such as housing, food, health care, or utilities in the past 12 months, but roughly one in three (32%) of those with lower incomes (less than $40,000 per year) say this (Figure 12).

One In Ten Asian Immigrants Say They Have Difficulty Paying Their Bills Each Month, Including One In Five With Lower Incomes

One In Five Asian Immigrants Report Problems Paying For Basic Needs In The Past 12 Months

Health And Health Care Experiences

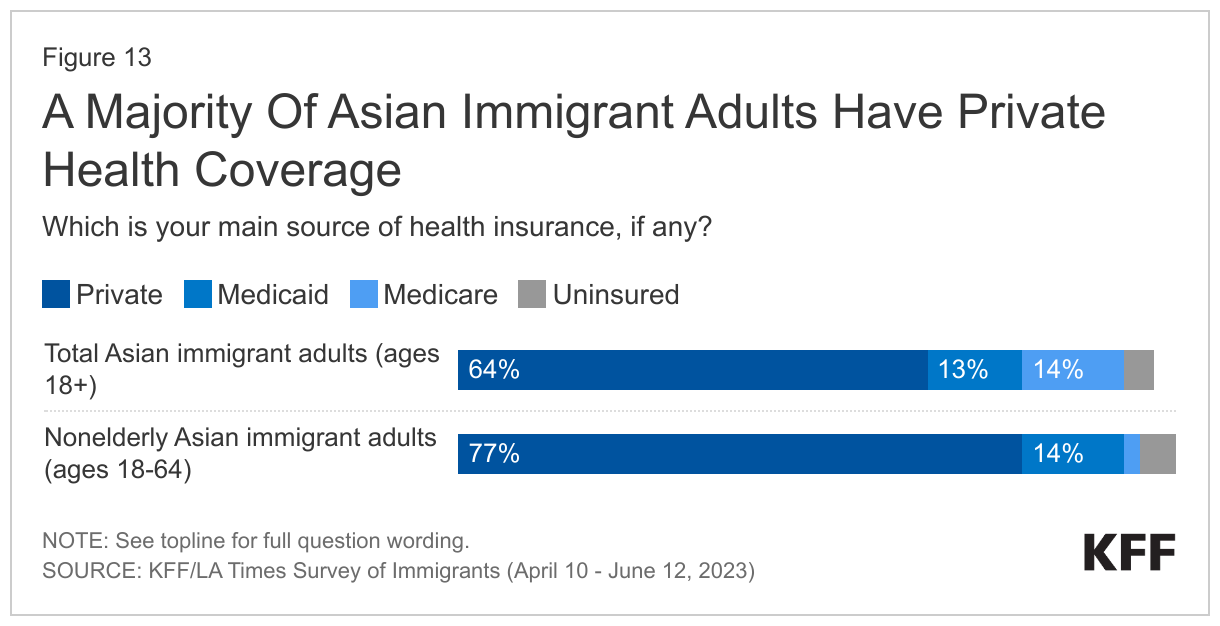
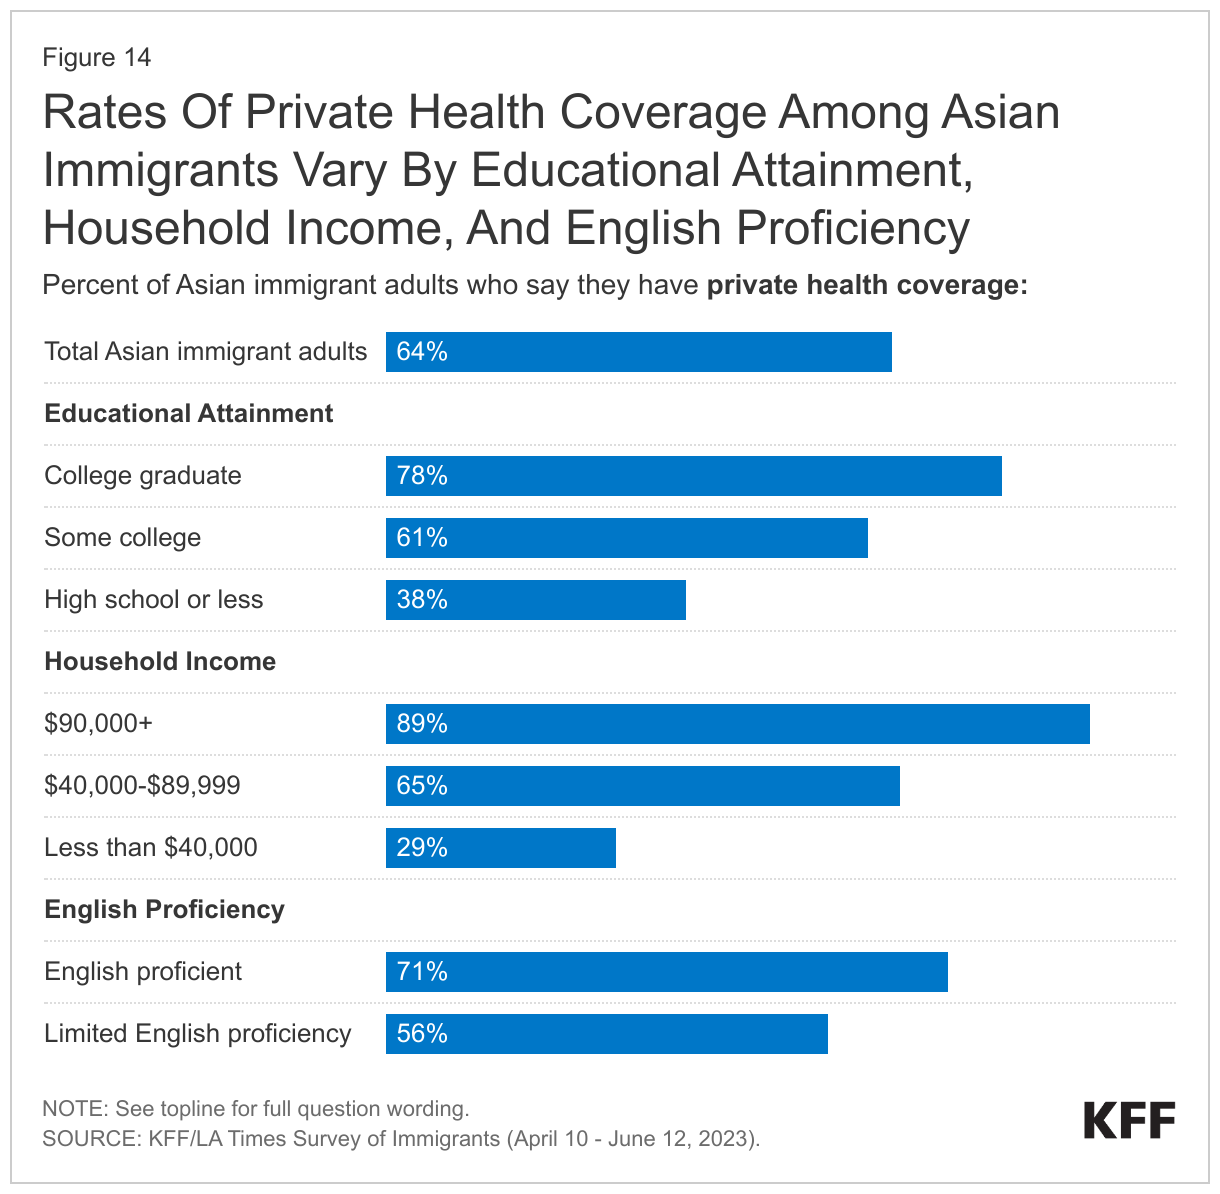
Reflecting their job patterns, a majority (64%) of Asian immigrant adults report having private health insurance coverage and only 4% report being uninsured (Figure 13). High rates of private coverage and low uninsured rates among Asian immigrant adults likely reflect their higher incomes as well as higher rates of employment in management, business, and science occupations, which are more likely to offer employer-sponsored coverage. Asian immigrants with higher educational attainment (78%), higher incomes (at least $90,000 per year) (89%), and those who are English proficient (71%), are more likely than their lower educational attainment (38%), lower income (less than $40,000 per year) (29%), and LEP (56%) counterparts to have private health coverage (Figure 14).

A Majority Of Asian Immigrant Adults Have Private Health Coverage

Rates Of Private Health Coverage Among Asian Immigrants Vary By Educational Attainment, Household Income, And English Proficiency

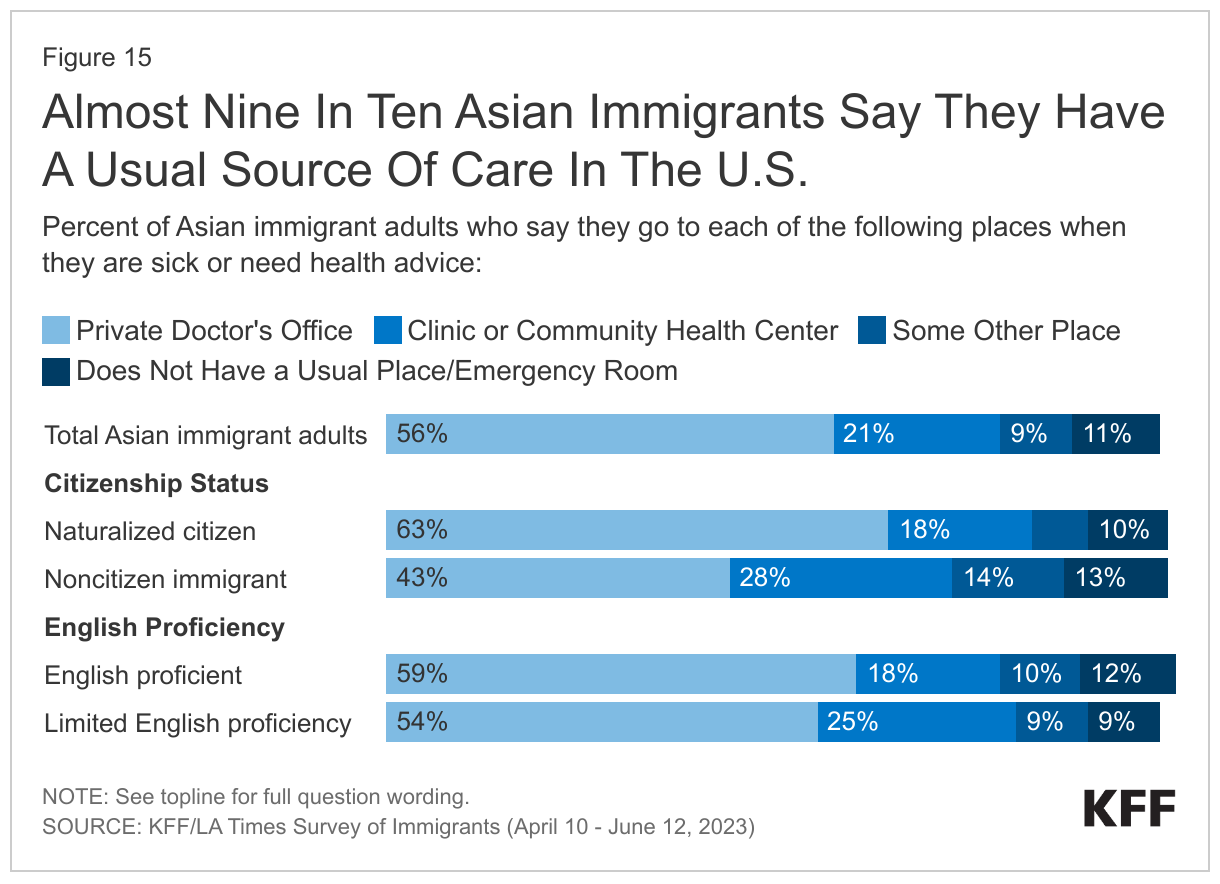
The large majority of Asian immigrants have a usual source of care and a trusted health care provider in the U.S. Reflecting their high rates of health coverage, roughly nine in ten (86%) Asian immigrant adults say they have a place other than an emergency room where they usually go when they are sick or need health advice, with most saying they go to a private doctor’s office (56%) and about one in five (21%) saying they use a community health center (CHC) (Figure 15). Use of CHCs as a usual source of care is higher among Asian immigrants who are noncitizens (28%) and those with LEP (25%) compared with their citizen (18%) and English proficient (18%) counterparts, reflecting their role as a national network of safety-net primary care providers serving low-income and medically underserved communities. Research shows that CHCs offer linguistically and culturally competent care to underserved racial and ethnic groups as well as people with LEP and that these services can positively impact patient satisfaction. About eight in ten Asian immigrants (84%) say they have a trusted health care provider in the U.S. However, noncitizens are less likely than citizens to say they have a trusted provider (74% vs. 90%).

Almost Nine In Ten Asian Immigrants Say They Have A Usual Source Of Care In The U.S.

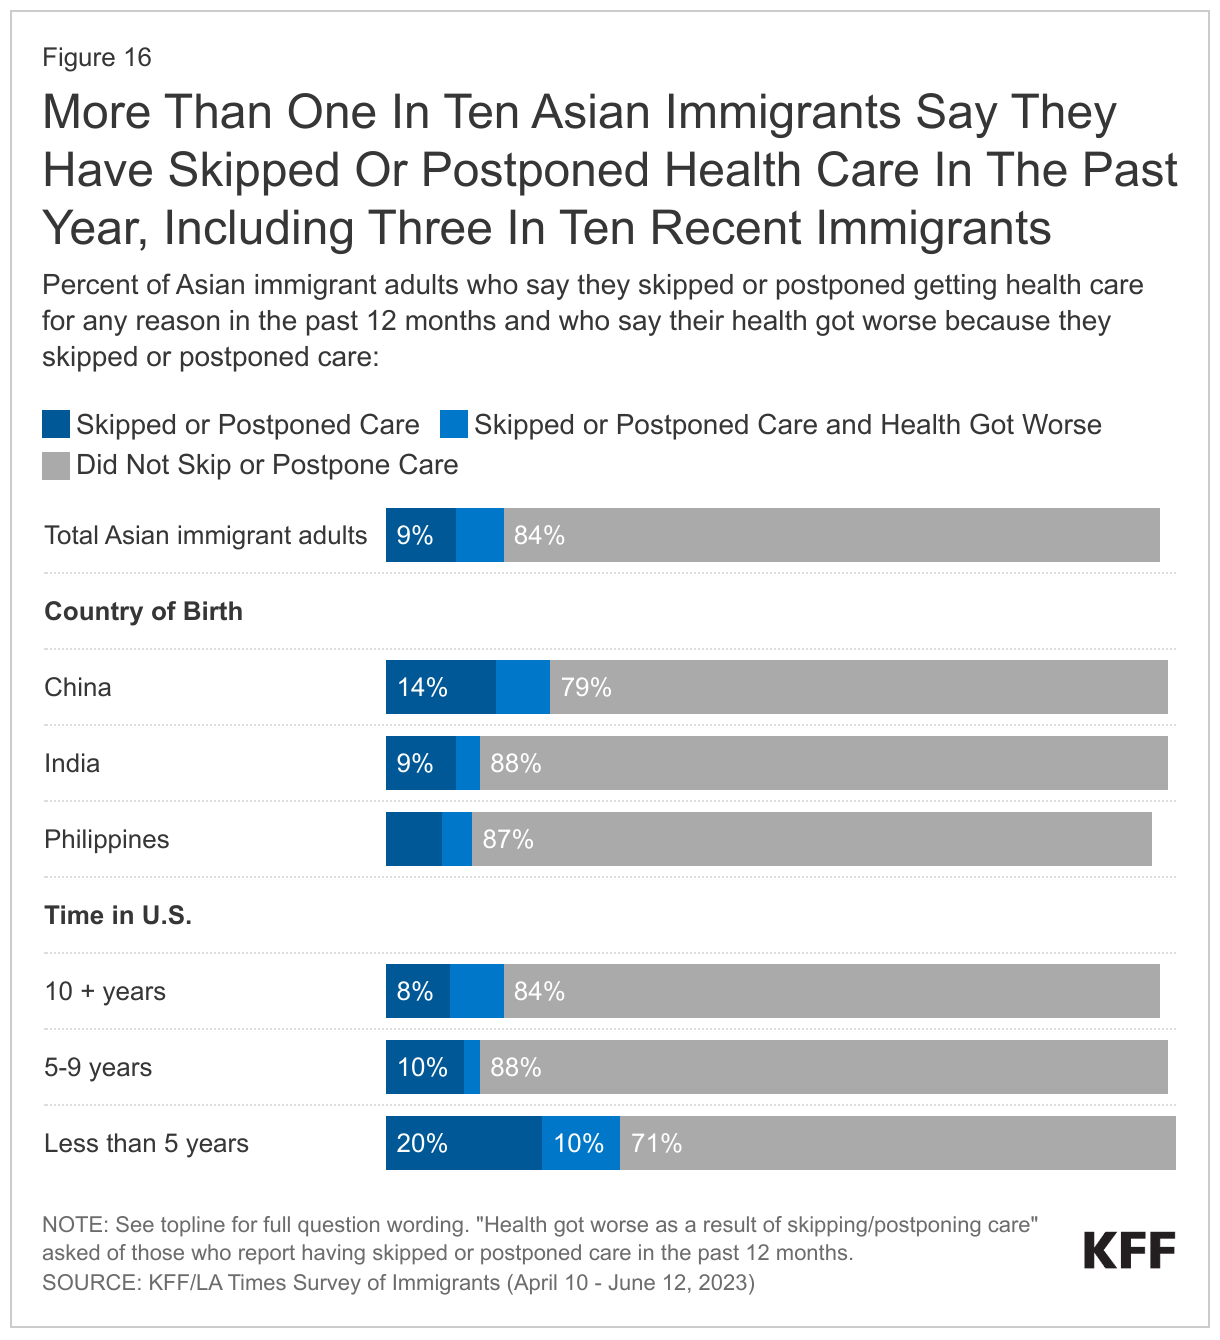
Reflecting that most Asian immigrants have health coverage and a regular source of care, about one in seven (16%) say they skipped or postponed health care services in the past year, but this share rises to about three in ten (29%) among recent immigrants. (Figure 16). Chinese immigrants (21%) also are more likely than Indian (12%) and Filipino (11%) immigrants to say they went without or postponed health care even though there are no significant differences in rates of health coverage and in the shares saying they have a usual source of care by country of birth, suggesting that the differences could be driven by cultural and linguistic barriers experienced by Chinese immigrants or other unidentified factors. Overall, 6% of Asian immigrants (representing 40% of those who skipped or postponed care) say their health got worse as a result of skipping or postponing care.

More Than One In Ten Asian Immigrants Say They Have Skipped Or Postponed Health Care In The Past Year, Including Three In Ten Recent Immigrants

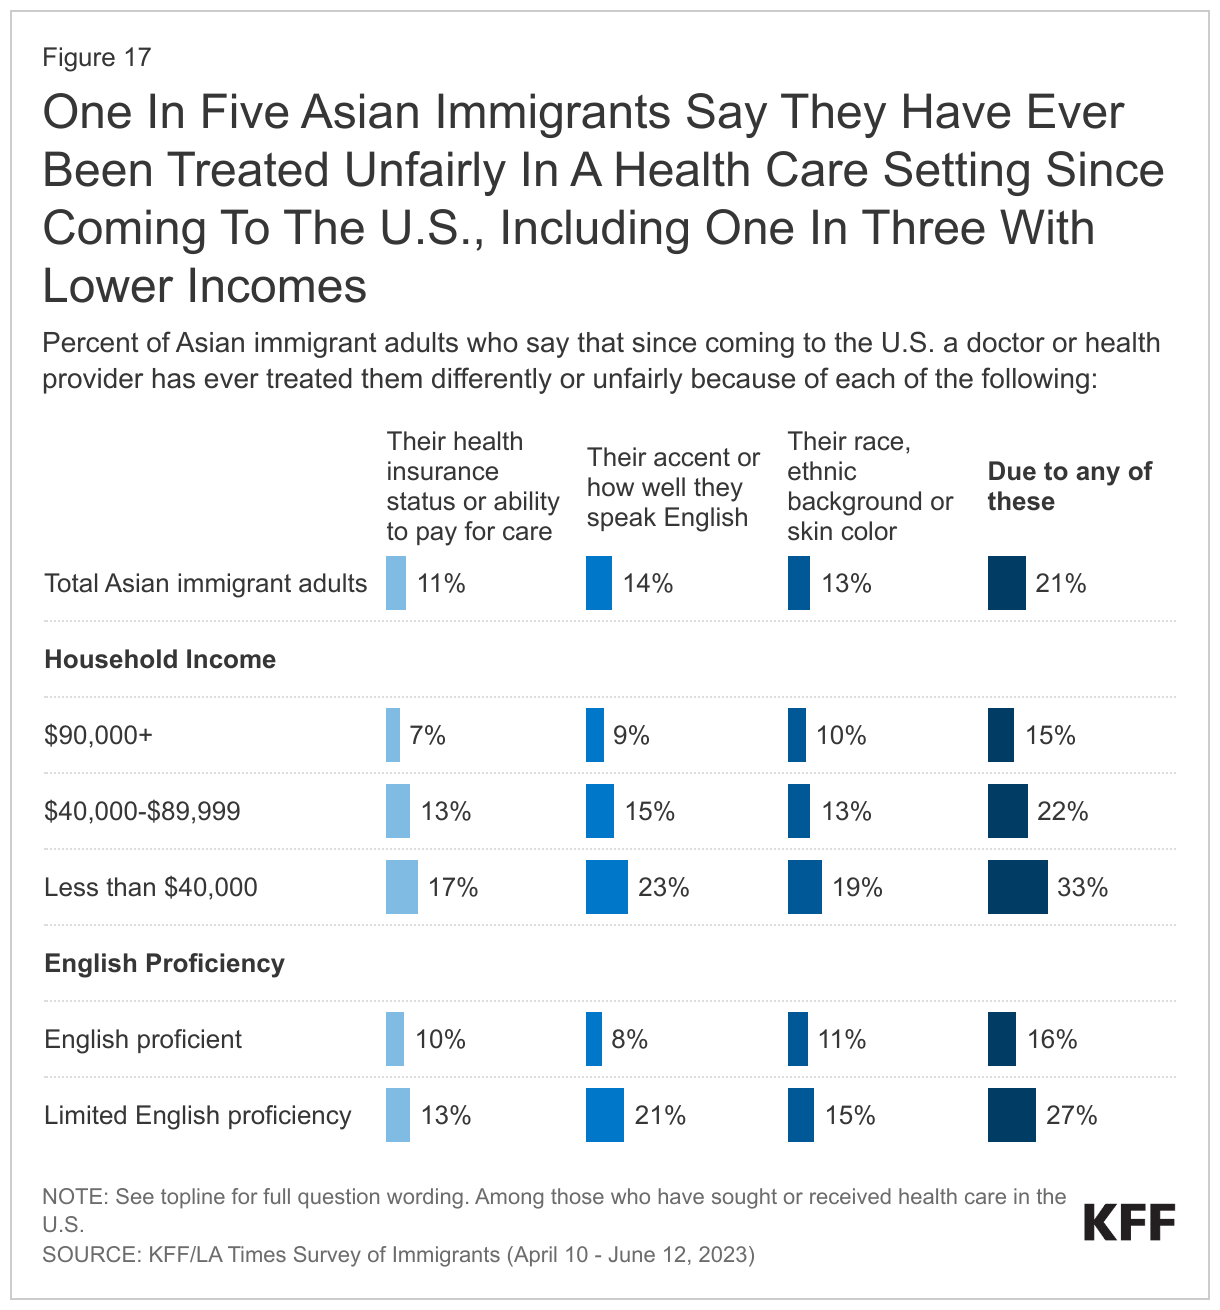
About one in five (21%) Asian immigrants who have sought or received health care in the U.S. say they have ever been treated unfairly by a health care provider, with those who are lower income reporting higher levels of unfair treatment than their higher income counterparts. Overall, 14% of Asian immigrants say they have ever been treated unfairly by a health care provider due to their accent or ability to speak English, 13% report unfair treatment due to their racial or ethnic background or skin color, and 11% cite unfair treatment due to their insurance status or ability to pay (Figure 17). A third (33%) of lower income (less than $40,000 per year) Asian immigrants say that they experienced discrimination or unfair treatment in a health care setting for at least one of these reasons compared with 15% of higher income (at least $90,000 per year) Asian immigrants. Asian immigrants with LEP (27%) also are more likely than their English proficient counterparts (16%) to say they experienced unfair treatment when seeking health care, including one in five (21%) who say it was due to their accent or ability to speak English.

One In Five Asian Immigrants Say They Have Ever Been Treated Unfairly In A Health Care Setting Since Coming To The U.S., Including One In Three With Lower Incomes

Confusion and Worries About Immigration Policies

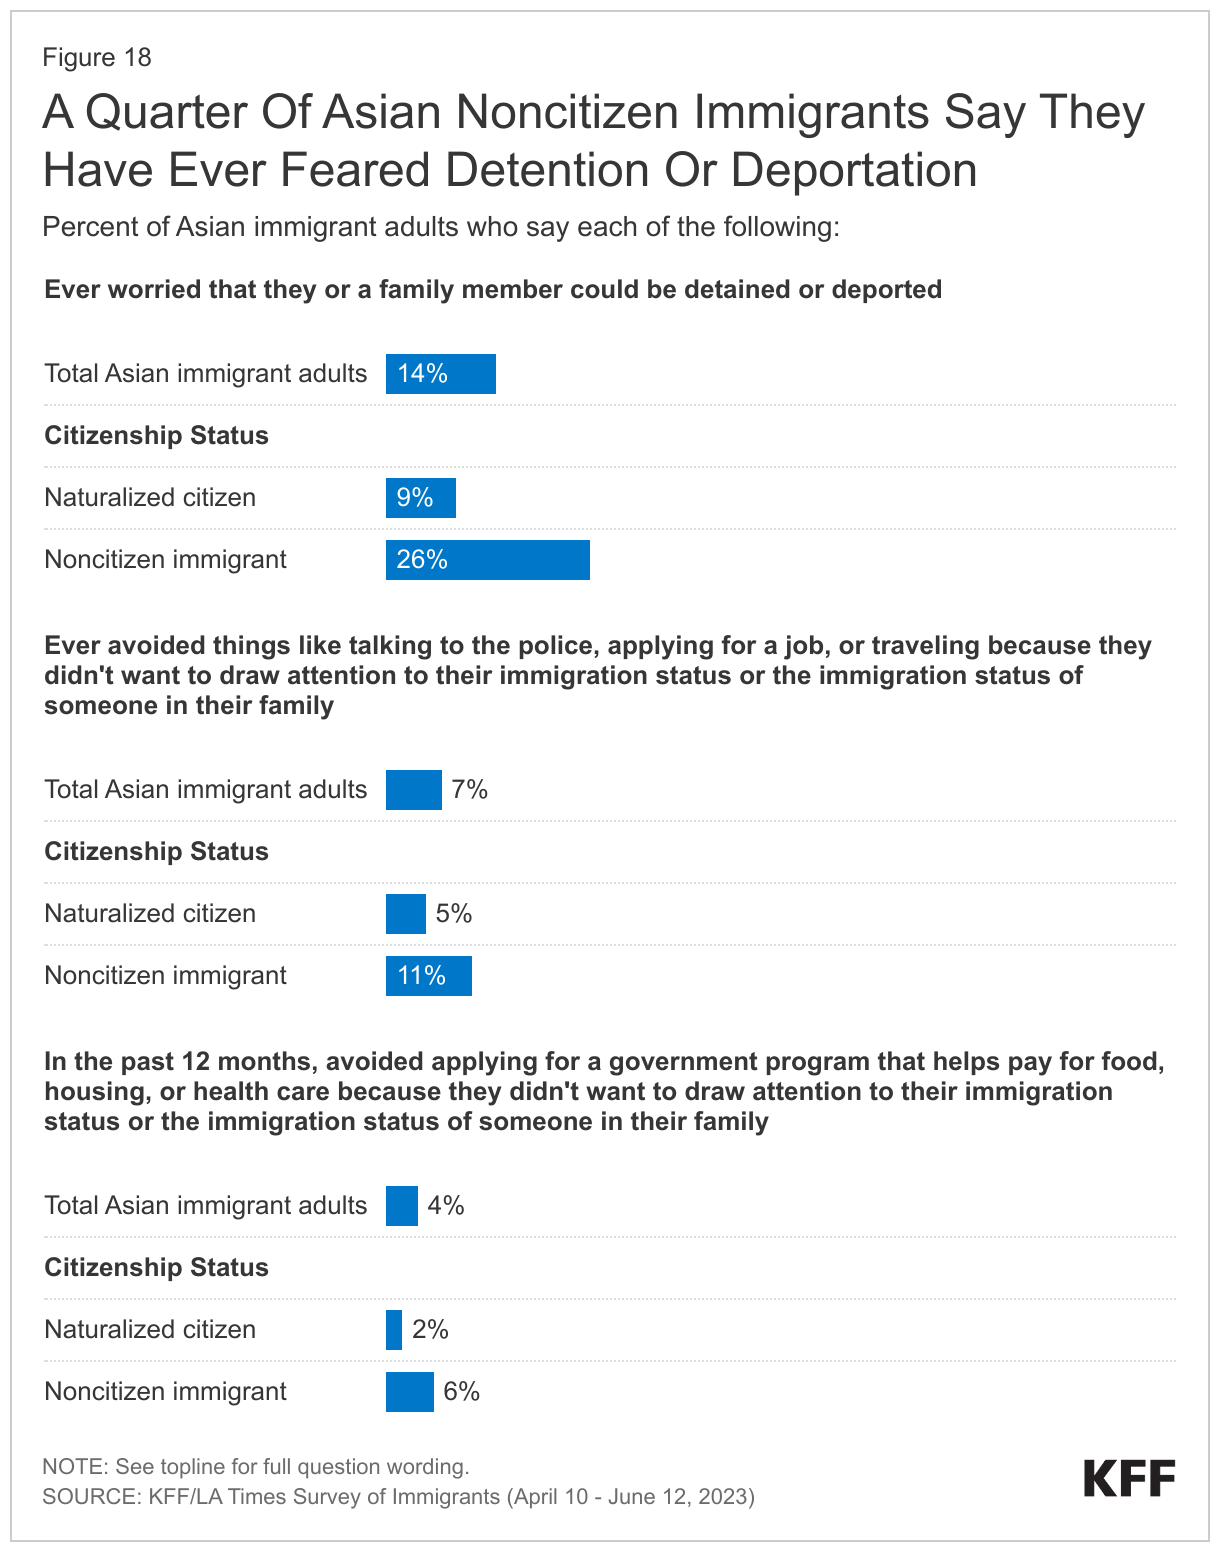
While only 5% of Asian immigrants are likely undocumented, 14% of Asian immigrants overall and 26% of those who are noncitizens say they have ever worried that they or a family member could be detained or deported. Moreover, 7% of Asian immigrants overall and 11% of those who are noncitizens say immigration-related fears have led them to avoid things such as talking to the police, applying for a job, or traveling (Figure 18). Only 4% of Asian immigrants overall say they have avoided applying for a government program that helps pay for food, housing, or health care in the past 12 months because they didn’t want to draw attention to their immigration status or the immigration status of someone in their family. This could partly reflect limited need for these types of assistance given that most Asian immigrants do not report financial challenges.

A Quarter Of Asian Noncitizen Immigrants Say They Have Ever Feared Detention Or Deportation

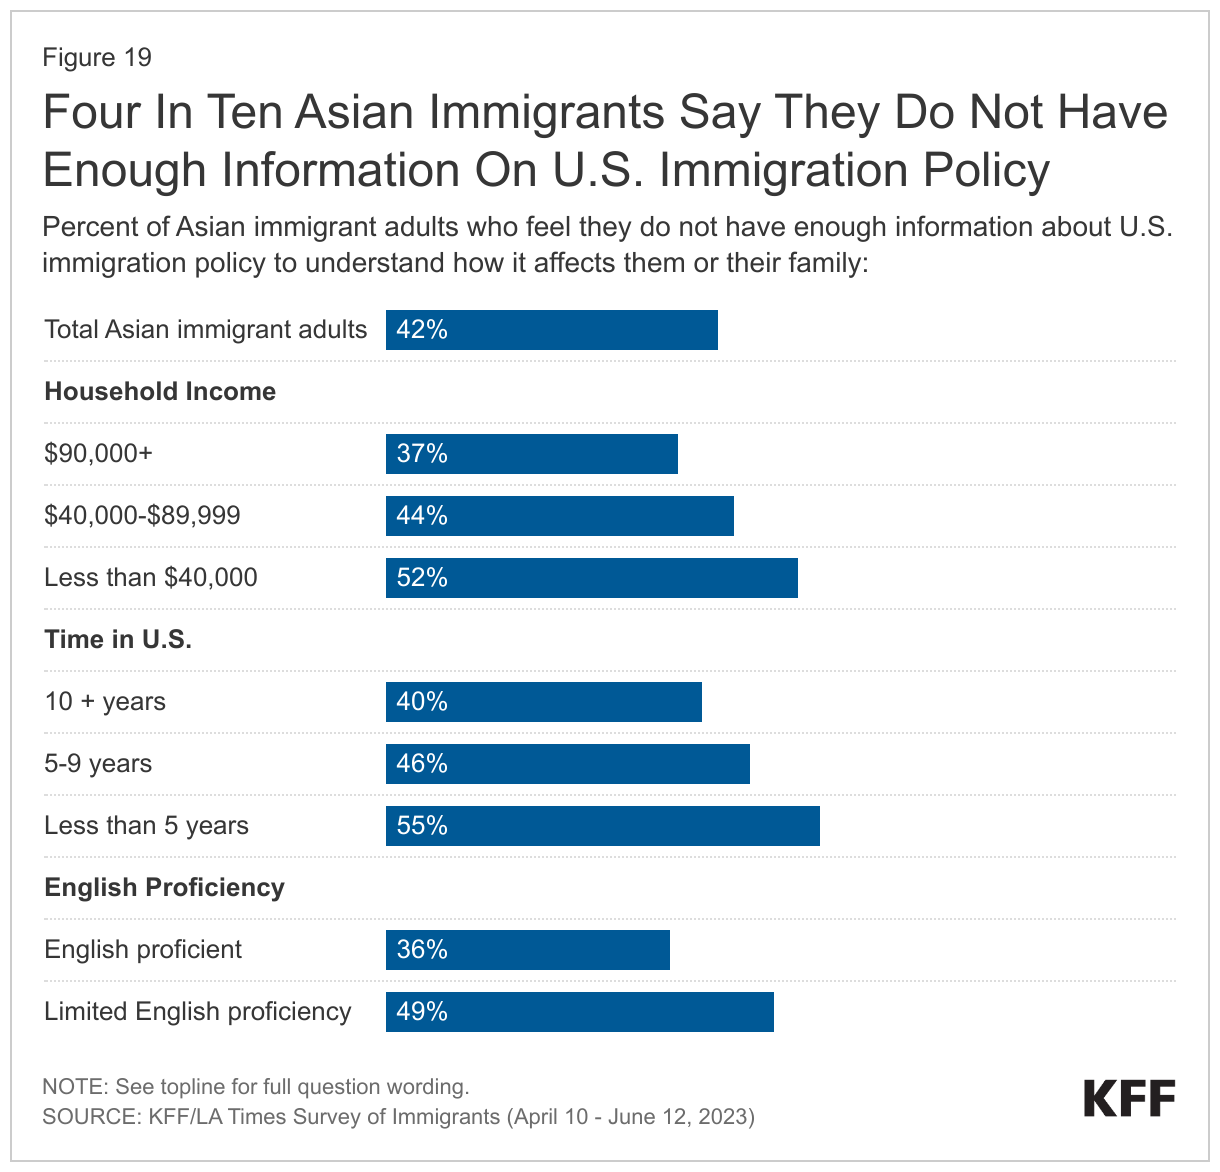
About four in ten (42%) Asian immigrants say they do not have enough information about U.S. immigration policy to understand how it affects them or their family, with shares higher among those with lower incomes, those who have been in the U.S. fewer than five years, and those with LEP (Figure 19). About half of Asian immigrants with lower incomes (less than $40,000 per year) (52%), who have been in the U.S. for fewer than five years (55%), and with LEP (49%) say they do not have enough information about U.S. immigration policies as compared to about four in ten with higher incomes (at least $90,000 per year) (37%), who have been in the country for 10 or more years (40%), and who are English proficient (36%).

Four In Ten Asian Immigrants Say They Do Not Have Enough Information On U.S. Immigration Policy

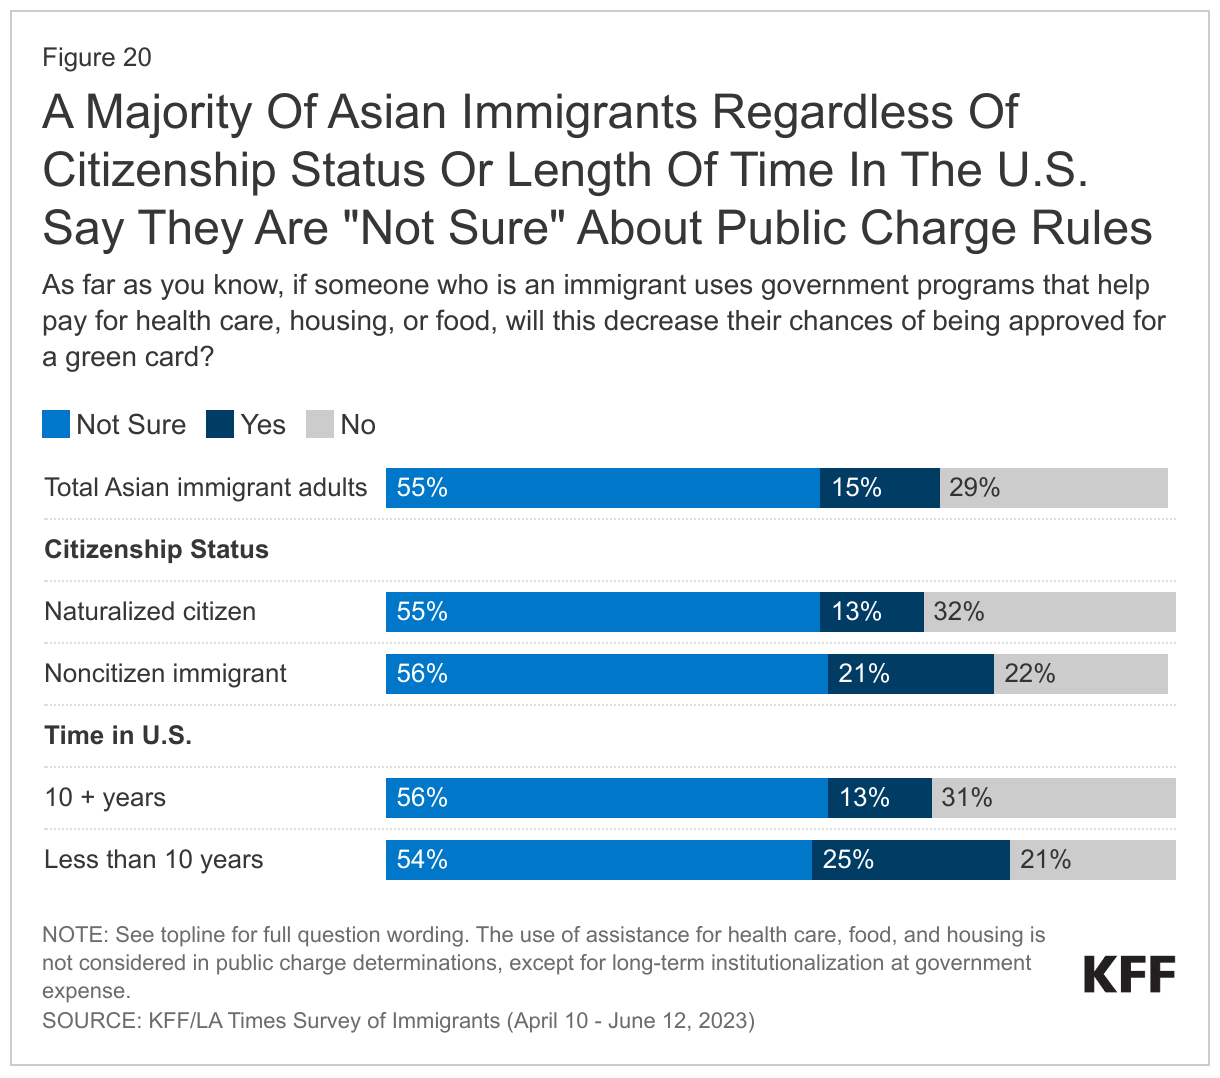
Most Asian immigrants are uncertain about how using assistance for food, housing, and health care may affect one’s immigration status. Under longstanding U.S. policy, federal officials can deny an individual entry to the U.S. or adjustment to lawful permanent resident status (a green card) if they determine the individual is a “public charge” based on their likelihood of becoming primarily dependent on the government for subsistence. In 2019, the Trump Administration made changes to public charge policy that newly considered the use of previously excluded noncash assistance programs for health care, food, and housing in public charge determinations. However, this policy was rescinded by the Biden Administration in 2021, meaning that the use of assistance for health care, food, and housing is not considered for public charge tests, except for long-term institutionalization at government expense. However, a majority (55%) of Asian immigrants say they are “not sure” whether use of public programs that help pay for health care, housing, or food can decrease one’s chances for green card approval and another 15% incorrectly believe this to be the case (say “yes”) (Figure 20). Among Asian immigrants, noncitizens (21%) and those who have been in the country for less than 10 years (25%) are more likely to report an incorrect understanding of the rules compared to their citizen (13%) and 10+ year (13%) immigrant counterparts.

A Majority Of Asian Immigrants Regardless Of Citizenship Status Or Length Of Time In The U.S. Say They Are &quot;Not Sure&quot; About Public Charge Rules

Acknowledgements

KFF would like to thank the Association of Asian Pacific Community Health Organizations, the Black Alliance for Just Immigration, Dr. May Sudhinaraset, the National Immigration Law Center, the National Resource Center for Refugees, Immigrants, and Migrants, and UnidosUS for their invaluable inputs, insights, and suggestions throughout the planning, fielding, and dissemination of this survey project.

Methodology

The KFF/LA Times Survey of Immigrants is a partnership survey conducted by KFF and the LA Times examining the U.S. immigrant experience.

The survey was conducted April 10-June 12, 2023, online, by telephone, and by mail among a nationally representative sample of 3,358 immigrants, defined as adults living in the U.S. who were born outside the U.S. and its territories. Respondents had the option to complete the survey in one of ten languages: English (n=2,435), Spanish (n=627), Chinese (n=171), Korean (n=52), Vietnamese (n=22), Portuguese (n=16), Haitian-Creole (n=13), Arabic (n=9), French (n=9), and Tagalog (n=4). These languages were chosen as they are most commonly spoken by immigrant adults from countries of focus for the survey with limited English proficiency (LEP), based on the 2021 American Community Survey (2021).

Teams from KFF and The Los Angeles Times worked together to develop the questionnaire and both organizations contributed financing for the survey. KFF researchers analyzed the data, and each organization bears the sole responsibility for the work that appears under its name. Sampling, data collection, weighting, and tabulation were managed by SSRS of Glenn Mills, Pennsylvania in collaboration with public opinion researchers at KFF.

Respondents were reached through one of three sampling modes: an address-based sample (ABS) (n=2,661); a random digit dial telephone (RDD) sample of prepaid (pay-as-you go) cell phone numbers (n=565); and callbacks to telephone numbers that that were previously randomly sampled for RDD surveys and were identified as speaking a language other than English or Spanish (n=132). Respondents from all three samples were asked to specify their country of birth and qualified for the survey if they were born outside of the U.S.

Project design was informed by a pilot study conducted from January 31-March 14, 2022 among a sample of 1,089 immigrants in collaboration with SSRS. Prior to fielding the pilot study, KFF and SSRS conducted interviews with experts who had previous experience surveying immigrants. These conversations informed decisions on sampling, modes of data collection, recruitment strategies, and languages of interviews. The pilot test measured incidence of immigrant households across four different sample types and offered a short survey in 8 different languages both online and on the telephone. Based on the results of the pilot test, the following recruitment and data collection protocol was implemented:

Sampling strategy and interview modes:

The ABS was divided into areas (strata), defined by Census tract, based on the incidence of immigrants among the population overall and by countries of origin. Within each stratum, the sample was further divided into addresses that were flagged by Marketing Systems Group (MSG) as possibly occupied by foreign-born adults and unflagged addresses. To increase the likelihood of reaching immigrant adults, strata with higher incidence of immigrant households overall, and of immigrants from certain countries of origin were oversampled.

Households in the ABS were invited to participate through multiple mail invitations: 1) an initial letter in English with a short paragraph of instructions in each of the 10 survey languages on the back; 2) a reminder postcard in English plus up to two additional languages; 3) a follow-up letter accompanied by hardcopy questionnaires in English and one additional language; and 4) a final reminder including short messages in all 10 languages. For mailings 2 and 3, additional languages were chosen by using flags to identify the language other than English likely spoken at home. Invitation letters requested the household member ages 18 or older who was born outside of the U.S. with the most recent birthday to complete the survey in one of three ways: by going online, dialing into a toll-free number, or returning the completed paper questionnaire. In addition, interviewers attempted outbound calls to telephone numbers that were matched to sampled addresses. ABS respondents completed the survey online (n=2,087), over the phone (n=105), or by mail on paper (n=469). The random sample of addresses was provided by MSG.

The RDD sample of prepaid (pay-as-you-go) cell phone numbers was obtained through MSG. The prepaid cell phone component was disproportionately stratified to effectively reach immigrants from different countries based on county-level information. To increase the likelihood of reaching immigrant adults, counties with higher incidence of immigrants overall, and of certain countries of origin were oversampled.

The callback sample included 132 respondents who were reached by calling back telephone numbers that were previously randomly sampled for SSRS RDD surveys within two years and coded by interviewers as non-English or non-Spanish speaking.  as having respondents speaking languages other than English or Spanish.

Incentives:

Initial mailings to the ABS sample included $2 as part of the invitation package, and respondents received a $10 incentive if they completed the survey in the first two weeks after the initial mailing. In order to increase participation among under-represented groups, the incentive increased to $20 for those who did not respond within the first two weeks. ABS phone respondents received this incentive via a check received by mail, paper respondents received a Visa gift card by mail, and web respondents received an electronic gift card incentive. Respondents in both phone samples received a $25 incentive via a check received by mail.

Questionnaire design and translation:

In addition to collaboration between KFF and the LA Times, input from organizations and individuals that directly serve or have expertise in issues facing immigrant populations helped shaped the questionnaire. These community representatives were offered a modest honorarium for their time and effort to review questionnaire drafts, provide input, attend meetings, and offer their expertise on dissemination of findings.

After the content of the questionnaire was largely finalized, SSRS conducted a telephone pretest in English and adjustments were made to the questionnaire. Following the English pretest, Research Support Services Inc. (RSS) translated the survey instrument from English into the nine languages outlined above and performed cognitive testing through qualitative interviews in all languages including English. The results of the cognitive testing were used to adjust questionnaire wording in all languages including English to ensure comprehension and cohesiveness across languages and modes of interview. As a final check on translation and its overlay into the web and CATI program, translators from Cetra Language Solution reviewed each question, as it appears in the program, and provided feedback. The questionnaire was revised and finalized based on this feedback.

Data quality checks:

A series of data quality checks were run on the final data. The online questionnaire included two questions designed to establish that respondents were paying attention and cases were monitored for data quality. Fifteen cases were removed from the data because they failed two or more quality checks, failed both attention check questions, or skipped over 50% of survey questions. An additional 67 interviews were removed after deemed ineligible by SSRS researchers (they were not U.S. immigrants).

Weighting:

The combined sample was weighted to adjust for the sampling design and to match the characteristics of the U.S. adult immigrant population, based on data from the Census Bureau’s 2021 American Community Survey (ACS). Weighting was done separately for each of 11 groups defined by country or region of origin (Mexico, China, Other East/Southeast Asia, South Asia, Europe, Central America, South America, Caribbean, Middle East/North Africa, Sub-Sahara Africa, all others). The samples were weighted by sex, age, education, race/ethnicity, census region, number of adults in the household, presence of children in the household, home ownership, time living in the U.S., English proficiency, and U.S. citizenship. The overall sample was also weighted to match the share of U.S. adult immigrants from each country/region of origin group. The weights take into account differences in the probability of selection for each of the three sample types. This includes adjustment for the sample design and geographic stratification, and within household probability of selection. Subgroup analysis includes data checks to ensure that the weighted demographics of subgroups are within reasonable range from benchmarks whenever possible.

The margin of sampling error including the design effect for the full sample is plus or minus 2 percentage points. Numbers of respondents and margins of sampling error for key subgroups are shown in the table below. For results based on other subgroups, the margin of sampling error may be higher. Sample sizes and margins of sampling error for other subgroups are available by request. Sampling error is only one of many potential sources of error and there may be other unmeasured error in this or any other public opinion poll. KFF public opinion and survey research is a charter member of the Transparency Initiative of the American Association for Public Opinion Research.

GroupN (unweighted)M.O.S.E.
Total3,358± 2 percentage points
Race/Ethnicity
Black immigrants274± 8 percentage points
Hispanic immigrants1,207± 4 percentage points
Asian immigrants1,318± 4 percentage points
White immigrants495± 6 percentage points
Immigration Status
Naturalized citizen2,134± 3 percentage points
Green card or valid visa holder819± 5 percentage points
Likely undocumented372± 6 percentage points
English Proficiency
Speaks English only or “very well”1,713± 3 percentage points
Speaks English “less than very well”1,635± 3 percentage points

Focus group methodology:

As part of this project, KFF conducted 13 focus groups with immigrant adults across the country to help inform survey questionnaire development, provide deeper insights into the experiences of immigrant groups that had a smaller sample size in the survey, and to provide a richer understanding of some of the survey findings.

Two rounds of focus groups were completed. The first round of 6 groups was conducted between September-October 2022 virtually among participants living across the country who are Hispanic immigrants (conducted in Spanish), Asian (excluding Chinese) immigrants (conducted in English), or Chinese immigrants (conducted in Mandarin Chinese). The groups were separated by gender, lasted 90 minutes, and included 5-7 participants each.

The second round of groups were conducted in-person between May-June 2023 in Los Angeles, CA and Fresno, CA with Hispanic immigrants conducted in Spanish; and in Houston, TX and Irvine, CA with Vietnamese immigrants conducted in Vietnamese. In addition, virtual groups were conducted among participants living in the Texas border region (Hispanic immigrants), the Miami, FL region (Haitian immigrants), and nationally (Black immigrants from sub-Saharan Africa). Groups were mixed gender, lasted between 90 minutes and two hours, and were conducted in English, Spanish, Vietnamese, and Haitian-Creole with 5-8 participants each.

For each group, participants were chosen based on the following criteria: Must be at least 18 years of age and have been born outside of the U.S. and its territories; for groups conducted in languages other than English, must speak English “less than very well” and be able to speak conversationally in the group’s language (i.e., Spanish). In addition, groups were chosen to represent a mix of household composition, including at least some participants who are parents; a mix of household income levels, with a preference for recruiting lower income participants; a mix of health insurance types; and a mix of immigration statuses. Goodwin Simon Strategic Research (GSSR) recruited and hosted the first round of focus groups. PerryUndem recruited and hosted the second round of focus groups. The screener questionnaire and discussion guides were developed by researchers at KFF in consultation with the firms who recruited and hosted the groups. Groups were audio and video recorded with participants’ permission. Each participant was given $150-$175 after participating.

Endnotes

  1. The sample includes 1,318 adults who self-identified as Asian or, in a small number of cases, as Pacific Islander. ↩︎
  2. Country of birth-level estimates among Asian immigrants are only available for China, India, and the Philippines due to sample size limitations. China includes Macau, Hong Kong, Taiwan, and Mongolia. ↩︎

The U.S. Government and International Family Planning & Reproductive Health Efforts

Published: Jan 2, 2024

This fact sheet does not reflect recent changes that have been implemented by the Trump administration, including a foreign aid review and restructuring. For more information, see KFF’s Overview of President Trump’s Executive Actions on Global Health.

Key Facts

  • Improving access to family planning and reproductive health (FP/RH) services globally can help prevent maternal deaths and reduce unintended pregnancies. Each year, an estimated 287,000 women die from complications during pregnancy and childbirth, almost all in low- and middle-income countries. Approximately one-third of maternal deaths could be prevented annually if women who did not wish to become pregnant had access to and used effective contraception. Worldwide, 218 million women have an unmet need for modern contraception.
  • The U.S. government (U.S.) has supported global FP/RH efforts for nearly 60 years and is the largest donor to FP/RH in the world. It is also one of the largest purchasers and distributors of contraceptives internationally.
  • Over time, the U.S. role in global FP/RH has changed, sometimes influenced by differing views and political debates related to FP/RH that have arisen both domestically and internationally. Historically, these debates have concerned both the amount of U.S. funding provided as well as its use, particularly related to abortion.
  • U.S. funding for FP/RH rose steadily in its first three decades but has remained relatively flat in recent years at approximately $600 million. In FY 2023, U.S. funding totaled $608 million, including funding for the United Nations Population Fund (UNFPA). After the Trump administration withheld funding from UNFPA from FY 2017 – FY 2020, under the Kemp-Kasten Amendment, it was restored by the Biden administration in FY 2021.
  • U.S. funding for FP/RH is governed by several other legislative and policy requirements, including a legal ban on the direct use of U.S. funding overseas for abortion as a method of family planning (the Helms Amendment, which has been in place since 1973) and, when in effect, the Mexico City Policy (reinstated and expanded by President Trump as the “Protecting Life in Global Health Assistance” policy but rescinded by President Biden upon taking office).

Global Situation

Access to family planning and reproductive health (FP/RH) services is critical to the health of women and children worldwide. Improving access to FP/RH services globally can help prevent maternal deaths and reduce unintended pregnancies. Each year, approximately 287,000 women die from complications during pregnancy and childbirth, almost all in developing countries and most in sub-Saharan Africa and South and Central Asia.1  It is also estimated that approximately one-third of maternal deaths could be prevented annually if women who did not wish to become pregnant had access to and used effective contraception.2 

Family Planning (FP): The ability of individuals and couples to anticipate and attain their desired number of children and the spacing and timing of births.3 

Reproductive Health (RH): The state of complete physical, mental, and social well-being, and not merely the absence of disease or infirmity, in all matters relating to the reproductive processes, functions, and system at all stages of life.4 

Key Factors

Key factors contributing to maternal deaths and unintended pregnancy include:5 

  • unmet need for FP services;
  • high adolescent birth rates, since adolescents (ages 15-19) are more likely to die or face complications during pregnancy and childbirth;
  • lack of access to antenatal care, which increases the risk of complications during pregnancy and childbirth; and
  • unsafe abortions, which are those performed by individuals without the necessary skills or in an unsanitary environment and often lead to complications and death.

Worldwide, 218 million women have an unmet need for modern contraception (i.e., they do not wish to get pregnant and are using no contraceptive method or a traditional method).6  Access to modern FP methods varies significantly by region. Unmet need for modern FP is highest in regions like sub-Saharan Africa, Oceania, and Western Asia where modern contraceptive prevalence is low.7  Adolescent fertility rates have declined slowly and remain particularly high in sub-Saharan Africa, where child marriage remains common, and in Latin America and the Caribbean as well as Oceania.8  While the percentage of pregnant women receiving the recommended minimum number of four antenatal care visits has been on the rise, it is 49% in the least developed countries and has reached only 54% in sub-Saharan Africa and 55% in South Asia.9  Each year, approximately 47,000 women die from complications associated with unsafe abortion.10  Access to and use of effective contraception reduces unintended pregnancies and the incidence of abortion.11 

Reasons for the lack of access to and, in some cases, utilization of FP/RH services include low awareness of the risks of sexual activity, such as pregnancy and HIV; cost; gender inequality; and laws in some countries that require women and girls to be of a certain age or have third party authorization, typically from their husband, to utilize services.12 

Interventions

FP/RH encompasses a wide range of services that have been shown to be effective in decreasing the risk of unintended pregnancies, maternal and child mortality, and other complications. These include:

  • birth spacing;
  • contraception;
  • sexuality education, information and counseling;
  • post-abortion care;
  • screening/testing for HIV and other sexually transmitted diseases (STDs);
  • repair of obstetric fistula;
  • antenatal and postnatal care;
  • genital human papillomavirus (HPV) vaccine to prevent cervical cancer and genital warts; and
  • research into new methods such as microbicides.13 

SDG 3: Achieving Universal Access to Reproductive Health

This goal, adopted in 2015 as part of Sustainable Development Goal (SDG) 3 – “ensure healthy lives and promote well-being for all at all ages,” is to “ensure universal access to sexual and reproductive health care services, including for family planning, information, and education, and the integration of reproductive health into national strategies and programmes”14  by 2030.

U.S. Government Efforts

The U.S. has a long history of engagement in international family planning and population issues, and today, the U.S. government is the largest donor to global FP/RH efforts and is one of the largest purchasers and distributors of contraceptives internationally.15  Congress first authorized research in this area in the Foreign Assistance Act of 1961.16  In 1965, the U.S. Agency for International Development (USAID) launched its first FP program and, in 1968, began purchasing contraceptives to distribute in developing countries. In the 1980s, USAID programs expanded to address maternal, newborn, and child health as well as the relationship between population, health, and the environment; and in the 1990s, USAID FP/RH programs began to recognize the need for male involvement in FP/RH and focus on the needs of young people.17  More recently, the U.S. adopted a longer term global health goal of ending preventable child and maternal deaths by 2035 and highlighted the important role of FP/RH efforts in achieving this goal.18  U.S. funding for FP/RH is governed by several legislative and policy requirements, including a legal ban on the direct use of U.S. funding overseas for abortion as a method of family planning (which has been in place since 1973) as well as more stringent restrictions in some years, such as the Mexico City Policy (see below).

Organization

USAID has long served as the lead U.S. agency for FP/RH activities, with other agencies also carrying out FP/RH activities.

USAID

USAID operates FP/RH programs in more than 30 countries, with a focused effort in 24 priority countries that are mostly in Africa and Southern Asia.19  The agency’s stated FP/RH objective is to help countries meet the FP/RH needs of their people.20  It does this by expanding sustainable access to quality voluntary FP/RH services, commodities, and information (see Table 121 ) that enhance efforts to reduce high-risk pregnancies; allow sufficient time between pregnancies; provide information, counseling, and access to condoms to prevent HIV transmission; reduce the number of abortions; support women’s rights by improving “women’s opportunities for education, employment, and full participation in society;” and stabilize population growth by advancing “individuals’ rights to decide their own family size.”22 

Table 1: U.S. Government-Funded Family Planning/Reproductive Health (FP/RH) Interventions
Addressing child marriage
Addressing gender-based violence
Biomedical and contraceptive research and development
Contraceptive supplies and their distribution
Contributions to UNFPA
Counseling and services such as birth spacing
Eliminating female genital mutilation
Financial management
Linking FP with HIV/AIDS & STD information/services
Linking FP with maternity services
Post-abortion care
Prevention and repair of obstetric fistula
Public education and marketing
Sexuality & reproductive health education
Training of health workers

Other U.S. FP/RH Efforts

Also carrying out FP/RH efforts are the Centers for Disease Control and Prevention (CDC) (research, surveillance, technical assistance, and a designated World Health Organization Collaborating Center for Reproductive Health);23  the Department of State (diplomatic and humanitarian efforts); the National Institutes of Health (NIH) (research); and the Peace Corps (volunteer activities).

Additionally, USAID’s FP/RH and maternal and child health (MCH) efforts are closely linked, although Congress directs funding to and USAID operates these programs separately. Recent years have also seen greater emphasis on coordinating FP/RH investments with global HIV efforts through the President’s Emergency Plan for AIDS Relief (PEPFAR).24  See the KFF fact sheet on U.S. MCH efforts and the KFF fact sheet on U.S. PEPFAR efforts.

Multilateral Efforts

The U.S. works with several international institutions, partnerships, and other donors to carry out FP/RH efforts. Among them are the U.N. Population Fund (UNFPA, the largest purchaser and distributor of contraceptives worldwide); Family Planning 2030 (FP2030, an international partnership to expand access to rights-based family planning services in which the U.S. is a core partner25 ); and the Global Financing Facility (GFF, a partnership to advance the health and rights of women, children, and adolescents through innovative financing, in which the U.S. is an investor and has recently enhanced its cooperation with a focus on how their combined efforts may further strengthen primary health care).26 

Funding27 

U.S. funding for FP/RH rose steadily in its first three decades28  but then declined for several years before peaking at $715 million in FY 2010. More recently, funding has been relatively flat at approximately $600 million. Total U.S. funding for FP/RH, which includes the U.S. contribution to UNFPA, was $608 million in FY 2023 (see figure for the latest information). In several years during this period, the Trump administration withheld the U.S. contribution to UNFPA (FY 2017 – FY 2020) due to the Kemp-Kasten Amendment.29  (See the KFF fact sheet on the U.S. Global Health Budget: Family Planning & Reproductive Health (FP/RH) and the KFF budget tracker for more details on historical appropriations for U.S. global FP/RH efforts.)

Most U.S. funding for FP/RH is part of the Global Health Programs account at USAID, with additional funding provided through the Economic Support Fund account. FP/RH funding is also provided through the International Organizations & Programs account at the Department of State for the U.S. contribution to UNFPA. Under current U.S. law, any U.S. funding withheld from UNFPA is to be made available to other family planning, maternal health, and reproductive health activities.30 

U.S. Funding for International Family Planning/Reproductive Health (FP/RH), FY 2016 - FY 2025

Requirements in Law and Policy31 

Legal, policy, and programmatic requirements for U.S. funding for international FP include (also see the KFF fact sheet on these and other requirements):

Helms Amendment

Since 1973, through the Helms Amendment, U.S. law has prohibited the use of foreign assistance to pay for the performance of abortion as a method of family planning or to motivate or coerce any person to practice abortion.

Mexico City Policy

First instituted by President Reagan in 1984 through executive order, the Mexico City Policy (the “Global Gag Rule”) required foreign non-governmental organizations (NGOs) to certify that they would not perform or promote abortion as a method of family planning using funds from any source as a condition for receiving U.S. funding. A highly debated issue, this policy was rescinded by President Clinton, reinstated by President Bush, rescinded by President Obama, and reinstated – in an expanded form – by President Trump in January 2017. The Trump administration’s application of the policy extended to the vast majority of U.S. bilateral global health assistance, including funding for FP/RH, HIV under PEPFAR, maternal and child health, malaria, nutrition, and other programs; in past iterations, it applied to family planning assistance only, and under that administration, the policy was renamed “Protecting Life in Global Health Assistance.” The Biden administration rescinded the policy in January 2021. See the KFF explainer on the Mexico City Policy.

UNFPA & the Kemp-Kasten Amendment

Although the U.S. government helped create the U.N. Population Fund (UNFPA) in 1969 and was a leading contributor for many years, there have been several years in which funding has been withheld due to executive branch determinations that UNFPA’s activities in China violated the Kemp-Kasten Amendment, which prohibits funding any organization or program, as determined by the President, that supports or participates in the management of a program of coercive abortion or involuntary sterilization.32  The Kemp-Kasten Amendment was most recently invoked to withhold funding for UNFPA for four years (FY 2017 – FY 2020) during the Trump administration; see the KFF explainer on UNFPA funding and the Kemp-Kasten Amendment.

Voluntarism and Informed Choice

The principles of ensuring voluntary use of FP/RH services as well as informed choice of FP/RH options are specified in legislative language and program guidance.

  1. World Health Organization (WHO), et al., Trends in maternal mortality: 2000 to 2020, 2023; WHO, “Maternal mortality,” fact sheet, Feb. 22, 2023. ↩︎
  2. S. Ahmed, et al., “Maternal deaths averted by contraceptive use: an analysis of 172 countries,” The Lancet, July 14, 2012 (Vol. 30, no. 9837: 111-125). ↩︎
  3. WHO, Family Planning website, https://www.who.int/health-topics/contraception#tab=tab_1. ↩︎
  4. WHO, Reproductive Health website, https://www.who.int/teams/sexual-and-reproductive-health-and-research-(srh)/overview; International Conference on Population and Development (ICPD), Programme of Action, Cairo, 1994. ↩︎
  5. WHO, “Maternal mortality,” fact sheet, Sept. 2019; United Nations (UN), The Millennium Development Goals Report 2009, 2009; WHO, World Health Report 2005 – Making Every Mother and Child Count, 2005; Guttmacher Institute, “Unintended Pregnancy and Abortion Worldwide,” fact sheet, July 2020; WHO, “Preventing unsafe abortion,” fact sheet, Sept. 2020. ↩︎
  6. Guttmacher Institute, Adding It Up: Investing in Sexual and Reproductive Health 2019, 2020. ↩︎
  7. Oceania excludes Australia and New Zealand. U.N. Department of Economic and Social Affairs, Population Division, Estimates and Projections of Family Planning Indicators 2022: Regions, 2022. ↩︎
  8. Oceania excludes Australia and New Zealand. U.N., Progress towards the Sustainable Development Goals, Report of the Secretary-General 2023, Supplementary Information, statistical annex, undated, https://unstats.un.org/sdgs/files/report/2023/E_2023_64_Statistical_Annex_I_and_II.pdf. ↩︎
  9. UNICEF, “Table 3: Maternal and Newborn Health,” in State of the World’s Children 2023, 2023. ↩︎
  10. WHO, Unsafe abortion: global & regional estimates of the incidence of unsafe abortion and associated mortality in 2008, 2011. See also WHO, “Abortion,” fact sheet, Nov. 2021. ↩︎
  11. Eric Zuehlke, “Reducing Unintended Pregnancy and Unsafely Performed Abortion Through Contraceptive Use,” PRB, 2009. See also WHO, “Abortion,” fact sheet, Nov. 2021. ↩︎
  12. WHO, World Health Report 2005 – Making Every Mother and Child Count, 2005. See also Guttmacher Institute, Unmet Need for Contraception in Developing Countries: Examining Women’s Reasons for Not Using a Method, June 2016, and Guttmacher Institute, “Reasons for Unmet Need For Contraception in Developing Countries,” fact sheet, June 2016. ↩︎
  13. USAID, “Family Planning & Reproductive Health Programs – Saving Lives, Protecting the Environment, Advancing U.S. Interests,” fact sheet, undated; USAID, “Fast Facts: Family Planning,” fact sheet, Dec. 2009; WHO, Johns Hopkins, and USAID, Family Planning: A Global Handbook for Providers, 2007; USAID, Report to Congress: Global Health and Child Survival Progress Report – FY 2008, 2009; UNESCO, International Technical Guidance on Sexuality Education, Dec. 2009. ↩︎
  14. UN, Transforming our world: the 2030 Agenda for Sustainable Development, 2015. This goal was originally specified in the 1994 Cairo International Conference on Population and Development’s (ICPD) Programme of Action and was added in 2007 as a specific target of Millennium Development Goal 5 (MDG 5), which aims to improve maternal health. This addition to MDG 5 was a recognition by governments and world leaders of the need to address challenges related to access and utilization of RH services. The world did not reach this target, but some progress was made, with more women attending a health provider four times or more during pregnancy and using contraceptives, though these indicators still vary widely across regions. ICPD, Programme of Action, Cairo, 1994; UN, The Millennium Development Goals Report 2009, 2009; UN, The Millennium Development Goals Report 2015, 2015. ↩︎
  15. KFF, Mapping the Donor Landscape in Global Health: Family Planning and Reproductive Health, 2014; KFF, Donor Government Assistance for Family Planning, report series; UNFPA, Contraceptives and Condoms for Family Planning and STI & HIV Prevention (2014), 2015. ↩︎
  16. Congressional Research Service (CRS), U.S. International Family Planning Programs: Issues for Congress, Jan. 2016. ↩︎
  17. USAID, USAID Family Planning Program Timeline, undated. ↩︎
  18. USAID, “What We Do – Global Health,” webpage, https://www.usaid.gov/global-health; USAID: Acting on the Call: Ending Preventable Child and Maternal Deaths, June 2014; USAID: Acting on the Call: Ending Preventable Child and Maternal Deaths, June 2014. See also USAID, Acting on the Call 2018: A Focus on the Journey to Self-Reliance for Preventing Child and Maternal Deaths, 2018. ↩︎
  19. KFF analysis of data from the U.S. Foreign Assistance Dashboard website, ForeignAssistance.gov. See also USAID, “Family Planning Countries,” webpage, https://www.usaid.gov/global-health/health-areas/family-planning/countries. Countries are selected based on high rates of unmet need for FP, prevalence of high-risk births, low contraceptive use, and significant population pressures on land and water resources (per KFF personal communication with USAID, April 2, 2010). ↩︎
  20. USAID, “Family Planning and Reproductive Health Program Overview,” fact sheet, Oct. 2023. ↩︎
  21. USAID, “Family Planning and Reproductive Health Program Overview,” fact sheet, Oct. 2023; U.S. Government, FY 2019 Congressional Budget Justification – Department of State, Foreign Operations, and Related Programs, 2018; USAID, “Family Planning and Reproductive Health Program Overview,” fact sheet, Nov. 2017; USAID: “Family Planning and Reproductive Health,” webpage, https://www.usaid.gov/global-health/health-areas/family-planning; USAID, “Family Planning Resources,” webpage, https://www.usaid.gov/global-health/health-areas/family-planning/resources; USAID, “Reproductive Health,” webpage, https://www.usaid.gov/global-health/health-areas/reproductive-health; USAID, “Family Planning & Reproductive Health Programs – Saving Lives, Protecting the Environment, Advancing U.S. Interests,” fact sheet, undated; USAID, “Fast Facts: Family Planning,” fact sheet, Dec. 2009. ↩︎
  22. USAID, “Family Planning and Reproductive Health Program Overview,” fact sheet, Oct. 2023; USAID, “Family Planning and Reproductive Health Program Overview,” fact sheet, Nov. 2017; USAID: “Family Planning and Reproductive Health,” webpage, https://www.usaid.gov/global-health/health-areas/family-planning; USAID, Report to Congress: Global Health and Child Survival Progress Report – FY 2008, 2009. ↩︎
  23. CDC, Global Reproductive Health website, http://www.cdc.gov/reproductivehealth/Global/index.htm. ↩︎
  24. For example: OGAC, PEPFAR 2018 Country Operational Plan Guidance for Standard Process Countries, Jan. 28, 2018; OGAC, PEPFAR Fiscal Year 2014 Country Operational Plan (COP) Guidance, Version 2, Nov. 8, 2013; OGAC, PEPFAR Blueprint: Creating An AIDS-free Generation, Nov. 2012; OGAC, U.S. PEPFAR: Five-Year Strategy, Dec. 2009. ↩︎
  25. FP2030, “About FP2030,” webpage, https://fp2030.org/about. ↩︎
  26. The GFF was launched in 2015 as a multi-stakeholder partnership that supports country-led efforts to advance the health and rights of women, children, and adolescents, and the U.S. is as a member of the Investors Group that oversees the partnership’s overall activities. GFF, “About,” webpage, https://www.globalfinancingfacility.org/about; GFF, “Governance,” webpage, https://www.globalfinancingfacility.org/governance; GFF, “Investors Group,” webpage, https://www.globalfinancingfacility.org/governance/investors-group. ↩︎
  27. KFF analysis of data from the Office of Management and Budget, Agency Congressional Budget Justifications, Congressional Appropriations Bills, and U.S. Foreign Assistance Dashboard website, ForeignAssistance.gov. ↩︎
  28. PAI, Cents and Sensibility: U.S. International Family Planning Assistance from 1965 to the Present, webpage, https://pai.org/cents-and-sensibility/. ↩︎
  29. Congress has usually required that funding withheld from UNFPA be reallocated to USAID’s family planning, maternal, and reproductive health activities. See KFF, UNFPA Funding & Kemp-Kasten: An Explainer. ↩︎
  30. KFF, UNFPA Funding & Kemp-Kasten: An Explainer. ↩︎
  31. KFF, The U.S. Government and International Family Planning & Reproductive Health: Statutory Requirements and Policies, fact sheet; KFF, Statutory Requirements & Policies Governing U.S. Global Family Planning and Reproductive Health Efforts, brief, 2012; USAID, USAID’s Family Planning Guiding Principles and U.S. Legislative and Policy Requirements webpage, https://www.usaid.gov/global-health/about-us/policy-requirements. ↩︎
  32. CRS, The United Nations Population Fund (UNFPA): Background and U.S. Funding, May 2022; CRS, The U.N. Population Fund: Background and the U.S. Funding Debate, Feb. 2010. ↩︎