Prior Authorization Process Policies in Medicaid Managed Care: Findings from a Survey of State Medicaid Programs

Authors: Jada Raphael, Elizabeth Hinton, Aimee Lashbrook, and Kathleen Gifford
Published: Aug 7, 2025

Note: This brief was updated on Aug. 21, 2025, to include Kentucky in the count of states that require Medicaid managed care organizations (MCOs) to make standard prior authorization decisions within a timeframe shorter than 7 calendar days.

Medicaid managed care organizations (MCOs) deliver care to three-quarters of all Medicaid enrollees nationally. MCOs often require patients to obtain approval of certain health care services or medications before the care is provided—an insurance practice commonly referred to as “prior authorization”. This allows the MCO to evaluate whether care is covered, medically necessary, and being delivered in the most appropriate setting. If the MCO determines the requested service (or medication) is not appropriate or medically necessary, the MCO may deny the request (fully or partially). Providers and patients have raised concerns that MCO prior authorization processes have the potential to delay or limit access to care. A 2023 report from the U.S. Department of Health and Human Services (HHS) Office of Inspector General (OIG) found that Medicaid MCOs had an overall prior authorization denial rate (12.5%) that was more than double the Medicare Advantage rate (5.7%). OIG found most Medicaid enrollees (89%) do not appeal to the MCO for reconsideration. Of those who do appeal, only about one-third get the initial denial overturned—far less than for Medicare Advantage appeals (82% overturn rate). They also found limited state Medicaid agency oversight. The Medicaid and CHIP Payment and Access Commission (MACPAC) has highlighted similar concerns, making recommendations to improve state monitoring and oversight, transparency, and the enrollee experience.

To help reduce prior authorization-related burden, the Biden Administration issued the Interoperability and Prior Authorization final rule in 2024 aimed at streamlining and automating the prior authorization process and improving transparency for Medicare Advantage, Medicaid, CHIP, and Marketplace health plans. A growing number of states have also introduced limits on prior authorization requirements through state legislation. In June 2025, under the Trump Administration, HHS announced a voluntary initiative where dozens of health insurers pledged to reduce the burden of prior authorizations across insurance markets. The pledge included commitments to require prior authorization less often, speed up the timeframe to review prior authorization requests, and use clearer language when communicating with patients. A recent KFF poll found that about three-quarters (73%) of adults say that health insurance related delays and denials are “a major problem,” and few people think it is likely that health insurance companies will follow through on the new pledge in a meaningful way.

To improve understanding of state Medicaid managed care prior authorization processes and oversight, the 24th annual Medicaid budget survey, conducted by KFF and Health Management Associates (HMA) in the summer of 2024, asked about specific prior authorization process-related policies in place as of July 1, 2024. Key findings include:

  • Prior Authorization Decision Timeframes. Half of responding MCO states (18 of 36) required MCOs to make “standard” prior authorization decisions within 7 calendar days or a shorter timeframe. New federal rules that take effect in January 2026 require standard prior authorization decisions to be made within 7 calendar days.
  • Offering of Electronic Denial Notices. Only about one-third of responding MCO states (12 of 38) required MCOs to offer prior authorization denial notices electronically. Delayed receipt of denial notices can leave enrollees without enough time to request an appeal.
  • Access to External Medical Review. At least one-third of responding MCO states (15 of 39) provided enrollees with access to an independent external medical review process to review an MCO’s decision to uphold a denial.

Prior Authorization Process Overview

Prior authorization is a multi-step process where payers require medical providers to receive approval before providing a specific service, item, or medication. Federal regulations allow Medicaid MCOs to limit services based on medical necessity (must be no more restrictive than fee-for-service (FFS)) and for the purpose of utilization control if certain conditions are met.1  Federal rules also establish timeframes and processes MCOs must follow when making prior authorization and appeals decisions (Figure 1). State Medicaid agencies may impose stricter requirements on MCOs than set forth in federal regulations for prior authorization processes and timelines.
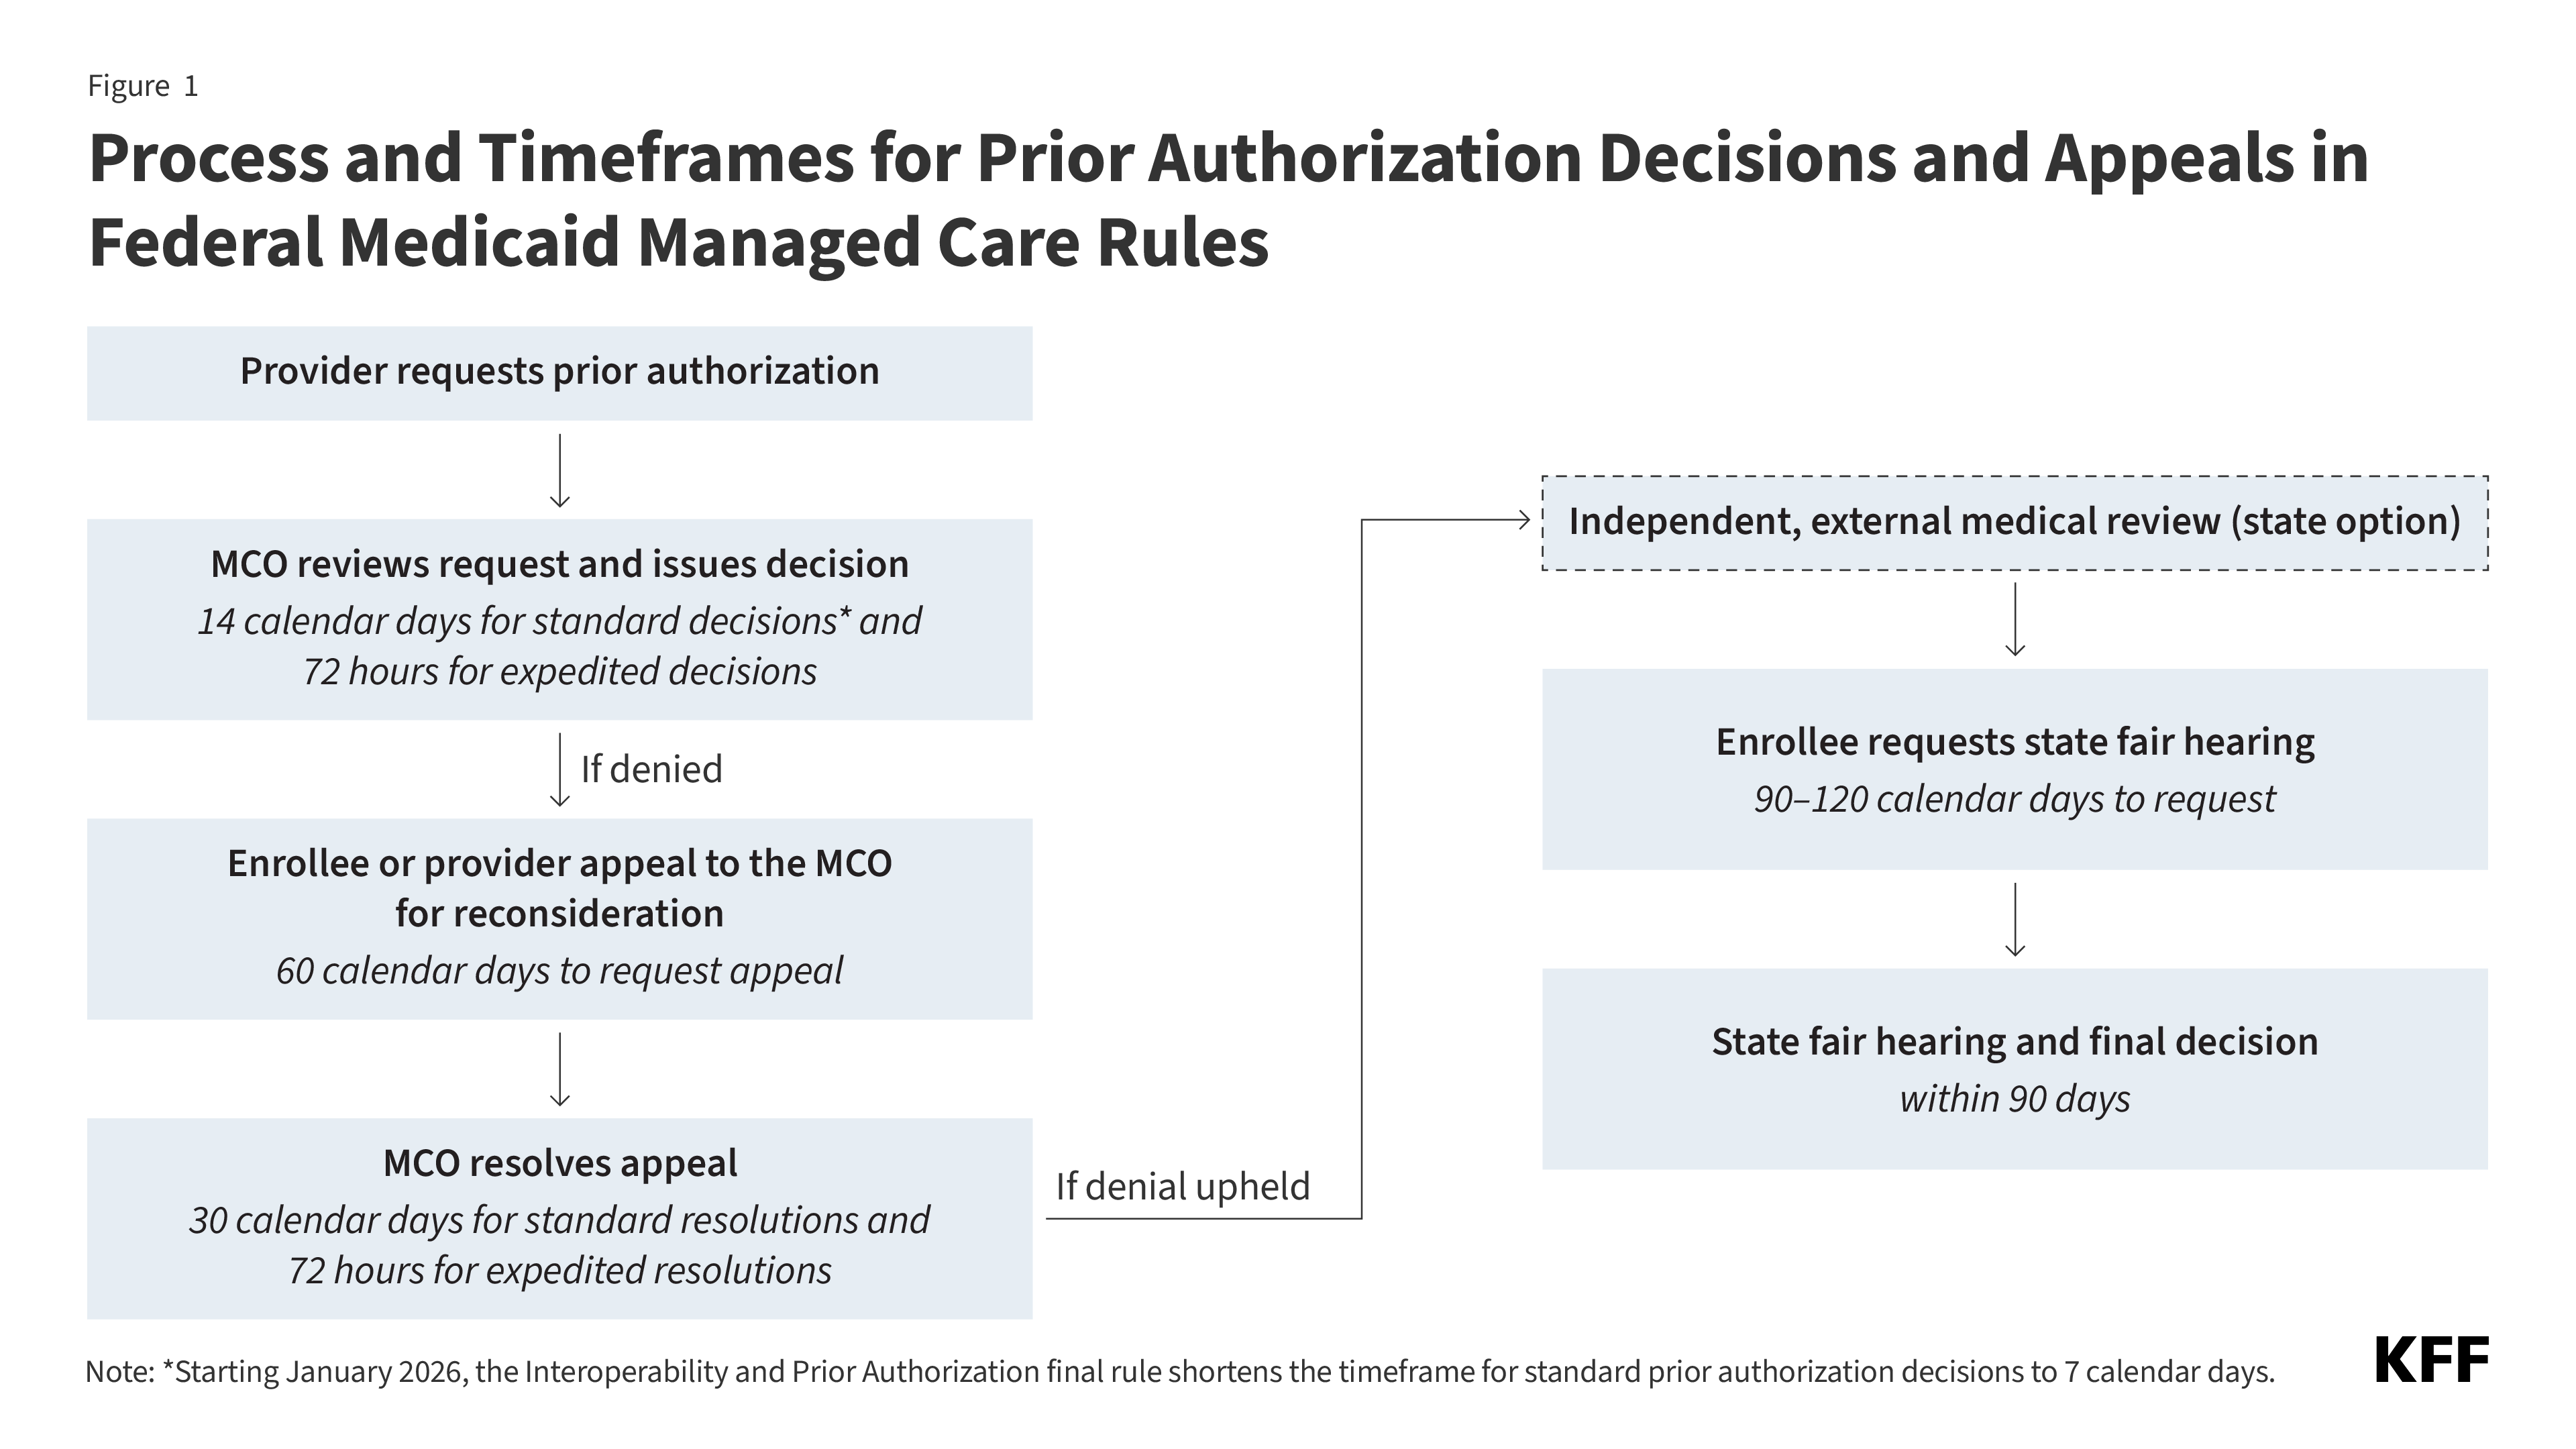
Figure 1 is titled "Process and Timeframes for Prior Authorization Decisions and Appeals in Federal Medicaid Managed Care Rules." It is a flow chart detailing MCO's review and appeal process.

Survey Findings

Prior Authorization Decision Timeframes

Federal rules currently require MCOs to make “standard” prior authorization decisions within 14 calendar days and “expedited” decisions within 72 hours of prior authorization requests; however, states may establish shorter timeframes. Starting January 2026, the Interoperability and Prior Authorization final rule shortens the timeframe for standard prior authorization decisions to 7 calendar days. (The timeframe for expedited prior authorization decisions in Medicaid managed care is unchanged by the final rule.) The 2024 KFF/HMA state survey asked states how their current MCO requirements compare to the final prior authorization rule’s timeframe standards.

Half of responding MCO states (18 of 36) reported requiring standard prior authorization decisions within 7 calendar days (8 states) or a shorter timeframe (10 states) (Table 1). Eighteen states reported requiring a timeframe longer than 7 calendar days for standard prior authorization decisions. For expedited prior authorization requests, about one-third of responding MCO states (13 states) reported having a standard shorter than 72 hours, while 23 states reported having a 72-hour standard.
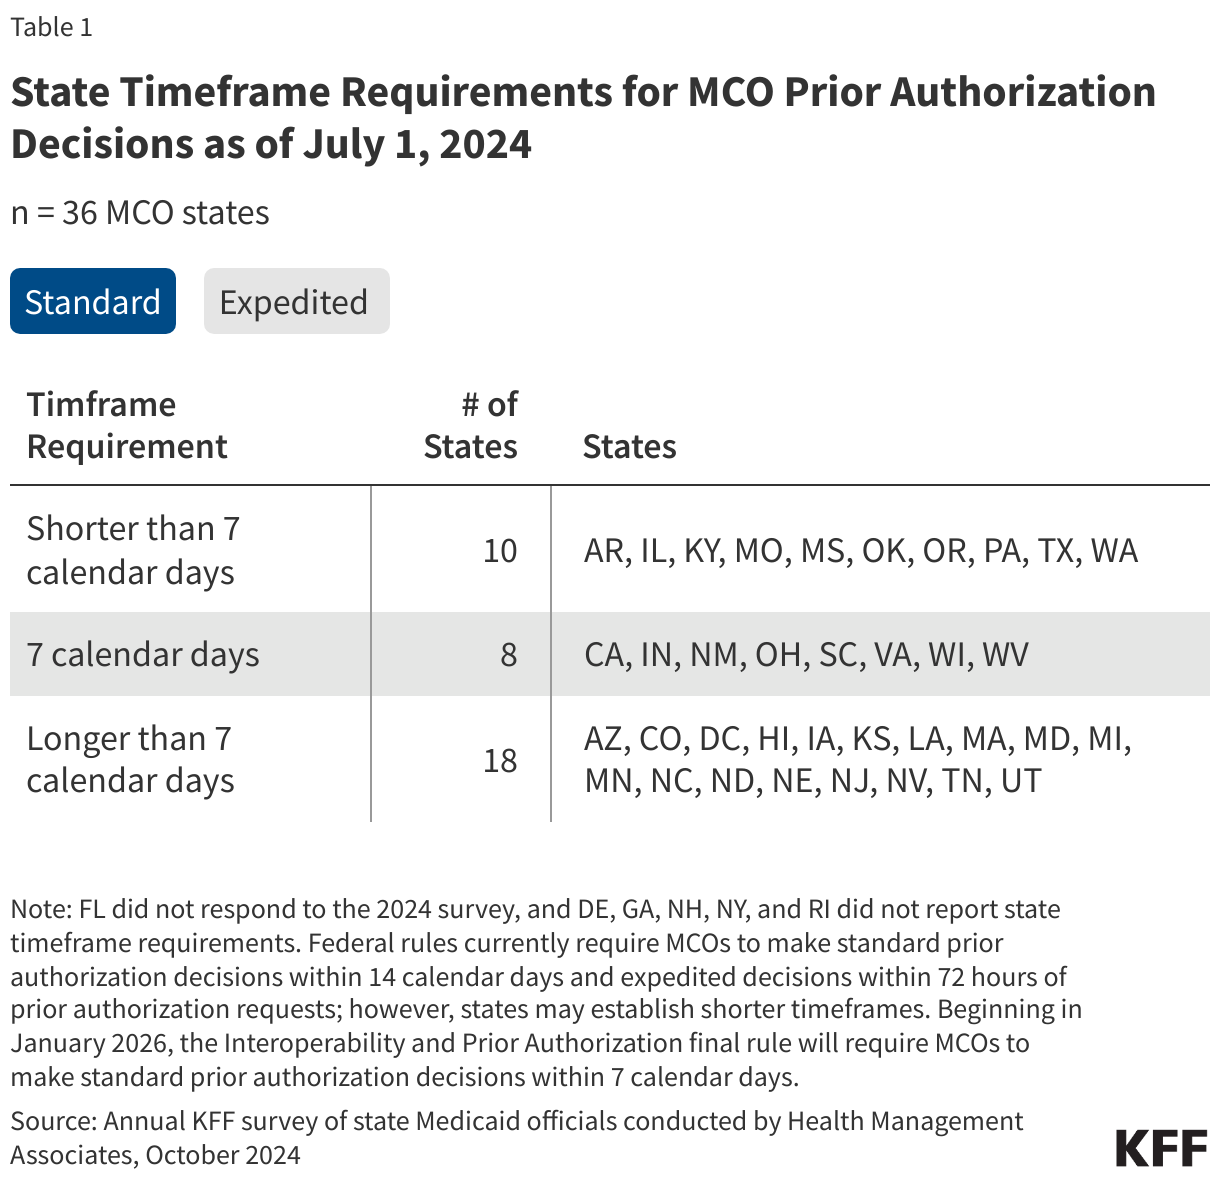
State Timeframe Requirements for MCO Prior Authorization Decisions as of July 1, 2024 (Table)

Denial Notices and Enrollee Support

About one-third of responding MCO states (12 of 38) require MCOs to offer electronic denial notices (Figure 2). MACPAC’s examination of denials and appeals in Medicaid managed care found that mailed denial notices often arrived late or not at all. Enrollees have 60 calendar days from the date on the denial notice to file a request for an appeal to the MCO. Delayed receipt of denial notices can leave enrollees without enough time to request an appeal. Offering an option to receive electronic notices may help enrollees receive denial notices faster and more reliably.
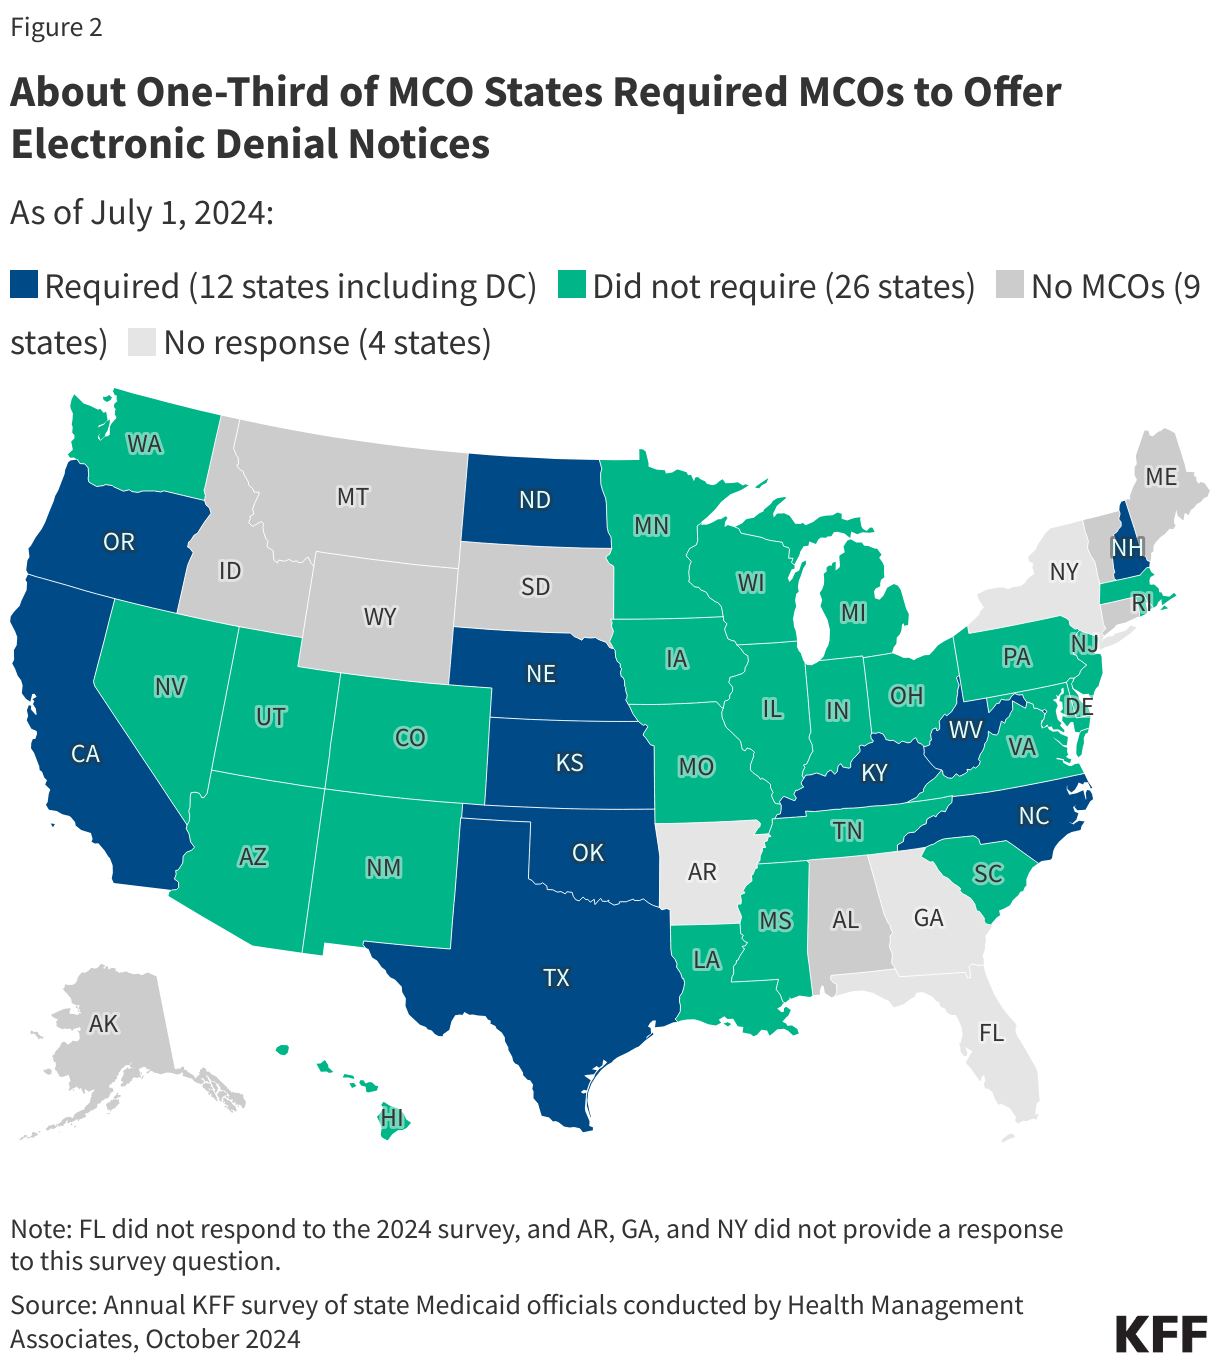
About One-Third of MCO States Required MCOs to Offer Electronic Denial Notices (Choropleth map)

More than half of responding MCO states (21 of 38 states) reported using standardized prior authorization denial notice templates or language. Both MACPAC and OIG found denial notices can be lengthy and challenging to understand, often using clinical and/or legal jargon. Denial notices may be missing key information such as why the original request failed to meet medical necessity standards/requirements and what documentation the MCO may need to approve the request, which can contribute to challenges with the appeals process and result in lower appeal rates. Standardized denial notice language may improve enrollees’ ability to understand the prior authorization process and next steps. However, in a review, OIG found even template language can lack key information in some instances (e.g., one state’s template failed to inform enrollees of their right to request a state fair hearing after appealing to the MCO).

While federal rules require MCOs to provide enrollees assistance with the appeals process upon request, MACPAC found some enrollees may not have confidence in information provided by MCOs or enrollees may hesitate to seek support (in navigating the appeals process) from the entity that denied their service request. External entities like ombudsperson offices can help enrollees navigate the appeals process. Although the survey asked whether states provide Medicaid funding to external entities (e.g., state ombudsperson offices, legal aid societies) that could assist enrollees through the MCO appeals process, it’s not clear how many states provide such external funding (as it appears the question was not interpreted consistently across states).

Independent External Medical Review

Enrollees who disagree with an MCO’s prior authorization decision have the right to appeal to the MCO for reconsideration. If the managed care plan upholds the original denial, states have the option to offer an external medical review but are not required to do so. An external medical review is a clinical review of an MCO’s decision to uphold a denial by an independent, third party (not affiliated with the state or MCO). If offered, it must be at no cost to the enrollee, cannot disrupt an enrollee’s “continuation of benefits,” or be used as a deterrent to a state fair hearing (the next step in the appeals process which involves an administrative law judge). In Medicare Advantage, if the managed care plan upholds the original denial, the case is automatically sent to an independent review entity. OIG suggests that this automatic independent review process might explain why Medicare Advantage’s appeal overturn rate is 82%–far higher than Medicaid MCOs 36% overturn rate. The 2024 KFF/HMA state survey asked states whether they provide access to an external medical review process to review an MCO’s decision to uphold a denial.

As of July 1, 2024, at least one-third of responding MCO states (15 of 39) provided enrollees access to an independent external medical review process to review an MCO's decision to uphold a denial (Figure 3).2  These findings represent a slight increase in the number of states that report providing access to external medical reviews compared to OIG’s 2019 findings.
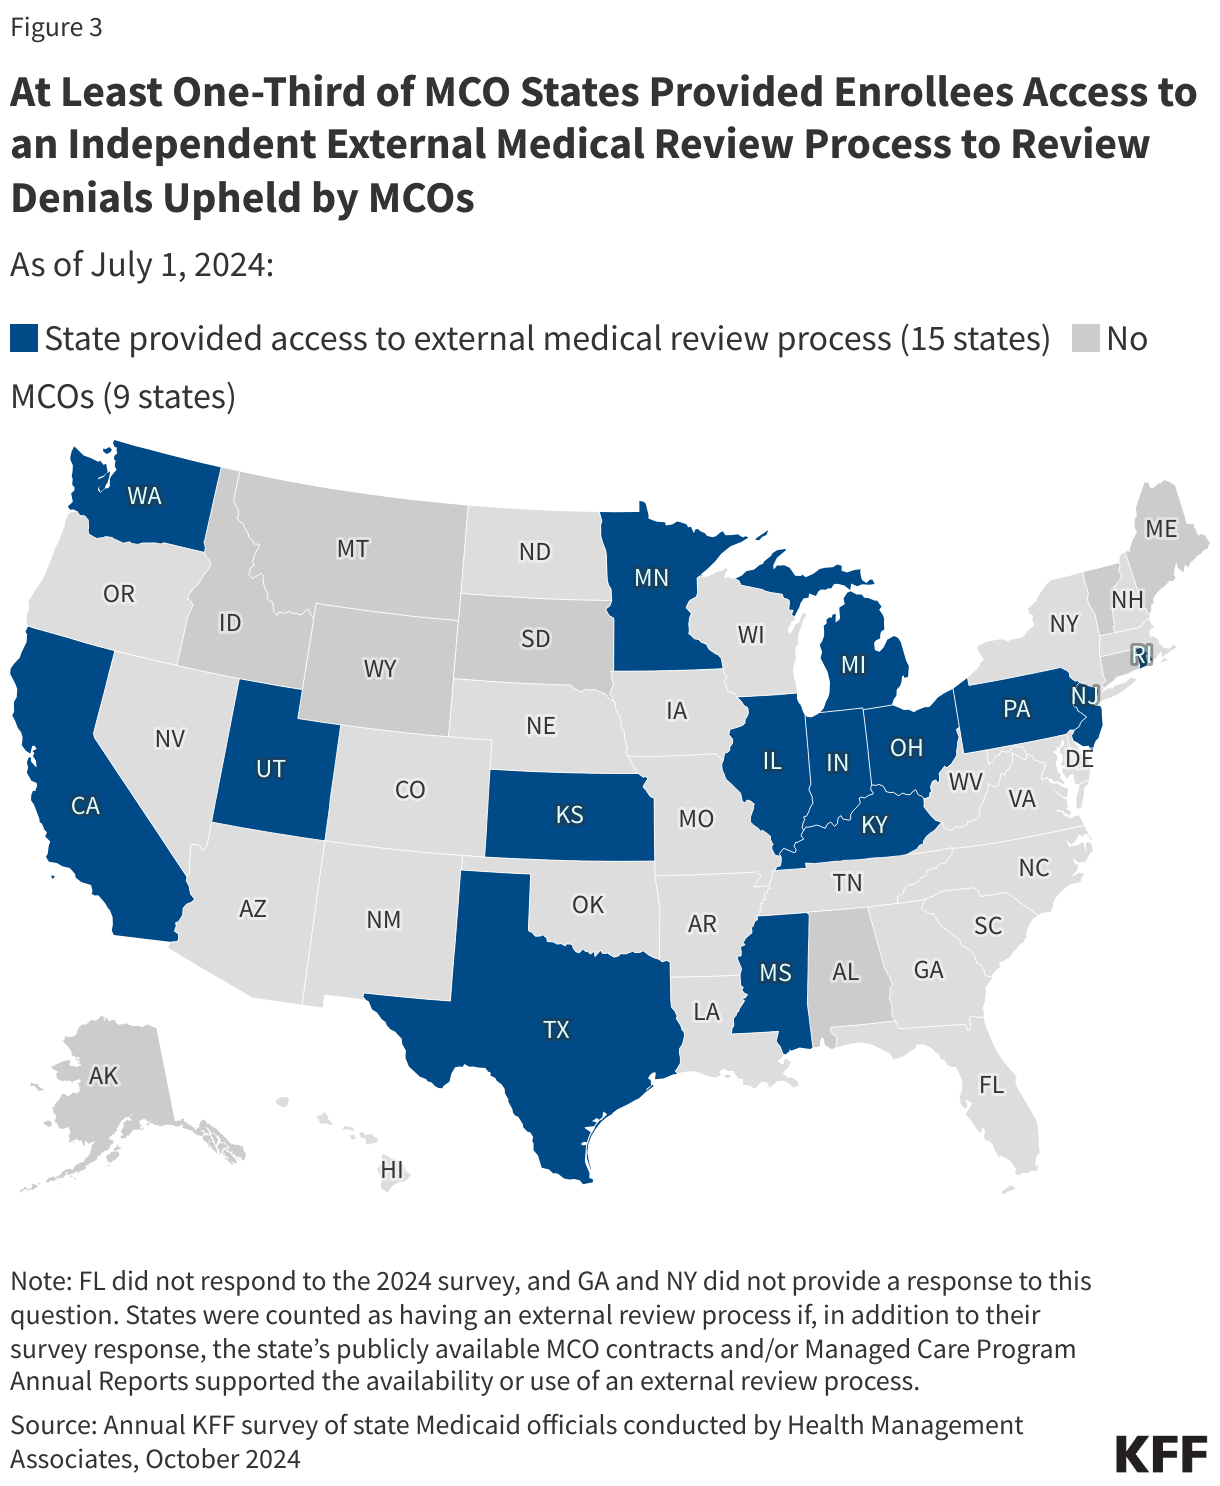
At Least One-Third of MCO States Provided Enrollees Access to an Independent External Medical Review Process to Review Denials Upheld by MCOs (Choropleth map)
  1. MCOs must ensure that the services they provide are sufficient in amount, duration, or scope to achieve the purpose for which they are furnished. Also, MCOs may not arbitrarily deny or reduce a required service based solely on an enrollee’s illness or condition. ↩︎
  2. States were counted as having an external review process if, in addition to their survey response, the state’s publicly available MCO contracts and/or Managed Care Program Annual Reports supported the availability or use of an external review process. ↩︎
Poll Finding

KFF Tracking Poll on Health Information and Trust: Health Information and Advice on Social Media

Published: Aug 7, 2025

Key Takeaways

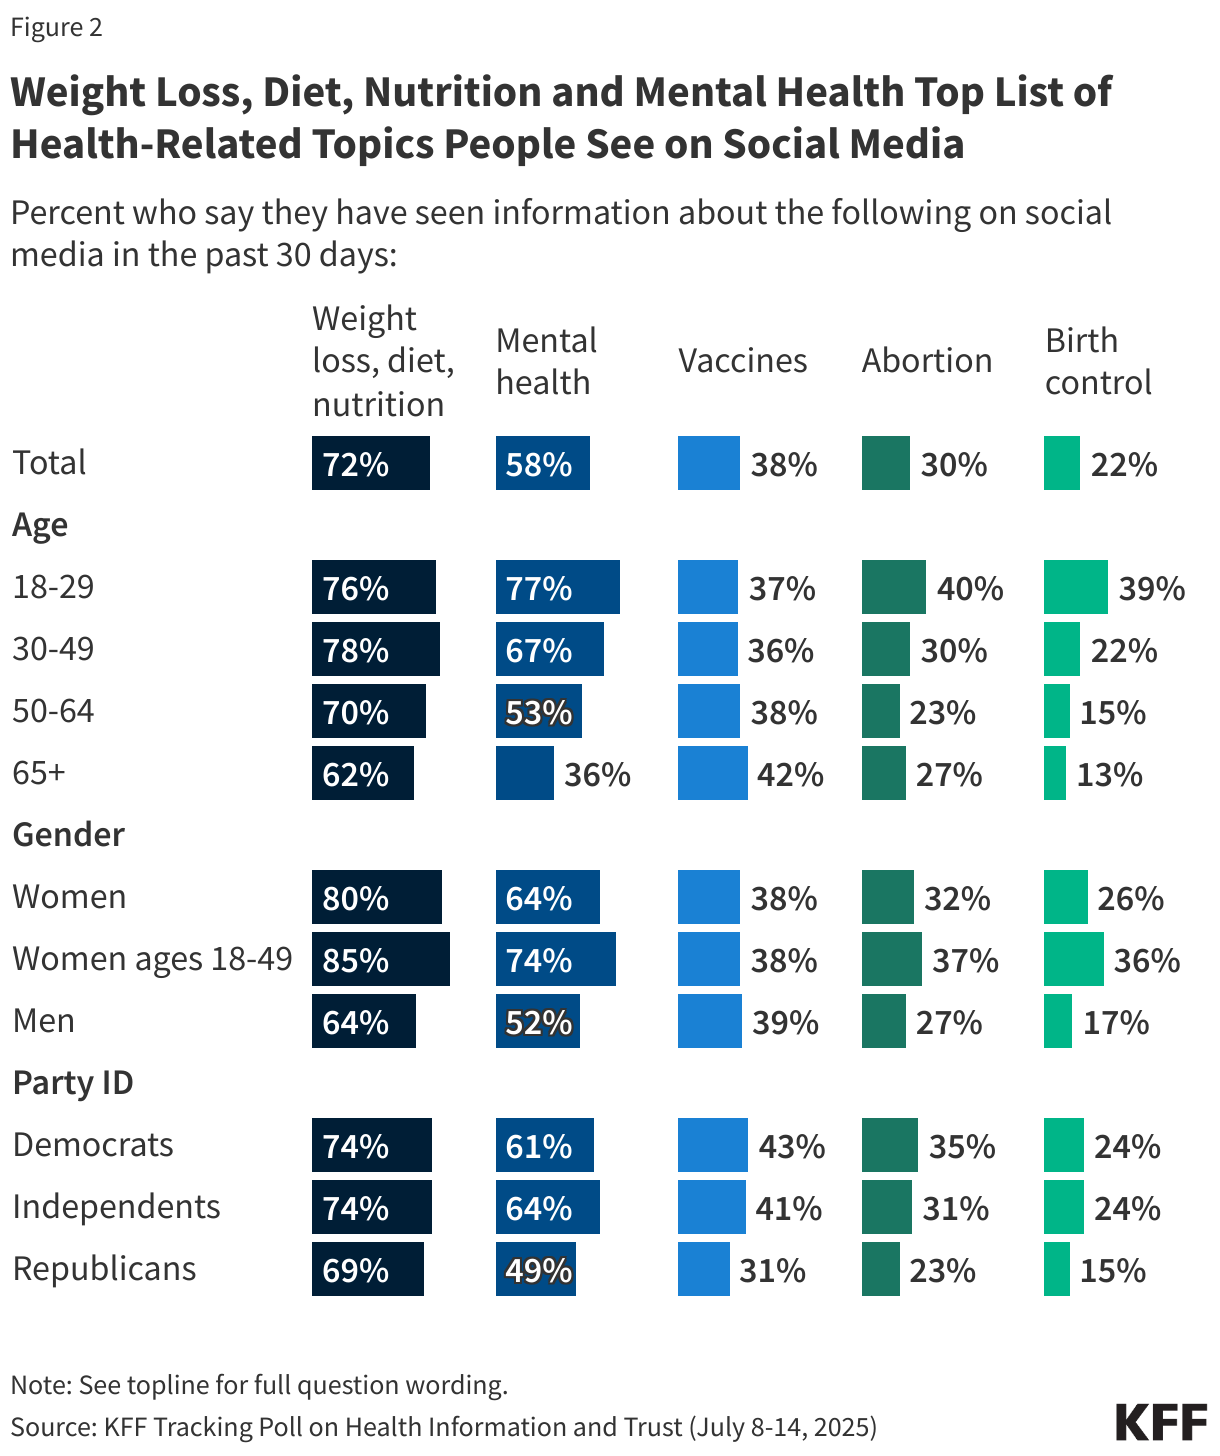
  • Just over half (55%) of adults, including larger shares of young adults and Black and Hispanic adults, say they use social media to find health information and advice at least occasionally and most adults report seeing health-related content in the past month on social media, with the largest shares saying they’ve seen content about weight loss, diet, or nutrition (72%) and mental health (58%). Overall, fewer adults report seeing content related to vaccines (38%), abortion (30%), and birth control (22%). Even people who say they never use social media for health information and advice report being exposed to health information in the past month – with weight loss, nutrition, and diet information being the most common.
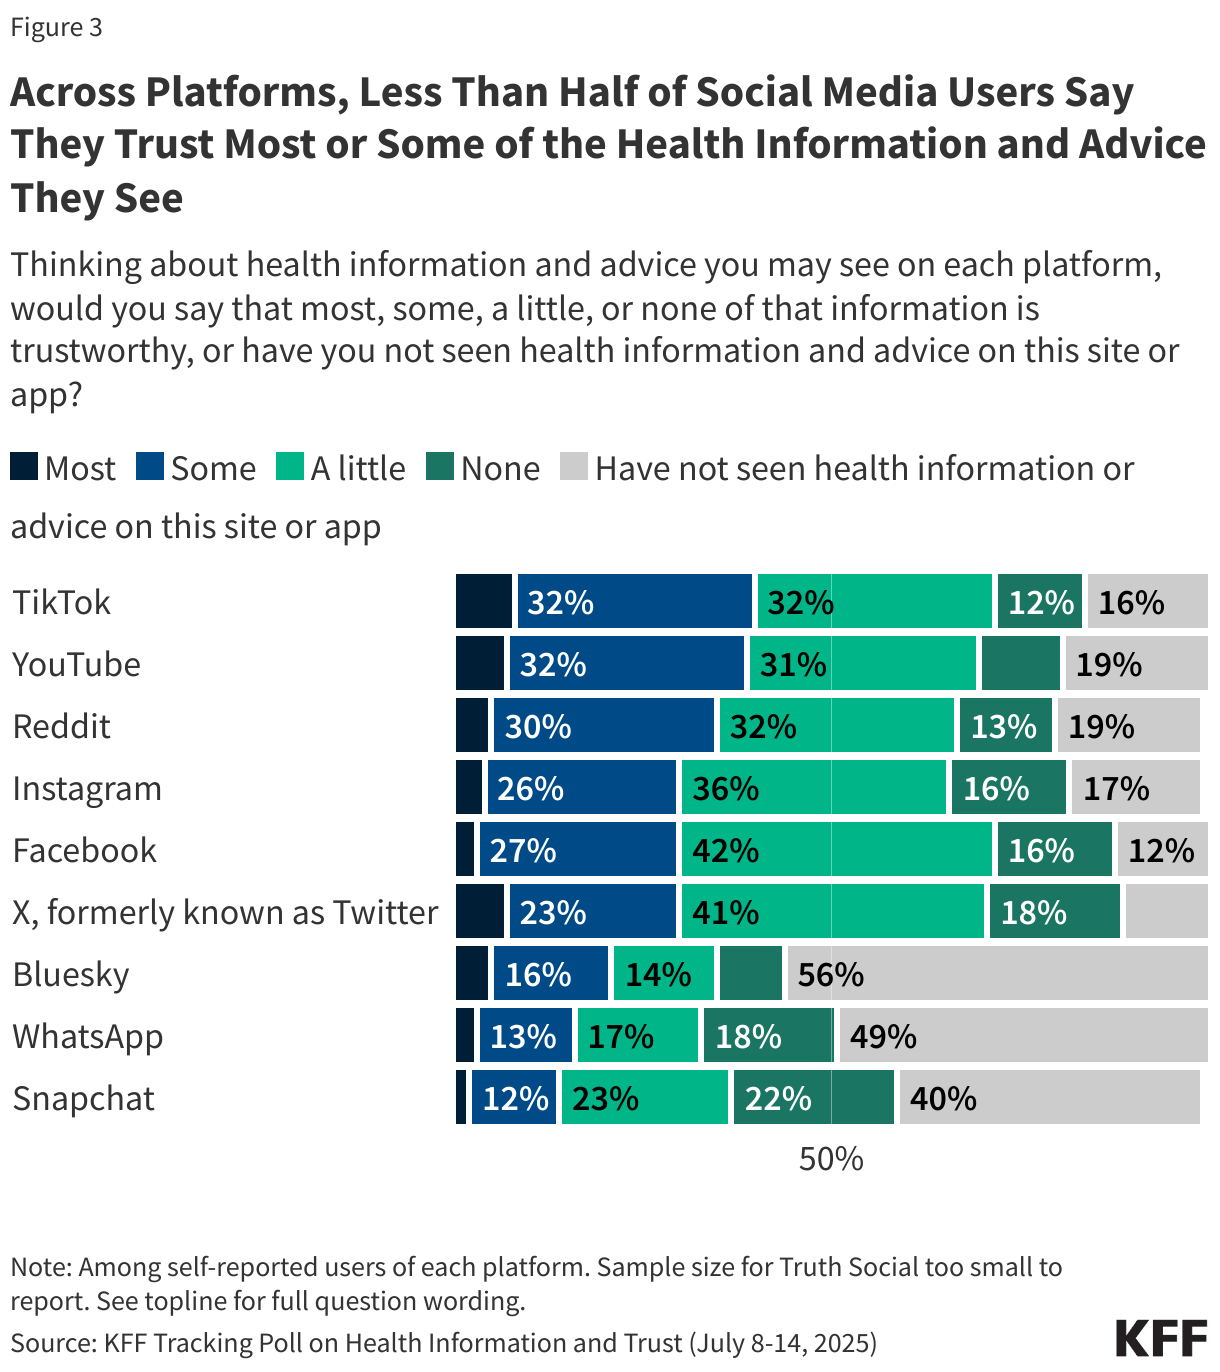
  • Most adults are skeptical of the health information and advice they see across social media platforms. When asked to assess the health information and advice on various social media platforms, fewer than half say they find “most” or “some” of the information they see on each platform trustworthy, and less than one in ten say “most” of the information is trustworthy. There is some variance across platforms, with at least three in ten users of YouTube, TikTok, and Reddit saying they trust “some” of the health content they see, compared to about a quarter of Facebook, Instagram, and X users, and smaller shares of users of WhatsApp, Snapchat, and Bluesky who say this.
  • About one in six (15%) social media users (14% of the public overall) say they regularly get health information and advice from social media influencers. Among those who report regularly getting health information and advice from influencers on social media, six in ten (61%) say health influencers are mostly motivated by their own financial interests, while about four in ten (39%) say health influencers are mostly motivated by serving the public interest. Among those who use social media for health information and advice, more than one-third (36%) say there is a particular influencer whom they trust when it comes to health information and advice (5% of total social media users), with a variety of individuals named, including conservative influencers, as well as doctors and other health care providers mentioned by name.

The Public’s Use of Social Media for Health Information and Advice

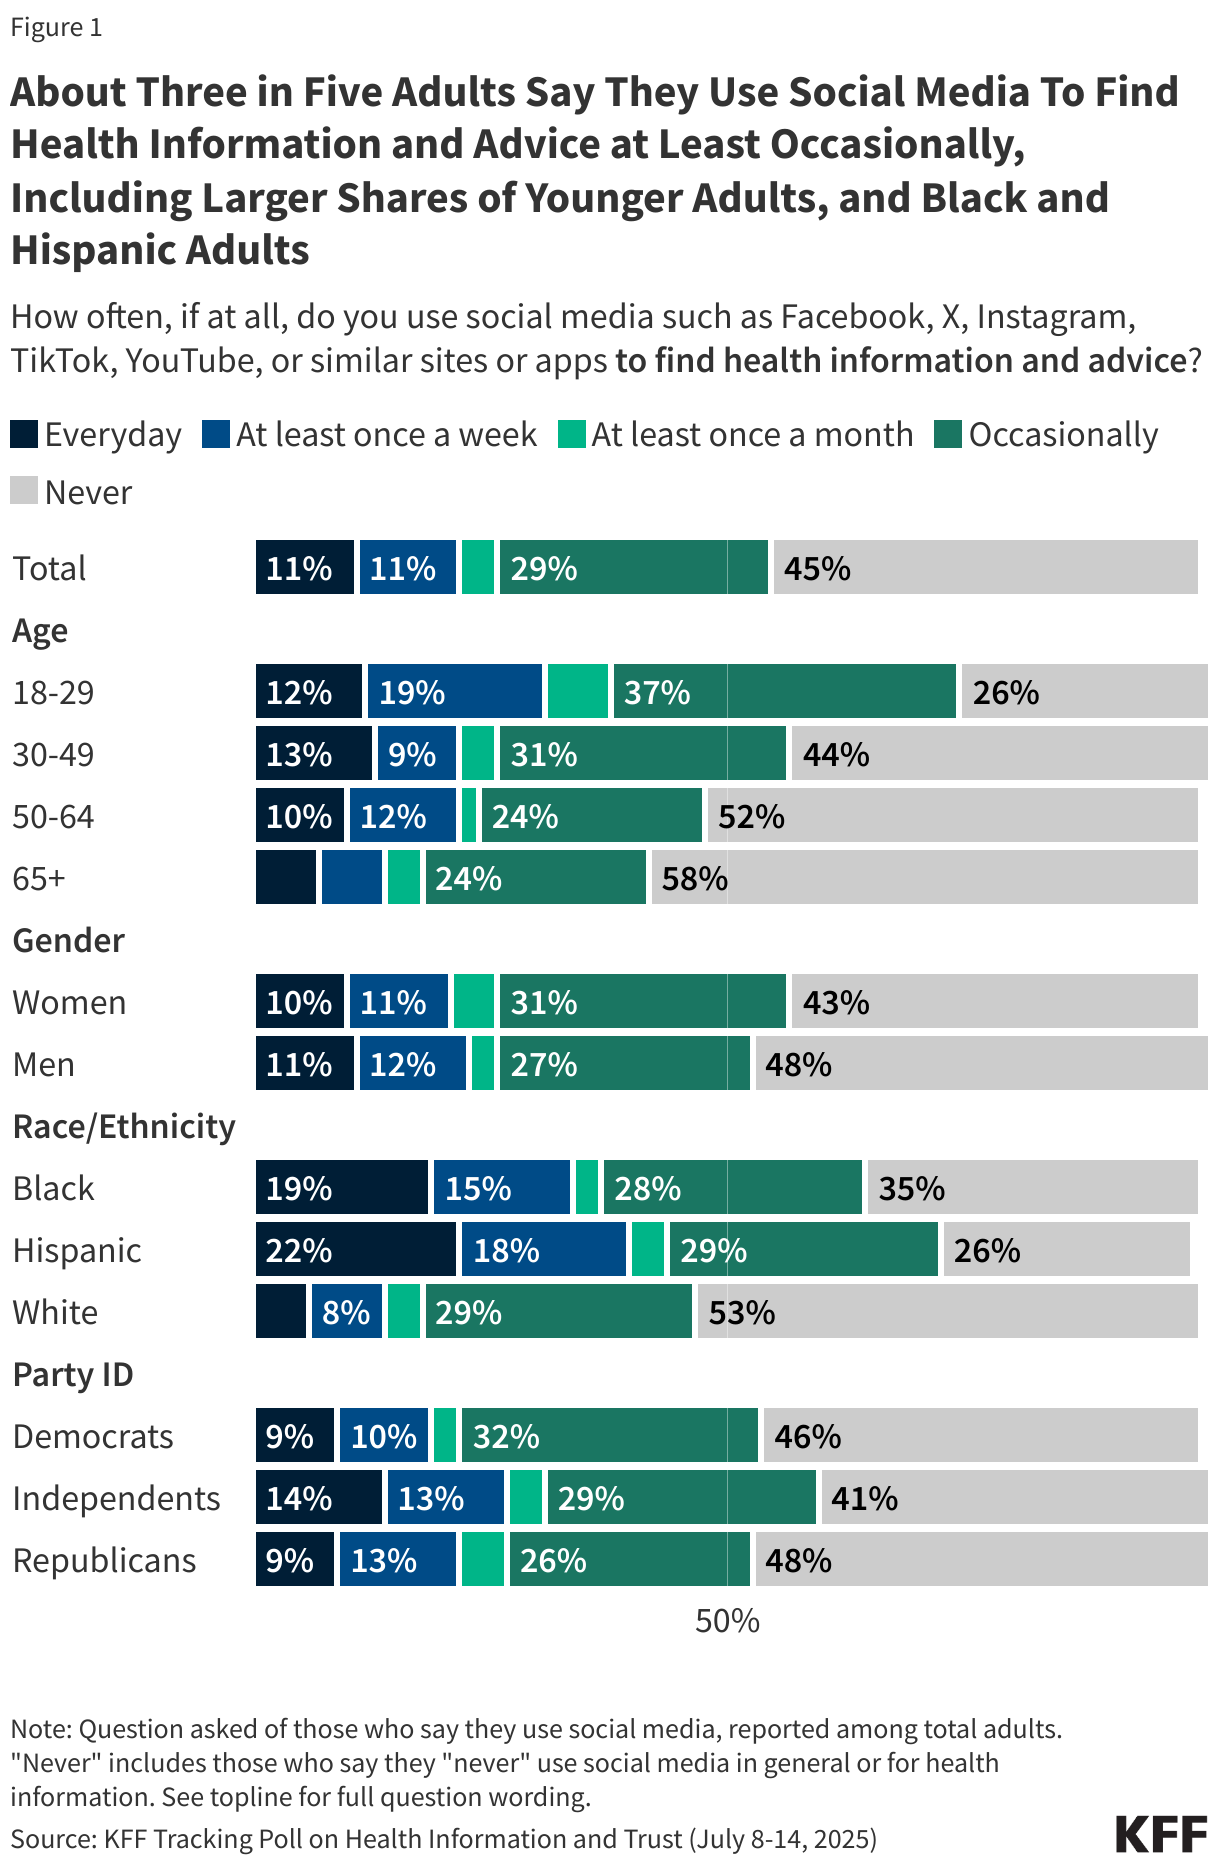
Just over half (55%) of adults say they use social media to find health information and advice “at least occasionally,” with larger shares of younger adults, and Black and Hispanic adults reporting this. Overall, about one in ten adults say they use these sites or apps to find health information and advice “everyday” (11%) or “at least once a week” (11%), 4% say they use it “at least once a month,” and about three in ten (29%) say they use it “occasionally” for this purpose. About four in ten (45%) adults say they never use social media to look up health information and advice. Younger adults and Black and Hispanic adults are more likely to report using social media to find health information and advice, while similar shares of social media users by gender and partisanship say they do this.

Stacked bar chart showing how often U.S. adults report using social media. Results shown by age gender, race/ethnicity, and party ID.

Majorities of the public report being exposed to health information and advice about weight loss, diet, and nutrition (72%) as well as mental health (58%) on social media in the past 30 days, with younger adults, women, and Democrats most likely to report seeing these topics. Overall, fewer adults report seeing other content related to vaccines (38%), abortion (30%), and birth control (22%) on social media in the past month. Democrats are more likely than their Republican counterparts to report seeing social media content in the past month related to mental health (61% vs. 49%), vaccines (43% vs. 31%), abortion (35% vs. 23%), and birth control (24% vs. 15%). Similar shares of adults by race and ethnicity report seeing most of these topics on social media, though White adults (41%) are more likely to report seeing content about vaccines compared with Black (34%) and Hispanic (29%) adults. Notably, sizeable shares of adults who say they “never” use social media to find health information and advice nonetheless report seeing these topics, including seven in ten who say they have seen weight loss, diet, and nutrition information on social media in the past month.

Split bar chart showing the share of U.S. adults who say that in the past 30 days, they have seen information on social media on various health-related topics. Results shown by age, gender and party ID.

Less than one in ten social media users say they trust most of the health information and advice they see on social media platforms. At least three in ten users of YouTube, TikTok, and Reddit say “some” of the health content they see is trustworthy, as do about a quarter of those who use Facebook, Instagram, and X. Smaller shares of users of WhatsApp, Snapchat, and Bluesky say the same. Importantly, across all social media platforms, a majority of users say they trust the health information they see on the app either “a little” or say that none of the information is trustworthy.

Stacked bar chart showing how must trust U.S. adult users of each platform have in the health information and advice they see.

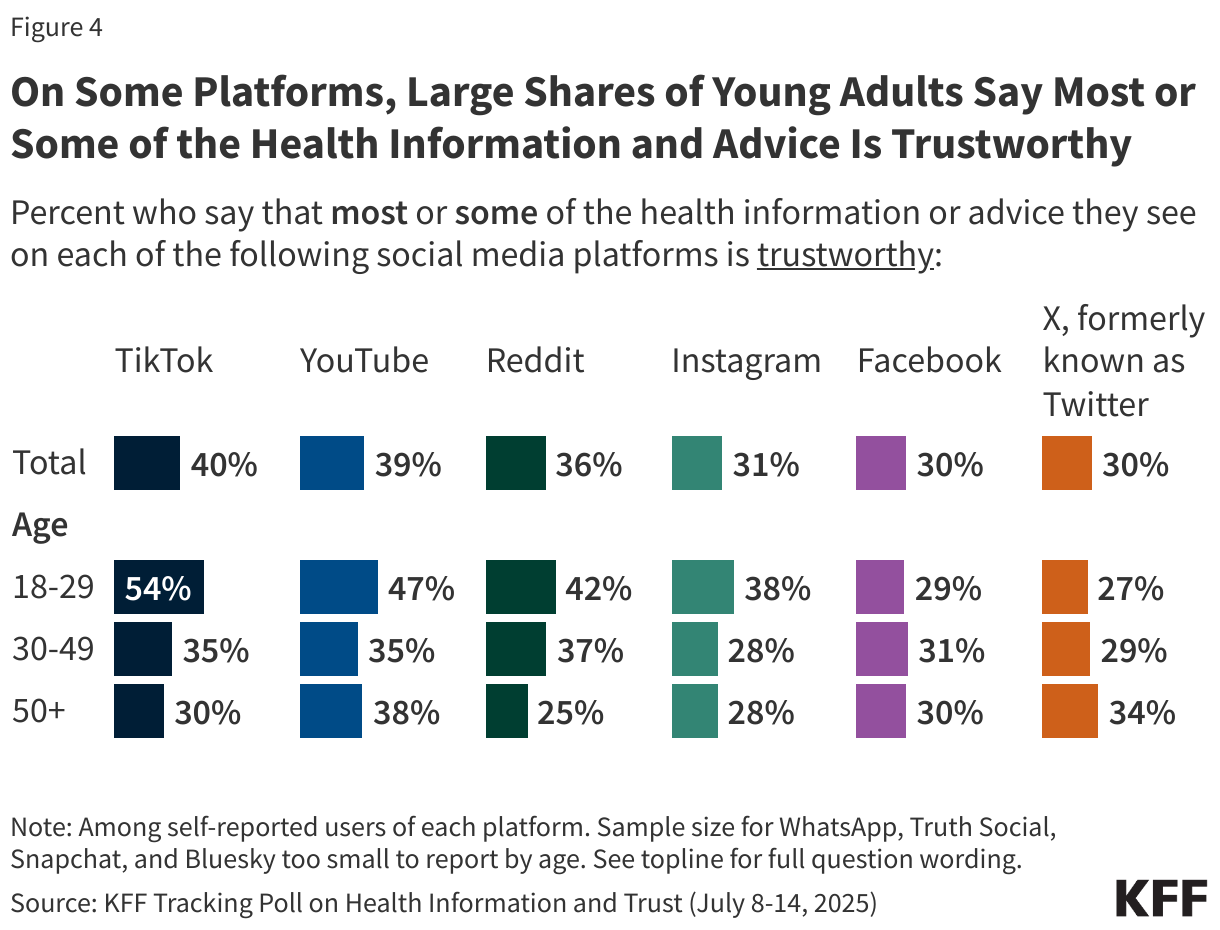
On some of the most widely used social media apps or sites, large shares of younger adults trust the health information and advice they see. For example, just over half (54%) of TikTok users ages 18-29 say “most” or “some” of the health information and advice they see on the app is trustworthy, as do about half (47%) of young YouTube users, and about four in ten young Reddit (42%) and Instagram (38%) users. On lesser used sites by young adults like Facebook and X, younger adults are as trusting of the health information they see as older adults.

Split bar chart showing the share of U.S. adult users of each platform who have at least some trust in the health information or advice they see on each platform.

The Role of Social Media Health Influencers

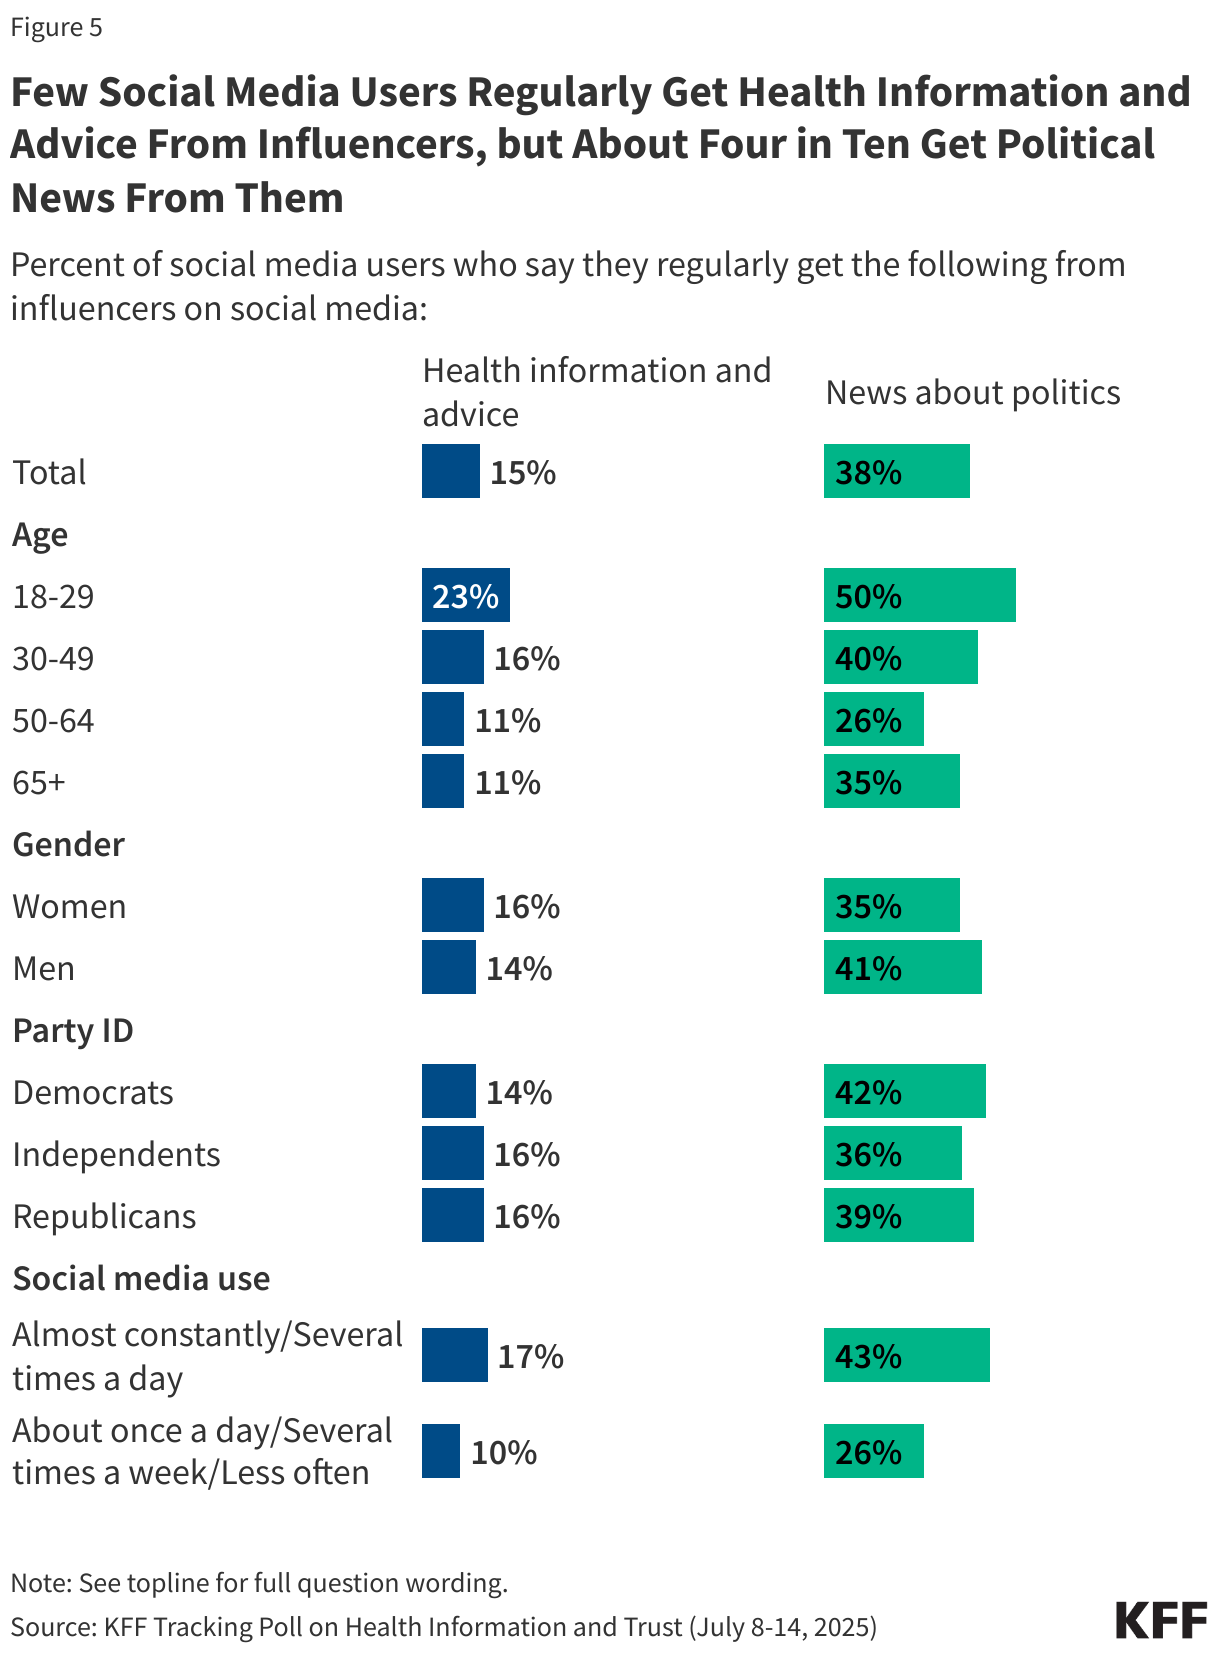
About one in six (15%) adults who use social media (14% of the public overall) say they regularly get health information and advice from influencers on social media. Notably, the share who say they get health information and advice from social media influencers is much smaller than the share who say they get news about politics from social media influencers (38% say so). Certain groups are more likely to report relying on social media influencers for health information and advice including about one in five 18–29-year-olds (23%) and Black adults who use social media (21%). Perhaps unsurprisingly, more frequent social media users are more likely to say they get health information and advice from influencers than less frequent social media users. Similar shares of social media users by gender and partisanship say they get health information and advice from influencers. About one in five users of each social media platform say they regularly get health information and advice, ranging from 15% of YouTube users to 21% of TikTok users.

Split bar chart showing the share of U.S. adults who report regularly getting health information and advice and news about politics from influencers on social media. Results by age gender, party ID, and social media use.

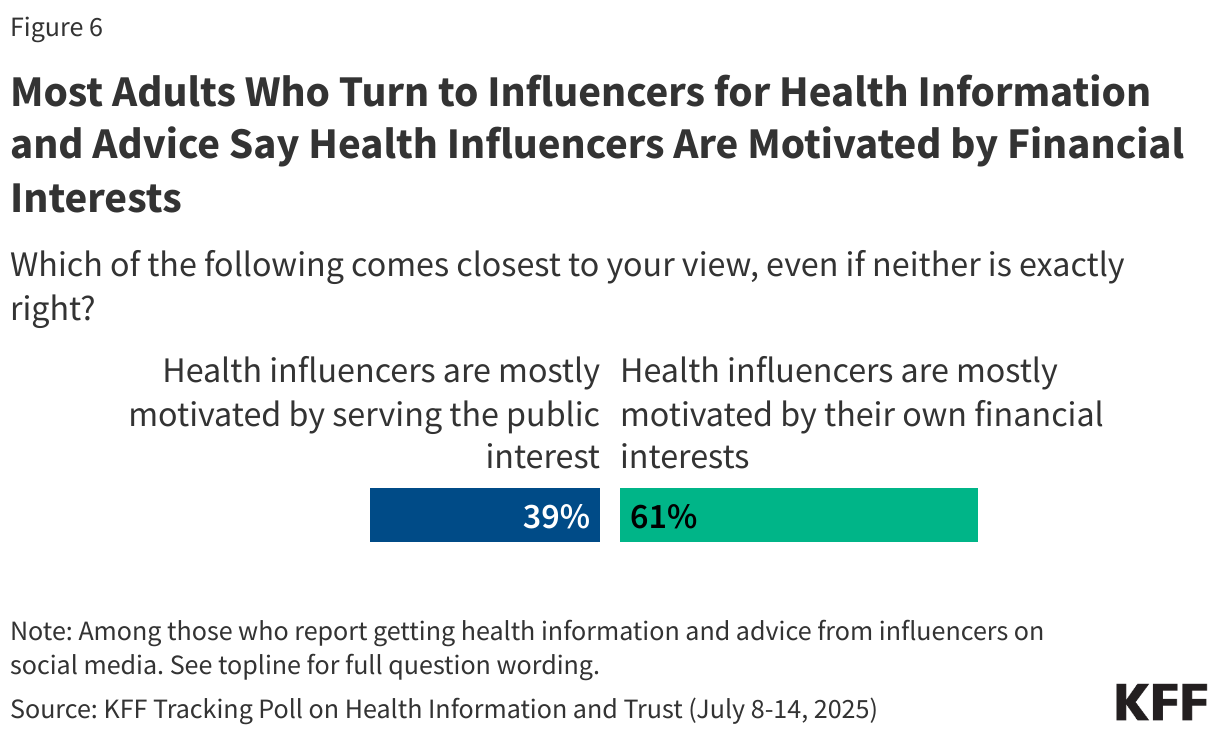
Among those who report regularly getting health information and advice from influencers on social media, six in ten (61%) say health influencers are mostly motivated by their own financial interests, while about four in ten (39%) say health influencers are mostly motivated by serving the public interest.

Split bar chart showing whether people who report getting health information and advice from influencers on social media believe these influencers are motivated to serve the public or by financial interests.

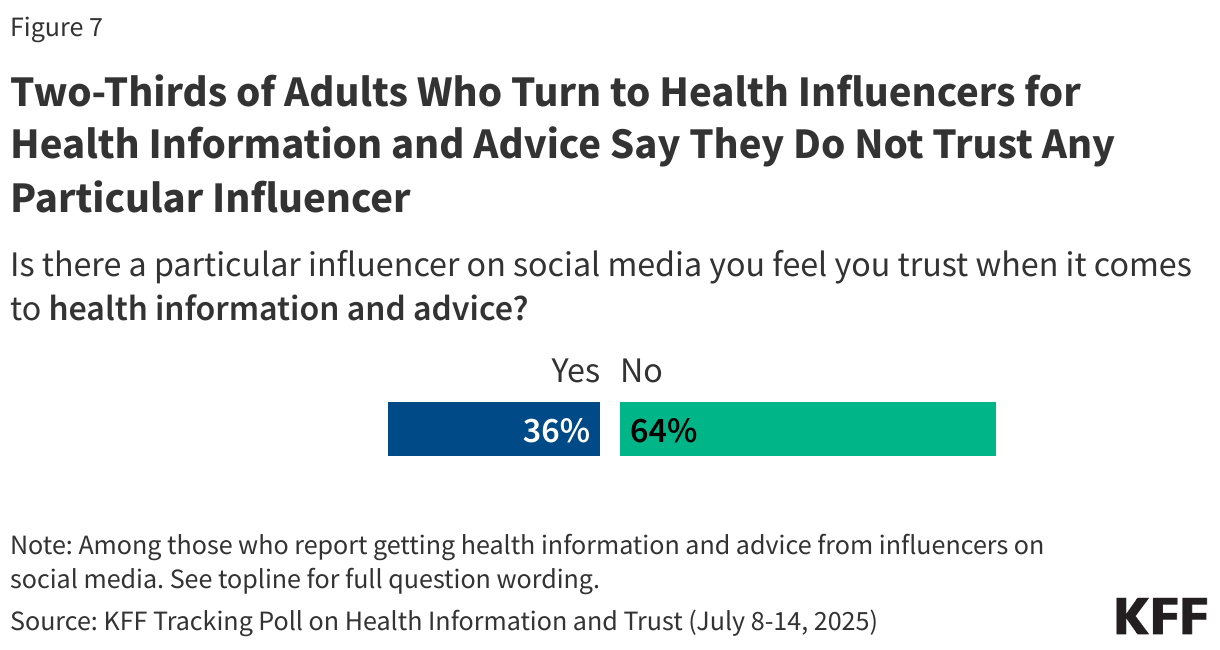
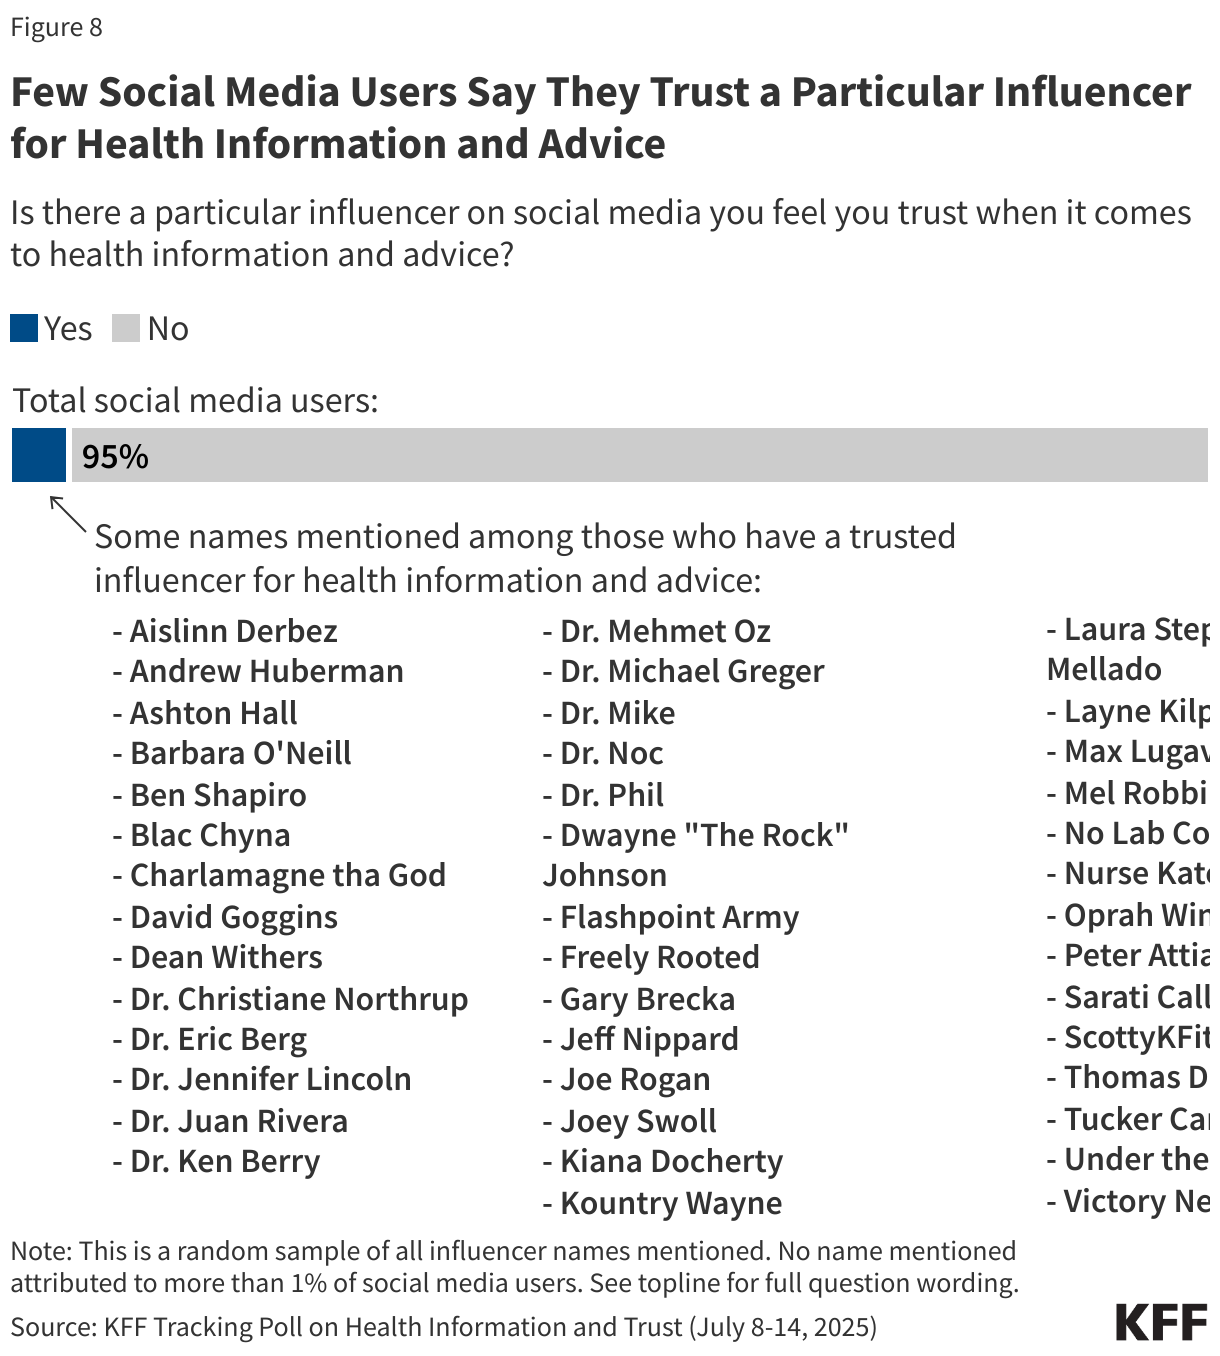
One-third (36%) of those who use social media for health information and advice say they trust a particular influencer for this (5% of total social media users). When asked to give the name or handle of the person whom they trust for health information and advice, a variety of individuals are mentioned, including Barbara O’Neill and Nurse Kate, conservative influencers like Ben Shapiro, Joe Rogan, as well as doctors and other health care providers who were mentioned by name.

Split bar chart showing whether people who report getting health information and advice from influencers on social media have a particular influencer they trust.
Bar chart showing that 5 percent of social media users say they have a particular trusted influencer, and a list of some names mentioned.

This KFF Health Tracking Poll/KFF Tracking Poll on Health Information and Trust was designed and analyzed by public opinion researchers at KFF. The survey was conducted July 8-14, 2025, online and by telephone among a nationally representative sample of 1,283 U.S. adults in English (n=1,212) and in Spanish (n=71). The sample includes 1,004 adults (n=58 in Spanish) reached through the SSRS Opinion Panel either online (n=979) or over the phone (n=25). The SSRS Opinion Panel is a nationally representative probability-based panel where panel members are recruited randomly in one of two ways: (a) Through invitations mailed to respondents randomly sampled from an Address-Based Sample (ABS) provided by Marketing Systems Groups (MSG) through the U.S. Postal Service’s Computerized Delivery Sequence (CDS); (b) from a dual-frame random digit dial (RDD) sample provided by MSG. For the online panel component, invitations were sent to panel members by email followed by up to three reminder emails.

Another 279 (n=13 in Spanish) adults were reached through random digit dial telephone sample of prepaid cell phone numbers obtained through MSG. Phone numbers used for the prepaid cell phone component were randomly generated from a cell phone sampling frame with disproportionate stratification aimed at reaching Hispanic and non-Hispanic Black respondents. Stratification was based on incidence of the race/ethnicity groups within each frame. Among this prepaid cell phone component, 135 were interviewed by phone and 144 were invited to the web survey via short message service (SMS).

Respondents in the prepaid cell phone sample who were interviewed by phone received a $15 incentive via a check received by mail. Respondents in the prepaid cell phone sample reached via SMS received a $10 electronic gift card incentive. SSRS Opinion Panel respondents received a $5 electronic gift card incentive (some harder-to-reach groups received a $10 electronic gift card). In order to ensure data quality, cases were removed if they failed two or more quality checks: (1) attention check questions in the online version of the questionnaire, (2) had over 30% item non-response, or (3) had a length less than one quarter of the mean length by mode. Based on this criterion, 1 case was removed.

The combined cell phone and panel samples were weighted to match the sample’s demographics to the national U.S. adult population using data from the Census Bureau’s 2024 Current Population Survey (CPS), September 2023 Volunteering and Civic Life Supplement data from the CPS, and the 2025 KFF Benchmarking Survey with ABS and prepaid cell phone samples. The demographic variables included in weighting for the general population sample are gender, age, education, race/ethnicity, region, civic engagement, frequency of internet use, political party identification by race/ethnicity, and education. The weights account for differences in the probability of selection for each sample type (prepaid cell phone and panel). This includes adjustment for the sample design and geographic stratification of the cell phone sample, within household probability of selection, and the design of the panel-recruitment procedure.

The margin of sampling error including the design effect for the full sample is plus or minus 3 percentage points. Numbers of respondents and margins of sampling error for key subgroups are shown in the table below. For results based on other subgroups, the margin of sampling error may be higher. Sample sizes and margins of sampling error for other subgroups are available on request. Sampling error is only one of many potential sources of error and there may be other unmeasured error in this or any other public opinion poll. KFF public opinion and survey research is a charter member of the Transparency Initiative of the American Association for Public Opinion Research.

GroupN (unweighted)M.O.S.E.
Total1,283± 3 percentage points
Party ID
Democrats439± 6 percentage points
Independents387± 6 percentage points
Republicans344± 6 percentage points
MAGA Republicans308± 7 percentage points

How Much and Why ACA Marketplace Premiums Are Going Up in 2026

Authors: Jared Ortaliza, Matt McGough, Kaitlyn Vu, Imani Telesford, Shameek Rakshit, Emma Wager, Lynne Cotter, and Cynthia Cox
Published: Aug 6, 2025

A new analysis of initial rate filings for Affordable Care Act (ACA) Marketplace plans submitted by 312 insurers in all 50 states and the District of Columbia finds the median proposed increase for 2026 is 18%, more than double last year’s 7% median proposed increase. The proposed rates are preliminary and could change before being finalized in late summer.

In addition to rising cost and utilization of services, insurers cited the expiration of enhanced premium tax credits as a significant factor in their rate hikes for next year. The analysis includes a data table showing proposed premium increases by state and by insurers.

The full analysis and other data on health costs are available on the Peterson-KFF Health System Tracker, an online information hub dedicated to monitoring and assessing the performance of the U.S. health system.

A Spotlight on Vasectomy

Published: Aug 5, 2025

While the Affordable Care Act requires most private health plans to provide coverage with no cost-sharing for a range of recommended preventive services, including female contraceptives and female sterilization, because male condoms and vasectomy procedures are considered to be services for men, they are not required to be covered under the law.  Vasectomies, considered permanent sterilization methods for men, are typically out-patient procedures and can cost $1,000 or more without insurance.  These procedures are generally much simpler and have fewer risks that tubal ligations which is the procedure that women who seek permanent contraception typically get. As part of the 2024 KFF Women’s Health Survey, a nationally representative sample of 1,191 men ages 18 to 64 were surveyed on a broad range of health issues. This data note highlights their responses to their experiences, knowledge, and perspectives about vasectomy services.

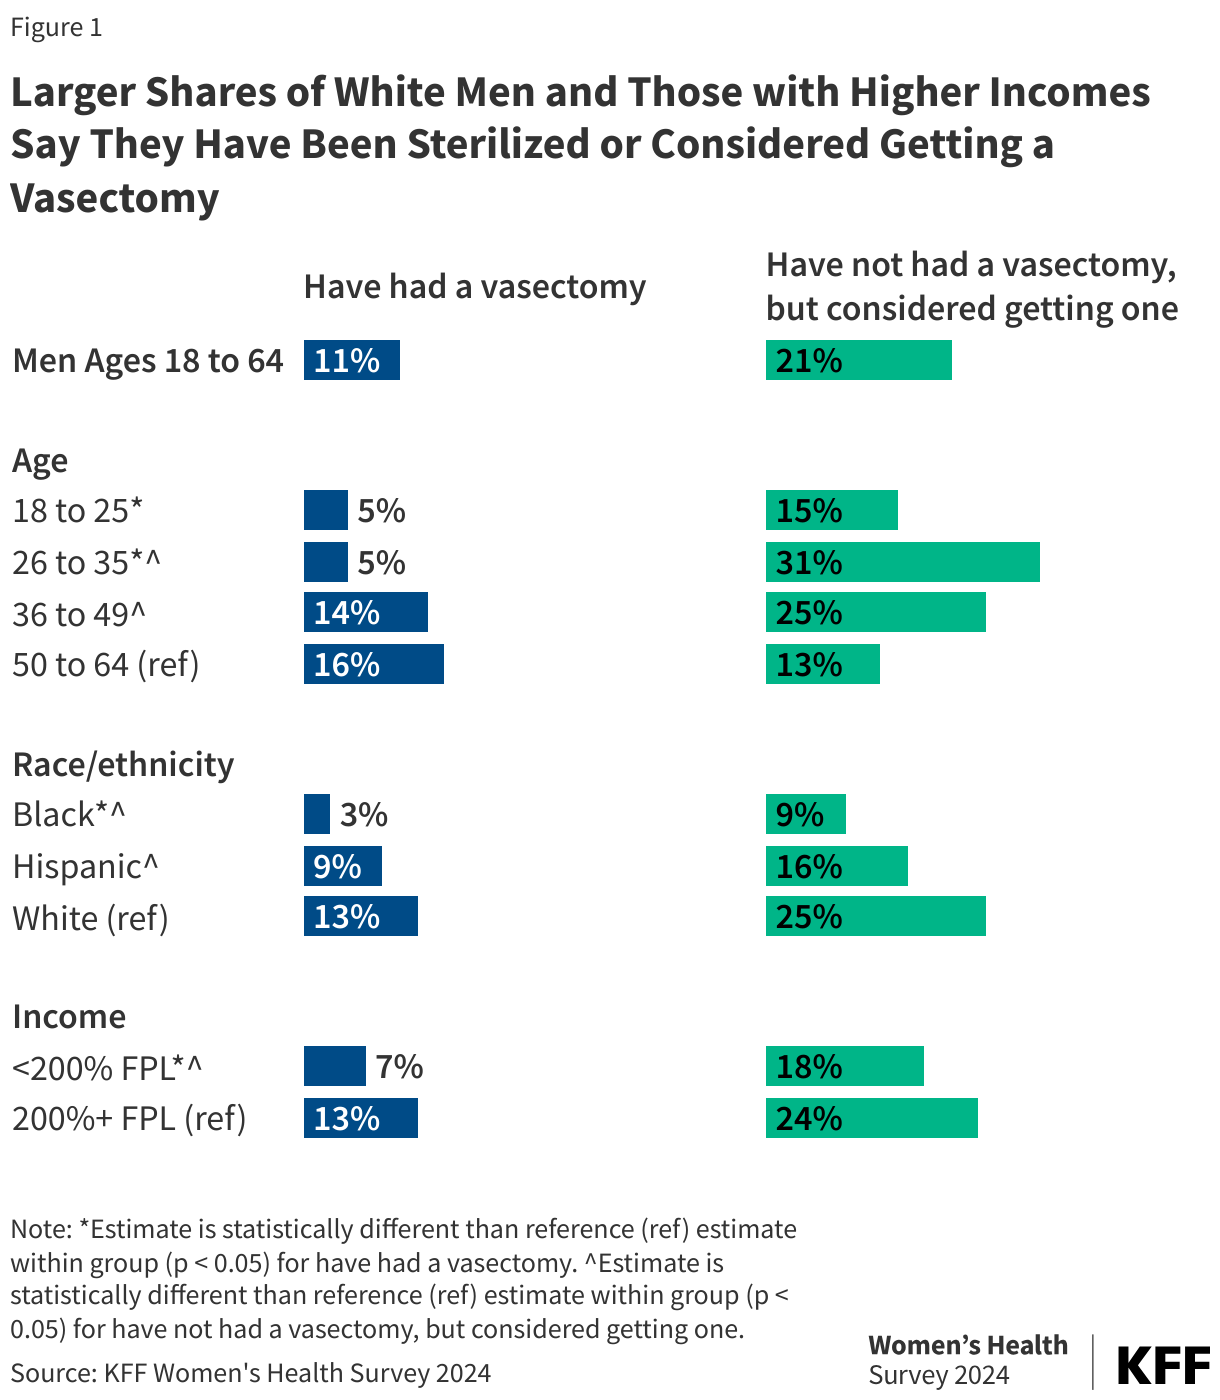
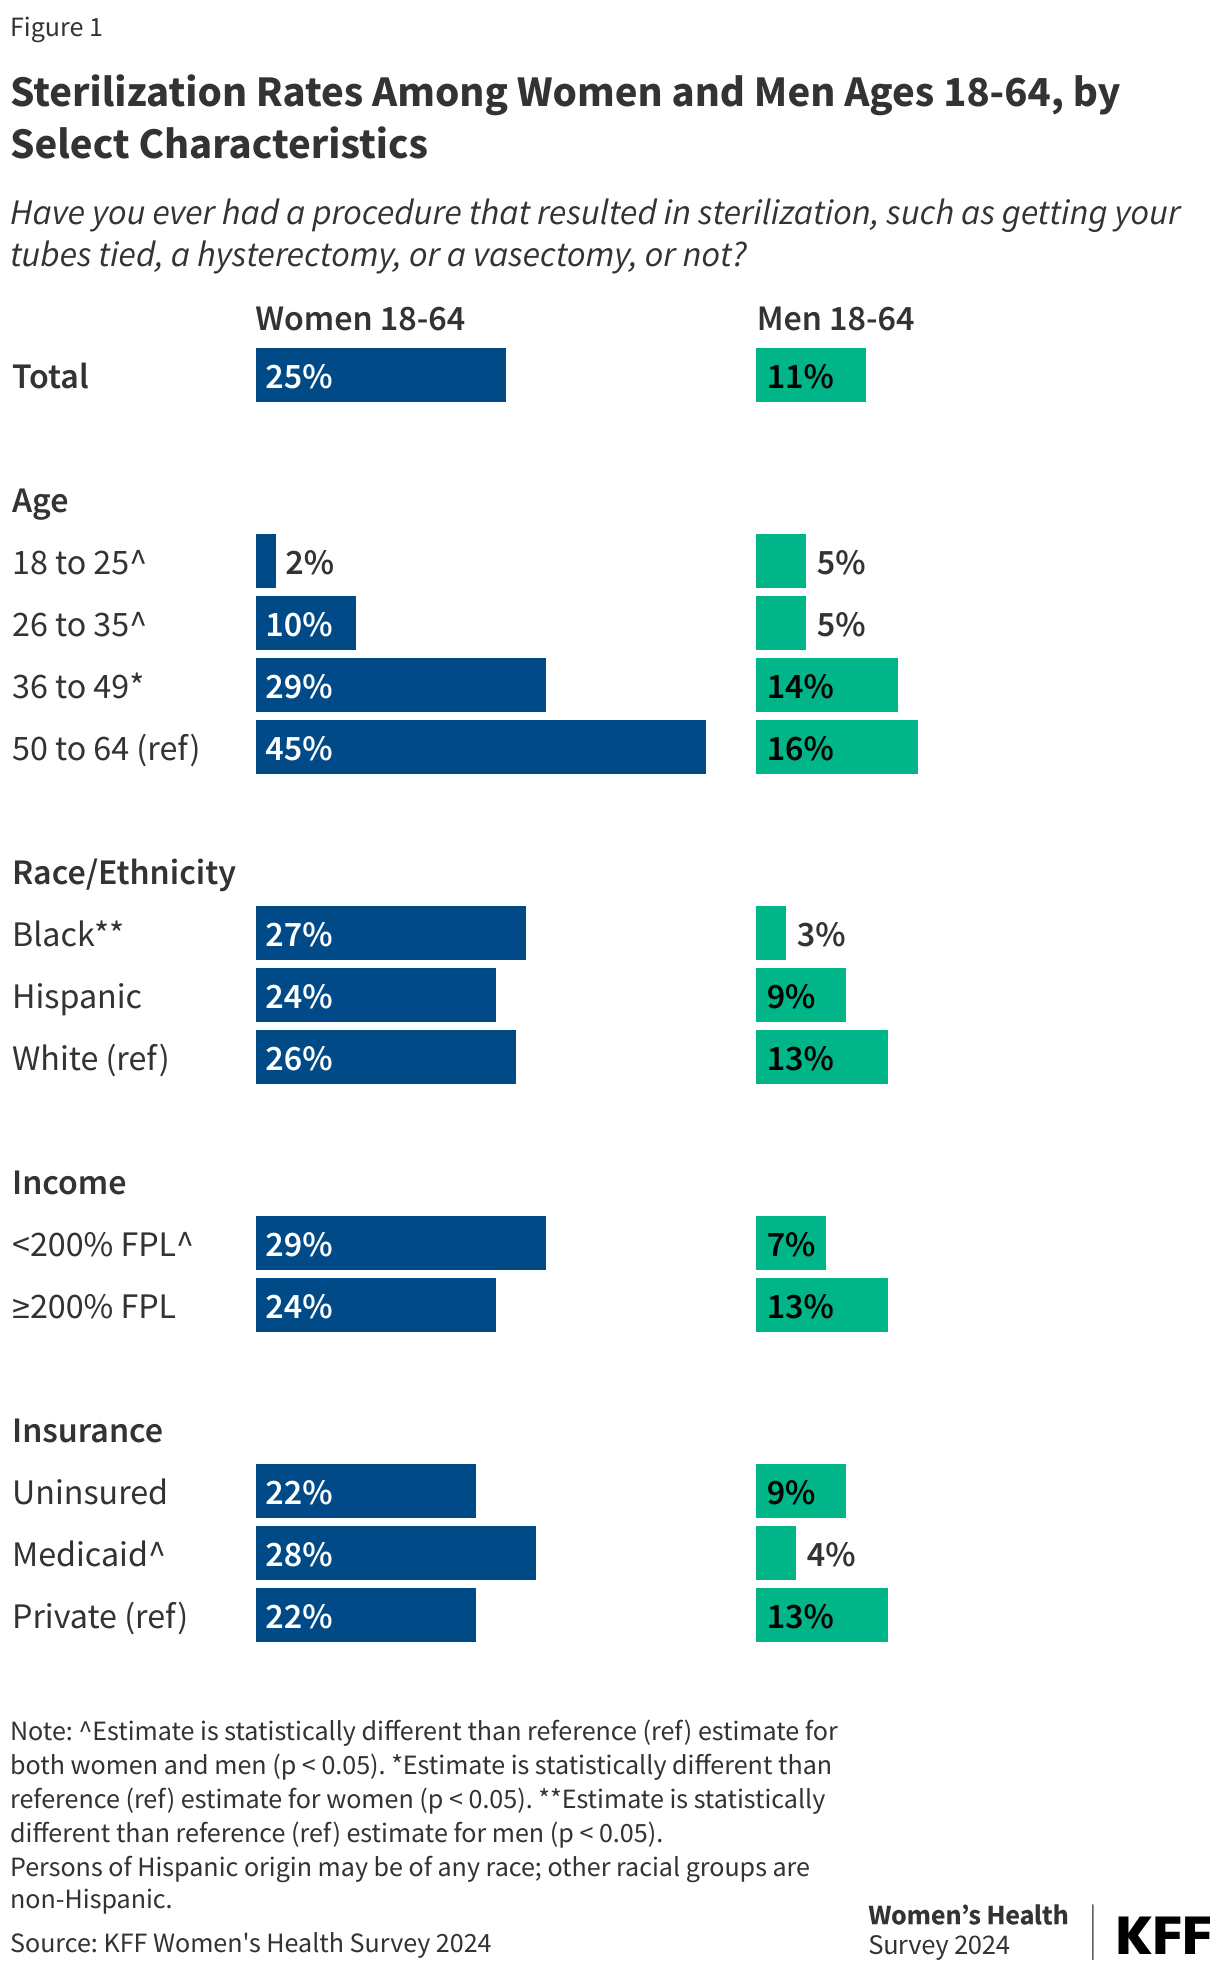
Just over one in ten men ages 18 to 64 (11%) say they have had a procedure that resulted in sterilization, such as a vasectomy (Figure 1). This rate is half of that reported by women, where 25% of those in the same age range report sterilization as their contraceptive method. Larger shares of older men say they have been sterilized compared to younger men, but 5% of men ages 18 to 25 report they have been sterilized. Over one in ten White men (13%) report having been sterilized compared to just 3% of Black men. Smaller shares of men with low incomes have had a sterilization procedure compared to men with higher incomes (7% vs.13%).

Larger Shares of White Men and Those with Higher Incomes Say They Have Been Sterilized or Considered Getting a Vasectomy

Among men who have not had a sterilization procedure, one in five (21%) say they would consider getting a vasectomy. The largest shares of men who would consider getting a vasectomy include men ages 26 to 35 (31%) and men ages 36 to 49 (25%), White men (25%), and men with higher incomes (24%).

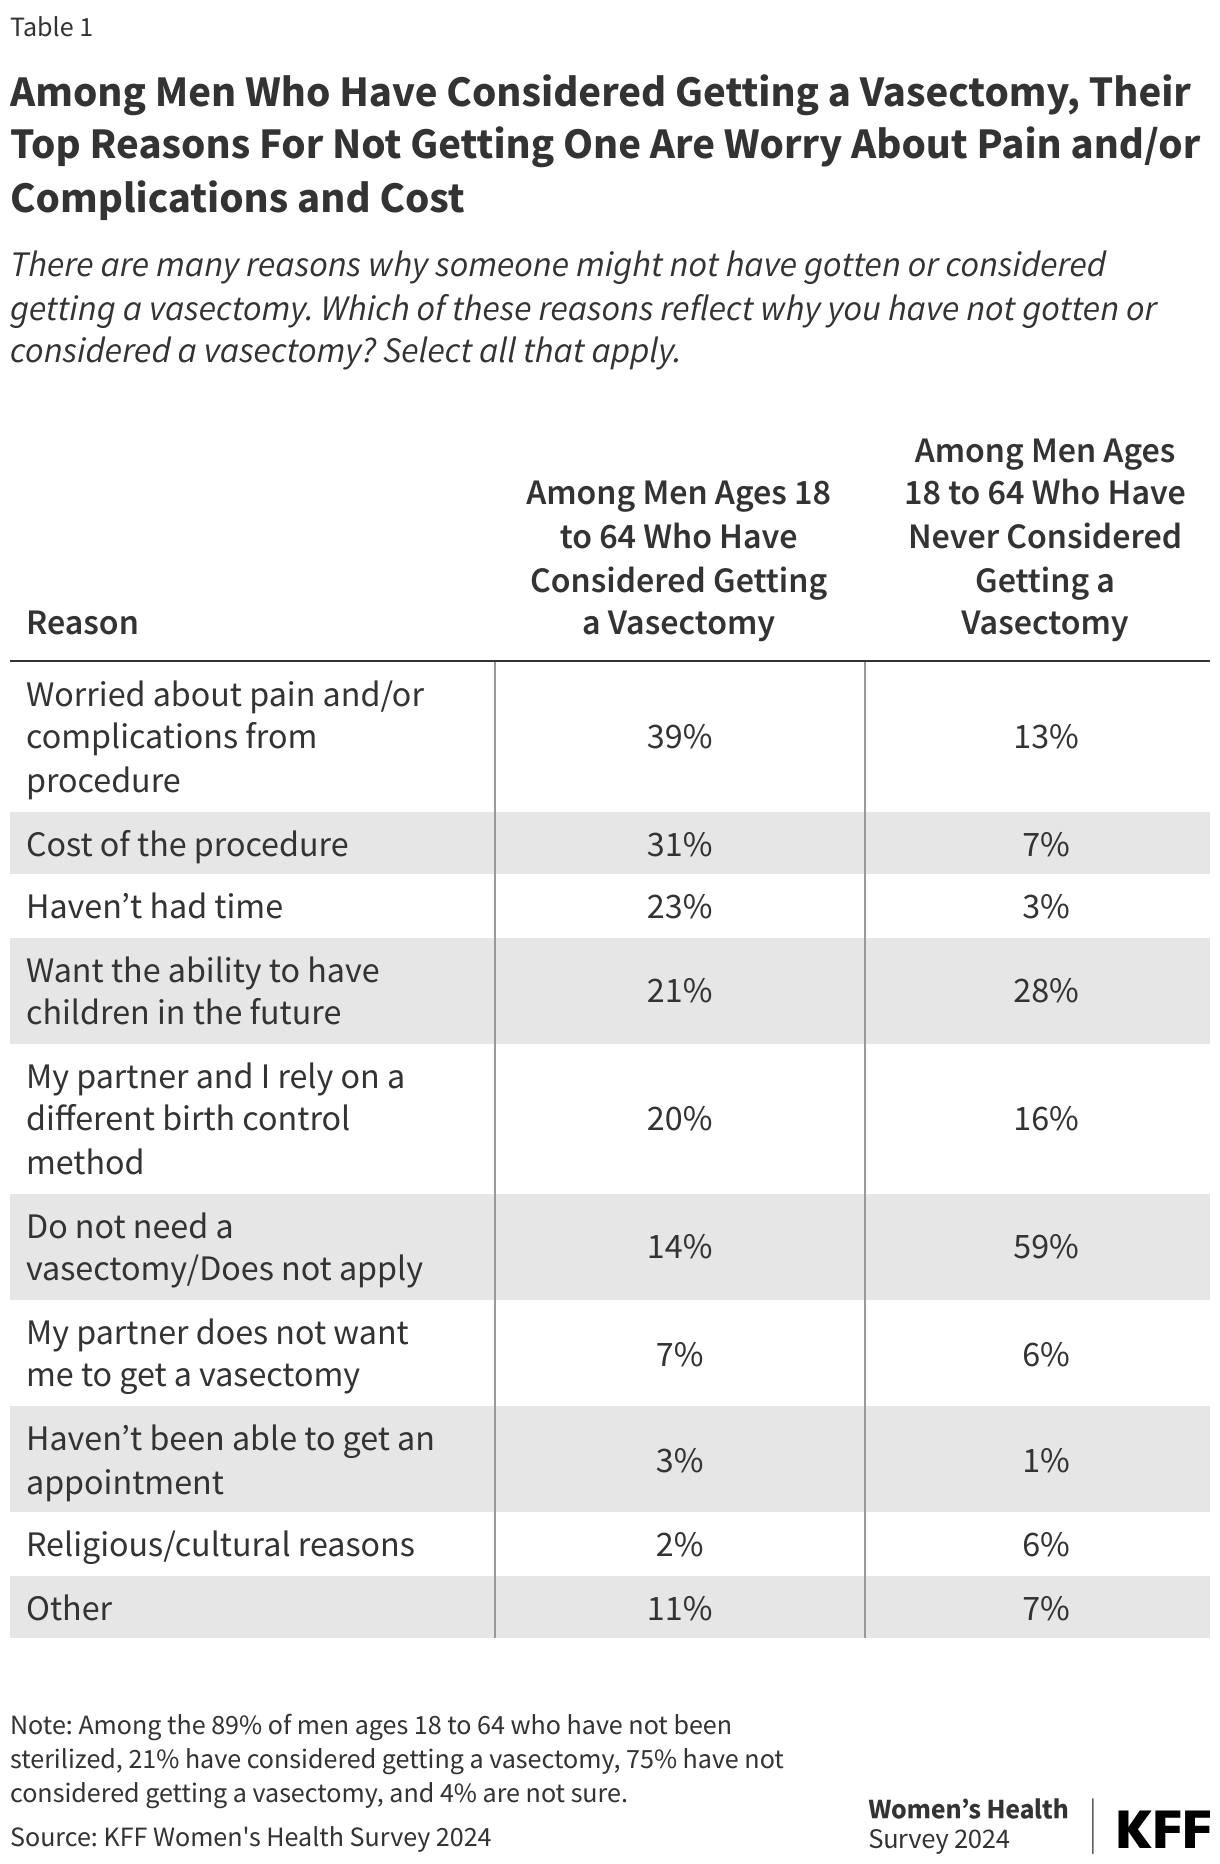
Among men ages 18 to 64 who have considered getting a vasectomy but have not had one, reasons for not seeking the procedure included: worry about pain and/or complications from the procedure (39%), the cost of the procedure (31%), not having the time (23%), wanting the ability to have children in the future (21%), and relying on a different birth control method with their partner (20%) (Table 1). Among those who have never considered getting a vasectomy, six in ten (59%) say they do not need a vasectomy, or the question does not apply to them.

Among Men Who Have Considered Getting a Vasectomy, Their Top Reasons For Not Getting One Are Worry About Pain and/or Complications and Cost

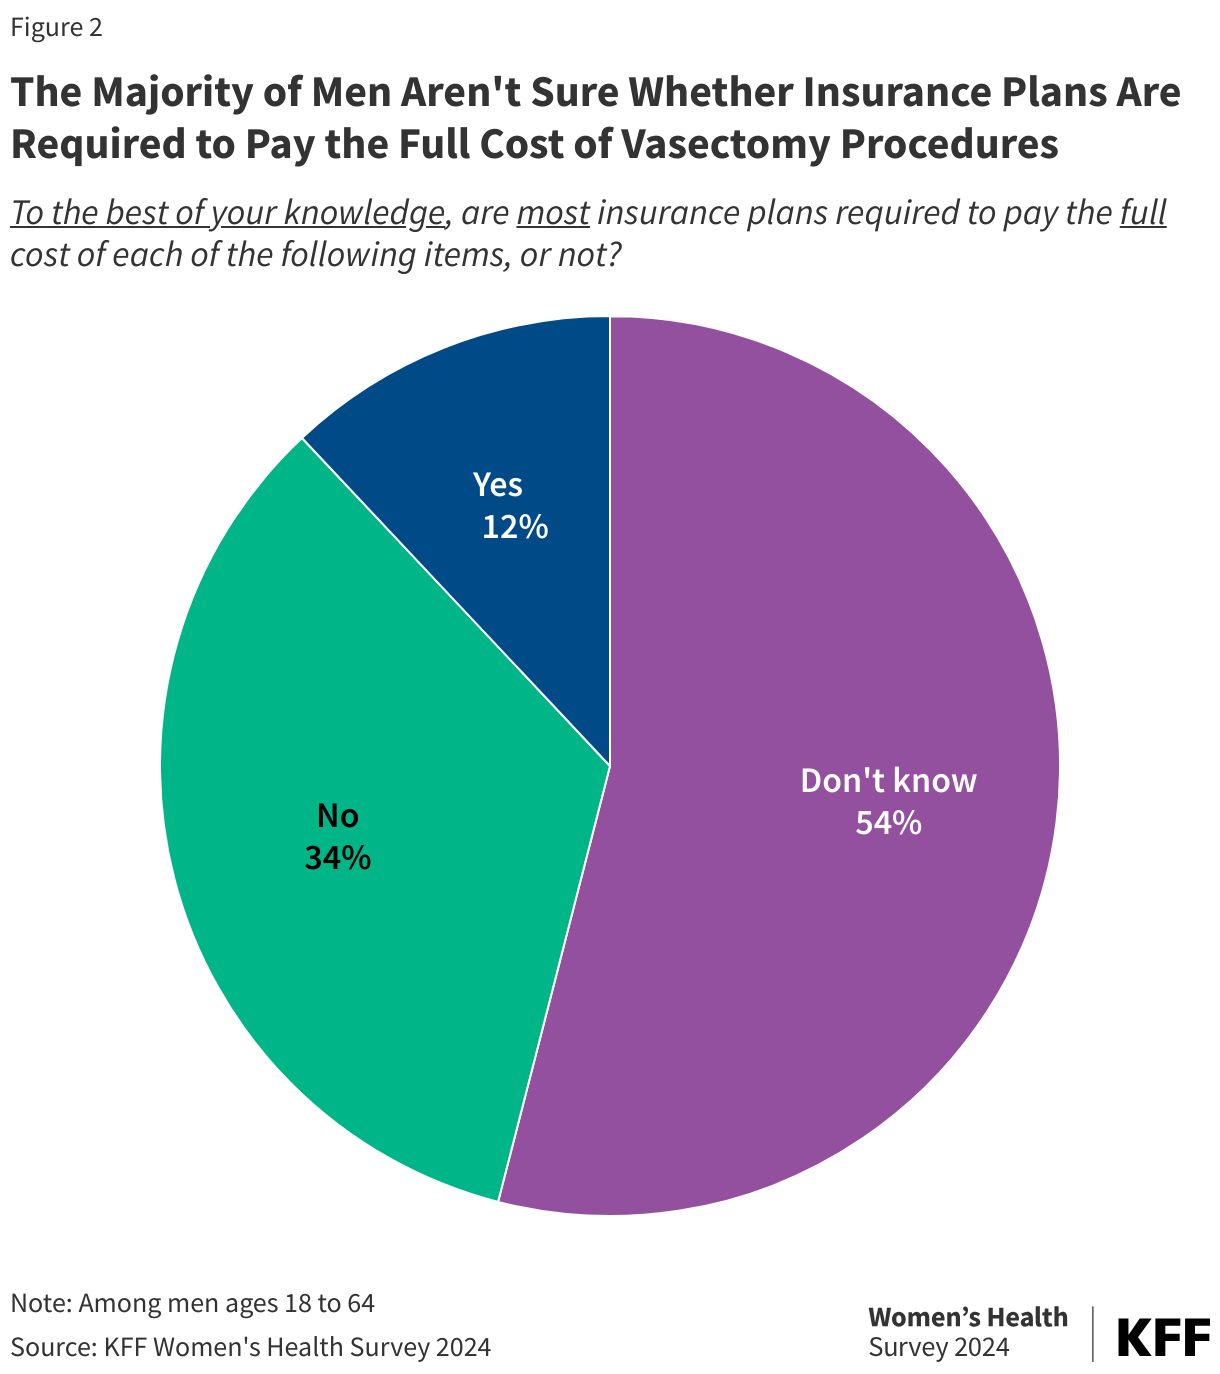
Regarding the perspectives about cost, most men aren’t sure whether insurance plans are required to pay the full cost of vasectomy procedures, which they are not required to cover. Plans may cover the procedure, but typically it is with cost-sharing, and the out-of-pocket costs are determined by plan coverage policy and deductibles. There are considerable gaps in understanding of coverage policy. A third (34%) of men ages 18 to 64 were aware that this was not a coverage requirement, but over half did not know (Figure 2).

The Majority of Men Aren't Sure Whether Insurance Plans Are Required to Pay the Full Cost of Vasectomy Procedures

There have been recent state-level policy changes to cover vasectomy procedures at no-cost similar to how sterilization procedures for women are required to be covered by federal law. As of June 2025, nine states require state-related health insurance plans to cover vasectomies at no cost to the patient: California, Illinois, Maryland, New Jersey, New Mexico, New York, Oregon, Vermont, and Washington. However, state-regulated benefit requirements do not apply to self-insured employer plans, which covered about two-thirds (63%) of covered workers in 2024.

Sterilization or Permanent Contraception as a Family Planning Method

Published: Aug 5, 2025

Sterilization or permanent contraception is the most commonly used form of family planning in the United States. There are two main methods of sterilization: tubal ligations and vasectomies. Both are safe and nearly 100% effective in preventing pregnancy. The Affordable Care Act’s (ACA) contraceptive coverage requirement applies to sterilization procedures for women, but not for men. Some states, however, have passed laws that require male procedures to be covered by state-regulated insurance plans. Permanent contraception services, however, are not available in all health care settings due to policies followed by faith-based health providers that have religious objections to the procedures. This fact sheet explains the types of permanent contraception or sterilization procedures available, reviews private insurance and Medicaid coverage policy, and discusses issues that affect availability in the U.S.

Types of Sterilization

Tubal Ligation

Tubal ligation is an outpatient surgical procedure conducted on people with female reproductive organs in which the fallopian tubes are either removed or blocked to prevent eggs from travelling to the uterus and sperm from fertilizing eggs. Data from the 2024 KFF Women’s Health Survey show that one in four women between the ages of 18 and 64 report they have had a sterilization procedure. Larger shares of women 50 years old and older, women with lower incomes, and women with Medicaid have had a sterilization procedure (Figure 1).

Sterilization Rates Among Women and Men Ages 18-64, by Select Characteristics

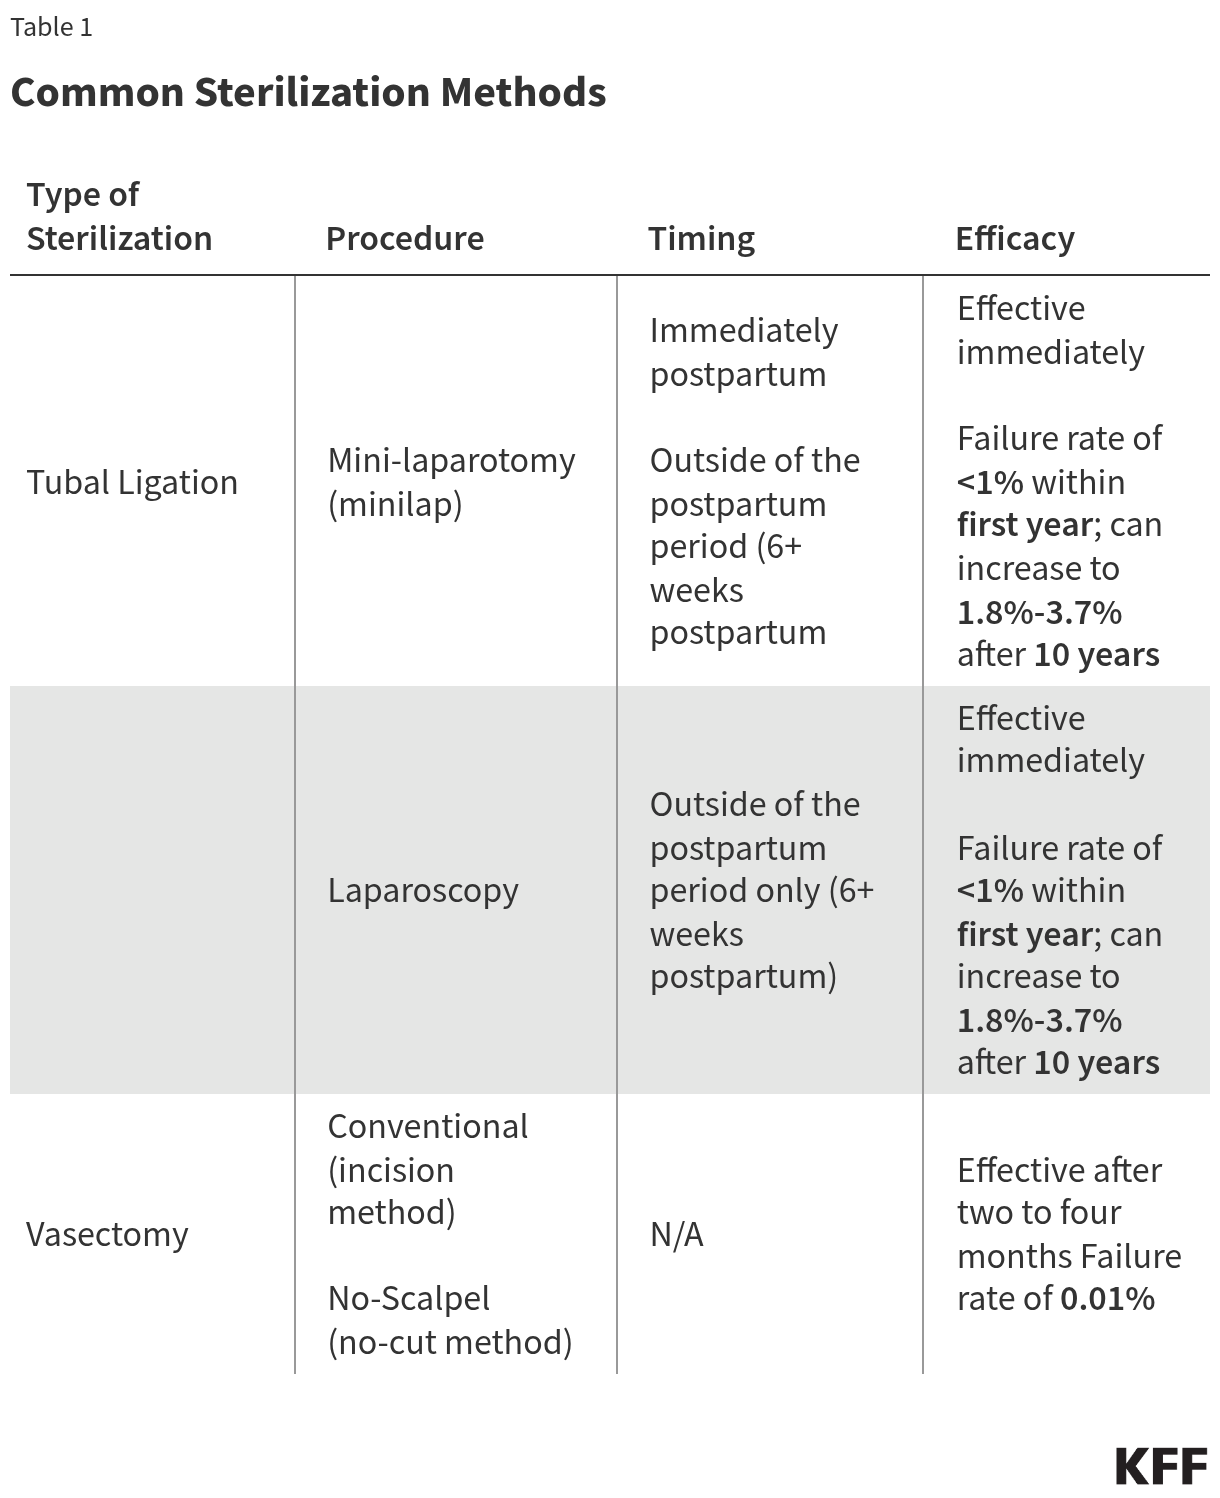
There are two main methods of surgical tubal ligation: mini-laparotomy (or a minilap) and laparoscopic sterilization (Table 1). The minilap can be performed immediately postpartum, right after childbirth, while the laparoscopic procedure cannot. Tubal ligation procedures are effective immediately and have a failure rate of less than 1% within the first year of having the surgery. After 10 years, the failure rate can increase to 18 to 37 pregnancies out of 1,000 women depending on how the fallopian tubes are closed. Complications are rare, but they can include bleeding, infection, and ectopic pregnancy. While the procedure sometimes can be reversed, the process is costly, invasive, typically not covered by insurance, and not guaranteed to work. Sterilization does not protect against sexually transmitted infections (STIs).

Vasectomies

A vasectomy is an outpatient procedure done on people with male reproductive organs and is typically done under local anesthesia. In the traditional procedure, a doctor will clip, cut and tie, or cauterize the vas deferens. There is also a newer “no-scalpel” technique which is less invasive, reducing complications and recovery time (Table 1). Despite lower frequency of use compared to tubal ligations, vasectomies are safer, cheaper, and even more effective. Only one out of every 10,000 women will become pregnant using this contraceptive method; however, vasectomies are not effective immediately. It can take two to four months for sperm to be reabsorbed or ejaculated, so an alternate form of contraception should be used to prevent pregnancy. Vasectomies also do not protect against STIs.

Common Sterilization Methods

The 2024 KFF Women’s Health Survey, found that one in ten (11%) men ages 18 to 64 say they have undergone a sterilization procedure. The share who have been sterilized is higher among white men, men with higher incomes, and men with private insurance (Figure 1).

Insurance Coverage

Sterilization is a highly cost-effective method of contraception. Although it can have high upfront costs, it typically requires no long-term follow-up care and therefore can be cheaper in the long run than other methods. Depending on location, insurance, and procedure type, the out-of-pocket cost of tubal ligation procedures may range from $0 to $6,000, whereas a vasectomy may cost between $0 and $1,000.

Private Insurance and Affordable Care Act

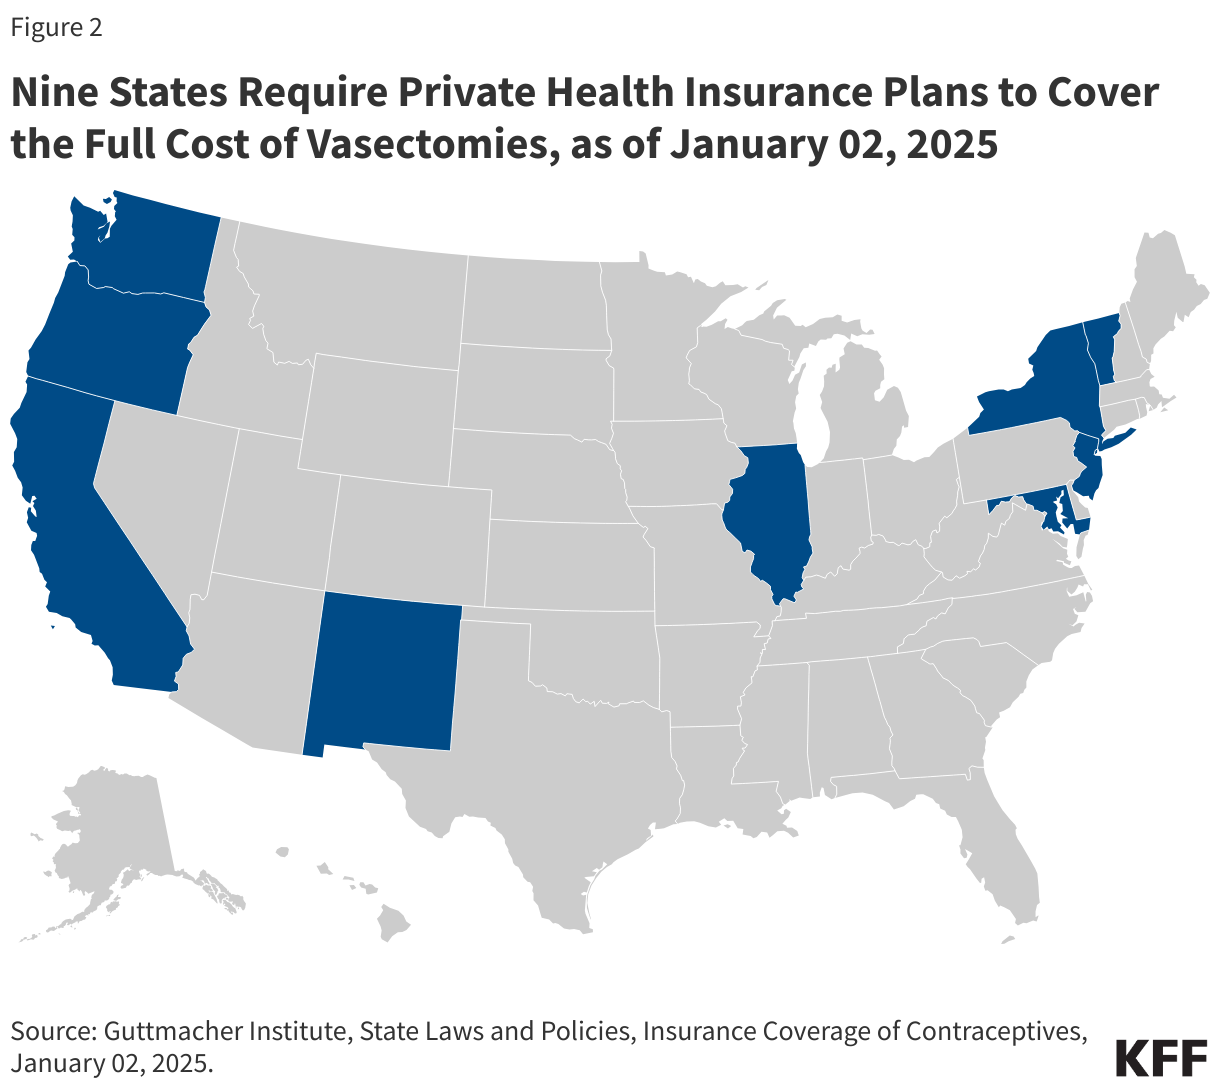
The ACA requires private health insurance plans to cover at least one form of all 18 FDA-approved contraceptive methods for women without cost sharing, meaning tubal ligation procedures must be fully covered by most private health insurance plans. This federal policy does not include vasectomies; however, nine states—California, Illinois, Maryland, New Jersey, New Mexico, New York, Oregon, Vermont, and Washington—require state-regulated private health insurance plans to cover vasectomies at no additional cost to the patient (Figure 2). State-regulated benefit requirements do not apply to self-insured employer plans, though, which covered 63% of covered workers in 2024.

Nine States Require Private Health Insurance Plans to Cover the Full Cost of Vasectomies, as of January 02, 2025

Medicaid

Medicaid, the national health coverage program for low-income individuals, is financed and operated jointly by the federal and state governments. Under Medicaid, it is mandatory for states to cover family planning, including sterilization procedures for women. Vasectomies are not federally required to be covered under any of the Medicaid pathways, but a KFF state survey found that most states report they cover the procedure.

Regulations prohibit federal funds from being used for sterilization procedures on women younger than 21 years old. They also require patients to sign an informed consent form at least 30 days prior to the procedure, with some exceptions. In the event of a premature delivery, consent must have been obtained at least 30 days prior to the due date. However, if a premature delivery or emergency abdominal surgery occurs within the 30-day waiting period, the physician must certify that consent was obtained at least 72 hours after the date on the patient’s signed consent form. This provision was implemented to guard against coercive practices and abuses that were historically directed towards women with low incomes, women with disabilities, women of color, and incarcerated women. However, some advocates suggest that this requirement places a burden on publicly insured women seeking sterilization services that women with private insurance do not face.

Uninsured

Some states have extended access to family planning services to uninsured populations through the Medicaid family planning expansion program that provides Medicaid coverage solely for family planning services to women and men who do not qualify for full Medicaid benefits. These programs are available in 32 states as of January 2025, and most report that they cover tubal ligations and vasectomies.

Although most public funding for sterilization comes from Medicaid, a share is provided by the federal Title X National Family Planning Program and the Maternal and Child Health and Social Services block grants. Changes to federal funding for clinics providing family planning programs may impede access to sterilization services for those who rely on these programs for reproductive health coverage.

Religious Providers

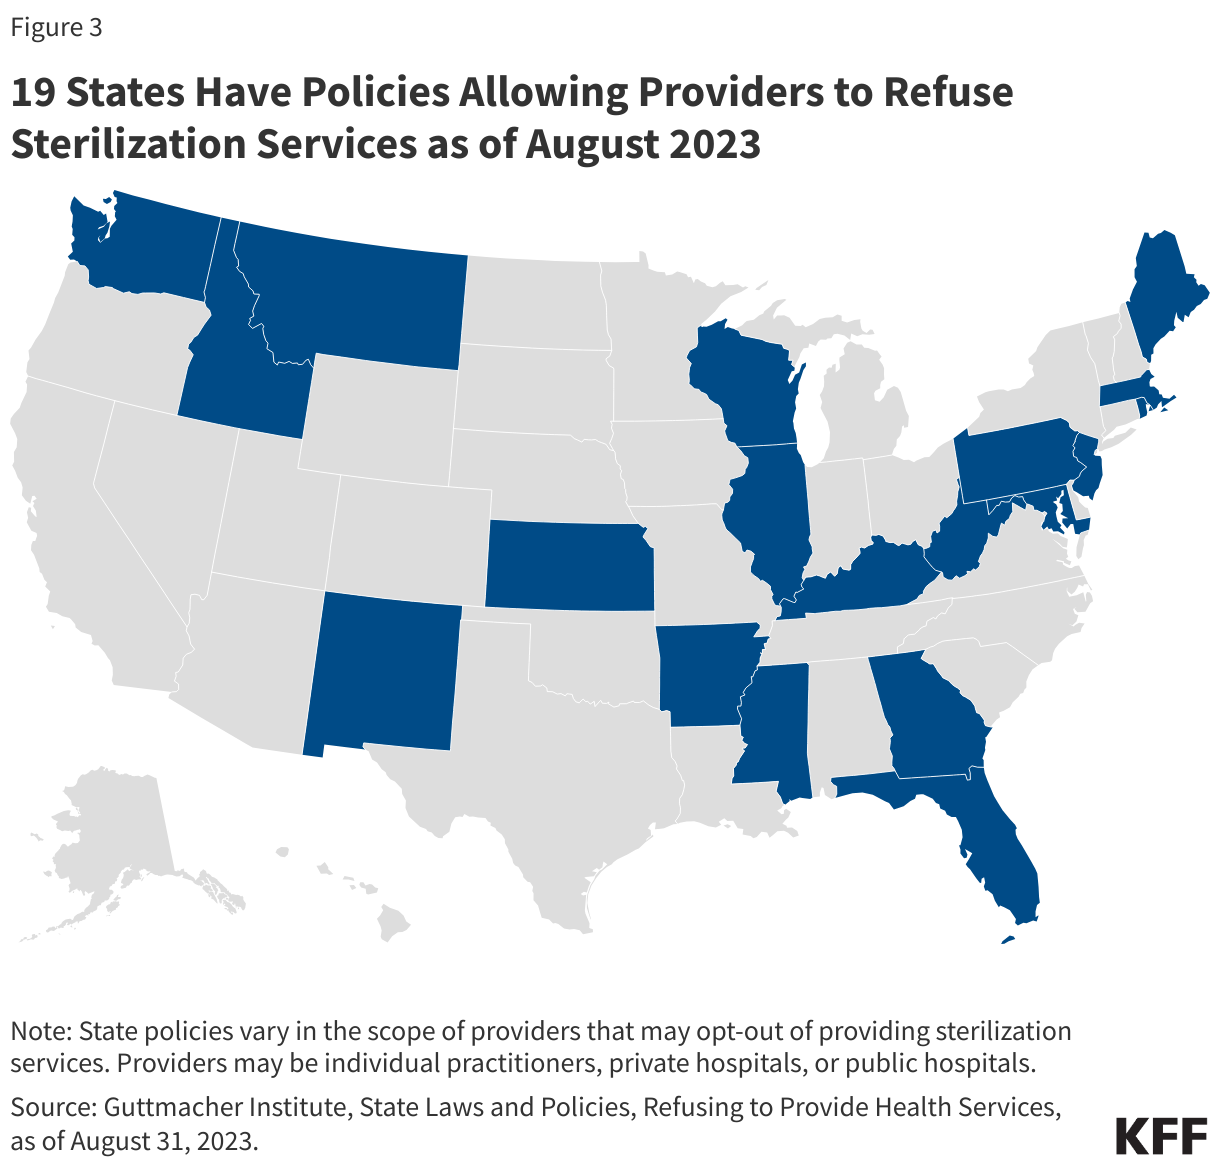
Currently, federal and state laws allow providers with religious objections to refuse sterilization services to patients. The Church Amendments prohibit the federal government from requiring a provider to assist in abortion or sterilization services if they violate the provider’s religious beliefs. As of 2023, 19 states have laws that allow some health care providers to refuse to provide sterilization services for religious reasons (Figure 3). In areas with a limited choice of health care providers, refusal policies could limit the availability of sterilization services.

19 States Have Policies Allowing Providers to Refuse Sterilization Services as of August 2023

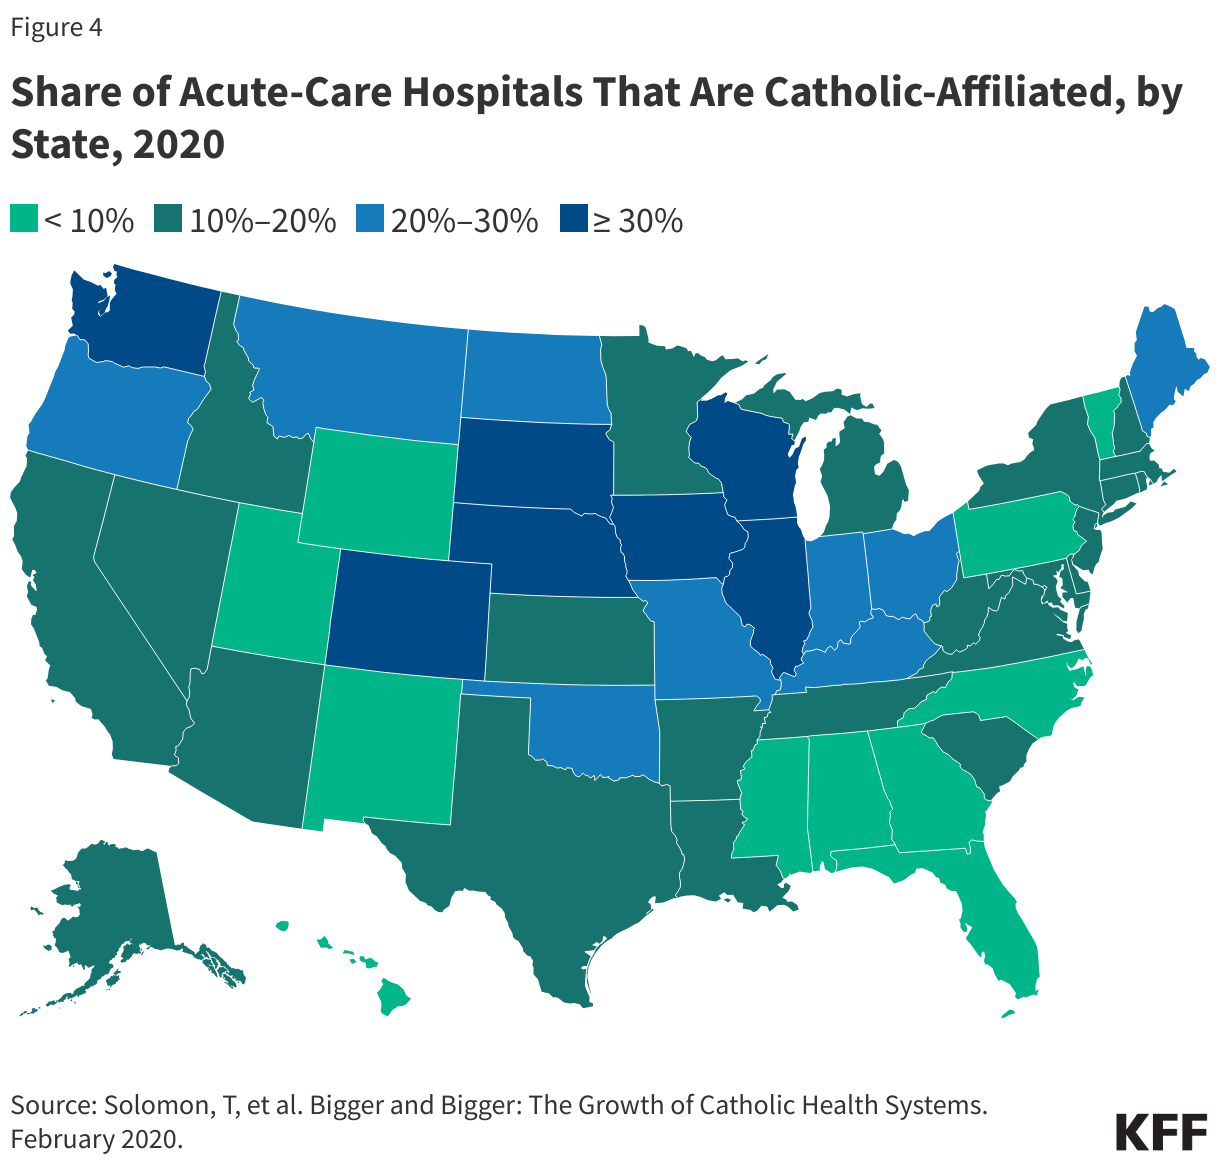
Another challenge to the availability of sterilization services is the growing number of acute care hospitals that are affiliated with the Catholic Church. These hospitals usually adhere to the religious restrictions required by the U.S. Conference of Catholic Bishops, which prohibit the use of sterilization. These directives also prohibit referrals for contraception, abortion, and sterilization services. As of 2020, 7 of the 25 largest health systems nationwide are Catholic-affiliated. There is concern that the growing dominance of Catholic hospitals in some areas may limit access to tubal ligations and post-delivery sterilization procedures. The lack of a postpartum sterilization option could pose a particular challenge for women in communities where the only hospital available to them is part of a Catholic health system (Figure 4). Catholic-affiliated hospitals receive a share of their revenue from public sources, such as Medicaid and Medicare, and serve diverse populations who may not be aware of the limits placed on their care, nor follow the hospital’s religious tenets.

Share of Acute-Care Hospitals That Are Catholic-Affiliated, by State, 2020

Impact of the Dobbs Ruling

The reproductive health landscape in the United States has drastically changed since the Supreme Court’s decision to overturn Roe v. Wade in Dobbs v. Jackson Women’s Health Organization in 2022 and contraceptive choices have also changed in response to the ruling. A KFF survey found that in 2023, four in ten (43%) OBGYNs reported an increase in the number of patients who sought sterilization since Dobbs. A little over half (51%) of OBGYNs in states with abortion bans or restrictions reported the same, compared to 36% of OBGYNs in states where abortion is legal. Research suggests that the demographics of individuals seeking sterilization may have changed since the Dobbs decision, though it is important to note that the research is limited, and long-term trends continue to be studied. Although sterilization is most common in individuals over 35 years old, a limited number of studies found that the number of sterilization procedures performed on adults under 35 years old increased post-Dobbs. In addition to being younger, similar research has found that a higher share of men who underwent vasectomies or sought consultations since Dobbs are childless and single.

How Much is Health Spending Expected to Grow?

Published: Aug 5, 2025

This updated chart collection explores how health spending is expected to grow in coming years, based on National Health Expenditure (NHE) projections from federal actuaries.

Health spending is projected to reach $5.6 trillion in 2025, with hospitals making up the largest share of spending ($1.8 trillion). By 2033, health spending is expected to hit $8.6 trillion.

These projections do not account for recent regulatory changes under the Trump Administration, nor do they account for recent legislative changes in the tax and budget law (formerly “the One Big, Beautiful Bill Act”), which the Congressional Budget Office (CBO) expects to decrease spending on Medicaid and the Affordable Care Act (ACA) Marketplaces by over a trillion dollars through 2034.

The analysis can be found on the Peterson-KFF Health System Tracker, an information hub dedicated to monitoring and assessing the performance of the U.S. health system.

What Role Do Immigrants Play in the Rural Workforce?

Published: Aug 4, 2025

As of 2023, there were over 47 million immigrants residing in the country, accounting for 14% of the total population, including roughly 1.8 million living in rural America. The Trump administration has undertaken a range of actions aimed at restricting immigration; increasing interior immigration enforcement efforts, including among lawfully present immigrants; and eliminating access to health coverage and care for lawfully present and undocumented immigrants. Research shows that immigrants make significant contributions to the U.S. workforce. Efforts to limit immigration may have negative ramifications for the country’s labor supply and economy, particularly in key occupations such as health care that are already experiencing worker shortages. Research further shows that health care workforce shortages are particularly stark in rural areas, which are also home to larger shares of older residents as well as residents who have worse health conditions as compared to their urban counterparts.

This data note examines the role that immigrants play in the rural workforce, particularly in industries disproportionately filled by immigrants, including health care, agriculture, construction, and service. It is based on KFF analysis of the 2023 American Community Survey 1-year Public Use Microdata Sample (see Methods for more details). It also highlights the socioeconomic and health coverage barriers that immigrant workers in rural areas face. For the purposes of this analysis, rural areas (non-metropolitan) are defined as counties or a group of counties that have a population of at least 10,000 but less than 50,000.

This analysis shows that although immigrants account for a small share of the rural adult population (5%) and rural adult workforce (5%), they play an outsized role in certain occupations in rural areas, including as physicians and surgeons (14%), agriculture workers (28%), and construction workers (10%). Despite having similar rates of employment as their citizen counterparts, noncitizen immigrant workers in rural areas are somewhat more likely to have lower incomes (annual incomes below $20,000) (22% vs. 18% among U.S.-born workers) and to be uninsured (40% vs. 8% among U.S.-born workers).

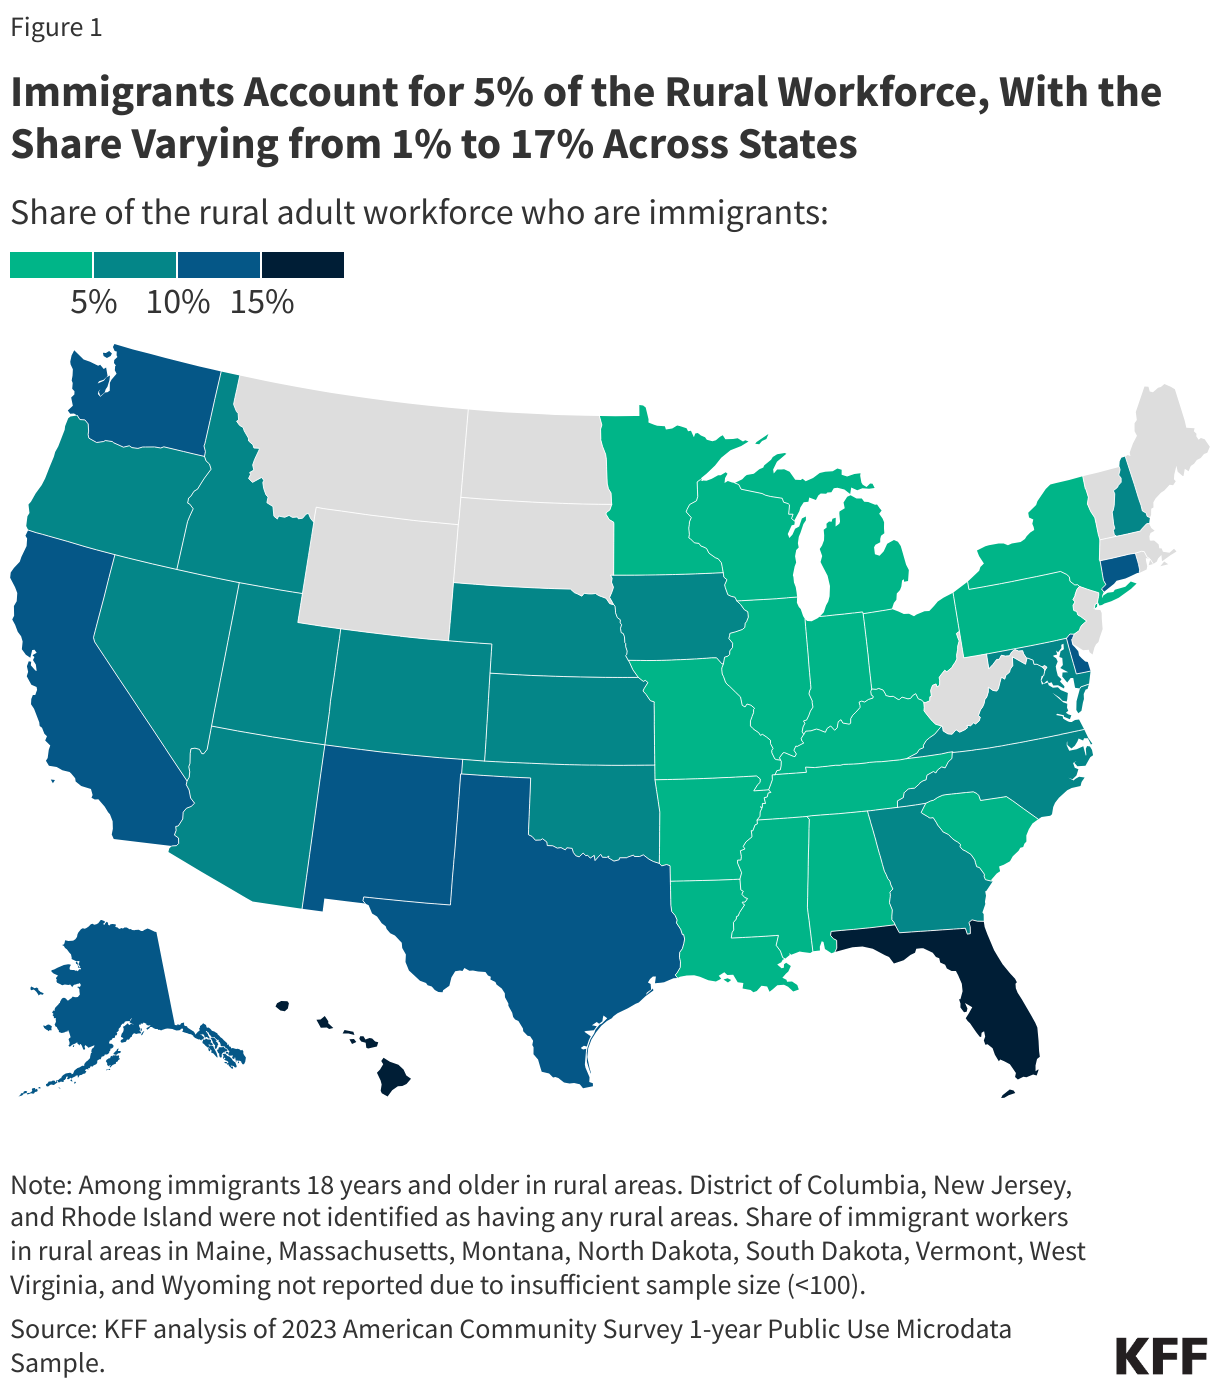
Immigrant adults make up 5% of the rural workforce nationwide, with the share varying from 1% to 17% across states.

Overall, immigrants account for 5% of rural adults and the rural adult workforce. However, their share of the rural workforce ranges from 1% to 17% across the 40 states with sufficient data to examine immigrant workers in rural areas. In nine states (HI, FL, CT, DE, NM, AK, WA, TX, and CA), immigrants account for at least one in ten or more of rural adult workers, including 17% in Hawaii, 15% in Florida, and 14% in Connecticut, reflecting these states generally having higher shares of immigrant adults residing in rural areas and immigrants overall.

Immigrants Account for 5% of the Rural Workforce, With the Share Varying from 1% to 17% Across States

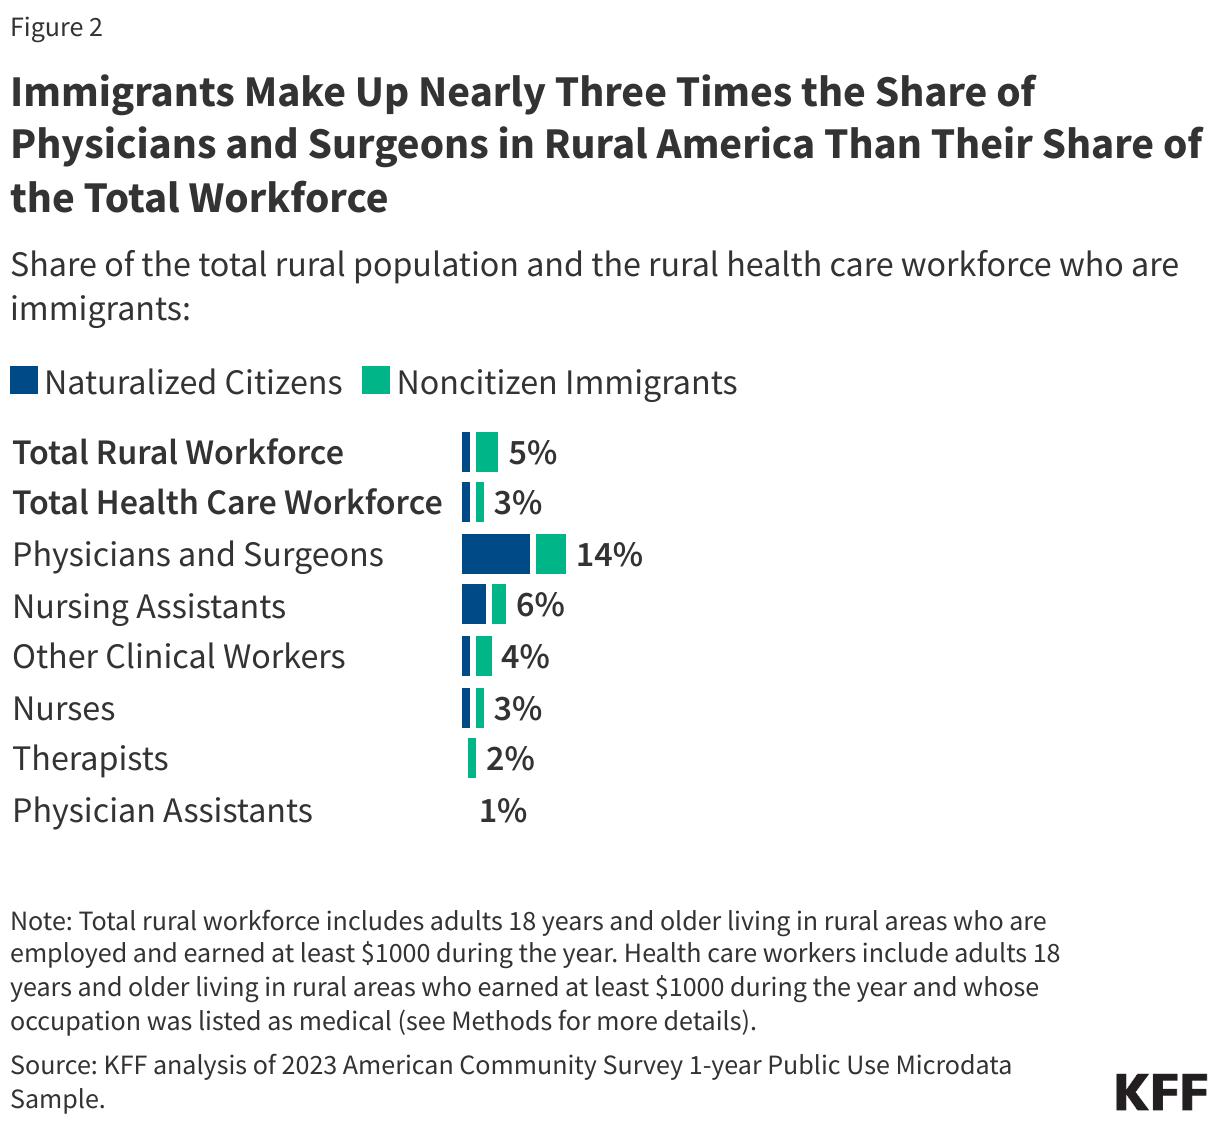
Immigrant adults make up nearly three times the share of physicians and surgeons in rural America than their share of the overall rural workforce (14% vs. 5%).

Immigrant adults account for similar shares of the total rural workforce (5%) and the total rural health care workforce (3%) but make up nearly three times (14%) the share of physicians and surgeons in rural America (Figure 2). These physicians and surgeons include one in ten naturalized citizens and 4% noncitizen immigrants. In addition, immigrant adults account for 6% of nursing assistants, 3% of nurses, 2% of therapists, 1% of physician assistants, and 4% of other clinical workers in rural America.

Immigrants Make Up Nearly Three Times the Share of Physicians and Surgeons in Rural America Than Their Share of the Total Workforce (Stacked Bars)

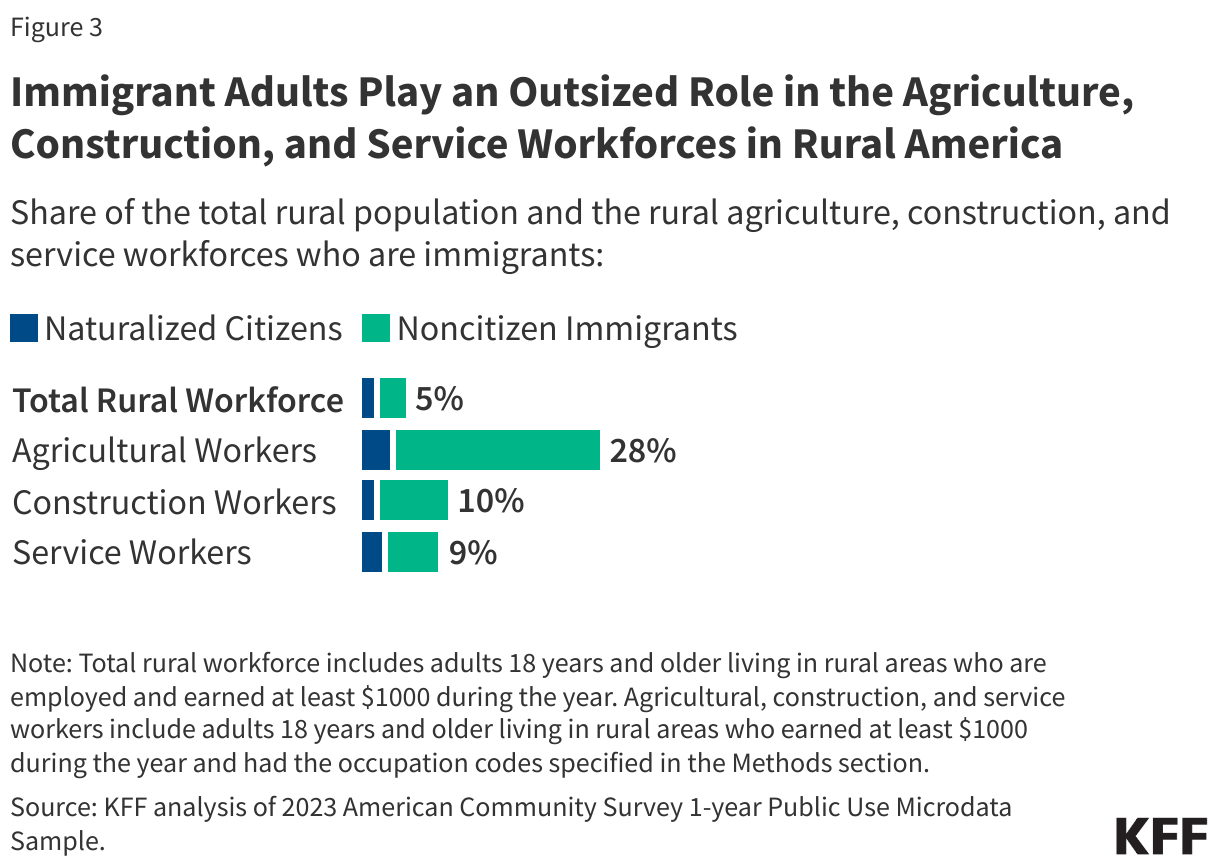
Immigrant adults also play an outsized role in the agriculture, construction, and service workforces in rural America.

In addition to their role as physicians and surgeons, immigrant adults make up significantly higher shares of the agriculture, construction, and service (including restaurant and cleaning) workforces in rural America compared to their share of the total rural workforce (Figure 3). These patterns are similar to the outsized role immigrant adults play in these workforces nationwide. In rural areas, immigrant adults account for nearly three in ten (28%) agricultural workers, including nearly a quarter (24%) who are noncitizen immigrants. Immigrant adults also make up about one in ten construction (10%) and service (9%) workers in rural America, again driven by larger shares of noncitizen immigrants who account for these workers.

Immigrant Adults Play an Outsized Role in the Agriculture, Construction, and Service Workforces in Rural America

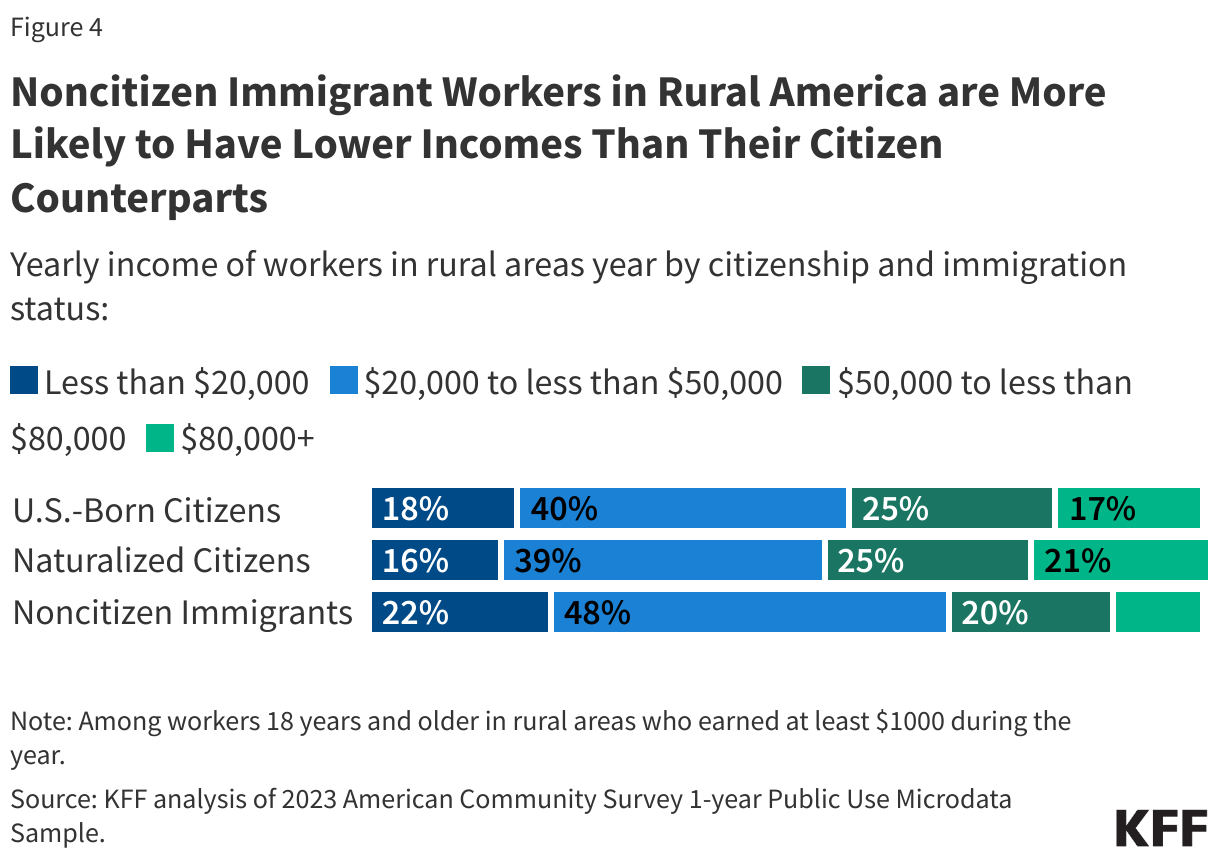
More than one in five noncitizen immigrant workers in rural America earn less than $20,000 a year.

Despite their workforce contributions, noncitizen immigrant workers in rural America are somewhat more likely than their citizen counterparts to earn less than $20,000 a year (Figure 4). More than one in five (22%) of noncitizen immigrant workers earn less than $20,000 a year compared to 18% of U.S.-born citizen and 16% of naturalized citizen workers in rural America. In contrast, about one in six (17%) U.S.-born and one in five (21%) naturalized citizen workers in rural America report earning $80,000 or more per year compared to one in ten noncitizen immigrant workers. This pattern likely reflects noncitizen immigrants’ disproportionate employment in lower-wage jobs such as agriculture, construction, food services, and cleaning services.

Noncitizen Immigrant Workers in Rural America are More Likely to Have Lower Incomes Than Their Citizen Counterparts

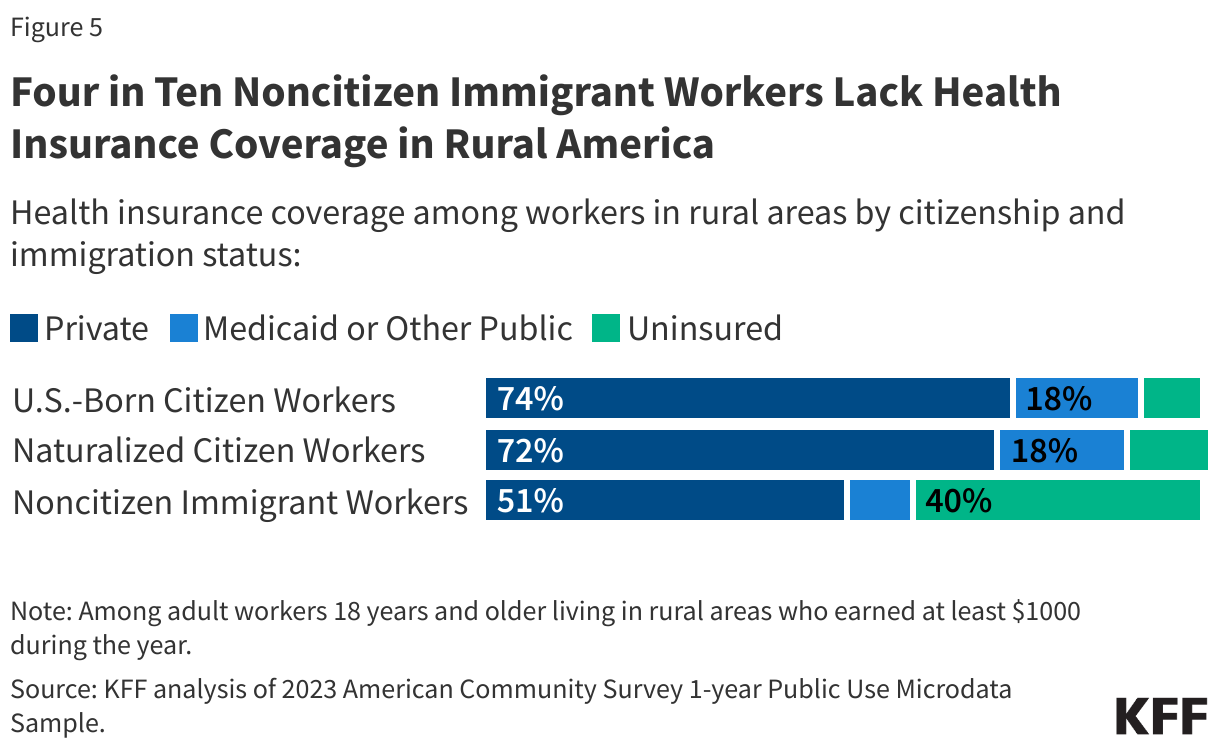
Four in ten noncitizen immigrant workers in rural America are uninsured.

Roughly six in ten of naturalized citizen (60%) and U.S.-born citizen (57%) adults, as well as two in three noncitizen immigrant adults (66%) 18 years and older in rural America are employed. However, noncitizen immigrant workers in rural America are roughly four times more likely to lack health insurance coverage (40%) than their naturalized citizen (11%) and U.S.-born citizen (8%) counterparts (Figure 5). Roughly three in four U.S.-born (74%) and naturalized citizen (72%) workers have private coverage compared to half (51%) of noncitizen immigrant workers. U.S.-born and naturalized citizen (18%) workers also are twice as likely to be covered by Medicaid compared to noncitizen immigrant workers (9%). These patterns reflect noncitizen immigrants’ disproportionate employment in jobs that are less likely to offer employer-sponsored health coverage as well as their limited access to federally funded health coverage. Provisions in the recently passed tax and spending law will further limit access to health coverage for noncitizen immigrants, which could further increase their uninsured rates and result in workforce productivity losses as well as an exacerbation of worker shortages in rural areas.

Four in Ten Noncitizen Immigrant Workers Lack Health Insurance Coverage in Rural America

Methods

Data: These findings are based on KFF analysis of the 2023 American Community Survey 1-year Public Use Microdata Sample (ACS PUMS). The ACS PUMS includes a 1% sample of the U.S. population.

Classification of Rural and Urban Areas: A Public Use Microdata Area (PUMA)-to-county crosswalk was conducted in the 2023 ACS PUMS file after which counties were classified as one of the following: rural (remote) – a non-metro area not adjacent to any large or small metro area; rural (other) – a non-metro area adjacent to a large or small metro area; and urban – a large or small metro area. For the purposes of this analysis, rural (remote) and rural (other) were combined into a single rural category. Non-metro areas are defined as a county or group of counties with a population of at least 10,000 but less than 50,000 people; metro areas are defined as a county or group of counties with a population of 50,000 or more people. For more details on the definition of rural and urban areas, please refer to this Methods section.

Identification of Immigrants: Immigrants are identified as those who report their citizenship status in ACS as a “U.S. citizen by naturalization” or as “not a citizen of the U.S.”. The former are referred to as “naturalized citizens” and the latter as “noncitizen immigrants” in this analysis.

Identification of Health Care Workers: Health care workers are identified as those who have an occupational code (OCCP) in ACS between 3000 and 3655. This group is further broken out into physicians and surgeons (3090, 3100); nurses (3255, 3256, 3258, or 3500); nursing assistants (3603); physician assistants (3110); therapists (3150, 3160, 3200, 3210, 3220, 3230, or 3245); and other clinical workers (all other occupation codes between 3000 and 3655).

Identification of Agricultural Workers: Agricultural workers are identified as those who have an occupational code (OCCP) in ACS of 6005, 6010, 6040, or 6050.

Identification of Construction Workers: Construction workers are identified as those who have an occupational code (OCCP) in ACS between 6200 and 6765.

Identification of Service Workers: Service workers are identified as those who have an occupational code (OCCP) in ACS between 4000 and 4255.

Implementation Dates for 2025 Budget Reconciliation Law

On July 4, President Trump signed the budget reconciliation bill, previously known as “One Big Beautiful Bill Act,” into law. The bill includes significant health care policy changes. This timeline provides a brief overview of the specific provisions and their effective dates. You can view all health provisions in the order they are implemented or can filter them by the following categories: Medicaid, Medicare, Affordable Care Act and Health Savings Accounts. You can read a detailed summary of the health provisions of the law.

Implementation Dates for Health Provisions in the 2025 Republican Tax and Spending Cut Legislation

Senate Committee on Appropriations Approves FY 2026 Labor, Health and Human Services, Education, and Related Agencies (Labor HHS) Appropriations Bill & Accompanying Report

Published: Aug 4, 2025

The Senate Committee on Appropriations approved its FY 2026 Labor, Health and Human Services, Education, and Related Agencies (Labor HHS) appropriations bill, accompanying report, and amendments on July 31, 2025.

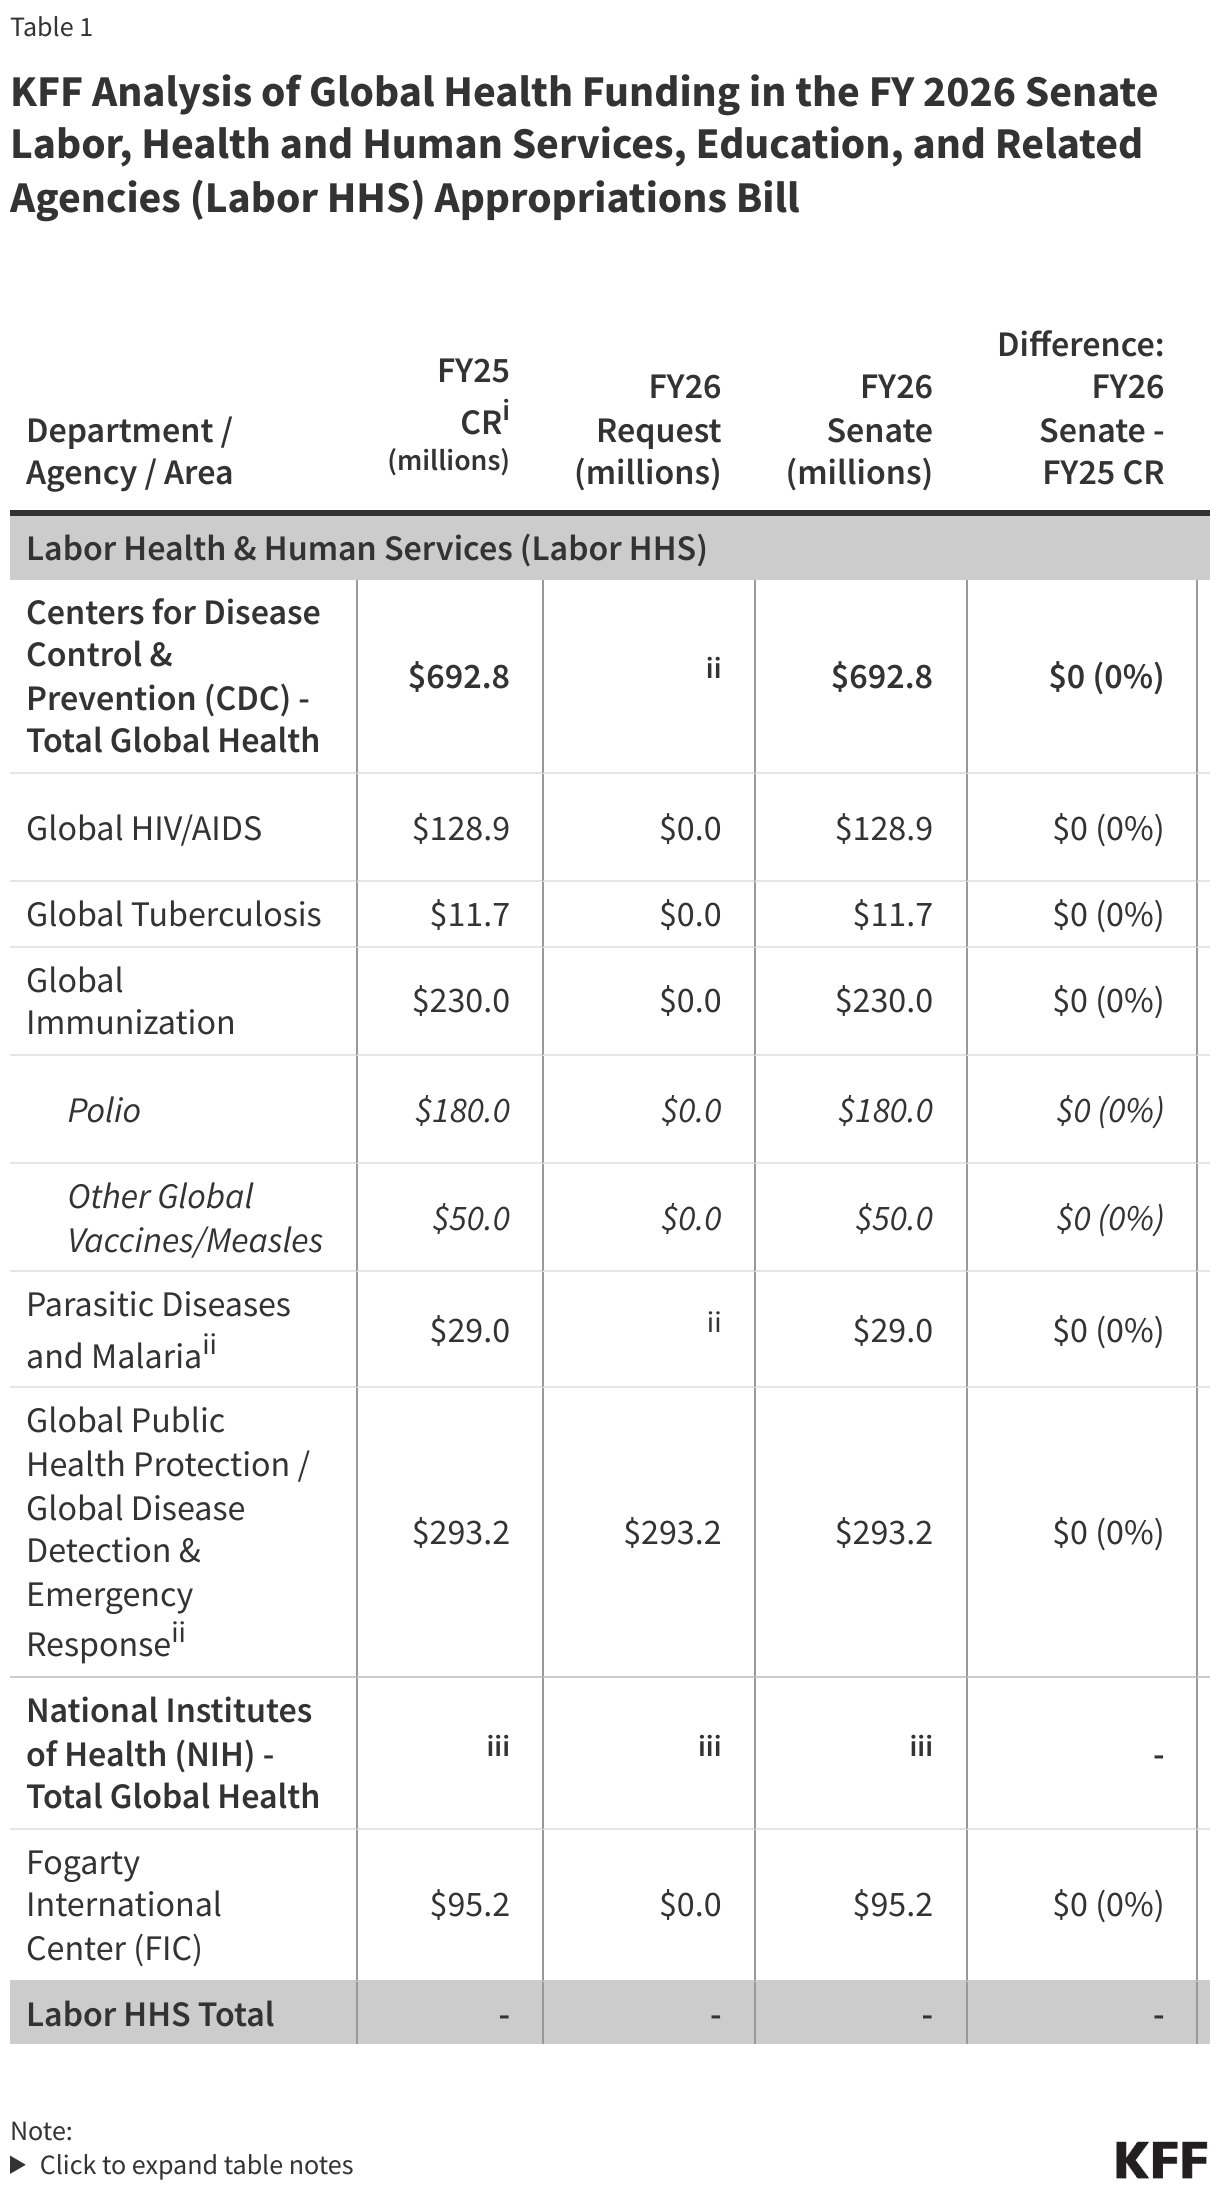
While most U.S. global health funding is provided to the State Department through a separate appropriations bill, the Labor HHS appropriations bill includes funding for global health programs at the Centers for Disease Control and Prevention (CDC) as well as funding for global health research activities at the National Institutes of Health (NIH). Total global health funding at CDC and NIH through the Labor HHS bill is not yet known, as funding for some programs (i.e. global HIV/AIDS and malaria research) at NIH is determined at the agency level rather than specified by Congress in annual appropriations bills. Funding for global health programs at CDC totals $693 million in the bill and funding for global health research activities at the Fogarty International Center (FIC) at NIH totals $95 million; these are the same levels as the FY 2025 enacted amounts.[i],[ii]

See the table below for additional details on global health funding (downloadable table here). See other budget summaries and the KFF budget tracker for details on historical annual appropriations for global health programs.

KFF Analysis of Global Health Funding in the FY 2026 Senate Labor, Health and Human Services, Education, and Related Agencies (Labor HHS) Appropriations Bill

[i] Funding for FY25 was provided in a full-year Continuing Resolution (CR), which maintained FY24 levels. All FY25 amounts and associated notes are based on those specified in relevant FY24 appropriations bills.

[ii] The FY26 Request eliminates CDC's Global Health Center and most of its bilateral programs, except funding for "Global Disease Detection & Emergency Response", which is transferred to "Crosscutting Activities and Program Support", and "Parasitic Diseases and Malaria", which is transferred to "Emerging and Zoonotic Infectious Diseases".

Poll Finding

KFF Tracking Poll on Health Information and Trust: COVID-19 Vaccine Update

Published: Aug 1, 2025

Read the news release about these poll findings.

Key Findings

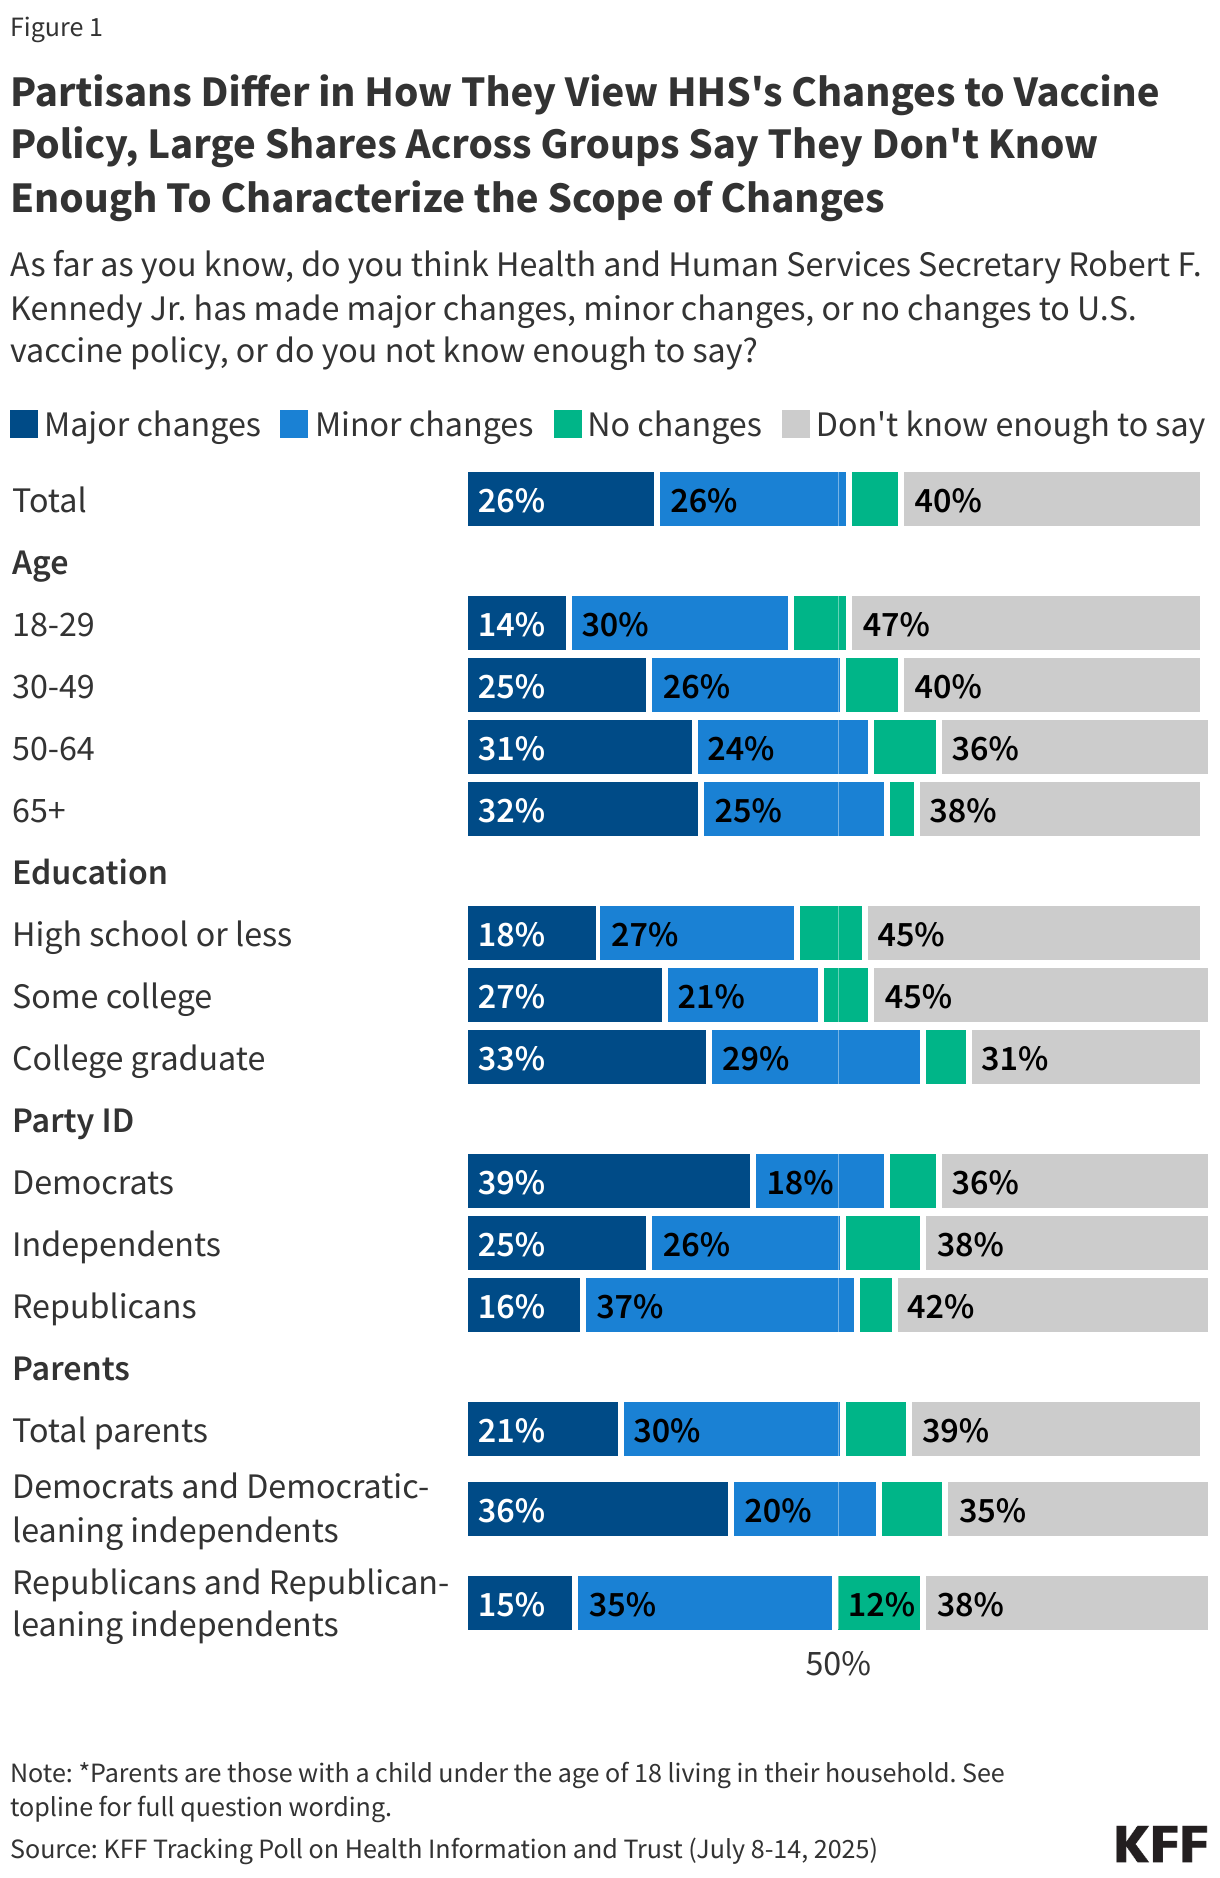
  • Amid ongoing news from federal agencies about changing COVID-19 vaccine recommendations, the replacement of the Centers for Disease Control and Prevention’s vaccine advisory committee members (ACIP), and re-examination of the federal childhood vaccine schedule, there is confusion among the public about U.S. vaccine policy. While half of the public thinks Department of Health and Human Services (HHS) Secretary Robert F. Kennedy Jr. has made “major” (26%) or “minor” (26%) changes to vaccine policy in the U.S., the other half either say they “don’t know enough to say” (40%) or say no changes have been made (7%). At least three in ten adults across demographic groups and party identification say they don’t know enough about the recent changes from Kennedy to vaccine policy to describe them. In addition, half (48%) of parents are not sure if federal health agencies are currently recommending that healthy children receive a COVID-19 vaccine this fall or not.
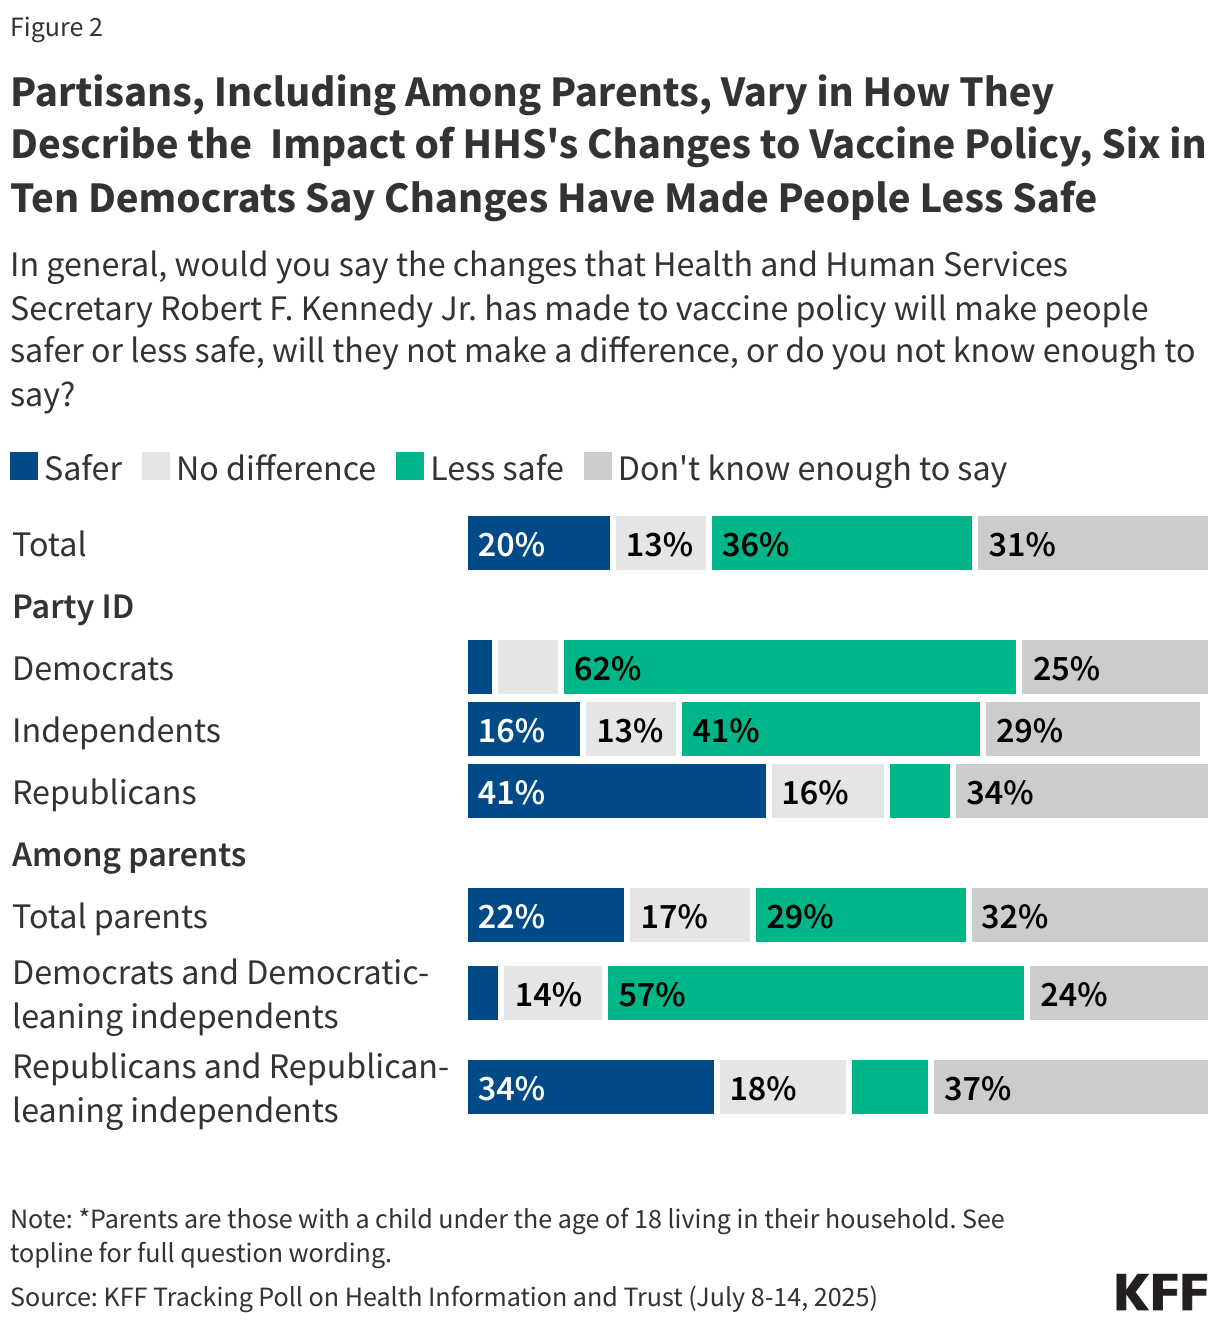
  • Once told about the changes to U.S. vaccine policy, the public is divided by partisanship in whether they think these changes will make people safer or less safe. About two in ten adults, including 41% of Republicans, think these changes will make people safer while about one-third of adults, including most Democrats (62%) and four in ten independents (41%) say they will make people less safe. Another third of adults (31%) say they “don’t know enough to say” as to whether the recent changes to U.S. vaccine policy will make people safer or not, and about one in ten say the changes won’t make a difference.
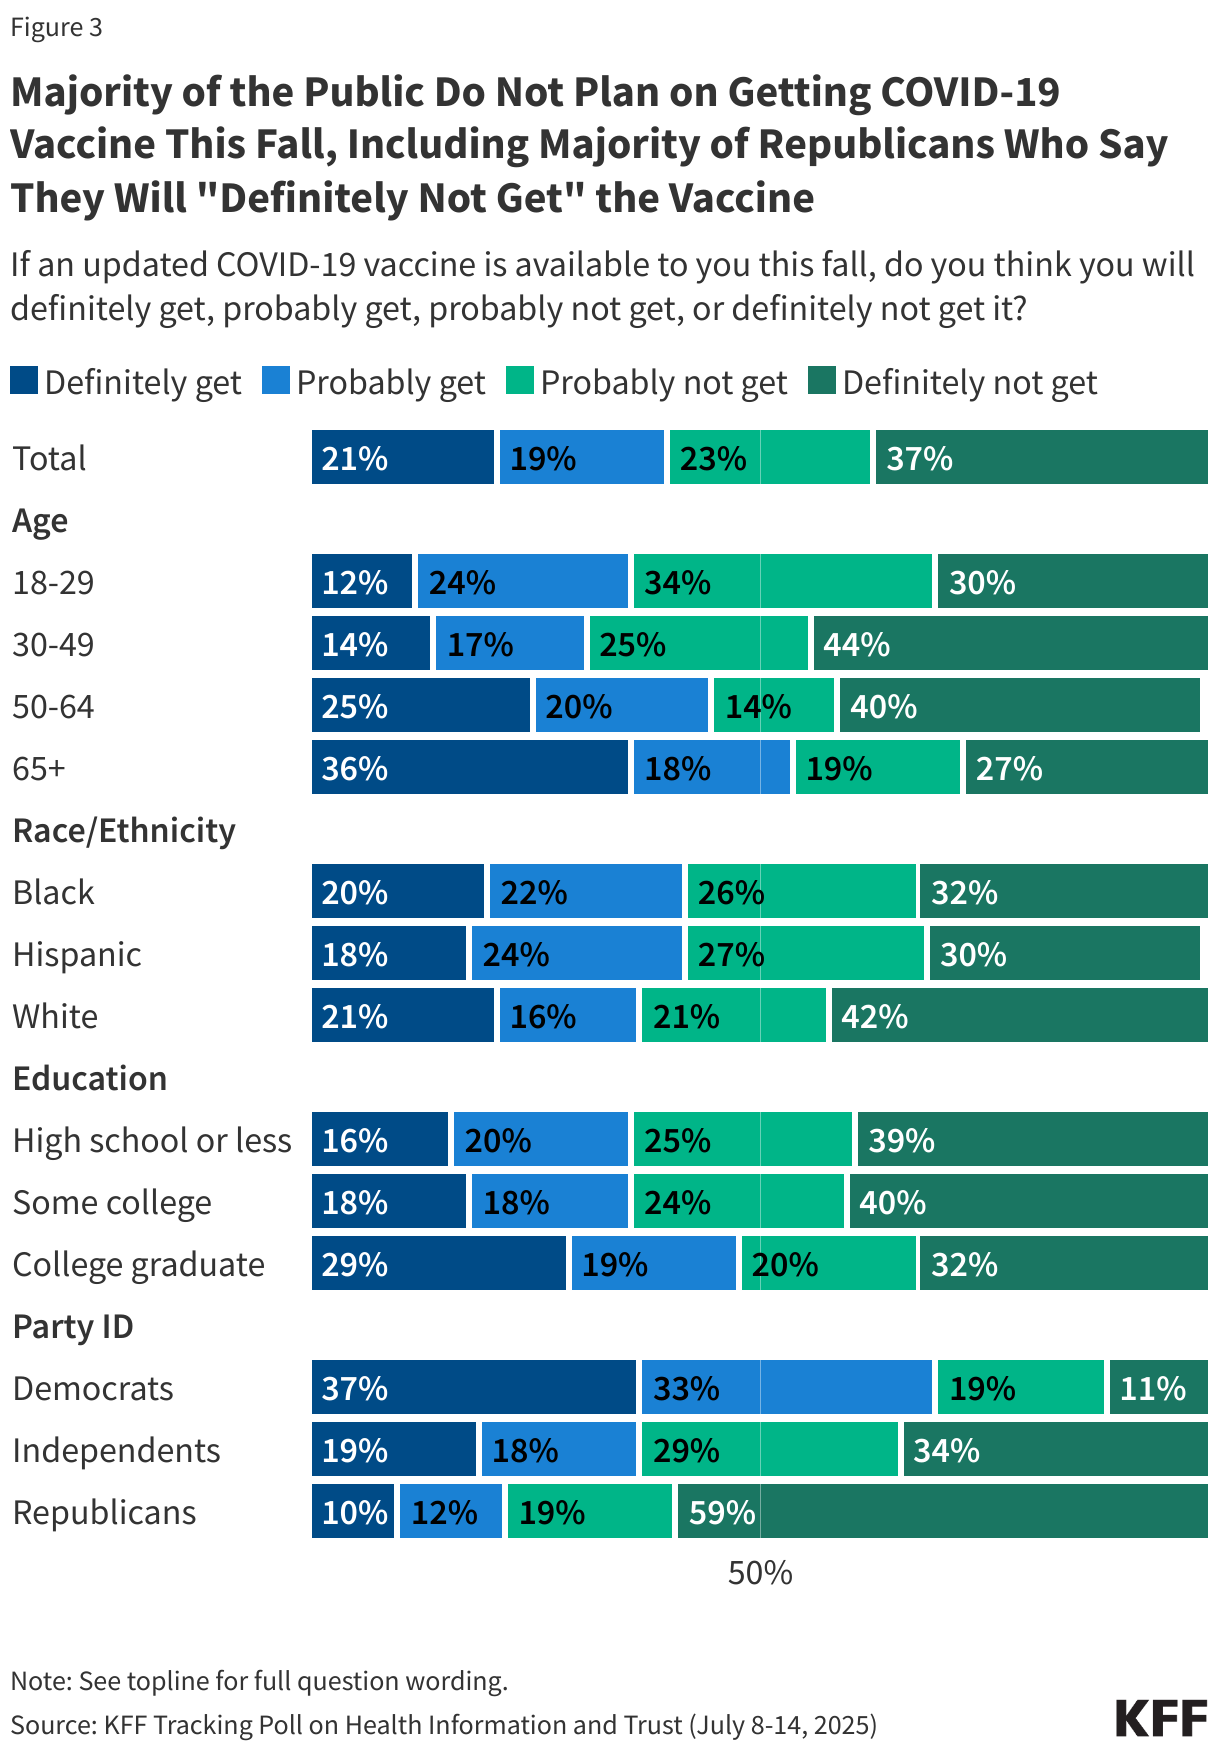
  • Most of the public (59%) say they will either “definitely not” or “probably not” get the COVID-19 vaccine this fall – including about six in ten Republicans who say they will “definitely not” get the vaccine. Older adults and Democrats are much more likely to report that they will get the COVID-19 vaccine. About four in ten Black adults and Hispanic adults say they plan to get the COVID-19 vaccine as do 37% of White adults.
  • With most of the public reporting that they will not get a COVID-19 vaccine this fall, few are worried about the availability of the vaccine or whether it will be covered by insurance. One-third (33%) of adults are concerned that COVID-19 vaccines won’t be available to them this fall, while a third (34%) of insured adults are also worried that their insurance won’t cover a shot. Concern about availability and coverage are tied to vaccine intention, with those who plan to get the vaccine much more likely to be concerned that it might not be available to them (66%), including specific demographic groups who are more likely to get vaccinated such as older adults and Democrats.
  • Personal doctors or health care providers remain the most trusted source for information about vaccines among asked sources, with eight in ten (83%) adults who say they trust their own doctor at least “a fair amount.” Smaller shares of the public, but still majorities trust their local public health department and the U.S. Centers for Disease Control and Prevention, or CDC, to provide information on vaccines, though the share who say so has been steadily in decline since September 2023. Fewer continue to say they trust HHS Secretary Robert F. Kennedy Jr. to provide information on vaccines, with about four in ten (37%) saying they trust him at least a fair amount, unchanged since his appointment in April of this year.
  • About half of the public have confidence in agencies like the CDC and Food and Drug Administration (FDA) to ensure the safety and effectiveness of vaccines approved for use in the U.S. (49%), while less than half say they have at least some confidence in the agencies to make decisions based on science rather than the personal views of agency officials (42%), or act independently, without interference from outside interests (37%). Democrats continue to be more confident in federal health agencies than Republicans to ensure the safety and effectiveness of vaccines.

Awareness of Changes to Vaccine Policy

Since his appointment as Secretary of Health and Human Services, Robert F. Kennedy Jr. has made several headlines about changing vaccine recommendations, leaving many confused about the scope of changes to U.S. vaccine policy and unsure of how these changes might affect people.

About half (52%) of the public are aware that RFK Jr. has made changes to U.S. vaccine policy, with about a quarter describing them as “major changes” (26%) or “minor changes” (26%). Four in ten adults say they don’t know enough about the changes to say whether they are “major” or “minor.” In addition, another 7% are unaware that changes have been made.

Whether the public views the changes as “major” or “minor” is largely partisan, with Democrats more likely to say they are “major” changes while Republicans describe them as “minor” changes. About four in ten (39%) Democrats say the changes that have been made to U.S. vaccine policy are “major,” compared to a quarter (25%) of independents and one in six (16%) Republicans. Nearly four in ten Republicans describe the changes as “minor,” compared to a quarter of independents and 18% of Democrats.

Young adults and those without a college degree are more likely to report that they don’t know enough about the issue to say whether or not the Secretary of HHS has made changes to vaccine policy. About half of those ages 18-29 (47%) and those without a college degree (45%) report that don’t know enough to say about changes to vaccine policy, compared to smaller shares of older adults and those with a college degree or higher.

With RFK, Jr. focusing attention on the childhood vaccine schedule, about half of parents are aware that changes have been made but the other half of parents are either unaware that changes have been made (9%) or report they don’t know enough to say (39%). Similar to all adults, how parents described the scope of the changes is largely partisan with Democratic-leaning parents describing them as major changes, and Republican-leaning parents describing them as minor changes.

Bar chart showing the percent of adults by age, education, party and among parents who say the changes to U.S. vaccine policy are major changes, minor changes, no changes, or don't know enough to say

In light of the recent changes to policy, a third (36%) of the public say the changes that HHS Secretary Robert F. Kennedy Jr. has made to vaccine policy will make people less safe while a smaller share (20%) say the changes to vaccine policy will make people safer. Similar to overall awareness of the changes, a substantial share (31%) say they don’t know enough about the recent changes to say whether they will make people safer or less safe. An additional one in ten (13%) say the changes will not make any difference.

Once again, views are largely partisan, including among parents. Pluralities of Democrats and independents say the changes RFK Jr. has made to vaccine policy will make people less safe, including six in ten (62%) Democrats and four in ten (41%) independents. However, Republicans are split, with similar shares who say the policy makes people safer (41%) and that they don’t know enough to say (34%).

Parents are also split, with a third (32%) who don’t know enough to say and three in ten (29%) who say these changes will make people less safe. Another quarter (22%) of parents say it’ll make people safer, while one in six (17%) say it won’t make a difference. Parents who are Democrats or Democratic-leaning independents are more likely to say the changes will make people less safe, while Republican-leaning parents are more likely to say the changes will make people safer.

Bar chart showing the percent of adults by party, and among parents, who think the changes to vaccine policy will make people safer or less safe, will not make a difference, or don't know

The Fall 2025 COVID-19 Vaccines

Overall, most of the public (59%) say they will either “definitely not” or “probably not” get the COVID-19 vaccine this fall. KFF has been tracking uptake of the COVID-19 vaccine since early 2021. Older adults and Democrats are much more likely to report that they will get the COVID-19 vaccine, while six in ten Republicans (59%) say they will “definitely not” get the COVID-19 vaccine. Similar shares across race and ethnicity say they plan to get the vaccine this fall, but notably White adults are the most likely to be against getting the vaccine, with four in ten (42%) saying they will “definitely not” get the vaccine.

Bar chart showing the share of adults who will get the COVID-19 vaccine by age, race/ethnicity, party, and education

Views of the changes to U.S. vaccine policy also vary by vaccine intention. Those who say they will “definitely” or “probably” get the shot are more likely to say they think the changes to U.S. vaccine policy are “major changes” and these changes will make people less safe.

Few Are Worried About Availability of Vaccines

With the Trump administration instituting possible changes to vaccine recommendations, including the COVID-19 vaccine, and coverage of vaccines largely tied to recommendations from the Advisory Committee on Immunization Practice (ACIP) or the Centers for Disease Control and Prevention (CDC), those who want a COVID-19 vaccine are worried about being able to access the vaccine.

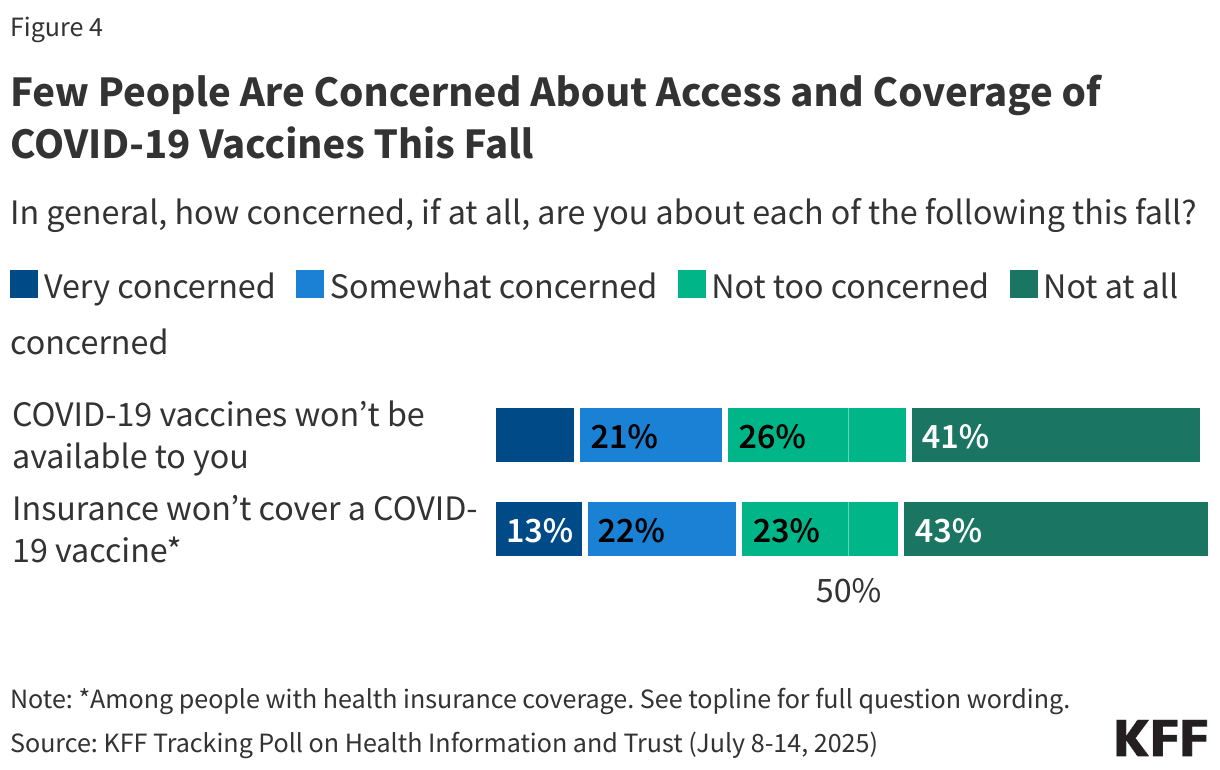
With less than half of adults saying they plan to get a COVID-19 vaccine this fall, just one-third (33%) of all adults are “very” or “somewhat” concerned that COVID-19 vaccines won’t be available to them this fall. Most adults (67%) say they’re “not too” or “not at all” concerned about the availability of the vaccine. Similarly, among those who have insurance, a third (34%) are “very” or “somewhat” concerned that their insurance won’t cover a COVID-19 vaccine this fall, while two-thirds (65%) are “not too” or “not at all” concerned.

Two bars showing the percent of adults who are concerned the COVID-19 vaccines won't be available or that their insurance won't cover them

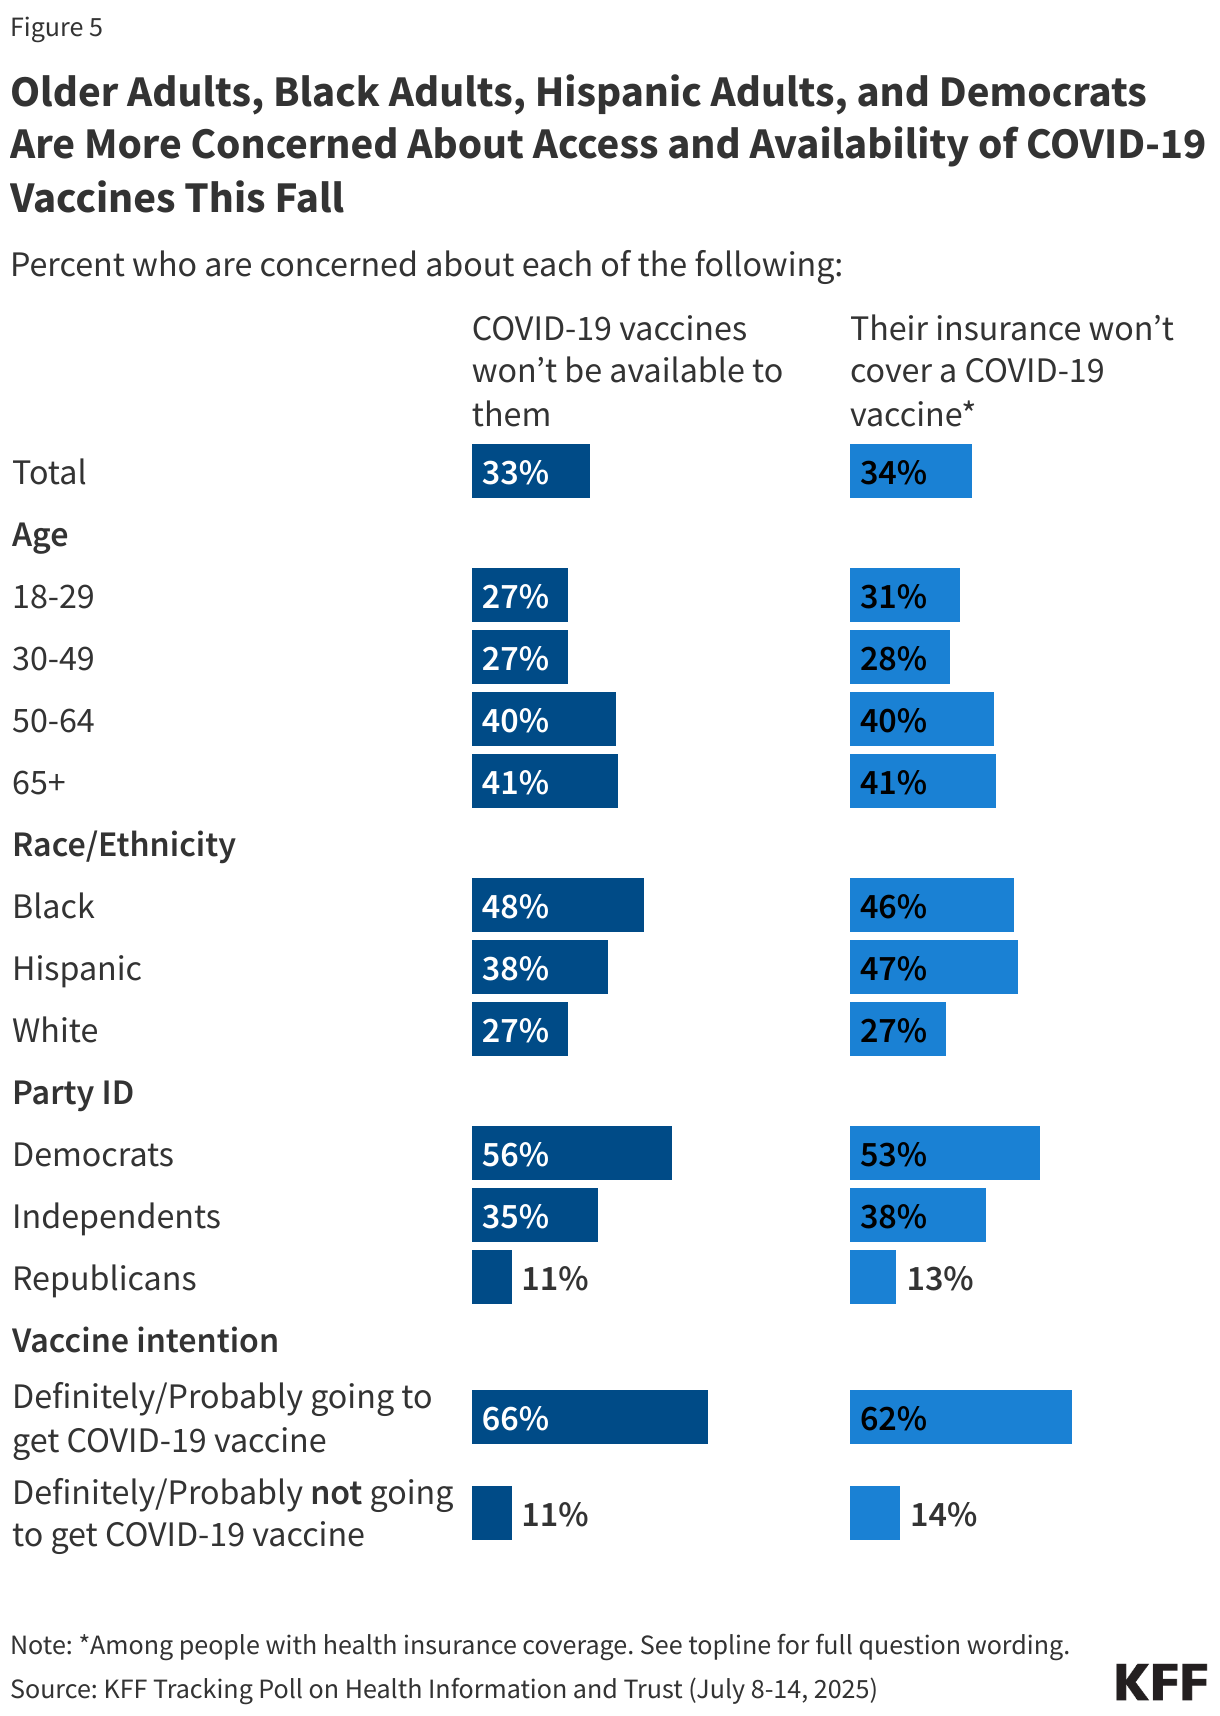
Those who plan to get the vaccine are much more likely to be concerned that it might not be available to them. Among those who say they’ll “definitely” or “probably” get a COVID-19 vaccine this fall, two-thirds (66%) are concerned that the vaccine won’t be available to them, while six in ten (62%) of insured adults who will likely get a vaccine this fall are concerned their insurance won’t cover it. Predictably, just about one in ten of those who likely won’t get the vaccine are concerned about availability (11%) or insurance coverage (14%).

Groups that are more likely to say they plan on getting the COVID-19 vaccine are predictably more concerned about both the availability of the vaccine and whether their insurance would pay for it. Over half (56%) of Democrats are concerned about the availability of the COVID-19 vaccine or insurance coverage (53%), compared to under four in ten independents and one in ten Republicans worried about availability or coverage.

In addition, people who are ages 50 and older are more concerned than younger adults that the vaccine won’t be available to them, though majorities still report they are not concerned, with about four in ten of older adults who are concerned about both availability and insurance coverage, compared to about a quarter of those under the age of 50.

Black adults and Hispanic adults are among the most concerned about the availability and insurance coverage of the COVID-19 vaccine, with half of Black adults concerned about availability (48%) and insurance coverage (46%), and half (47%) of Hispanic adults concerned about insurance coverage, compared to smaller shares of White adults concerned about either item.

Split bar charts showing the percent of adults who are concerned the COVID-19 vaccines won't be available or that their insurance won't cover them by key groups

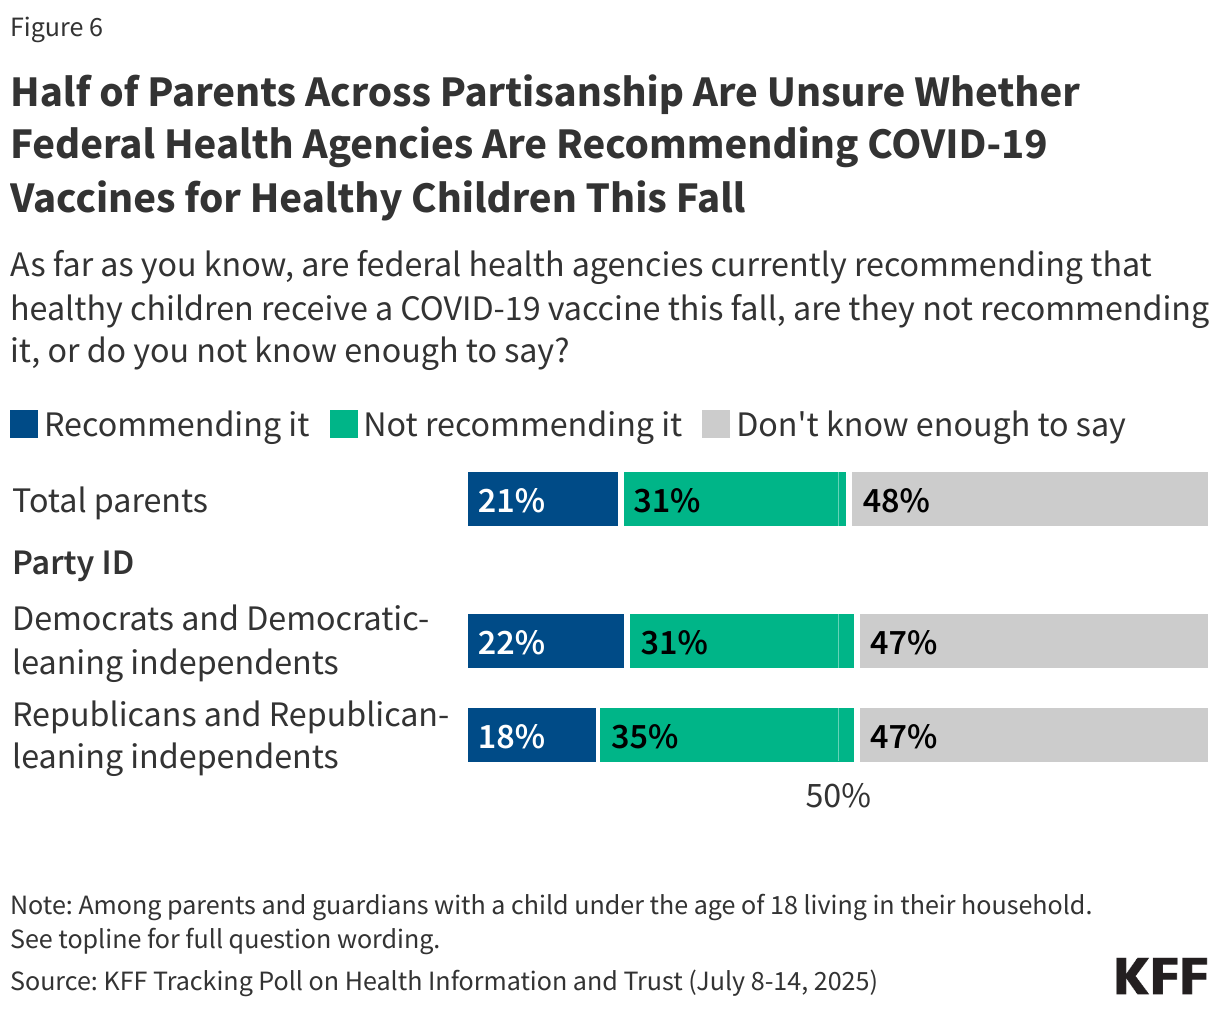
Half (48%) of parents say they are not sure if federal health agencies are currently recommending that healthy children receive a COVID-19 vaccine this fall. Currently, the CDC is recommending that decisions around the COVID-19 vaccine for healthy children ages 6 months to 17 years should be between the health care provider and the patient or their parents, with no formal recommendation from the CDC. This comes after RFK, Jr. announced that the COVID-19 vaccine is not being recommended for this group.

Two in ten (21%) parents believe the COVID-19 vaccines are being recommended, while three in ten (31%) say COVID-19 vaccines are not being recommended for healthy children this fall. This is similar across partisans, with half of parents regardless of party identification saying they don’t know enough to say, and about three in ten Republican and Republican-leaning independent parents (31%) and Democratic and Democratic-leaning independent parents (35%) aware that the CDC is not recommending the COVID-19 vaccine for healthy children this fall.

Percent among parents by party identification knowing whether federal health agencies are recommending the COVID-19 vaccine this fall for healthy children

Trust in Sources to Provide Vaccine Information

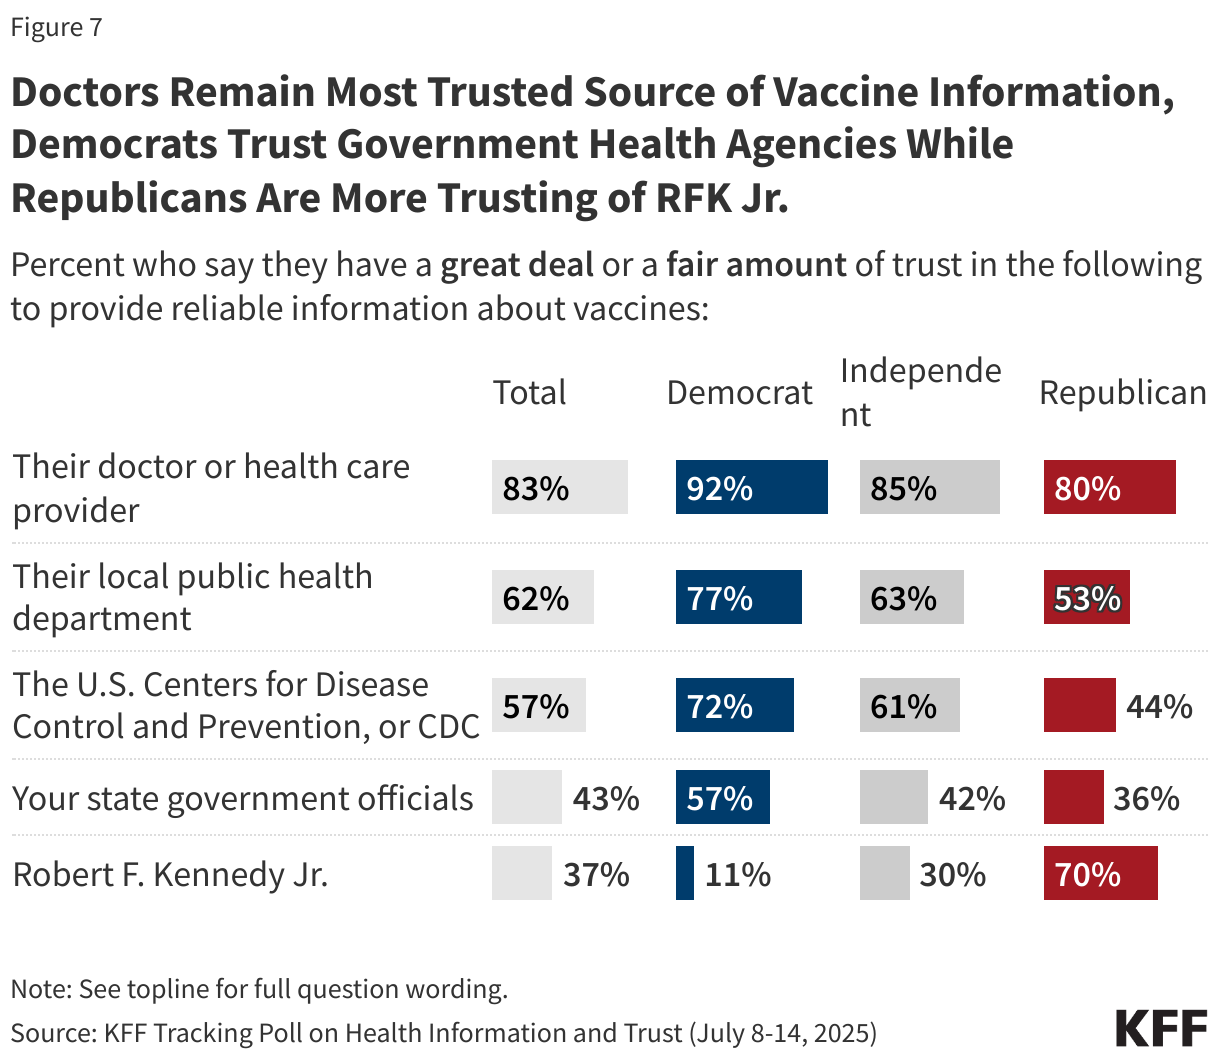
Personal doctors or health care providers remain the most trusted source for information about vaccines, with eight in ten (83%) adults saying they trust their doctor “a great deal” or “a fair amount” to provide reliable information about vaccines. Smaller shares of the public, but still majorities, trust their local public health department (62%) and the U.S. Centers for Disease Control and Prevention, or CDC (57%), to provide information on vaccines. Four in ten trust their state government officials (43%). HHS Secretary Robert F. Kennedy Jr. continues to be the least trusted source of information on vaccines with just over one-third of adults (37%) saying they trust him at least a fair amount.

Individuals’ doctors or health care providers also garner the highest shares of trust across partisans, with at least eight in ten Democrats (92%), independents (85%), and Republicans (80%) who trust them “a great deal” or “a fair amount” to provide vaccine information. Notably, Republicans’ next trusted source behind their own personal doctor is RFK Jr., with seven in ten Republicans saying they trust him to provide reliable information on vaccines, compared to three in ten independents and one in ten (11%) Democrats.

Democrats are more trusting of vaccine information from health agencies than independents or Republicans, with three-quarters (77%) of Democrats saying they trust their local public health department to provide reliable information on vaccines, compared to two-thirds (63%) of independents, and half (53%) of Republicans. Similarly, another seven in ten (72%) Democrats trust the CDC compared to six in ten (61%) independents and just under half (44%) of Republicans. These partisan divides in trust are consistent with findings from previous KFF polling.

Split bar chart by partisanship showing the share of people who have a great deal or fair amount of trust in several sources to provide reliable information on vaccines.

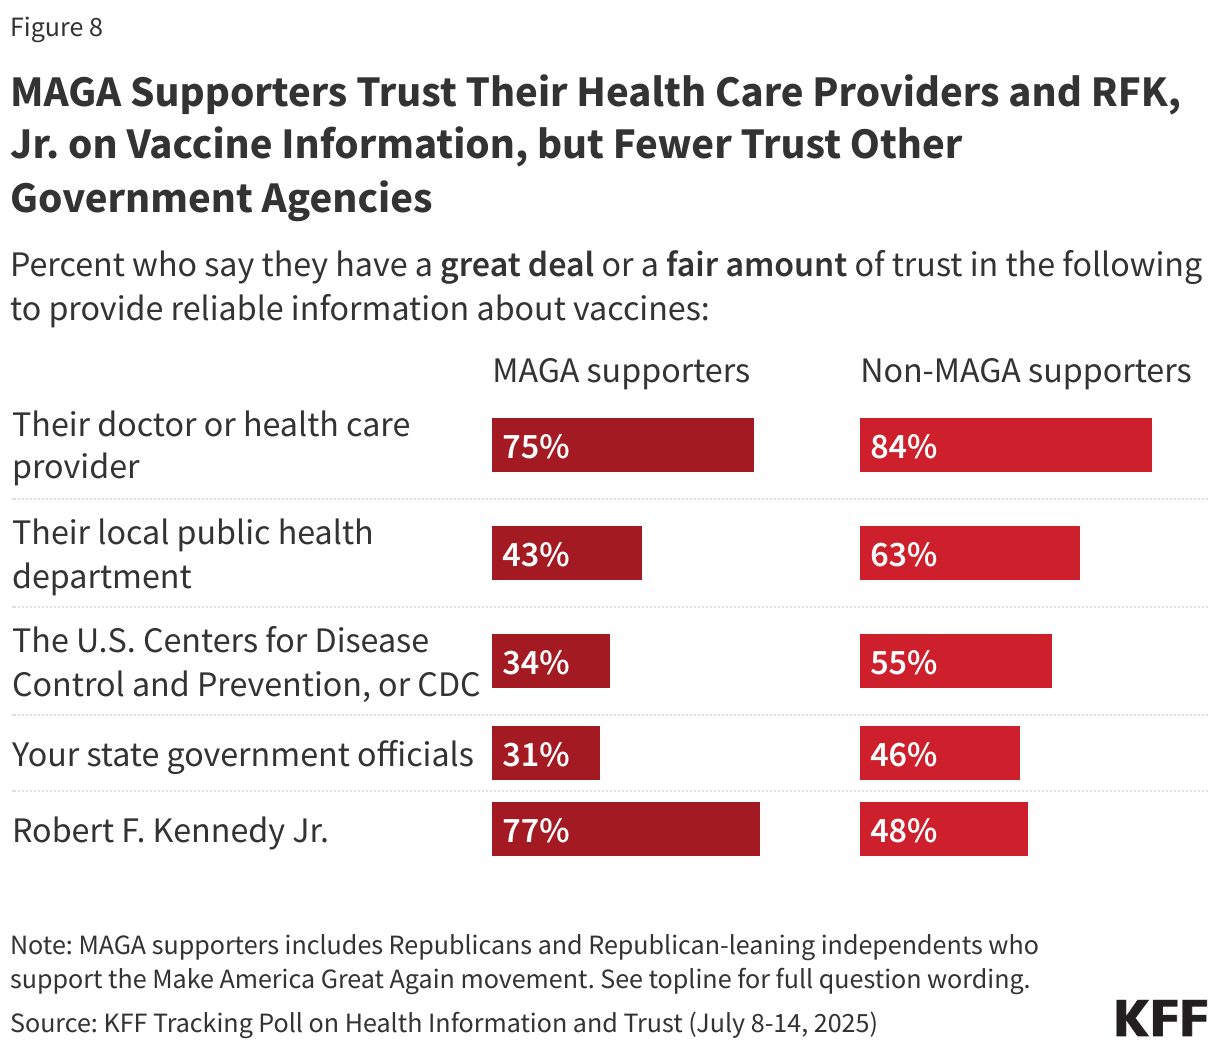
Republicans or Republican-leaning independents who support the MAGA movement are consistently less trusting of sources of information about vaccines than non-MAGA Republicans and leaners, with significantly fewer who say they trust their local public health department, the CDC, and their state government officials. Similar shares say they trust their personal doctors “a great deal” or “a fair amount,” but larger shares of MAGA Republicans trust RFK Jr. to provide information on vaccines (77% vs. 48% of non-MAGA Republicans).

Split bar chart by MAGA support showing the share of people who have a great deal or fair amount of trust in several sources to provide reliable information on vaccines.

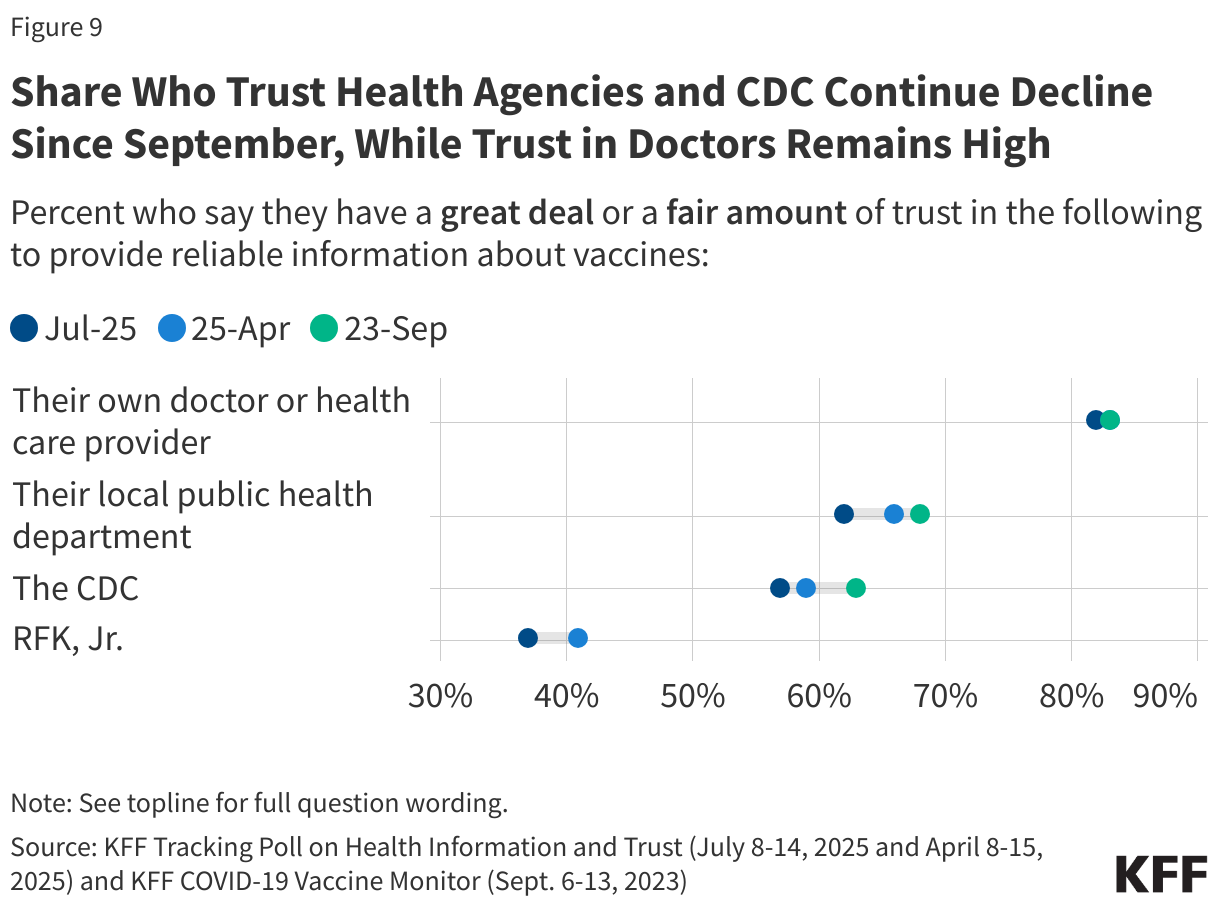
The latest polling shows that overall trust in government agencies, like the CDC or people’s local public health departments, to provide reliable information on vaccines is continuing a downward trend since first asked in September 2023. The share of adults who say they trust either the CDC or their local public health department has dropped six percentage points, while the share who trust their own provider has stayed relatively stable.

Dot plot between September 2023 and July 2025 showing the share of people who say they have a great deal or fair amount of trust in their doctors, health department, CDC and RFK, Jr.

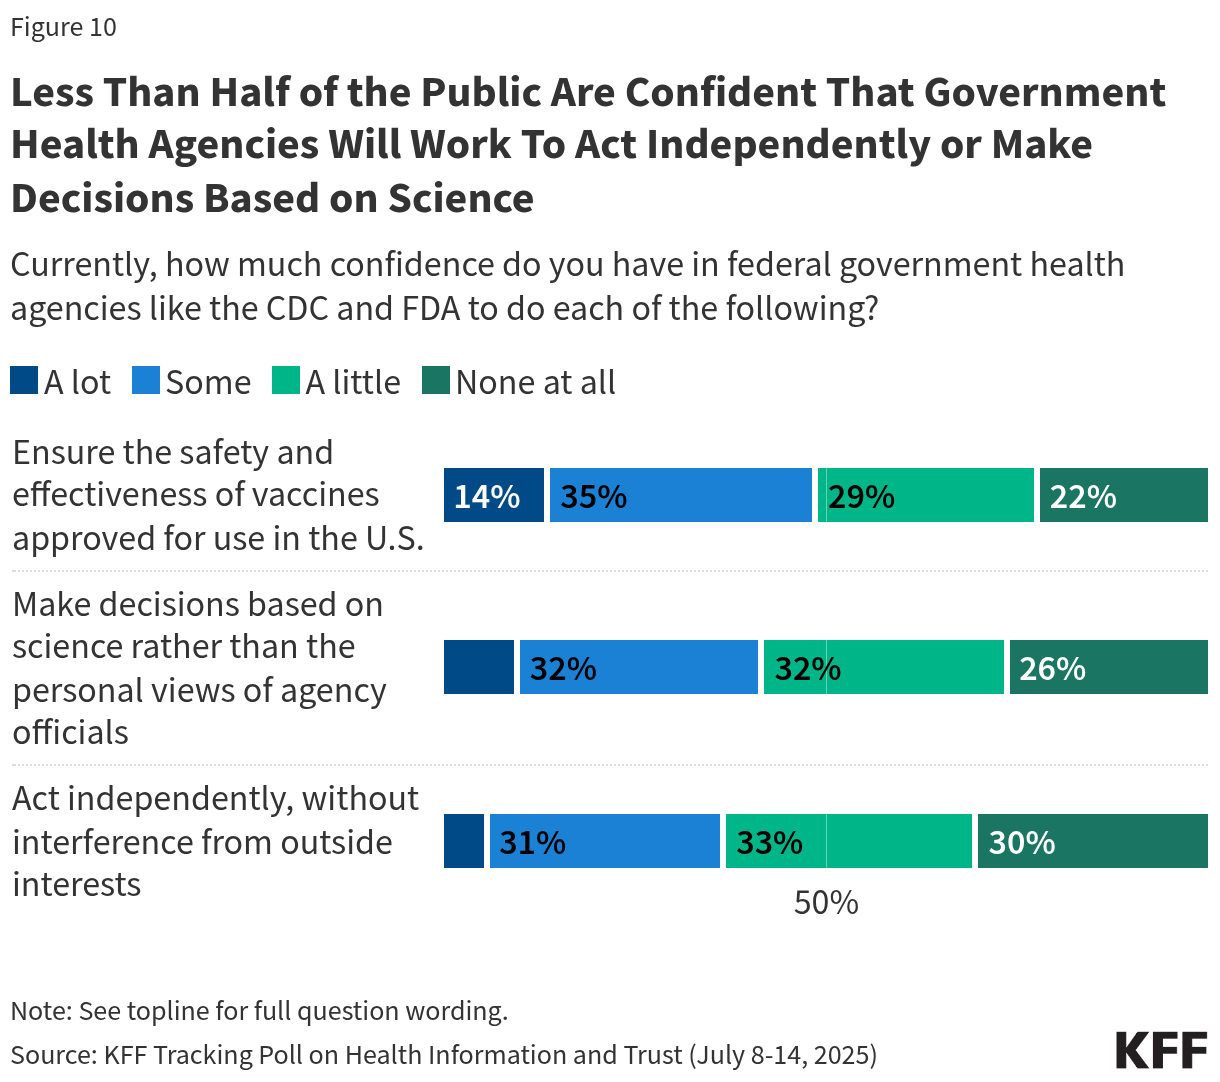
Even as majorities of the public express trust in government health agencies, like the CDC, to provide information on vaccines, few have confidence in agencies like the CDC and FDA to carry out many of their responsibilities, including ensuring the safety and effectiveness of vaccines approved for use in the U.S. (49%), making decisions based on science rather than the personal views of agency officials (42%), or acting independently, without interference from outside interests (37%). Fewer than one in five adults say they have “a lot” of confidence in these agencies to fulfill each of these tasks.

Bar chart showing confidence in federal health agencies on a variety of tasks

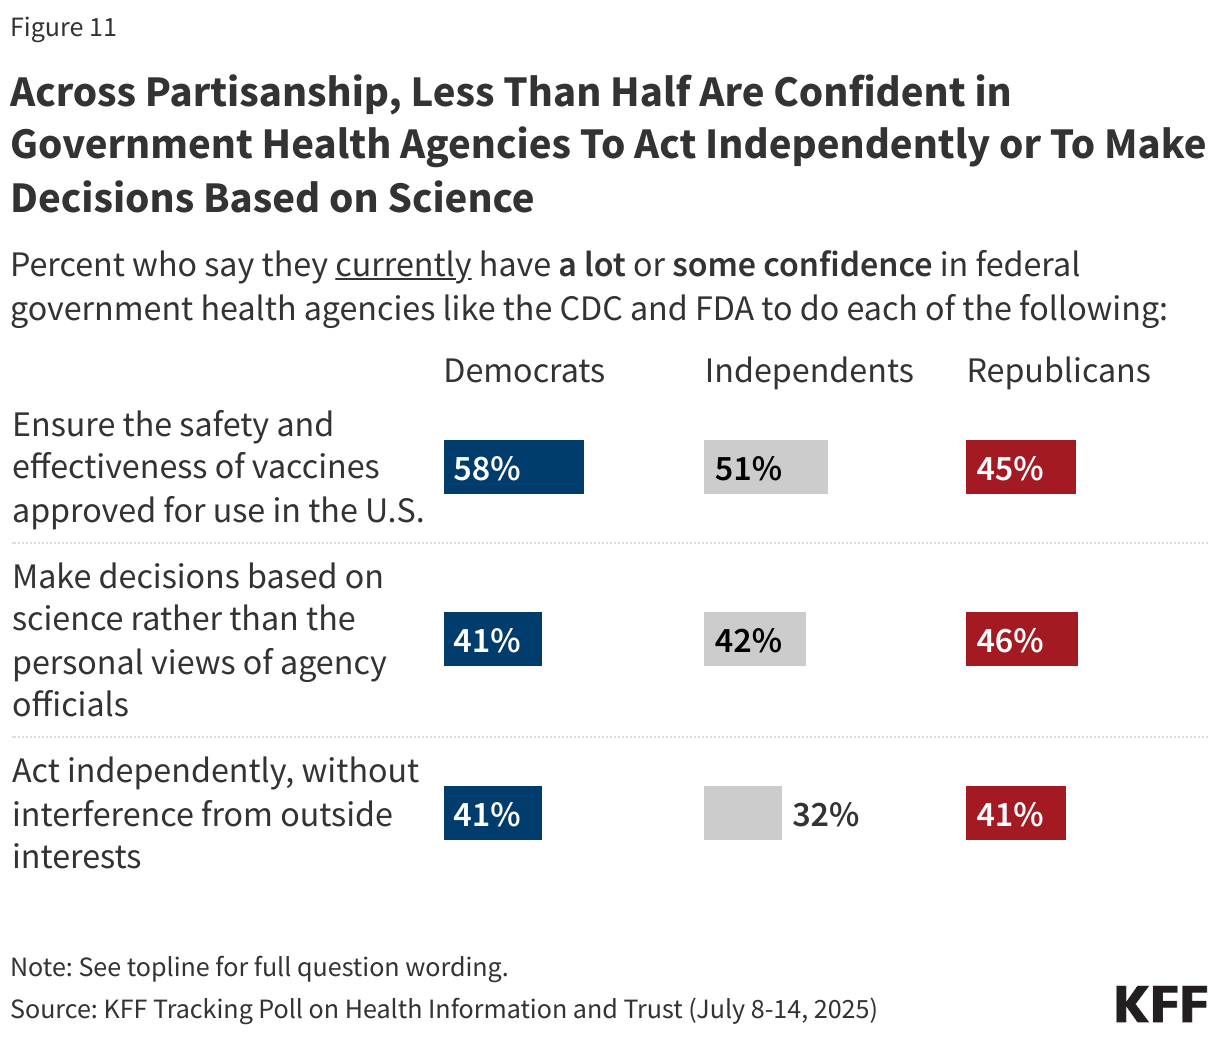
Despite the fact that Trump administration appointees lead these federal health agencies, larger shares of Democrats than Republicans have at least “some” confidence in government health agencies to ensure the safety and effectiveness of vaccines approved for use in the U.S. About six in ten (58%) Democrats say they are confident in these agencies to ensure the safety and effectiveness of vaccines, compared to less than half (45%) of Republicans who agree.

Similar shares of Democrats (41%), independents (42%), and Republicans (46%) have confidence in the government to make decisions based on science rather than personal views of agency officials, and similar shares of Democrats (41%) and Republicans (41%) are confident in the federal health agencies to act independently, without interference from outside interests. A smaller share of independents – about a third (32%) – say the same about agencies’ ability to act independently.

Split bar chart by partisanship showing the share of people who have a great deal or fair amount of trust in several sources to provide reliable information on vaccines.

This KFF Health Tracking Poll/KFF Tracking Poll on Health Information and Trust was designed and analyzed by public opinion researchers at KFF. The survey was conducted July 8-14, 2025, online and by telephone among a nationally representative sample of 1,283 U.S. adults in English (n=1,212) and in Spanish (n=71). The sample includes 1,004 adults (n=58 in Spanish) reached through the SSRS Opinion Panel either online (n=979) or over the phone (n=25). The SSRS Opinion Panel is a nationally representative probability-based panel where panel members are recruited randomly in one of two ways: (a) Through invitations mailed to respondents randomly sampled from an Address-Based Sample (ABS) provided by Marketing Systems Groups (MSG) through the U.S. Postal Service’s Computerized Delivery Sequence (CDS); (b) from a dual-frame random digit dial (RDD) sample provided by MSG. For the online panel component, invitations were sent to panel members by email followed by up to three reminder emails.

Another 279 (n=13 in Spanish) adults were reached through random digit dial telephone sample of prepaid cell phone numbers obtained through MSG. Phone numbers used for the prepaid cell phone component were randomly generated from a cell phone sampling frame with disproportionate stratification aimed at reaching Hispanic and non-Hispanic Black respondents. Stratification was based on incidence of the race/ethnicity groups within each frame. Among this prepaid cell phone component, 135 were interviewed by phone and 144 were invited to the web survey via short message service (SMS).

Respondents in the prepaid cell phone sample who were interviewed by phone received a $15 incentive via a check received by mail. Respondents in the prepaid cell phone sample reached via SMS received a $10 electronic gift card incentive. SSRS Opinion Panel respondents received a $5 electronic gift card incentive (some harder-to-reach groups received a $10 electronic gift card). In order to ensure data quality, cases were removed if they failed two or more quality checks: (1) attention check questions in the online version of the questionnaire, (2) had over 30% item non-response, or (3) had a length less than one quarter of the mean length by mode. Based on this criterion, 1 case was removed.

The combined cell phone and panel samples were weighted to match the sample’s demographics to the national U.S. adult population using data from the Census Bureau’s 2024 Current Population Survey (CPS), September 2023 Volunteering and Civic Life Supplement data from the CPS, and the 2025 KFF Benchmarking Survey with ABS and prepaid cell phone samples. The demographic variables included in weighting for the general population sample are gender, age, education, race/ethnicity, region, civic engagement, frequency of internet use, political party identification by race/ethnicity, and education. The weights account for differences in the probability of selection for each sample type (prepaid cell phone and panel). This includes adjustment for the sample design and geographic stratification of the cell phone sample, within household probability of selection, and the design of the panel-recruitment procedure.

The margin of sampling error including the design effect for the full sample is plus or minus 3 percentage points. Numbers of respondents and margins of sampling error for key subgroups are shown in the table below. For results based on other subgroups, the margin of sampling error may be higher. Sample sizes and margins of sampling error for other subgroups are available on request. Sampling error is only one of many potential sources of error and there may be other unmeasured error in this or any other public opinion poll. KFF public opinion and survey research is a charter member of the Transparency Initiative of the American Association for Public Opinion Research.

GroupN (unweighted)M.O.S.E.
Total1,283± 3 percentage points
Party ID
Democrats439± 6 percentage points
Independents387± 6 percentage points
Republicans344± 6 percentage points
MAGA Republicans308± 7 percentage points