10 Reasons to Pay Attention to ACA Open Enrollment in 2020

Authors: Cynthia Cox, Karen Pollitz, and Daniel McDermott
Published: Nov 5, 2020

The coronavirus pandemic has dominated the nation’s attention for about nine months, recently rivaled only by the Presidential election. But, there’s another thing many people may want to pay attention to right now, especially with historic job losses: How to maintain health insurance coverage at a time they may need it most.

The combination of extraordinary job losses and a historic pandemic are likely to test the Affordable Care Act (ACA) health insurance safety nets in a way not yet seen since the law’s passage. On one hand, people losing job-based coverage now may be more motivated than before to access ACA insurance programs like expanded Medicaid and Marketplace subsidies because of the pandemic. On the other hand, awareness of these key ACA programs has fallen over time, and people losing job-based coverage now may never have had a need to learn about the ACA’s programs since the 2014 implementation.

Whether new to the market or reenrolling, everyone who wants 2021 coverage through the ACA Marketplace must sign up during Open Enrollment, which takes place November 1 – December 15 in most states. In ten state-run marketplaces, the Open Enrollment period will be longer.

Here, we detail ten ways in which the 2021 ACA open enrollment period differs from enrollment periods in past years. We also provide links to a number of KFF resources for more information.

1. More people than ever before may need to know about coverage options through the Marketplace or Medicaid Expansion. Ten years ago, the ACA passed in the wake of the last financial crisis to hit the United States, when job losses left millions without access to insurance coverage. While most people in the U.S. still rely on employer coverage, the ACA creates and expands programs (specifically, the Marketplaces and Medicaid Expansion), through which people without job-based benefits can access health coverage with financial help. Since these programs went into effect in 2014, though, the economy has been relatively strong until early 2020. As such, this year’s Open Enrollment period could be the first real test of how well the ACA works to maintain coverage when large numbers lose their job-based health insurance.

Heading into 2021, continued widespread economic dislocation during this COVID-19 emergency could mean millions of people may need Medicaid or private health insurance through the Marketplace who haven’t needed that before. There are few, if any, reliable real-time data sources that would allow us to know exactly how many of the people losing employment have also lost health insurance. In an analysis of insurer-reported enrollment through June, we found employer group enrollment had dropped by 1.3%, indicating that many employers had kept furloughed workers on coverage at least temporarily. However, as more job losses become permanent, more coverage loss is possible, even likely. KFF has estimated that as many as 85% of people who are at risk of becoming uninsured due to loss of job-based coverage could be eligible for Medicaid or subsidized marketplace coverage.

2. Consumer awareness of ACA coverage options is limited. Although the vast majority of people at risk of losing coverage may be eligible for help, KFF polling finds that public awareness about ACA coverage options has fallen somewhat since the law passed a decade ago. For example, 59% of the public knows the ACA offers subsidies for marketplace health plans, compared to 75% ten years ago.  Among uninsured consumers today, understanding of ACA options and enrollment rules is more limited.  Less than half (43%) know Open Enrollment is the time to sign up for Marketplace plans; and 14% of uninsured individuals living in states that have expanded Medicaid eligibility under the ACA know about this expansion.  KFF also finds many consumers are unsure about the current status of the ACA; as of this spring, just 22% of the uninsured know the law remains in effect.  Uncertainty may result in part due to public debate and news coverage about  a pending Supreme Court case to overturn the law.

The Trump Administration has reduced funding for Open Enrollment marketing and outreach by 90 percent. In this environment, news coverage of Open Enrollment and the availability of financial assistance could have an even more significant impact on public education.

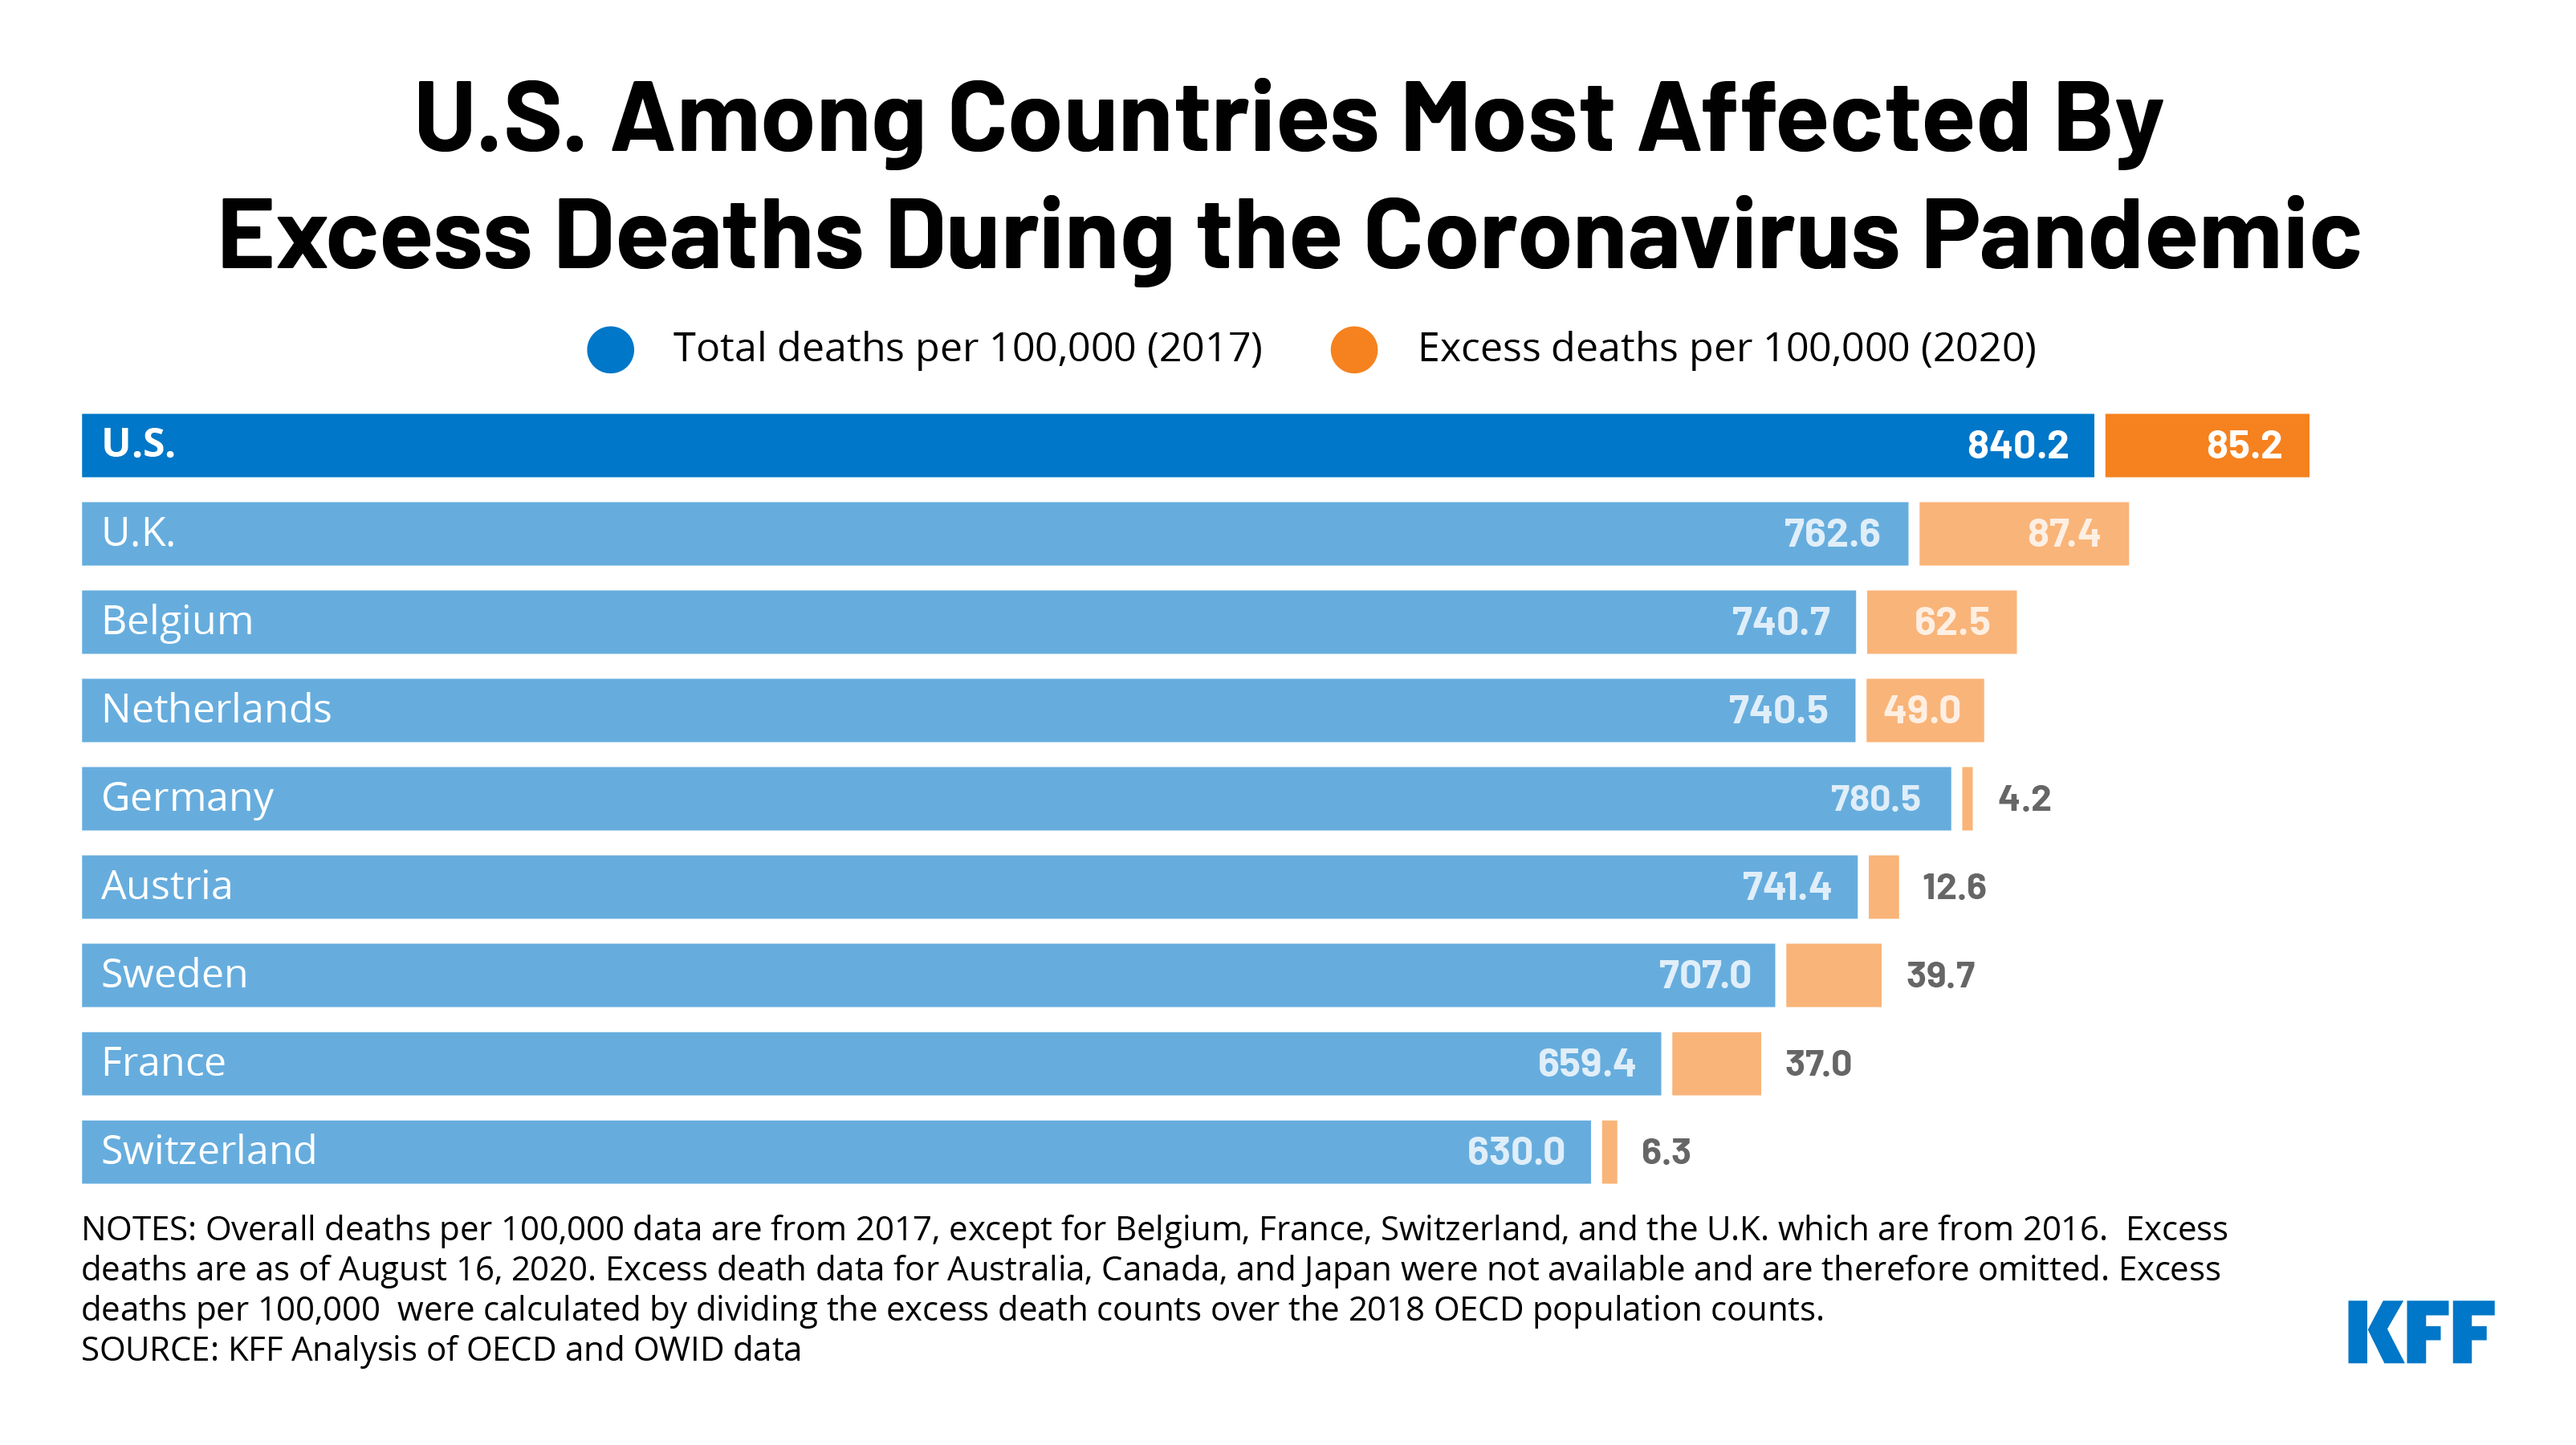
3. The importance of health coverage is even greater as coronavirus cases are surging. In recent days, the number of new coronavirus infections reached record highs in the U.S., and the pandemic is worsening rapidly in parts of the country that had previously been spared. A KFF analysis earlier this year showed that the cost of COVID-19 treatment for those requiring hospitalization could easily top ten thousand dollars, with more severe cases costing tens of thousands of dollars. Many private insurers have waived out-of-pocket costs for people needing COVID-19 treatment. At the very least, people with ACA-compliant private insurance are protected by out-of-pocket maximums, limiting how much enrollees must pay for a hospitalization. There is currently no guarantee that hospitals waive COVID-19 treatment costs for uninsured patients, meaning those without coverage could be on the hook for large medical bills.

4. Changes are taking place for 2021: premiums are dropping in many areas, as new insurers enter the Marketplaces. On average, marketplace benchmark premiums are declining by more than 2% in 2021 across the country (Table 1). In addition, new insurers are entering the Marketplace or expanding their service area in many states next year. These changes can increase plan choices and improve affordability for people who don’t qualify for Marketplace subsidies. People already enrolled in Marketplace plans with subsidies who want to renew coverage for 2021 are strongly advised to actively renew coverage, and not rely on Marketplace automatic renewal procedures. Changes in 2021 premiums and plan participation can affect the amount of a person’s tax credit from year to year. Actively renewing coverage lets people update their income information and review new plan choices, ensuring they receive the most accurate subsidy for 2021.

Table 1: Change in the Average Lowest-Cost Premium by Metal Level Before Tax Credit,  2020-2021 for a 40-year-old
20202021% Change
Lowest Cost Bronze Premium$331$328-0.9%
Lowest Cost Silver Premium$442$436-1.4%
Lowest Cost Gold Premium$501$481-4.0%
Benchmark Premium$462$452-2.2%
SOURCE: KFF analysis of premium data from Healthcare.gov and review of state rate filings.

5. For many people, incomes are particularly volatile this year, which can affect program eligibility and financial assistance. During the pandemic, many people have or will experience changes in income that could complicate their application for subsidies. Those who have previously been told they were ineligible for Marketplace financial assistance or Medicaid may now find out they are eligible if their income or other household circumstances have changed. An earlier KFF brief explored the various ways changes in wage income and unemployment benefits affect eligibility for Medicaid and Marketplace subsidies. Our newly released 2021 FAQs also review rules for income changes mid-year including potential tax consequences for those who mis-estimate their 2021 income. People who received Marketplace subsidies this year, will also have to report on income and sources when they file their 2020 tax return next year; FAQs provide information about how to count the $1,200 Recovery Rebate and federal supplements to weekly unemployment benefits that many received this year.

6. New State Actions: State Based Exchanges, Medicaid Expansions, and Public Options. Other new developments this year include new state-run insurance marketplaces and the first public option program. Residents of two states that have been using HealthCare.gov – Pennsylvania and New Jersey – will need to sign up through new state-run Marketplaces for 2021 and will have a longer Open Enrollment period than they’ve been used to. Currently, 37 states have adopted and implemented Medicaid expansion and both Oklahoma and Missouri plan to implement expansion by mid-2021. Additionally, the Washington state exchange has implemented a new quasi-public option, called Cascade Care, which will be offered in half of the state’s counties this year. KFF’s FAQs also provide updated information on four states that supplement marketplace subsidies with state funding.

7. Recent Trump Administration policy changes and court rulings may affect eligibility and covered benefits for some people. The KFF FAQs also include updated information related to recent Trump Administration actions and court rulings that may affect eligibility or covered benefits for some consumers. These include expanded exemptions for employers who refuse to cover contraceptive services based on religious or moral objections, and changes to the “public charge” test for certain individuals applying for green card status who use certain government services. The FAQs also provide information about private websites offering alternative enrollment pathways for people seeking marketplace plans and subsidies, and about short-term policies.

8. Enrollment help is available, though may be in short supply. Consumers in most states can get help from trained experts (Navigators) who won’t try to sell them anything. However, federal government funding for Navigators remains limited, with no funding for Navigators in South Carolina or Utah. In several other states, including Texas, Ohio, Illinois, Kansas, and Michigan, many counties will not be served by federal navigator programs. KFF finds nearly 5 million consumers tried to find enrollment help during the last Open Enrollment but could not. Among those who found help, about one in five heard about it through an advertisement or news coverage.

9. People affected by natural disasters or the COVID-19 disaster can apply for extended time to sign up for 2021 coverage. As in past years, people who live in FEMA-designated areas affected by hurricanes, wild fires, or other disasters – can get more time to sign up for 2021 coverage if you are unable to enroll by the end of Open Enrollment. This extension may also be available to residents throughout the US who are unable to sign up on time due to the COVID-19 disaster. The time extension is not automatic, and must be requested from the Marketplace call center.

10. There is still time to sign up for 2020 coverage. Even as this year winds down, people who lost coverage earlier this year due to the pandemic can still sign up for 2020 coverage because of a time extension for special enrollment periods (SEP). Normally, people have just 60 days to apply for a special enrollment period after they lose other coverage, but during the pandemic, those who lost coverage at any time during 2020 can still apply for an SEP to get coverage for the remainder of this year. In 3 states (Maryland, New York, and the District of Columbia), all residents who are uninsured, no matter the reason, can still sign up for 2020 coverage.

With so much changing this year, there is no shortage of reasons why the public needs to know about ACA open enrollment. KFF features more than 300 Frequently Asked Questions about the Health Insurance Marketplace and the Affordable Care Act (ACA). Spanish-language translations are also available. KFF Open Enrollment information materials also include an ACA Marketplace Subsidy Calculator, a subsidy explainer, and state-level data on premium changes. FAQs also focus on information of particular interest to young adults, women, immigrants, early retirees, non-traditional households, and people with employer-based health benefits.

How Costly Are Common Health Services in the United States?

Published: Nov 4, 2020

A new chart collection examines what we know about the cost of common health services in the U.S.

The analysis shows that costs for many common health services have risen more rapidly than inflation; for example, the average cost of hospital admission among large employer plans increased by about $10,000 (68%) between 2008 and 2018. Additionally, there are large geographic variations in the cost of the same health services across the U.S. A lower back MRI in the Las Vegas, NV area costs $404 on average; in the Houston, TX area, the average price is $1,106.

The chart collection is available on the Peterson-KFF Health System Tracker, an online information hub dedicated to monitoring and assessing the performance of the U.S. health system.

Pre-Existing Condition Prevalence Among Women Under Age 65

Published: Nov 4, 2020

Data Note

The Affordable Care Act (ACA) guarantees that people cannot be denied coverage or charged higher premiums in the individual insurance market due to their health status. While most adults under age 65 have health insurance coverage through an employer, many turn to the non-group market at some point in their lives, such as if they lose a job, become self-employed, get divorced, age off of a parent’s policy, retire early, or lose eligibility for public coverage. Prior to 2014, when most of the Affordable Care Act’s (ACA) consumer protections took effect, people seeking non-group coverage in all but five states1  were routinely denied or charged more based on their health status and history, pregnancy status, prescription medications, and lab results. In 2013, 18% of individual market applicants were denied coverage; this figure does not account for the many people with pre-existing health conditions who did not even try to apply.

In November, the Supreme Court will hear oral arguments on California v. Texas, a lawsuit brought by Republican state officials and supported by President Trump, that seeks to invalidate the ACA entirely. If the ACA is overturned, federal protections for people with pre-existing health conditions would end and access to high quality, affordable individual market insurance for them could be drastically reduced.

We analyzed data from the 2018 National Health Interview Survey (NHIS) and 2018 Behavioral Risk Factor Surveillance System (BRFSS) to calculate prevalence rates of declinable health conditions.2  This data note looks at the share of adults ages 18-64 with declinable pre-existing conditions, with a particular focus on women.

Estimates of the Share of Women Under Age 65 with Pre-Existing Conditions

53.8 million (27%) adults under 65 have at least one pre-existing condition that would have rendered them ineligible for individual insurance prior to the ACA, with higher rates among women than men. The prevalence of declinable conditions increases with age, ranging from 18% of those ages 18-34 to 44% of those ages 55-64 (Figure 1).

Figure 1: Share of Adults Under Age 65 with Declinable Pre-Existing Conditions, by Age and Gender, 2018

We estimate that 30.1 million (30%) women have a pre-existing condition that would have left them uninsurable in the individual market pre-ACA, compared to 23.7 million (24%) men (Table 1). These estimates are conservative because the NHIS and BRFSS do not contain data for all conditions that were often declinable (e.g., HIV/AIDS), nor for use of prescription medications that could have triggered a coverage denial. Some conditions disproportionately affect women, such as pregnancy and certain types of cancer.

Table 1: Among Adults Ages 18-64 with Declinable Pre-Existing Health Conditions, Types of Conditions, by Gender, 2018
WomenMenTotal
Current pregnancy12%NANA
Crohn’s disease, ulcerative colitis, or ulcers45%47%46%
Ever had diabetes24%29%26%
Difficulty due to depression22%21%21%
Any other heart condition20%23%21%
BMI > 4023%16%20%
Chronic bronchitis in past 12 months14%9%12%
Ever had non-skin cancer15%9%12%
Melanoma skin cancer8%6%8%
Ever had congenital heart disease4%10%7%
Ever had COPD6%8%7%
Ever had stroke5%7%6%
Ever had heart attack3%8%6%
Weak or failing kidneys5%5%5%
SOURCE: KFF analysis of data from 2018 National Health Interview Survey and the 2018 Behavioral Risk Factor Surveillance System.

Older women, certain women of color, low-income women, and women living in non-metropolitan counties experience pre-existing health conditions at higher rates than their counterparts (Figure 2).

Non-Hispanic women under age 65 of ‘other’ races (43%) have a prevalence of declinable pre-existing conditions nearly three times higher than non-Hispanic Asian women (16%). One in four (25%) Hispanic women have a have a pre-existing condition, which is also lower than the national average. Seventy percent of women under 65 in the ‘NH All other races’ category are American Indian/Alaska Native (AIAN), 23% are of multiple races, and 9% were not releasable by NHIS due to respondent confidentiality or for other reasons. Forty-two percent of AIAN women under 65 of any ethnicity have a declinable pre-existing condition. Approximately one-third of non-Hispanic white (33%) and black (31%) women under 65 have a declinable condition.

The share of women under 65 with a declinable health condition decreases with income, ranging from 40% of those with household incomes below 100% of the federal poverty level (FPL) to 25% for those at or above 400% of FPL. Twenty-seven percent of women under 65 residing in a metropolitan county have a pre-existing condition compared to 34% in non-metropolitan counties.3 

Figure 2: Share of Women Ages 18-64 with Declinable Pre-Existing Conditions, by Sociodemographic Characteristics, 2018

Estimates of the Share of Women Ages 18-64 with Pre-Existing Conditions by State

Rates of declinable pre-existing conditions vary from state to state (Figure 3). On the low end, less than one-quarter (23%) of women under age 65 in Massachusetts have conditions that would likely be declinable under pre-ACA underwriting practices in the individual market. For men under age 65 (19%), the rate is lowest in Colorado. On the high ends, more than one-third of women (39%) and men (34%) in West Virginia have a declinable health condition. Overall, rates of pre-existing conditions are higher in the South – such as Arkansas (34%), Kentucky (34%), Mississippi (34%), and West Virginia (37%), where at least one-third of adults under 65 have declinable conditions.

.

Discussion

We estimate that 27% (53.8 million) of adults under age 65, including 30% (30.1 million) of women, have at least one pre-existing health condition that would have left them uninsurable in the medically-underwritten, pre-ACA individual market. The ACA’s prohibition on denying health insurance based on health status, or charging more for coverage, has been of particular importance to women, who have higher rates of pre-existing conditions than men. If the ACA is overturned, these protections would disappear, leaving many women vulnerable to difficulties obtaining insurance that addresses all of their health needs should they need to secure coverage through the individual insurance market either as their regular source of coverage or temporarily during life transitions.

Appendix

Appendix 1: Share of People Ages 18-64 with Declinable Pre-Existing Conditions, by State and Gender, 2018
StateWomenMenTotal Population
Alabama36%30%33%
Alaska29%23%26%
Arizona31%24%28%
Arkansas38%30%34%
California27%23%25%
Colorado25%19%22%
Connecticut25%23%24%
Delaware30%26%28%
District of Columbia26%21%23%
Florida30%27%28%
Georgia30%26%28%
Hawaii26%24%25%
Idaho28%23%26%
Illinois28%24%26%
Indiana32%29%30%
Iowa27%23%25%
Kansas30%25%27%
Kentucky37%31%34%
Louisiana37%30%33%
Maine29%28%28%
Maryland29%25%27%
Massachusetts23%22%23%
Michigan31%28%29%
Minnesota24%22%23%
Mississippi38%30%34%
Missouri33%27%30%
Montana25%23%24%
Nebraska28%24%26%
Nevada30%23%26%
New Hampshire30%27%28%
New Jersey27%23%25%
New Mexico31%25%28%
New York28%24%26%
North Carolina31%25%28%
North Dakota26%24%25%
Ohio30%27%29%
Oklahoma35%28%31%
Oregon30%25%28%
Pennsylvania30%25%27%
Rhode Island28%25%27%
South Carolina33%27%30%
South Dakota26%22%24%
Tennessee36%29%32%
Texas29%26%28%
Utah25%22%24%
Vermont26%22%24%
Virginia27%24%26%
Washington27%23%25%
West Virginia39%34%37%
Wisconsin28%22%25%
Wyoming28%22%25%
U.S.30%24%27%
NOTE: Five states (MA, ME, NJ, NY, VT) had broadly-applicable guaranteed access to insurance before the ACA. What protections might exist in these or other states if the ACA is overturned is unclear.SOURCE: KFF analysis of data from 2018 National Health Interview Survey and the 2018 Behavioral Risk Factor Surveillance System.

Endnotes

  1. Maine, Massachusetts, New Jersey, New York, and Vermont. ↩︎
  2. For full methodology, please see the methods section of Pre-Existing Condition Prevalence for Individuals and Families. ↩︎
  3. BRFSS designation of metro/non-metro counties is based on the 2013 NCHS Urban-Rural Classification Scheme for Counties. ↩︎

People with Disabilities Are At Risk of Losing Medicaid Coverage Without the ACA Expansion

Authors: MaryBeth Musumeci and Kendal Orgera
Published: Nov 2, 2020

Data Note

On November 10, 2020, the Supreme Court will hear oral argument in a case that could invalidate the entire Affordable Care Act (ACA), including the Medicaid expansion. Without the ACA, most people who gained coverage through the Medicaid expansion would likely become uninsured, and states would lose access to the enhanced federal matching funds to finance this coverage. Many people who qualify for the ACA Medicaid expansion have a disability, despite that they do not meet the strict medical standard to qualify for federal Supplemental Security Income (SSI) cash assistance benefits and therefore do not qualify for Medicaid on that basis. This data note presents the latest state-level data about nonelderly Medicaid adults who have disabilities but do not quality for SSI and considers the implications for their continued coverage if the ACA expansion is invalidated by the Court. Key findings include the following:

  • More than six in 10 nonelderly Medicaid adults with disabilities do not receive SSI, meaning that they qualify for Medicaid on another basis. Nonelderly adults with disabilities who do not receive SSI can qualify for Medicaid based solely on their low income through the expansion group or as parents in non-expansion states. They also may qualify in a disability-related pathway offered at state option.
  • The median share of nonelderly Medicaid adults with a disability but not SSI is higher in expansion states compared to non-expansion states (68% vs. 53%). The availability of the ACA expansion contributes to this difference because the expansion provides a pathway to Medicaid eligibility for people with disabilities, many of whom previously did not qualify. Prior to the ACA, childless adults did not qualify for Medicaid no matter how poor, and eligibility limits for parents were very low. If the Court also invalidates the ACA’s protections for people with pre-existing conditions and premium subsidies, people with disabilities who lose expansion coverage could have difficulty obtaining private market coverage.
  • Medicaid is a significant source of coverage for nonelderly adults with disabilities but not SSI, providing access to care for serious health conditions and supporting those who work. A majority of nonelderly Medicaid adults with disabilities but not SSI report serious difficulty with cognitive functioning and just under half report serious difficulty with mobility. Nearly three in 10 nonelderly Medicaid adults with disabilities but not SSI are in the workforce.

How is “disability” defined?

While SSI is sometimes used as a shorthand to identify people with disabilities, not all people with disabilities qualify for SSI. SSI is a monthly cash payment to help low-income people with disabilities pay for housing, food, and other basic needs. To qualify for SSI, individuals must have low incomes, limited assets, and an impaired ability to work at a substantial gainful level as a result of old age or significant disability. The SSI disability criteria are more stringent than other definitions of disability, such as those used in national surveys. The American Community Survey (ACS) classifies a person as having a disability if the person reports serious difficulty with hearing, vision, cognitive functioning (concentrating, remembering, or making decisions), mobility (walking or climbing stairs), self-care (dressing or bathing), or independent living (doing errands, such as visiting a doctor’s office or shopping, alone).1  The ACS definition of disability is intended to capture whether a person has a functional limitation that results in a participation limitation and also is used in other federal surveys, such as the Current Population Survey and the Survey of Income and Program Participation.

How do people with disabilities qualify for Medicaid?

While nearly a quarter of nonelderly adults with Medicaid report having a disability, relatively few of these enrollees qualify for Medicaid because they receive SSI benefits (Figure 1). While people who receive SSI generally automatically qualify for Medicaid, the SSI population encompasses only a subset of all people with disabilities. Over six in 10 nonelderly Medicaid adults with disabilities do not receive SSI (Figure 1). This group can be eligible for Medicaid as ACA expansion adults or Section 1931 parents (based solely on their low income). There is no way with federal survey data to separate people who qualify due to the Medicaid expansion from those who would have qualified under pre-ACA eligibility rules. They also may be eligible for Medicaid through an optional disability-related pathway (such as the state option to cover people with disabilities up to the federal poverty level or a home and community-based services waiver).2  Without the expansion pathway, Medicaid coverage for people with disabilities typically is limited to people who receive SSI because other disability-related pathways are provided at state option. And, in addition to using a more restrictive definition of disability compared to other measures, SSI income and asset limits are more restrictive than those required for Medicaid expansion adults and many optional disability-related Medicaid coverage pathways.3 

Figure 1: Disability and SSI Status of Nonelderly Adults with Medicaid, 2019

Although it is not often thought of in these terms, the ACA expansion provides a significant Medicaid eligibility pathway for many people with disabilities. People covered in the Medicaid expansion group are sometimes erroneously described as “able-bodied adults.” While it is true that disability status is not one of the eligibility criteria to qualify for the expansion group, nonelderly adults with disabilities who do not receive SSI can qualify for Medicaid based solely on their income through the expansion group. Many people in the expansion group were previously ineligible for Medicaid. With the ACA expansion, Congress for the first time created a pathway in federal law for states to cover childless adults and low-income parents up to 138% of the federal poverty level (FPL, $17,609/year for an individual in 2020). Before the ACA, childless adults did not qualify for Medicaid, no matter how poor, and financial eligibility limits for “Section 1931” parents were tied to the former Aid to Families with Dependent Children cash assistance program and were very low, averaging 64% FPL nationally.

The median share of nonelderly Medicaid adults with a disability but not SSI is higher in expansion states compared to non-expansion states (68% vs. 53%) (Table 1). The availability of the ACA Medicaid expansion pathway contributes to this difference. Studies assessing the impact of the Medicaid expansion have identified coverage gains for people with disabilities as well as those with specific medical conditions or needs such as prescription drug users, people with substance use disorders including opioid use disorders, people with HIV, low-income adults who screened positive for depression, adults with diabetes, cancer patients/survivors, and adults with a history of cardiovascular disease or two or more cardiovascular risk factors. Nonelderly adults with disabilities who do not receive SSI also may qualify for Medicaid through an optional disability-related pathway. Greater shares of expansion states have adopted key optional disability-related pathways, compared to non-expansion states.4 

Why is Medicaid coverage beyond the SSI pathway important for people with disabilities?

Even though their needs do not rise to the stringent SSI level, nonelderly Medicaid adults with disabilities but not SSI still report serious functional limitations that can affect their health, making coverage important. A majority (52%) of non-SSI Medicaid adults with disabilities report serious difficulty with cognitive functioning, and nearly half (46%) report serious difficulty with mobility.5  Two in five (40%) non-SSI Medicaid adults with disabilities report serious difficulty with independent living tasks, such as visiting a doctor’s office or shopping alone.6  Smaller shares report serious difficulty with vision (18%), self-care tasks such as dressing or bathing (17%), and hearing (13%), compared to the other limitations that make up the ACS disability definition.7  Nearly half (48%) of nonelderly Medicaid adults with a disability but not SSI have multiple functional limitations, reporting impairment in two or more of the six ACS areas.8 

Just under three in 10 non-SSI Medicaid adults with disabilities are in the workforce, and having health insurance coverage can support their ability to work (Figure 2). National research has found increases in the share of individuals with disabilities reporting employment and decreases in the share reporting that they are not working due to a disability in Medicaid expansion states following expansion implementation, with no corresponding trends observed in non-expansion states, while other research has found a decline in SSI participation in expansion states. Disproportionate shares of non-SSI Medicaid adults with disabilities have a high school education or less (61%), are non-Hispanic white (56%), and are female (55%) (Figure 2). Just over one-quarter are ages 55 to 64, a population that is too young to qualify for Medicare based on older age but may not have access to other coverage (Figure 2). Studies have identified larger coverage gains for the near-elderly in expansion states compared to non-expansion states.

Figure 2: Demographics of Nonelderly Medicaid Adults with a Disability But Not Receiving SSI, 2019

Looking Ahead

The ACA Medicaid expansion is a significant pathway to health insurance coverage for people with disabilities whose health needs do not rise to the stringent SSI level. These enrollees include people with serious, and often multiple, functional limitations that can affect health, including some who are in the workforce and others who are near elderly. If the Supreme Court invalidates the Medicaid expansion as part of the current case challenging the entire ACA, most expansion enrollees would likely become uninsured. These coverage losses would be in the 39 states (including DC) that have adopted the Medicaid expansion to date. The expansion group covers 15 million people as of June 2019, about 12 million of whom were newly eligible for Medicaid under the ACA (the remainder had been covered under Section 1115 waivers and subsequently moved to expansion group). Since the onset of the COVID-19 pandemic and resulting economic issues, more people may have gained coverage through the Medicaid expansion, as overall program enrollment has been increasing since February 2020. Moreover, without the ACA, states that have not yet adopted the expansion would not have the option to do so in the future.

If the Court also invalidates the ACA’s protections for people with pre-existing conditions in the private market and premium subsidies, insurers could refuse to cover or charge higher rates to people based on their health status. This could make it difficult for people with disabilities who lose Medicaid expansion coverage to obtain private health insurance at all or coverage that is affordable. As part of the health care safety net, Medicaid never has excluded people with pre-existing conditions from coverage. In addition, without the Medicaid expansion, other gains in access, utilization, affordability, and addressing disparities resulting from expansion could be lost, and states and providers would lose federal funds that help them support health services and systems.

Table 1: Nonelderly Medicaid Adults by Disability and SSI Status, 2019
StateTotal Nonelderly Medicaid AdultsNonelderly Medicaid Adults with a Disability as a Share of Total Nonelderly Medicaid AdultsNonelderly Medicaid Adults with a Disability But Not SSI as a Share of Nonelderly Medicaid Adults with a Disability
U.S. Total24,236,00024%63%
Expansion States 19,100,000Median 25%Median 68%
Alaska61,00023%77%
Arizona633,00023%71%
Arkansas276,00032%72%
California4,455,00016%68%
Colorado403,00022%74%
Connecticut345,00019%73%
Delaware78,00023%72%
District of Columbia86,00029%63%
Hawaii100,00017%72%
Illinois940,00022%66%
Indiana445,00030%67%
Iowa241,00025%72%
Kentucky479,00032%66%
Louisiana544,00025%69%
Maine97,00036%66%
Maryland459,00022%69%
Massachusetts707,00020%63%
Michigan930,00027%65%
Minnesota412,00023%71%
Montana86,00015%61%
Nevada224,00023%71%
New Hampshire69,00032%73%
New Jersey577,00020%64%
New Mexico296,00022%70%
New York2,309,00018%64%
North Dakota34,00032%81%
Ohio1,010,00027%65%
Oregon402,00026%72%
Pennsylvania1,030,00030%64%
Rhode Island98,00025%52%
Vermont65,00025%62%
Virginia397,00027%66%
Washington604,00025%66%
West Virginia208,00032%61%
Non-Expansion States 5,136,000Median 33%Median 53%
Alabama245,00036%47%
Florida1,000,00028%53%
Georgia435,00034%48%
Idaho*65,00036%53%
Kansas103,00039%54%
Mississippi171,00037%50%
Missouri*244,00039%62%
Nebraska*58,00029%46%
North Carolina509,00029%52%
Oklahoma*144,00034%54%
South Carolina282,00029%56%
South Dakota26,00025%42%
Tennessee447,00033%58%
Texas949,00033%50%
Utah*91,00032%55%
Wisconsin348,00029%62%
Wyoming20,00035%49%
NOTES: Includes non-institutionalized adults ages 19-64. Excludes those dually eligible for Medicare and Medicaid. Totals may not sum due to rounding. *MO and OK have adopted but not yet implemented the expansion. NE implemented 10/1/20, and ID and UT implemented 1/1/20, so these states are considered non-expansion states for this analysis.SOURCES: KFF analysis of the 2019 American Community Survey, 1-Year Estimates; KFF, Status of State Medicaid Expansion Decisions (Oct. 16, 2020).

Endnotes

  1. The ACS questions used to classify an individual as having a disability include: (1) Is this person deaf, or does he/she have serious difficulty hearing? (2) Is this person blind, or does he/she have serious difficulty seeing, even when wearing glasses? (3) Because of a physical, mental, or emotional condition, does this person have serious difficulty concentrating, remembering, or making decisions? (4) Does this person have serious difficulty walking or climbing stairs? (5) Does this person have difficulty dressing or bathing? (6) Because of a physical, mental, or emotional condition, does this person have difficulty doing errands alone, such as visiting a doctor’s office or shopping? U.S. Census Bureau, American Community Survey, Why We Ask Questions About… Disability, (last accessed Oct. 12, 2020). ↩︎
  2. People who qualify for Medicaid both as an expansion adult and based on a disability can choose the group through which they enroll in coverage; benefit packages may differ by coverage group. 42 C.F.R. § 435.911 (c) (2), (d). ↩︎
  3. The maximum SSI benefit is about 74 percent of the federal poverty level (FPL, $9,396/year for an individual in 2020), and the asset limit is $2,000. The ACA Medicaid expansion covers individuals up to 138% FPL ($17,609/year for an individual in 2020) without an asset test. States have the option to extend financial eligibility for certain other disability-related Medicaid coverage pathways up to 300% of SSI ($28,188/year in 2020). ↩︎
  4. As of 2018, when 37 states (including DC) had adopted the ACA Medicaid expansion, and 14 had not, just under half of expansion states elected the option to cover seniors and people with disabilities up to 100% FPL, compared to less than one-third of non-expansion states; nearly three-quarters of expansion states offered the optional medically needy pathway for seniors and people with disabilities, while just over one-third of non-expansion states did so; over two in five expansion states elected the Katie Beckett state plan option for children with significant disabilities, compared to just over one-third of non-expansion states; nearly all expansion states elected the option to cover working people with disabilities, compared to less than two-thirds of non-expansion states; and both states opting to use Section 1915 (i) as an independent eligibility pathway were expansion states. ↩︎
  5. KFF analysis of the 2019 American Community Survey, 1-Year Estimates. ↩︎
  6. Id. ↩︎
  7. Id. ↩︎
  8. Id. ↩︎

Death Toll of the Pandemic Places the U.S. at Top of Most Affected Countries

Authors: Giorlando Ramirez, Krutika Amin, Daniel McDermott, Cynthia Cox, and Chelsea Rice
Published: Nov 2, 2020

We put the coronavirus pandemic’s toll into perspective by comparing where COVID-19 falls as a leading cause of death in the U.S. versus peer countries (Organisation for Economic Co-operation and Development (OECD) member nations with above median GDP and above median GDP per capita). On a per capita basis, excess deaths this year are highest in the United States and the United Kingdom. Taken together these findings suggest the pandemic will likely increase the existing mortality rate gap between the U.S. and its peers. 

During pandemics, epidemiologists use excess deaths as a measure to put official death counts in context. Excess deaths represent the number of deaths exceeding what is expected in a typical year. Excess deaths in 2020 serves as a good proxy for the potential mortality directly or indirectly associated with the COVID-19 pandemic. 

The U.S.’s excess deaths count per 100,000 people is higher than that for comparable countries. The U.S. has the second highest excess deaths count per 100,000 people at 85.2, with the U.K having the highest at 87.4 excess deaths per 100,000 people as of August 16, 2020.

However, using more recent data from August 30, 2020, the U.S. has a higher rate of excess deaths per 100,000 at 90.1 than the U.K., which has 89.6 per capita. This data was not used in the chart above because not all countries reported data as of this week. The U.S. already had the highest overall deaths per capita over peer countries prior to COVID-19, with an additional 60 overall deaths per 100,000 people over the next closest country, Germany. Germany has 5 percent of the excess deaths per capita as the U.S. so far in 2020 at 4.2 per 100,000.  COVID-19 will therefore likely increase the mortality gap between the U.S. and peer countries. 

Source

The Pandemic’s Effect on the Widening Gap in Mortality Rate between the U.S. and Peer Countries

The latest KFF Health Tracking Poll revealed a stark contrast in opinion on two questions about the current challenge to the Affordable Care Act (ACA) facing the U.S. Supreme Court. Since it was enacted in 2010 by President Obama, the ACA, sometimes known as Obamacare, has been opposed by Republicans and favored by Democrats, but many of the benefits it provides are popular across parties. One of the most popular provisions of the law is that it protects people with pre-existing medical conditions from being denied coverage or having to pay more for coverage. A large majority of voters, across political party identification, say they do not want the Court to overturn the ACA’s protections for people with pre-existing conditions, but there are strong partisan differences on attitudes towards overturning the entire ACA. Two-thirds of Republican voters (67%) say they do not want the ACA’s protections for people with pre-existing conditions to be overturned, while three-quarters of Republican voters (77%) say they do want to see the ACA itself overturned. (more…)

A Conundrum: Majority of Republican Voters Want to Overturn ACA but Keep Protections for People with Pre-existing Conditions

Author: Audrey Kearney
Published: Nov 2, 2020

The latest KFF Health Tracking Poll revealed a stark contrast in opinion on two questions about the current challenge to the Affordable Care Act (ACA) facing the U.S. Supreme Court. Since it was enacted in 2010 by President Obama, the ACA, sometimes known as Obamacare, has been opposed by Republicans and favored by Democrats, but many of the benefits it provides are popular across parties. One of the most popular provisions of the law is that it protects people with pre-existing medical conditions from being denied coverage or having to pay more for coverage. A large majority of voters, across political party identification, say they do not want the Court to overturn the ACA’s protections for people with pre-existing conditions, but there are strong partisan differences on attitudes towards overturning the entire ACA. Two-thirds of Republican voters (67%) say they do not want the ACA’s protections for people with pre-existing conditions to be overturned, while three-quarters of Republican voters (77%) say they do want to see the ACA itself overturned. (more…)

The latest KFF Health Tracking Poll revealed a stark contrast in opinion on two questions about the current challenge to the Affordable Care Act (ACA) facing the U.S. Supreme Court. Since it was enacted in 2010 by President Obama, the ACA, sometimes known as Obamacare, has been opposed by Republicans and favored by Democrats, but many of the benefits it provides are popular across parties. One of the most popular provisions of the law is that it protects people with pre-existing medical conditions from being denied coverage or having to pay more for coverage. A large majority of voters, across political party identification, say they do not want the Court to overturn the ACA’s protections for people with pre-existing conditions, but there are strong partisan differences on attitudes towards overturning the entire ACA. Two-thirds of Republican voters (67%) say they do not want the ACA’s protections for people with pre-existing conditions to be overturned, while three-quarters of Republican voters (77%) say they do want to see the ACA itself overturned. (more…)

News Release

Wide Variations in Flu Vaccination Rates Across States Highlight Challenges as State and Local Authorities Plan to Distribute a COVID-19 Vaccine

Published: Nov 2, 2020

When a COVID-19 vaccine becomes available, all or most people living in the country will need to get vaccinated in order to maximize its benefits and provide adequate immunity nationwide.

That could present a daunting challenge for state and local health officials, as a new KFF analysis shows vaccination rates for the annual flu vaccine vary widely across states as well as by race and ethnicity, age, and other demographic characteristics.

The flu vaccine provides a good model for understanding how quickly and broadly a new vaccine could be distributed and administered across the country. For the past decade, it’s been recommended for everyone at least 6 months old and, because of the Affordable Care Act, is available free of charge to people with insurance, as well as uninsured children through the Vaccines for Children Program.

Even so, the analysis finds slightly more than half (52%) of the public received the recommended vaccine during last year’s flu season, well below the federal government’s 70% target vaccination rate. Across states, Rhode Island had the highest (61%) and Nevada the lowest (44%) vaccination rate for seasonal flu.

Other findings include:

  • In most states, Black and Hispanic people had lower flu vaccination rates compared to their White counterparts, but these differences varied across states.
  • Vaccination rates were highest for seniors and significantly lower for other adults across states. Children’s vaccination rates generally fall in the middle.
  • Across states, adults with underlying health conditions that could put them at heightened risk of severe illness from COVID-19 generally had higher flu vaccination rates than other adults.

The analysis highlights factors that may contribute to the variations in flu vaccination rates across states and could lead to similar variations for any future COVID-19 vaccine. These include lower rates of insurance coverage, particularly for people of color; the lack of dedicated vaccination programs for uninsured adults; whether and for whom states mandate vaccinations; differences in funding and public health infrastructure; and variation in levels of concern or misconceptions about vaccine safety, side effects, and efficacy.

State Variation in Seasonal Flu Vaccination: Implications for a COVID-19 Vaccine

Published: Nov 2, 2020

Issue Brief

Introduction

Once a COVID-19 vaccine has been authorized or approved by the Food and Drug Administration (FDA), states will play a central role in its distribution. While the Centers for Disease Control and Prevention (CDC) recently released guidance to state and local jurisdictions for preparing for a COVID-19 vaccine, state level engagement and success around vaccine distribution is likely to differ. Yet, to achieve sufficient levels of immunity against COVID-19, most, if not all, people in the United States will need to be vaccinated, and variation in COVID-19 vaccination rates across the country could significantly impede efforts to control the pandemic. As states consider the logistics of what will likely be an unprecedented vaccination campaign, analysis of routine vaccination rates by state may help to shed light on differential uptake across the country as well as inform where more targeted efforts might be needed. Specifically, we analyzed seasonal flu vaccination rates for the 2019-2020 flu season by state, as well as across states by age, race/ethnicity, and health risk status. Data were obtained from the CDC’s 2019-20 Influenza Season Vaccination Coverage Dashboard and are also available at KFF’s State Health Facts.

Routine annual flu vaccination has been recommended by the CDC’s Advisory Committee on Immunization Practices (ACIP) for anyone ages 6 months and older for the past decade and, because of the Affordable Care Act (ACA), is available free of charge to those with insurance, to uninsured children, through the Vaccines for Children Program, and to some uninsured adults (although to a much lesser extent). Still, national rates are well below the Healthy People 2030 target of 70% and vary by race/ethnicity and age. Looking across the states, we also find significant variation overall, and by race/ethnicity, age, and health status. In some cases, there are higher flu vaccination rates among groups that are likely to be prioritized for a COVID-19 vaccine, such as older Americans; in others, however, many states have low vaccination rates among those who have already been disproportionately impacted by COVID-19 and will be critical to reach with a vaccine, such as people of color, particularly Black Americans, who have expressed significant reluctance about getting a COVID-19 vaccine. While there are important differences between COVID-19 and seasonal flu, including that COVID-19 is much more serious and that the federal government has said it will ensure the vaccine is provided free to all even those who are uninsured, these findings point to several potential challenges to rolling out a COVID-19 vaccine across the United States.

Overall State Variation

During the 2019-2020 flu season, flu vaccination rates varied significantly by state, and all states fell below national targets. Across the U.S., 52% of the U.S. population (6 months and older) received the seasonal flu vaccine last season. Rates ranged from a low of 44% in Nevada to a high of 61% in Rhode Island. In 12 states, less than half of the population was vaccinated for the flu. In addition, all 50 states and DC fell short of the U.S.’s Healthy People 2030 goal of having at least 70% of the population receive the seasonal flu vaccine (Figure 1). There was also variation by region. Rates were highest in the Northeast (57%), followed by the Midwest (54%), the South (52%) and lastly, the West (51%) (Figure 2).


Race/Ethnicity

Achieving a high COVID-19 vaccination rate among people of color will be particularly important because they are bearing a heavy, disproportionate burden of the disease, and population immunity is not likely to be reached without high vaccination rates across all communities. Earlier KFF analysis of flu vaccination rates at the national level showed persistent gaps and racial disparities among adults, with lower rates of vaccination among Black, Hispanic, and American Indian and Alaska Native adults compared to their White counterparts. A separate analysis reported similar findings for older (65+) Black and Hispanic adults compared to White adults.

Our analysis of flu vaccination rates by state and race/ethnicity provides additional insight into such variation. Specifically, we looked at rates for all individuals ages six months or older by race/ethnicity among White, Black, and Hispanic people. Data could not be further disaggregated by race/ethnicity and age and some states could not be included due to unreliable data (Appendix 1).1 

Across racial and ethnic groups, flu vaccination rates remained below the target level in nearly all states. Only DC achieved vaccination rates above the 70% target for White people (71%); however, its rate for Black people fell well below the target at 44%. No state achieved the target vaccination level for Black or Hispanic people.

The range in vaccination rates by state was similar across racial and ethnic groups, but the overall rates for Black and Hispanic people were below that of White people. Specifically, flu vaccination rates ranged from 30% in Nevada to 60% in Nebraska for Black people and from 37% in Florida to 62% in New Hampshire for Hispanic people. For White people, the rate ranged from 45% in Idaho to 71% in DC (Figure 3).


In most states, Black and Hispanic people had lower flu vaccination rates compared to their White counterparts, but these differences varied across states. Consistent with earlier analysis showing lower rates of flu vaccination among adults, we find that Black and Hispanic people were less likely to have received the flu vaccination compared to their White counterparts (46% and 47% compared to 55%). However, these differences varied across states (Figure 4).

Black people had a lower flu vaccination rate compared to White people in 36 states, with the largest gaps in DC (44% vs. 71%), Nevada (30% vs. 47%), Maryland (49% vs. 64%), and New Jersey (45% vs. 59%). In only one state did Black people have higher vaccination rates compared to White people (Oklahoma, 58% compared to 54%).2 

Hispanic people had a lower flu vaccination rate compared to White people in 40 states. The largest gaps were in Florida (37% vs. 50%), Connecticut (54% vs. 64%), and Michigan (41% vs. 52%). Hispanic people had a higher vaccination rate compared to White people in 7 states. (Alaska, Arkansas, Louisiana, Mississippi, Montana, New Hampshire, and Wyoming).3 .


Age

In most states, flu vaccination rates were highest for seniors, followed by children, and lowest for non-elderly adults 4  (Appendix 2). As states develop COVID-19 vaccination plans, age will likely be a key factor in determining priority groups, due to the increased risk COVID-19 poses for older adults. Across states, the vaccination rate among seniors age 65 and older was 70%, ranging from 54% in Alaska to 79% in North Carolina. A total 30 states met or exceeded the 70% Healthy People 2030 goal (Figure 5).


Coverage for children, ages 6 months to 17, ranged from 52% in Mississippi to 78% in Rhode Island; 10 states and DC met or exceeded the national target rate of 70% among children. Rates were lowest among non-elderly adults, ages 18-64, ranging from 33% in Florida to 52% in Rhode Island. No state reached the 70% target for this population (Figure 6).


Health-Risk Status

Adults with comorbidities were more likely to be vaccinated for the flu, compared to those without such conditions, but rates were still well below national targets in all states. Similarly to older adults, individuals under 65 with certain underlying medical conditions are at a heightened risk of severe illness from COVID-19. As such, they are likely to be a priority group for a COVID-19 vaccine roll out. Overall, in the 2019-2020 season, non-elderly adults with certain underlying health conditions 5  were more likely to receive the seasonal flu vaccine (51%) compared to those without (40%), though still below the Healthy People 2030 target in all states (Appendix 3). Rates among adults with comorbidities varied significantly by state ranging from 38% in Florida to 61% in Connecticut and Vermont. For adults without underlying health conditions, flu vaccination rates were much lower, ranging from 31% in Nevada to 50% in Rhode Island (Figures 7 and 8)..


Discussion

Overall, we observed low rates of flu vaccination uptake across the country last season, well below national goals, and substantial variation by state and between groups. Rates were highest in the Northeast and lowest in the West. In most states, rates were highest among seniors, followed by children, and lowest among non-elderly adults. Rates were also highest in most states among White people compared to Black and Hispanic people and the lowest state rates for Black and Hispanic people were below that of White people. Rates were also higher among adults with co-morbidities, compared to those without.

There are several potential factors that may affect flu vaccination rates across states, including: lower rates of insurance coverage for some groups, particularly people of color; the lack of dedicated vaccination programs for uninsured and underinsured adults, compared to children; differential access to health care; the relatively small number of states that mandate flu vaccine; differences in funding and vaccine infrastructure by state; and variation in levels of concern or misconceptions about vaccine safety, side effects, and efficacy. While there are important distinctions between COVID-19 and seasonal flu, including that COVID-19 is much more serious, and the public’s receptivity to a COVID-19 vaccine may differ from that of the flu vaccine, these findings suggest there may be significant challenges to achieving equity in distribution and sufficient levels of immunity in the U.S. with a COVID-19 vaccine.

As states and other stakeholders plan for distribution of a COVID-19 vaccine, targeting those states that already have disproportionately lower coverage rates for routine vaccination, particularly for populations most affected by COVID-19 and who appear to face greater barriers to vaccination, may provide an important avenue for increasing success. It will be important for vaccination efforts to address a range of barriers, including potential barriers to access and cost concerns, particularly among those who are uninsured. It also will be important to address concerns about safety and potential side effects of the vaccine, particularly among Black Americans. The recently released KFF/The Undefeated Survey found that just 17% of Black Americans say they would definitely get a COVID-19 vaccine if it was determined safe and available for free, compared to 37% of White Americans, largely due to safety concerns or distrust of the health care system.

Appendix

Endnotes

  1. States with data values with confidence interval half-widths greater than 12 were considered unreliable and excluded from analysis. This resulted in suppressed values for 14 states for rates among Black people and 4 states for rates among Hispanic people. ↩︎
  2. States with data values with confidence interval half-widths greater than 12 were considered unreliable and excluded from analysis. This resulted in suppressed values for 14 states for rates among Black people and 4 states for rates among Hispanic people. ↩︎
  3. States with data values with confidence interval half-widths greater than 12 were considered unreliable and excluded from analysis. This resulted in suppressed values for 14 states for rates among Black people and 4 states for rates among Hispanic people. ↩︎
  4. Non-elderly adults are defined as adults between the ages 18 and 64 years.   ↩︎
  5. Underlying health conditions include asthma, diabetes, heart disease, chronic obstructive pulmonary disease, and cancers other than skin cancer. https://www.cdc.gov/flu/fluvaxview/reportshtml/reporti1920/reportii/index.html ↩︎

This Week in Coronavirus: October 23 to October 29

Published: Oct 30, 2020

Here’s our recap of the past week in the coronavirus pandemic from our tracking, policy analysis, polling, and journalism.

The U.S. added over a half million cases and about 5,600 deaths this week.

Issues related to voting during the coronavirus pandemic have been a story during the primaries and now the general election season. KHN published stories this week on how people who are hospitalized can still vote in many parts of the country and efforts in North Carolina to help long-term care facility residents vote.

Also released this week is an analysis showing nursing homes with a relatively high share of Black or Hispanic residents are more likely to have had a resident die of COVID-19 than homes with lower shares of such residents, adding to studies and stories throughout the year showing communities of color have been disproportionately affected by the pandemic.

Here are the latest coronavirus stats from KFF’s tracking resources:

Global Cases and Deaths: Total cases worldwide are approximately 45 million this week – with an increase of over 3.3 million new confirmed cases in the past seven days. There were almost 44,000 new confirmed deaths worldwide and the total for confirmed deaths is nearing 1.2 million.

U.S. Cases and Deaths: Total confirmed cases in the U.S. is on the verge of reaching 9 million this week. There was an increase of roughly 536,100 confirmed cases between October 22 and October 29. Approximately 5,600 confirmed deaths in the past week brought the total in the United States to approximately 228,700.

Race/Ethnicity Data: Black individuals made up a higher share of cases/deaths compared to their share of the population in 40 of 50 states reporting cases and 33 of 48 states reporting deaths. In 10 states (MI, MO, PA, WI, KS, MN, RI, NH, ME and VT) the share of COVID-19 related deaths among Black people was at least two times higher than their share of the total population. Hispanic individuals made up a higher share of cases compared to their share of the total population in 44 of 46 states reporting cases. In 5 states (NH, NC, OR, PA, and WA), Hispanic peoples’ share of cases was more than 3 times their share of the population. COVID-19 continues to have a sharp, disproportionate impact on American Indian/Alaska Native as well as Asian people in some states.

State Social Distancing Actions (includes Washington D.C.) that went into effect this week:

Extensions: CT, FL, GA, MA, NJ, OK, RI, SC

New Restrictions: HI, ID, IL

Face Mask Requirement: MS

The latest KFF COVID-19 resources:

  • Racial and Ethnic Disparities in COVID-19 Cases and Deaths in Nursing Homes (News Release, Issue Brief)
  • Trump, Health Advisers Split On COVID-19 Response; VP Pence Absent From Pandemic Planning Calls For Over 1 Month (KFF Daily Global Health Policy Report)
  • COVID-19 Coronavirus Tracker – Updated as of October 29 (Interactive)
  • State Data and Policy Actions to Address Coronavirus (Interactive)
  • Medicaid Emergency Authority Tracker: Approved State Actions to Address COVID-19 (Issue Brief)

The latest KHN COVID-19 stories:

  • Scientists Warn Americans Are Expecting Too Much From a Vaccine (KHN, NBC News)
  • For Each Critically Ill COVID Patient, a Family Is Suffering, Too (KHN, Washington Post)
  • Telemedicine or In-Person Visit? Pros and Cons (KHN, US News)
  • COVID Spikes Exacerbate Health Worker Shortages in Rocky Mountains, Great Plains (KHN, Billings Gazette)
  • Verily’s COVID Testing Program Halted in San Francisco and Oakland (KHN, LA Times)
  • Lost on the Frontline: Explore the Database (KHN, The Guardian)
  • Readers and Tweeters Shed Light on Vaccine Trials and Bias in Health Care (KHN)
  • Hospital Bills for Uninsured COVID Patients Are Covered, but No One Tells Them (KHN, NPR)
  • Democrats Link GOP Challengers to Trump’s COVID Record, Efforts to Undo Obamacare (KHN)
  • Why State Mask Stockpiling Orders Are Hurting Nursing Homes, Small Providers (KHN, NBC News)
  • KHN’s ‘What the Health?’: As Cases Spike, White House Declares Pandemic Over (KHN)
  • Despite COVID Concerns, Teams Venture Into Nursing Homes to Get Out the Vote (KHN, Charlotte News & Observer)