Factors Associated With COVID-19 Cases and Deaths in Long-Term Care Facilities: Findings from a Literature Review
Issue Brief
Executive Summary
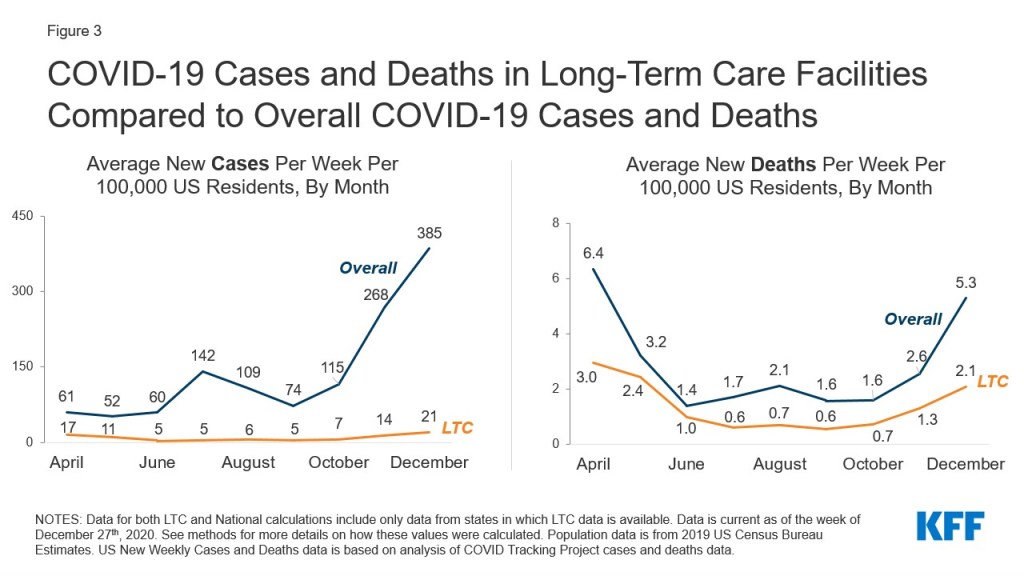
The COVID-19 pandemic has disproportionately affected residents and staff in nursing homes and other long-term care facilities (LTCFs). While this group is in the top priority group for vaccine distribution in all states, some may remain at risk as the pandemic continues to spread across the country, particularly LTCF staff for whom vaccination rates have been low. In addition, the pandemic may have exposed vulnerabilities in LTCFs that can inform future efforts to address infectious disease outbreaks.
This brief summarizes the findings of 30 studies between April 2020 and January 2021 that examined potential factors associated with COVID-19 cases and/or deaths in LTCFs. Key takeaways include:
- The prevalence of COVID-19 cases in the community is consistently associated with COVID-19 cases and/or deaths in long-term care facilities.
- Staff infections appear to be a link between cases in the community and long-term care facilities, although it is unclear if the staff infections were the result of community spread or pre-existing cases in LTCFs.
- Long-term care facilities that are for-profit or have higher shares of residents who are people of color (or are located in communities with a large share of people from communities of color) were more likely to have COVID-19 cases and deaths. Urban location and large bed size are also associated with cases and deaths, which may reflect other factors such as community spread or association between bed side and case count.
- Among studies that examine the association between CMS overall quality ratings and infection control deficiencies in nursing facilities, most find no clear association with COVID-19 cases or deaths, but a small number of studies do.
- Nursing homes with higher staffing levels, including those with higher CMS 5-star quality ratings for staffing are associated with fewer cases or deaths in the facility.
It should be noted that many of these studies were conducted in real time, as the pandemic was gaining force and shifting geographically; it is possible that results from studies conducted in the earlier months may not reflect changes that have occurred over the course of the year. Further, we did not identify research that examines the role of PPE shortages, staff shortages, or state or facility policy on cases or deaths in LTCFs. While a successful vaccination effort should mitigate the future risk of serious illness and deaths due to COVID-19, this analysis identifies factors that may make residents and staff of nursing homes and other LTCFs vulnerable if sufficient numbers are not vaccinated, or if they are exposed to other highly contagious and dangerous infections in the future.
Introduction
The COVID-19 pandemic has disproportionately affected residents and staff in nursing homes and other long-term care facilities (LTCFs), accounting for 6% of all cases and 38% of all COVID-19 deaths nationwide. In response, the Centers for Disease Control (CDC) recommended that LTCFs have the highest priority when it comes to vaccinations. Since the initial high-profile outbreak of the virus at the Life Care Center of Kirkland, Washington, many facilities have implemented measures to contain the spread of coronavirus in LTCFs, including universal testing, widespread use of personal protective equipment (PPE), and visitor restrictions. The federal government also responded to pandemic by refocusing early routine nursing home inspections on infection control and convening a panel of experts to provide evidence-based recommendations on how to address the pandemic in nursing homes (Coronavirus Commission for Safety and Quality in Nursing Homes). Additionally, federal legislation allocated some funds to help cover the expense of PPE and testing.
Despite these measures, deaths and infections among long-term care facility residents and staff have continued to increase throughout the pandemic, largely following the national trend, underscoring the need to better understand factors that are associated with increased COVID-19 cases and deaths in LTCFs. Early data also suggests that initial vaccine distribution has been slower than anticipated, and that staff vaccination rates are relatively low due to concerns about vaccine safety, which could lead to the continued spread of the virus in LTCFs. According to a recent survey conducted by KFF, nearly three in ten (29%) people who work in health care settings said they would definitely or probably not get vaccinated. Additionally, 35% of Black adults (a group that has borne a disproportionate burden of the pandemic and makes up over a quarter of the long-term care work force) say they definitely or probably would not get vaccinated. This review of studies informs ongoing efforts to limit preventable infections and deaths in long-term care settings, and may help to identify characteristics of facilities most at risk that could be prioritized for vaccine distribution, staff education and oversight.
This issue brief summarizes the findings of 30 studies that have examined potential factors associated with COVID-19 cases and/or deaths in LTCFs. We group those factors into categories of community spread, including staff-to-patient transmission and patient transfers; facility quality and infection control; staffing levels; and other facility-level characteristics, such as ownership, location, payer mix, and the racial/ethnic composition of residents. An overview of the methods used in identifying studies included is provided in the Methods box at the end of the brief.
Key Findings
Community Spread
The prevalence of COVID-19 in the community is consistently associated with COVID-19 cases and/or deaths in long-term care facilities. In total, all nine studies that looked at community transmission found an association between community (typically county) case rates and likelihood or severity of outbreaks or deaths in LTCFs. All studies found that communities with high coronavirus case rates had more cases and deaths in its long-term care facilities than communities with low case rates. These studies used data from time periods ranging from early in the pandemic (end of May) to mid-September 2020, but most were using data from late Spring through Summer 2020. Only two used national or 50-state data1 ,2 while four studies used state-reported data for a subset of states3 ,4 ,5 ,6 , and three used other samples or a single state.7 ,8 ,9 Only one of these studies adjusted for the possible endogeneity between community cases and LTCF cases (that is, high cases or deaths in LTCFs contributing to high COVID-19 rates within the county), though it still found a significant relationship between community rates and cases and deaths in LTCFs.10
Some studies identify staff infections as a likely link between community cases and cases in long-term care facilities. Three studies explicitly looked at the role of staff in LTCF outbreaks, and all found a relationship between community spread, staff infections, and resident infections. In a NY state report from summer 2020, researchers found that staff infections correlated with the timing of peak nursing home resident mortality across the state and were typically centralized in communities with high case rates.11 Another analysis using geolocation data from 50 million smartphones and data from 22 states found that overlapping staff networks between nursing homes were significantly associated with coronavirus infections.12 The third study, using data from one large academic LTCF, found that facilities with a high burden of disease were more likely to have staff members that lived in communities with high rates of COVID-19 infection.13 It is unclear from existing research whether these findings are generalizable nationwide or whether staff infections themselves were a result of community transmission or pre-existing cases within the facility.
The evidence is mixed on the effect of patient transfers on COVID-19 cases and deaths in long-term care facilities. Following reports in the media about transfers from hospitals and other health care settings leading to new infections in LTCFs, three state-based analyses (from New York, Michigan, and Maryland) examined the potential role of patient transfers to other health care facilities in COVID-19 outbreaks in LTCFs. Neither the New York nor Michigan state report found a consistent relationship between hospital transfers and increased COVID-19 case load or deaths among nursing home residents, though both relied on descriptive analysis of timing and number of cases.14 ,15 In contrast, a third study from Maryland found that nursing home residents that were transferred to receive dialysis treatment were more likely to contract the virus than those who were not transferred.16 The generalizability of findings from the three state-based studies may not be generalizable nationwide. In addition, we did not identify research evaluating outcomes of residents that were transferred within long-term care facilities.
Quality and Infection Control
Among the twelve studies that analyzed whether lower quality ratings under the CMS 5-Star Quality Rating System were associated with COVID-19 cases or deaths, the evidence is mixed: eight studies found that overall quality ratings were not associated with the likelihood of a COVID-19 cases and deaths while four states identified a link between quality ratings and cases or deaths. The CMS star-rating system is one of the most cited measures of nursing home quality and accounts for a nursing home’s performance in the following domains: health inspection ratings, quality measure ratings, and staffing ratings. Early in the pandemic, there was speculation that nursing home quality was associated with virus outbreaks. This theory gained additional traction when early analysis by CMS found that nursing homes with a one-star quality star rating were more likely to have more COVID-19 cases than facilities with a five-star quality rating. Since that report, 12 studies have investigated star ratings and COVID-19 among skilled nursing facilities, using data from time periods ranging from early in the pandemic (end of May) to the summer (June-July). Only one study used national or 50-state data, while five studies used state-reported data for a subset of states and six used single state data.
Among these 12 studies, eight studies, including 1 national study, 5 studies based on a subset of states, and 2 single-state studies, found that CMS overall quality ratings were not associated with the likelihood of having a reported COVID-19 case,17 ,18 the number of COVID-19 cases,19 ,20 ,21 ,22 ,23 or mortality rates 24 . Among the remaining four studies, which were all based on single-state data, all found some link between overall star rating and either likelihood of having COVID-19 cases or deaths25 ,26 or severity of outbreaks among facilities with cases.27 ,28 Additional studies have examined star ratings on staffing and COVID-19 and found significant associations between those ratings and cases or deaths, as summarized in the staffing section below.
Most of the limited number of studies that examine nursing home infection control and COVID-19 find no association between nursing home infection control deficiencies and COVID-19 cases and deaths. Recent analysis by the Government Accountability Office found that most nursing homes had infection control deficiencies even prior to the COVID-19 pandemic. During the pandemic, facilities, states, and the federal government have undertaken several measures to strengthen infection control practices in nursing homes, including through CMS’ National Training Program.
Four out of five studies that have evaluated whether infection control practices or deficiencies, separately from overall health deficiencies and/or CMS overall star rating, are associated with COVID-19 outcomes in nursing homes, found no association with COVID-19 burden. Among the four studies that found no association, one study used national data and found no relationship between the number of deficiencies related to infection control and COVID-19 outbreak,29 two used data from a subset of states and found no association between prior infection violations and probability of having at least one COVID-19 case,30 ,31 and one implemented the same infection control procedures across all long-term care facility units in a single long-term care facility in Boston but still found that the prevalence of COVID-19 cases and deaths varied widely.32 In contrast, one of the five studies found that 91% of nursing homes that reported at least one COVID-19 case had a prior infection control violation compared to 81% of nursing homes without any reported cases.33 Other studies looked at broader measures of deficiencies not limited to infection control and found that nursing homes with higher health rates of deficiencies were more likely to report at least COVID-1934 ,35 but nursing homes that received a fine for deficiencies had lower case rates than those that did not.36
Staffing Levels
Findings suggest that higher staffing levels may play a protective role in containing COVID-19 cases and deaths in nursing homes, particularly in containing outbreaks once they enter the facility, though some research finds a link between LPN hours and cases or deaths. Prior to the pandemic, research suggested that majority of nursing homes did not have adequate staffing levels, raising questions as to whether lower staffing levels are linked to COVID-19 cases and deaths in LTCFs. Seven studies examined the relationship between staffing levels and COVID-19 outcomes in nursing homes, with some variation in conclusions:
- Quality ratings on staffing: Four studies examined whether nursing homes’ star rating on nurse staffing were associated with COVID-19 cases or deaths, including one that used national data, one that used data from a subset of states, and two that used data from a single state. Three of the four studies found that nursing homes with high quality ratings on nurse staffing were less likely to have more than 30 COVID-19 cases or deaths (controlling for bed size and other factors),37 had fewer cases and deaths per bed,38 and lower probability of having a resident with COVID-19.39 However, the remaining study, based on national data, did not find a statistically significant association between lower staffing ratings and COVID-19 cases.
- Nursing and aide hours: Five studies examined whether staffing levels, separate from staffing quality ratings, are associated with COVID-19 cases and/or deaths, including two national studies and three state- based analyses. Three studies found an association between higher staffing and fewer cases, deaths, and/or lower likelihood of experiencing an outbreak. Specifically, the first study, based on national data, found that while nursing homes with a higher number of registered nurse (RN) hours per resident per day were more likely to experience at least one COVID-19 case, higher nurse aide hours and total nursing hours were associated with fewer deaths and lower likelihood of an outbreak among facilities with at least one COVID-19 case.40 The second study, also based on national data, found that higher total staffing was associated with no COVID-19 cases.41 The third study based on California data, found that early in the pandemic, nursing homes with lower total nurse staffing (RN, LVN, and CNA) had higher case rates, but as the pandemic progressed to August, nursing homes with higher RN staffing had lower case rates.42 Of note, these three studies included both staff and resident cases in their analyses, with two studies finding that county-level rates of COVID-19 were associated with COVID-19 transmission in nursing homes.43 ,44
- The remaining two studies, based on single-state data of cases among residents only, found either an inverse relationship between staffing and cases, where low RN hours per resident were associated with higher odds of a nursing home having COVID-19 cases,45 or found no association between RN staffing and likelihood of having one or more COVID-19 cases or deaths but rather, among facilities with at least one case or death, an increase in RN staffing was associated with fewer cases and deaths.46
- Additionally, among the five studies, two national studies examined the role of licensed practical nurses (LPNs) and found a positive association between LPN hours and COVID-19 cases and/or deaths. The first study found that low LPN hours were associated with fewer deaths but not the probability of an outbreak,47 and the second study found that higher LPN staffing rates were associated with more COVID-19 cases, a difference that could be partially attributed to the fact that LPNs, unlike RNs, tend to interact with more residents while completing tasks such as wound care or dressing changes.48
Additional research has examined factors associated with staffing shortages during the pandemic and found that shortages are associated with factors that are also associated with COVID-19 cases and deaths. Data from the federal government shows that approximately one in five nursing homes have reported a staffing shortage at some point in time during the pandemic. However, we were unable to identify analyses that examined whether and to what extent these shortages contributed to outbreaks or severity of outbreaks in LTCFs.49 Not surprisingly, staffing shortages as an outcome measure in research are linked to the same factors associated with cases and deaths, such as community spread, since shortages are logically related to COVID-19 outbreaks among staff.
Five studies evaluated the most likely factors associated with staffing shortages in nursing homes during the pandemic, finding that higher COVID-19 cases in the surrounding community or within the facility,50 ,51 ,52 lower CMS star rating,53 ,54 ,55 government ownership,56 ,57 and a higher share of residents covered by Medicaid58 ,59 were associated with staff shortages. One study found that high concentrations of Black residents and facility location in a less urban county were associated with reported staffing shortages.60 One study identified several factors associated with a lower likelihood of reporting a staffing shortage, including having at least a one week supply of PPE, higher occupancy rates, or a higher share of Medicare residents.61 Again, it is unclear from existing research if these staffing shortages in turn contribute to higher COVID-19 cases or deaths.
Other Facility-Level Characteristics
Long-term care facilities that are for-profit, have a higher share of residents who are people of color, located in urban areas, and have more beds are more likely to have COVID-19 cases and deaths. Seventeen studies analyzed a range of facility-level characteristics associated with COVID-19 cases and/or deaths in long-term care facilities, including characteristics such as location, facility size (as measured by number of beds), share of residents with Medicaid as their primary payer, racial composition of residents, ownership, and labor union presence.62 ,63 ,64 ,65 ,66 ,67 ,68 ,69 ,70 ,71 ,72 ,73 ,74 ,75 ,76 ,77 ,78 These studies used data from various time periods, including eleven studies with data collected early in the pandemic (end of May), four studies as of June and July, and one study as of October. One study collected data from two time periods: May and August 2020. Among these seventeen studies, only four studies used national or 50-state data, while seven studies used state-reported data for a subset of states and six used single state data.
- For-profit nursing facilities are at higher risk for COVID-19 cases and deaths, while nursing facilities with labor unions are less likely to have COVID-19 deaths: Six studies evaluated whether for-profit versus non-profit status was associated with COVID-19 outcomes.79 ,80 ,81 ,82 ,83 ,84 Three studies collected data as of early in the pandemic (end of May), two studies had study collection periods during the summer, and one study used data from both May and August. Four studies obtained data from a subset of states whereas two studies obtained data from single states. All six studies found that for-profit nursing homes were associated with higher COVID-19 case and/or death counts..One study that focused more specifically on private-equity owned nursing homes, using national data from early summer, found that private equity-owned nursing homes did not have higher COVID-19 case rates or death rates than non-profit or for-profit nursing homes, though they did have higher case rates than government-owned facilities.85 Two examined chain status, with mixed results: a Connecticut study found that nursing facilities that were part of a chain were more likely to have at least one COVID-19 case, while the second study, based on a subset of states, found that non-chain status was associated with the likelihood of having at least one COVID-19 case.86 , 87 .One study using data as of May found that nursing facilities in New York with labor unions were associated with lower COVID-19 death rates compared to facilities without these unions.88
- Long-term care facilities with higher shares of residents who are people of color are more likely to experience COVID-19 cases and/or deaths: Ten studies examined racial/ethnic composition of LTCF residents as potential factors associated with COVID-19 cases and/or deaths. Among these 10 studies, nine studies found that LTCFs with higher shares of people of color, especially Black or Hispanic residents, were more likely to have a greater likelihood of having at least one COVID-19 case89 , 90 ,91 or at least one COVID-19 death,92 a higher number of new COVID-19 cases and deaths,93 a higher number of cases,94 ,95 higher case rates,96 and higher case and death counts.97 The remaining study found that the concentration of residents who are people of color was not associated with the likelihood of having one or more COVID-19 case or deaths in the facility; however, among facilities with at least one case, nursing homes with a greater share of people of color had higher counts of COVID-19 cases.98 One study examined whether the concentration of African-Americans at the county-level was associated with cases in nursing homes.99 This study found that county-level population of African-Americans was associated with COVID-19 cases in nursing homes.
- Urban location may be associated with cases in long-term care facilities: Two studies examined the role of location using data collected in May from a subset of states.100 ,101 Both studies found that nursing facilities located in urban locations were associated with an increased probability of having at least one COVID-19 case or a higher likelihood of more COVID-19 cases. As the pandemic has spread across the country and affected more rural areas, it is possible that distinctions in location are no longer associated with LTCF outbreaks.
- Facilities with more beds and higher occupancy rates are more likely to have COVID-19 cases and/or deaths: Nine studies evaluated the relationship between COVID-19 burden and the size of long-term care facilities, as measured by the number of beds, among a subset of states or from single states using data ranging from early in the pandemic (end of May) to August.102 ,103 ,104 ,105 ,106 ,107 ,108 ,109 ,110 These nine studies found that long-term care facilities with more beds were associated with increased probability of having at least one COVID-19 case 111 ,112 higher case counts,113 higher mortality rates,114 higher case and death counts, 115 ,116 ,117 and severity of outbreak.118 Two additional studies also found that LTCFs with higher occupancy rates were associated with increased likelihood of experiencing at least one COVID-19 case but not necessarily a higher count of cases,119 and a higher count of COVID-19 cases and deaths.120 The relationship between COVID-19 cases and facility size likely reflects the fact that larger facilities accept more residents and have more staff, potentially increasing the risk of community spread through movements of residents and staff to and from the facility.
- There is some association between the share of residents covered by Medicaid as a primary payer and COVID-19 burden: Five studies evaluated whether nursing homes with a greater share of residents for whom Medicaid was primary payer had more COVID-19 cases and deaths, with mixed results.121 ,122 ,123 ,124 ,125 Two studies, one multi-state study using data from Spring 2020 and one based on Spring 2020 data from Connecticut, found that facilities with a relatively high share of residents covered by Medicaid did not have higher likelihood of one or more cases or deaths; however, the Connecticut-based study found that among facilities with at least one case, nursing homes with relatively high share of Medicaid-insured residents had more COVID-19 cases (controlling for other facility characteristics including size and resident race/ethnicity). Two multi-state studies found that facilities with a higher share of residents on Medicaid were associated with more COVID-19 cases or deaths. Additionally, one study found that facilities that reported at least one COVID-19 case had a greater share of Medicaid-insured residents than facilities that did not report any cases.
- Few studies have examined the association between COVID-19 cases and deaths and facility-level characteristics in Assisted Living Facilities separately from nursing facilities: One study, using data from a subset of seven states, examined the association between assisted living characteristics and COVID-19 cases and deaths in the facility. Consistent with other studies on nursing homes, this study found that assisted living facilities with a high share of residents who are people of color have high case rates. Additionally, this study found that larger ALFs are more likely to experience at least one COVID-19 case. We were unable to find other studies that analyzed the relationship between assisted living characteristics and COVID-19 outcomes.
Discussion
The coronavirus pandemic has had an outsized impact on older adults generally and long-term care facility residents and staff more specifically, prompting a wave of studies that have looked at factors associated with COVID-19 cases and deaths. Our analysis of the studies published 9 months into the pandemic finds that community transmission was found to be consistently associated with cases and deaths. In addition, the data indicate that certain facility characteristics are associated with COVID-19 cases and deaths, including having a relatively large share of Black or Hispanic residents, for-profit status, a relatively large number of beds, and being located in urban areas. There also appears to be evidence that nursing homes with higher staffing levels, including higher CMS 5-star quality ratings for staffing, have a lower likelihood of cases or deaths.
However, there are other areas where the evidence so far is less clear. Studies have mixed results on the relationship between overall nursing home quality ratings and COVID-19 cases and deaths. Results are also less clear on important questions of transmission patterns, such as whether patient transfers contribute to the spread of the virus. In addition, we could find no studies that look at whether shortages of PPE, testing and staff are associated with cases or deaths, nor whether certain practices (e.g., setting up separate COVID-19 facilities) or policies (e.g., relaxing or restricting visitation) directly affected the spread of infection across LTCFs. Further, we were able to identify only one pertaining to assisted living, group homes, and other residential facilities, separate from nursing facility studies, which are home to nearly one million people who are unable to live independently.
While the pandemic took hold in March of 2020, nursing facilities were not required to begin reporting coronavirus cases and deaths to the federal government until May 8, 2020, which means that many of the studies were limited to state-reported data, if available, or missing the early months when nursing homes in some states were hit hard by infections. Even with the federal reporting requirements imposed by CMS, there are gaps in data that would help further pinpoint which residents, staff and facilities were most at risk. For example, current requirements do not include cases or deaths from long-term care facilities that are not certified by Medicare or Medicaid, which excludes virtually all assisted living and residential care facilities. Further, nursing facilities are not required to report the race or ethnicity, age, or comorbidities of the staff and residents who have become seriously ill or died due to COVID-19.
As the new Administration takes the helm in managing the pandemic and putting in place safeguards to protect residents and staff from future outbreaks, this analysis informs efforts that may be used to help strengthen safety and quality protections in long-term care settings and inform efforts to maximize resident and staff vaccinations.
Methods
This literature review summarizes findings from 30 studies published through January 2021 that examine factors associated with COVID-19 cases and deaths in long-term care facilities. It includes analyses and reports published by government, research, and policy organizations using data from April 2020 or later. We also included certain studies done by media organizations (The New York Times and Kaiser Health News) that include original data analysis on this topic. Most studies included in this literature review are journal articles from peer-reviewed journals, but we also included studies published by independent policy and research groups as well as government reports. We excluded reports from advocacy or industry groups.
The key outcome of interest was COVID-19 cases and deaths. We were unable to find studies that examined the effects of PPE, testing, and staffing shortages on the outcomes of interest, but incorporated the studies that examined factors associated with staffing shortages because they were factors also associated with COVID-19 cases and deaths. We included studies that looked at LTCFs specifically but did not limit our inclusion criteria to only nursing homes or other type; that said, the vast majority of studies we identified were for nursing facility settings.
To collect relevant studies, we conducted keyword searches of PubMed and Google Scholar, as well as websites of long-term care policy-specific journals. We also identified studies using a snowball technique based on bibliographies of previously pulled studies. While we tried to be as comprehensive as possible in our inclusion of studies and findings that meet our criteria, it is possible that we missed some relevant studies or findings. For each study, we read the final publication and summarized the data sources, methods, and findings. We broke findings out into key factors of interest – community spread, quality/infection control, staffing levels, and other facility characteristics. Studies may be cited in multiple of these categories or in multiple places within a category. The Appendix Table at the end of the brief provides a list of citations for each of the included studies, grouped by the four categories of findings.
Appendix
| Appendix Table 1: Factors Associated With COVID-19 Cases and Deaths in Long-Term Care Facilities: A Literature Review | ||||
| Study | Measure | |||
| Community Spread | Quality and Infection Control | Staffing Levels and Staffing Shortages | Other Facility-Level Characteristics | |
| Adam Dean, Atheendar Venkataramani, and Simeon Kimmel, “Mortality Rates From COVID-19 Are Lower In Unionized Nursing Homes,” Health Affairs, 39 no.11 (September 2020): https://doi.org/10.1377/hlthaff.2020.01011 | X | X | ||
| Benjamin F. Bigelow, Olive Tang, Gregory R. Toci, et al., “Transmission of SARS-CoV-2 Involving Residents Receiving Dialysis in a Nursing Home — Maryland, April 2020”, MMWR Morb Mortal Wkly Rep 2020;69:1089–1094, http://dx.doi.org/10.15585/mmwr.mm6932e4 | X | |||
| Brian E. McGarry, David C. Grabowski, and Michael L. Barnett, “Severe Staffing And Personal Protective Equipment Shortages Faced By Nursing Homes During The COVID-19 Pandemic” Health Affairs 39, 10 (August 2020), https://doi.org/10.1377/hlthaff.2020.01269 | X | |||
| Bruce Spurlock, Alex Stack, Charlene Harrington, COVID-19 in California’s Nursing Homes: Factors Associated with Cases and Deaths (California Health Care Foundation, December 2020), https://www.chcf.org/publication/covid-19-californias-nursing-homes-factors-cases-deaths/#recommendations | X | X | ||
| Center for Health and Research Transformation, Keeping nursing home residents safe and advancing health in light of COVID-19 (Center for Health and Research Transformation, (September 2020), https://chrt.org/wp-content/uploads/2020/09/KeepingNursingHomeResidentsSafeSummaryReport9-8-2020.pdf | X | |||
| Charlene Harrington, Leslie Ross, Susan Chapman, et al., “Nurse Staffing and Coronavirus Infections in California Nursing Homes.” Policy, Politics, & Nursing Practice 21, no. 3 (August 2020): 174–86, https://doi.org/10.1177%2F1527154420938707 | X | X | X | |
| Craig S. Richmond, Arick P. Sabin, Dean A. Jobe, et al., “SARS-CoV-2 sequencing reveals rapid transmission from college student clusters resulting in morbidity and deaths in vulnerable populations” MedRxiv (October 2020), https://doi.org/10.1101/2020.10.12.20210294 | X | |||
| David P. Bui, Isaac See, Elisabeth M. Hesse et al., “Association Between CMS Quality Ratings and COVID-19 Outbreaks in Nursing Homes – West Virginia, March 17-June 11, 2020,” MMWR Morb Mortal Wkly Rep, 69 no. 37 (September 2020): 1300–1304. https://doi.org/10.15585/mmwr.mm6937a5 | X | X | ||
| Diane Gibson and Jessica Greene, “State Actions and Shortages of PPE and Staff in U.S Nursing Homes” Journal of the American Geriatrics Society (October 2020), https://doi.org/10.1111/jgs.16883 | X | |||
| Elizabeth M. White, Cyrus M. Kosar, Richard A.Feifer, et al., “Variation in SARS‐CoV‐2 Prevalence in U.S. Skilled Nursing Facilities,” Journal of the American Geriatrics Society 68, no 10 (October 2020): 2167-2173, https://doi.org/10.1111/jgs.16752 | X | X | X | |
| Hannah R. Abrams, Lacey Loomer, Ashvin Gandhi, et al., “Characteristics of U.S. Nursing Homes with COVID‐19 Cases,” Journal of the American Geriatrics Society 68, no 8 (August 2020): 1653-1656, https://doi.org/10.1111/jgs.16661 | X | X | ||
| Helena Temkin-Greener, Wenhan Guo, Yunjiao Mao, et al., “COVID‐19 Pandemic in Assisted Living Communities: Results from Seven States,” Journal of the American Geriatrics Society 68, no 12 (December 2020): 2727-2734, https://doi.org/10.1111/jgs.16850 | X | X | ||
| Huiwen Xu, Orna Intrator, and John R. Bowblis, “Shortages of Staff in Nursing Homes During the COVID-19 Pandemic: What are the Driving Factors?” Journal of the American Medical Directors 21, 10 (October 2020): 1371-1377, https://doi.org/10.1016/j.jamda.2020.08.002 | X | |||
| Jordan Rau and Anna Almendrala, “COVID-Plagued California Nursing Homes Often Had Problems in Past,” Kaiser Health News (May 2020), https://kffhealthnews.org/news/covid-plagued-california-nursing-homes-often-had-problems-in-past/ | X | |||
| Jose F. Figueroa, Rishi K. Wadhera, Irene Papanicolas, et al., “Association of Nursing Home Ratings on Health Inspections, Quality of Care, and Nurse Staffing With COVID-19 Cases,” JAMA 324, no 11 (August 2020): 1103-1105, doi:10.1001/jama.2020.14709 | X | X | ||
| M Keith Chen, Judith A. Chevalier, and Elisa F. Long, “Nursing Home Staff Networks and COVID-19”, National Bureau of Economic Research Working Paper Series No. 27608 (July 2020), https://www.nber.org/papers/w27608 | X | X | X | |
| Margaret M. Sugg, Trent J. Spaulding, Sandi J. Lane, et al., “Mapping community-level determinants of COVID-19 transmission in nursing homes: A multi-scale approach,” Science of the Total Environment 752, no. 15 (January 2021):141946, https://doi.org/10.1016/j.scitotenv.2020.141946 | X | |||
| Mark Aaron Unruh, Hyunkyung Yun, Yongkang Zhang, et al., “ Nursing Home Characteristics Associated With COVID-19 Deaths in Connecticut, New Jersey, and New York,” Journal of the American Medical Directors Association, 21 no. 7 (July 2020): 1001–1003, https://doi.org/10.1016/j.jamda.2020.06.019 | X | |||
| Mengying He, Yumeng Li, and Fang Fang, “Is There a Link between Nursing Home Reported Quality and COVID-19 Cases? Evidence from California Skilled Nursing Facilities,” Journal of the American Medical Directors Association 21, no. 7 (July 2020): 905–908, https://doi.org/10.1016/j.jamda.2020.06.016 | X | X | ||
| New York State Department of Health, Factors Associated with Nursing Home Infections and Fatalities in New York State During the COVID-19 Global Health Crisis ( New York, NY: New York State Department of Health, July 2020), https://www.health.ny.gov/press/releases/2020/docs/nhfactorsreport.pdf | X | X | ||
| Patricia Rowan, Reena Gupta, Rebecca Lester, et al., A Study of the COVID-19 Outbreak and Response in Connecticut Long-Term Care Facilities ( Princeton, NJ: Mathematica, Inc., September 2020), https://www.mathematica.org/our-publications-and-findings/publications/fr-a-study-of-the-covid-19-outbreak-and-response-in-connecticut-long-term-care-facilities | X | |||
| Paul Chatterjee, Sheila Kelly, Mingyu Qi, et al., “Characteristics and Quality of US Nursing Homes Reporting Cases of Coronavirus Disease 2019 (COVID-19),” JAMA Network Open 3, no 7 (July 2020): e2016930, doi:10.1001/jamanetworkopen.2020.16930 | X | X | X | |
| Priya Chidambaram, Rising Cases in Long-term Care Facilities Are Cause for Concern (Washington, DC: Kaiser Family Foundation, July 2020), https://www.kff.org/coronavirus-covid-19/issue-brief/rising-cases-in-long-term-care-facilities-are-cause-for-concern/ | X | |||
| Priya Chidambaram, Tricia Neuman, and Rachel Garfield, Racial and Ethnic Disparities in COVID-19 Cases and Deaths in Nursing Homes (Washington, DC: Kaiser Family Foundation, October 2020), https://www.kff.org/coronavirus-covid-19/issue-brief/racial-and-ethnic-disparities-in-covid-19-cases-and-deaths-in-nursing-homes/ | X | |||
| Rebecca Gorges and R. Tamara Konetzka, “Staffing Levels and COVID-19 Cases and Outbreaks in U.S Nursing Homes,” Journal of the American Geriatrics Society 68 no. 11 (August 2020): 2462-2466, https://doi.org/10.1111/jgs.16787 | X | X | ||
| Robert Tyler Braun, Hyunkyung Yun, Lawrence P. Casalino et al., “Comparative Performance of Private Equity–Owned US Nursing Homes During the COVID-19 Pandemic,” JAMA Network Open 3, no 10 (October 2020): e2026702, doi:10.1001/jamanetworkopen.2020.26702 | X | X | ||
| Sandra M. Shi, Innokentiy Bakaev, Helen Chen, et al., “Risk Factors, Presentation, and Course of Coronavirus Disease 2019 in a Large, Academic Long-Term Care Facility”, JAMDA, 21 (August 2020), https://doi.org/10.1016/j.jamda.2020.08.027 | X | X | ||
| The New York Times, “The Striking Racial Divide in How Covid-19 Has Hit Nursing Homes”, The New York Times (September 2020), https://www.nytimes.com/article/coronavirus-nursing-homes-racial-disparity.html?action=click&module=Well&pgtype=Homepage§ion=US%20News | X | |||
| Yue Li, Xi Cen, Xeuya Cai, et al., “Racial and Ethnic Disparities in COVID‐19 Infections and Deaths Across U.S. Nursing Homes,” Journal of the American Geriatrics Society, 68 no. 11 (September 2020): 2454-2461, https://doi.org/10.1111/jgs.16847 | X | |||
| Yue Li, Helena Temkin‐Greener, Gao Shan, et al., “COVID‐19 Infections and Deaths among Connecticut Nursing Home Residents: Facility Correlates,” Journal of the American Medical Directors Association , 68 no. 9 (September 2020): 1899-1906, https://doi.org/10.1111/jgs.16689 | X | X | X | |
| NOTES: X denotes that the study had findings related to the specific measure.SOURCE: KFF analysis of 30 studies that have examined potential predictors of COVID-19 cases and/or deaths in long-term care facilities | ||||
Endnotes
- Rebecca Gorges, “Staffing Levels and COVID-19 Cases and Outbreaks in U.S Nursing Homes,” Journal of the American Geriatrics Society 68 no. 11 (November 2020): 2462-2466, https://doi.org/10.1111/jgs.16787 ↩︎
- Margaret M. Sugg, Trent J. Spaulding, Sandi J. Lane et al, “Mapping community-level determinants of COVID-19 transmission in nursing homes: A multi-scale approach,” Science of the Total Environment 752, no. 15 (January 2021):141946, https://doi.org/10.1016/j.scitotenv.2020.141946 ↩︎
- Helena Temkin-Greener, Wenhan Guo, Yunjiao Mao, Xueya Cai, and Yue Li, “COVID‐19 Pandemic in Assisted Living Communities: Results from Seven States,” Journal of the American Geriatrics Society 68, no. 12 (December 2020): 2727-2734, https://doi.org/10.1111/jgs.16850 ↩︎
- Elizabeth M. White, Cyrus M. Kosar, Richard A.Feifer et al., “Variation in SARS‐CoV‐2 Prevalence in U.S. Skilled Nursing Facilities,” Journal of the American Geriatrics Society 68, no. 10 (October 2020): 2167-2173, https://doi.org/10.1111/jgs.16752 ↩︎
- Priya Chidambaram, Rising Cases in Long-term Care Facilities Are Cause for Concern (Washington, DC: Kaiser Family Foundation, July 2020), https://modern.kff.org/coronavirus-covid-19/issue-brief/rising-cases-in-long-term-care-facilities-are-cause-for-concern/ ↩︎
- Paul Chatterjee, Sheila Kelly, Mingyu Qi, and Rachel Werner, “Characteristics and Quality of US Nursing Homes Reporting Cases of Coronavirus Disease 2019 (COVID-19),” JAMA Network Open 3, no. 7 (July 2020): e2016930, doi:10.1001/jamanetworkopen.2020.16930 ↩︎
- Patricia Rowan, Reena Gupta, Rebecca Lester et al., A Study of the COVID-19 Outbreak and Response in Connecticut Long-Term Care Facilities (Princeton, NJ: Mathematica, Inc., September 2020), https://www.mathematica.org/our-publications-and-findings/publications/fr-a-study-of-the-covid-19-outbreak-and-response-in-connecticut-long-term-care-facilities ↩︎
- Craig Richmond, Arick Sabin, “SARS-CoV-2 sequencing reveals rapid transmission from college student clusters resulting in morbidity and deaths in vulnerable populations” MedRxiv (October 2020), https://doi.org/10.1101/2020.10.12.20210294 ↩︎
- [9] David P. Bui, Isaac See, Elisabeth M. Hesse et al., “Association Between CMS Quality Ratings and COVID-19 Outbreaks in Nursing Homes – West Virginia, March 17-June 11, 2020,” MMWR. Morbidity and mortality weekly report, 69 no. 37 (September 2020): 1300–1304. https://doi.org/10.15585/mmwr.mm6937a5 ↩︎
- Patricia Rowan, Reena Gupta, Rebecca Lester et al., A Study of the COVID-19 Outbreak and Response in Connecticut Long-Term Care Facilities (Princeton, NJ: Mathematica, Inc., September 2020), https://www.mathematica.org/our-publications-and-findings/publications/fr-a-study-of-the-covid-19-outbreak-and-response-in-connecticut-long-term-care-facilities ↩︎
- New York State Department of Health, Factors Associated with Nursing Home Infections and Fatalities in New York State During the COVID-19 Global Health Crisis, (New York, NY: New York State Department of Health, July 2020), https://www.health.ny.gov/press/releases/2020/docs/nh_factors_report.pdf ↩︎
- M Keith Chen, Judith A. Chevalier, and Elisa F. Long, Nursing Home Staff Networks and COVID-19, (National Bureau of Economic Research, Working Paper Series no. 27608, July 2020), https://www.nber.org/papers/w27608 ↩︎
- Sandra M. Shi, Innokentiy Bakaev, Helen Chen, Thomas G. Travison, and Sarah D. Berry, “Risk Factors, Presentation, and Course of Coronavirus Disease 2019 in a Large, Academic Long-Term Care Facility” JAMDA, 21 no.10 (August 2020), https://doi.org/10.1016/j.jamda.2020.08.027 ↩︎
- New York State Department of Health, Factors Associated with Nursing Home Infections and Fatalities in New York State During the COVID-19 Global Health Crisis (New York, NY: New York State Department of Health, July 2020), https://www.health.ny.gov/press/releases/2020/docs/nh_factors_report.pdf ↩︎
- Center for Health and Research Transformation, Keeping nursing home residents safe and advancing health in light of COVID-19 (Center for Health and Research Transformation, September 2020), https://chrt.org/wp-content/uploads/2020/09/KeepingNursingHomeResidentsSafe_SummaryReport_9-8-2020.pdf ↩︎
- Bigelow BF, Tang O, Toci GR, et al., “Transmission of SARS-CoV-2 Involving Residents Receiving Dialysis in a Nursing Home — Maryland, April 2020,” MMWR Morb Mortal Wkly 69 no. 32 (August 2020): 1089-1094, http://dx.doi.org/10.15585/mmwr.mm6932e4 ↩︎
- Hannah R. Abrams, Lacey Loomer, Ashvin Gandhi, and David Grabowski, “Characteristics of U.S. Nursing Homes with COVID‐19 Cases,” Journal of the American Geriatrics Society 68, no 8 (August 2020): 1653-1656, https://doi.org/10.1111/jgs.16661 ↩︎
- Paul Chatterjee, Sheila Kelly, Mingyu Qi, and Rachel Werner, “Characteristics and Quality of US Nursing Homes Reporting Cases of Coronavirus Disease 2019 (COVID-19),” JAMA Network Open 3, no. 7 (July 2020): e2016930, doi:10.1001/jamanetworkopen.2020.16930 ↩︎
- Margaret M. Sugg, Trent J. Spaulding, Sandi J. Lane et al, “Mapping community-level determinants of COVID-19 transmission in nursing homes: A multi-scale approach,” Science of the Total Environment 752, no. 15 (January 2021):141946, https://doi.org/10.1016/j.scitotenv.2020.141946 ↩︎
- Jose F. Figueroa, Rishi K. Wadhera, Irene Papanicolas et al., “Association of Nursing Home Ratings on Health Inspections, Quality of Care, and Nurse Staffing With COVID-19 Cases,” JAMA 324, no. 11 (August 2020): 1103-1105, doi:10.1001/jama.2020.14709 ↩︎
- M Keith Chen, Judith A. Chevalier, and Elisa F. Long, Nursing Home Staff Networks and COVID-19, (National Bureau of Economic Research, Working Paper Series no. 27608, July 2020), https://www.nber.org/papers/w27608 ↩︎
- Elizabeth M. White, Cyrus M. Kosar, Richard A.Feifer et al., “Variation in SARS‐CoV‐2 Prevalence in U.S. Skilled Nursing Facilities,” Journal of the American Geriatrics Society 68, no. 10 (October 2020): 2167-2173, https://doi.org/10.1111/jgs.16752 ↩︎
- Patricia Rowan, Reena Gupta, Rebecca Lester et al., A Study of the COVID-19 Outbreak and Response in Connecticut Long-Term Care Facilities (Princeton, NJ: Mathematica, Inc., September 2020), https://www.mathematica.org/our-publications-and-findings/publications/fr-a-study-of-the-covid-19-outbreak-and-response-in-connecticut-long-term-care-facilities ↩︎
- New York State Department of Health, Factors Associated with Nursing Home Infections and Fatalities in New York State During the COVID-19 Global Health Crisis (New York, NY: New York State Department of Health, July 2020), https://www.health.ny.gov/press/releases/2020/docs/nh_factors_report.pdf ↩︎
- David P. Bui, Isaac See, Elisabeth M. Hesse et al., “Association Between CMS Quality Ratings and COVID-19 Outbreaks in Nursing Homes – West Virginia, March 17-June 11, 2020,” MMWR. Morbidity and mortality weekly report, 69 no. 37 (September 2020): 1300–1304. https://doi.org/10.15585/mmwr.mm6937a5 ↩︎
- Jordan Rau and Anna Almendrala, “COVID-Plagued California Nursing Homes Often Had Problems in Past,” Kaiser Health News (May 2020), https://kffhealthnews.org/news/covid-plagued-california-nursing-homes-often-had-problems-in-past/ ↩︎
- Yue Li, Helena Temkin‐Greener, Gao Shan, and Xueya Cai, “COVID‐19 Infections and Deaths among Connecticut Nursing Home Residents: Facility Correlates,” Journal of the American Medical Directors Association, 68 no. 9 (September 2020): 1899-1906, https://doi.org/10.1111/jgs.16689 ↩︎
- Mengying He, Yumeng Li, and Fang Fang, “Is There a Link between Nursing Home Reported Quality and COVID-19 Cases? Evidence from California Skilled Nursing Facilities,” Journal of the American Medical Directors Association 21, no. 7 (July 2020): 905–908, https://doi.org/10.1016/j.jamda.2020.06.016 ↩︎
- Margaret M. Sugg, Trent J. Spaulding, Sandi J. Lane et al, “Mapping community-level determinants of COVID-19 transmission in nursing homes: A multi-scale approach,” Science of the Total Environment 752, no. 15 (January 2021):141946, https://doi.org/10.1016/j.scitotenv.2020.141946 ↩︎
- Hannah R. Abrams, Lacey Loomer, Ashvin Gandhi, and David Grabowski, “Characteristics of U.S. Nursing Homes with COVID‐19 Cases,” Journal of the American Geriatrics Society 68, no. 8 (August 2020): 1653-1656, https://doi.org/10.1111/jgs.16661 ↩︎
- Elizabeth M. White, Cyrus M. Kosar, Richard A.Feifer et al., “Variation in SARS‐CoV‐2 Prevalence in U.S. Skilled Nursing Facilities,” Journal of the American Geriatrics Society 68, no. 10 (October 2020): 2167-2173, https://doi.org/10.1111/jgs.16752 ↩︎
- Sandra M. Shi, Innokentiy Bakaev, Helen Chen, Thomas G. Travison, and Sarah D. Berry, “Risk Factors, Presentation, and Course of Coronavirus Disease 2019 in a Large, Academic Long-Term Care Facility” JAMDA, 21 no.10 (August 2020), https://doi.org/10.1016/j.jamda.2020.08.027 ↩︎
- Jordan Rau and Anna Almendrala, “COVID-Plagued California Nursing Homes Often Had Problems in Past,” Kaiser Health News (May 2020), https://kffhealthnews.org/news/covid-plagued-california-nursing-homes-often-had-problems-in-past/ ↩︎
- Charlene Harrington, Leslie Ross, Susan Chapman, et al., “Nurse Staffing and Coronavirus Infections in California Nursing Homes.” Policy, Politics, & Nursing Practice 21, no. 3 (August 2020): 174–86, https://doi.org/10.1177%2F1527154420938707 ↩︎
- Paul Chatterjee, Sheila Kelly, Mingyu Qi, and Rachel Werner, “Characteristics and Quality of US Nursing Homes Reporting Cases of Coronavirus Disease 2019 (COVID-19),” JAMA Network Open 3, no. 7 (July 2020): e2016930, doi:10.1001/jamanetworkopen.2020.16930 ↩︎
- Bruce Spurlock, Alex Stack, Charlene Harrington, COVID-19 in California’s Nursing Homes: Factors Associated with Cases and Deaths (California Health Care Foundation, December 2020), https://www.chcf.org/publication/covid-19-californias-nursing-homes-factors-cases-deaths/#recommendations ↩︎
- Jose F. Figueroa, Rishi K. Wadhera, Irene Papanicolas et al., “Association of Nursing Home Ratings on Health Inspections, Quality of Care, and Nurse Staffing With COVID-19 Cases,” JAMA 324, no. 11 (August 2020): 1103-1105, doi:10.1001/jama.2020.14709 ↩︎
- Patricia Rowan, Reena Gupta, Rebecca Lester et al., A Study of the COVID-19 Outbreak and Response in Connecticut Long-Term Care Facilities (Princeton, NJ: Mathematica, Inc., September 2020), https://www.mathematica.org/our-publications-and-findings/publications/fr-a-study-of-the-covid-19-outbreak-and-response-in-connecticut-long-term-care-facilities ↩︎
- Charlene Harrington, Leslie Ross, Susan Chapman, et al., “Nurse Staffing and Coronavirus Infections in California Nursing Homes.” Policy, Politics, & Nursing Practice 21, no. 3 (August 2020): 174–86, https://doi.org/10.1177%2F1527154420938707 ↩︎
- Rebecca Gorges, “Staffing Levels and COVID-19 Cases and Outbreaks in U.S Nursing Homes,” Journal of the American Geriatrics Society 68 no. 11 (November 2020): 2462-2466, https://doi.org/10.1111/jgs.16787 ↩︎
- Margaret M. Sugg, Trent J. Spaulding, Sandi J. Lane et al, “Mapping community-level determinants of COVID-19 transmission in nursing homes: A multi-scale approach,” Science of the Total Environment 752, no. 15 (January 2021):141946, https://doi.org/10.1016/j.scitotenv.2020.141946 ↩︎
- Bruce Spurlock, Alex Stack, Charlene Harrington, COVID-19 in California’s Nursing Homes: Factors Associated with Cases and Deaths ( California Health Care Foundation, December 2020), https://www.chcf.org/publication/covid-19-californias-nursing-homes-factors-cases-deaths/#recommendations ↩︎
- Rebecca Gorges, “Staffing Levels and COVID-19 Cases and Outbreaks in U.S Nursing Homes,” Journal of the American Geriatrics Society 68 no. 11 (November 2020): 2462-2466, https://doi.org/10.1111/jgs.16787 ↩︎
- Margaret M. Sugg, Trent J. Spaulding, Sandi J. Lane et al, “Mapping community-level determinants of COVID-19 transmission in nursing homes: A multi-scale approach,” Science of the Total Environment 752, no. 15 (January 2021):141946, https://doi.org/10.1016/j.scitotenv.2020.141946 ↩︎
- Charlene Harrington, Leslie Ross, Susan Chapman, et al., “Nurse Staffing and Coronavirus Infections in California Nursing Homes.” Policy, Politics, & Nursing Practice 21, no. 3 (August 2020): 174–86, https://doi.org/10.1177%2F1527154420938707 ↩︎
- Yue Li, Helena Temkin‐Greener, Gao Shan, and Xueya Cai, “COVID‐19 Infections and Deaths among Connecticut Nursing Home Residents: Facility Correlates,” Journal of the American Medical Directors Association, 68 no. 9 (September 2020): 1899-1906, https://doi.org/10.1111/jgs.16689 ↩︎
- Rebecca Gorges, “Staffing Levels and COVID-19 Cases and Outbreaks in U.S Nursing Homes,” Journal of the American Geriatrics Society 68 no. 11 (November 2020): 2462-2466, https://doi.org/10.1111/jgs.16787 ↩︎
- Margaret M. Sugg, Trent J. Spaulding, Sandi J. Lane et al, “Mapping community-level determinants of COVID-19 transmission in nursing homes: A multi-scale approach,” Science of the Total Environment 752, no. 15 (January 2021):141946, https://doi.org/10.1016/j.scitotenv.2020.141946 ↩︎
- Priya Chidambaram, Rising Cases in Long-term Care Facilities Are Cause for Concern (Washington, DC: Kaiser Family Foundation, July 2020), https://modern.kff.org/coronavirus-covid-19/issue-brief/rising-cases-in-long-term-care-facilities-are-cause-for-concern/ ↩︎
- Brian E. McGarry, David C. Grabowski, and Michael L. Barnett, “Severe Staffing And Personal Protective Equipment Shortages Faced By Nursing Homes During The COVID-19 Pandemic” Health Affairs 39, no. 10 (August 2020), https://doi.org/10.1377/hlthaff.2020.01269 ↩︎
- Huiwen Xu, Orna Intrator, John R. Bowblis “Shortages of Staff in Nursing Homes During the COVID-19 Pandemic: What are the Driving Factors?” Journal of the American Medical Directors 21, no. 10 (October 2020): 1371-1377, https://doi.org/10.1016/j.jamda.2020.08.002 ↩︎
- Diane Gibson and Jessica Greene, “State Actions and Shortages of PPE and Staff in U.S Nursing Homes” Journal of the American Geriatrics Society 68, no. 12 (October 2020): 2721: 2726, https://doi.org/10.1111/jgs.16883 ↩︎
- Diane Gibson and Jessica Greene, “State Actions and Shortages of PPE and Staff in U.S Nursing Homes” Journal of the American Geriatrics Society 68, no. 12 (October 2020): 2721: 2726, https://doi.org/10.1111/jgs.16883 ↩︎
- Brian E. McGarry, David C. Grabowski, and Michael L. Barnett, “Severe Staffing And Personal Protective Equipment Shortages Faced By Nursing Homes During The COVID-19 Pandemic” Health Affairs 39, no. 10 (August 2020), https://doi.org/10.1377/hlthaff.2020.01269 ↩︎
- Huiwen Xu, Orna Intrator, John R. Bowblis “Shortages of Staff in Nursing Homes During the COVID-19 Pandemic: What are the Driving Factors?” Journal of the American Medical Directors 21, no. 10 (October 2020): 1371-1377, https://doi.org/10.1016/j.jamda.2020.08.002 ↩︎
- Brian E. McGarry, David C. Grabowski, and Michael L. Barnett, “Severe Staffing And Personal Protective Equipment Shortages Faced By Nursing Homes During The COVID-19 Pandemic” Health Affairs 39, no. 10 (August 2020), https://doi.org/10.1377/hlthaff.2020.01269 ↩︎
- Robert Tyler Braun, Hyunkyung Yun, Lawrence P. Casalino et al., “Comparative Performance of Private Equity–Owned US Nursing Homes During the COVID-19 Pandemic,” JAMA Network Open 3, no 10 (October 2020): e2026702, doi:10.1001/jamanetworkopen.2020.26702 ↩︎
- Diane Gibson and Jessica Greene, “State Actions and Shortages of PPE and Staff in U.S Nursing Homes” Journal of the American Geriatrics Society 68, no. 12 (October 2020): 2721: 2726, https://doi.org/10.1111/jgs.16883 ↩︎
- Brian E. McGarry, David C. Grabowski, and Michael L. Barnett, “Severe Staffing And Personal Protective Equipment Shortages Faced By Nursing Homes During The COVID-19 Pandemic” Health Affairs 39, no. 10 (August 2020), https://doi.org/10.1377/hlthaff.2020.01269 ↩︎
- Diane Gibson and Jessica Greene, “State Actions and Shortages of PPE and Staff in U.S Nursing Homes” Journal of the American Geriatrics Society 68, no. 12 (October 2020): 2721: 2726, https://doi.org/10.1111/jgs.16883 ↩︎
- Huiwen Xu, Orna Intrator, John R. Bowblis “Shortages of Staff in Nursing Homes During the COVID-19 Pandemic: What are the Driving Factors?” Journal of the American Medical Directors 21, no. 10 (October 2020): 1371-1377, https://doi.org/10.1016/j.jamda.2020.08.002 ↩︎
- Hannah R. Abrams, Lacey Loomer, Ashvin Gandhi, and David Grabowski, “Characteristics of U.S. Nursing Homes with COVID‐19 Cases,” Journal of the American Geriatrics Society 68, no. 8 (August 2020): 1653-1656, https://doi.org/10.1111/jgs.16661 ↩︎
- Paul Chatterjee, Sheila Kelly, Mingyu Qi, and Rachel Werner, “Characteristics and Quality of US Nursing Homes Reporting Cases of Coronavirus Disease 2019 (COVID-19),” JAMA Network Open 3, no. 7 (July 2020): e2016930, doi:10.1001/jamanetworkopen.2020.16930 ↩︎
- Helena Temkin-Greener, Wenhan Guo, Yunjiao Mao, Xueya Cai, and Yue Li, “COVID‐19 Pandemic in Assisted Living Communities: Results from Seven States,” Journal of the American Geriatrics Society 68, no. 12 (December 2020): 2727-2734, https://doi.org/10.1111/jgs.16850 ↩︎
- Robert Tyler Braun, Hyunkyung Yun, Lawrence P. Casalino et al., “Comparative Performance of Private Equity–Owned US Nursing Homes During the COVID-19 Pandemic,” JAMA Network Open 3, no. 10 (October 2020): e2026702, doi:10.1001/jamanetworkopen.2020.26702 ↩︎
- Mengying He, Yumeng Li, and Fang Fang, “Is There a Link between Nursing Home Reported Quality and COVID-19 Cases? Evidence from California Skilled Nursing Facilities,” Journal of the American Medical Directors Association 21, no. 7 (July 2020): 905–908, https://doi.org/10.1016/j.jamda.2020.06.016 ↩︎
- Elizabeth M. White, Cyrus M. Kosar, Richard A.Feifer et al.,, “Variation in SARS‐CoV‐2 Prevalence in U.S. Skilled Nursing Facilities,” Journal of the American Geriatrics Society 68, no. 10 (October 2020): 2167-2173, https://doi.org/10.1111/jgs.16752 ↩︎
- Mark Aaron Unruh, Hyunkyung Yun, Yongkang Zhang, et al., “ Nursing Home Characteristics Associated With COVID-19 Deaths in Connecticut, New Jersey, and New York,” Journal of the American Medical Directors Association, 21 no. 7 (July 2020): 1001–1003, https://doi.org/10.1016/j.jamda.2020.06.019 ↩︎
- Adam Dean, Atheendar Venkataramani, and Simeon Kimmel, “Mortality Rates From COVID-19 Are Lower In Unionized Nursing Homes,” Health Affairs, 39 no.11 (September 2020): https://doi.org/10.1377/hlthaff.2020.01011 ↩︎
- Charlene Harrington, Leslie Ross, Susan Chapman, et al., “Nurse Staffing and Coronavirus Infections in California Nursing Homes.” Policy, Politics, & Nursing Practice 21, no. 3 (August 2020): 174–86, https://doi.org/10.1177%2F1527154420938707 ↩︎
- Yue Li, Helena Temkin‐Greener, Gao Shan, and Xueya Cai, “COVID‐19 Infections and Deaths among Connecticut Nursing Home Residents: Facility Correlates,” Journal of the American Medical Directors Association, 68 no. 9 (September 2020): 1899-1906, https://doi.org/10.1111/jgs.16689 ↩︎
- M Keith Chen, Judith A. Chevalier, and Elisa F. Long, Nursing Home Staff Networks and COVID-19, (National Bureau of Economic Research, Working Paper Series no. 27608, July 2020), https://www.nber.org/papers/w27608 ↩︎
- Patricia Rowan, Reena Gupta, Rebecca Lester et al., A Study of the COVID-19 Outbreak and Response in Connecticut Long-Term Care Facilities (Princeton, NJ: Mathematica, Inc., September 2020), https://www.mathematica.org/our-publications-and-findings/publications/fr-a-study-of-the-covid-19-outbreak-and-response-in-connecticut-long-term-care-facilities ↩︎
- Bruce Spurlock, Alex Stack, Charlene Harrington, COVID-19 in California’s Nursing Homes: Factors Associated with Cases and Deaths ( California Health Care Foundation, December 2020), https://www.chcf.org/publication/covid-19-californias-nursing-homes-factors-cases-deaths/#recommendations ↩︎
- Margaret M. Sugg, Trent J. Spaulding, Sandi J. Lane et al, “Mapping community-level determinants of COVID-19 transmission in nursing homes: A multi-scale approach,” Science of the Total Environment 752, no. 15 (January 2021):141946, https://doi.org/10.1016/j.scitotenv.2020.141946 ↩︎
- Priya Chidambaram, Tricia Neuman, and Rachel Garfield, Racial and Ethnic Disparities in COVID-19 Cases and Deaths in Nursing Homes (Washington, DC: Kaiser Family Foundation, October 2020), https://modern.kff.org/coronavirus-covid-19/issue-brief/racial-and-ethnic-disparities-in-covid-19-cases-and-deaths-in-nursing-homes/ ↩︎
- The New York Times, “The Striking Racial Divide in How Covid-19 Has Hit Nursing Homes”, The New York Times (September 2020), https://www.nytimes.com/article/coronavirus-nursing-homes-racial-disparity.html?action=click&module=Well&pgtype=Homepage§ion=US%20News ↩︎
- Yue Li, Xi Cen, Xueya Cai, and Helena Temkin-Greener, “Racial and Ethnic Disparities in COVID‐19 Infections and Deaths Across U.S. Nursing Homes,” Journal of the American Geriatrics Society 68, no. 11 (November 2020): 2454-2461, https://doi.org/10.1111/jgs.16847 ↩︎
- Paul Chatterjee, Sheila Kelly, Mingyu Qi, and Rachel Werner, “Characteristics and Quality of US Nursing Homes Reporting Cases of Coronavirus Disease 2019 (COVID-19),” JAMA Network Open 3, no. 7 (July 2020): e2016930, doi:10.1001/jamanetworkopen.2020.16930 ↩︎
- Mengying He, Yumeng Li, and Fang Fang, “Is There a Link between Nursing Home Reported Quality and COVID-19 Cases? Evidence from California Skilled Nursing Facilities,” Journal of the American Medical Directors Association 21, no. 7 (July 2020): 905–908, https://doi.org/10.1016/j.jamda.2020.06.016 ↩︎
- Mark Aaron Unruh, Hyunkyung Yun, Yongkang Zhang, et al., “ Nursing Home Characteristics Associated With COVID-19 Deaths in Connecticut, New Jersey, and New York,” Journal of the American Medical Directors Association, 21 no. 7 (July 2020): 1001–1003, https://doi.org/10.1016/j.jamda.2020.06.019 ↩︎
- M Keith Chen, Judith A. Chevalier, and Elisa F. Long, Nursing Home Staff Networks and COVID-19, (National Bureau of Economic Research, Working Paper Series no. 27608, July 2020), https://www.nber.org/papers/w27608 ↩︎
- Patricia Rowan, Reena Gupta, Rebecca Lester et al., A Study of the COVID-19 Outbreak and Response in Connecticut Long-Term Care Facilities (Princeton, NJ: Mathematica, Inc., September 2020), https://www.mathematica.org/our-publications-and-findings/publications/fr-a-study-of-the-covid-19-outbreak-and-response-in-connecticut-long-term-care-facilities ↩︎
- Bruce Spurlock, Alex Stack, Charlene Harrington, COVID-19 in California’s Nursing Homes: Factors Associated with Cases and Deaths ( California Health Care Foundation, December 2020), https://www.chcf.org/publication/covid-19-californias-nursing-homes-factors-cases-deaths/#recommendations ↩︎
- Robert Tyler Braun, Hyunkyung Yun, Lawrence P. Casalino et al., “Comparative Performance of Private Equity–Owned US Nursing Homes During the COVID-19 Pandemic,” JAMA Network Open 3, no. 10 (October 2020): e2026702, doi:10.1001/jamanetworkopen.2020.26702 ↩︎
- Patricia Rowan, Reena Gupta, Rebecca Lester et al., A Study of the COVID-19 Outbreak and Response in Connecticut Long-Term Care Facilities (Princeton, NJ: Mathematica, Inc., September 2020), https://www.mathematica.org/our-publications-and-findings/publications/fr-a-study-of-the-covid-19-outbreak-and-response-in-connecticut-long-term-care-facilities ↩︎
- Hannah R. Abrams, Lacey Loomer, Ashvin Gandhi, and David Grabowski, “Characteristics of U.S. Nursing Homes with COVID‐19 Cases,” Journal of the American Geriatrics Society 68, no. 8 (August 2020): 1653-1656, https://doi.org/10.1111/jgs.16661 ↩︎
- Adam Dean, Atheendar Venkataramani, and Simeon Kimmel, “Mortality Rates From COVID-19 Are Lower In Unionized Nursing Homes,” Health Affairs, 39 no.11 (September 2020): https://doi.org/10.1377/hlthaff.2020.01011 ↩︎
- Hannah R. Abrams, Lacey Loomer, Ashvin Gandhi, and David Grabowski, “Characteristics of U.S. Nursing Homes with COVID‐19 Cases,” Journal of the American Geriatrics Society 68, no. 8 (August 2020): 1653-1656, https://doi.org/10.1111/jgs.16661 ↩︎
- Priya Chidambaram, Tricia Neuman, and Rachel Garfield, Racial and Ethnic Disparities in COVID-19 Cases and Deaths in Nursing Homes (Washington, DC: Kaiser Family Foundation, October 2020), https://modern.kff.org/coronavirus-covid-19/issue-brief/racial-and-ethnic-disparities-in-covid-19-cases-and-deaths-in-nursing-homes/ ↩︎
- The New York Times, “The Striking Racial Divide in How Covid-19 Has Hit Nursing Homes”, The New York Times (September 2020), https://www.nytimes.com/article/coronavirus-nursing-homes-racial-disparity.html?action=click&module=Well&pgtype=Homepage§ion=US%20News ↩︎
- Priya Chidambaram, Tricia Neuman, and Rachel Garfield, Racial and Ethnic Disparities in COVID-19 Cases and Deaths in Nursing Homes (Washington, DC: Kaiser Family Foundation, October 2020), https://modern.kff.org/coronavirus-covid-19/issue-brief/racial-and-ethnic-disparities-in-covid-19-cases-and-deaths-in-nursing-homes/ ↩︎
- Yue Li, Xi Cen, Xueya Cai, and Helena Temkin-Greener, “Racial and Ethnic Disparities in COVID‐19 Infections and Deaths Across U.S. Nursing Homes,” Journal of the American Geriatrics Society 68, no. 11 (November 2020): 2454-2461, https://doi.org/10.1111/jgs.16847 ↩︎
- M Keith Chen, Judith A. Chevalier, and Elisa F. Long, Nursing Home Staff Networks and COVID-19, (National Bureau of Economic Research, Working Paper Series no. 27608, July 2020), https://www.nber.org/papers/w27608 ↩︎
- Helena Temkin-Greener, Wenhan Guo, Yunjiao Mao, Xueya Cai, and Yue Li, “COVID‐19 Pandemic in Assisted Living Communities: Results from Seven States,” Journal of the American Geriatrics Society 68, no. 12 (December 2020): 2727-2734, https://doi.org/10.1111/jgs.16850 ↩︎
- Bruce Spurlock, Alex Stack, Charlene Harrington, COVID-19 in California’s Nursing Homes: Factors Associated with Cases and Deaths ( California Health Care Foundation, December 2020), https://www.chcf.org/publication/covid-19-californias-nursing-homes-factors-cases-deaths/#recommendations ↩︎
- Mengying He, Yumeng Li, and Fang Fang, “Is There a Link between Nursing Home Reported Quality and COVID-19 Cases? Evidence from California Skilled Nursing Facilities,” Journal of the American Medical Directors Association 21, no. 7 (July 2020): 905–908, https://doi.org/10.1016/j.jamda.2020.06.016 ↩︎
- Yue Li, Helena Temkin‐Greener, Gao Shan, and Xueya Cai, “COVID‐19 Infections and Deaths among Connecticut Nursing Home Residents: Facility Correlates,” Journal of the American Medical Directors Association, 68 no. 9 (September 2020): 1899-1906, https://doi.org/10.1111/jgs.16689 ↩︎
- Margaret M. Sugg, Trent J. Spaulding, Sandi J. Lane et al, “Mapping community-level determinants of COVID-19 transmission in nursing homes: A multi-scale approach,” Science of the Total Environment 752, no. 15 (January 2021):141946, https://doi.org/10.1016/j.scitotenv.2020.141946 ↩︎
- Hannah R. Abrams, Lacey Loomer, Ashvin Gandhi, and David Grabowski, “Characteristics of U.S. Nursing Homes with COVID‐19 Cases,” Journal of the American Geriatrics Society 68, no. 8 (August 2020): 1653-1656, https://doi.org/10.1111/jgs.16661 ↩︎
- M Keith Chen, Judith A. Chevalier, and Elisa F. Long, Nursing Home Staff Networks and COVID-19, (National Bureau of Economic Research, Working Paper Series no. 27608, July 2020), https://www.nber.org/papers/w27608 ↩︎
- Hannah R. Abrams, Lacey Loomer, Ashvin Gandhi, and David Grabowski, “Characteristics of U.S. Nursing Homes with COVID‐19 Cases,” Journal of the American Geriatrics Society 68, no. 8 (August 2020): 1653-1656, https://doi.org/10.1111/jgs.16661 ↩︎
- Helena Temkin-Greener, Wenhan Guo, Yunjiao Mao, Xueya Cai, and Yue Li, “COVID‐19 Pandemic in Assisted Living Communities: Results from Seven States,” Journal of the American Geriatrics Society 68, no. 12 (December 2020): 2727-2734, https://doi.org/10.1111/jgs.16850 ↩︎
- Mengying He, Yumeng Li, and Fang Fang, “Is There a Link between Nursing Home Reported Quality and COVID-19 Cases? Evidence from California Skilled Nursing Facilities,” Journal of the American Medical Directors Association 21, no. 7 (July 2020): 905–908, https://doi.org/10.1016/j.jamda.2020.06.016 ↩︎
- Elizabeth M. White, Cyrus M. Kosar, Richard A.Feifer et al., “Variation in SARS‐CoV‐2 Prevalence in U.S. Skilled Nursing Facilities,” Journal of the American Geriatrics Society 68, no. 10 (October 2020): 2167-2173, https://doi.org/10.1111/jgs.16752 ↩︎
- Mark Aaron Unruh, Hyunkyung Yun, Yongkang Zhang, et al., “ Nursing Home Characteristics Associated With COVID-19 Deaths in Connecticut, New Jersey, and New York,” Journal of the American Medical Directors Association, 21 no. 7 (July 2020): 1001–1003, https://doi.org/10.1016/j.jamda.2020.06.019 ↩︎
- Charlene Harrington, Leslie Ross, Susan Chapman, et al., “Nurse Staffing and Coronavirus Infections in California Nursing Homes.” Policy, Politics, & Nursing Practice 21, no. 3 (August 2020): 174–86, https://doi.org/10.1177%2F1527154420938707 ↩︎
- M Keith Chen, Judith A. Chevalier, and Elisa F. Long, Nursing Home Staff Networks and COVID-19, (National Bureau of Economic Research, Working Paper Series no. 27608, July 2020), https://www.nber.org/papers/w27608 ↩︎
- Patricia Rowan, Reena Gupta, Rebecca Lester et al., A Study of the COVID-19 Outbreak and Response in Connecticut Long-Term Care Facilities (Princeton, NJ: Mathematica, Inc., September 2020), https://www.mathematica.org/our-publications-and-findings/publications/fr-a-study-of-the-covid-19-outbreak-and-response-in-connecticut-long-term-care-facilities ↩︎
- Bruce Spurlock, Alex Stack, Charlene Harrington, COVID-19 in California’s Nursing Homes: Factors Associated with Cases and Deaths ( California Health Care Foundation, December 2020), https://www.chcf.org/publication/covid-19-californias-nursing-homes-factors-cases-deaths/#recommendations ↩︎
- Hannah R. Abrams, Lacey Loomer, Ashvin Gandhi, and David Grabowski, “Characteristics of U.S. Nursing Homes with COVID‐19 Cases,” Journal of the American Geriatrics Society 68, no. 8 (August 2020): 1653-1656, https://doi.org/10.1111/jgs.16661 ↩︎
- Charlene Harrington, Leslie Ross, Susan Chapman, et al., “Nurse Staffing and Coronavirus Infections in California Nursing Homes.” Policy, Politics, & Nursing Practice 21, no. 3 (August 2020): 174–86, https://doi.org/10.1177%2F1527154420938707 ↩︎
- M Keith Chen, Judith A. Chevalier, and Elisa F. Long, Nursing Home Staff Networks and COVID-19, (National Bureau of Economic Research, Working Paper Series no. 27608, July 2020), https://www.nber.org/papers/w27608 ↩︎
- Mark Aaron Unruh, Hyunkyung Yun, Yongkang Zhang, et al., “ Nursing Home Characteristics Associated With COVID-19 Deaths in Connecticut, New Jersey, and New York,” Journal of the American Medical Directors Association, 21 no. 7 (July 2020): 1001–1003, https://doi.org/10.1016/j.jamda.2020.06.019 ↩︎
- Elizabeth M. White, Cyrus M. Kosar, Richard A.Feifer et al., “Variation in SARS‐CoV‐2 Prevalence in U.S. Skilled Nursing Facilities,” Journal of the American Geriatrics Society 68, no. 10 (October 2020): 2167-2173, https://doi.org/10.1111/jgs.16752 ↩︎
- Patricia Rowan, Reena Gupta, Rebecca Lester et al., A Study of the COVID-19 Outbreak and Response in Connecticut Long-Term Care Facilities (Princeton, NJ: Mathematica, Inc., September 2020), https://www.mathematica.org/our-publications-and-findings/publications/fr-a-study-of-the-covid-19-outbreak-and-response-in-connecticut-long-term-care-facilities ↩︎
- Bruce Spurlock, Alex Stack, Charlene Harrington, COVID-19 in California’s Nursing Homes: Factors Associated with Cases and Deaths ( California Health Care Foundation, December 2020), https://www.chcf.org/publication/covid-19-californias-nursing-homes-factors-cases-deaths/#recommendations ↩︎
- Elizabeth M. White, Cyrus M. Kosar, Richard A.Feifer et al., “Variation in SARS‐CoV‐2 Prevalence in U.S. Skilled Nursing Facilities,” Journal of the American Geriatrics Society 68, no. 10 (October 2020): 2167-2173, https://doi.org/10.1111/jgs.16752 ↩︎
- Helena Temkin-Greener, Wenhan Guo, Yunjiao Mao, Xueya Cai, and Yue Li, “COVID‐19 Pandemic in Assisted Living Communities: Results from Seven States,” Journal of the American Geriatrics Society 68, no. 12 (December 2020): 2727-2734, https://doi.org/10.1111/jgs.16850 ↩︎
- Mengying He, Yumeng Li, and Fang Fang, “Is There a Link between Nursing Home Reported Quality and COVID-19 Cases? Evidence from California Skilled Nursing Facilities,” Journal of the American Medical Directors Association 21, no. 7 (July 2020): 905–908, https://doi.org/10.1016/j.jamda.2020.06.016 ↩︎
- Hannah R. Abrams, Lacey Loomer, Ashvin Gandhi, and David Grabowski, “Characteristics of U.S. Nursing Homes with COVID‐19 Cases,” Journal of the American Geriatrics Society 68, no. 8 (August 2020): 1653-1656, https://doi.org/10.1111/jgs.16661 ↩︎
- Paul Chatterjee, Sheila Kelly, Mingyu Qi, and Rachel Werner, “Characteristics and Quality of US Nursing Homes Reporting Cases of Coronavirus Disease 2019 (COVID-19),” JAMA Network Open 3, no. 7 (July 2020): e2016930, doi:10.1001/jamanetworkopen.2020.16930 ↩︎
- Mark Aaron Unruh, Hyunkyung Yun, Yongkang Zhang, et al., “ Nursing Home Characteristics Associated With COVID-19 Deaths in Connecticut, New Jersey, and New York,” Journal of the American Medical Directors Association, 21 no. 7 (July 2020): 1001–1003, https://doi.org/10.1016/j.jamda.2020.06.019 ↩︎
- Yue Li, Helena Temkin‐Greener, Gao Shan, and Xueya Cai, “COVID‐19 Infections and Deaths among Connecticut Nursing Home Residents: Facility Correlates,” Journal of the American Medical Directors Association, 68 no. 9 (September 2020): 1899-1906, https://doi.org/10.1111/jgs.16689 ↩︎
- M Keith Chen, Judith A. Chevalier, and Elisa F. Long, Nursing Home Staff Networks and COVID-19, (National Bureau of Economic Research, Working Paper Series no. 27608, July 2020), https://www.nber.org/papers/w27608 ↩︎