Introduction
The COVID-19 pandemic has disproportionately affected seniors and people with disabilities who rely on long-term services and supports (LTSS) to meet daily self-care and independent living needs and the direct care workers who provide these services. As the primary source of funding for home and community-based services (HCBS), state Medicaid programs have faced long-standing challenges related to the aging population, direct care workforce shortages, and an insufficient supply of affordable accessible housing. All of these challenges pre-dated and have been intensified by the pandemic. Nearly all HCBS are provided at state option, resulting in substantial variation among states. State Medicaid programs vary in many respects, due to the number of options available to states in all program areas, beyond HCBS. During the COVID-19 public health emergency (PHE), states have used Medicaid emergency authorities to adopt various policies to streamline and expand access to HCBS and support providers, illustrating the range of HCBS options available to states. States will face choices about whether to continue these policies after the PHE ends.1 States also will likely consider how to continue to expand the HCBS provider infrastructure, which experienced some permanent closures and financial challenges during the pandemic.
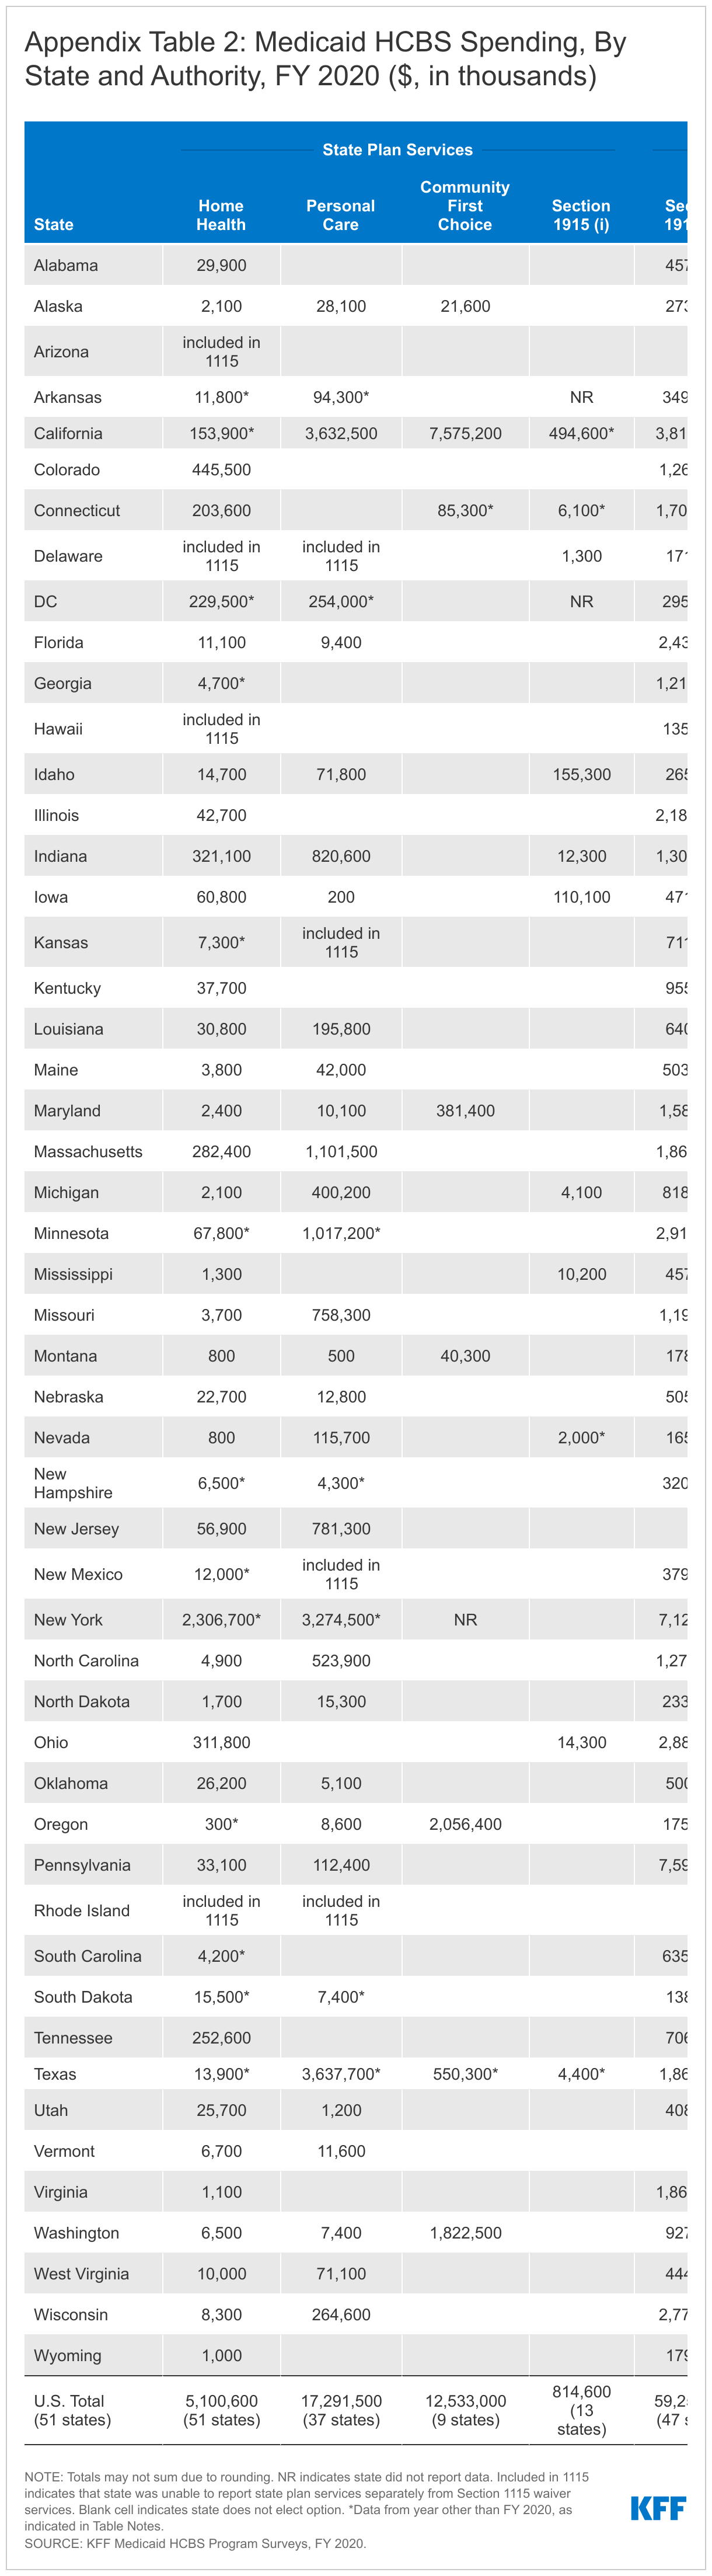
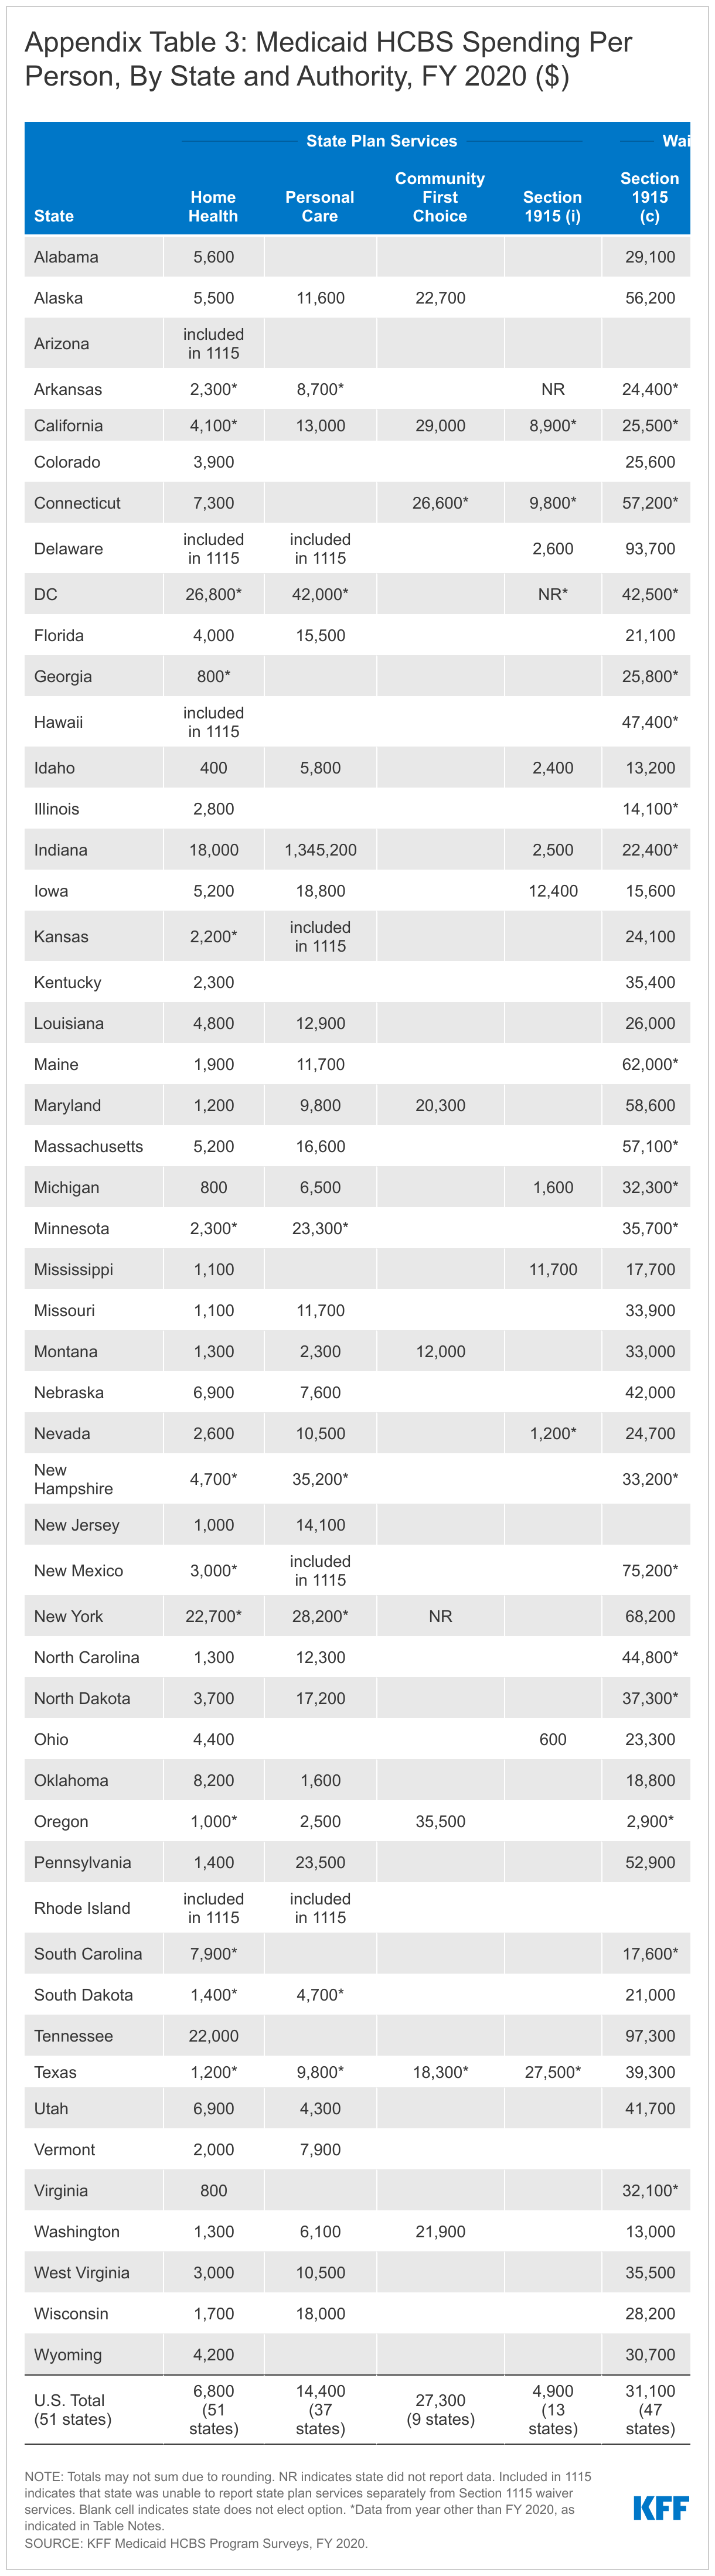
This issue brief presents the latest findings on key state policy choices about Medicaid HCBS in FY 2020. The data were collected from March through August 2022 in KFF’s 19th survey of state officials administering Medicaid HCBS programs in all 50 states and DC.2 Our survey captured some of the early impacts of the COVID-19 pandemic, though additional impacts will be seen in FY 2021 and beyond. Most states began FY 2020 in July 2019, prior to the pandemic’s onset. By the last quarter of FY 2020, states were facing uncertainty about the pandemic and the economy. An earlier brief presented survey findings about state policies adopted in response to the pandemic and the pandemic’s impact on people receiving Medicaid HCBS and providers. A related brief presents the latest state-level data on the number of people receiving HCBS and HCBS spending.
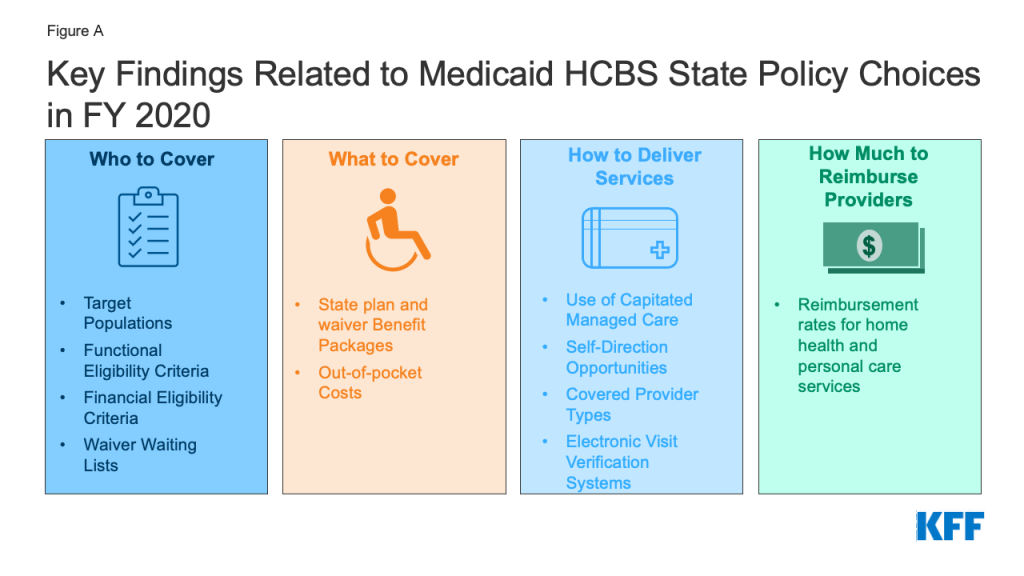
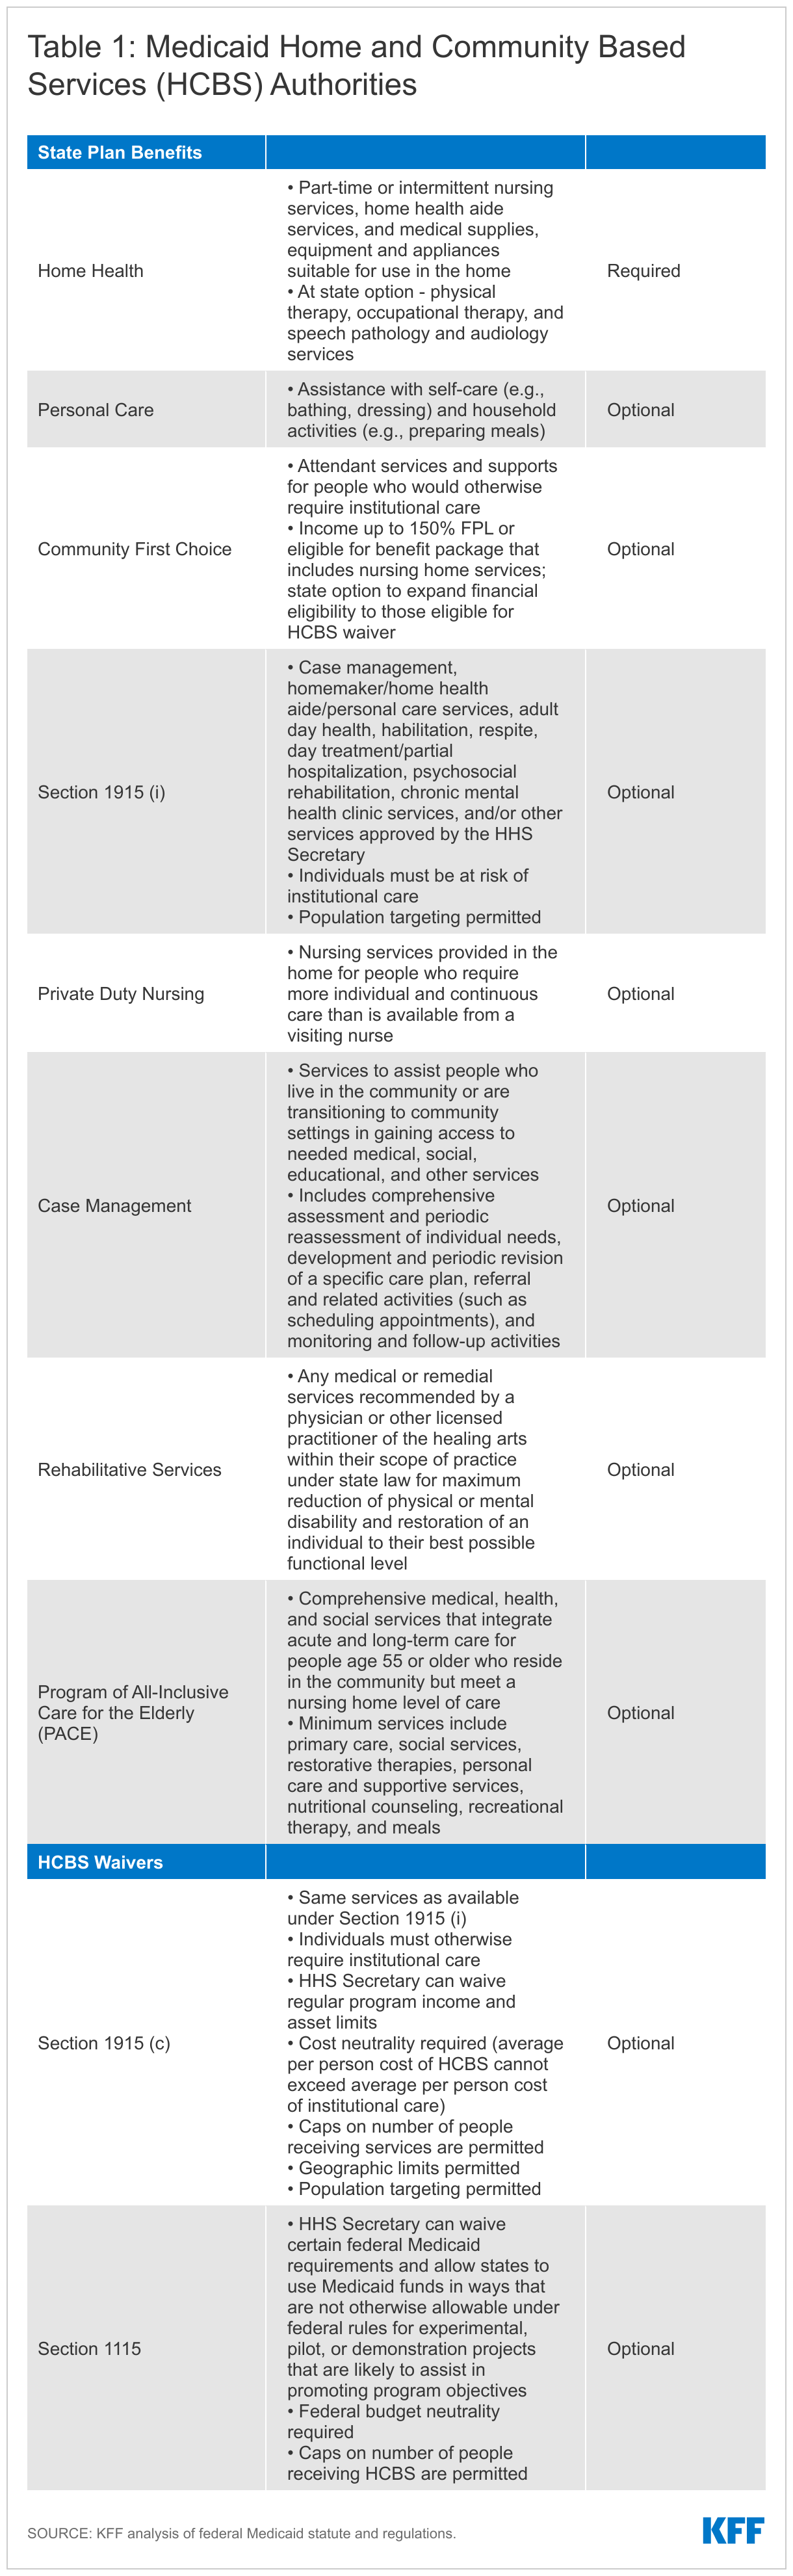
Overall, 47 states responded to this year’s survey, though response rates for particular questions varied.3 When available, prior years’ data was used to supplement missing data for states that did not submit complete survey responses. When prior years’ data was unavailable, we indicate when state-level data are omitted from totals. The survey encompasses four Medicaid HCBS state plan benefits (home health, personal care, Section 1915 (i), and Community First Choice (CFC)) and two waiver authorities (Section 1915 (c) and Section 11154 ). The Appendix Tables contain detailed state-level data. We report findings related to key state policy choices in four areas:
- Who to cover, including target populations, functional eligibility criteria, financial eligibility criteria, and waiver waiting lists;
- What to cover, including state plan and waiver benefit packages and out-of-pocket costs;
- How to deliver services, including use of capitated managed care, self-direction opportunities, covered provider types, and electronic visit verification systems; and
- How much to reimburse providers, including reimbursement rates for home health and personal care services.
Who to Cover
Target populations
Some HCBS authorities enable states to target services to a specific population of seniors and/or people with disabilities. The Section 1915 (i) state plan option allows states to offer an HCBS benefit package targeted to a specific population with functional needs that are less than an institutional level of care. Additionally, states use Section 1915 (c) or Section 1115 HCBS waivers to offer a benefit package targeted to a specific population who would otherwise need institutional services.
Just under half of the 13 states that offer Section 1915 (i) state plan services to people with functional needs that are less than an institutional level of care target people with mental illness.5 The six states providing Section 1915 (i) state plan services to people with mental illness include Arkansas, Idaho, Indiana, Iowa, Ohio, and Texas. Four states (CA, DE, ID, and MS) provide Section 1915 (i) state plan services to people with intellectual or developmental disabilities (I/DD), and four states provide Section 1915 (i) state plan services to seniors and/or people with physical disabilities (CT-seniors only, DC, MI, and NV).
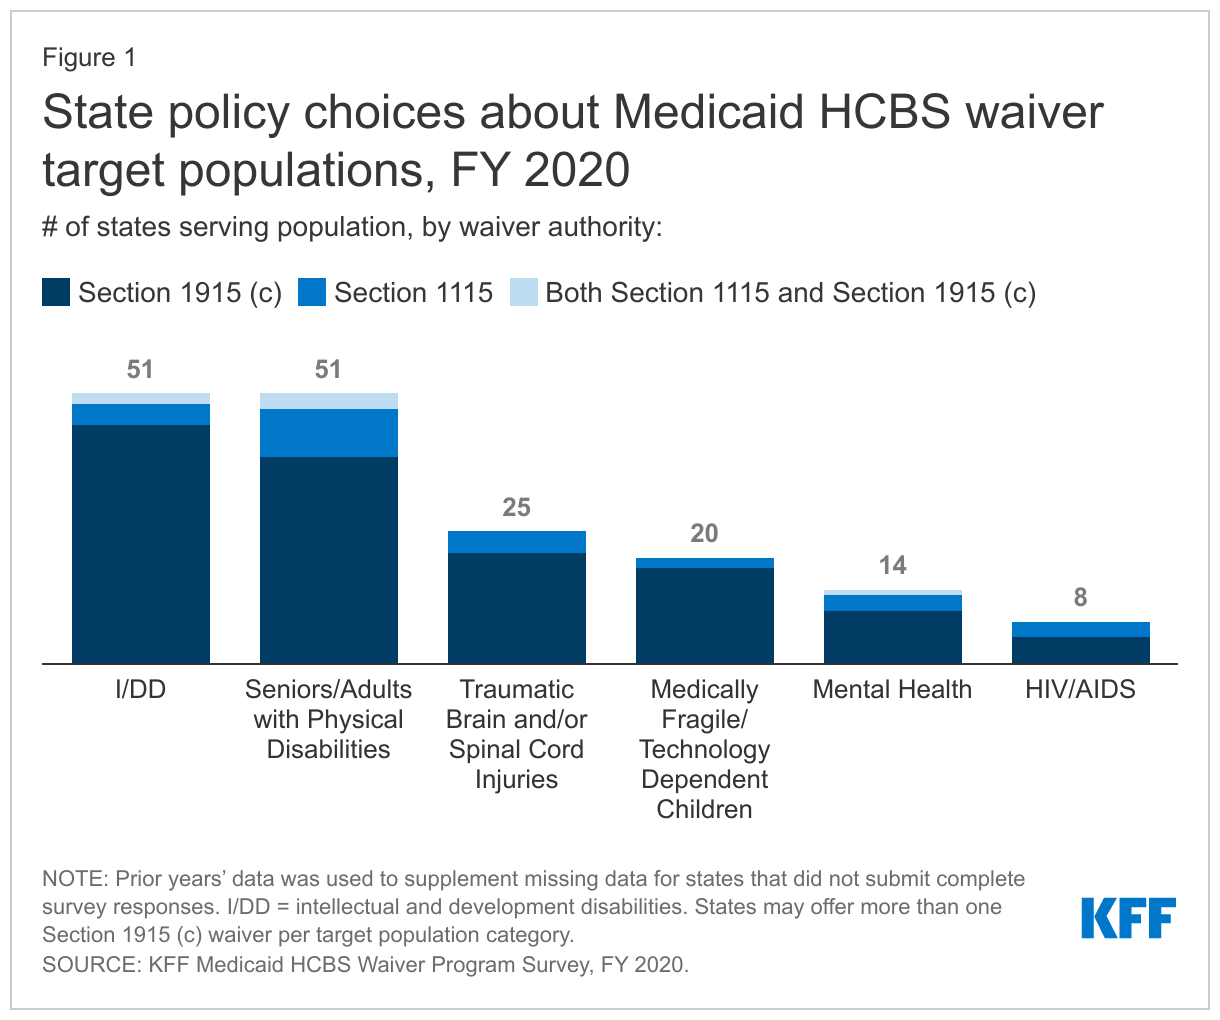
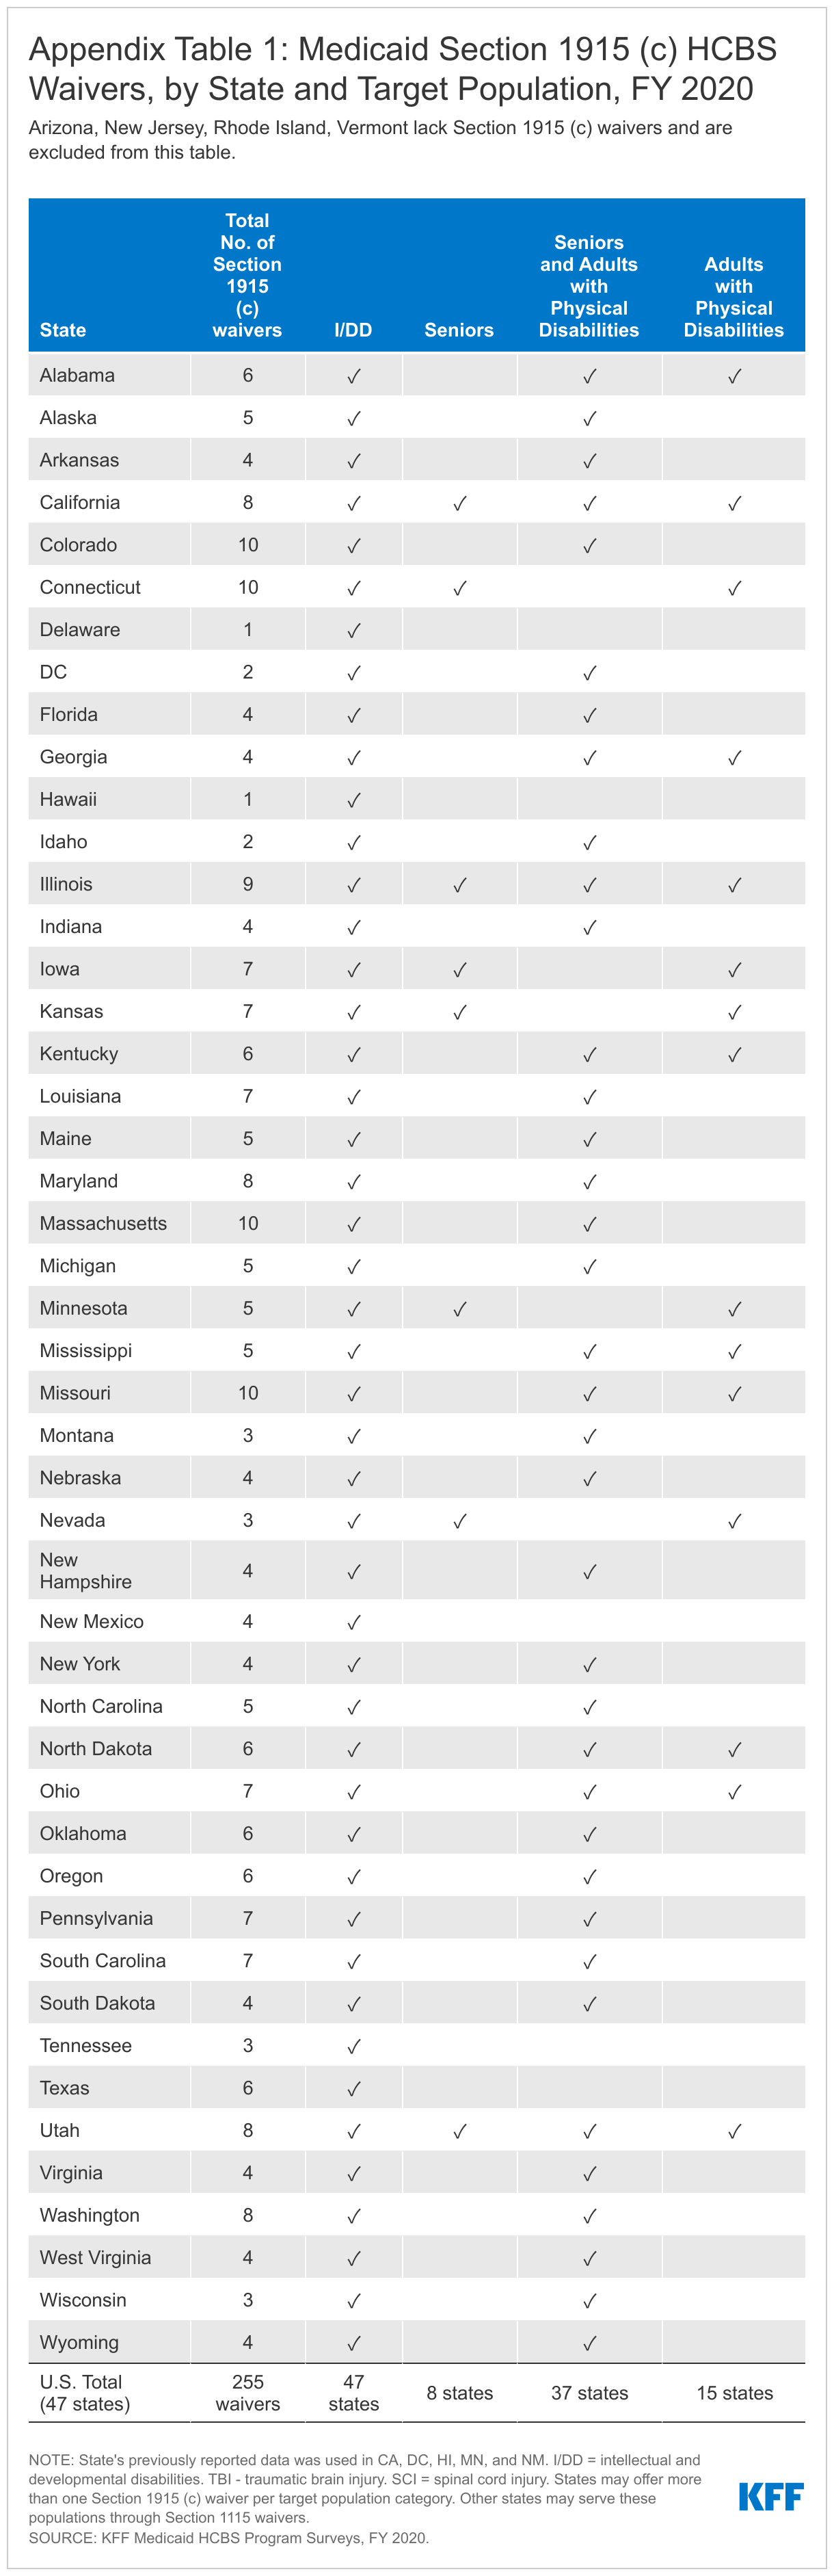
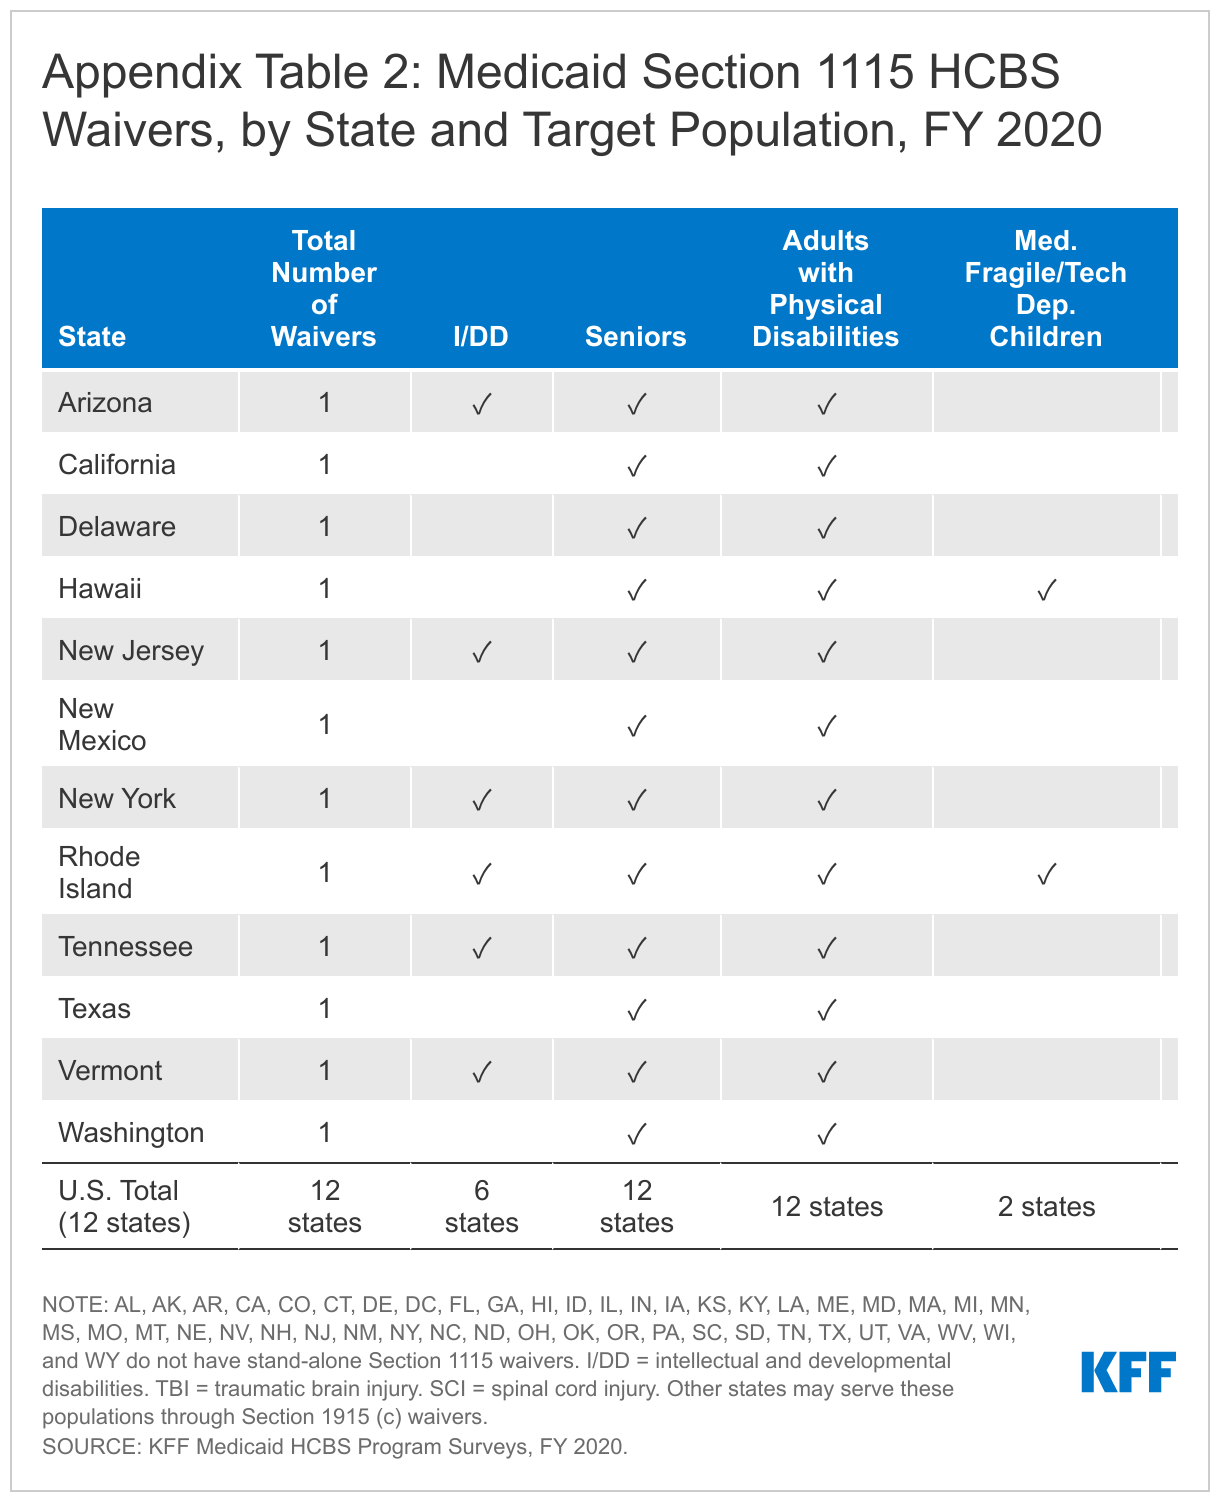
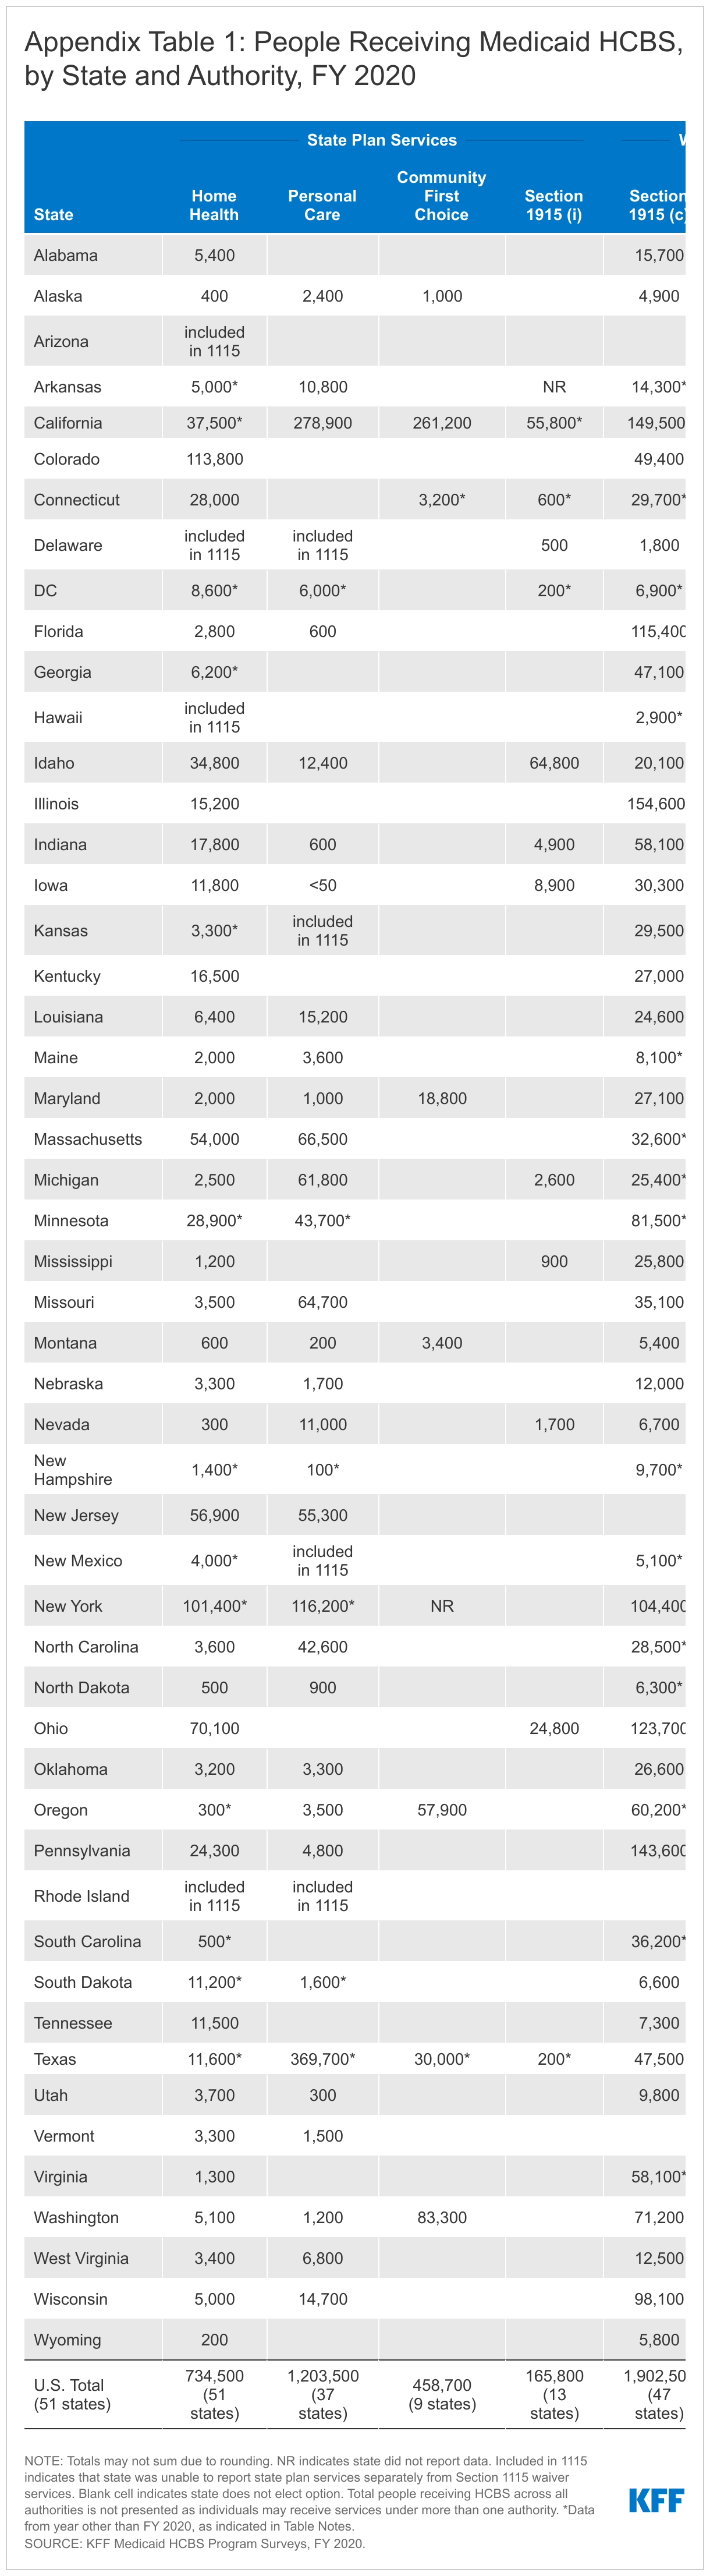
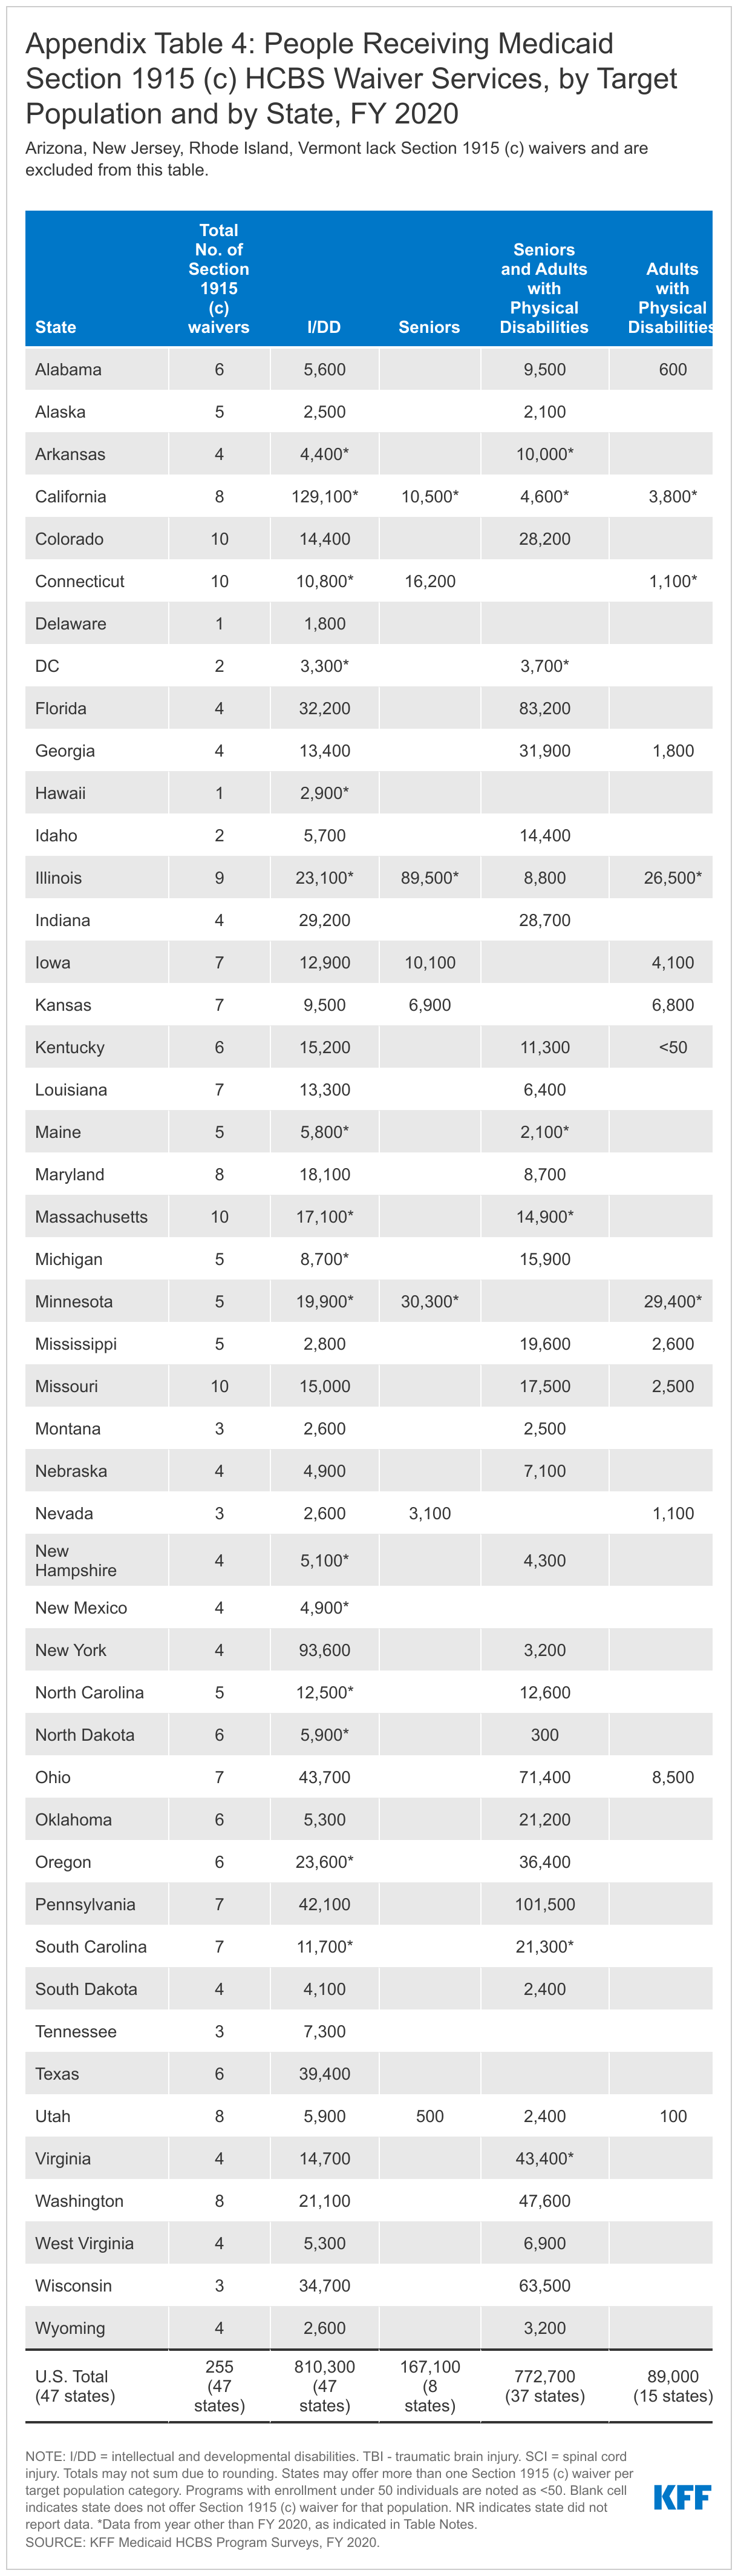
Nationally, there are a total of 267 HCBS waivers serving a variety of target populations in FY 2020.6 Section 1915 (c) waivers continue to account for the vast majority (255) of HCBS waivers (Appendix Table 1), with the remaining dozen HCBS waivers authorized under Section 1115 HCBS (Appendix Table 2).7 Four states (AZ, NJ, RI,8 and VT) use a Section 1115 waiver to provide HCBS to all covered populations and do not offer any Section 1915 (c) waivers, while eight states9 serve some populations under a Section 1115 waiver and other populations through Section 1915 (c) waivers. The other 39 states offer one or more Section 1915 (c) waivers. The number of Section 1915 (c) HCBS waivers averages five per state. The greatest number of Section 1915 (c) waivers per state is 10 (in CO, CT, MA, and MO). Section 1915 (c) waivers are targeted to a single population, while Section 1115 HCBS waivers serve multiple populations.
All states serve people with I/DD,10 seniors, and nonelderly adults with physical disabilities11 through HCBS waivers (Figure 1 and Appendix Tables 1 and 2). Fewer states use HCBS waivers to serve people with traumatic brain and/or spinal cord injuries (TBI/SCI),12 children who are medically fragile or technology dependent,13 people with mental health disabilities,14 and people with HIV/AIDS.15
Several states report offering new HCBS waivers serving various populations in FY 2020. These include:
- Three states with new waivers serving people with I/DD (MD (with two new waivers serving this population), NC, and NM);
- Two states with new waivers serving seniors and adults with physical disabilities (MI, effective January 2020, and MO, effective July 2020);16
- One state with a new waiver serving children with serious emotional disturbance (WV); and
- One state with a new waiver serving people with traumatic brain injuries (MO).
See the Financial Eligibility and Capitated Managed Care sections below for additional discussion of recent HCBS waiver activity.
Functional eligibility
Some HCBS authorities require individuals to meet functional criteria to qualify for services. Functional eligibility typically is assessed based on self-care and/or household activity needs. Self-care needs may include assistance with tasks such as eating, bathing, or dressing, while household activity needs may include assistance with tasks such as preparing meals or managing medications. To qualify for Section 1915 (i) state plan HCBS, individuals must have functional needs that are less than what the state requires to meet an institutional level of care. Section 1915 (c) and Section 1115 HCBS waivers generally require individuals to meet an institutional level of care, though some states establish functional eligibility criteria for waivers that differ from the criteria they use for nursing home or other institutional eligibility.
Since adopting the Section 1915 (i) state plan option, no state has chosen to restrict functional eligibility to control enrollment. Unlike waivers, states are not permitted to cap enrollment or maintain a waiting list for state plan HCBS. However, states can manage enrollment under Section 1915 (i) by restricting functional eligibility criteria if the state will exceed the number of beneficiaries that it anticipated serving. Despite the availability of this option, none of the 13 states that offers Section 1915 (i) state plan services reports using it to date.
Nearly all (262 of 267) HCBS waivers use functional eligibility criteria that are the same as or less stringent than the criteria to qualify for institutional services.17 Most HCBS waivers (242 in 50 states) use the same functional eligibility criteria as are required for nursing facility eligibility, treating HCBS and institutional care equally. A minority of waivers (20 in 10 states) use functional eligibility criteria that are less stringent than those required for institutional care, making HCBS eligibility broader than eligibility for institutional care. Using the same functional eligibility criteria for HCBS waivers and institutional care removes any potential bias in favor of institutional care. Additionally, adopting HCBS functional eligibility criteria that are less stringent than what is required for institutional care can allow states to provide HCBS in an effort to preventing or delaying an individual’s need for institutional care if functioning were to decline without services.
Just five waivers use functional eligibility criteria that are more restrictive than those required for institutional care. Two of these waivers, in Oklahoma and Oregon, serve medically fragile children and set financial eligibility the same as for institutions, though functional eligibility is more restrictive. One South Carolina waiver serves seniors and adults with disabilities and requires dependence on a ventilator in addition to a nursing home level of care. Two Texas waivers serve people with I/DD.
Self-care needs are the type of need most frequently required to establish functional eligibility, compared to household activity needs. Forty-three percent of all waivers (115 in 33 states) require individuals to have self-care needs to establish functional eligibility, while one-quarter require individuals to have household activity needs to establish functional eligibility.18 One-quarter (68 in 21 states) require individuals to have both self-care and household activity needs to establish functional eligibility. Most states utilize a state-specific tool to conduct the functional needs assessment for HCBS waivers.
States most typically require that an individual need help with three needs to be eligible for a HCBS waiver. Among the waivers that require self-care needs for functional eligibility, 55 (in 17 states) require three or more needs.19 Two self-care needs are required in 30 waivers (12 states), and another 30 waivers (13 states) require one self-care need. Although states that selected “three or more needs” were not asked to provide a specific number, Arizona volunteered that seven self-care needs are required to qualify for its Section 1115 HCBS waiver. Among the waivers that require household activity needs for functional eligibility, 33 waivers (in 10 states) require three or more needs, while fewer waivers require one need (23 in 10 states) or two needs (12 in 5 states).20
Many waivers (205 of 216 reporting) require individuals to satisfy other criteria, in addition to self-care and/or household activity needs, to establish functional eligibility.21 The majority of waivers with other functional eligibility criteria require a specific diagnosis (119 waivers in 36 states), such as autism or intellectual disability, traumatic brain injury, or a mental health condition. Very few waivers (8 in 5 states) require the need for cueing as part of the functional eligibility determination.
Financial eligibility
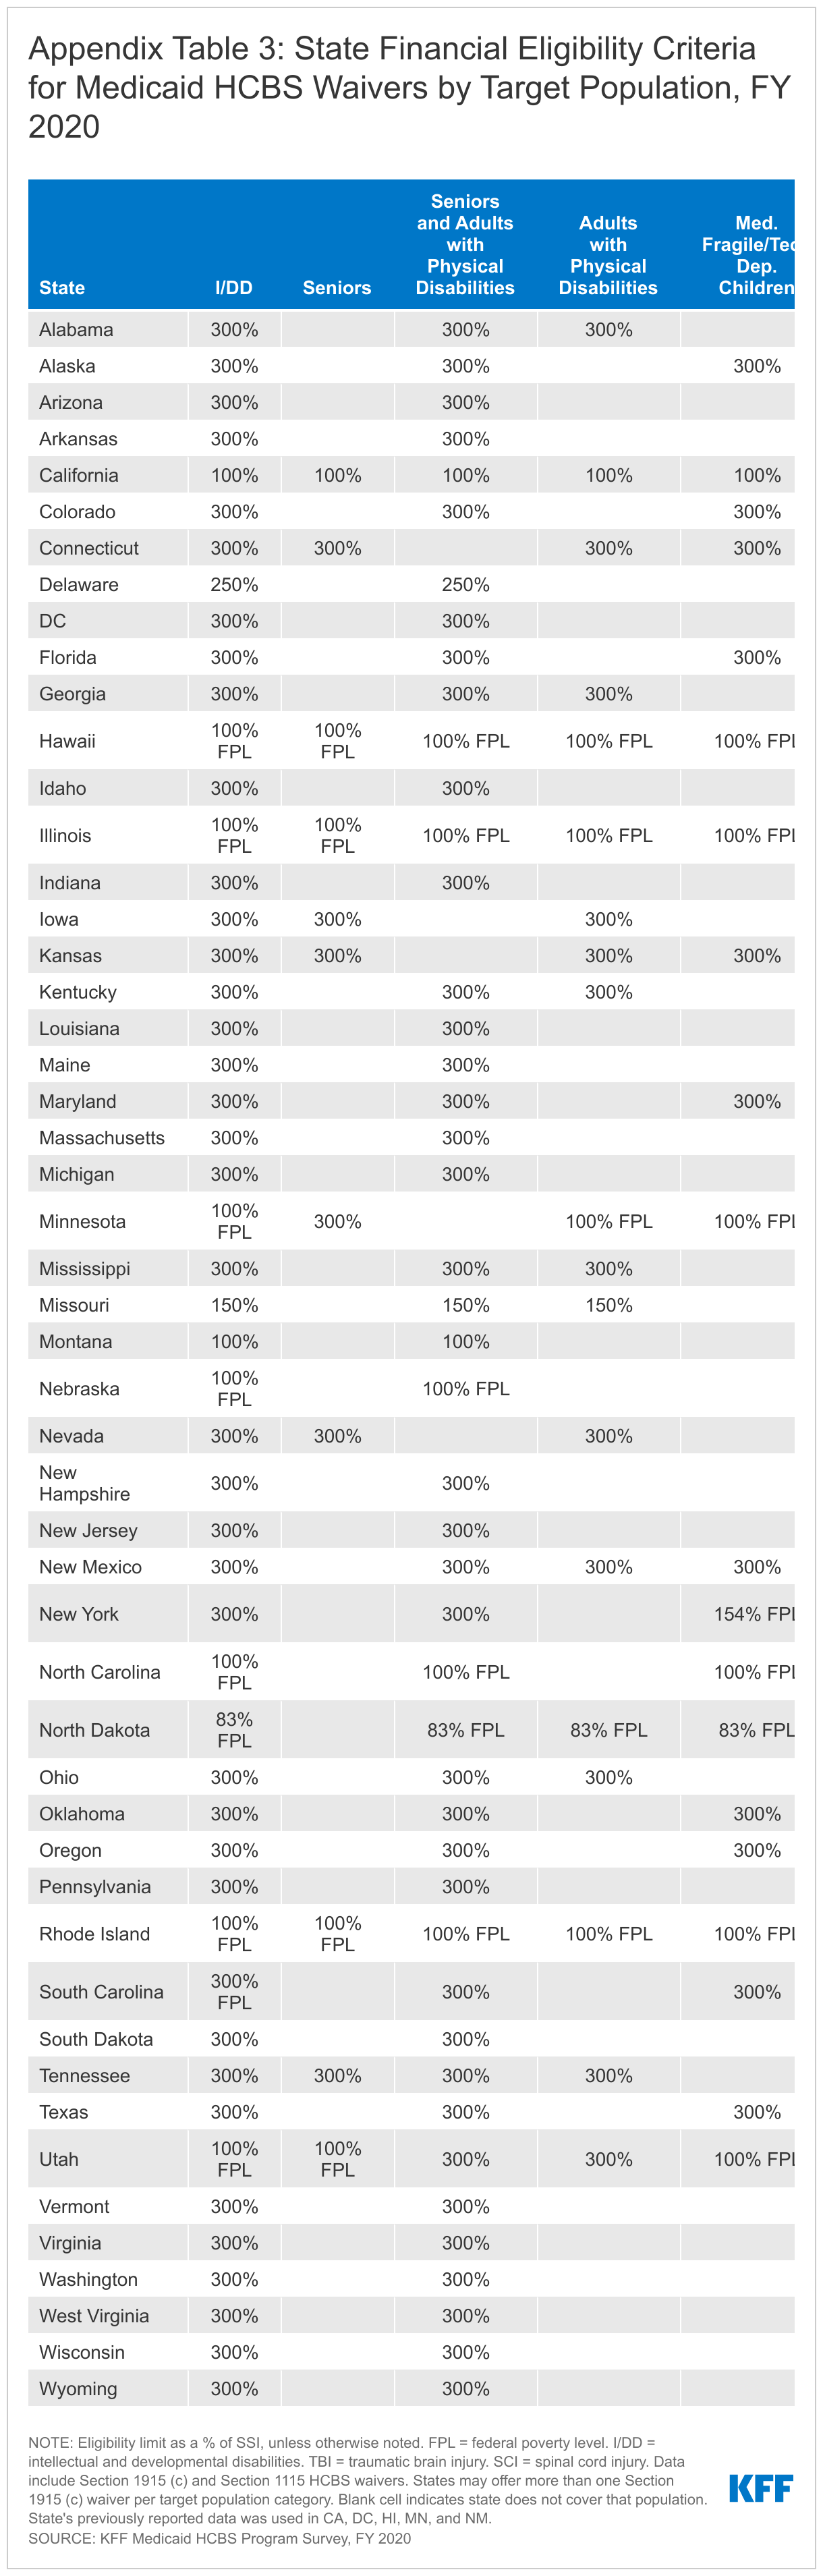
Two state plan HCBS authorities (Section 1915 (i) and CFC) have financial eligibility limits that determine whether individuals can qualify to receive those services. (Individuals already must be eligible for Medicaid under a state plan or HCBS waiver pathway, and these additional financial eligibility criteria govern access to these particular services.). Furthermore, while states can use waivers just to authorize an HCBS benefit package (provided to people who qualify for Medicaid through state plan eligibility pathways), most states also use waivers to expand financial eligibility for HCBS beyond the limits in state plan pathways, up to a maximum of 300% of SSI ($2,523/month for an individual in 2022).
Three of the 13 states that offer the Section 1915 (i) state plan option extend financial eligibility for these services up to the federal maximum of 300% SSI.22 These states include Idaho, Indiana, and Ohio. The remaining nine states provide Section 1915 (i) services to people with income up to 150% FPL. Under Section 1915 (i), states can provide services to (1) people who are eligible for Medicaid under the state plan up to 150% FPL, with no asset limit, who meet functional eligibility criteria; and also may cover (2) people up to 300% SSI who would be eligible for Medicaid under an existing HCBS waiver.
Nearly all of the nine states that offer the CFC state plan option expand financial eligibility for these services to people who qualify for Medicaid under an HCBS waiver. The exception is Montana. All states electing the CFC option must provide services to individuals who either (1) are eligible for Medicaid in a state plan pathway that includes nursing home services in the benefit package, or (2) have income at or below 150% of the federal poverty level (FPL), $1,699/month for an individual in 2022).23 States can choose to expand CFC eligibility to individuals who are eligible for Medicaid under an HCBS waiver, up to the federal maximum of 300% of SSI.24
Three-quarters of HCBS waivers expand income eligibility to the federal maximum (300% SSI), and nearly all waivers set income eligibility limits at or above the state’s limit to qualify for institutional care.25 A minority of HCBS waivers (15 in 5 states) limit income to 100% of SSI ($841/month for an individual in 2022) (Figure 2 and Appendix Table 3). Most waivers (217 in 46 states) use the same income limits as apply to nursing home eligibility, and another 31 waivers in seven states use income limits that are less stringent than those required for institutional care. By contrast, 19 waivers in six states (MA, MI, MO, MT, NC, TX) use income limits that are more restrictive than those required for institutional care. Notably, two of these states (MT and NC) apply more restrictive income limits than those required for institutional care in all of their HCBS waivers; the other four states do so only for certain populations. Using the same income limits for HCBS waivers and institutional care removes any potential bias in favor of institutional care, which can occur if an individual must have less income to receive HCBS than to receive institutional services.
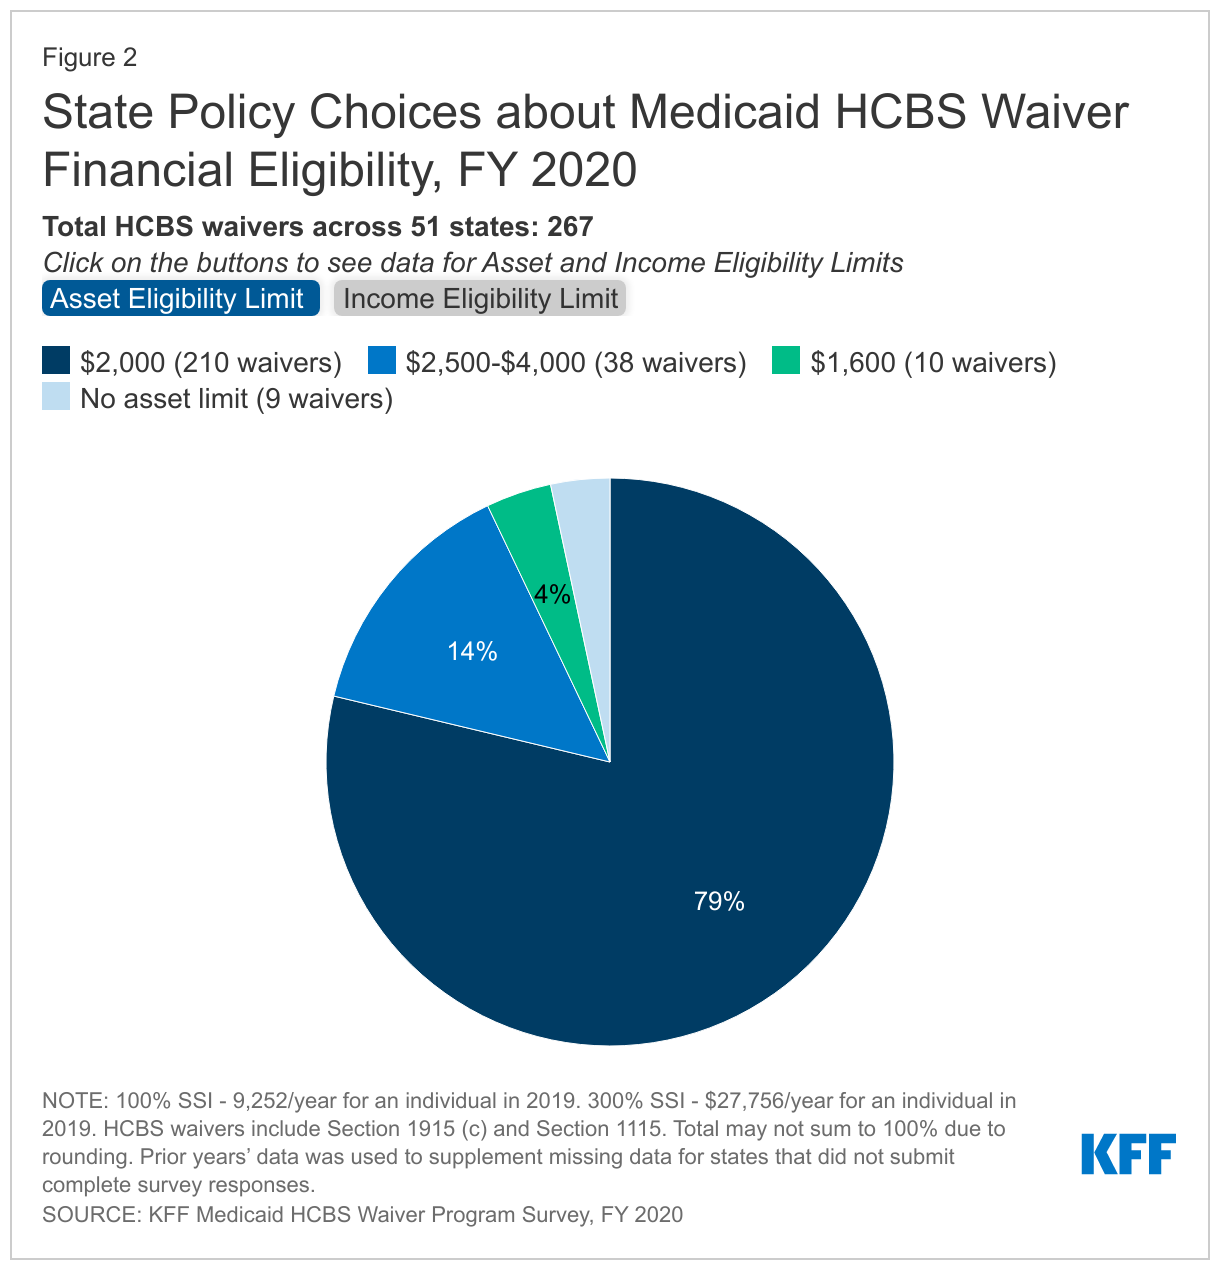
Over three-quarters of HCBS waivers apply the federal SSI asset limit of $2,000 for an individual, and almost all waivers use the same asset limit as is required for institutional care.26 A small share of waivers (38 in 11 states) have an asset limit that is higher than the SSI amount, ranging from $2,500 to $4,000 (Figure 2). Eight states apply this higher asset limit to all waiver populations (DC, MN, MS, MO, NE, NH, ND, RI), while 2 states (NY and WA) apply the higher asset limit to some waiver enrollees. Additionally, nine waivers in seven states (MA, MO, NC, ND, WV, WI) do not have any asset limit. Waivers without an asset limit most frequently target children with I/DD or individuals with mental illness. Connecticut is the only state that applies an asset limit lower than the federal SSI amount ($1,600 per individual).27 Eight waivers in six states (MA, SC, UT, WA, WV, WI) have asset limits that are higher than the limit for institutional care. Box 1 below highlights recent Section 1115 waiver activity where states are adopting or proposing waivers to expand HCBS financial eligibility to new populations who are not otherwise Medicaid eligible. Results from these demonstrations will be important to watch, with the potential for identifying promising practices that other states may adopt.
Box 1: Recent Section 1115 Waiver Activity to Expand HCBS Financial Eligibility
Several states have recently adopted or proposed Section 1115 waivers that expand HCBS to new populations not otherwise eligible for Medicaid. These waivers offer limited HCBS benefit packages delivered fee-for-service with the goal of delaying or avoiding the need for more intensive LTSS. These states include the following:
- Washington’s Tailored Support for Older Adults program, approved in 2016, creates a new eligibility pathway for people age 55 and older with income up to 300% SSI and assets up to $53,100, who meet a nursing home level of care but not do otherwise financially qualify for Medicaid.28 The state is permitted to cap enrollment. An interim evaluation of this program found high enrollee satisfaction and concluded that the program may have reduced utilization of traditional Medicaid LTSS.29
- Minnesota’s Alternative Care program, approved in 2013, expands HCBS eligibility (without an enrollment cap) for seniors who meet a nursing home level of care and have insufficient income and/or assets to pay for 135 days of nursing home care but are not otherwise financially eligible for Medicaid.30 Enrollees are subject to sliding scale cost-sharing up to 30% of their average monthly service costs.31
- Oregon’s pending waiver application would expand HCBS eligibility (without an enrollment cap) to seniors and adults with disabilities who are “at risk” of becoming eligible for Medicaid LTSS, with income up to 400% FPL and assets equivalent to six months of nursing home care.32
Waiver waiting lists
Unlike state plan services, HCBS waivers allow states to choose – and limit – how many people are served. States’ ability to cap HCBS waiver enrollment can result in waiting lists when the number of people seeking services exceeds the number of waiver slots available. Waiting lists are a function of the populations a state chooses to serve and how the state defines those populations; both factors vary among states, making waiting lists an incomplete measure of state capacity and need for HCBS and not directly comparable among states. While all states have waivers serving people with I/DD, seniors, and adults with physical disabilities, fewer states offer waivers for other target populations. Consequently, there may be a particular population in need of services, but the state does not keep a waiting list because it does not offer a waiver for that population. In addition, all states do not define the eligibility criteria for their waiver target populations in the same way. The Build Back Better Act, as passed by the House, would provide states with enhanced federal matching funds for HCBS without a time limit. This could enable states to increase access to HCBS by serving more people and reducing waiting lists.
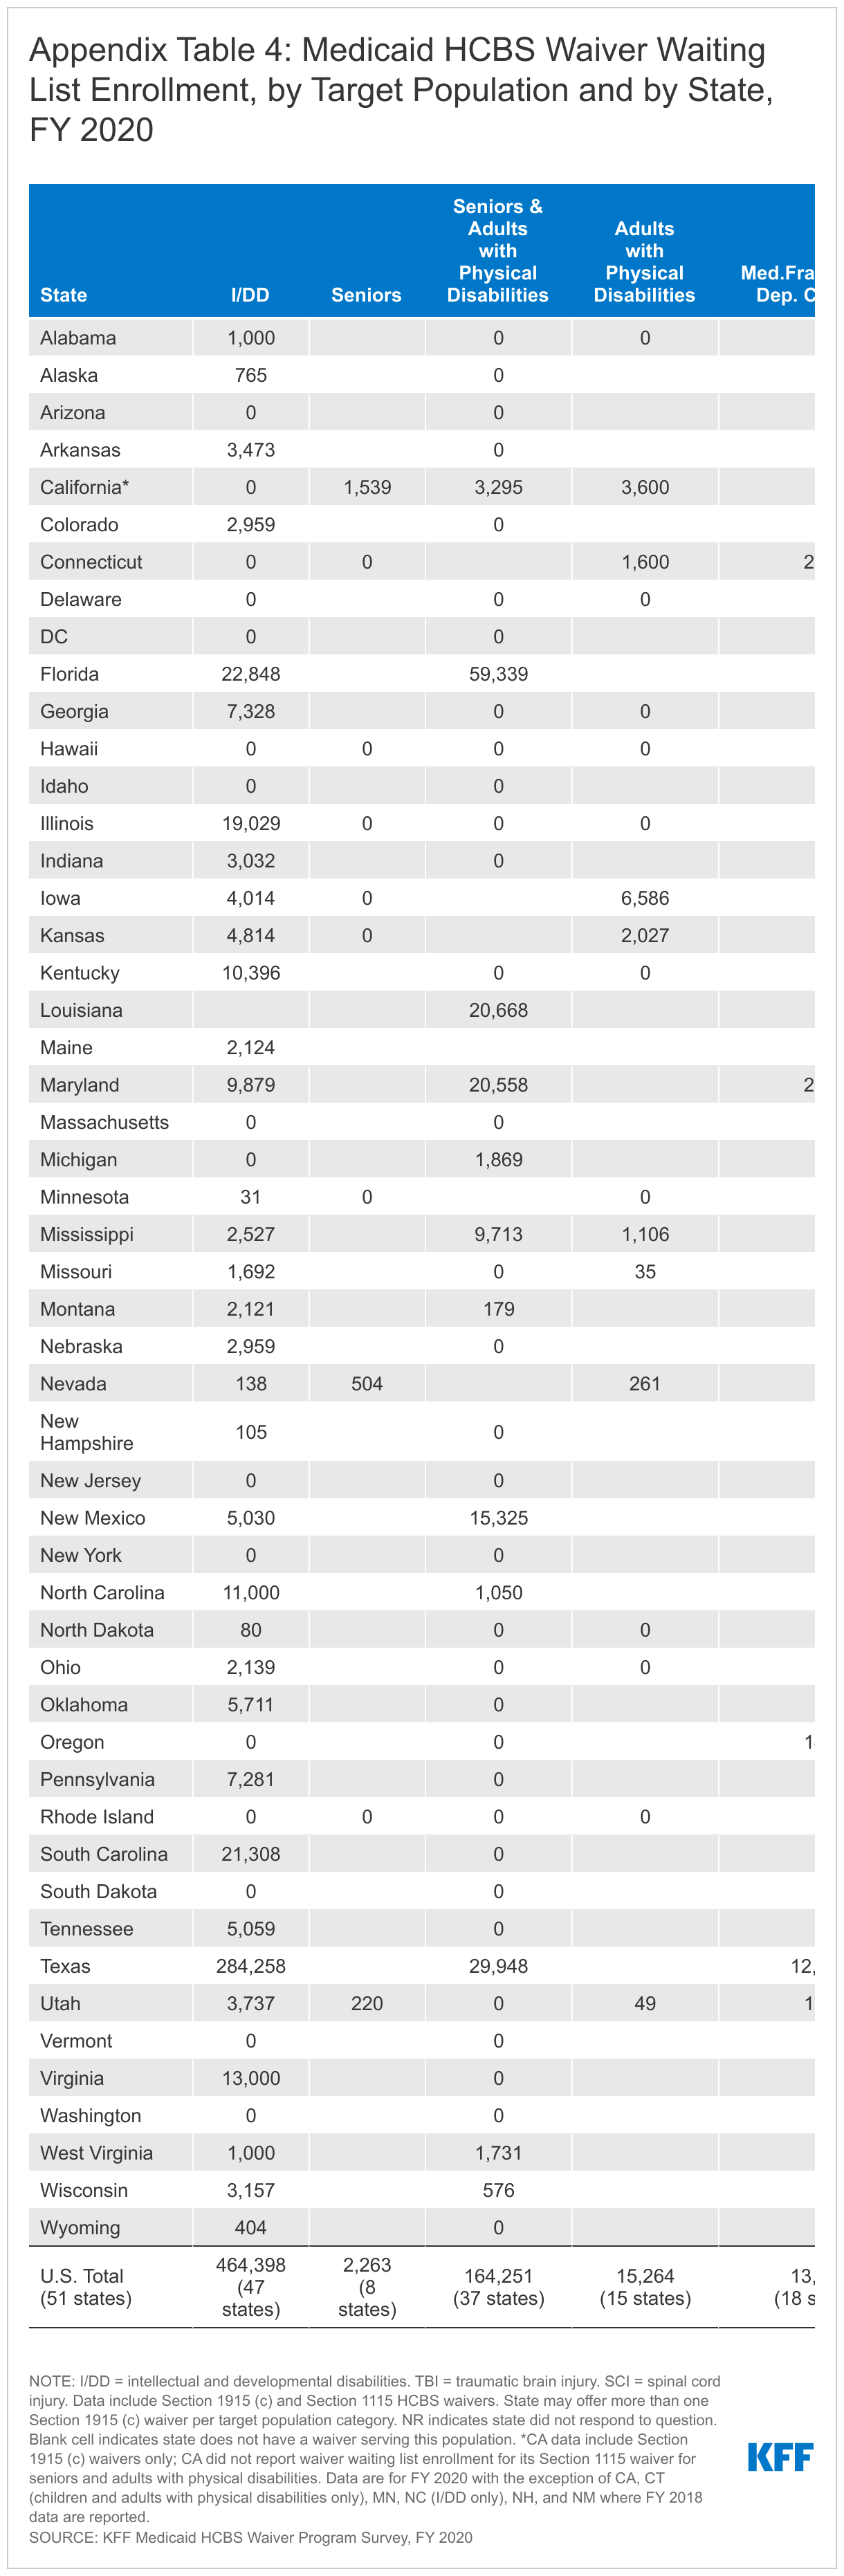
Most states (39) have a waiting list for at least one HCBS waiver,33 with over 665,000 people on HCBS waiver waiting lists nationally at any point in FY 2020.34 However, all individuals on waiting lists ultimately may not be eligible for waiver services. For example, 32 states with waiting lists screen individuals for waiver eligibility before they are placed or while they are on a waiting list, while seven states do not. Notably, the seven states that do not screen for waiver eligibility comprise over half (59%) of the total waiting list population. These states include IA, IL, MI, OK, OR, SC, and TX. Additionally, most states with waiting lists (28 of 39) allow individuals to be on more than one waiting list at a time. Waiting list enrollment remained roughly flat between FY 2019 and FY 2020 nationally, though changes in state policies about who to include on waiting lists make year to year comparisons difficult. From FY 2019 to FY 2020, enrollment was relatively stable in most states, but a few states experienced larger changes. Changes in state waiting lists policies can contribute to larger changes, making year to year comparisons difficult. For example, our survey data reflect a 10 percent drop in waiting lists nationally from FY 2018 to FY 2019, which is primarily attributed to reporting changes in Ohio and Louisiana after those states adopted changes in their assessment policies.35 Waiting list decreases do not necessarily indicate that all people who leave waiting lists are receiving services.
People with I/DD comprise 70 percent of the total waiver waiting list population (Figure 3 and Appendix Table 4). Seniors and adults with physical disabilities account for slightly more than one-quarter of total waiting lists. The remaining three percent of waiver waiting lists is spread among other populations, including children who are medically fragile or technology dependent, people with traumatic brain or spinal cord injuries, people with mental illness, and people with HIV/AIDS. People with I/DD comprise 86 percent of waiting lists in states that do not screen for waiver eligibility before placing someone on a waiting list, compared to 47 percent in states that do determine waiver eligibility before placing someone on a waiting list (Figure 3).
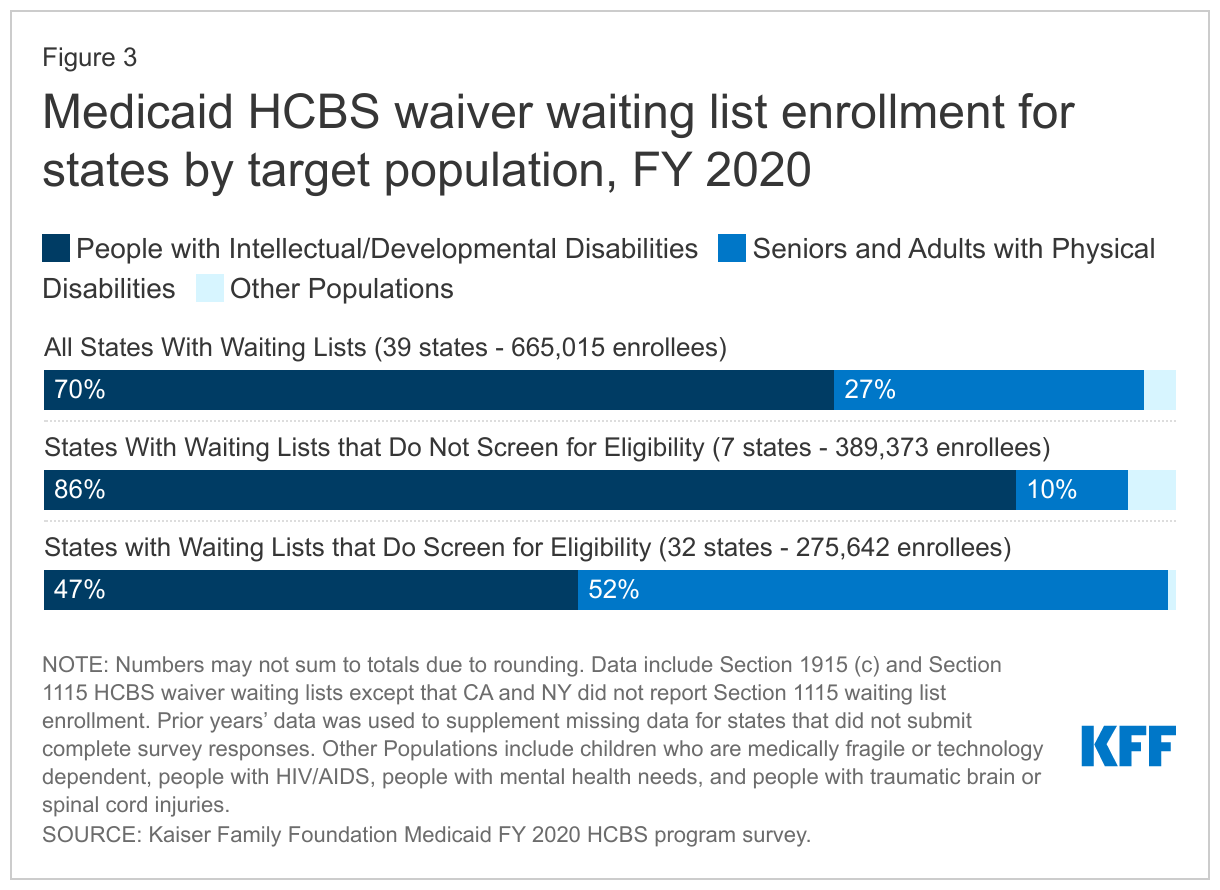
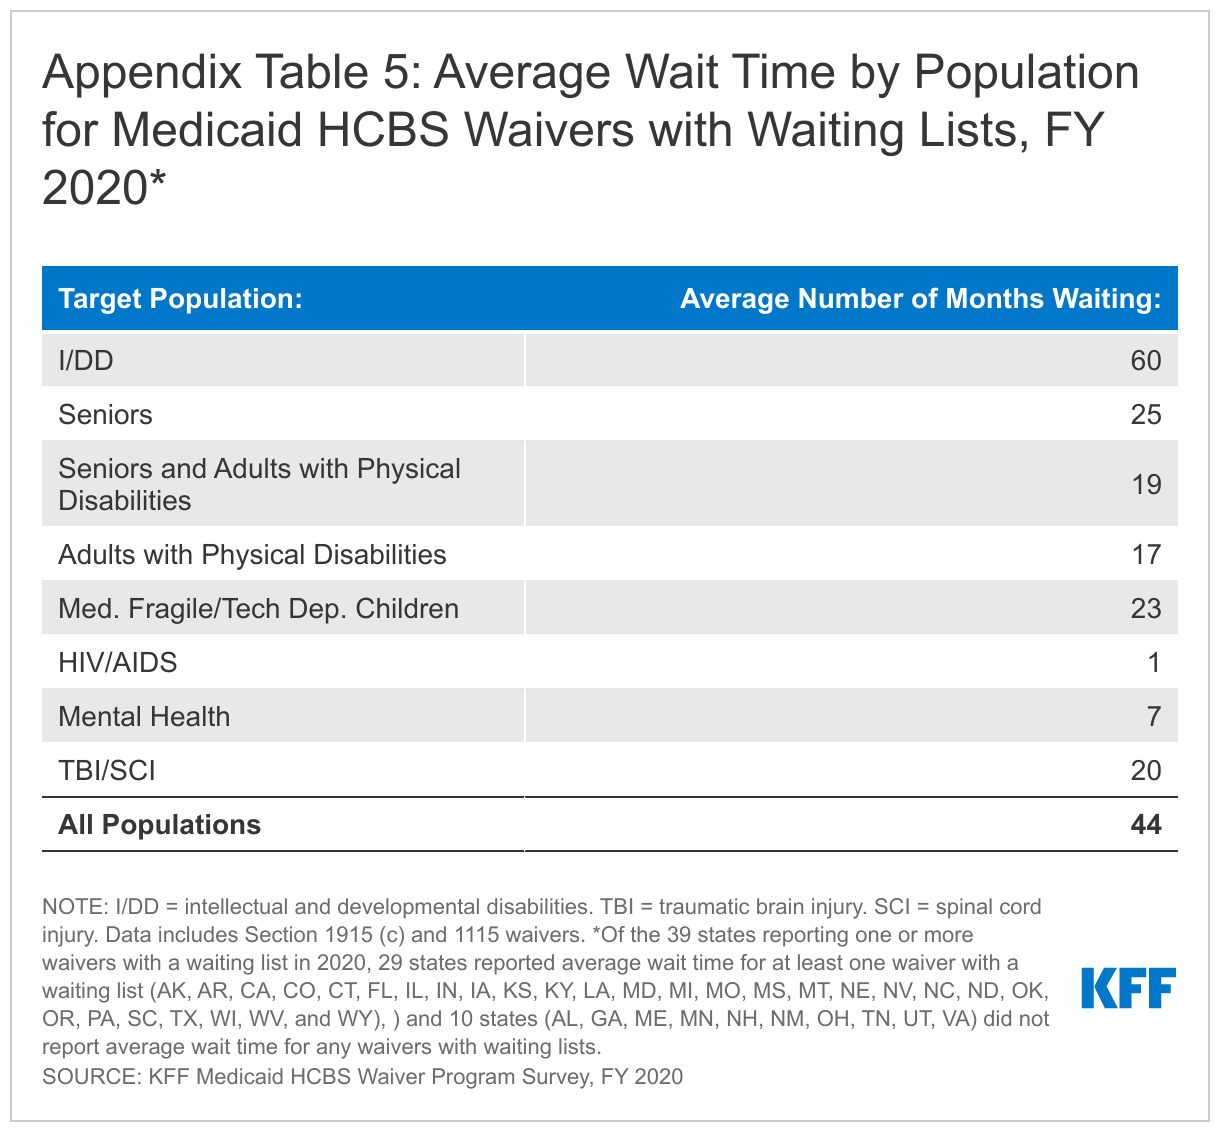
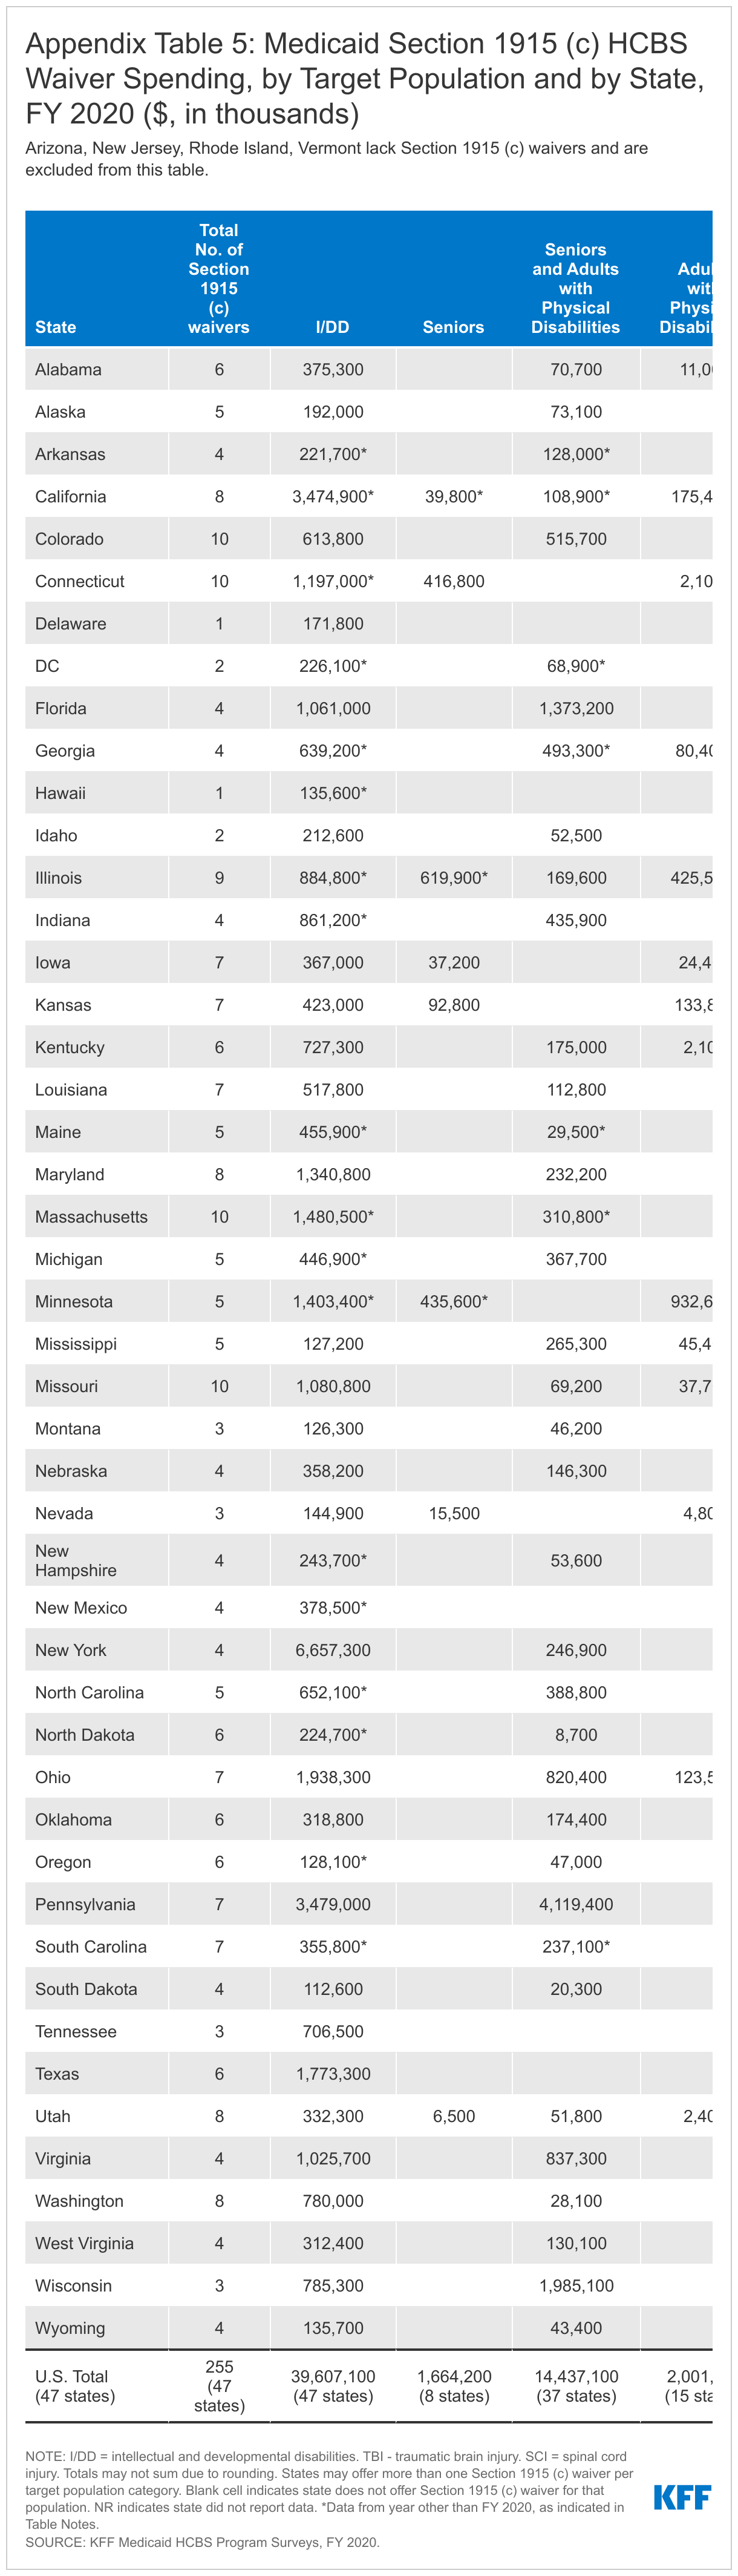
Nationally, individuals waited an average of 44 months to receive waiver services in FY 2020, with substantial variation by target population (Appendix Table 5).36 The average waiting period by population ranged from one month for a waiver targeting people with HIV/AIDS (in 1 state) to 60 months for waivers targeting people with I/DD. Historically, individuals with I/DD have had the longest waiting time for HCBS waiver services compared to all other target populations. All but two states (AL, ND) report that individuals on a waiting list are presently receiving Medicaid state plan HCBS.37 Nearly all (96%) of people on waiver waiting lists currently live in the community.
Almost all (33 of 39) states with waiting lists prioritize individuals with certain characteristics to receive services when slots become available. Twenty-five states offer waivers that give priority to individuals in crisis/emergency status, and 22 states prioritize people who are moving from an institution to the community. Fewer states prioritize individuals based on assessed level of need (16) or age (6). Twenty-two states reported other prioritization criteria including loss of caregiver support, COVID-19, length of time on the waiting list, homelessness, highest utilization review score, aging out of foster care/child services, and need for residential supports. Twenty-seven states use more than one priority group.38 Over two-thirds (28 of 39) of waiting list states have reserve capacity, meaning that some waiver slots are set aside for individuals who will be admitted to the waiver on a priority basis.39
What to Cover
States can choose to provide a variety of HCBS in their state plan benefit package. People can gain access to the state plan benefit package through Medicaid eligibility pathways based on low income (including the ACA Medicaid expansion), old age, or disability. State plan benefits are provided to all Medicaid enrollees for whom they are medically necessary.40
States also can use waivers to authorize HCBS. As described above, waiver benefit packages typically are targeted to a specific population. Eligibility for waiver services may be limited to people who qualify for Medicaid through state plan eligibility pathways, though most states also use waivers to expand financial eligibility for HCBS (discussed above).
State plan benefit packages
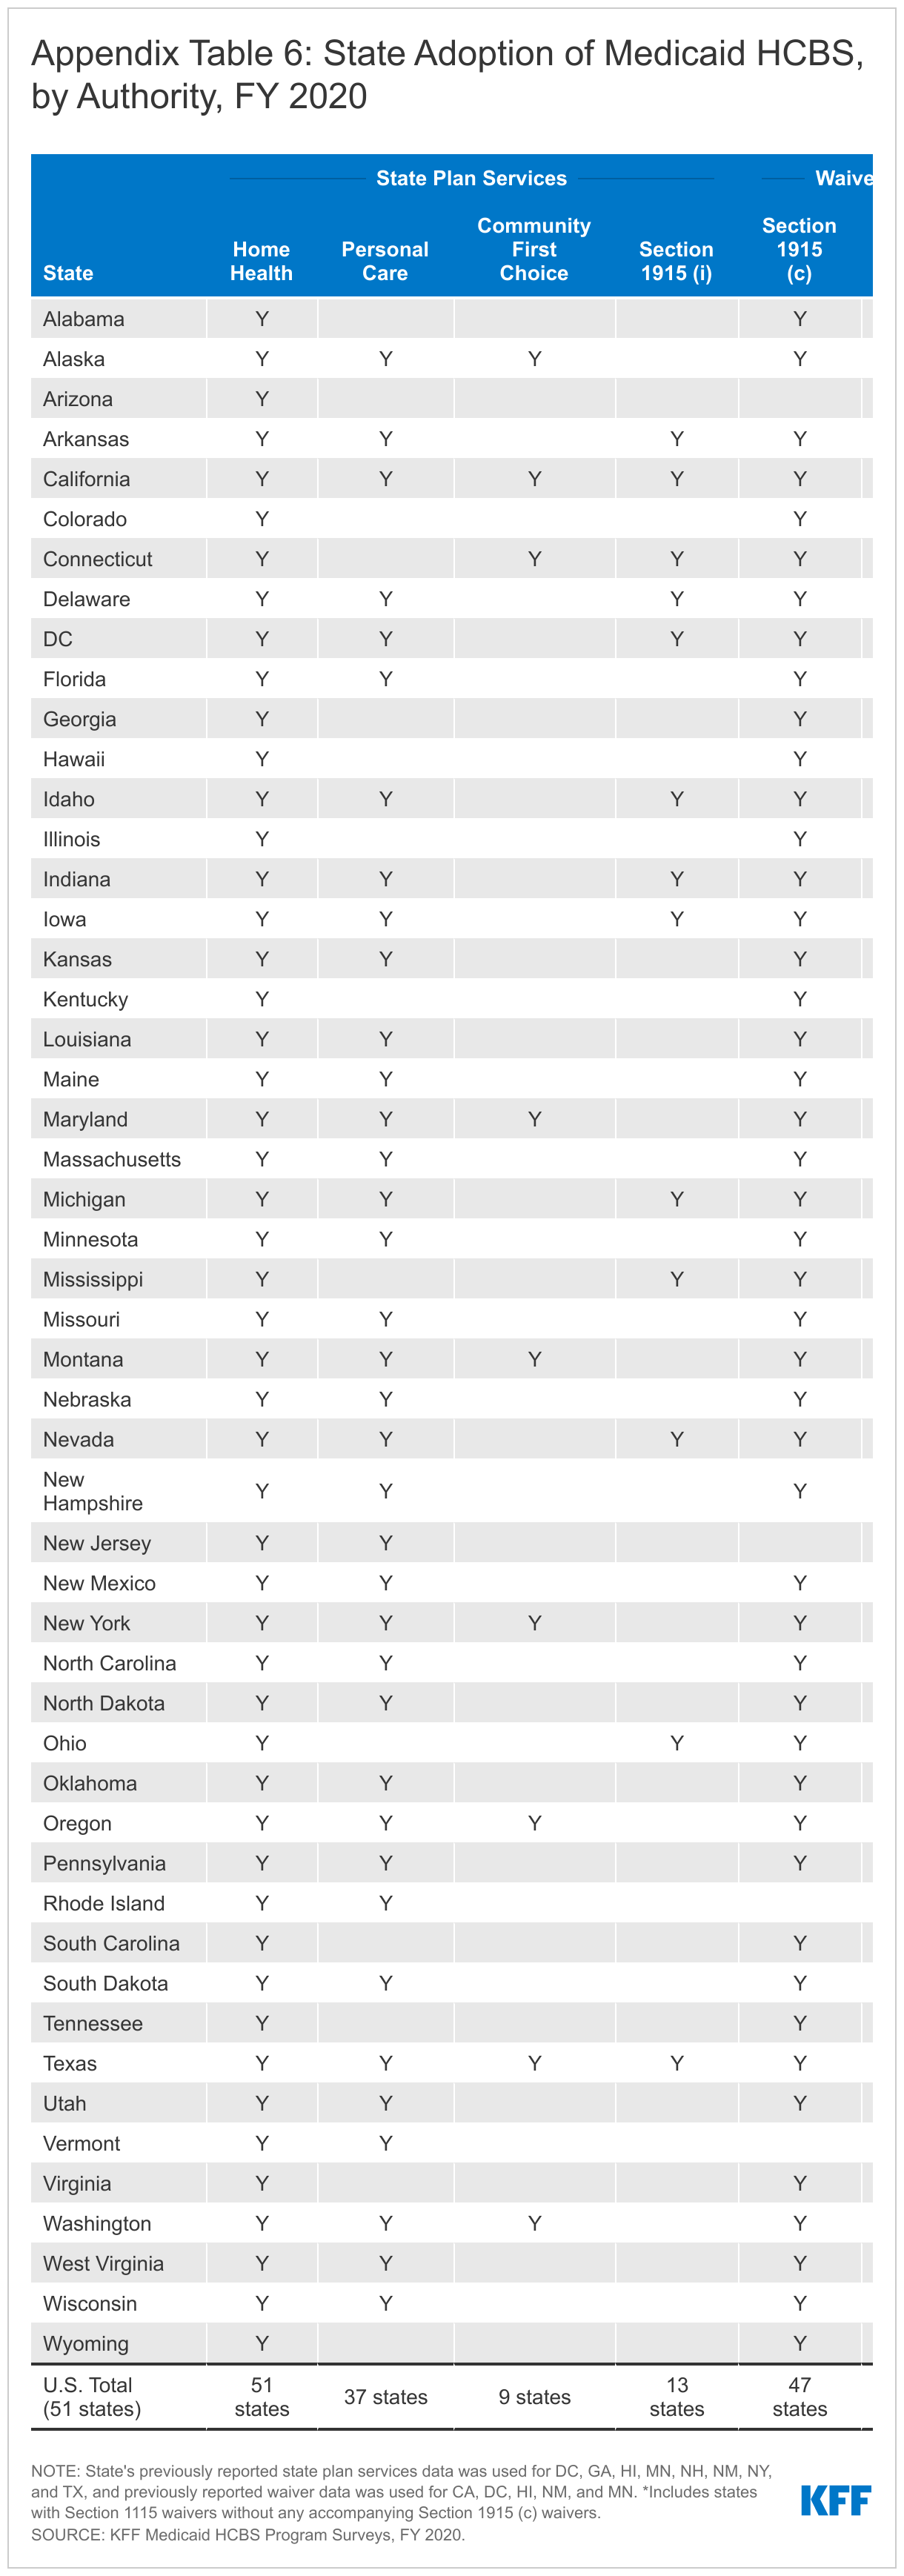
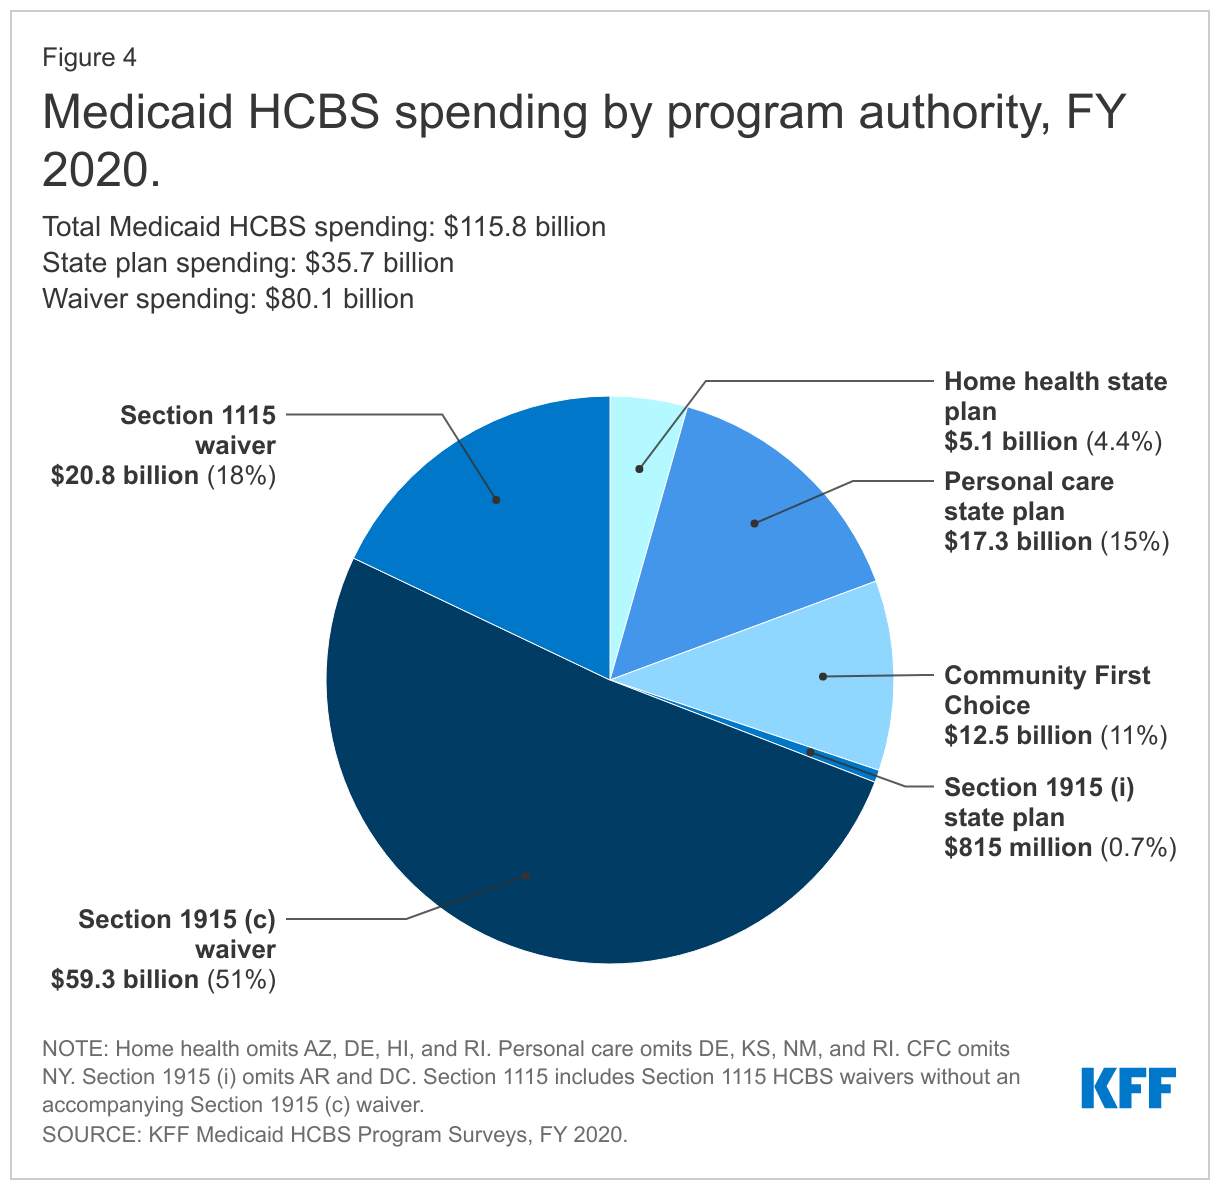
All states offer home health state plan services, the only HCBS that is not provided at state option (Figure 4 and Appendix Table 6).41 At minimum, the home health state plan benefit includes nursing and home health aide services and medical supplies, equipment, and appliances. Home health aides typically assist individuals with self-care tasks, such as bathing or eating. States also can choose to offer physical, occupational, and/or speech-language therapy services as part of their home health state plan benefit.
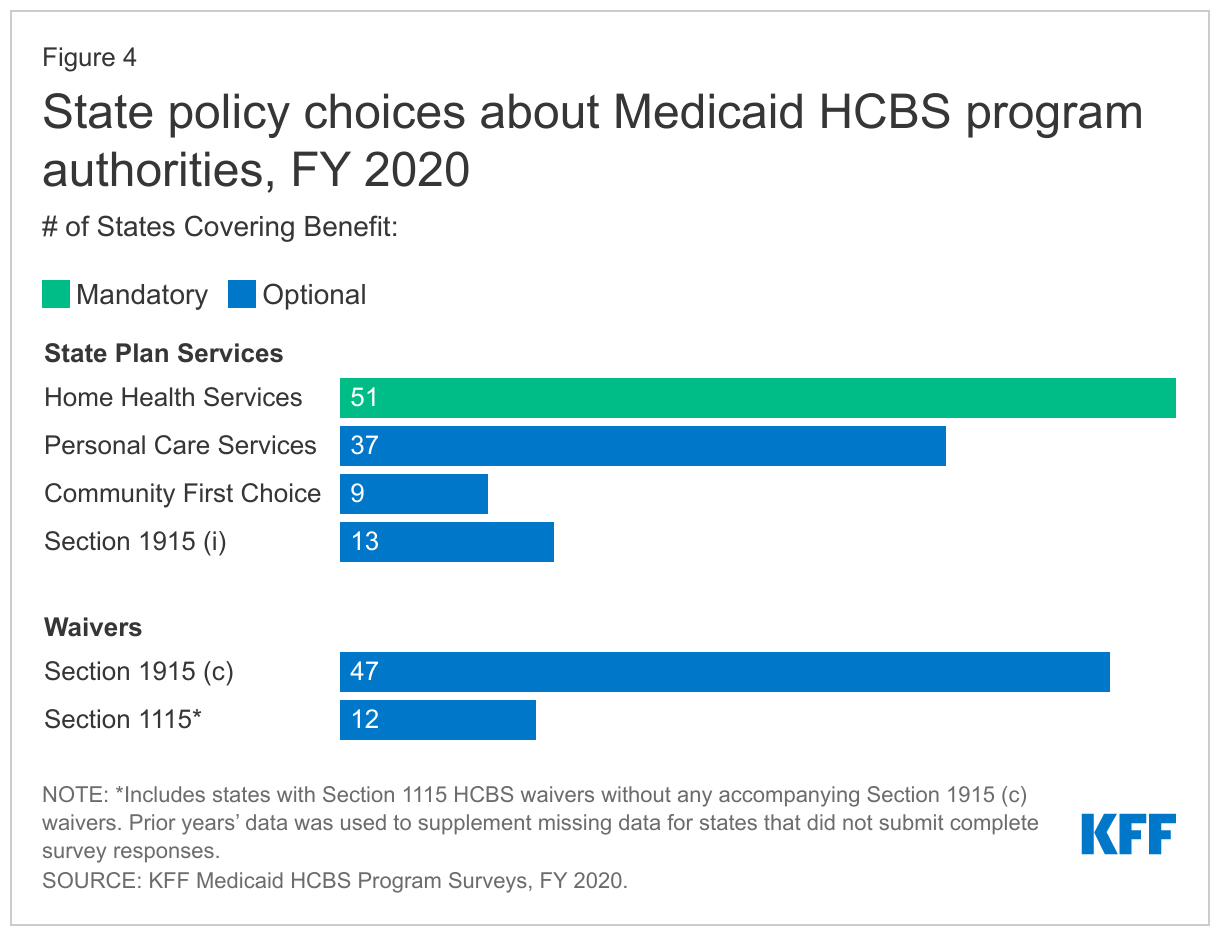
Thirty-seven states offer the personal care services state plan option (Figure 4 and Appendix Table 6).42 Personal care services assist individuals with a range of self-care tasks, such as eating, bathing, dressing, toileting, transferring; and household activities, such as light housework, laundry, meal preparation, transportation, grocery shopping, using the telephone, and medication and money management.43 Personal care services may be provided via hands-on assistance (actually performing a personal care task for a person) or cueing (providing direction while the person performs the task by themself).44
Alaska is the newest state to adopt the Community First Choice (CFC) state plan option, bringing the total number of states offering CFC services to nine (Figure 4 and Appendix Table 6).45 The CFC option allows states to provide attendant services and supports. States providing CFC services receive enhanced federal matching funds at an additional six percentage points. Four CFC states offer additional services beyond the minimum CFC benefit package. CFC services must include assistance with self-care, household activities, and health-related tasks;46 self-direction opportunities; and back-up systems.47 States also have the option to cover additional CFC services, including institutional to community transition costs48 and supports that increase or substitute for human assistance.49 Connecticut, Maryland, Oregon, and Washington cover both types of optional CFC services.50
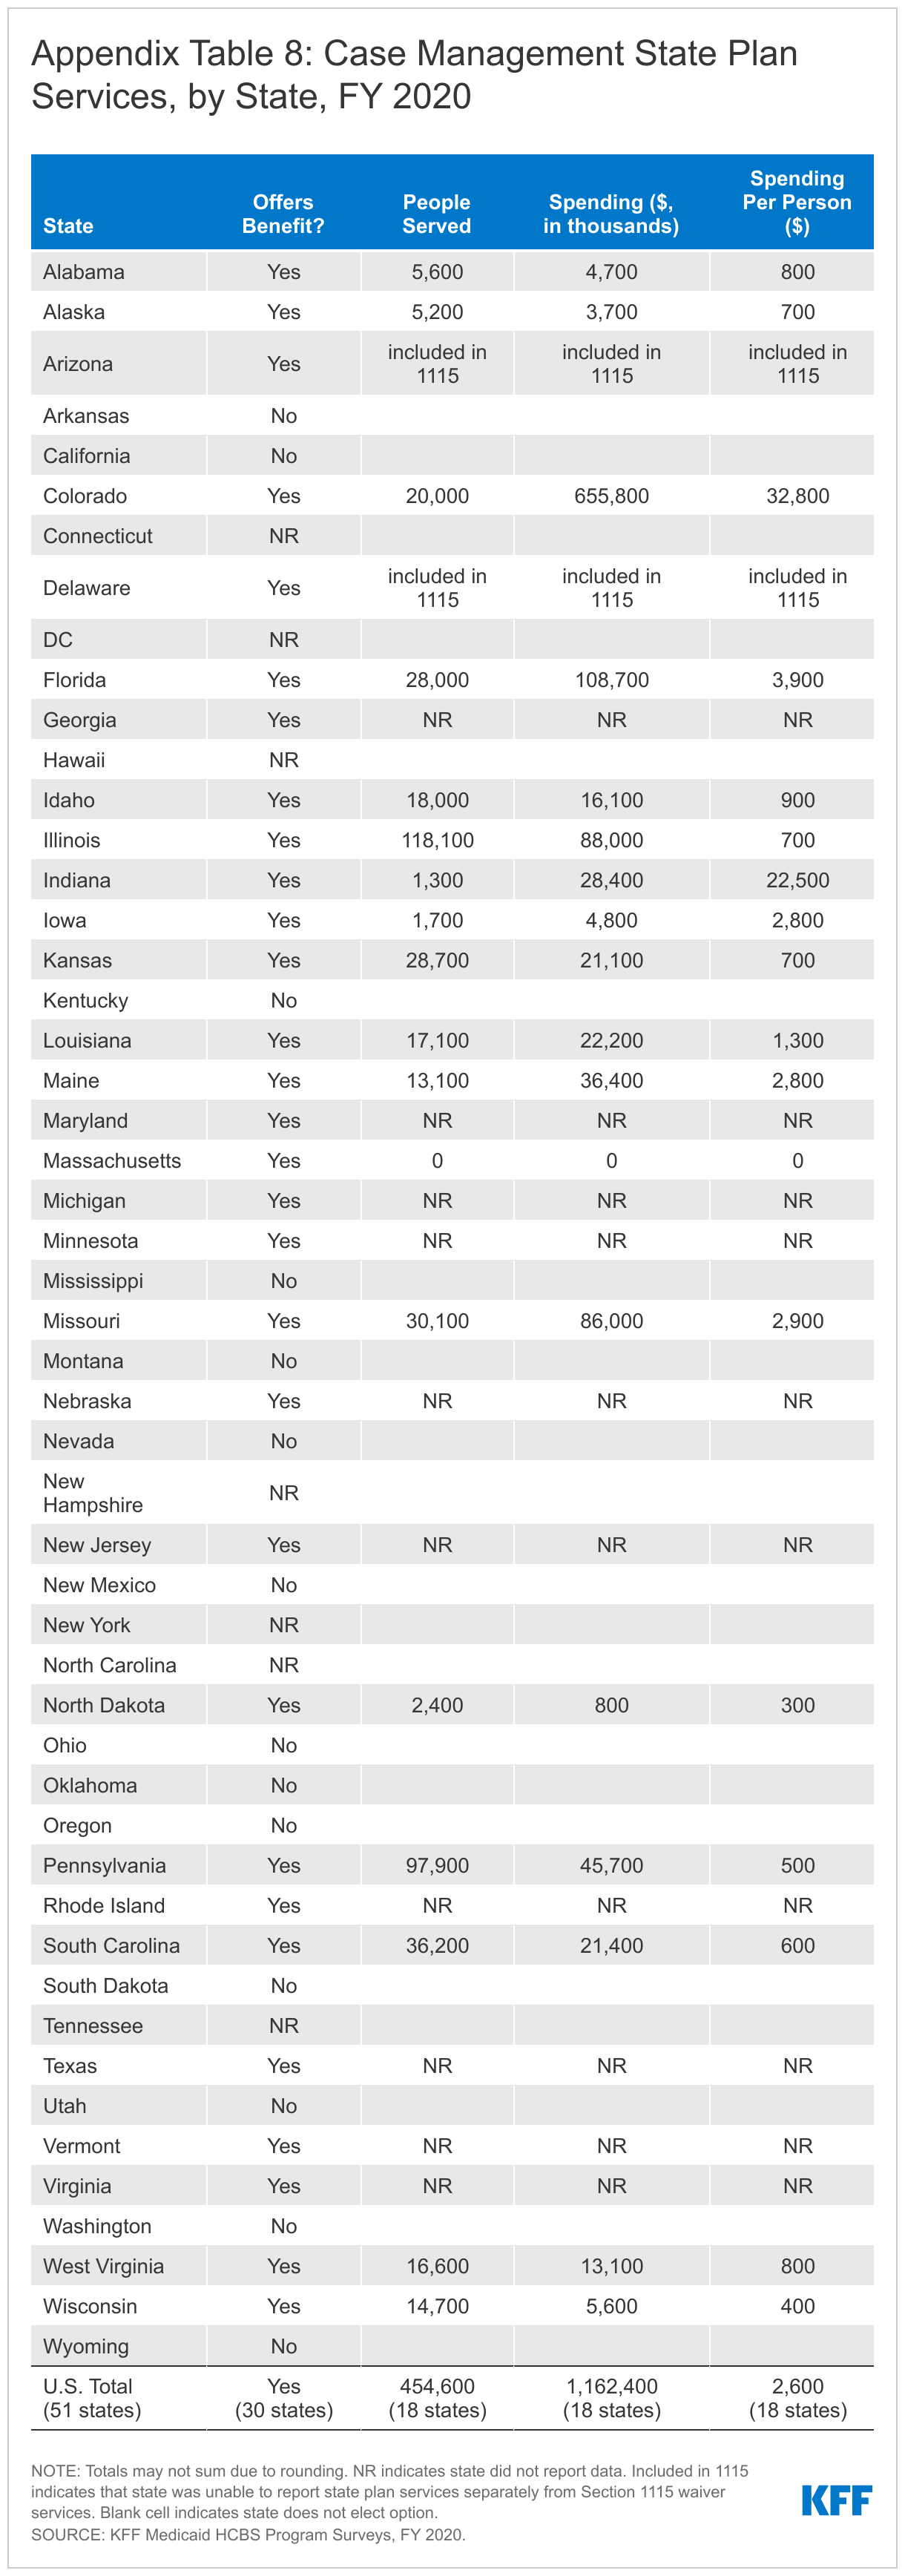
Thirteen states offer the Section 1915 (i) state plan option to provide HCBS to people with functional needs that are less than an institutional level of care (Figure 4 and Appendix Table 6).51 Arkansas is the most recent state to adopt the Section 1915 (i) option, effective March 2019.52 Case management, day services, and supported employment are the most common services offered in Section 1915 (i) benefit packages.53 Other services offered by states under Section 1915 (i) include home-based services, nursing/therapy services, other mental health/behavioral services, and equipment/technology/modifications. Box 2 explains the 12 service categories included in our survey.
Box 2: Service Categories for Section 1915 (i) and Section 1915 (c) HCBS Benefit Packages
States provide a range of different HCBS through the Section 1915 (i) state plan option and Section 1915 (c) waivers, which our survey groups into 12 categories that reflect CMS’s HCBS Taxonomy:54
(1) case management;
(2) home-based services (including personal care, companion, home health, respite, chore/homemaker, and home-delivered meals);
(3) day services (including day habilitation and adult day health);
(4) nursing/other health/therapeutic services;
(5) round-the-clock services (including in-home residential habilitation, supported living, and group living);
(6) supported employment/training;
(7) other mental health and behavioral services (including mental health assessment, crisis intervention, counseling, and peer specialist);
(8) equipment/technology/modifications (such as personal emergency response systems and home and/or vehicle accessibility adaptions);
(9) non-medical transportation;
(10) community transition services;
(11) supportive housing; and
(12) other services (such as payments to managed care and goods and services).
HCBS waiver benefit packages
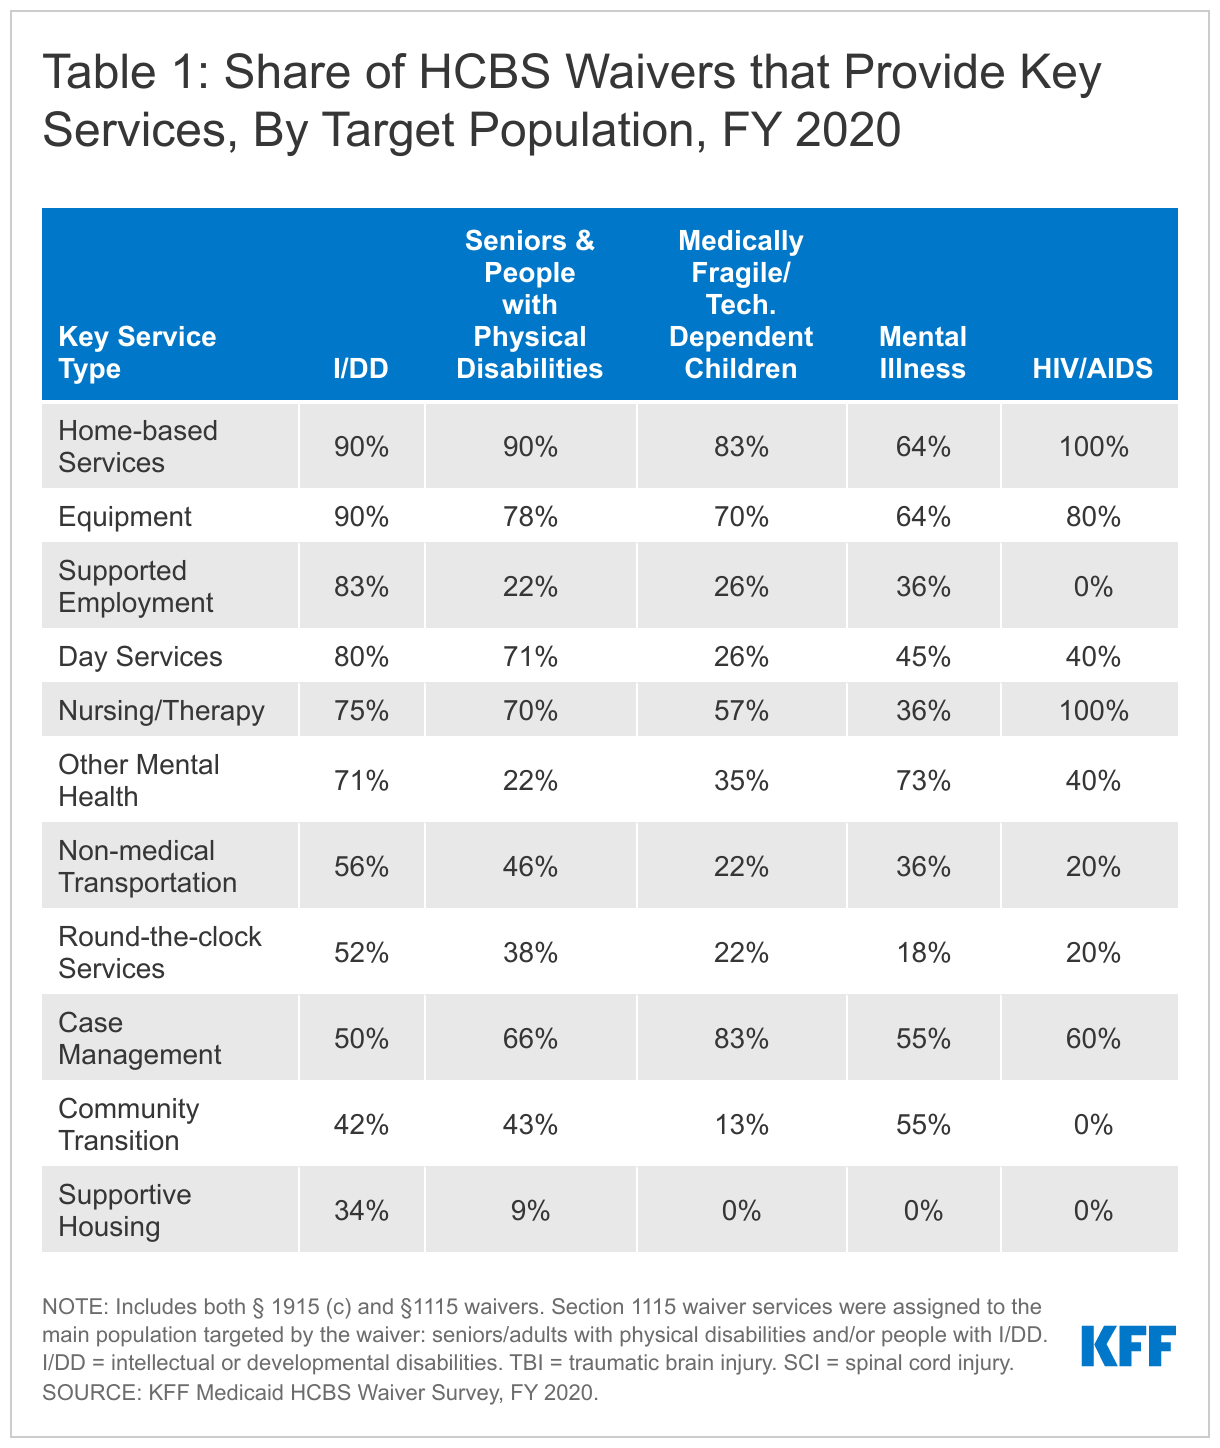
Home-based services and equipment/technology/modifications are among the most frequently offered waiver services across all states and target populations.55 Other frequently offered services across all states and waivers include day services, nursing/therapy, and case management. Additionally, some services are more common in waivers that target certain populations. For example:
- States are much more likely to offer supported employment services to individuals enrolled in I/DD and TBI/SCI waivers, compared to other waiver populations.
- Supportive housing services are twice as likely to be offered in waivers serving individuals with I/DD than any other waiver population.
- Non-medical transportation services are included in roughly half of waivers serving people with I/DD and TBI/SCI.
Box 2 above describes the 12 service categories included in our survey, and Table 1 below presents the share of waivers that cover each service category by target population.
Out-of-Pocket Costs
Medicaid cost-sharing, such as copayments, generally is limited to nominal amounts, reflecting the Medicaid population’s low income, and is subject to an aggregate cap of five percent of household income. Some populations are entirely exempt from cost-sharing, such as children under age 18 and people who are terminally ill, among others.56 Copayments for state plan services are adopted at state option, and providers cannot deny services to individuals with income below the poverty level who do not pay copayments.
Post-eligibility treatment of income (PETI) rules apply to individuals who are eligible for HCBS under a waiver.57 PETI rules require these individuals to contribute a portion of their income to their cost of care, after deducting a monthly maintenance needs allowance, recognizing that they must pay for room and board as well as other basic needs that Medicaid does not cover, such as clothing. There is no federal minimum maintenance needs allowance; instead, states may use any amount as long as it is based on a “reasonable assessment of need” and subject to a maximum that applies to all enrollees under the waiver.58 The maintenance needs allowance established by states play a critical role in determining whether individuals can afford to remain in the community and avoid or forestall institutional placement, as Medicaid does not cover room and board in the community.
Eight states require a copayment for home health state plan services,59 while one state does so for personal care state plan services.60 Home health state plan service copayment amounts range from $1 to $3.30 per visit,61 with most states (6 of 8) charging about $3. Maine charges a maximum of $3 per day for personal care state plan services.
Thirty-one states require certain HCBS waiver enrollees to contribute a portion of their monthly income to the cost of their care,62 and 15 of those states set the monthly maintenance needs allowance at the federal maximum (300% SSI) for at least one waiver.63 Two states use 100% FPL,64 while the remaining states report another amount ranging from $73 in Vermont to $1,913 in Idaho. Amounts vary within some states by waiver program and/or living arrangement. For example, the monthly maintenance needs allowance is higher for individuals in Idaho who have a rent or mortgage obligation.
How to Deliver Services
Capitated Managed Care
States have broad authority to choose the type of service delivery system for Medicaid HCBS. Traditionally, HCBS have been delivered on a fee-for-service (FFS) basis. Over the last decade, states have increasingly been delivering HCBS through capitated managed care. In capitated arrangements, the state contracts with health plans to provide covered services and coordinate care in exchange for a predetermined monthly payment. States also can choose a managed care model that does not involve risk-based capitation. Those models reimburse providers on a FFS basis and provide a separate monthly payment for care coordination services. Box 3 describes a managed FFS service delivery model, recently approved in Alabama.
Box 3: Alabama’s Managed FFS HCBS Program
In October 2021, CMS approved Alabama’s Community Waiver Program, using concurrent Section 1115 demonstration and Section 1915 (c) HCBS waiver authority.65 Under the new program, HCBS are delivered using a new managed FFS model. Support coordination services are provided by state staff or county boards. The state also is establishing preferred provider qualifications for other HCBS to limit the provider network to at least two providers for most services.
The new program serves 5 groups of people with intellectual disabilities who live in 11 counties. Four of the new groups must meet an institutional level of care and will receive HCBS through a concurrent Section 1915 (c) waiver: (1) children ages 3-13 who live with family; (2) youth ages 14-21 who live with family (or independently for those ages 18-21); (3) adults ages 22 and older who live with family, independently, or in an non-intensive supported living arrangement; and (4) children and adults ages 3 and older who cannot live with family, independently, or in a non-intensive supportive living arrangement. The 5th group will receive Section 1915 (i)-like services; this group includes adults age 22 and older with income up to 250% FPL who need HCBS but do not meet an institutional level of care and live with family or independently.
Each enrollment group is subject to a spending cap. The waiver also includes an enrollment cap, initially 500 slots across the groups, with priority to those ages 21 and older who are currently on a waiting list. The first priority group includes adults on a waiting list with goals of preserving current family or independent living arrangements and obtaining or maintaining competitive integrated employment for those under 65.
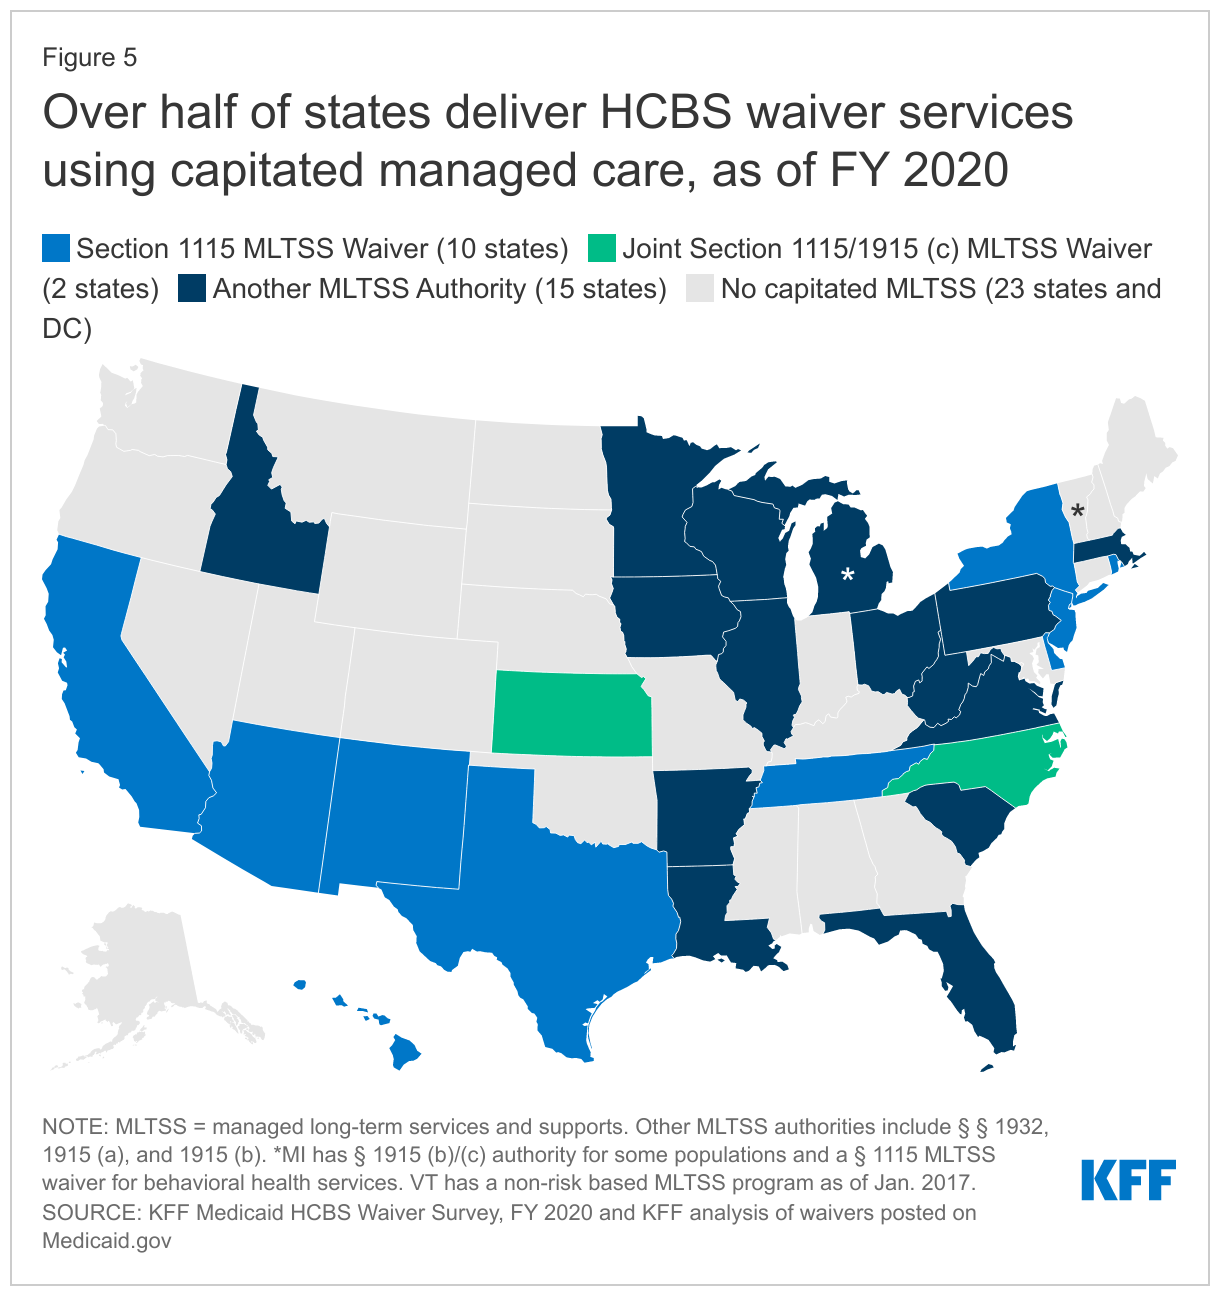
Over half of states (27) deliver some or all HCBS waiver services using capitated managed care (Figure 5).66 Capitated managed care accounts for the vast majority (75% or more) of people receiving HCBS and HCBS spending in states that have adopted that delivery system. Two of the most recently approved capitated HCBS waivers are in West Virginia and Virginia. West Virginia has a joint Section 1915 (b)/(c) waiver, effective FY 2020, providing services to children with serious emotional disorders who are at risk of institutionalization. Virginia’s Section 1115 waiver, approved in July 2020,67 includes a “High Need Supports” program, which provides Section 1915 (i)-like services including housing and employment supports using capitated managed care, with geographic and enrollment caps permitted, for state plan enrollees with a health or functional need68 and a risk factor,69 or those with a risk factor who are expected to benefit from employment support services.70
Self-Direction
Self-direction typically allows beneficiaries to select and dismiss their direct care workers, determine worker schedules, set worker payment rates, and/or allocate their service budgets. Self-direction is offered at state option for all HCBS authorities, except that self-direction opportunities must be included as part of CFC.
Nearly 437,000 individuals self-direct some or all their Medicaid HCBS waiver services,71 and another more than 400,000 individuals72 self-direct their personal care state plan services. All states except Alaska offer at least one HCBS waiver with a self-direction option, and over half (19 of 37) states offering the personal care state plan option allow self-direction of those services. By contrast, three states (DE, ID, MS) allow individuals to self-direct Section 1915 (i) services and two states (CA and VA) allow individuals to self-direct home health state plan services. States may be less likely to offer self-direction for home health services at least in part because home health services may be used by some people for shorter periods of time compared to personal care or waiver services.
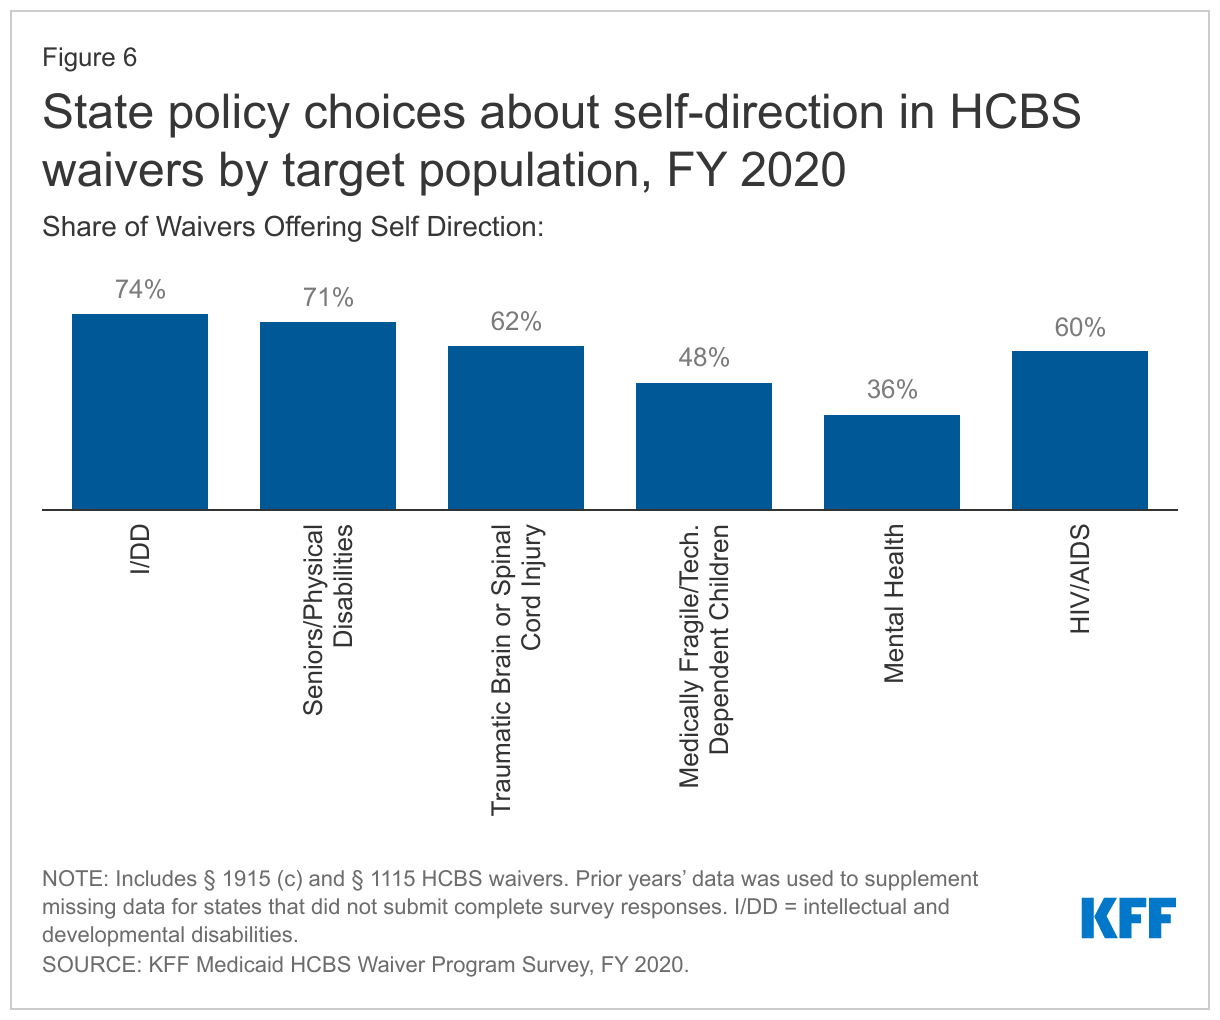
Nationally, over two-thirds of HCBS waiver enrollees self-directing services were seniors and people with physical disabilities, and about one-third were people with I/DD.73 Self-direction is offered in two-thirds of all HCBS waivers and is more likely to be offered in waivers targeting people with I/DD, seniors, and/or adults with physical disabilities compared to waivers targeting people with mental health disabilities (Figure 6).
State policies about the scope of self-direction vary.74 All states that allow self-direction, across HCBS authorities, permit individuals to select and dismiss their direct care workers. Additionally, all states that allow self-direction for HCBS waiver, personal care state plan services, Section 1915 (i), and CFC75 services also permit individuals to set worker schedules. The authority to allow individuals to set worker payment rates and/or allocate their service budgets is more common in HCBS waivers (39 states and 34 states, respectively), compared to state plan HCBS. Few states allow individuals to set worker payment rates for personal care state plan services (NJ, UT, VT), Section 1915 (i) services (ID), or CFC services (MD). Similarly, few states allow individuals to allocate service budgets for personal care state plan services (ME, NJ, VT), Section 1915 (i) services (ID), or CFC services (MD).
Covered Providers
States generally determine which types of HCBS providers to include in their Medicaid programs. Covering more provider types can help to increase access to HCBS, which is especially critical during the COVID-19 pandemic, as individuals often rely on these services for basic daily needs.
Almost two-thirds of states allow legally responsible relatives to be paid providers of HCBS waiver services, while fewer states (11) do so for personal care state plan services.76 Legally responsible relatives may include a spouse or parent. While not asked in our survey, several states (IN, MT, OH, VA) volunteered that they had adopting new policies allowing legally responsible relatives to be paid providers of direct care services using Medicaid emergency authorities during the COVID-19 PHE.77
Almost all states allow HCBS waiver enrollees to choose among agency and independent providers,78 while over one-third of states offering the personal care state plan option allow individuals to choose among agency and independent providers.79 All states offer agency-employed providers for HCBS waiver services, and all but three states (AK, DC, OR) offer independent providers for HCBS waiver services.
Electronic Visit Verification
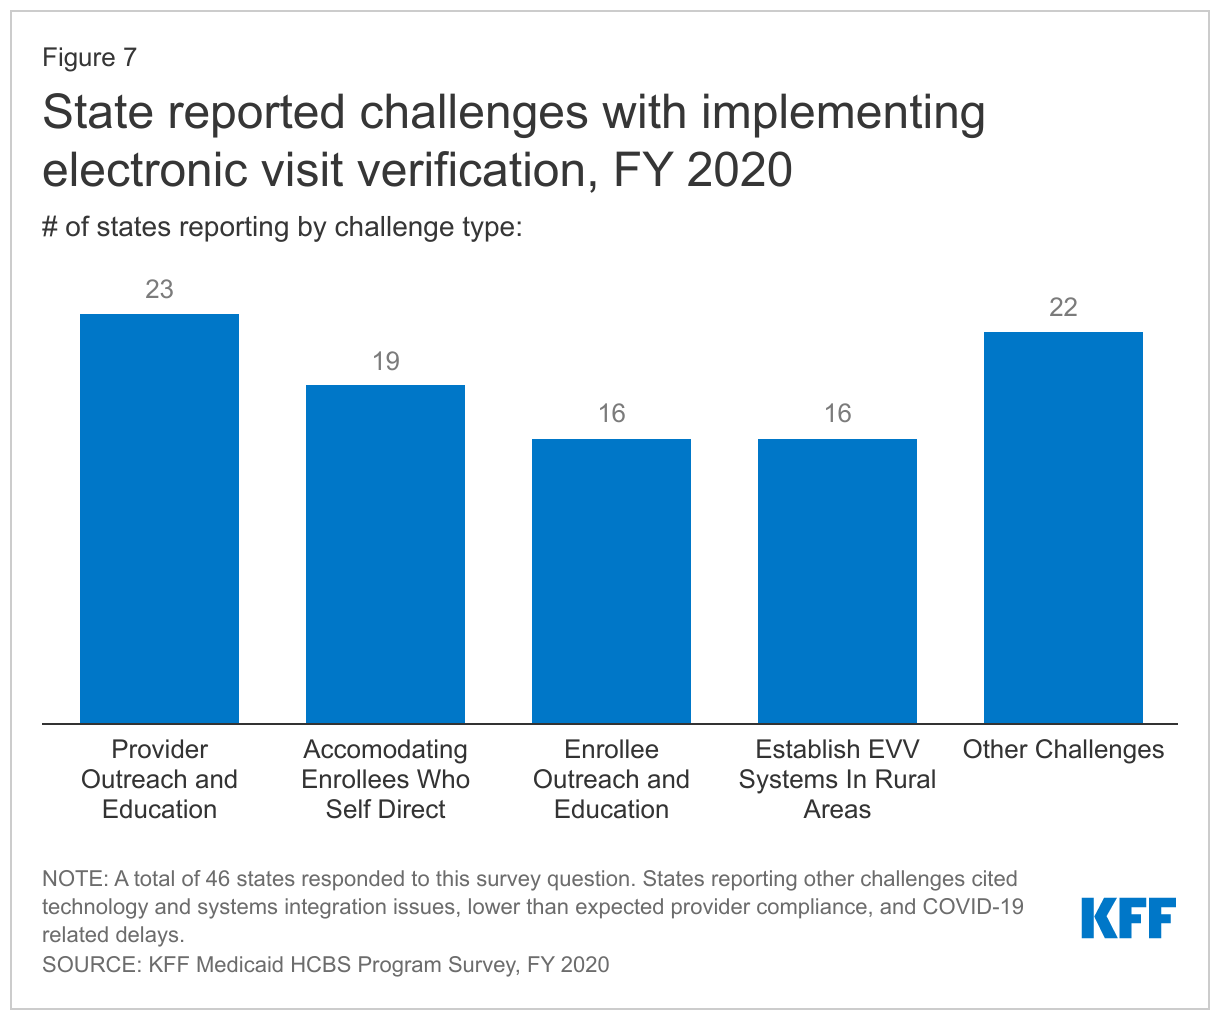
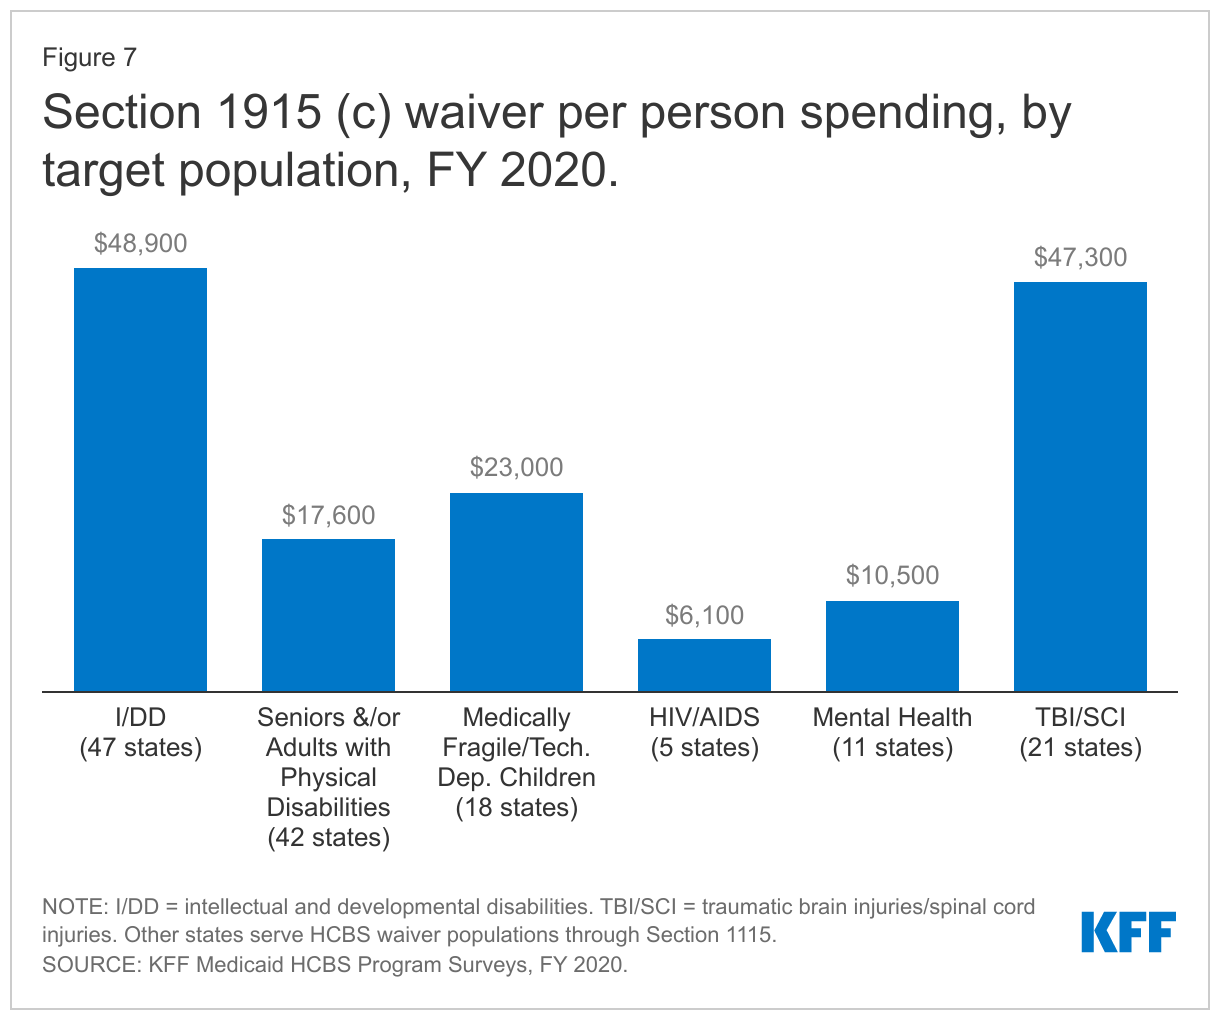
Federal law now requires states to meet federal electronic verification visit (EVV) requirements80 for Medicaid home health and personal care services that require an in-home visit by a provider. States must implement EVV for personal care services by January 1, 2021, and home health services by January 1, 2023.81 States without compliant EVV systems will receive an FMAP reduction.82 Specifically, states must electronically verify the type of service performed; the individuals receiving the service; the service date; the service delivery location; the individual providing the service; and the time the service begins and ends.83 EVV seeks to reduce unauthorized services, fraud, waste, and abuse and improve service quality.84
Over three-quarters of states report challenges with implementing EVV, with over half of states (27) facing more than one challenge.85 EVV challenges most frequently cited by states relate to provider outreach/education and accommodating enrollees who self-direct services (Figure 7). Other frequently reported challenges include enrollee outreach/education and establishing an EVV system in rural areas. Over 40 percent of states (22) responding to this question cited “other” challenges, such as technology and systems integration issues (KY, ME, OR), lower than expected provider compliance (CO, NV, TN, WI), and COVID-19 related delays (MA, MT, ND).
How Much to Reimburse Providers
States determine provider reimbursement rates, within broad federal standards. Federal law requires that rates must be “consistent with efficiency, economy, and quality of care and sufficient to enlist enough providers so that [Medicaid] services. . . are available to beneficiaries at least to the extent that those services are available to the general population.”86
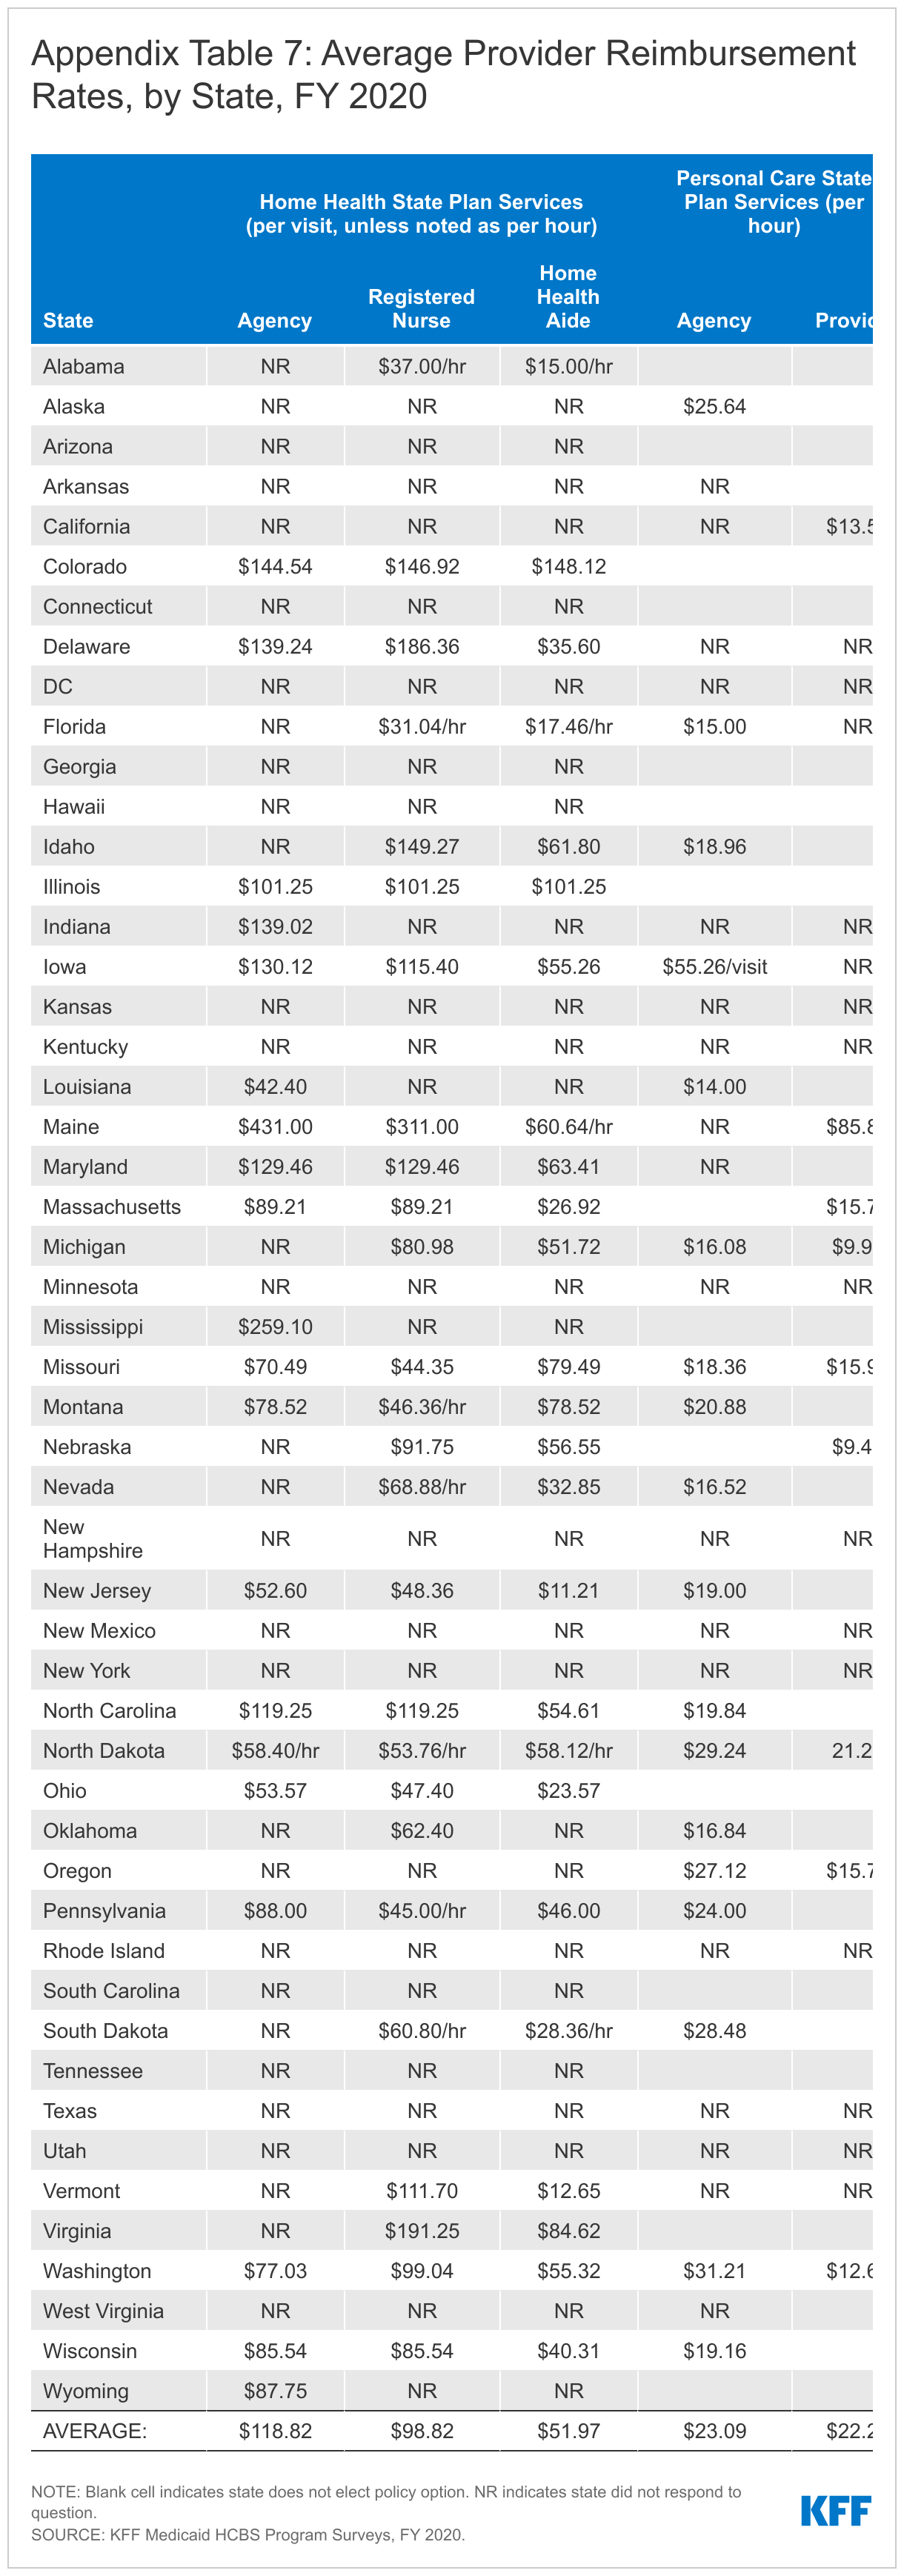
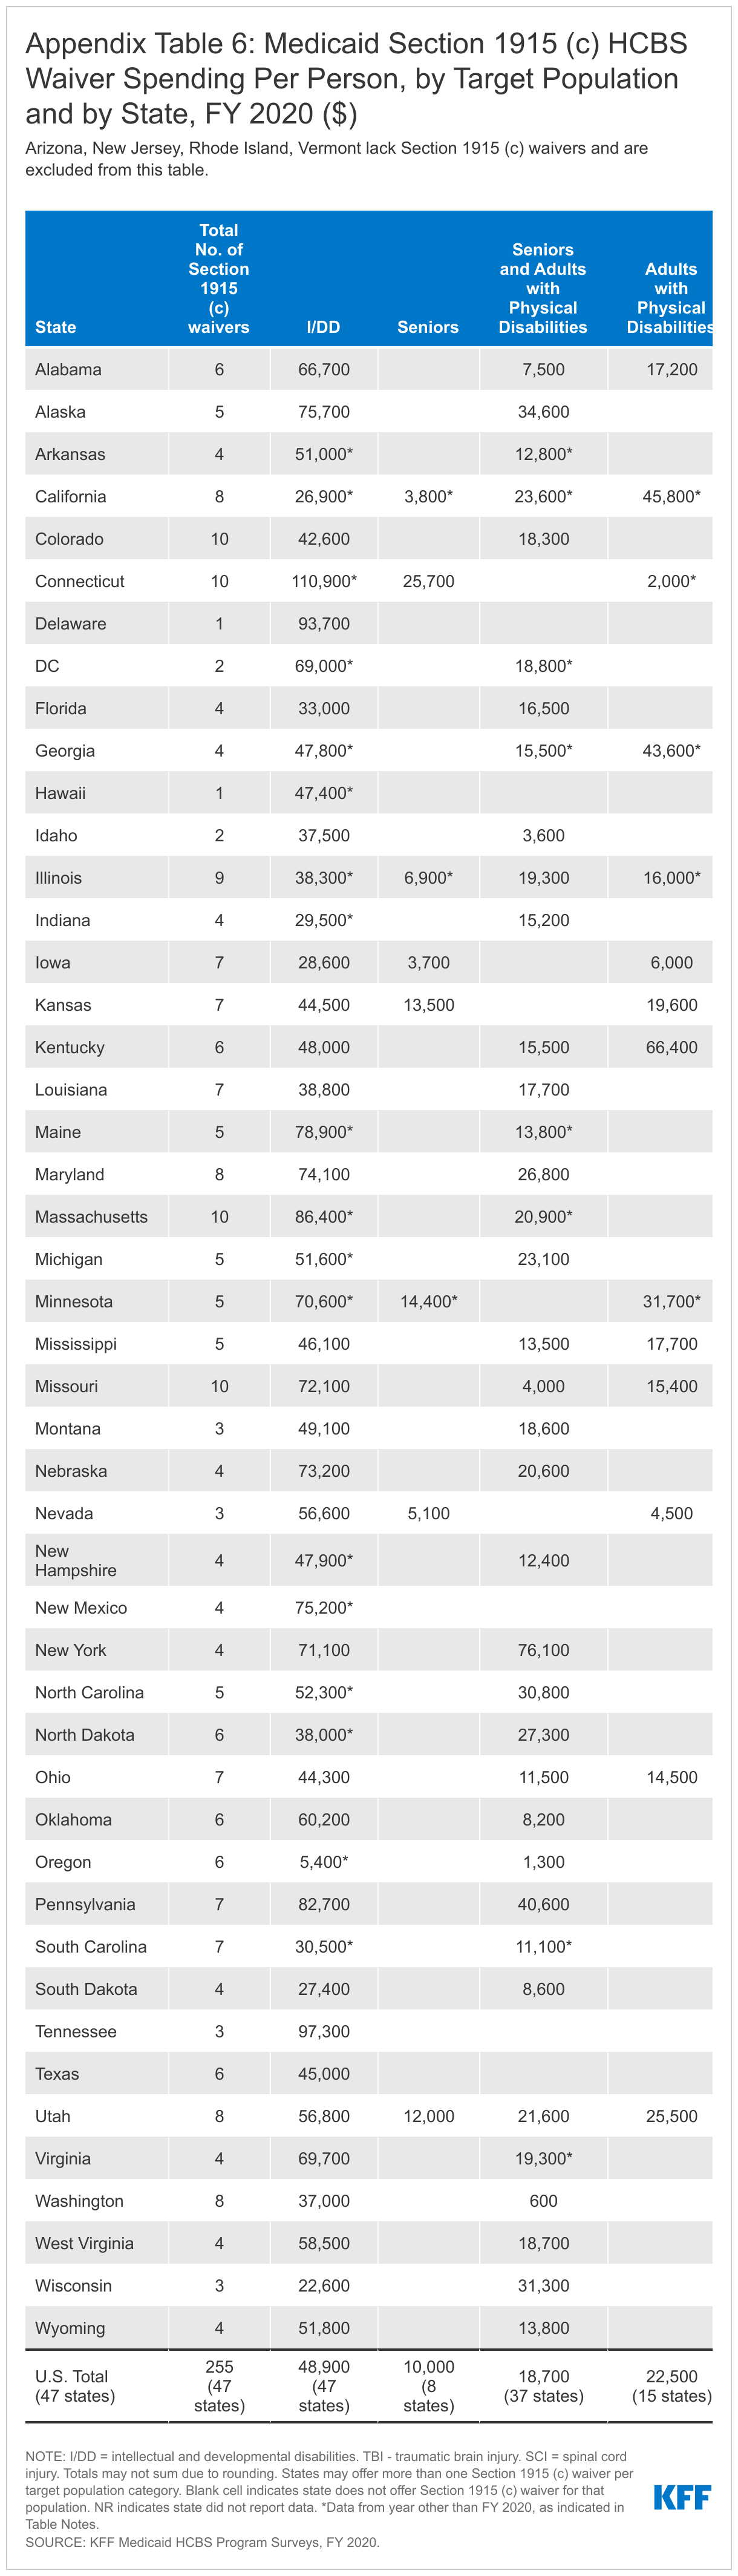
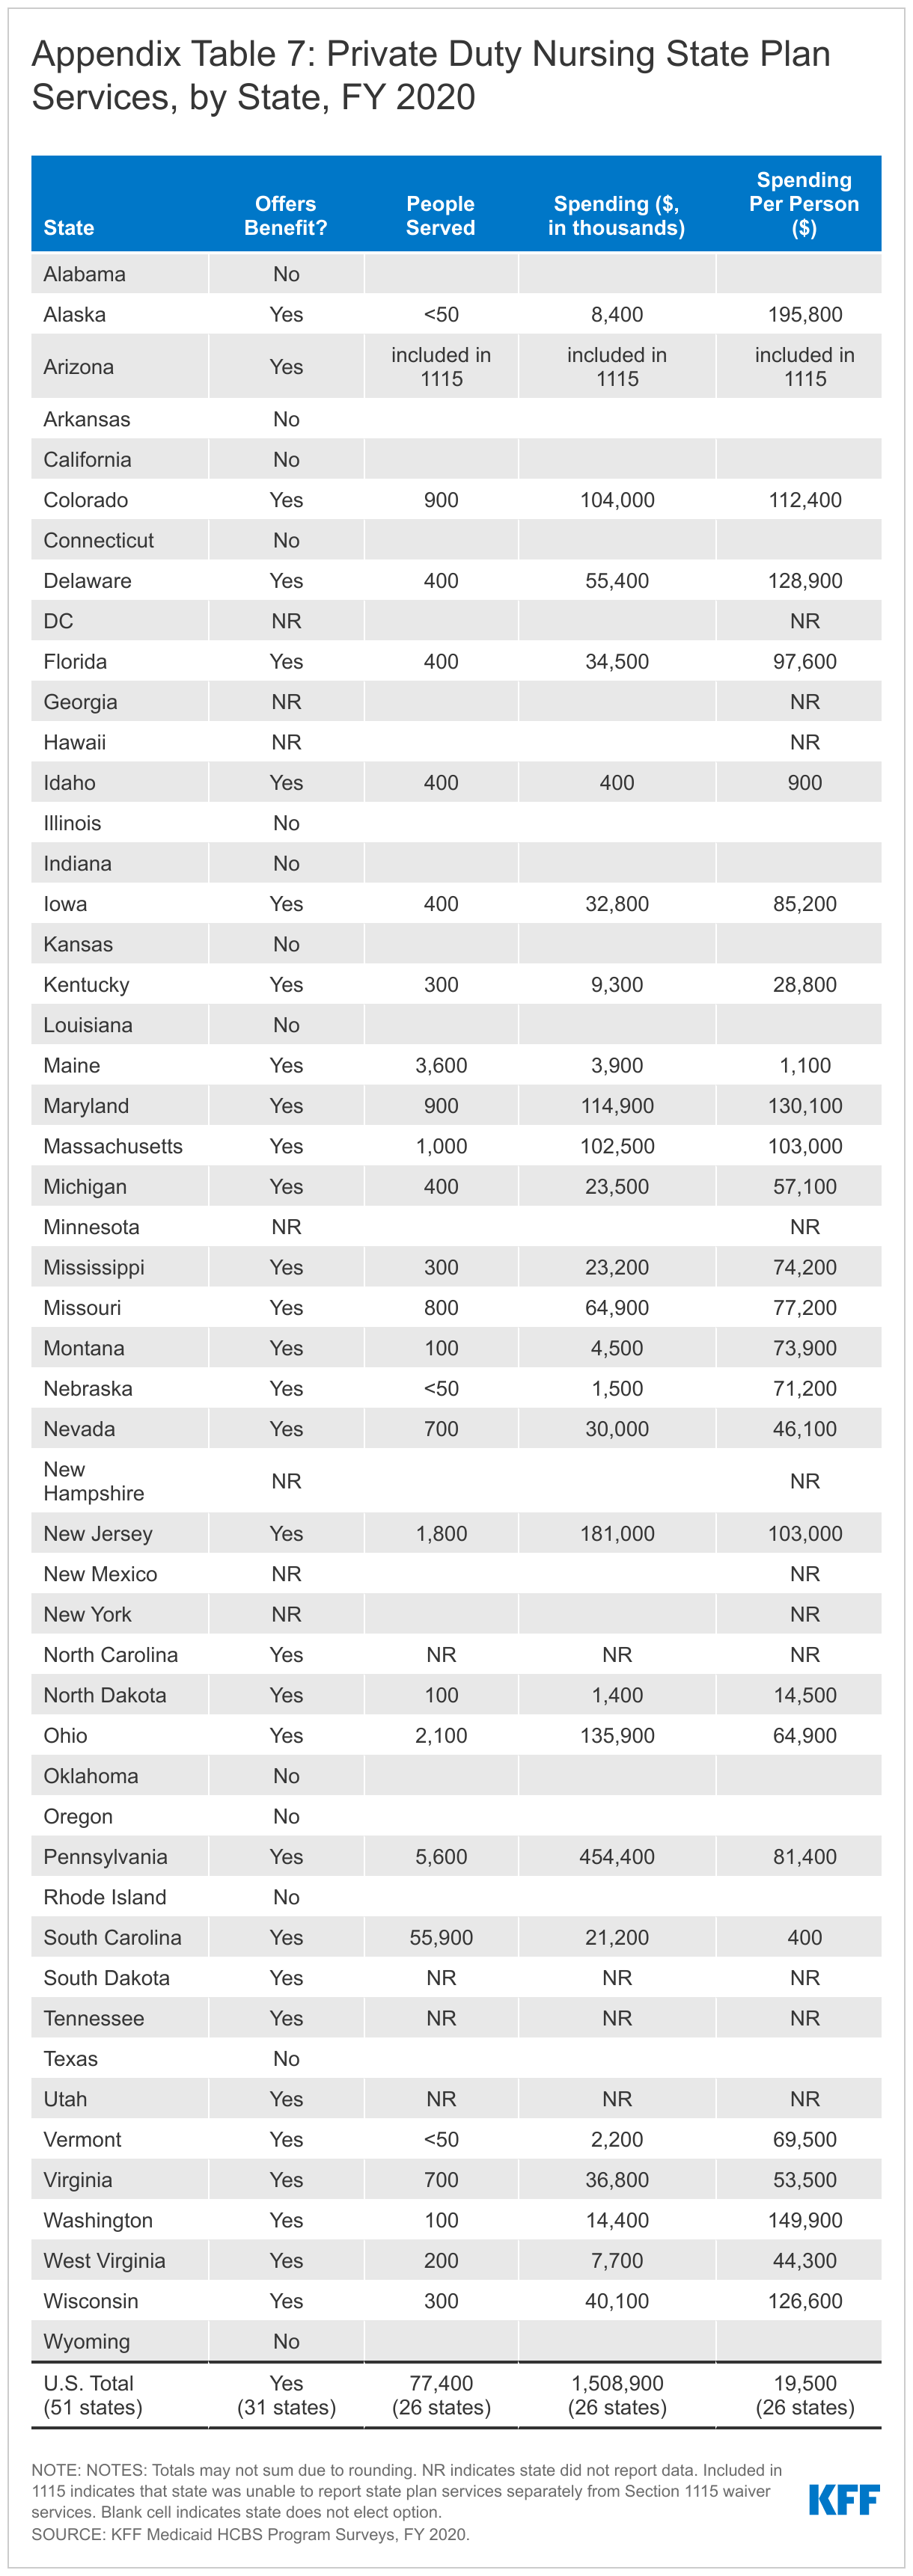
The average provider reimbursement rate for home health agency services is $118.82 per visit in FY 2020 (Appendix Table 7).87 Agency reimbursement rates account for a range of home health providers, such as registered nurses; home health aides; physical, occupational, and speech-language therapists; and social workers. In the states with direct payment or mandated rates for registered nurses providing home health services, the average rate per visit is $98.22. In the states with direct payment or mandated rates for home health aides, the average rate per visit is $51.97.88
The average provider reimbursement rate paid to personal care agencies is $23.09 per hour in FY 2020 (Appendix Table 7).89 In the nine states that report paying personal care service providers directly or mandating their reimbursement rates, the average rate is $22.24 per hour.
There is a wide range among states in reimbursement rates for both home health and personal care services. While survey response rates for these questions were low for FY 2020, these data are consistent with responses in prior survey years when response rates were higher. The survey asked states to provide the average dollar rate per visit for each provider type. States were not asked to specify whether these rates were amounts that states reimburse providers directly FFS and/or whether they were rates that health plans pay to providers for covered services. Notably, these rates are what states and/or health plans pay provider entities and may not reflect the wages received by individual direct care workers employed by the provider. Other research shows that direct care worker wages are low, with 70% of aides and personal care workers earning less than $30,000 (the 40th percentile of overall long-term care worker earnings) across care settings. Direct care workers who participated in focus groups conducted by KFF in summer 2021 universally agreed that wages were low and did not reflect job demands. They cited improving wages as the top issue for policymakers to address and emphasized the importance of any reimbursement rate increases being passed through to direct care worker wages.
Looking Ahead
Medicaid continues to be the primary source of HCBS, enabling millions of seniors and people with disabilities to remain in their homes and avoid living in nursing homes or other institutions. With long-term care facility deaths from COVID-19 recently surpassing 200,000, there is increased focus among policymakers and the public on avoiding institutional placement and expanding access to HCBS. Yet, substantial variation in HCBS eligibility and services among states continues, creating a patchwork where not everyone who needs services can access them. This variation reflects the optional nature of most Medicaid HCBS; furthermore, HCBS typically are not covered in private insurance and can be expensive for individuals to pay out-of-pocket. While waiting lists are one measure of need for HCBS, they are an incomplete measure and not directly comparable across states or over time. As the population continues to age, and the pandemic continues to create elevated risks for people who need LTSS, it may be important to establish different and more effective ways to measure unmet need.
In the short term, states have access to a temporary increase in federal funding for Medicaid HCBS through the American Rescue Plan Act (ARPA). Looking ahead, states’ ability to make longer-term systemic changes and investments to expand access to HCBS and bolster the direct care workforce is likely to be affected by whether the Build Back Better Act (BBBA) ultimately becomes law. The BBBA, as passed by the House in November 20201, includes a permanent increase in federal Medicaid matching funds for HCBS and also encourages states to assess their HCBS programs more holistically, moving away from a siloed focus on specific populations. The prospects for the bill, including HCBS funding, remains uncertain. This year’s HCBS state policy survey not only provides a snapshot of policies in place during the pandemic but also can serve as a baseline from which to measure changes in state policies in light of new federal funds available through the APRA and (if passed) the BBBA and in response to the increased focus on HCBS instead of institutional care due to the pandemic.
It will be important to understand how states use new federal funds to expand who is eligible for HCBS and which services are provided, as well as how the new funds may affect states’ and providers’ capacity to deliver services, and the extent to which new funds bolster the direct care workforce through increased payments. If passed, BBBA would make a significant investment in HCBS, which could help states address long-standing needs that were highlighted by the pandemic. States that choose to accept the new BBBA funds would have to identify HCBS access barriers and unmet needs to address with the new funds. To the extent that barriers may differ among states, states’ responses to address those barriers also may differ. Additionally, states are starting in different places in terms of the breadth of their existing HCBS programs. However, BBBA also could incentivize states to move toward some national uniformity. For example, states that accept BBBA funds would have to cover personal care state plan services, provide family caregiver supports, and adopt or expand Medicaid eligibility for working people with disabilities. These initiatives could reduce existing variation in HCBS eligibility and benefits across states.