News Release

Telehealth Continues to Account for More Than a Third of Outpatient Visits for Mental Health and Substance Use Services Well into the COVID-19 Pandemic

Published: Mar 15, 2022

A new analysis from KFF and Epic Research finds that telehealth visits for outpatient mental health and substance use services went from virtually zero percent in 2019 prior to the COVID-19 pandemic to a peak of 40% in mid-2020 – and continued to account for more than a third (36%) of such visits in the six months ending in August 2021.

The telehealth boom for mental health and substance use services far exceeds the increase recorded over the same period for other outpatient services. As a result, mental health and substance use services accounted for 39% of all telehealth outpatient visits in the six-month period between March and August 2021, about five times the share of all other outpatient visits. This reflects the tremendous increase in need for mental health services as a result of the pandemic, social distancing and ensuing economic turmoil, as well as a return to in-person visits for other outpatient care. 

The analysis examines data from Cosmos, Epic’s HIPAA-defined limited data set of more than 126 million patients from hospitals and clinics across the country. It also examines variations in telehealth use by age, gender and diagnosis.

Telehealth Has Played an Outsized Role Meeting Mental Health Needs During the COVID-19 Pandemic

Authors: Justin Lo, Matthew Rae, Krutika Amin, Cynthia Cox, Nirmita Panchal, and Benjamin F. Miller
Published: Mar 15, 2022

There has been a rapid increase in the use of telehealth thus far into the COVID-19 pandemic for both mental and physical health concerns. While many employer health plans covered telehealth prior to the pandemic, utilization of these services was relatively low, accounting for less than 1% of outpatient visits. At its pandemic peak, telehealth represented 13% of outpatient visits between March and August of 2020. As in-person care resumed, telehealth began to represent a smaller share of outpatient care (8% between March and August 2021). While many continue to envision an expanded role for telehealth in the delivery of care following the pandemic, there remains considerable uncertainty in what services will be available, where and how providers will be able to practice, how benefits will be structured, and how providers will be paid.

The COVID-19 pandemic has taken a toll on the nation’s mental health, with 3 in 10 adults in the U.S. reporting symptoms consistent with depression or anxiety disorder since April 2020. Over 20% of adults reporting poor mental health also report not receiving counseling or therapy during the pandemic. Telehealth has played a particularly significant role in meeting the need for mental health services. Thus far into the pandemic, some private payers have improved coverage for mental health and substance use, removing pre-pandemic restrictions on coverage for these services via telehealth. Similarly, Medicaid expanded coverage of telehealth services during the pandemic for mental health and substance use services. Many state Medicaid programs reported that telehealth has had particular value in maintaining or improving access to such services during the pandemic.

This analysis looks at outpatient visits during five six-month periods between March 2019 and August 2021, using data from Cosmos, a HIPAA-defined Limited Data Set of more than 126 million patients from over 156 Epic organizations, including 889 hospitals and 19,420 clinics across all 50 states. Mental health and substance use visits were identified based on the primary ICD-10-CM diagnosis code listed for the visit. We find that a year and a half into the pandemic, telehealth continues to play a significant role in providing services, particularly for mental health and substance use services.

Mental health and substance use services by telehealth has remained elevated whereas other outpatient care use by telehealth has declined

Share of outpatient visits delivered by telehealth, 2019-2021

Telehealth represented less than 1% of outpatient care before the pandemic (rounding to zero) for both mental health and substance use and other concerns. However, at its pandemic peak, telehealth represented 40% of mental health and substance use outpatient visits and 11% of other visits (during the March- August 2020 period). Since then, in-person care has returned and telehealth visits have dropped off to represent 5% of other outpatient care visits, those without a mental health or substance use claim in the March-August 2021 period. However, telehealth use has remained strong for mental health and substance use treatment, still representing 36% of these outpatient visits.

Telehealth use for mental health or substance use continues to grow as a share of all telehealth visits

Share of visits with a mental health and substance use disorder primary diagnosis, 2019-2021

Mental health and substance use visits represent a growing share of both telehealth visits and outpatient visits overall, but the trend is much more pronounced for telehealth. By the period of March-August 2021, 39% of telehealth outpatient visits were primarily for a mental health or substance use diagnosis compared to 24% a year earlier and 11% two years earlier. Among all outpatient visits (in-person and over telehealth), the share with a mental or substance use diagnosis grew from 4% in March-August 2019 to 8% during the pandemic, and has remained at 8% in March-August 2021.

This is a product of several factors, including the tremendous increase in need for mental health services as a result of the pandemic, social distancing and ensuing economic turmoil, as well as a return to in-person visits for other outpatient care.

Rural residents are more likely to use telehealth for mental and substance use disorder visits

Share of outpatient visits delivered by telehealth, by patient characteristics, March-August 2021

The adoption of telehealth varies based on the health needs of patients, their readiness and ability to adopt the technology, and the restrictions or incentives they face from payers and providers. Looking at the most recent study period (March-August 2021), a relatively high share of patients in rural areas relied on telehealth to receive outpatient mental health and substance use services (55%) compared to those in urban areas (35%). This pattern is especially pronounced in comparison to other outpatient health care services, where we observed a similar rate across urban and rural (5% vs. 6%) areas. This may be impacted by the number of rural areas which have a shortage of mental health providers.

Non-elderly adults consistently used telehealth to access mental health and substance use services

Share of outpatient visits delivered by telehealth, by age groups, 2019-2021

Early on in the pandemic (March-August 2020), outpatient services for mental health and substance use were delivered by telehealth at a similar rate among children and the elderly, and a slightly lower rate among non-elderly adults. A year later (March-August 2021), non-elderly adults were somewhat more likely to be treated via telehealth compared to kids and seniors. In the most recent period, 58% of all mental health or substance use outpatient visits, and 62% of these visits performed via telehealth, were among people in the 19-64 age group.

Telehealth use is significant across major mental health and substance use disorder conditions

Share of mental health or substance use outpatient visits delivered over telehealth by mental health or substance use condition in March-August 2021

The primary ICD-10-CM diagnosis code listed on an outpatient visit was categorized into conditions based on the Clinical Classifications Software Refined (CCSR). Major conditions were selected if there were more than 5,000 total visits (in-person and telehealth) during the March-August 2021 period. A large share of outpatient visits for major mental and substance use conditions were delivered over telehealth during this period, including for substance use disorders such as opioid-related disorders (29%) and alcohol-related disorders (29%). For mental health needs, over 1 in 3 outpatient visits were delivered by telehealth (for example, 35% and 38% of outpatient visits were over telehealth for depression or anxiety, respectively).

Discussion

How the mass adoption of telehealth affects access, cost, and quality of mental health and substance use disorder services remains to be seen. Telehealth may provide a way to improve access to mental health and substance use disorder care, particularly for people living in areas with fewer providers. Though differences in comfort with technology, digital literacy and lack of internet at home may hinder access to telehealth for some.

Payers’ and regulators’ policies governing telehealth services continue to evolve. As required under the Consolidated Appropriations Act of 2021 (CAA), and as implemented under the CY 2022 Medicare Physician Fee Schedule Final Rule, Medicare has permanently removed geographic restrictions for mental health and substance use services and permanently allows beneficiaries to receive those services at home. Also under the Physician Fee Schedule final rule, CMS will now permanently cover audio-only visits for mental health and substance use services, though only when the beneficiary is not capable of, or does not consent to, the use of two-way, audio/video technology.

States have broad flexibility to determine Medicaid coverage of telehealth services as well as providers’ licensure requirements to practice and prescribe during a telehealth consultation. States expanded Medicaid telehealth coverage in response to the pandemic, with nearly all states covering and paying parity for audio-visual and audio-only mental health and substance use disorder visits in their fee-for-service Medicaid programs as of July 2021. Many states plan to maintain all or some of these expanded telehealth policies post-pandemic, especially flexibilities for behavioral health visits. However, some states have moved to reinstate certain rules that limit telehealth use, providers’ ability to practice across state lines, and providers’ ability to prescribe medication without an in-person visit. In some other states, telehealth coverage expansions for Medicaid are tied to the COVID-19 public health emergency (PHE) and will expire with the PHE unless extended. State and federal laws regarding providers’ abilities to prescribe medication via telehealth and practice across state lines will also affect telehealth use in the future. Temporary federal policies that gave qualified providers more flexibility to prescribe controlled substances over telehealth are set to expire at the end of the PHE.

Data during the pandemic suggest there is a concerning increase in the number of individuals reporting symptoms of depression or anxiety and showing signs of substance use disorder. Many employers have expressed concern about the availability of mental health providers in their plan network. Given the increased need for services and concerns about the availability of mental health and substance use care providers, some payers may look to bolster access to these services through telehealth.

As policy makers continue to look at how to regulate and pay for telehealth services, it is important to consider opportunities for patient choice so that telehealth is not necessarily given as the only option for those looking for care. Additionally, the Substance Abuse and Mental Health Services Administration (SAMHSA) has called for refining clinical guidelines for tele-mental health services, including broader adoption of telehealth for mental and substance use disorders. In particular, how laws affecting prescribing patterns for mental health and substance use therapies are devised after the COVID-19 public health emergency ends may influence the long-term use of telehealth for mental health and substance use disorders.

Justin Lo is with Epic Research. Matthew Rae, Krutika Amin, Cynthia Cox, and Nirmita Panchal are with KFF. Benjamin F. Miller is with Well Being Trust.

Methods

This analysis was done using Epic’s Cosmos dataset, a HIPAA-defined limited data set of electronic health records from over 150 Epic organizations. Estimates in this report are based on this population and not weighted to be nationally representative. The analysis used data on outpatient visits for 94 data contributors to Cosmos from March 1, 2019 through August 31, 2021 and was analyzed in 6-month periods. Mental health and substance use services delivered by third-party vendors may not be included.  Organizations were then excluded if they had software go-lives or mergers during the study time period, had multiple weeks of missing data, or showed discrepancies. Mental health and substance use visits were identified based on the primary ICD-10-CM diagnosis code listed on the outpatient visit. Primary diagnosis codes were then grouped based on the Agency for Healthcare Research and Quality (AHRQ) Clinical Classifications Software Refined (CCSR) grouping. Rural patients are those who do not reside in a core based statistical area (CBSA).

Half of Admissions in the Large Group Market Are Paid Above 150% of Medicare Rates, Excluding Maternity Admissions

Published: Mar 11, 2022

Rising health care prices have led premiums and deductibles for employer-sponsored coverage to grow faster than wages and general inflation, creating affordability challenges for employers and employees. One proposal to address the high prices paid by private insurers is to cap these prices at a multiple of Medicare rates. States, including Montana and Oregon, have adopted this approach for certain providers under their public employee health plan. In Washington state, the public option in the individual market ties payments to a percent of Medicare rates. This brief considers the potential implications for inpatient admissions and spending of applying a price cap to all private insurance hospital payments in the large employer group market.

In this analysis, we look at in-network payment rates for inpatient hospital stays, other than maternity/newborn admissions, among large employer plans relative to Medicare payment rates. To do so, we analyzed data from the 2018 IBM MarketScan Commercial Claims and Encounters Database that includes health claims from a sample of 18 million non-elderly people, representing about 82 million covered lives in large employer plans. Specifically, we examined the share of non-maternity inpatient hospital admissions and associated spending among large employer plans for in-network inpatient admissions paid above various ratios of private-to-Medicare rates. We then focus on 15 common types of admissions (classified using diagnosis related groups, or DRGs), representing more than a quarter of all non-maternity inpatient spending in the large group market (see methods for additional information). This analysis is intended to be illustrative and does not assess potential spillover effects on volume, access, or quality of a policy that caps prices for the privately insured.

Findings

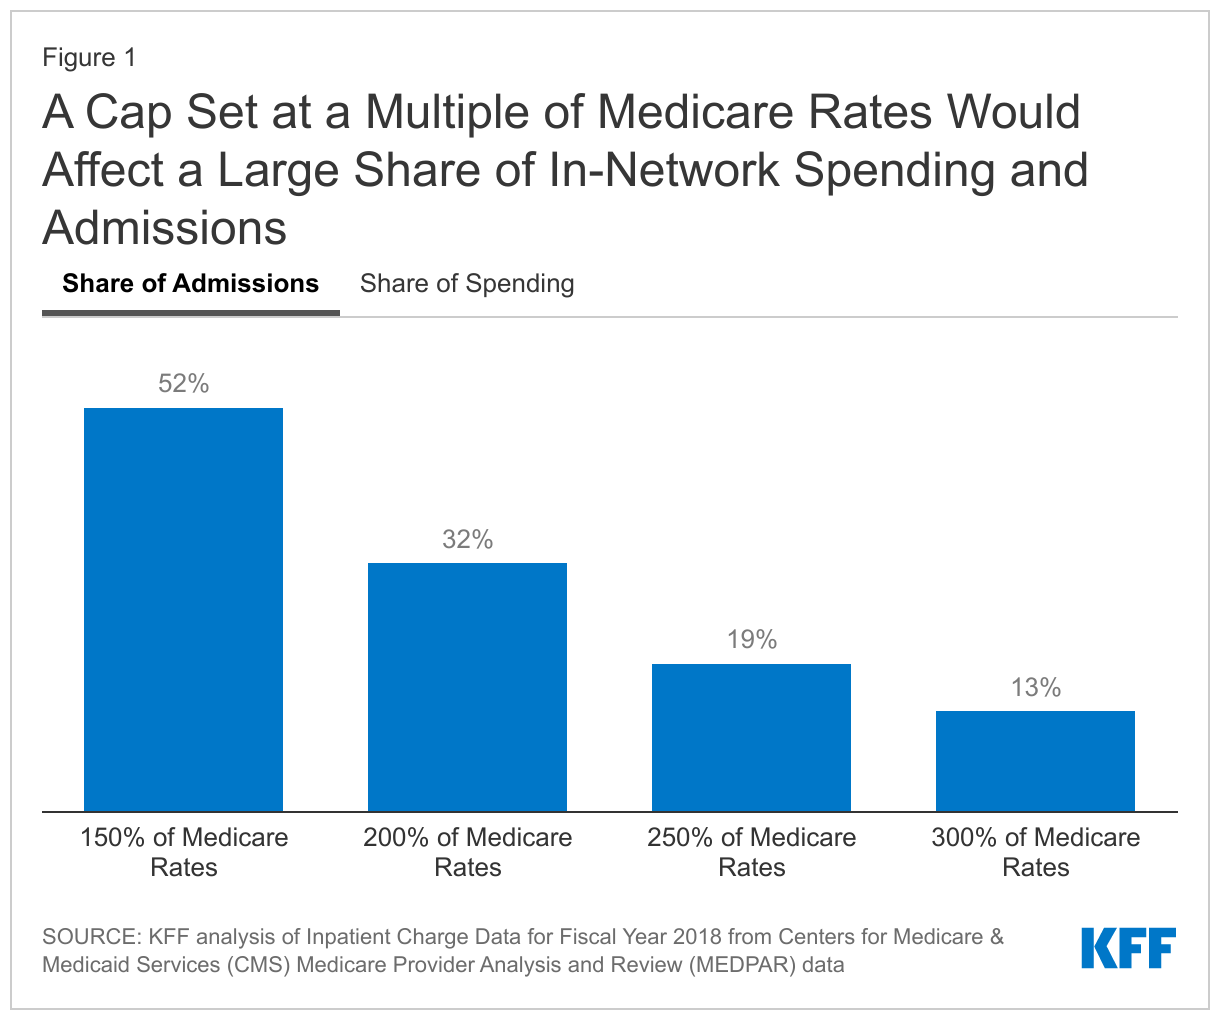
About half of non-maternity inpatient hospital admissions in the large group market would be affected by a cap on prices set to 150% of Medicare rates. Based on our analysis, 52% of inpatient admissions were paid above 150% of Medicare rates, meaning just over half of all admissions would be affected by a cap on payments set at this level. Moving from 150% to 200% of Medicare rates, the share drops to just about one-third of admissions (32%). If the payment rate was capped at 300% of Medicare rates, 13% of admissions would be affected (Figure 1).

A cap set at a multiple of Medicare rates would affect a sizeable amount of inpatient spending in the large group market, even if set at 300% of Medicare rates. Just over one-third of non-maternity inpatient spending in the large group market is for spending associated with the portion of prices above 150% of Medicare rates. In other words, if no admission was paid more than 150% of Medicare, all else equal, spending would be 36% lower. Capping prices at 300% of Medicare rates would affect 13% of spending covered by employer plans (Figure 1).

A Cap Set at a Multiple of Medicare Rates Would Affect a Large Share of In-Network Spending and Admissions

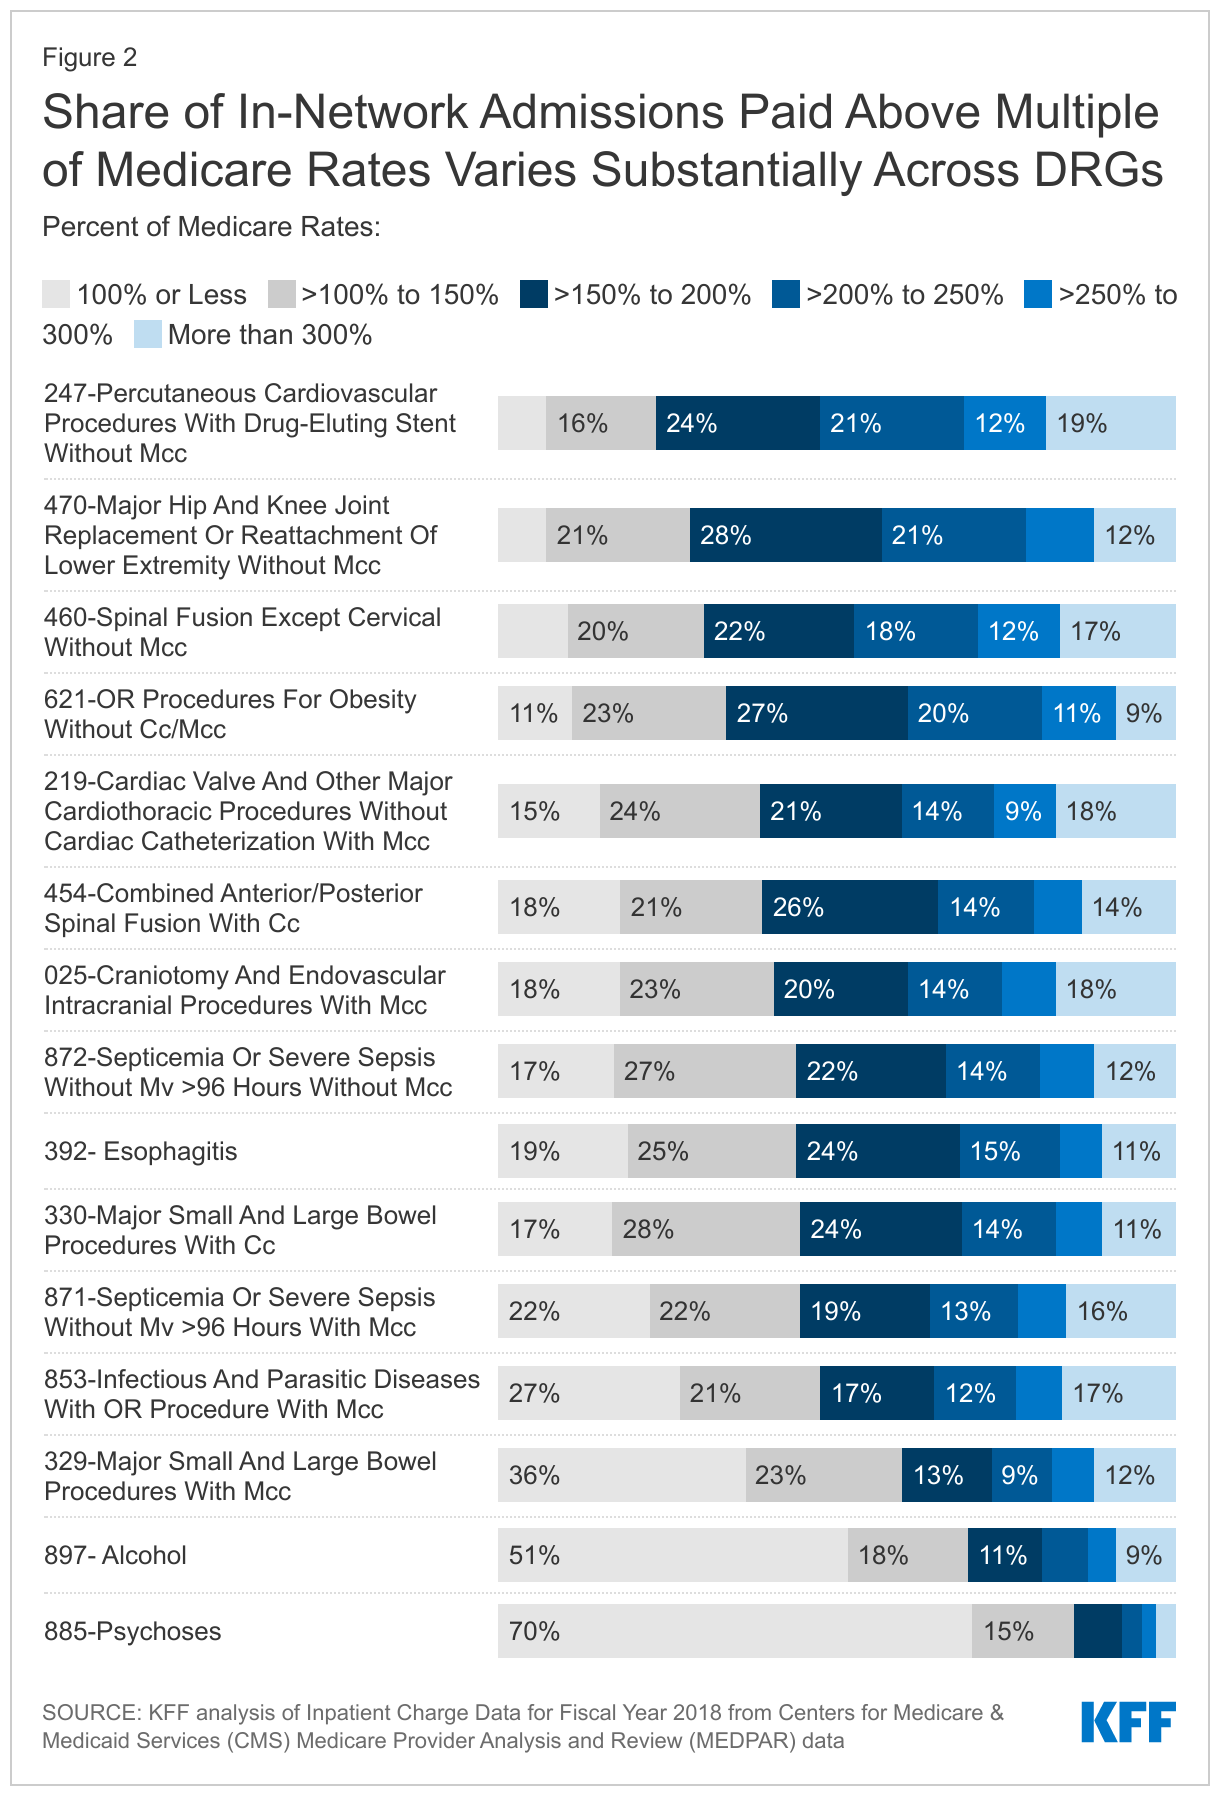
Across 15 common types of admissions, the share of in-network admissions paid above 150% of Medicare varies substantially. For example, among patients covered by large group plans, 71% of admissions for hip and knee joint replacements (DRG 470) are paid more than 150% of Medicare rates, whereas only 15% of admissions for psychosis (DRG 885) are paid above 150% of Medicare rates.

Among these same 15 DRGs, between 3% and 19% of large group plan admissions have payments above 300% of the Medicare rates. For 6 of these 15 DRGs, at least 15% of inpatient stays in the large group market are paid above 300% of Medicare rates (DRG 247, DRG 460, DRG 219, DRG 025, DRG 871 and DRG 853). Figure 2 shows the share of admissions paid within different ranges of multiples of Medicare rates.

In other words, because the distribution of current prices varies widely across DRGS, the choice of where to set a cap would matter more for some types of admissions than others (Figure 2). It would also have different affects across individual hospitals depending on their current prices and distribution of admissions.

Share of In-Network Admissions Paid Above Multiple of Medicare Rates Varies Substantially Across DRGs

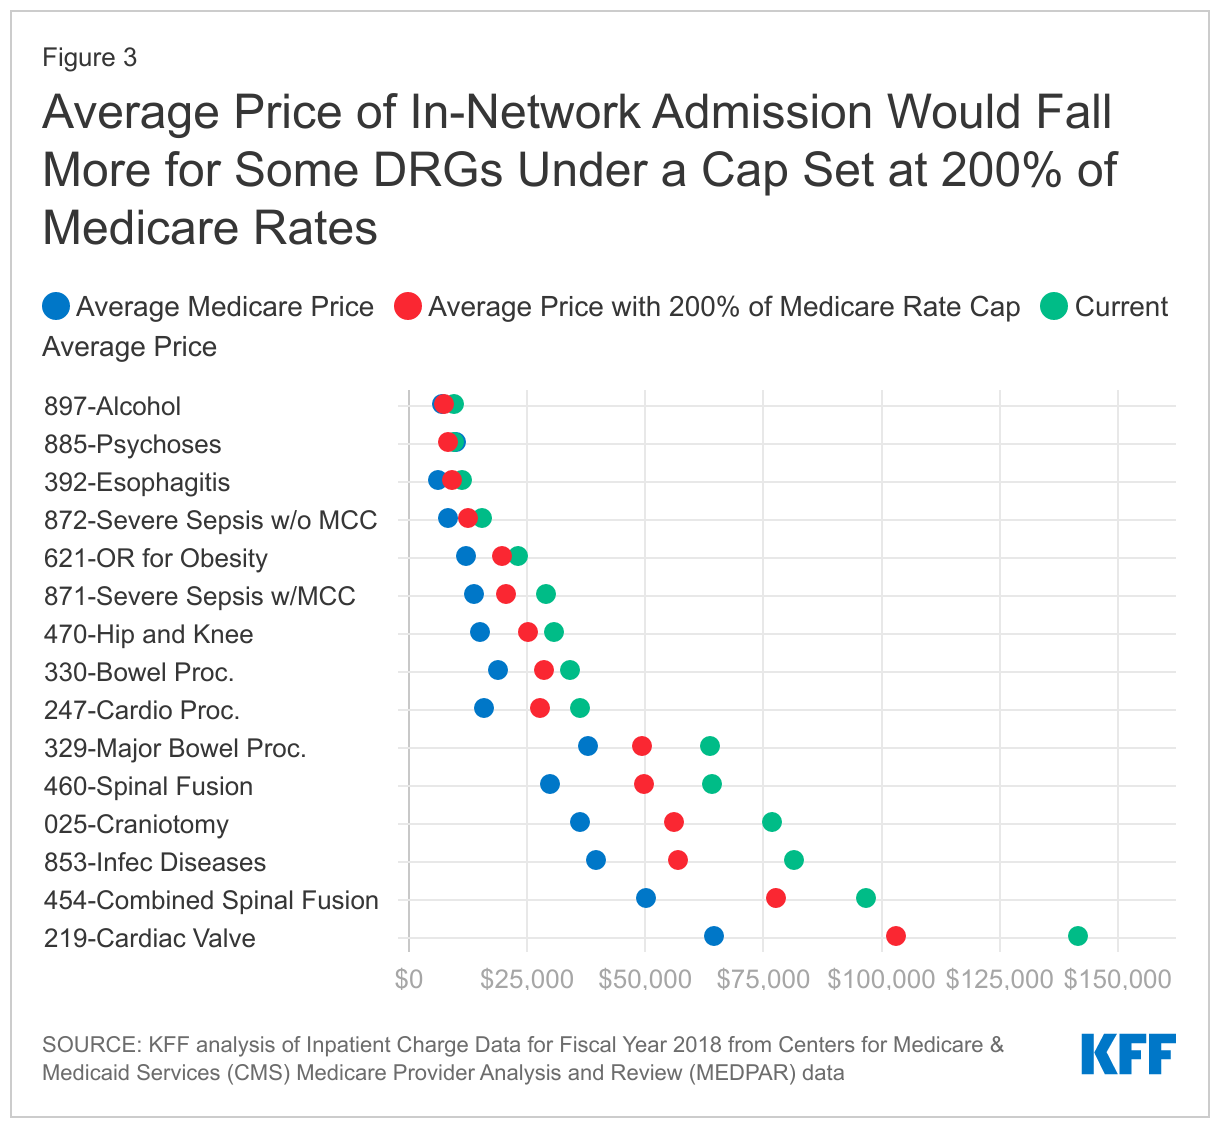
The average price for an in-network large group admission would fall more for admissions that currently have higher prices relative to Medicare. To illustrate how a cap set at a percent of Medicare rates might work, we repriced admissions currently paid above each multiple of the Medicare payment rate and recalculated the average price for the DRG in the large employer market. If a cap is set at 200% of Medicare rates, we assumed all large group admissions that are currently paid a at a higher rate would be paid the lower price of 200% of Medicare. For example, for hip and knee replacements, the average price paid by large employer plans would decrease from $30,506 to $25,366. The decrease would be smaller for psychoses under the same scenario, falling from $9,425 to $8,420 (Figure 3). In these illustrative calculations, we made no assumptions about spillover effects on the volume of admissions or prices paid underneath the cap. In practice, volume could increase to compensate for lower average prices with a cap, and the price for admissions below the cap could rise for the same reason.

Average Price of In-Network Admission Would Fall More for Some DRGs Under a Cap Set at 200% of Medicare Rates

Conclusions

High and rising health care costs, driven by high and rising prices, and exacerbated by increasing provider consolidation, are contributing to affordability challenges for people with employer-sponsored coverage. To counteract these effects, some have considered capping prices as a multiple of Medicare rates, following the lead of states, such as Montana, that have adopted this policy for its state employees’ health insurance plan.

Our analysis finds that a cap of 150% of Medicare rates would affect 52% of in-network admissions and 36% of in-network spending, while a cap of 300% of Medicare rates would affect 13% of in-network admissions and 13% of in-network spending, with variation across types of admissions. A lower cap would affect a larger share of admissions than of spending, because at lower levels more admissions are currently paid just above the potential cap. A cap on prices could potentially apply to both in- and out-of-network services, as has been proposed in other contexts. Our analysis examines in-network admissions, which account for the vast majority of spending in the group market. Therefore, our findings are illustrative of the range of admissions that could be affected and would not be substantially different if we included out-of-network admissions.

A cap on prices paid in the group market could be disruptive depending on the level at which the cap is set and the number of services to which it applies. At the same time, if a cap achieved meaningful savings, it could make health care more affordable - tradeoffs that warrant careful attention. In our analysis, we do not attempt to model any changes that may follow from a cap on prices, such as an increase in volume or an increase in prices for admissions that are below the cap. However, in Montana, capping prices at a multiple of Medicare rates resulted in net savings and utilization did not increase. There could also be effects on networks. In Washington state, some hospitals are not participating in the network for the public option in the individual market because the cap on prices of 160% of Medicare is too low. While it is unlikely that hospitals could forgo the large group market entirely, it is possible that some hospitals would choose to contract with fewer plans, creating access concerns.

While this analysis does not consider the potential impact on quality, it is possible that some high-priced inpatient admissions are of high quality and restricting prices could have a negative impact in those cases. There is some evidence this may be the case in unconcentrated (more competitive) markets. Additionally, a recent report by the Congressional Budget Office notes a correlation between prices and quality, though states there is not evidence of causality and it is not clear whether higher prices lead to higher quality or vice versa.

Capping the prices employer-sponsored plans pay for inpatient admissions would likely reduce hospital revenue. The magnitude of the impact would depend on the level of the cap, and whether volume changed in response. While affected providers could respond by operating more efficiently, it is also possible that decreases in revenue could lead to lower pay for hospital staff, fewer capital investments, and efforts to shift admissions away from payers who pay lower prices. These changes could be especially unpalatable during the ongoing COVID-19 pandemic, which has prompted billions of dollars in federal funding to help support and stabilize hospital finances.

This work was supported in part by Arnold Ventures. We value our funders. KFF maintains full editorial control over all of its policy analysis, polling, and journalism activities.

Methods

To calculate private insurance payment rates, we analyzed a sample of medical claims obtained from the 2018 IBM Health Analytics MarketScan Commercial Claims and Encounters Database. We only included claims for people under the age of 65. This analysis used claims for 18 million people representing about 22% of the 82 million people in the large group market in 2018. Weights were applied to match counts in the Current Population Survey for enrollees at firms of a thousand or more workers by sex, age, and state. Weights were trimmed at eight times the interquartile range. We exclude admissions accounting for 12% of total spending in Marketscan, namely DRGs related to childbirth. When selecting common DRGs, we did not include DRGS with fewer than 800 observations, regardless of the amount of spending attributed to those cases.

Averages represent the amounts paid to the hospitals for an admission. Across all the DRGs, hospital spending represented about 87% of the total cost of the admission. Costs include both amounts paid by enrollees in the form of cost sharing and spending by the plan. Hospital costs are trimmed to exclude the highest 0.5% of hospital costs within a DRG and admissions below 5% of the median. This is intended to exclude admissions in which the claims do not capture all the spending on the admission. These data reflect cost sharing incurred under the benefit plan, but do not include balance-billing payments that beneficiaries may make to health care providers for out-of-network services delivered during the admission or out-of-pocket payments for non-covered services. Only admissions with in-network room and board charges are included. Limiting to in-network admissions does not qualitatively affect our findings. In-network spending is about 90% of total spending after trimming outliers.

To calculate Medicare payment rates, we analyzed average payments to hospitals for admissions identified through the DRG, as reported in Inpatient Charge Data FY 2018. According to CMS documentation, the DRG reimbursements are "the average total payments to all providers for the DRG including the MS-DRG amount, teaching, disproportionate share, capital, and outlier payments for all cases. Also included in average total payments are co-payment and deductible amounts that the patient is responsible for and any additional payments by third parties for coordination of benefits." These files are prepared by the Centers for Medicare and Medicaid Services (CMS) using Medicare Provider Analysis and Review (MEDPAR) data.  For more information see: https://www.cms.gov/Research-Statistics-Data-and-Systems/Statistics-Trends-and-Reports/Medicare-Provider-Charge-Data/Downloads/Inpatient_Methodology.pdf.

IBM assigns a DRG to each admission using the Centers for Medicare & Medicaid Services (CMS) Grouper 37. This method selects a DRG for the admission based on the diagnosis and procedures a patient received during the case. The total payments to hospitals in the Marketscan data reflect the payments made to the hospitals. Some variation in the payment rates of admissions is accounted for by differences in the intensity or types of services that a patient receives, and not differences in the rates paid for those services. The rates Medicare uses to reimburse DRGs are designed to account for this variation in the intensity of cases and services. This analysis compares the average of DRG payment rates in Medicare to admissions in Marketscan. CMS suppresses DRGs with low counts; in order to use the most DRGs, we use national averages rather than the price in particular States or MSAs. Therefore, this analysis does not account for regional variation in Medicare reimbursement.

In Medicare, hospital admissions are reimbursed based on DRGs that reflects a patient’s clinical conditions and treatment. In contrast, private insurers pay for hospital admissions using different approaches that may vary with the procedures performed during the stay, including per diem payments, discounted fee-for-service payments, DRGs or other combinations of payments and performance incentives. Therefore, the variation in payment within DRG among large group plans, may reflect both variation in the intensity of services and the length of stay, as well as the prices being paid for those services.
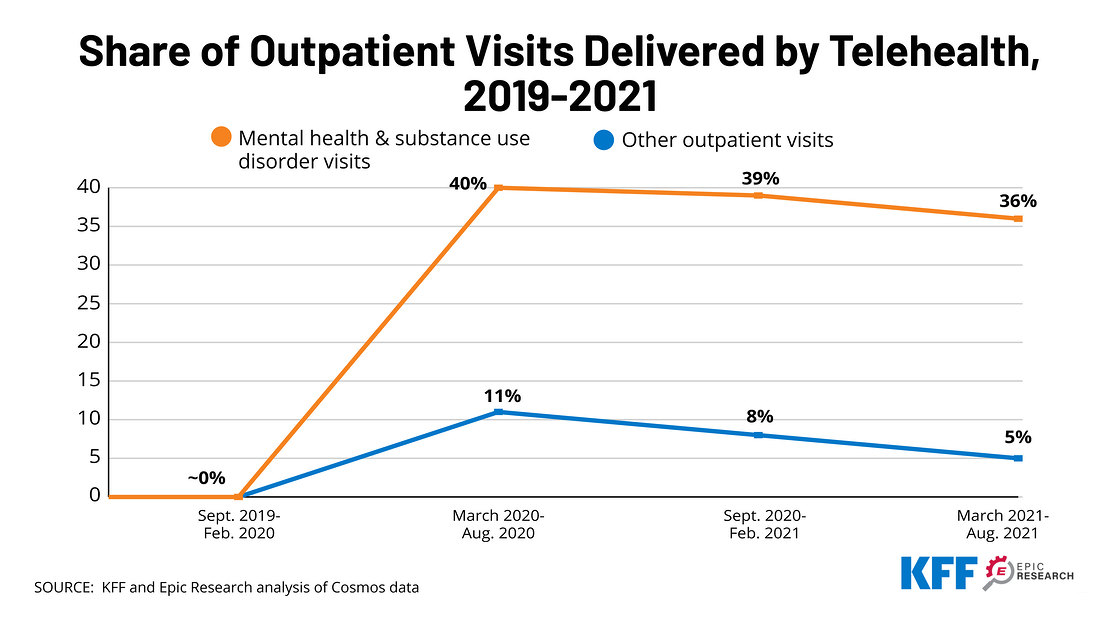
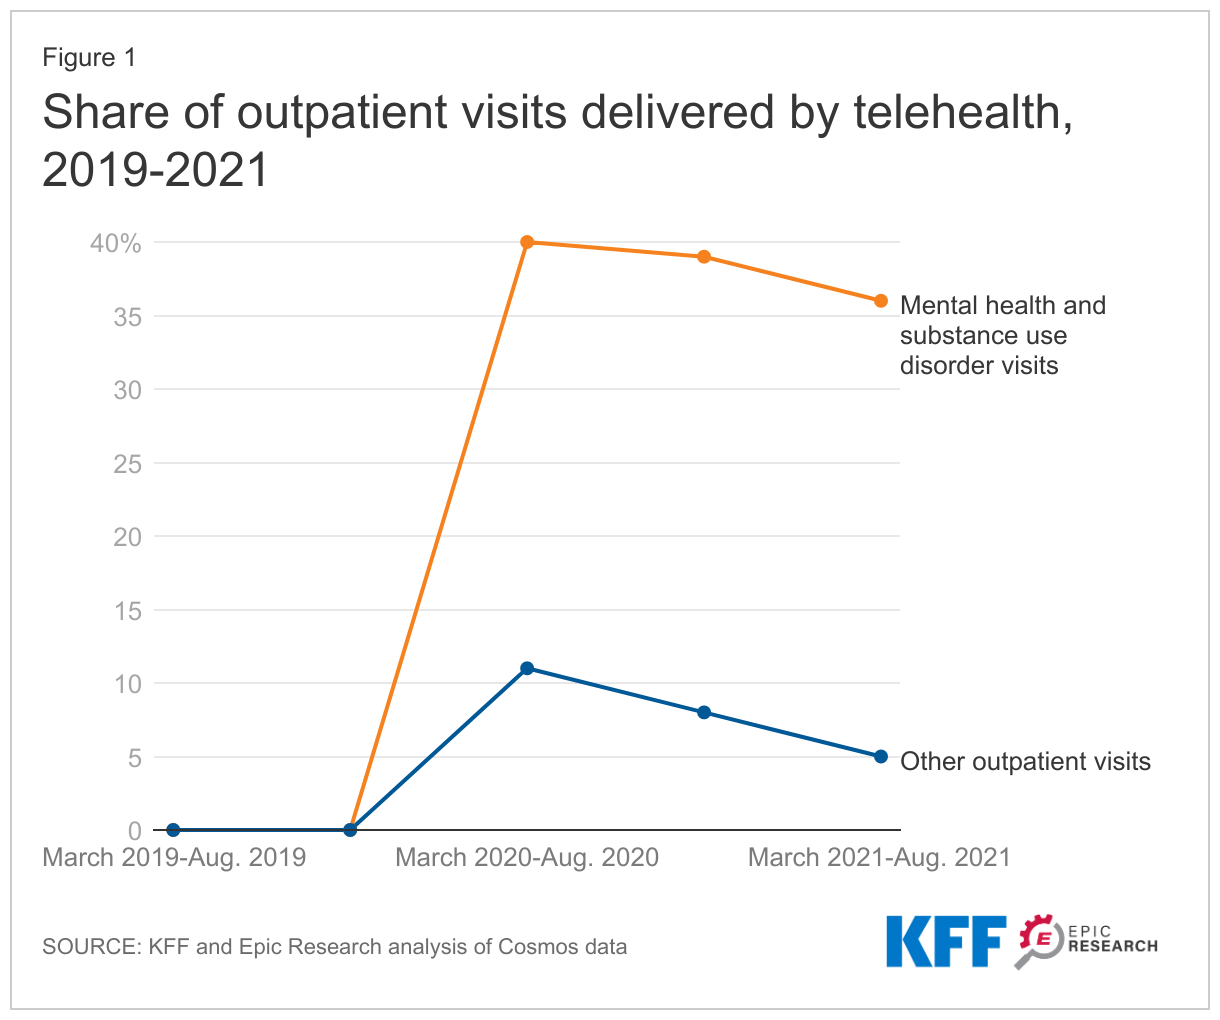
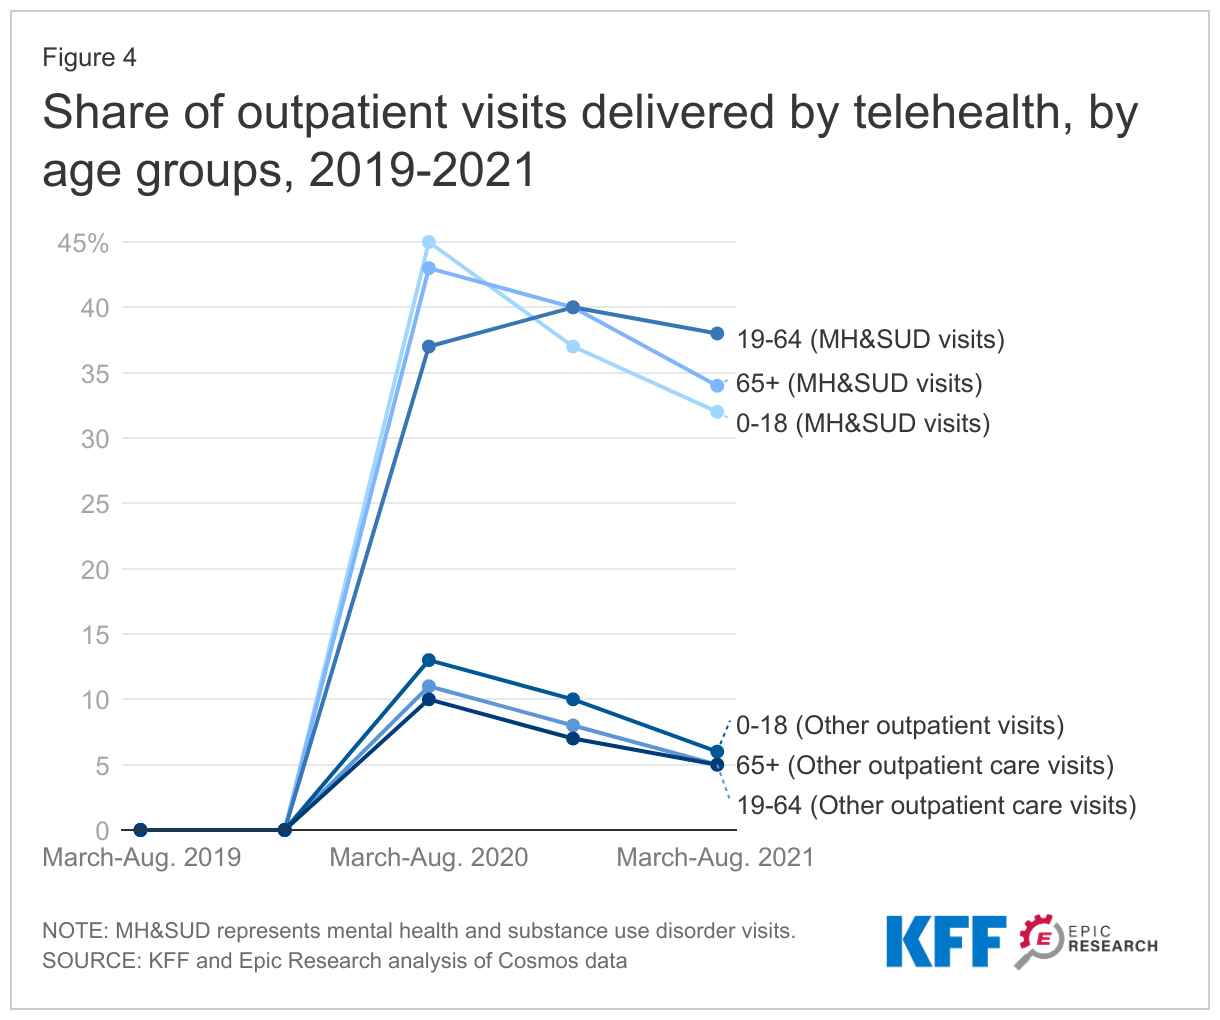
News Release

1 in 10 Adults Owe Medical Debt, With Millions Owing More Than $10,000

Black Adults, Those in Poor Health, and People Living with Disabilities are Most Likely to Carry Significant Medical Debt

Published: Mar 10, 2022

Americans Likely Owe Hundreds of Billions of Dollars in Total Medical Debt

A new KFF analysis of government data estimates that nearly 1 in 10 adults (9%) – or roughly 23 million people – owe medical debt. This includes 11 million who owe more than $2,000 and 3 million people who owe more than $10,000.

The analysis is based on data from the 2020 Survey of Income and Program Participation, a nationally representative survey that asks every adult in a household whether they owed money for medical bills in 2019 and how much they owe. It looks at people with medical debt of more than $250.

The 2020 survey suggests Americans’ collective medical debt totaled at least $195 billion in 2019, though with quite a bit of uncertainty. A small share of adults account for a huge share of the total, with considerable variation from year to year. The estimate is significantly higher than other commonly cited estimates, which generally rely on data from credit reports that may not capture medical debts charged to credit cards or included in other debts rather than being directly owed to a provider.

Other findings include:

  • People ages 35-49 (11%) and 50-64 (12%) are more likely than other adults to report medical debt. They have greater health needs than younger people on average and aren’t yet old enough to qualify for Medicare coverage, which may protect them from high costs.
  • Larger shares of people in poor health (21%) and living with a disability (15%) report medical debt. People in these groups are more likely to need and receive care than people in better health and without disabilities.
  • Among racial and ethnic groups, a larger share of Black adults (16%) report having medical debt compared to White (9%), Hispanic (9%), and Asian American (4%) adults.
  • Adults who were uninsured for more than half of the year are more likely to report medical debt (13%) than those who were insured for all or most of the year (9%).

It’s not yet clear how the pandemic and resulting recession affected medical debt. Many people lost jobs and income early in the pandemic, which could have led to more difficulty affording medical care. At the same time, many people delayed or went without care, so fewer people may have been exposed to costly medical care. Shifts in insurance coverage and COVID-related cost-sharing waivers could also affect what people had to pay out-of-pocket.

Two related KFF analyses look at other challenges related to health costs:

The first finds that many households do not have enough money available to cover the cost of a typical deductible in a private health plan. For example, about a third (32%) of single-person households with private insurance in 2019 could not pay a $2,000 bill, and half (51%) could not pay a $6,000 bill.

The second finds that lower-income families (less than twice the federal poverty level) who have employer health coverage spend a tenth of their income on health care on average, including both their share of the premium and their out-of-pocket costs.

The new analyses are available through the KFF-Peterson Health System Tracker, an online information hub that monitors and assesses the performance of the U.S. health system.

Many households do not have enough money to pay cost-sharing typical in private health plans

Authors: Greg Young, Matthew Rae, Gary Claxton, Emma Wager, and Krutika Amin
Published: Mar 10, 2022

Health plans use cost-sharing (deductibles, copayments, and coinsurance) as incentives for enrollees to use services efficiently and to shop for lower cost options when they do need care. Cost-sharing that is too high, however, can discourage enrollees from getting the care that they need or drive them into financial distress and even bankruptcy. Enrollees in private health insurance plans may have to pay thousands of dollars to meet plan deductibles, coinsurance and copayments.

To evaluate whether people can afford to pay cost-sharing amounts common with private insurance plans, this analysis examines data from the 2019 Survey of Consumer Finances. It finds that large shares of non-elderly households do not have enough liquid assets to meet typical plan cost-sharing amounts. For example, 45% of single-person non-elderly households could not pay over $2,000 from current liquid assets, and 63% could not pay over $6,000. Lower-income households were much less likely to have the liquid assets to meet typical cost sharing.

The analysis is available through the KFF-Peterson Health System Tracker, an online information hub that monitors and assesses the performance of the U.S. health system.

Poll Finding

KFF COVID-19 Vaccine Monitor: The Pandemic’s Toll on Workers and Family Finances During the Omicron Surge

Published: Mar 10, 2022

Findings

The KFF COVID-19 Vaccine Monitor is an ongoing research project tracking the public’s attitudes and experiences with COVID-19 vaccinations. Using a combination of surveys and qualitative research, this project tracks the dynamic nature of public opinion as vaccine development and distribution unfold, including vaccine confidence and acceptance, information needs, trusted messengers and messages, as well as the public’s experiences with vaccination.

Key Findings:

  • COVID-related business closures, loss of work, and related financial struggles are impacting lower-income households at disproportionate levels. Workers with household incomes less than $40,000 were more likely to report having to miss work due to a COVID-related sickness or concern and were less likely to say their employer provides paid time off if they get sick from COVID-19 or need to quarantine following a COVID-19 exposure. Six in ten workers with household incomes less than $40,000 report missing work for COVID concerns during the past three months, compared to fewer than four in ten of higher income workers. In addition, one-third (32%) of workers in households with incomes below $40,000 report getting paid time off if they get sick from COVID-19 compared to more than half of those earning $40,000 or more.
  • Among workers who had to miss work due to COVID-19 concerns or sickness (42% of all workers), about one in five say missing work had a “major impact” on the level of stress in their family or on their family’s finances. Overall, about one in ten workers say they missed work due to COVID concerns and that it had a “major impact” on their family but this rises to one in four workers in households with an income under $40,000.
  • Amidst the financial uncertainty, it is perhaps unsurprising that a small but notable share of workers say they have either gone to work or sent their child to school or daycare when they either had or were exposed to COVID-19 because they couldn’t afford to miss work. One in ten(11%) workers say they have gone to work when they had COVID-19 symptoms or had been exposed to the virus because they couldn’t afford to take the time off, rising to about three in ten among those in lower-income households (those earning less than $40,000 annually). Additionally, five percent of employed parents say they have sent their child to school or daycare when they had COVID-19 symptoms or had been exposed to the virus because they couldn’t take the time off work. Fifteen percent of workers whose employer does not offer paid time if they get sick from COVID-19 say they have gone into work when they had COVID-19 symptoms or had been exposed because they couldn’t afford to take the time off (compared to six percent of those whose employer offers paid time off).
  • Overall, lower-income families and workers, as well as members of racial and ethnic minority groups, report a disproportionate impact on their finances in the latest surge of coronavirus cases during the omicron wave. While the share of U.S. adults who reported difficulty paying bills or expenses wasn’t as widespread as seen during previous coronavirus waves, challenges remain for some households – most notably nearly half of those with household incomes less than $40,000 annually say they have had problems affording at least one of these expenses during the past 3 months, roughly four times the rate among those with incomes of at least $90,000 a year.

This month’s KFF COVID-19 Vaccine Monitor explored how the recent omicron surge impacted the economic stability of U.S. families and workers. Four in ten workers (42%) say they had to miss work at least once in the past three months because of a COVID-19 related concern or sickness. This includes one in four workers (26%) who say they had to miss work to quarantine following a COVID-19 exposure, one in five who missed work because they tested positive for COVID-19, and one in eight (13%) who missed work because their place of employment was closed or reduced hours due to COVID-19 concerns. Additionally, three in ten parents (28%) say they had to miss work in the past three months because they had to stay home with a child who had to quarantine, or their child’s school went virtual due to COVID-19 concerns.

Many Workers, Including Six In Ten Of Those Earning Less Than $40,000, Report Having To Miss Work During Past Three Months Due To COVID-19  Concerns

Lower-income workers are more likely than those with higher incomes to report missing work in the past three months due to COVID-related concerns, particularly when it comes to workplace closures. Six in ten workers with household incomes less than $40,000 report missing work for COVID concerns during the past three months, compared to less than four in ten of higher income workers. In particular, one-third of lower-income workers (35%) say they missed work because their workplace was closed or had reduced hours, compared to fewer than one in ten among workers with higher incomes. Half of Hispanic workers (47%) say they have had to miss work in the past three months due to COVID-19-related issues as did four in ten White workers (42%) and more than one-third (35%) of Black workers.

One In Five WORKERS WHO MISSED WORK DUE TO COVID Report It Had Major Impact ON FAMILY FINANCES OR STRESS LEVEL

Among the 42% of workers who had to miss work due to COVID-19 concerns or sickness, six in ten (62%) say missing work had a “major impact” or “minor impact” on their family’s stress level and four in ten (44%) say it has impacted their family’s finances. About one in five say missing work had a “major impact” on the level of stress in their family (22%) or on their family’s finances (19%).

Many Of Those Who Missed Work Due To COVID-19 Concerns Or Illness During Past Three Months Say It Had Impact On Family's Stress Or Finances

Overall, about one in ten workers say that they had to miss work due to COVID-related concerns in the past three months, and that missing work had a major impact on their family’s stress or finances. Individuals living in households with lower incomes are more likely to report that missing work had a major negative impact on their family. One-fourth of workers in households with incomes less than $40,000 report missing work for COVID-concerns and say that this had a major impact on their family’s finances or the level of stress in their family, compared to less than one in ten in households with higher levels of income. One in five Hispanic adults (18%) report loss of work that had a major negative impact, as do about one in eight Black adults and one in ten White adults.

One In Four Lower-Income Workers Report That Missing Work In Past Three Months Had Major Negative Impact On Their Family

Many Lower-Income Workers Report Not Having Paid Time Off When Sick Or Needing To Quarantine

One way to protect employees’ health and reduce the spread of COVID-19 in workplaces is for employers to offer their employees paid time off. About half of workers (52%) say their employer provides paid time off if they get sick from COVID-19 while less than half report receiving paid time off if they need to quarantine (44%), or to stay home with a child (35%) who can’t attend school or daycare because of COVID-related concerns. Slightly more than one-third of all employees say their employer offers paid time off to get vaccinated or boosted (37%) or to recover from vaccine side effects (36%).

Half Of Employees Say Employer Offers Paid Time Off If They Get Sick From COVID-19, Less Than Half Say They Receive Similar Benefits To Quarantine Or Stay Home With Child

While half of all workers report paid time off if they are sick from COVID-19, getting time off to recover from COVID is less common among those in households with lower incomes. One-third (32%) of workers in households with incomes below $40,000 report getting paid time off if they get sick from COVID-19 compared to more than half (57%) of those earning $40,000 or more. Similarly, three in ten (28%) lower-income workers report having paid time off if they need to quarantine following a COVID-19 exposure compared to half of higher-income workers. About one-third of lower-income workers report being unaware if they receive paid time off in either of these instances.

Lower-Income Workers Are Less Likely  Than Higher Income Workers To Report Paid Time Off To Recover From Symptoms Or Quarantine After COVID-19 Exposure

Among those who report missing work due to COVID-19 concerns or sickness in the last three months, less than half report that their employer offers paid time off if they get sick from COVID-19 (48%), if they need to quarantine because of a COVID-19 exposure (42%), or if their child has to stay home from school or daycare (27%).

Without Paid Time Off, Some have To Continue Working When Sick Or Quarantining

A notable share of workers, especially among lower-income households, say they have gone to work amidst COVID-19 concerns because they couldn’t afford to miss work. One in ten workers (11%) say they have gone to work when they had COVID-19 symptoms or had been exposed to the virus because they couldn’t afford to take the time off, rising to about three in ten among those in lower-income households (those earning less than $40,000 annually). Fifteen percent of workers whose employer does not offer paid time if they get sick from COVID-19 say they have gone into work when they had COVID-19 symptoms or had been exposed because they couldn’t afford to take the time off (compared to six percent of those whose employer offers paid time off).

Three In Ten Lower-Income Workers  Report Going To Work Amidst COVID-19 Concerns Because They Couldn't Afford To Miss Work

Additionally, five percent of employed parents say they have sent their child to school or daycare when they had COVID-19 symptoms or had been exposed to the virus because they couldn’t take the time off work.

Many workers also report being exposed to coronavirus at work with one-third of those who tested positive or had to quarantine saying their exposure happened at their workplace. Half (52%) say their exposure occurred outside of work while an additional 15% are unsure where they were exposed to coronavirus.

Three In Ten Say Their Household Had Difficulty Paying Bills During Omicron Surge

Overall, about three in ten U.S. adults say their household has had difficulty paying bills over the past three months, during the latest wave of coronavirus cases with the omicron surge. This includes one in five (17%) who say they have fallen behind in paying credit cards or other bills, and about one in ten who say they have had problems paying for food (13%), medical bills (12%), affording health insurance (11%), or have fallen behind in their rent or mortgage payments (9%).

The share of households who experienced economic impacts during the omicron surge is somewhat lower than the level measured at other points during the pandemic (July 2020 and February 2021) when there was a large number of cases of the virus in the U.S. but before there were vaccines widely available.

Three In Ten Adults Report Economic Impact During Omicron Surge, Down Slightly From Previous COVID-19 Waves

While the share of U.S. adults who reported difficulty paying bills or expenses wasn’t as widespread as seen during previous coronavirus waves, members of racial and ethnic minority groups, as well as those with lower levels of income, are still reporting difficulty at higher rates.

Nearly half of Black adults (48%) and one-third of Hispanic adults (34%) report difficulty paying such bills, compared to a smaller share of White adults (22%). In addition, about half (47%) of those with household incomes less than $40,000 annually say they have had problems affording at least one of these expenses during the past 3 months, roughly four times the rate among those in families with incomes of at least $90,000 a year (12%).

While Overall Financial Impact Of Omicron Was Less Than Previous Waves, Lower-Income Households, Black And Hispanic Families Still Report Significant Impact

Methodology

This KFF COVID-19 Vaccine Monitor was designed and analyzed by public opinion researchers at the Kaiser Family Foundation (KFF). The survey was conducted February 9-21, 2022, among a nationally representative random digit dial telephone sample of 1,502 adults ages 18 and older (including interviews from 301 Hispanic adults and 279 non-Hispanic Black adults), living in the United States, including Alaska and Hawaii (note: persons without a telephone could not be included in the random selection process). Phone numbers used for this study were randomly generated from cell phone and landline sampling frames, with an overlapping frame design, and disproportionate stratification aimed at reaching Hispanic and non-Hispanic Black respondents as well as those living in areas with high rates of COVID-19 vaccine hesitancy. Stratification was based on incidence of the race/ethnicity subgroups and vaccine hesitancy within each frame. High hesitancy was defined as living in the top 25% of counties as far as the share of the population not intending to get vaccinated based on the U.S. Census Bureau’s Household Pulse Survey.  The sample also included 130 respondents reached by calling back respondents that had previously completed an interview on the KFF Tracking poll at least nine months ago. Another 87 interviews were completed with respondents who had previously completed an interview on the SSRS Omnibus poll (and other RDD polls) and identified as Hispanic (n=25; including 1 in Spanish) or non-Hispanic Black (n=62). Computer-assisted telephone interviews conducted by landline (172) and cell phone (1,330; including 1,017 who had no landline telephone) were carried out in English and Spanish by SSRS of Glen Mills, PA. To efficiently obtain a sample of lower-income and non-White respondents, the sample also included an oversample of prepaid (pay-as-you-go) telephone numbers (25% of the cell phone sample consisted of prepaid numbers) Both the random digit dial landline and cell phone samples were provided by Marketing Systems Group (MSG). For the landline sample, respondents were selected by asking for the youngest adult male or female currently at home based on a random rotation. If no one of that gender was available, interviewers asked to speak with the youngest adult of the opposite gender. For the cell phone sample, interviews were conducted with the adult who answered the phone. KFF paid for all costs associated with the survey.

The combined landline and cell phone sample was weighted to balance the sample demographics to match estimates for the national population using data from the March 2021 U.S. Current Population Survey (CPS) on sex, age, education, race, Hispanic origin, region, and marital status, within race-groups, along with data from the 2010 Census on population density. The sample was also weighted to match current patterns of telephone use using data from the January-June 2021 National Health Interview Survey. The sample is also weighted to account for the possibility of nonresponse, including partisan nonresponse, based on previous months of KFF national polls and this current survey. The weight takes into account the fact that respondents with both a landline and cell phone have a higher probability of selection in the combined sample and also adjusts for the household size for the landline sample, and design modifications, namely, the oversampling of potentially undocumented respondents and of prepaid cell phone numbers, as well as the likelihood of non-response for the recontacted sample. All statistical tests of significance account for the effect of weighting.

The margin of sampling error including the design effect for the full sample is plus or minus 3 percentage points. Numbers of respondents and margins of sampling error for key subgroups are shown in the table below. For results based on other subgroups, the margin of sampling error may be higher. Sample sizes and margins of sampling error for other subgroups are available by request. Sampling error is only one of many potential sources of error and there may be other unmeasured error in this or any other public opinion poll. Kaiser Family Foundation public opinion and survey research is a charter member of the Transparency Initiative of the American Association for Public Opinion Research.

This work was supported in part by grants from the Chan Zuckerberg Initiative DAF (an advised fund of Silicon Valley Community Foundation), the Ford Foundation, and the Molina Family Foundation. We value our funders. KFF maintains full editorial control over all of its policy analysis, polling, and journalism activities.

Group

N (unweighted)M.O.S.E.
Total1,502± 3 percentage points
COVID-19 vaccination status
Have gotten at least one dose of the COVID-19 vaccine1,090± 4 percentage points
Have not gotten the COVID-19 vaccine386± 7 percentage points
Race/Ethnicity
White, non-Hispanic780± 4 percentage points
Black, non-Hispanic279± 8 percentage points
Hispanic301± 7 percentage points
Parents
Total parents383± 6 percentage points
Parent with a child under age 5142± 10 percentage points
Parents with a child ages 5-11188± 9 percentage points
Parents with a child ages 12-17203± 9 percentage points
 
Party identification
Democrats460± 6 percentage points
Republicans335± 7 percentage points
Independents480± 6 percentage points
Registered voters
Registered voters1186± 4 percentage points
Democratic voters410± 6 percentage points
Republican voters296± 7 percentage points
Independent voters349± 7 percentage points


News Release

4 in 10 Workers – and 6 in 10 of Those with Low Incomes – Say They Missed Work During the Omicron Surge Due to COVID-19 Illness, Quarantine or Closure

1 in 10 Workers, Including 3 in 10 with Low Incomes, Say They Went to Work with COVID-19 Symptoms or After Being Exposed Because They Couldn’t Afford to Miss Work

Published: Mar 10, 2022

The surge in COVID-19 cases triggered by the omicron variant led to widespread work disruptions, with about 4 in 10 workers (42%) – including 6 in 10 of those with lower incomes – saying they had to miss work at least once in the past three months because of a COVID-19 illness, quarantine, or closure, a new KFF COVID-19 Vaccine Monitor report shows.

Among all workers, a quarter (26%) say they missed work because they had to quarantine following a COVID-19 exposure, 20% missed work after testing positive, and 13% missed work because their employer was closed or had reduced hours due to COVID-19 concerns. In addition, nearly 3 in 10 employed parents (28%) say they had to miss work to stay home with a child who had to quarantine or because their child’s school went virtual.

Among lower-income workers (with annual household incomes below $40,000), 6 in 10 (60%) say they had to miss work in the past three months for at least one of these reasons. This includes a third (35%) who say they missed work because their workplace had closed or reduced hours due to the pandemic.

“Without adequate paid sick leave and needing a paycheck, it’s not surprising that some workers – especially those with lower incomes – went to work with COVID-19 symptoms or after being exposed because they couldn’t afford not to,” KFF President and CEO Drew Altman said. “The unfortunate result is that they could help to spread the virus to others while on the job.”

Overall, about 1 in 10 (11%) workers say they went to work with COVID-19 symptoms or after being exposed to someone with the virus because they couldn’t afford to take time off work. Among lower-income workers, the share rises to 3 in 10 (29%).

Among workers whose employer does not offer paid time off if they get sick, 15% say they have gone into work when they had COVID-19 symptoms or had been exposed because they couldn’t afford to take the time off.

In addition, a small share (5%) of working parents say they sent a child to school or daycare when they had symptoms or had been exposed to the virus because they couldn’t take time off work.

Among those workers who had to miss work due to COVID-19 or had to keep their child home from school, most (62%) say that it impacted their family’s stress level and 4 in 10 (44%) say it impacted their family’s finances. This includes about 1 in 5 who say that missing work had a “major impact” on their family’s stress level (22%) or finances (19%).

The report also shows that about 3 in 10 adults (29%) report difficulties paying their household and health care bills over the past three months. That’s a somewhat smaller share than in February 2021 (37%) or in July 2020 (38%), when many businesses remained closed and the unemployment rate was higher.

Larger shares of Black (48%) and Hispanic (34%) adults, as well as people in low-income households earning less than $40,000 annually (47%), continue to report recent financial struggles.

Designed and analyzed by public opinion researchers at KFF, the Vaccine Monitor survey was conducted from February 9-21, 2022 among a nationally representative random digit dial telephone sample of 1,502 adults. Interviews were conducted in English and Spanish by landline (172) and cell phone (1,330). The margin of sampling error is plus or minus 3 percentage points for the full sample. For results based on subgroups, the margin of sampling error may be higher.

The KFF COVID-19 Vaccine Monitor is an ongoing research project tracking the public’s attitudes and experiences with COVID-19 vaccinations. Using a combination of surveys and qualitative research, this project tracks the dynamic nature of public opinion as vaccine development and distribution unfold, including vaccine confidence and hesitancy, trusted messengers, and messages, as well as the public’s experiences with vaccination.

Global Health Funding in the FY 2022 Omnibus

Published: Mar 9, 2022

The FY 2022 omnibus appropriations bill (and accompanying reports), released by Congress on March 9, 2022 and yet to be finalized, includes funding for U.S. global health programs at the State Department, the U.S. Agency for International Development (USAID), the Centers for Disease Control and Prevention (CDC), and the National Institutes of Health (NIH).[i] Key highlights from the FY22 omnibus appropriations bill are as follows (see table for additional detail):

State Department & USAID:

  • Funding for global health programs, through the Global Health Programs (GHP) account, which represents the bulk of global health assistance, totals $9.8 billion, an increase of $634 million above the FY21 enacted level, but $221 million below the President’s FY22 request. Most areas increased with the exception of funding for family planning & reproductive health (FP/RH) and the Global Fund to Fight AIDS, Tuberculosis and Malaria (Global Fund), which remained flat compared to the FY21 enacted levels. The majority of the increase was for global health security activities.
  • Funding for global health security totals $700 million in the bill, accounting for the largest increase in funding for all program areas compared to the FY21 enacted level. Funding in the FY22 omnibus bill is $510 million (268%) above the FY21 enacted level ($190 million), but $205 million (-23%) below the FY22 request ($905 million).
  • Bilateral HIV funding through the President’s Emergency Plan for AIDS Relief (PEPFAR) is $4,720 million, $20 million (0.5%) above the FY21 enacted and FY22 request level ($4,700 million).
  • The bill includes $1,560 million as the U.S. contribution to the Global Fund to Fight AIDS, Tuberculosis and Malaria (Global Fund), matching the FY21 enacted and FY22 request level.
  • Funding for tuberculosis (TB) totals $371 million, $52 million (16%) above the FY21 enacted and FY22 request level ($319 million).
  • Funding for malaria totals $775 million, $5 million (0.6%) above the FY21 enacted and FY22 request level ($770 million).
  • The bill includes $890 million for maternal and child health (MCH), an increase of $34.5 million (4%) above the FY21 enacted level ($855.5 million), and $10.5 million (1%) above the FY22 request ($879.5 million). Specific areas under MCH include:
    • Gavi, the Vaccine Alliance funding totals $290 million, matching the FY21 enacted and FY22 request level.
    • Polio funding totals $75 million, $10 million (15%) above the FY21 enacted and FY22 request level ($65 million).
    • The bill includes $139 million for the U.S. contribution to the United Nations Children’s Fund (UNICEF) provided through the International Organizations and Programs (IO&P) account, matching the FY21 enacted level and FY22 request level.
  • Funding for nutrition totals $155 million, $5 million (3%) above the FY21 enacted and FY22 request level ($150 million).
  • Bilateral family planning and reproductive health (FP/RH) funding totals $575 million ($524 million through the GHP account and $51 million through the ESF account), matching the FY21 enacted level, but $8.7 million (-2%) below the FY22 request level ($583.7 million).
  • Funding for the United Nations Population Fund (UNFPA) totals $32.5 million, matching the FY21 enacted level, but $23.5 million (-42%) below the FY22 request ($56 million).
  • Funding for the vulnerable children program totals $27.5 million, $2.5 million (10%) above the FY21 enacted and FY22 request level ($25 million).
  • Funding for neglected tropical diseases (NTDs) totals $107.5 million, $5 million (5%) above the FY21 enacted and FY22 request level ($102.5 million).
  • The bill also includes the following provisions:
    • States that up to $100 million be made available under the GHP account for the Emergency Reserve Fund, which is a mechanism that is used to quickly respond to emerging infectious disease outbreaks.
    • Provides the authority to transfer an amount “not to exceed an aggregate total of $200,000,000 of the funds appropriated by this Act” for international infectious disease outbreaks.
    • Includes $100 million from the GHP account “for a U.S. contribution to support a multilateral vaccine development partnership for epidemic preparedness innovations.”

Centers for Disease Control and Prevention (CDC): Funding for global health provided to the CDC totals $647 million, an increase of $54 million (9%) compared to the FY21 enacted level ($593 million), but $51 million (-7%) below the FY22 request ($698 million). Almost all areas increased in FY22 compared to the prior year level, with global health security accounting for most of this increase.

Fogarty International Center (FIC): Funding for the Fogarty International Center (FIC) at the National Institutes of Health (NIH) totaled $87 million, $3 million (3%) above the FY21 enacted level ($84 million), but $9 million (-10%) below the FY22 request ($96 million).

Resources:

  • “Consolidated Appropriations Act, 2022” – Bill Text
  • FY2022 Department of State, Foreign Operations, and Related Programs (SFOPs) Appropriations – Explanatory Statement
  • FY2022 Department of Labor, Health and Human Services, and Education, and Related Agencies (Labor HHS) Appropriations – Explanatory Statement

The table (.xlsx) below compares global health funding in the FY 2022 omnibus bill compared to the FY 2021 enacted funding amounts as outlined in the “Consolidated Appropriations Act, 2021” (KFF summary here) and the President’s FY 2022 request (KFF summary here).

See the KFF budget tracker for details on historical annual appropriations, including Senate and House amounts, for global health programs.

Table: KFF Analysis of Global Health Funding in the FY22 Omnibus
Department / Agency / AreaFY21Enactedi(millions)FY22Request(millions)FY22Omnibus(millions)Difference(millions)
FY22 Omnibus– FY21 EnactedFY22 Omnibus– FY22 Request
State, Foreign Operations, and Related Programs (SFOPs) – Global Health
HIV/AIDS$4,700.0$4,700.0$4,720.0$20 (0.4%)$20 (0.4%)
State Department$4,370.0$4,370.0$4,390.0$20(0.5%)$20(0.5%)
USAID$330.0$330.0$330.0$0(0%)$0(0%)
of which Microbicides$45.0$45.0$45.0$0(0%)$0(0%)
Global Fund$1,560.0$1,560.0$1,560.0$0 (0%)$0 (0%)
Tuberculosisii$321.0
Global Health Programs (GHP) account$319.0$319.0$371.1$52.1(16.3%)$52.1(16.3%)
Economic Support Fund (ESF) accountNot specified$2.0Not specified
Malaria$770.0$770.0$775.0$5 (0.6%)$5 (0.6%)
Maternal & Child Health (MCH)ii$1,039.5
GHP account$855.5$879.5$890.0$34.5(4%)$10.5(1.2%)
of which Gaviiii$290.0$290.0$290.0$0(0%)$0(0%)
of which Polio$65.0$65.0$75.0$10(15.4%)$10(15.4%)
UNICEFiv$139.0$139.0$139.0$0(0%)$0(0%)
ESF accountNot specified$21.0Not specified
of which PolioNot specified$0.0Not specified
Nutritionii$154.8
GHP account$150.0$150.0$155.0$5(3.3%)$5(3.3%)
ESF accountNot specified$4.0Not specified
AEECA account –$0.8
Family Planning & Reproductive Health (FP/RH)v$607.5$639.7$607.5$0 (0%)$-32.2 (-5%)
Bilateral FP/RHv$575.0$583.7$575.0$0(0%)$-8.7(-1.5%)
GHP accountv$524.0$550.0$524.0$0(0%)$-26.1(-4.7%)
ESF accountv$51.1$33.7$51.1$0(0%)$17.4(51.5%)
UNFPAvi$32.5$56.0$32.5$0(0%)$-23.5(-42%)
Vulnerable Children$25.0$25.0$27.5$2.5 (10%)$2.5 (10%)
Neglected Tropical Diseases (NTDs)$102.5$102.5$107.5$5 (4.9%)$5 (4.9%)
Global Health Security$190.0$913.3$700.0$510 (268.4%)$-213.3 (-23.4%)
GHP account$190.0$905.0$700.0$510(268.4%)$-205(-22.7%)
USAID GHP accountvii$190.0$655.0$700.0$510(268.4%)$45(6.9%)
State GHP accountviii –$250.0
ESF account$8.3
Emergency Reserve Fundix$90.0x
SFOPs Total (GHP account only)xi$9,196.0$10,051.0$9,830.0$634 (6.9%)$-221 (-2.2%)
Labor Health & Human Services (Labor HHS)
Centers for Disease Control & Prevention (CDC) – Total Global Health$592.8$697.8$646.8$54 (9.1%)$-51 (-7.3%)
Global HIV/AIDS$128.4$128.4$128.9$0.5(0.4%)$0.5(0.4%)
Global Tuberculosis$9.2$9.2$9.7$0.5(5.4%)$0.5(5.4%)
Global Immunization$226.0$226.0$228.0$2(0.9%)$2(0.9%)
Polio$176.0$176.0$178.0$2(1.1%)$2(1.1%)
Other Global Vaccines/Measles$50.0$50.0$50.0$0(0%)$0(0%)
Parasitic Diseases$26.0$31.0$27.0$1(3.8%)$-4(-12.9%)
Global Public Health Protection$203.2$303.2$253.2$50(24.6%)$-50(-16.5%)
Global Disease Detection and Emergency Response$193.4$293.4Not specified
of which Global Health Security (GHS)Not specifiedNot specifiedNot specified
Global Public Health Capacity Development$9.8$9.8Not specified
National Institutes of Health (NIH) – Total Global Health$918.8
HIV/AIDS$616.7$617.1Not specified
Malaria$218.0Not specifiedNot specified
Fogarty International Center (FIC)$84.0$96.3$86.9$2.8(3.4%)$-9.4(-9.8%)
Labor HHS Total$1,511.6Not yet knownNot yet known
Notes:
i – The FY21 final bill and FY22 Omnibus both include a provision giving the Secretary of State the ability to transfer up to $200,000,000 from the ‘Global Health Programs’, ‘Development Assistance’, ‘International Disaster Assistance’, ‘Complex Crises Fund’, ‘Economic Support Fund’, ‘Democracy Fund’, ‘Assistance for Europe, Eurasia and Central Asia’, ‘Migration and Refugee Assistance’, and ‘Millennium Challenge Corporation’ accounts “to respond to a Public Health Emergency of International Concern.”
ii – Some tuberculosis, MCH, and nutrition funding is provided under the ESF account, which is not earmarked by Congress in the annual appropriations bills and is determined at the agency level.
iii – The FY21 final bill text provides additional funding to Gavi to support coronavirus response efforts, stating, “For an additional amount for ‘Global Health Programs’, $4,000,000,000, to remain available until September 30, 2022, to prevent, prepare for, and respond to coronavirus, including for vaccine procurement and delivery: Provided, That such funds shall be administered by the Administrator of the United States Agency for International Development and shall be made available as a contribution to the GAVI, Alliance.”
iv – UNICEF funding in the FY21final bill and the FY22 Omnibus both include an earmark of $5 million for programs addressing female genital mutilation.
v – The FY21 final bill and FY22 Omnibus both state that “not less than $575,000,000 should be made available for family planning/reproductive health.” The FY22 request funding amounts are based on a bilateral total of $583.7 million as specified in the FY22 OMB Budget Appendices for the Department of State and Other International Programs.
vi – The FY21 final bill and FY22 Omnibus both state that if this funding is not provided to UNFPA it “shall be transferred to the ‘Global Health Programs’ account and shall be made available for family planning, maternal, and reproductive health activities.”
vii – According to the Department of State, Foreign Operations, and Related Programs FY22 Congressional Budget Justification, $300 million of this funding is “for contributions to support multilateral initiatives leading the global COVID response through the Act-Accelerator platform.”
viii – According to the Department of State, Foreign Operations, and Related Programs FY22 Congressional Budget Justification, this funding is “to support a new health security financing mechanism, which would be developed alongside U.S. partners and allies, to ensure global readiness to respond to the next outbreak.”
ix – The FY21 final bill states that “up to $50,000,000 of the funds made available under the heading ‘Global Health Programs’ may be made available for the Emergency Reserve Fund.”
x – The FY22 Omnibus states that “up to $100,000,000 of the funds made available under the heading ‘Global Health Programs’ may be made available for the Emergency Reserve Fund.”
xi – The FY22 Omnibus “includes $100,000,000 for a U.S. contribution to support a multilateral vaccine development partnership for epidemic preparedness innovations.”

[i] Total funding for global health is not currently available as some funding provided through USAID, NIH, and DoD is not yet available.

News Release

Rethinking the Use of Race in Medicine

Published: Mar 8, 2022

The COVID-19 pandemic has shined a spotlight on racial disparities in health and health care, but disparities are hardly new. They have been driven by longstanding inequities within and beyond the health care system that are rooted in racism.

KFF Vice President Samantha Artiga, who directs the Racial Equity and Health Policy Program, in this new video discusses how the medical system continues to use race in ways that may perpetuate disparities, including through provider and institutional bias, clinical guidelines, and medical education and training approaches. She also discusses the growing efforts within the medical community to reevaluate and revise how race is used in health care to move toward race-conscious versus race-based medicine.

Rethinking the Use of Race in Medicine

This is the latest video in our series “In Focus with KFF,” featuring insights from our experts on health care issues in the news.

‘In Focus with KFF’: Rethinking the Use of Race in Medicine

Published: Mar 8, 2022

The COVID-19 pandemic has shined a spotlight on racial disparities in health and health care, but disparities are hardly new. They have been driven by longstanding inequities within and beyond the health care system that are rooted in racism.

KFF Vice President Samantha Artiga, who directs the Racial Equity and Health Policy Program, in this new video discusses how the medical system continues to use race in ways that may perpetuate disparities, including through provider and institutional bias, clinical guidelines, and medical education and training approaches. She also discusses the growing efforts within the medical community to reevaluate and revise how race is used in health care to move toward race-conscious versus race-based medicine.