Poll Finding

KFF Tracking Poll on Health Information and Trust: Update on Common Vaccine Myths

Published: Jun 30, 2026

Key Takeaways

  • With childhood vaccination rates in the U.S. continuing to decline as measles cases rise across the U.S., KFF’s latest Tracking Poll on Health Information and Trust shows that several commonly circulated vaccine myths remain pervasive among the public. Many adults say they have heard false claims about the measles and COVID-19 vaccines, including that the measles, mumps, and rubella (MMR) vaccines have been proven to cause autism in children (66%), that more people have died from the COVID-19 vaccines than the virus (46%), that mRNA vaccines can alter DNA (36%), or that measles vaccines are more dangerous than measles itself (29%).
  • While many have heard of these myths, smaller shares are convinced they are true. Fewer than one in ten adults express ardent belief in each myth, while larger shares (between 31% and 44%) say each are “definitely false” and at least half fall in the “malleable middle,” saying each of these claims is either “probably true” or “probably false.”
  • Adults who have a relationship with a trusted health care provider are less likely than those who don’t have such a relationship to believe or lean toward believing vaccine falsehoods. For instance, nearly half (46%) of adults who say they do not have a health care provider they trust to answer questions about their health say it is “probably” or “definitely true” that more people have died from COVID-19 vaccines than from the virus, which is nearly twice the share among those with a trusted provider (24%). While younger adults, Hispanic adults, and uninsured adults are more likely than their counterparts to say they don’t have a trusted provider, the connection between lacking a trusted provider and belief in vaccine myths holds even when controlling for factors like age, race and ethnicity, education, partisanship, and insurance coverage.
  • Those who use social media and artificial intelligence (AI) chatbots for health information are also more likely to endorse many of these vaccine myths. For example, adults who use social media for health information at least weekly are more than twice as likely as those who don’t use social media for health to say the myth linking MMR vaccines to autism is “probably” or “definitely true” (37% v. 16%). Use of artificial intelligence (AI) for health information is also correlated with views on some of these myths, with adults who regularly use AI for health information more likely than non-users to believe or lean toward believing myths about the MMR and mRNA vaccines. While younger adults, Black and Hispanic adults, and those without a college degree are all more likely to use to social media for health information, the connection between frequent use and belief in vaccine myths holds even when controlling for factors like age, race and ethnicity, education, and partisanship.
  • Parents’ views on vaccine myths are also correlated with their decisions about childhood vaccinations. Parents who report skipping or delaying recommended childhood vaccines are consistently at least 25 percentage points more likely than those who keep their children up-to-date to say vaccine myths are “definitely” or “probably true,” including the false claims that MMR vaccines cause autism in children (57% v. 30%), that more people died from COVID-19 vaccines than the virus itself (55% v. 29%), that mRNA vaccines alter DNA (52% v. 23%), and that measles vaccines are more dangerous than measles (43% v. 18%). This relationship remains significant even when controlling for factors like age, education, and partisanship.
  • When looking at patterns of belief across the four false vaccine claims, a new analysis shows that some adults are consistent or leaned myth believers (8% who say all four claims are either “probably” or “definitely true”), or myth deniers (55% who deny all four claims, saying they are either “probably” or “definitely false”). At the same time, about three in ten (31%) fall in a “mixed middle” group, providing a range of true and false answers across the four vaccine myths and lacking certainty on at least half of the false claims. This group may be an important focus for those looking to counter vaccine misinformation and dispel confusion. Black adults, Hispanic adults, Republicans, younger adults, and those without a college degree are all more likely than their counterparts to fall into this “mixed middle” group, as are individuals who go to social media or AI for health information. Notably, nearly half of parents who report skipping or delaying recommended vaccines for their children fall in the “mixed middle,” indicating that these parents’ decisions may be driven, at least in part, by uncertainty and confusion.

Exposure to Common Vaccine Myths

The latest KFF Tracking Poll on Health Information and Trust examines the pervasiveness of several commonly circulated vaccine myths. These false or unproven claims about vaccines have remained persistent in terms of exposure over the past several years, with little change to the share of the public have heard most of these myths.

The false claim that MMR vaccines have been proven to cause autism in children – a myth associated with a since retracted study from the 1990s – remains one of the most widely heard vaccine myths, with two-thirds of adults saying they have heard or read this. Nearly half (46%) of adults say they have heard the false claim that more people have died from the COVID-19 vaccines than the virus itself, and about one third of adults (36%) say they have heard the myth that mRNA vaccines can change your DNA (mRNA is a vaccine technology utilized by some COVID-19 vaccines and others under development). About three in ten adults (29%) say they have heard the false claim that measles vaccines are more dangerous than measles infections.

Exposure to each of these false claims has been fairly steady in KFF polls over the past several years, though the share who report hearing the myth that mRNA vaccines can alter a person’s DNA dropped by 9 percentage points since April 2025 (from 45% to 36%). Exposure to the myth that measles vaccines are more dangerous than measles rose between 2024 and 2025, but has remained steady since then.

Figure 1

Uncertainty Surrounding False Vaccine Claims

While many report having heard some false claims about vaccines, very few adults are ardent believers in these myths, with larger shares (but fewer than half) stating the myths are “definitely false.” At the same time, and consistent with past KFF polling, at least half of adults fall into the “malleable middle” across the myths, expressing some uncertainty and saying these vaccine myths are either “probably true” or “probably false.” Across these four vaccine falsehoods, most parents fall into the malleable middle, expressing some uncertainty for each claim.
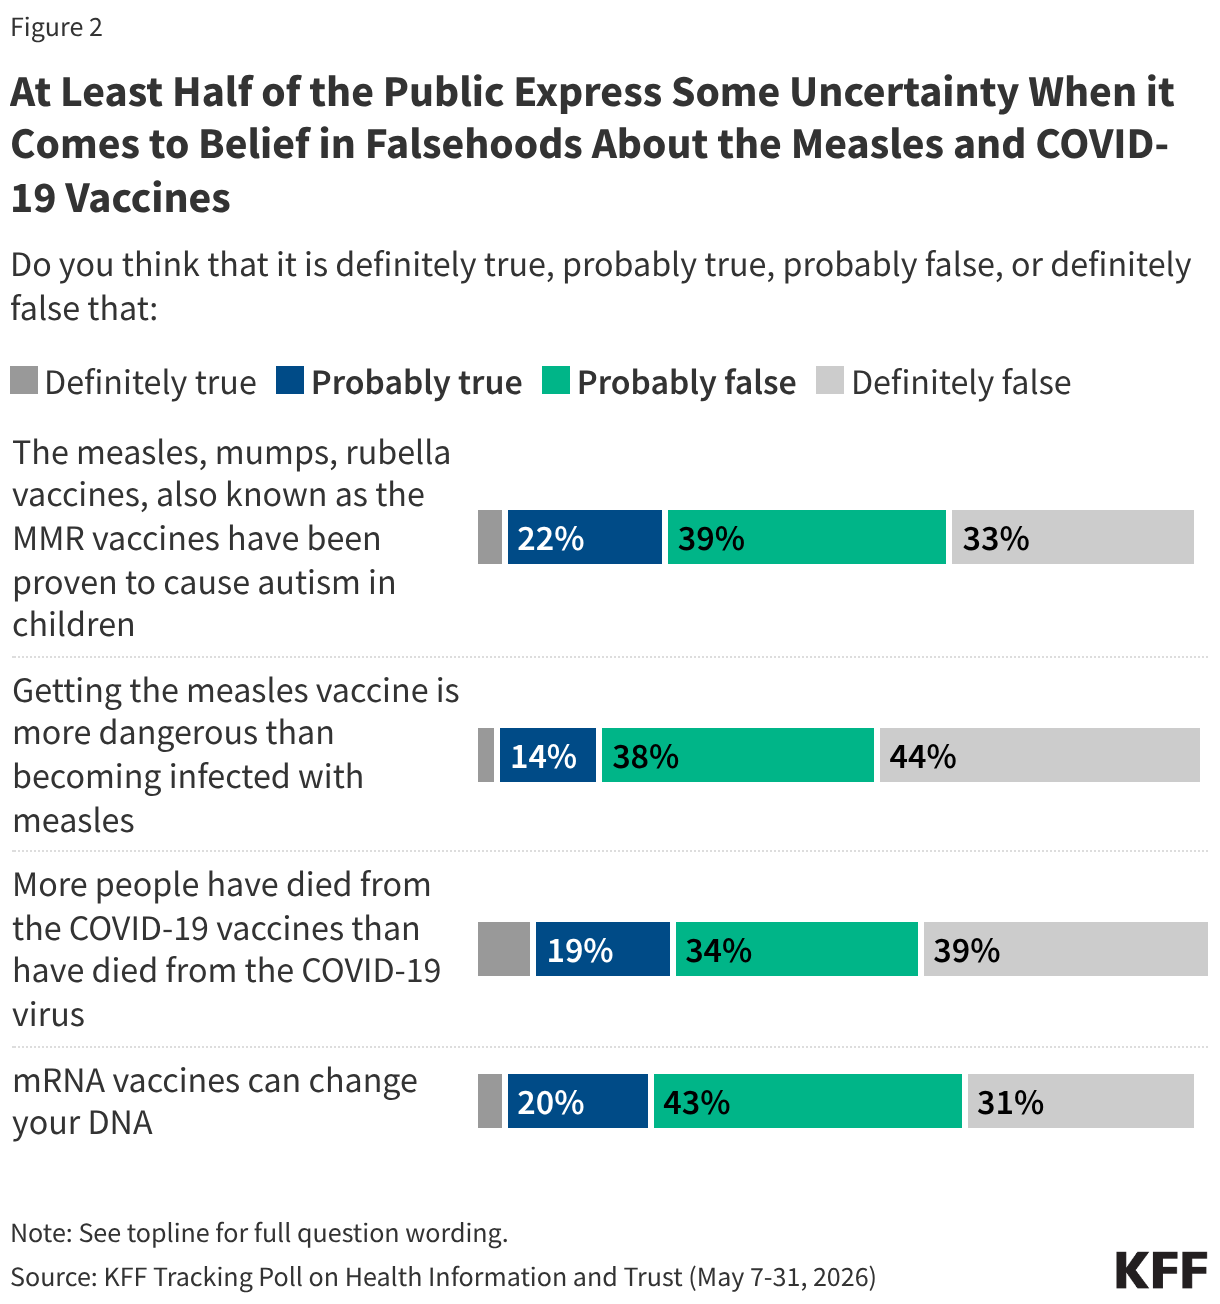
Stacked bar chart showing the share of the public who believe four false vaccine claims are definitely true, probably true, probably false, or definitely false.

Over time, the share who fall in the “malleable middle” for these vaccine myths has been relatively stable, with at least half saying each is either “probably true” or “probably false.” At the same time, there have been some minor shifts in the share who view some of these myths as “definitely false” over the past few years, underscoring how the public’s willingness to endorse vaccine falsehoods is not completely static. Somewhat larger shares of adults now say it is “definitely false” that mRNA vaccines can change your DNA (31% now v. 24% in April 2025), and that measles vaccines are more dangerous than getting infected with measles (44% now v. 38% in March 2024). Conversely, the share of adults who think it is “definitely false” that more people have died from COVID-19 vaccines than from the virus has declined (39% now compared to 47% in June 2023) alongside a 5-percentage point jump in the share who say this myth is “probably true.” There have been no notable changes in views of the long-standing myth that MMR vaccines cause autism.
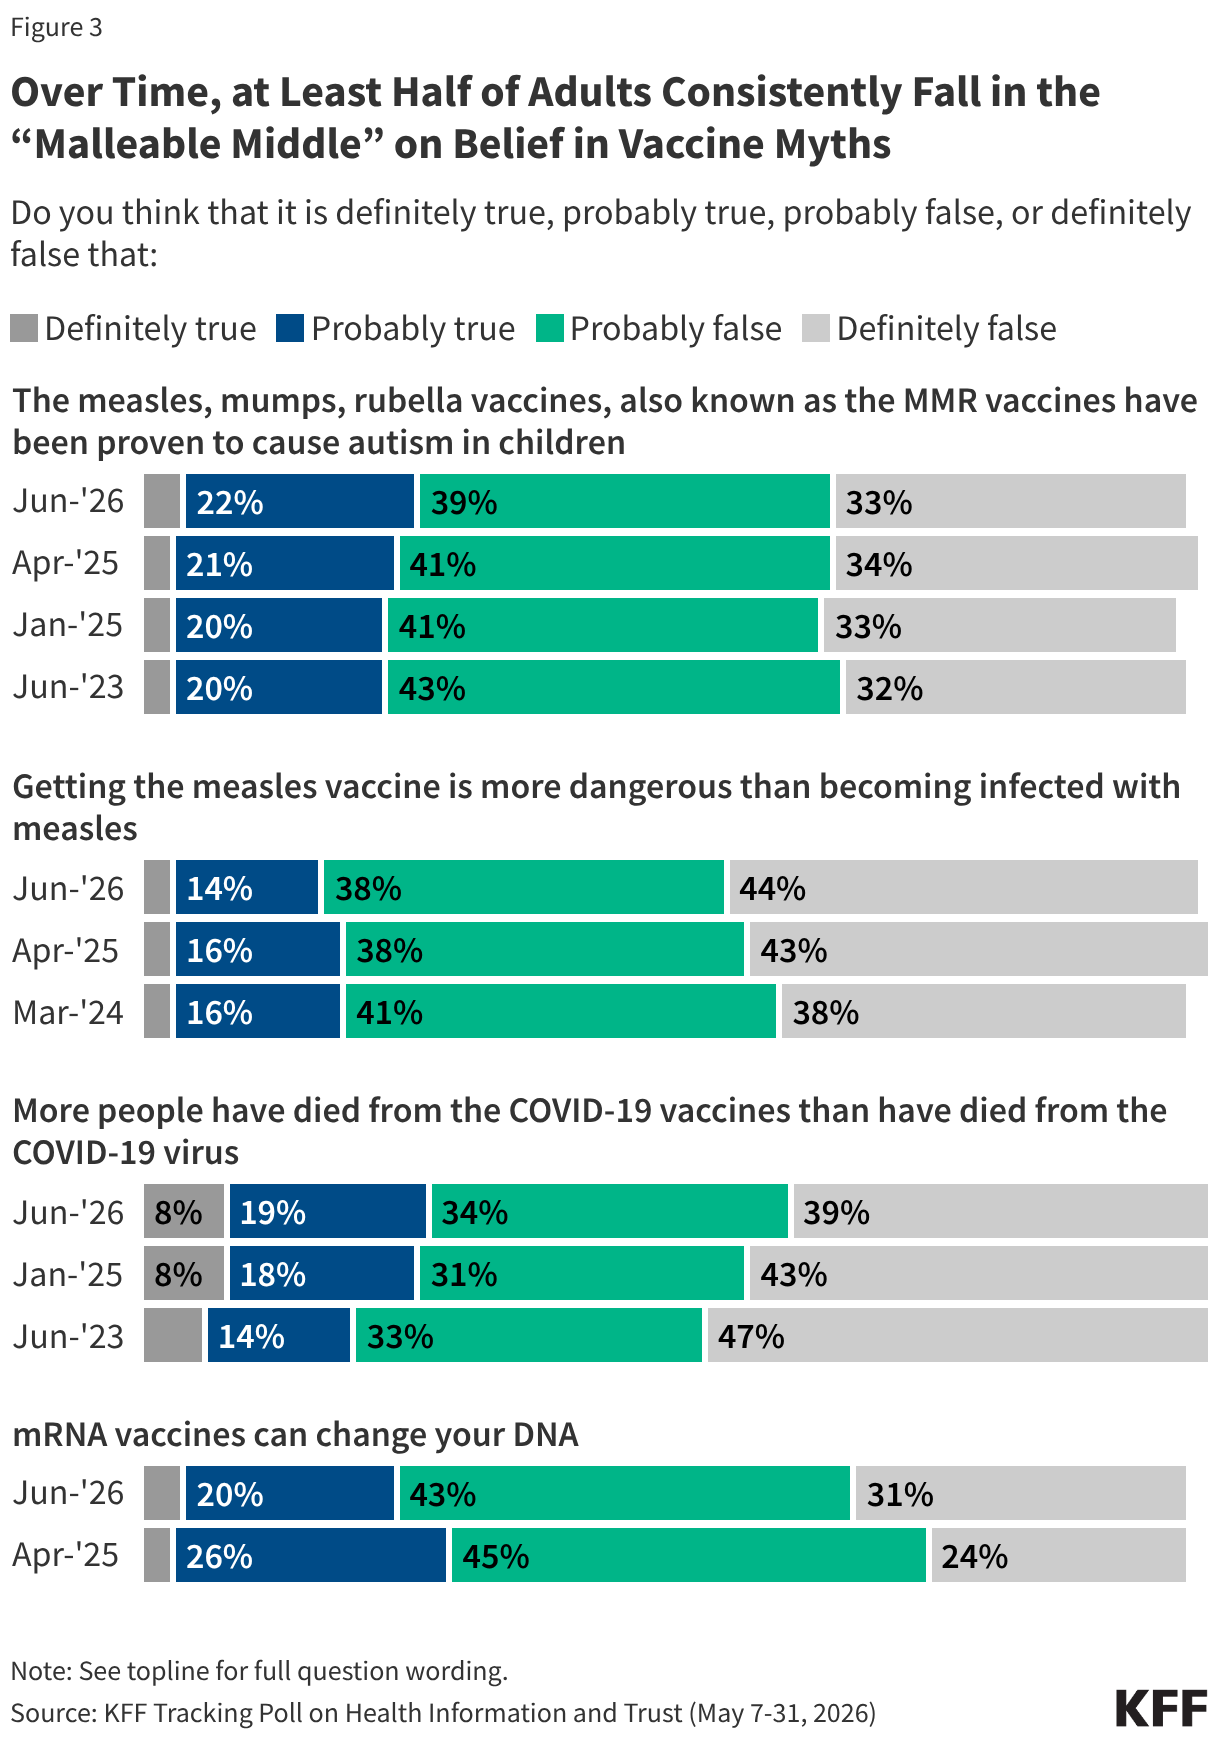
Stacked bar chart showing how belief in four false vaccine claims has changed over time, from June 2023 to June 2026.

Belief in Vaccine Myths is Tied to Lacking a Trusted Health Care Provider And Use of Social Media and AI For Health Information

Previous KFF polls have shown that health care providers are the most trusted source of health information among the public, and this latest poll shows that individuals who have a trusted provider are less likely than those without a trusted provider to endorse vaccine-related myths. For example, among adults who say they do not have a doctor or health care provider they trust to answer questions about their health (16% of all adults), nearly half (46%) say it is either “definitely” or “probably true” that more people have died from COVID-19 vaccines than from the COVID-19 virus, compared to a quarter (24%) among those who say they have a trusted health care provider.

Unsurprisingly, adults who say they do not have a trusted health care provider to answer their health questions are much more likely to be uninsured than those who have a provider they trust (36% v. 7%). At the same time, lacking a trusted provider could be related to low trust in providers and doctors more broadly and not necessarily related to health care access. Across demographics, adults under age 50, LGBT adults, and Hispanic adults are all more likely than their counterparts to say they don’t have a provider they trust to answer questions about their health. However, the connection between not having a trusted provider and belief in vaccine myths remains significant even when controlling for factors like age, race and ethnicity, education, partisanship, and insurance coverage.
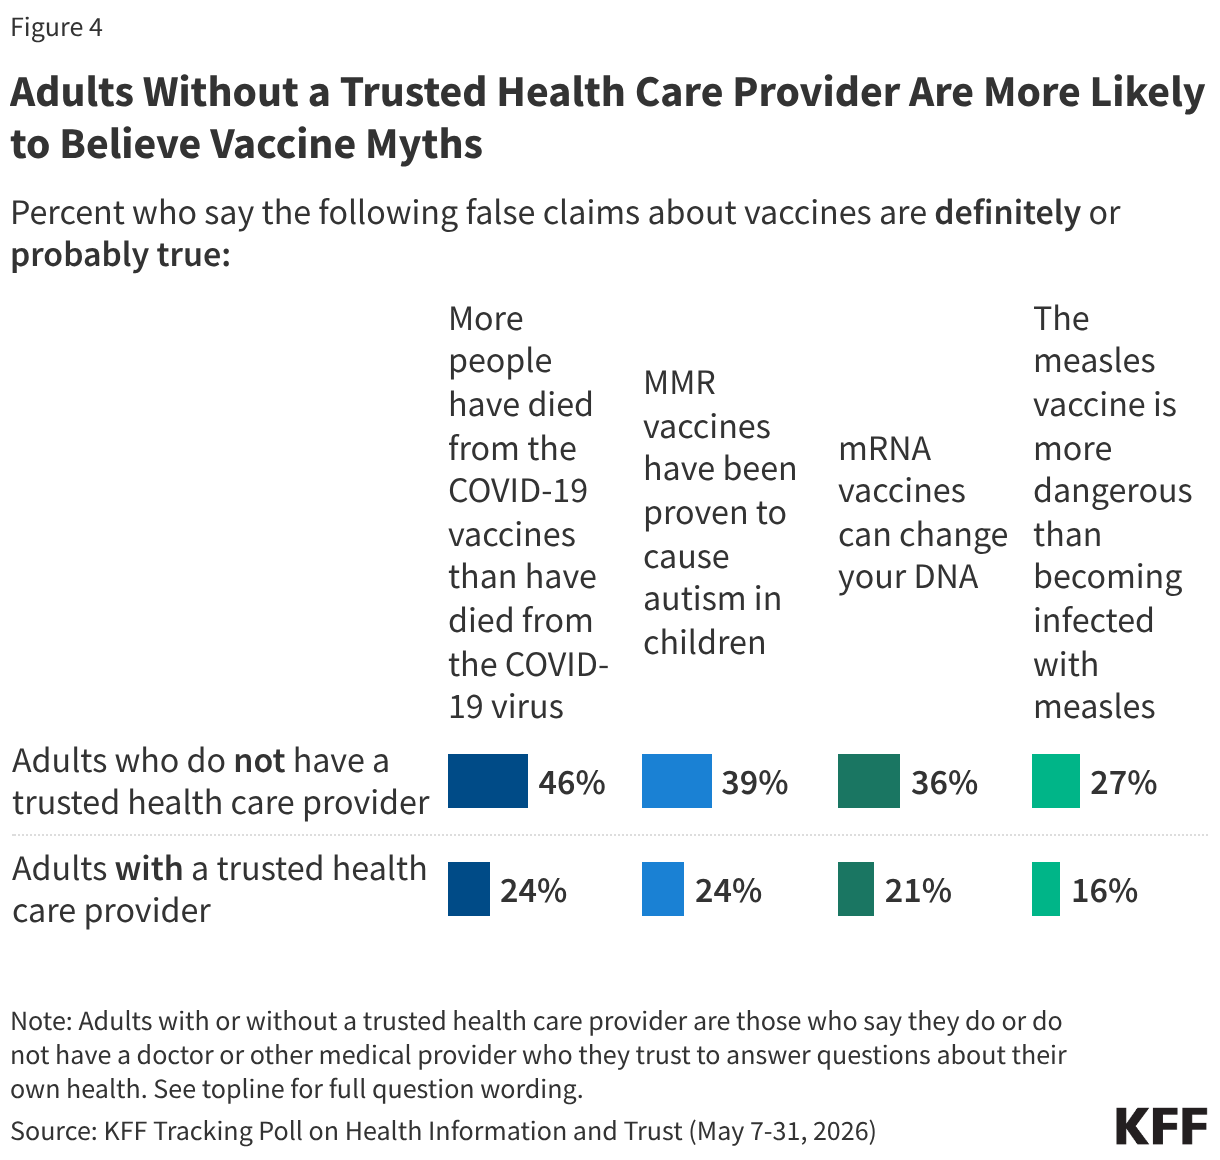
Grouped bar chart showing the percentage of adults who believe four false vaccine claims are definitely or probably true, comparing adults with and without a trusted health care provider.

Frequent health information-seeking on social media and via artificial intelligence (AI) chatbots is also tied to a tendency to believe vaccine myths. Adults who say they use social media for health information and advice at least weekly (26% of all adults) are more likely than those who never use social media for health to say each false vaccine claim is “probably” or “definitely true.” Similarly, adults who report using AI tools or chatbots at least weekly for health advice (20% of all adults) are more likely than those who never use these chatbots to endorse myths about the measles vaccines and mRNA vaccines. For example, the share who say it is “probably” or “definitely true” that MMR vaccines have been proven to cause autism is higher among adults who seek health advice at least weekly from social media (37%) or AI (35%) compared to those who never use social media (16%) or AI (20%) for health advice.

The relationship between belief in vaccine myths and use of social media or AI for health information continues to be significant even when controlling for factors like age, race and ethnicity, education, and partisanship.
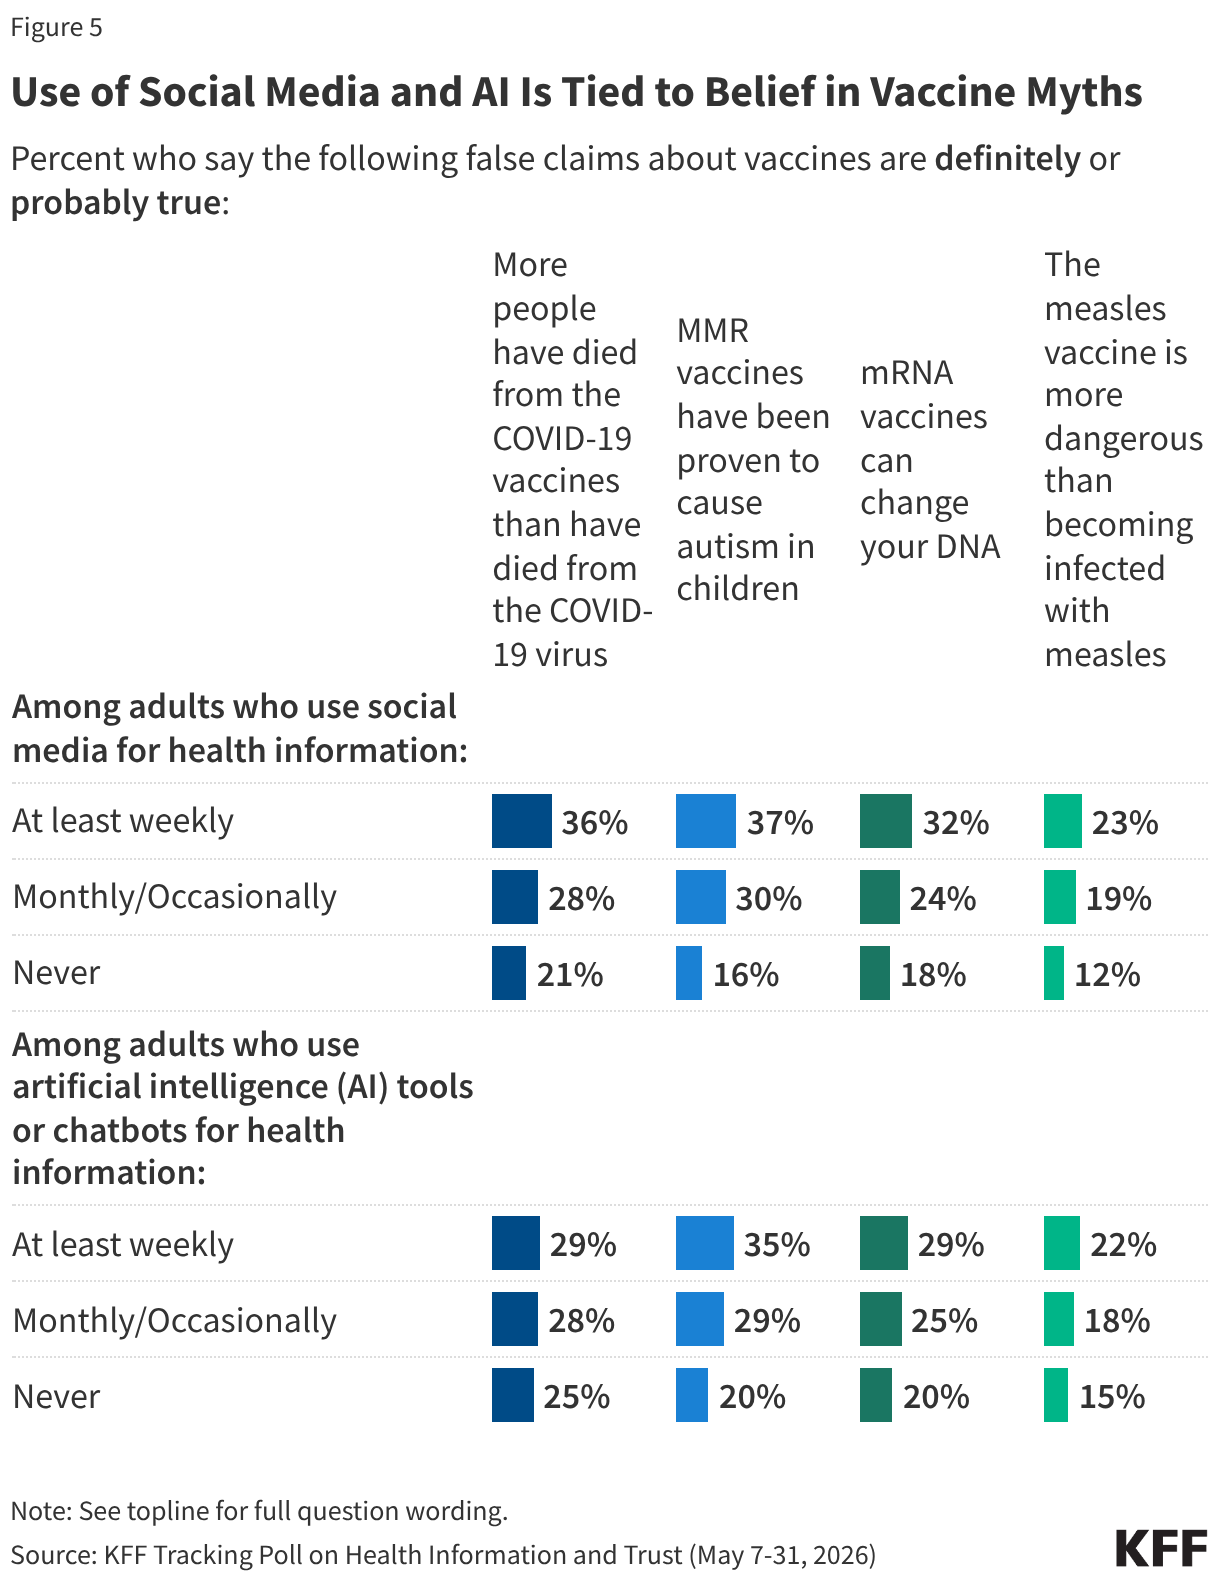
Bar chart showing the percentage of adults who believe four false vaccine claims are definitely or probably true, broken down by how often they use social media and AI tools for health information.

Parents who skip or delay recommended vaccines for their children are about twice as likely as parents who keep their children up to date on vaccines to believe or lean toward believing false claims about the measles and COVID-19 vaccines, underscoring how false health claims may shape parents’ decisions.

Overall, at least three in ten parents say it is “probably” or “definitely true” that MMR vaccines have been proven to cause autism in children (36%), that more people have died from COVID-19 vaccines than the virus (35%), or that mRNA vaccines can alter DNA (29%). About one in four (23%) parents believe or lean toward believing the myth that measles vaccines are more dangerous than measles.

The tendency to endorse these false vaccine claims, however, rises substantially among parents who report not keeping their children up to date on recommended vaccines. Six in ten (57%) parents who report having skipped or delayed recommended childhood vaccines (excluding seasonal vaccines for COVID-19 and flu), say it is either “definitely true” or “probably true” that the MMR vaccines have been proven to cause autism in children, while around half believe or lean toward believing that the COVID-19 vaccines killed more people than the virus (55%), or that mRNA vaccines alter DNA (52%). About four in ten (43%) parents who skipped or delayed childhood vaccines say it is true that the measles vaccines are more dangerous than measles itself. Each of these shares is at least 25 percentage points higher than among parents who report keeping their children up to date on recommended childhood vaccines, a relationship that remains significant even when controlling for factors like age, education, and partisanship. 
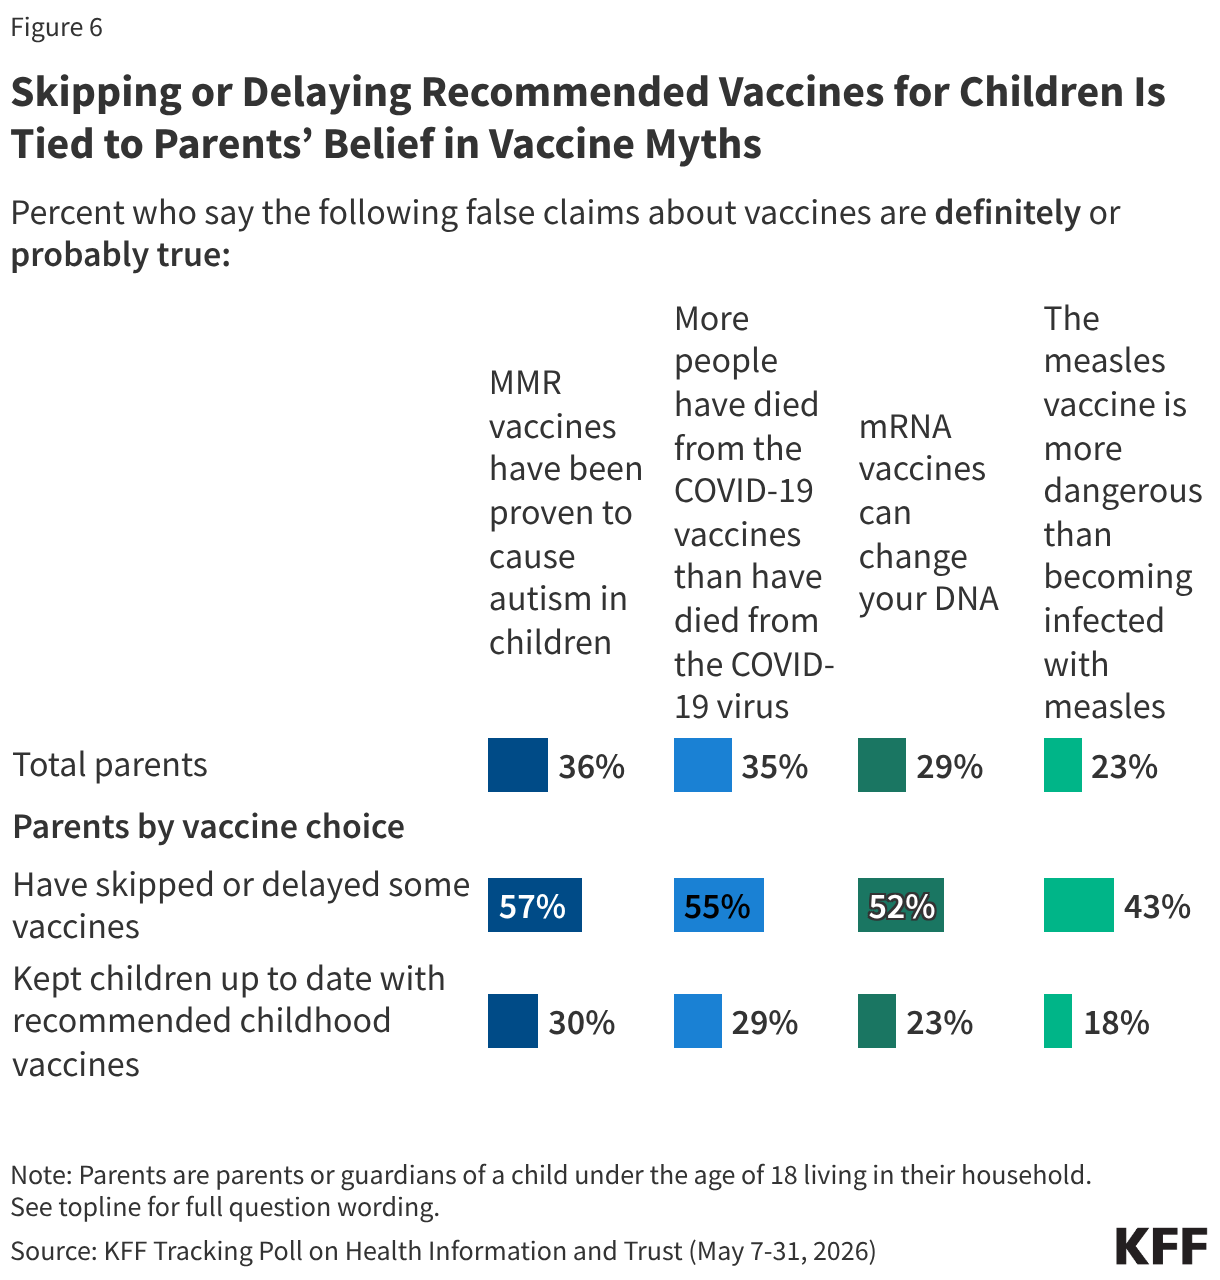
Bar chart showing the percentage of parents who believe four false vaccine claims are definitely or probably true, broken down by total parents and by whether they have skipped or delayed their children's vaccines or kept them up to date.

Digging Deeper on The Malleable Middle: Patterns of Belief Across Vaccine Myths

While KFF polling has routinely found that at least half the public fall in the “malleable middle” when it comes to a wide variety of false health claims, there are nuances within this group that can be examined by looking at patterns of belief across multiple myths rather than examining a single question.

This new typology identified five groups based off patterns of belief across the four false vaccine claims included in this survey:

  • Consistent myth believers (1% of the public) say all four vaccine myths are true, including at least three out of four as “definitely true.”
  • Leaned myth believers (6% of the public) say all four vaccine myths are true but are somewhat uncertain in their beliefs, saying at least two of the four myths are “probably true.”
  • The mixed middle (31% of the public) provide a range of true and false responses and at least half of the time provide a “probably” response (in either the true or false direction).
  • Leaned myth deniers (26% of the public) say all four vaccine myths are false but are somewhat uncertain, saying at least two of the four myths are “probably false.”
  • Consistent myth deniers (29% of the public) say all four vaccine myths are false, including at least three out of four as “definitely false.”

The “mixed middle” group, making up 31% of all adults, reflects a portion of the “malleable middle” that expresses the most uncertainty and does not routinely land on one side when it comes to commonly circulating vaccine falsehoods. The share who fall in the “mixed middle” differs by partisanship, education, race and ethnicity, and age. For example, four in ten Hispanic adults and about a third (35%) of Black adults are part of this group compared to fewer than three in ten white adults (28%). Republicans (44%) are more than twice as likely as Democrats (18%) to be part of this group, while independents (31%) fall in between the two. Those without a college degree (36%) are also 10 percentage points more likely than college graduates (23%) to fall into this mixed middle group. These findings suggest these groups who disproportionately fall in the “mixed middle” may be an important focus for those looking to counter vaccine misinformation and dispel confusion. 
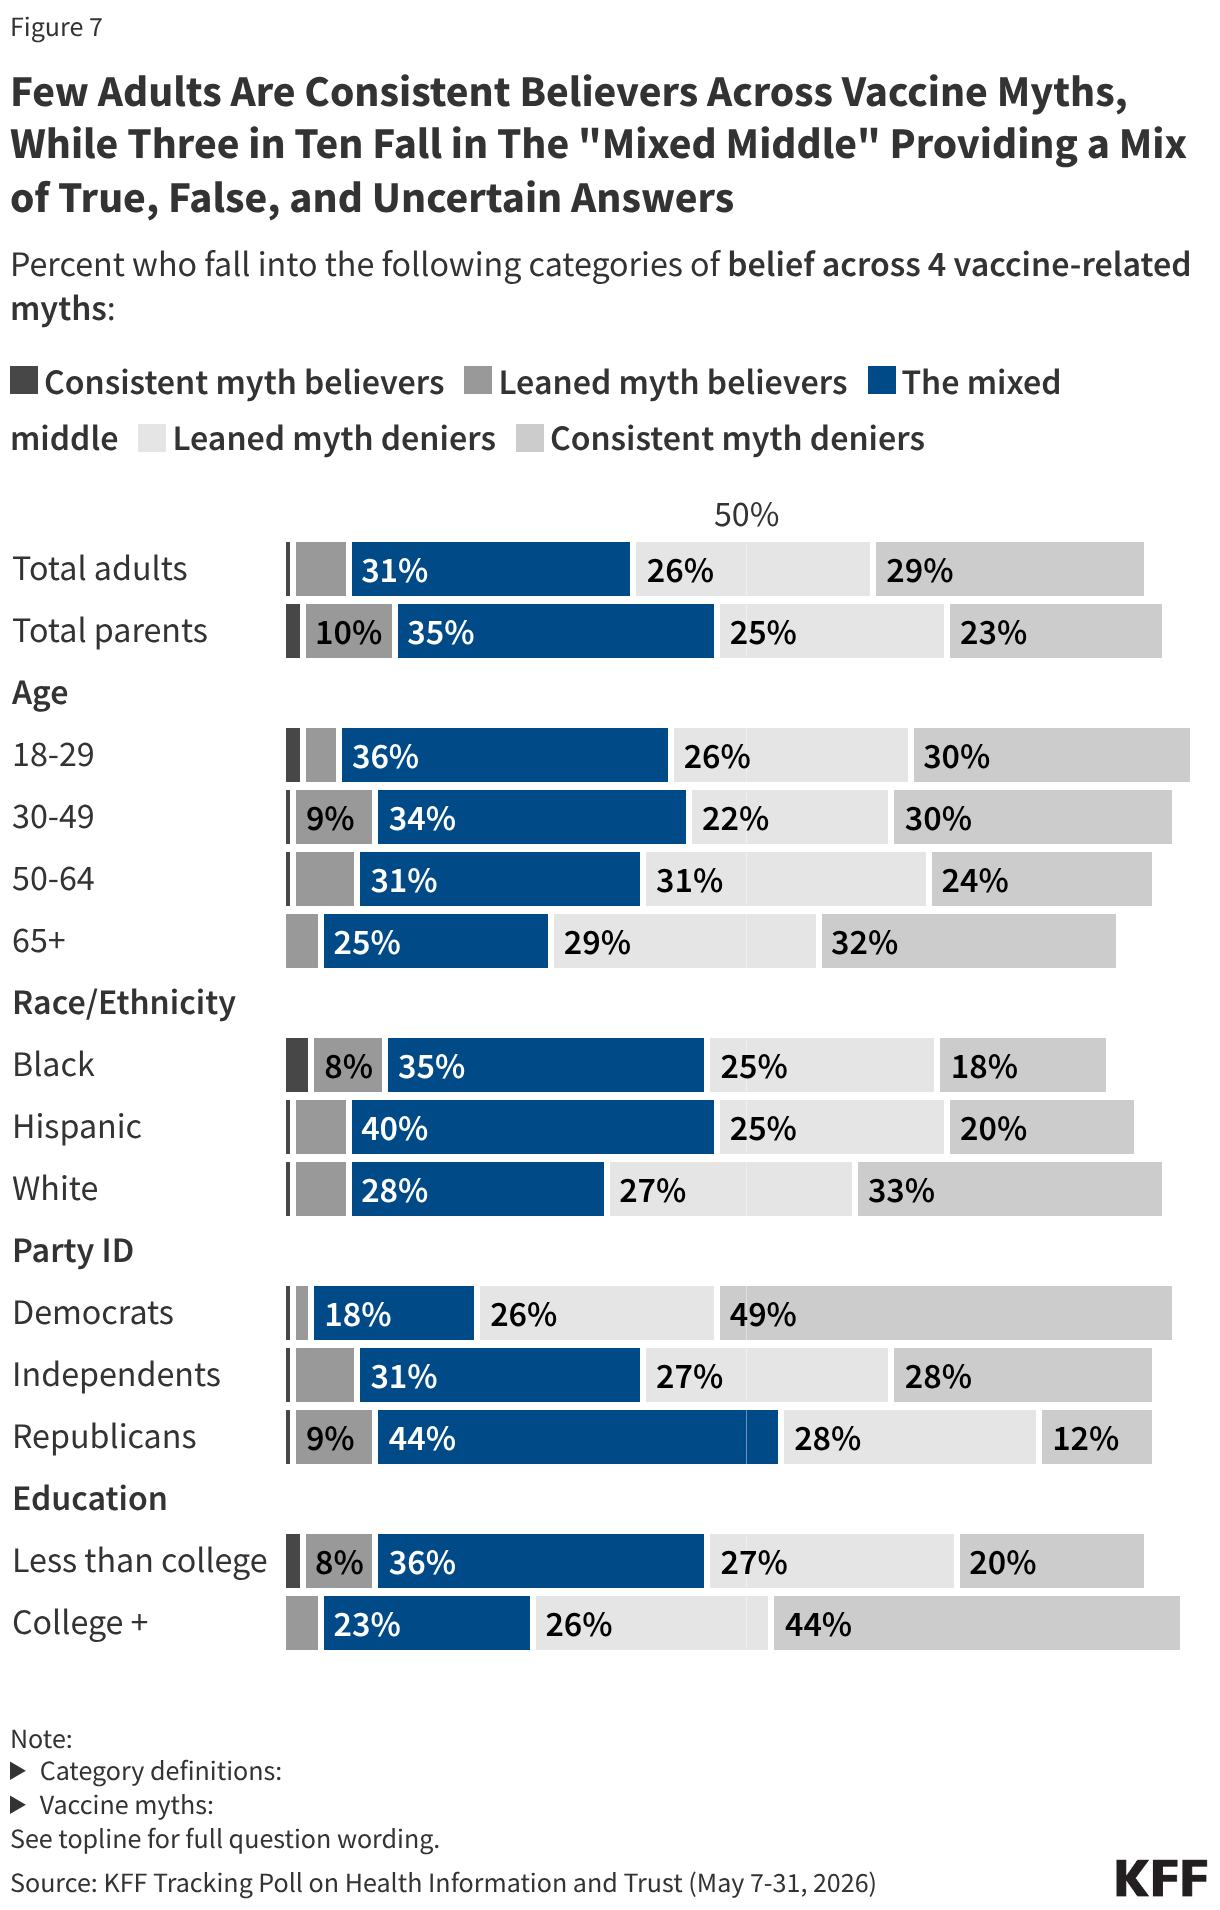
Stacked bar chart showing the percentage of adults who fall into five belief categories — consistent myth believers, leaned myth believers, the mixed middle, leaned myth deniers, and consistent myth deniers — across four vaccine-related myths, broken down by total adults, total parents, age, race and ethnicity, party identification, and education.

Adults who are frequently using social media for health advice are also more likely to lack certainty across vaccine myths, providing a range of mixed answers and saying at least half of the four myths are either “probably true” or “probably false.” When looking at belief across different vaccine myths, adults who report using social media for health information on at least a weekly basis are twice as likely to fall in the “mixed middle” group as those who never use social media for health (41% v. 21%). Adults who use AI tools for health information at least occasionally are also somewhat more likely to fall into the “mixed middle” compared to those who never use AI for health, but the difference is smaller for AI than it is for social media use.
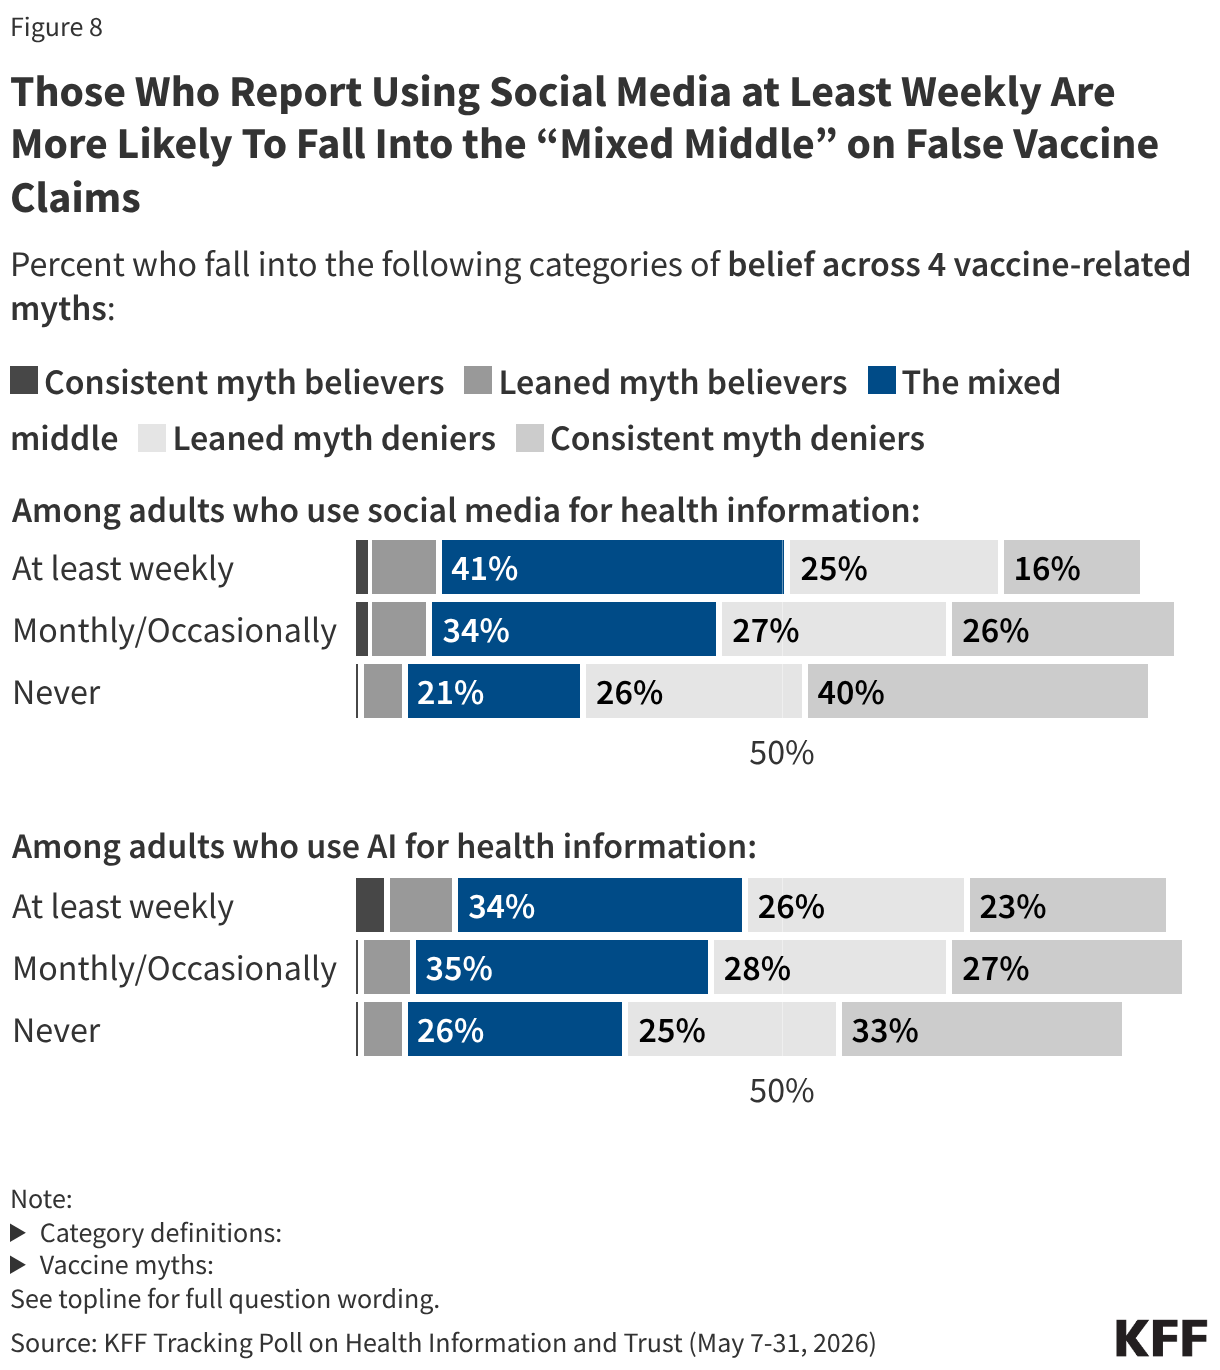
Stacked bar chart showing the percentage of adults who fall into five belief categories — consistent myth believers, leaned myth believers, the mixed middle, leaned myth deniers, and consistent myth deniers — across four vaccine-related myths, broken down by how often they use social media and AI tools for health information.

Nearly half (45%) of parentswho have skipped or delayed recommended vaccines for their children fall in this “mixed middle” group, underscoring the connection between confusion, uncertainty and parents’ decisions to forgo recommended vaccines for their children.
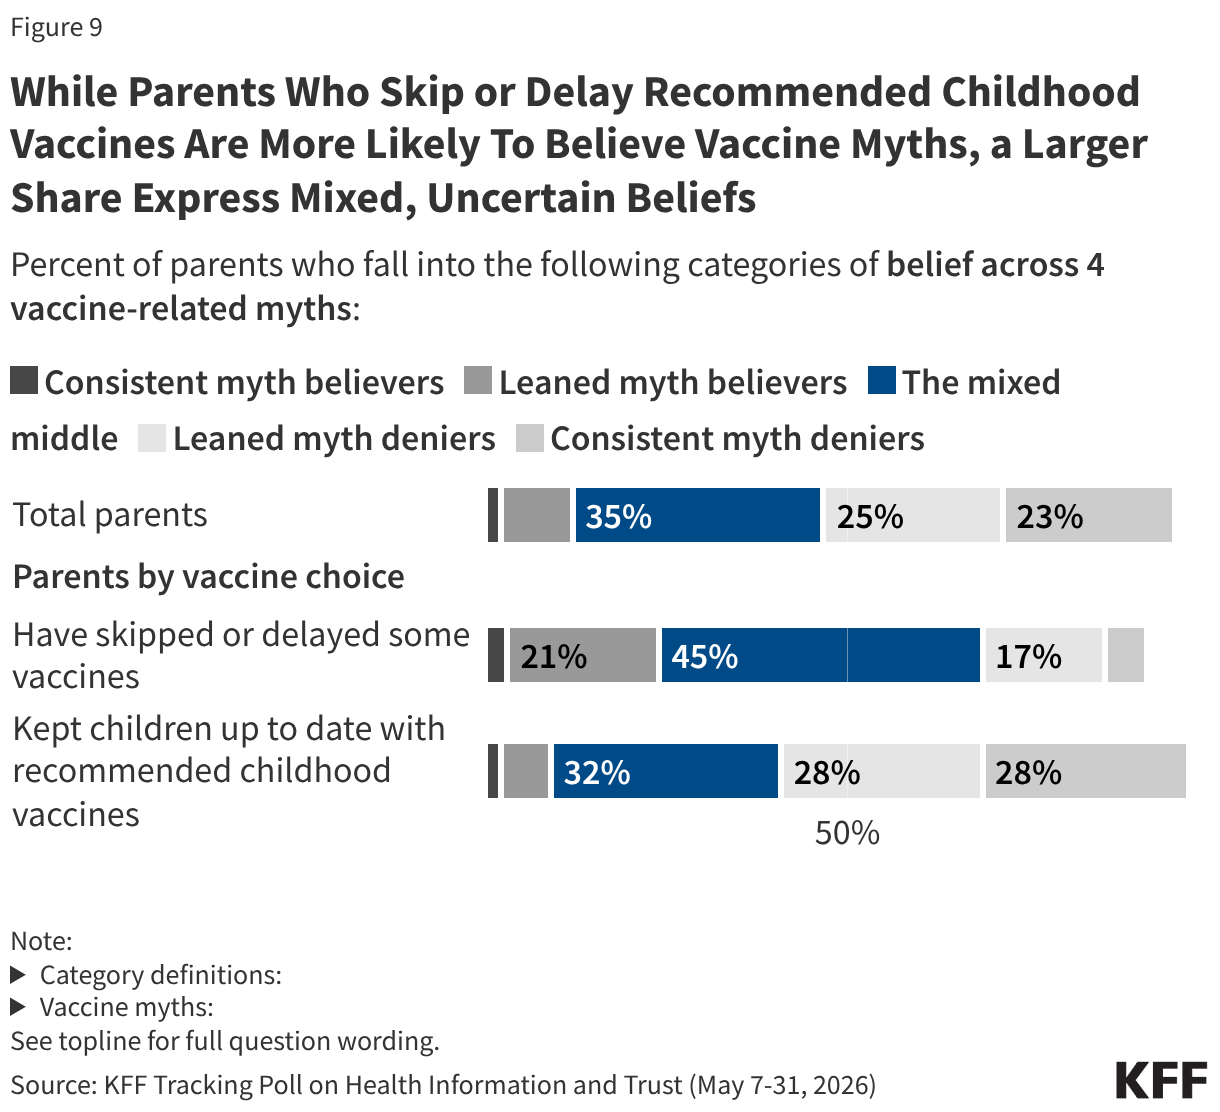
Stacked bar chart showing the percentage of parents who fall into five belief categories — consistent myth believers, leaned myth believers, the mixed middle, leaned myth deniers, and consistent myth deniers — across four vaccine-related myths, broken down by total parents and by whether they have skipped or delayed their children's vaccines or kept them up to date.

This KFF Tracking Poll on Health Information and Trust was designed and analyzed by public opinion researchers at KFF. The survey was conducted May 7 – 31, 2026, online and by telephone among a nationally representative sample of 2,480 U.S. adults in English (2,407) and Spanish (73).

The sample includes 1,977 who were reached through an address-based sample (ABS) and completed the survey online (1,819) or over the phone (158). An additional 503 respondents were reached through a random digit dial telephone (RDD) sample of prepaid (pay-as-you-go) cell phone numbers. Among this prepaid cell phone component, 223 were interviewed by phone and 280 were invited to the web survey via short message service (SMS). Marketing Systems Groups (MSG) provided both the ABS and RDD samples. All fieldwork was managed by SSRS of Glen Mills, PA; sampling design and weighting was done in collaboration with KFF.

Both the ABS and RDD sample frames included disproportionate stratification aimed at reaching Hispanic and non-Hispanic Black respondents. The ABS was also stratified based on model-based prediction of household-members’ party identification (Republican, Democratic, or independent).

Respondents received a $15 incentive for their participation, with interviews completed by phone receiving a mailed check and web respondents receiving an electronic gift card incentive.

In order to ensure data quality, cases were removed if they failed two or more quality checks: (1) attention check questions in the online version of the questionnaire, (2) had over 30% item nonresponse, or (3) had a length less than one quarter of the mean length by mode. Likewise, cases that were reached through ABS who reported a living in a different state than the sampled address were removed for quality assurance. Based on this criterion, 39 cases were removed.

The combined ABS and cell phone samples were weighted to match the sample’s demographics to the national U.S. adult population using data from the Census Bureau’s 2025 Current Population Survey (CPS). The combined sample was weighted by gender by age, gender by education, age by education, race/ethnicity by education, education, race, census region, population density, frequency of internet usage, recalled 2024 vote by quintiles of the county-level 2024 vote share. The weights also take into account differences in the probability of selection for each sample type (ABS and prepaid cell phone). This includes adjustment for the sample design and geographic stratification of the samples, and within household probability of selection. The population density benchmark was from the 2026 Claritas Pop-Facts Premier. The internet frequency benchmarks was from the 2025 National Public Opinion Reference Survey (NPORS) data. The county-level 2024 vote share was from CNN-provided file of 2024 election results by county

The margin of sampling error including the design effect for the full sample is plus or minus 3 percentage points. Numbers of respondents and margins of sampling error for key subgroups are shown in the table below. For results based on other subgroups, the margin of sampling error may be higher. Sample sizes and margins of sampling error for other subgroups are available by request. Sampling error is only one of many potential sources of error and there may be other unmeasured error in this or any other public opinion poll. The following questions included in this survey were designed, analyzed, and paid for by KFF. The demographic questions included in this study were developed and funded jointly by CNN and KFF, with each organization having independent editorial control over its portion of the survey. KFF Public Opinion and Survey Research is a charter member of the Transparency Initiative of the American Association for Public Opinion Research.

GroupN (unweighted)M.O.S.E.
Total2,480± 3 percentage points
   
Race/Ethnicity  
White, non-Hispanic                                                                                       1,355± 3 percentage points
Black, non-Hispanic435± 6 percentage points
Hispanic420± 7 percentage points
   
Age  
18-29399± 7 percentage points
30-49888± 4 percentage points
50-64590± 5 percentage points
65+556± 6 percentage points
   
Party ID  
Democrats774± 5 percentage points
Independents876± 5 percentage points
Republicans607± 5 percentage points
   
Parents of children under 18682± 5 percentage points

Cost and Utilization of Inpatient Mental Health and Substance Use Treatment

Published: Jun 29, 2026

Inpatient treatment for mental health and substance use accounted for 10% of total commercial inpatient stays in 2023 (or 32 per 10,000 enrollees). The average (mean) total inpatient cost (including the share paid by the insurer and the share paid by the patient) for a mental health admission was $15,900 and for a substance use admission was $15,500.

Using claims data from the 2023 Merative MarketScan Commercial Claims Database, this Peterson-KFF analysis describes the most common diagnoses for inpatient treatment and total associated costs, including patients’ out-of-pocket share.

This brief is available through the Peterson-KFF Health System Tracker, an online information hub dedicated to monitoring and assessing the performance of the U.S. health system.

News Release

Nearly Four Million Medicare Beneficiaries Could Be Eligible for the Temporary Medicare GLP-1 Bridge Program Covering These Drugs for Weight Loss

Published: Jun 29, 2026

A new KFF analysis finds that 3.8 million Medicare beneficiaries met the criteria to be eligible for the new Medicare GLP-1 Bridge, based on claims data from 2023.

The temporary 18-month program, launching on July 1 and running through December 2027, will provide coverage of three GLP-1s (Wegovy, Zepbound, and Foundayo) used for weight reduction and weight management to eligible beneficiaries who are enrolled in Medicare Part D.

The total cost to the federal government of the program will depend in part on what share of eligible beneficiaries participate, how quickly they take up coverage, and how many prescriptions each participating beneficiary fills during the 18-month period.

Based on the estimated 3.8 million Part D enrollees eligible, if 10% to 25% participate in Bridge beginning in July 2026 and fill a prescription each month for the duration of the program, the cost to Medicare would be $1.3 billion to $3.3 billion (at a net monthly cost of $245 minus the $50 beneficiary copay). If participation instead ranged from 50% to 75%, the cost to Medicare would be between $6.7 billion and $10 billion.

The clinical criteria for determining a Part D enrollee’s eligibility for Bridge include having a BMI of 35 or more; or having a BMI of 27 or more along with certain comorbid conditions. In addition, eligibility is limited to Part D enrollees who don’t have conditions treated by GLP-1 drugs that are currently covered under Part D, such as type 2 diabetes, and who have not filled a GLP-1 prescription in their Part D plan in 2026.

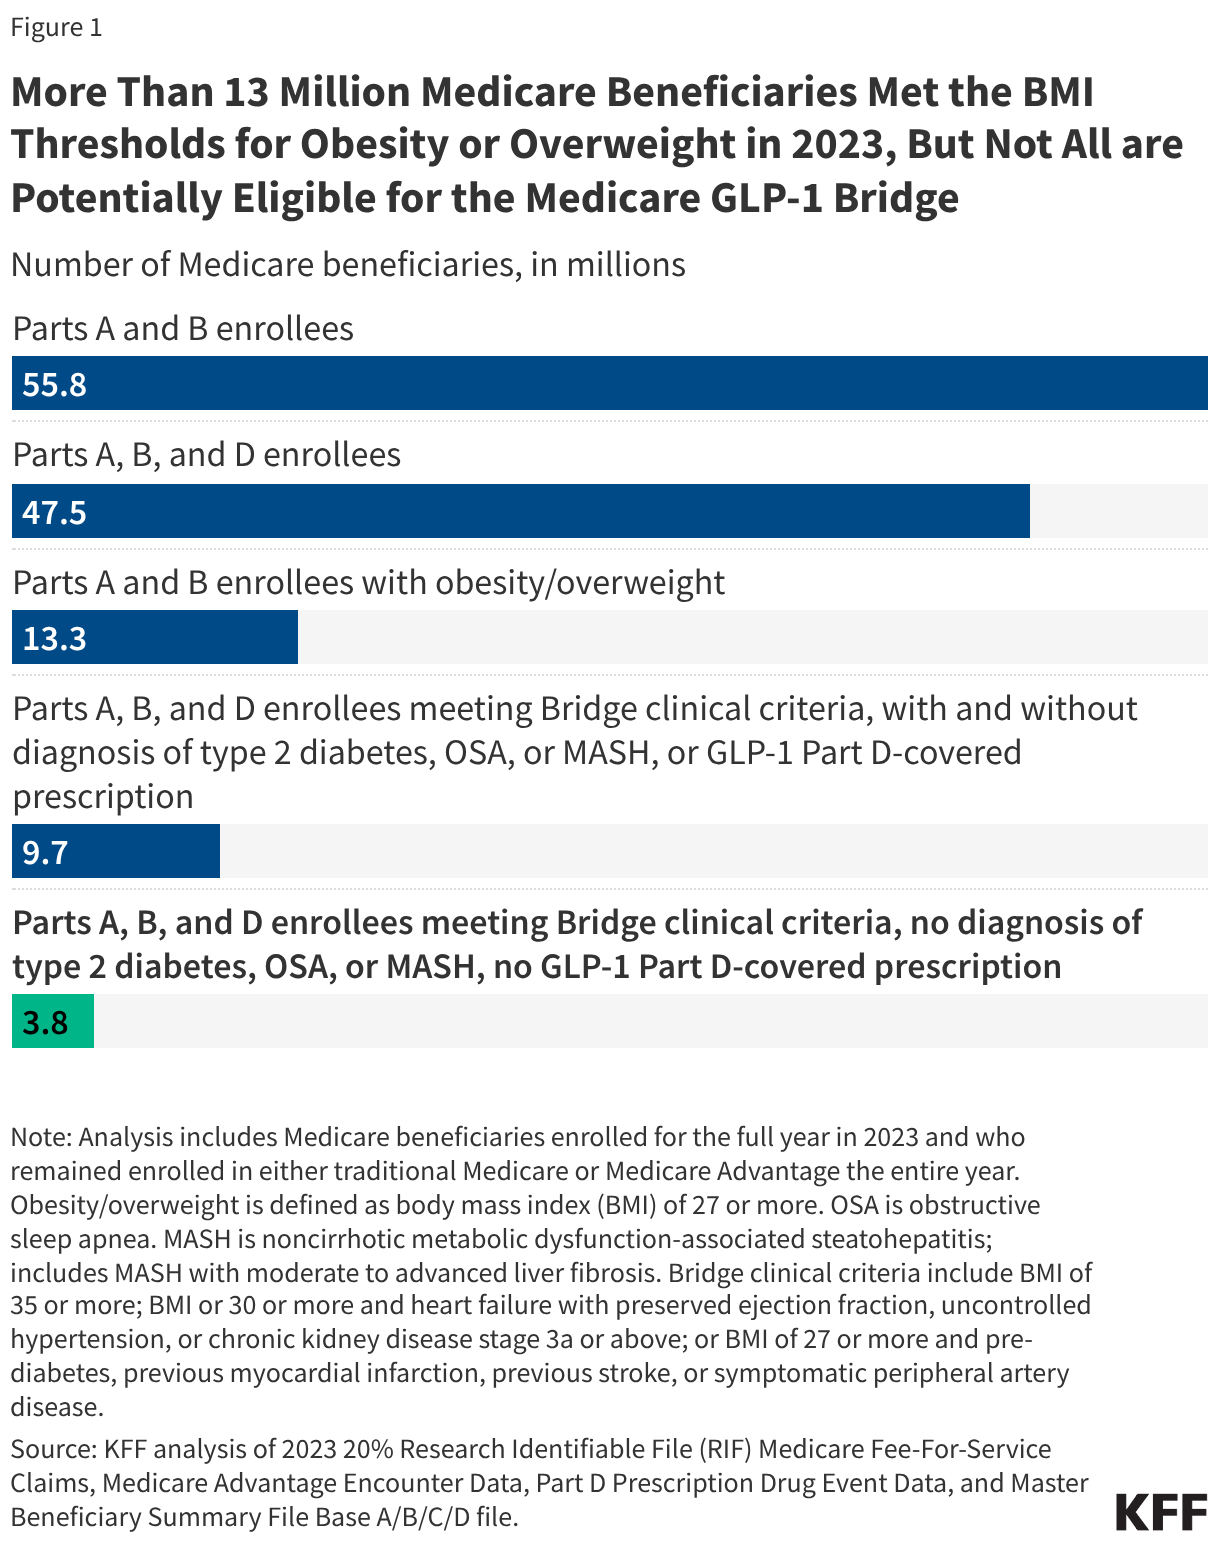
Although more than 13 million Medicare beneficiaries met the BMI thresholds for obesity or overweight based on diagnosis data in 2023, the analysis shows that a smaller group –9.7 million beneficiaries — were enrolled in Part D and met the clinical criteria for the Medicare-GLP-1 Bridge, and an even smaller subset — 3.8 million – met all of the eligibility criteria. That is because the potentially eligible population for Bridge is not as broad as if the program were targeted to all Medicare beneficiaries with obesity or overweight.

Tennessee Plans to Share Data on Children with Disabilities with Immigration Authorities

Published: Jun 29, 2026

According to recent news reports, the families of about 400 children with disabilities who are enrolled in Tennessee’s Children’s Special Services (CSS) program received notices from the state health department in early June stating that if their child continued to remain enrolled in CSS beyond June 30, 2026, their information would be reported to a central state immigration enforcement agency. However, following a lawsuit filed by physicians in the state, a judge issued a temporary restraining order on June 24, 2026, to prevent this data sharing from taking place. Tennessee is one of at least six states that have taken actions as of June 2026 to require state agencies to report applicants or recipients of Medicaid and/or other public benefits whose immigration status could not be verified and/or who were verified to not have lawful presence with immigration enforcement authorities. Under longstanding federal law, Medicaid and other federally funded health coverage are already limited to lawfully present immigrants.

In Tennessee, the legislation requires every state governmental entity, local governmental entity, and local health department to verify that each applicant who is 18 years of age or older and applies for a federal, state, or local public benefit is a United States citizen or lawfully present immigrant. It also requires these entities to report all identifying information for individuals who are not lawfully present and who receive federal, state, or local public benefits to the state’s centralized immigration enforcement division and makes it a criminal offense for an employee or official to intentionally fail to report an individual who is not lawfully present.

Tennessee has interpreted this law to include its CSS program, although Tennessee Representative Steve Cohen wrote a letter to Governor Bill Lee indicating that the law reads as limited to applicants who are at least 18 years old. Tennessee’s CSS program provides care coordination and payment assistance for certain services to people under age 21 whose family income is at or below 225% of the federal poverty level and who have a physical disability, such as cerebral palsy, cystic fibroses, sickle cell anemia or other serious medical conditions without immigrant eligibility restrictions. A recent report indicates more than 4,600 children in Tennessee are enrolled in CSS.

Health care providers and advocates in the state have warned that this data sharing will likely lead families to stop participating in the program, which could lead to disruptions in care that have life threatening consequences. Reporting requirements could also have “chilling effects” that lead to disenrollment and forgone enrollment among a broader group of families than those subject to the new reporting requirements due to confusion and fear. 

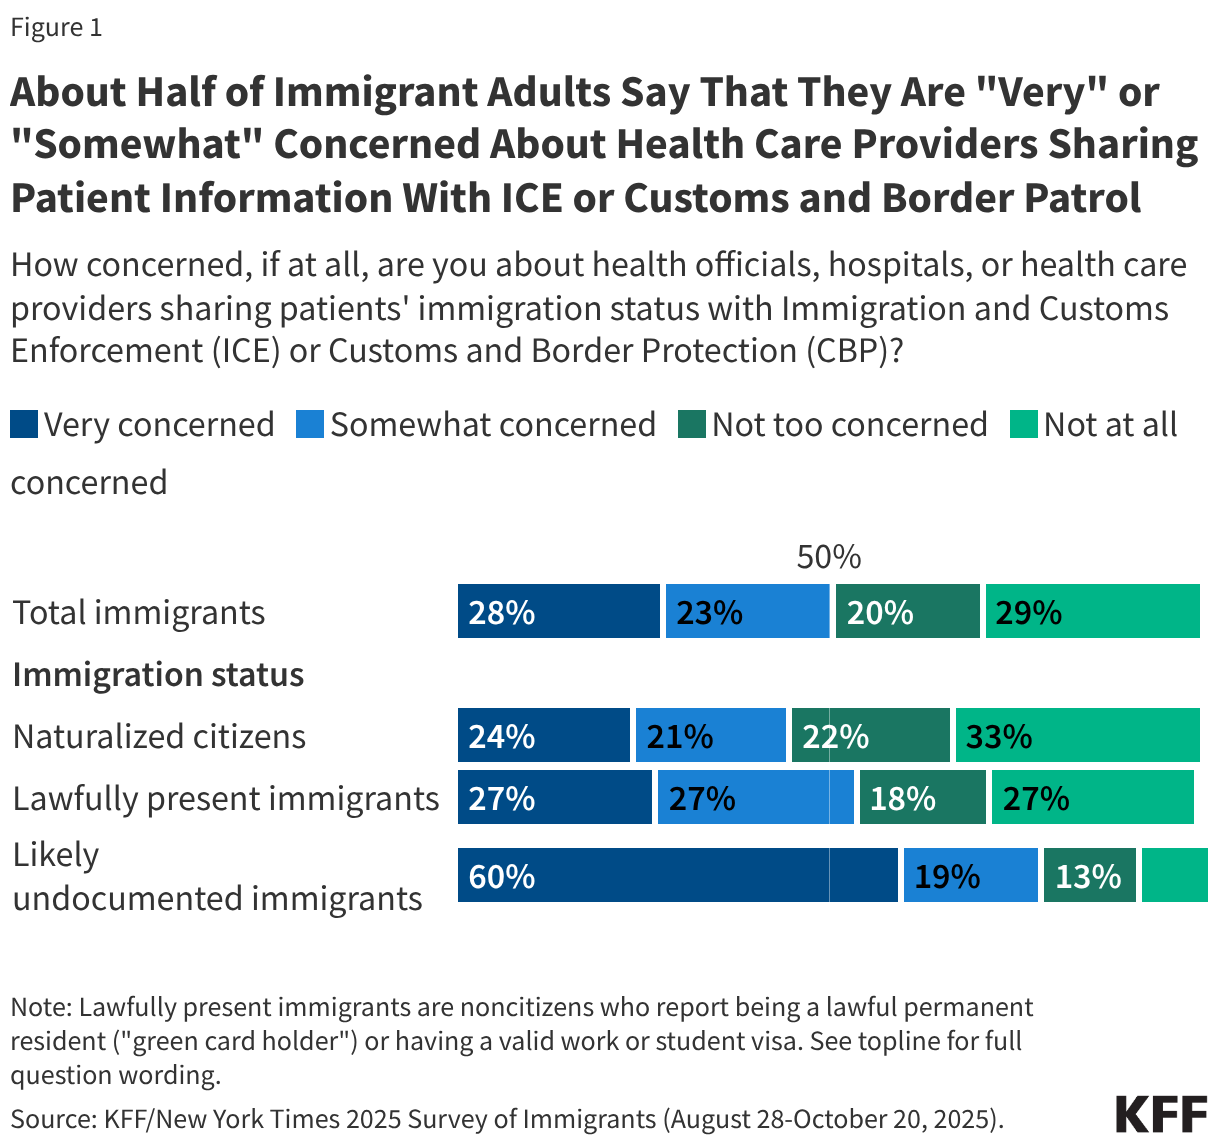
A 2025 national KFF survey shows that the share of immigrant adults who said they avoided applying for a government program that helps pay for food, housing, or health care in the past 12 months because they did not want to draw attention to their or a family member’s immigration status rose from 8% to 12% between 2023 and 2025. Further, 11% of immigrant adults say they have stopped participating in such a program since January 2025 because of immigration-related worries, including about four in ten (42%) of those who are likely undocumented and about one in six (17%) parents. Moreover, about half (51%) of immigrant adults overall and about eight in ten (78%) of those who are likely undocumented said they are “somewhat” or “very” concerned about health officials or providers sharing patient information with immigration enforcement officials (Figure 1). These data were collected prior to recent state-level actions to share data on immigrant families with immigration enforcement officials.

About Half of Immigrant Adults Say That They Are "Very" or "Somewhat" Concerned About Health Care Providers Sharing Patient Information With ICE or Customs and Border Patrol (Stacked Bars)

Beyond the data sharing actions in Tennessee and several other states, in July 2025, the Centers for Medicare and Medicaid Services (CMS) and U.S. Immigration and Customs Enforcement (ICE) established an Information Exchange Agreement that enables immigration enforcement officials to access the personal data of millions of Medicaid enrollees to help identify and locate “aliens in the United States.” This data sharing represents a reversal in prior policy that asserted CMS would not share such information and ICE would not use such information for immigration enforcement purposes, with assurances made to the public, applicants and enrollees, health care providers, and states that information collected to determine eligibility for health coverage programs would not be used for immigration enforcement. The administration also has directed the Internal Revenue Service to share personal information of individuals for immigration enforcement purposes, although these actions are facing court challenges.

Nearly Four Million Medicare Beneficiaries Met the Eligibility Criteria in 2023 for the Medicare GLP-1 Bridge

Published: Jun 29, 2026

On July 1, 2026, the Centers for Medicare & Medicaid Services (CMS) will roll out a new, temporary program covering GLP-1s for obesity for people with Medicare. The program, known as the Medicare GLP-1 Bridge, provides coverage of GLP-1s used for weight reduction and weight management to eligible beneficiaries enrolled in Medicare Part D, although the program will operate outside of the Part D benefit and payment system. Under the Medicare GLP-1 Bridge, eligible beneficiaries can get Medicare coverage of GLP-1s for obesity for a $50 monthly copayment, which will not count towards the Part D deductible or out-of-pocket spending cap and Part D Low-Income Subsidy cost-sharing assistance will not apply. The temporary program, running from July 2026 through December 2027, does not change the current statutory prohibition on Medicare coverage of drugs used for weight loss but instead is being established using the federal government’s Section 402 demonstration authority.

The Medicare GLP-1 Bridge will provide coverage of three GLP-1s (Wegovy, Zepbound, and Foundayo) that have been approved by the FDA for chronic weight management in adults with obesity (BMI of 30 or more) or adults with overweight (BMI of 27 or more) plus a weight-related comorbid condition. The clinical criteria for determining eligibility for the Medicare GLP-1 Bridge are somewhat more restrictive than the FDA approvals, however, and include Part D enrollees with a BMI of 35 or more; with a BMI of 30 or more and heart failure with preserved ejection fraction, uncontrolled hypertension, or chronic kidney disease stage 3a or above; or with a BMI of 27 or more and pre-diabetes, previous myocardial infarction, previous stroke, or symptomatic peripheral artery disease.

Eligibility for the Medicare GLP-1 Bridge will also be limited to Medicare beneficiaries who have not filled a prescription under their Part D plan for a GLP-1 in 2026, and who do not have a diagnosis with a condition that is a medically accepted indication for a GLP-1 drug that could be covered under Part D (specified by CMS as type 2 diabetes, obstructive sleep apnea (OSA), and noncirrhotic metabolic dysfunction-associated steatohepatitis (MASH)), even if they otherwise meet the clinical criteria. These limits are designed to prevent GLP-1 use that could be covered under Part D from shifting to the Medicare GLP-1 Bridge and will also help to limit the cost of the program to Medicare. As part of the prior authorization process for Bridge, prescribing clinicians will need to attest that the GLP-1 prescription is for weight reduction and weight management and that beneficiaries meet the clinical criteria and do not have a diagnosis of type 2 diabetes, OSA, or MASH that would make them eligible for GLP-1 coverage under Part D.

CMS has not released an estimate of how many beneficiaries could be eligible for the Medicare GLP-1 Bridge, although the director of Medicare at CMS, Chris Klomp, recently stated the agency anticipates the program will start with “single-digit millions” of beneficiaries. This analysis uses 2023 Medicare claims for traditional Medicare, Medicare Advantage encounter data, and Part D prescription drug event data to estimate the total number of Medicare beneficiaries with obesity or overweight, the number of Part D enrollees who met the Bridge eligibility criteria in 2023, and those who met the Bridge clinical criteria but who also had diagnoses recorded in claims or encounter data that would qualify for Part D coverage of GLP-1s (type 2 diabetes, OSA, or MASH) or who had a GLP-1 Part D-covered prescription during the year, either of which would make them ineligible for Bridge (see Methods).

More than 13 million Medicare beneficiaries met the BMI thresholds for obesity or overweight in 2023, but not all are potentially eligible for the Medicare GLP-1 Bridge. In 2023, an estimated 13.3 million Medicare beneficiaries enrolled in Parts A and B had obesity or overweight, based on having BMI of 27 or more recorded in claims or encounter data, or 24% of Medicare beneficiaries overall (Figure 1). (This estimate could be conservative to the extent that not all beneficiaries with obesity or overweight may have a claims-based diagnosis.) However, the potentially eligible population for the Medicare GLP-1 Bridge is not as broad as if the program were targeted to all people with Medicare with obesity or overweight. As detailed below, an estimated 3.8 million beneficiaries could be eligible for Bridge as of 2023, based on meeting all the eligibility criteria.

More Than 13 Million Medicare Beneficiaries Met the BMI Thresholds for Obesity or Overweight in 2023, But Not All are Potentially Eligible for the Medicare GLP-1 Bridge (Bar Chart)

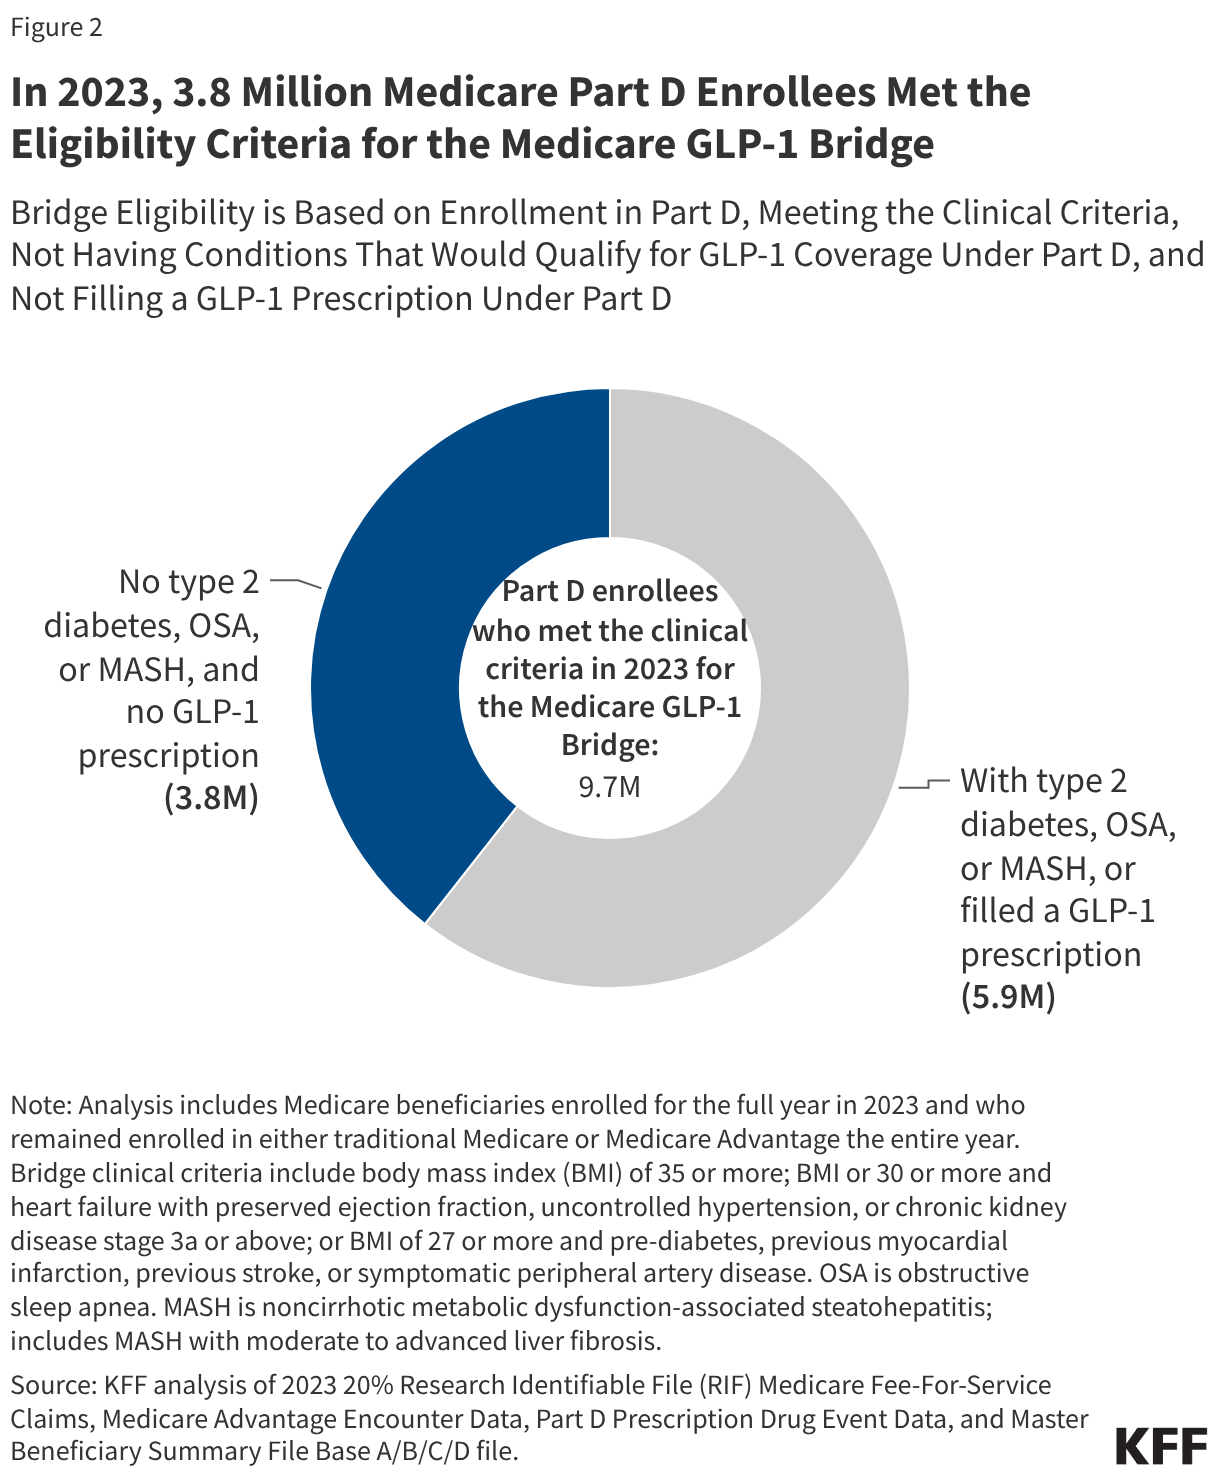
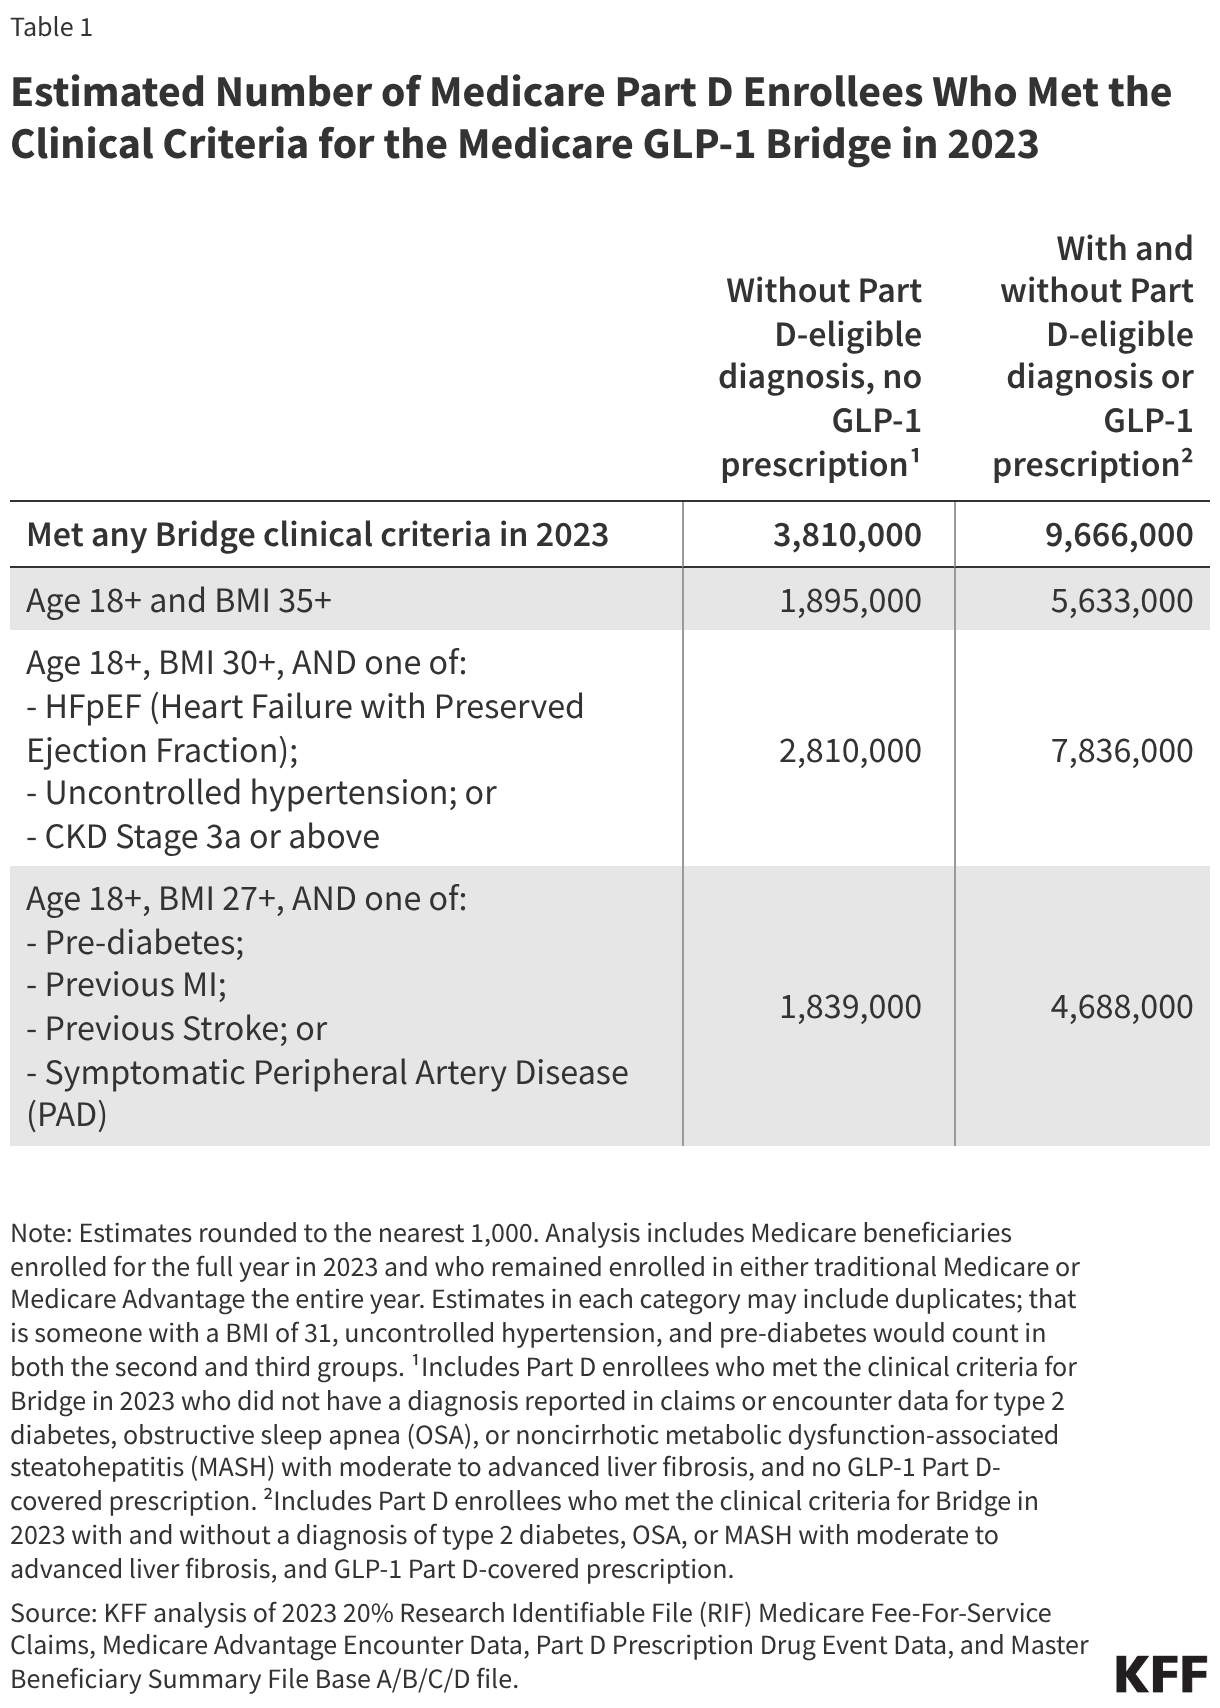
Among the 47.5 million Medicare Part D enrollees in 2023, 9.7 million enrollees met the clinical criteria for the Medicare GLP-1 Bridge in 2023, but less than half of this group—3.8 million (39%)—is estimated to be eligible for Bridge (Figure 2, Table 1). These 3.8 million Part D enrollees met the clinical criteria, did not have a diagnosis of type 2 diabetes, OSA, or MASH, or a GLP-1 Part D-covered prescription in 2023, and could be eligible for the Medicare GLP-1 Bridge, assuming no changes in diagnosis or GLP-1 use in Part D in 2026. This estimate, which includes Part D enrollees in traditional Medicare and Medicare Advantage, represents 8% of Medicare Part D enrollees and 7% of the total population enrolled in Medicare Part A and Part B for the entire year in 2023. The other 5.9 million Part D enrollees met the clinical criteria but also had claims or encounter data recording a diagnosis of type 2 diabetes, OSA, or MASH, and/or had a GLP-1 Part D-covered prescription, either of which would make them ineligible for Bridge.

In 2023, 3.8 Million Medicare Part D Enrollees Met the Eligibility Criteria for the Medicare GLP-1 Bridge (Donut Chart)

The total cost to the federal government of the Medicare GLP-1 Bridge will depend in part on how many beneficiaries are eligible in 2026 and 2027, what share of them participate, how quickly they initiate use under the program after it begins, and how many prescriptions each participating beneficiary fills during the 18-month period. While take-up is uncertain, interest in the program among potentially eligible Medicare beneficiaries is likely to be strong. Based on the estimated 3.8 million Part D enrollees eligible for the Medicare GLP-1 Bridge as of 2023, if 10% to 25% participate in Bridge from when the program launches in July 2026 and fill a prescription each month for the 18-month duration of the program, the cost to Medicare would be $1.3 billion to $3.3 billion (at a net monthly cost of $245 minus the $50 beneficiary copay). Assuming higher participation rates ranging from 50% to 75%, the cost to Medicare would be between $6.7 billion and $10 billion. The ultimate cost to the federal government of the Medicare GLP-1 Bridge will depend on actual participation numbers and adherence during the 18-month program, as well as potential cost offsets from savings that might accrue over time due to beneficiary health improvements from GLP-1 use for weight reduction and weight management.

Estimated Number of Medicare Part D Enrollees Who Met the Clinical Criteria for the Medicare GLP-1 Bridge in 2023 (Table)

Methods

This analysis mapped ICD-10 codes to the clinical criteria specified by CMS for the Medicare GLP-1 Bridge and utilized the 2023 20% Research Identifiable File (RIF) Medicare Fee-For-Service Claims and Medicare Advantage Encounter Data to create condition flags, along with the Part D Prescription Drug Event data to create a flag for GLP-1 use. The 2023 RIF Master Beneficiary Summary File (Base A/B/C/D file) was used to identify individuals to include in the analysis, which were then weighted to produce population estimates. To be included in the analysis of diagnosis with obesity or overweight, an individual was required to have coverage under Parts A and B for all months of 2023, not have switched between traditional Medicare and Medicare Advantage during the year, and remain living for the entire year. To be included in the Bridge eligibility analysis, an individual was required to have coverage for Parts A, B, and D for all months of 2023, not have switched between traditional Medicare and Medicare Advantage during the year, and remain living for the entire year. Individuals were grouped based on their insurance type (traditional Medicare or Medicare Advantage) for 2023. Individuals received a condition flag if they had one or more claims/encounters that matched a respective ICD-10 code mapped onto one of the Bridge clinical criteria in an inpatient, outpatient, carrier, home health, or skilled nursing facility setting in 2023. Individuals received a GLP-1 user flag if they had one or more Part D prescription drug event claims for a GLP-1 medication in 2023.

Diagnoses on Medicare Advantage chart reviews were not included in the creation of the condition flags. This produces a somewhat more conservative estimate of Medicare Advantage enrollees who could be eligible for the Medicare GLP-1 Bridge.

This work was supported in part by Arnold Ventures. KFF maintains full editorial control over all of its policy analysis, polling, and journalism activities.

Tracking Insurer Participation Changes in the ACA Marketplaces in 2027

Authors: Jared Ortaliza, Justin Lo, Lynne Cotter, Matt McGough, and Cynthia Cox
Published: Jun 29, 2026

Editorial Note: Originally published on June 11, 2026, this brief has been updated to reflect additional information about carriers’ plans for 2027. 

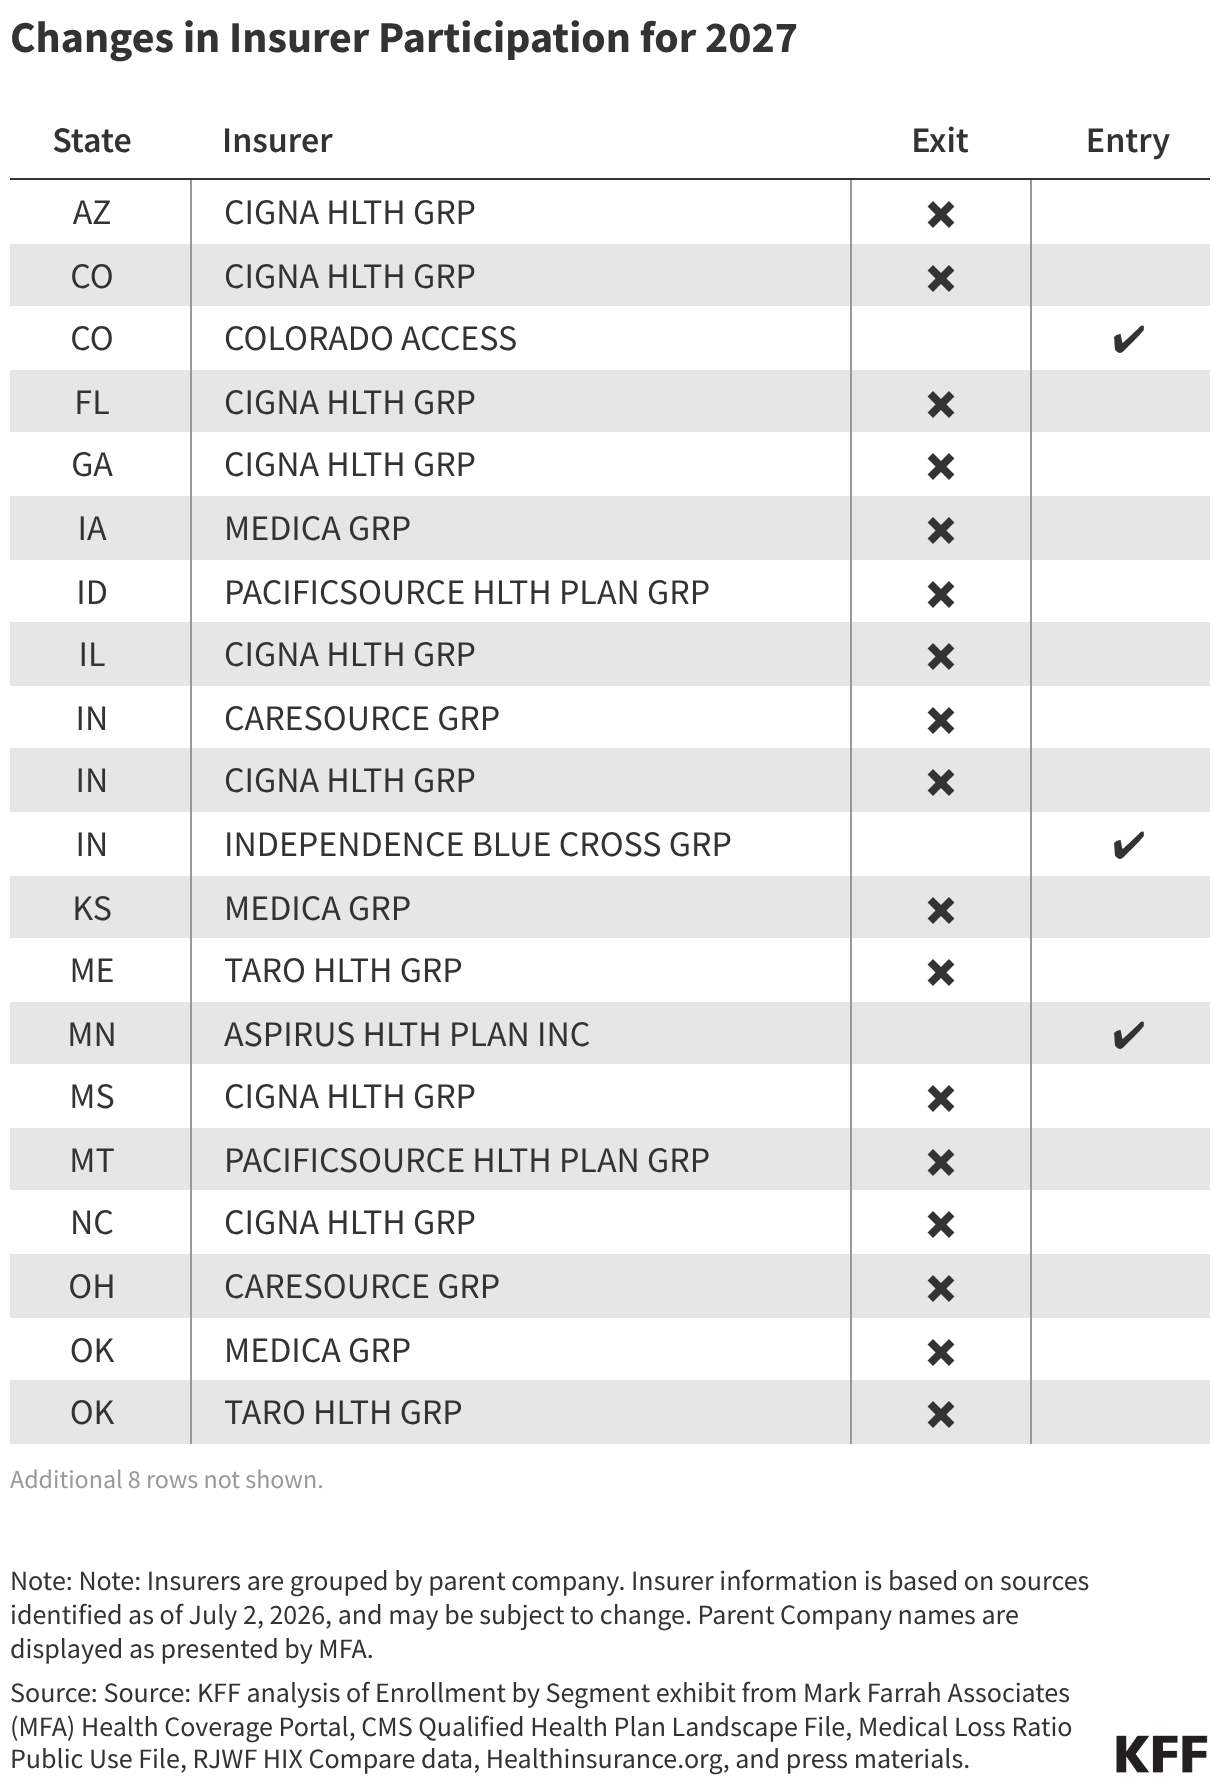
As of July 30, 2026, seven carriers have announced that they will exit the ACA Marketplaces in plan year 2027, either in some or all states that they are currently offering plans; five carriers have announced they will enter new state Marketplaces. These changes in insurer participation follow the expiration of the enhanced premium tax credits at the end of 2025, which drove sign-ups to fall by over a million from the 2025 to 2026 Open Enrollment Periods—with further membership declines in the ACA Marketplaces expected as the year progresses. ACA Marketplace enrollment declines affect the size of the potential market for insurers, and, potentially, the risk pool—to the extent that healthier than average enrollees are more likely to drop coverage.

As people leave the Marketplace, insurers may reassess the profitability of their Marketplace participation and decide to pull out in the future. Cigna has decided to leave the individual market in 2027 to focus on other segments given the lack of potential to grow their ACA Marketplace business. Cigna, which reported first-quarter on-exchange enrollment of over 350,000 individuals, will exit the 11 states in which it currently participates both on- and off-exchange. In some cases, multiple insurers are announcing exits in the same state. In some states, with fewer insurers participating in the ACA Marketplaces, remaining insurers will have less competition and consumers will be left with fewer choices.

Changes in Insurer Participation for 2027 (Table)

VOLUME 49

KFF Poll Shows Three in Ten Adults Turn to Social Media or AI for Health Information, with Lower-Income Adults More Likely to Cite Cost and Access Barriers as a Reason


Highlights

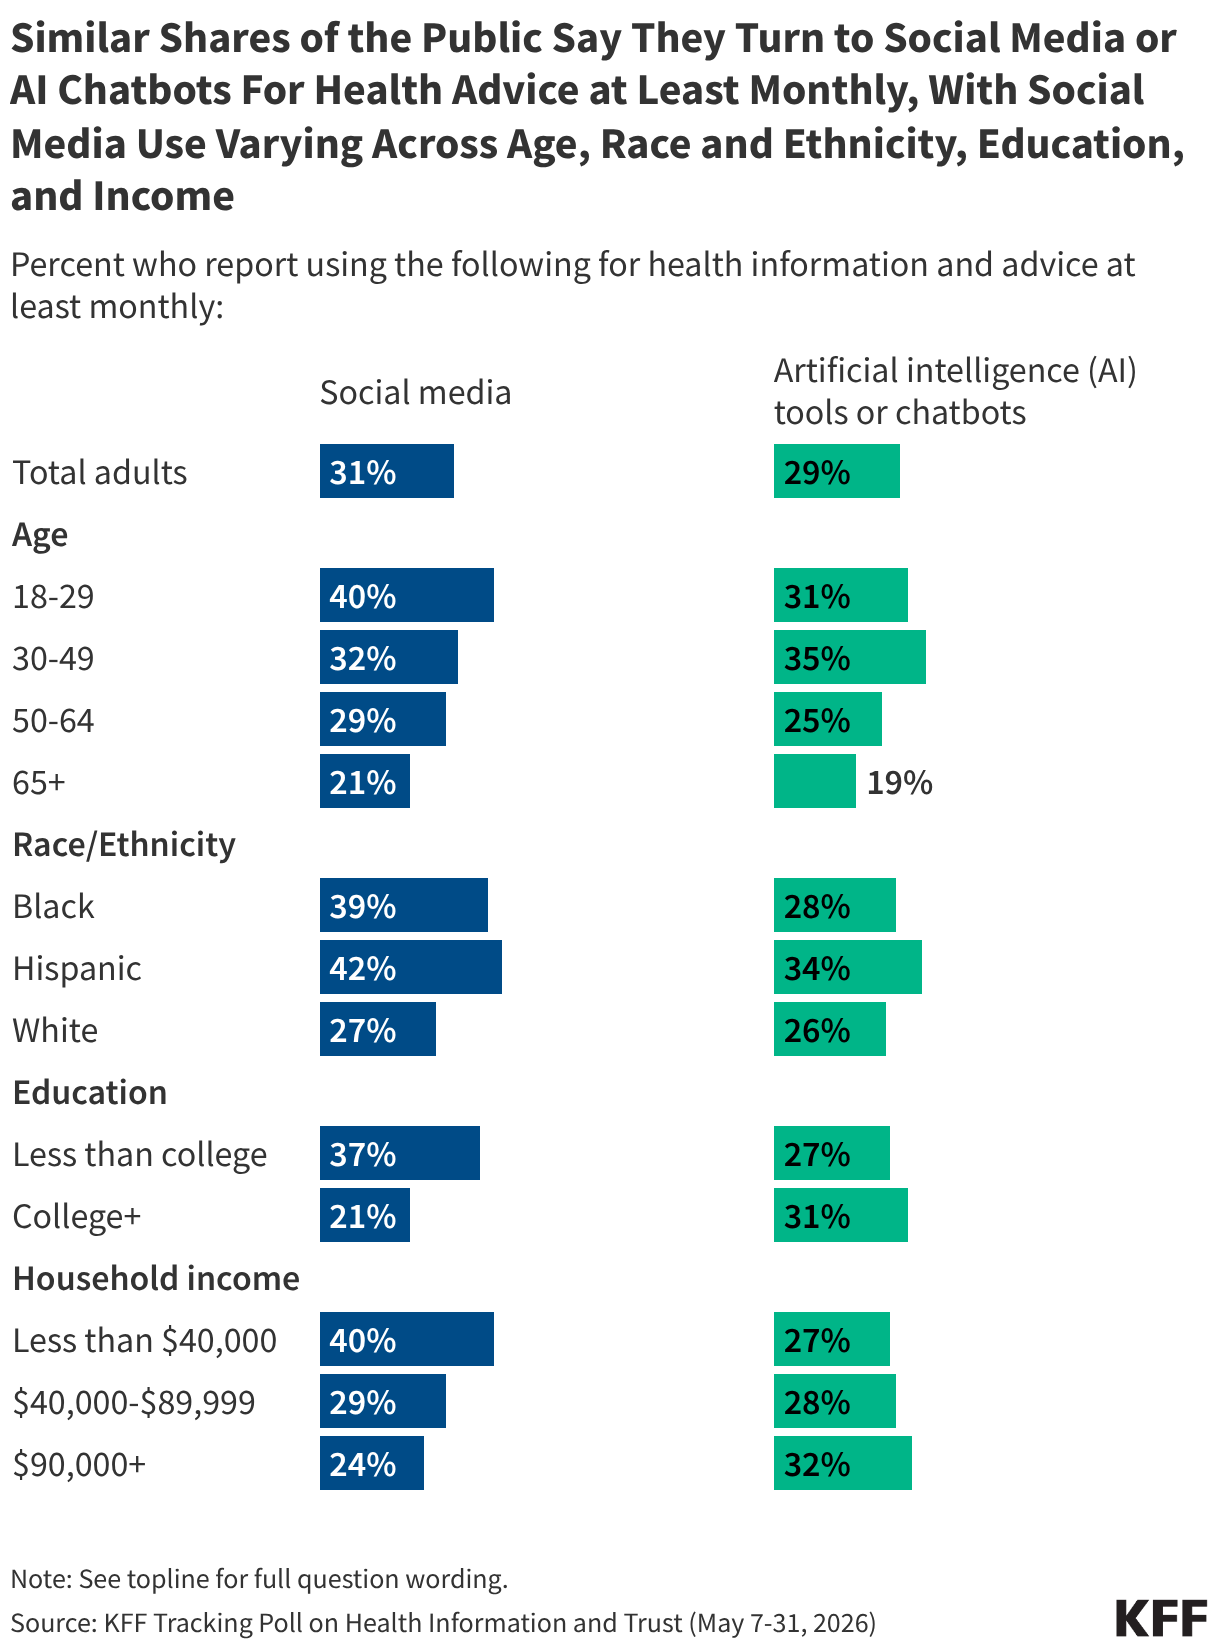
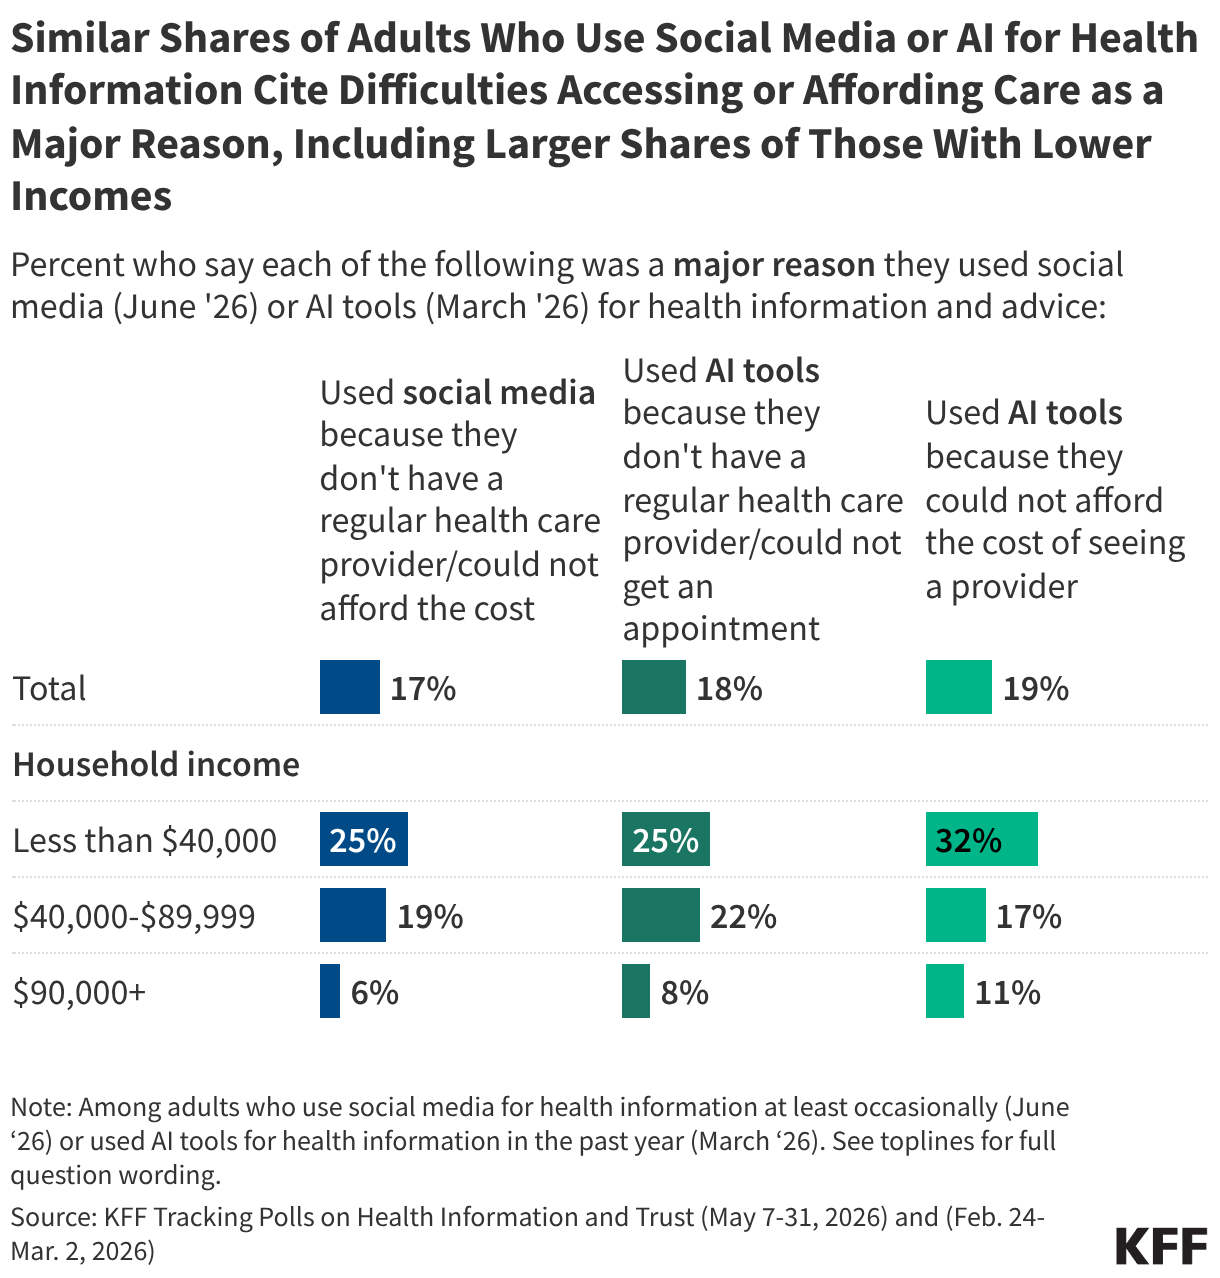
The latest KFF Tracking Poll on Health Information and Trust finds roughly three in ten adults report turning to social media (31%) or AI chatbots (29%) at least monthly for health information and advice. The top reasons people report turning to social media for health advice are wanting to hear from those with similar experiences or a desire for quick information. But nearly one in five say they turned to social media due to difficulties accessing or affording care, similar to the shares who cited access and cost as reasons for turning to AI for health information in a previous KFF poll.  

These findings as well as data from dozens of past KFF polls can also be found on KFF’s Health Information and Trust Polling Dashboard.  


KFF Poll Shows Three in Ten Adults Regularly Turn to Social Media or AI For Health Advice, With Similar Shares of Social Media and AI Users Citing Barriers to Accessing Care as a Reason for Using These Platforms

KFF’s latest Tracking Poll on Health Information and Trust examines the public’s use of social media and AI for health information. Overall, three in ten (31%) adults say they use social media at least monthly for health information and advice, similar to the share (29%) who say they use artificial intelligence (AI) tools or chatbots at least monthly for health. Larger shares of adults under 30, Black and Hispanic adults, those without a college degree, and those with lower incomes say they turn to social media for health information at least monthly. 

Split bar chart showing the percent of people who report using social media or AI tools for health information and advice at least monthly. Results by total adults, age, race/ethnicity, education, and household income.

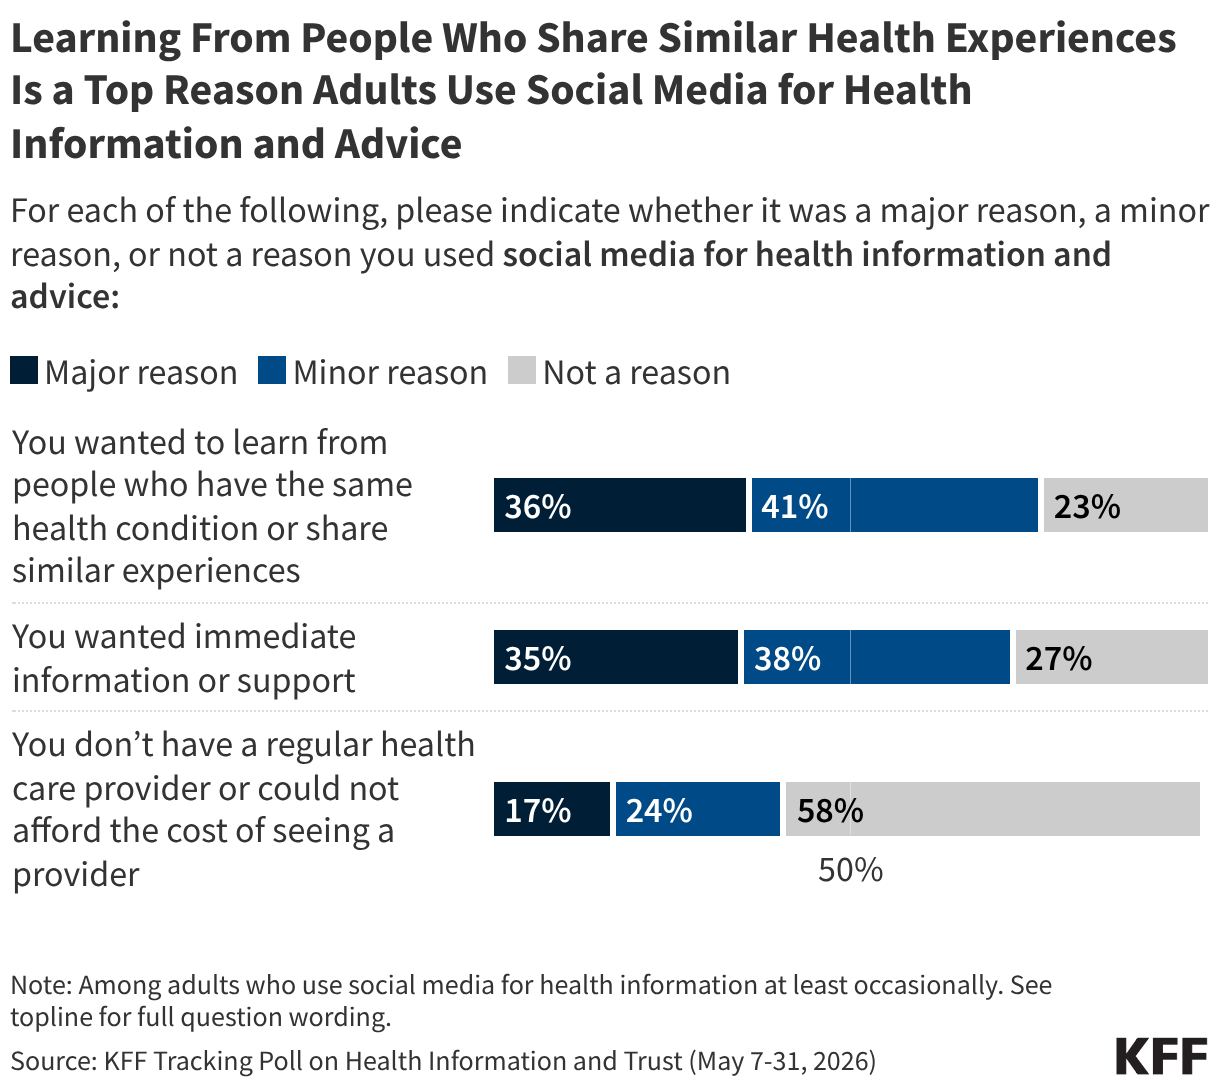
Among people who use social media for health information at least occasionally, over a third say a “major reason” they did so was to learn from others with similar experiences or conditions (36%) or because they wanted immediate information or support (35%). A smaller share of users (17%) say a “major reason” they relied on social media was because they don’t have a health care provider or couldn’t afford to see one.

Stacked bar chart showing the percent of people who selected wanting to learn from others, wanting immediate information, and not having a regular health care provider as a reason for using social media to find health information and advice.

While cost and access problems may not be the top reason people turn to either social media or AI for health information, nearly one in five users are turning to each of these mediums for these reasons, including even higher shares among those with lower incomes. Among adults who use social media for health, this reason is also more commonly cited among uninsured adults (32%) and some groups that have historically had a harder time accessing health care, including Hispanic adults (29%) and LGBT adults (30%). 

Similar Shares of Adults Who Use Social Media or AI for Health Information Cite Difficulties Accessing or Affording Care as a Major Reason, Including Larger Shares of Those With Lower Incomes (Split Bars)

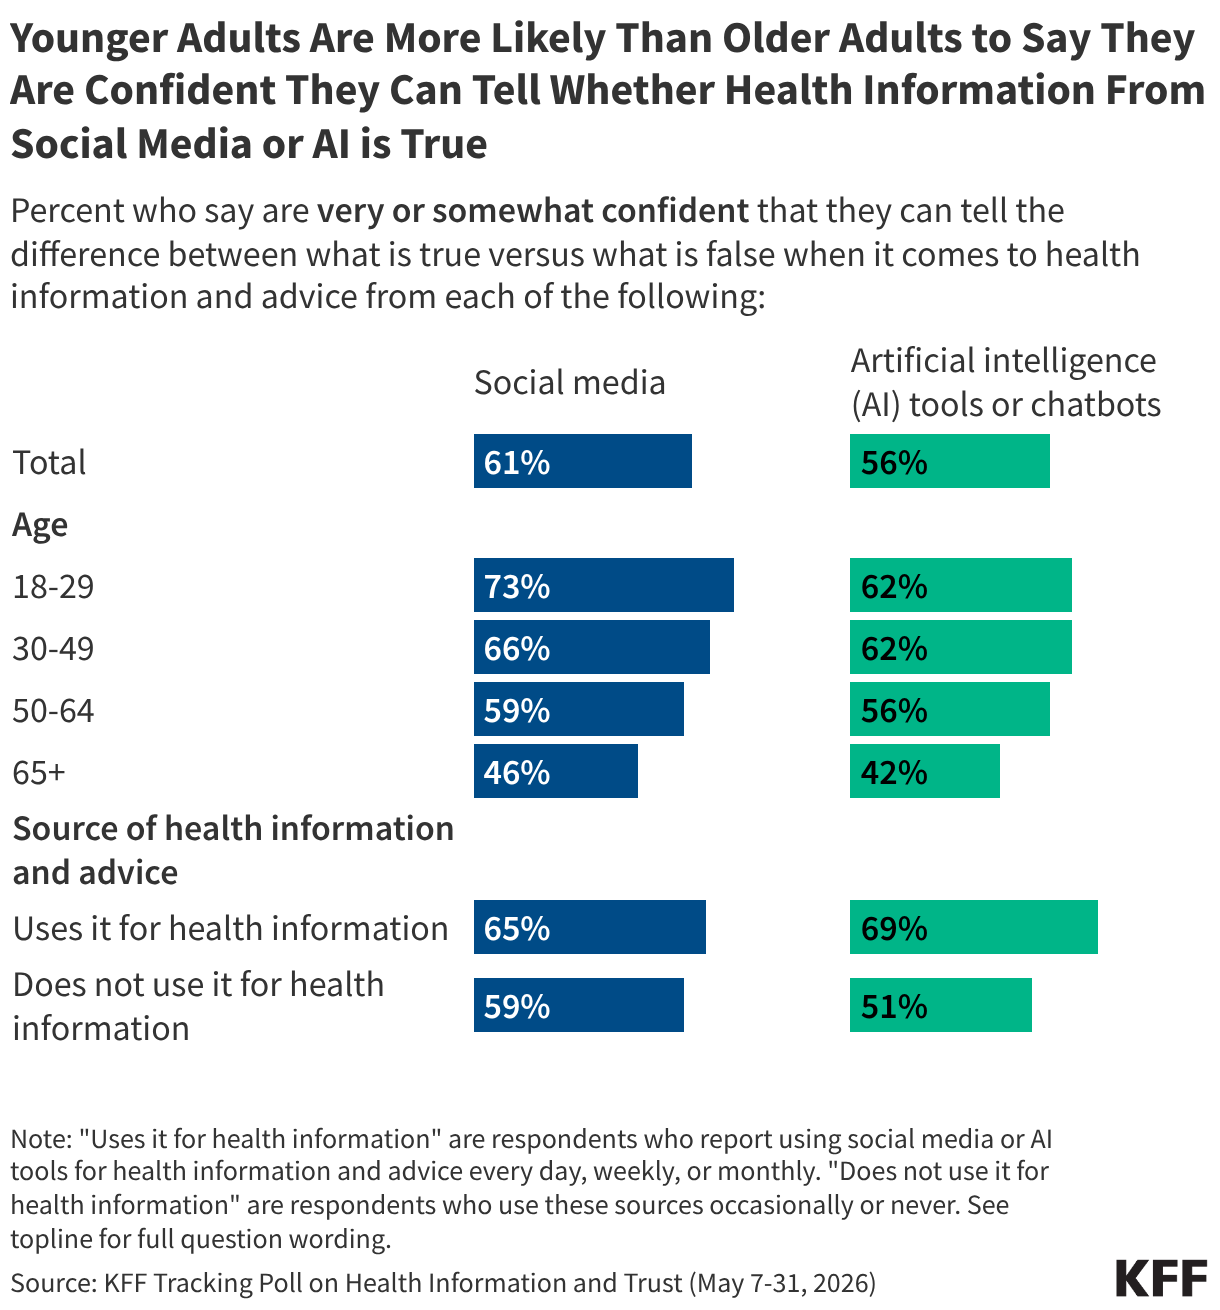
While a slim majority of adults express confidence in their ability to tell whether health information from social media or AI tools is true or not, about four in ten lack confidence in this regard. Adults who use social media and AI for health information are more likely than those who don’t to express confidence in their ability to discern whether health information on these platforms is true or not, as are younger adults compared to older adults.

Grouped bar chart showing the percentage of adults who say they are very or somewhat confident they can tell true from false health information from social media and from AI tools or chatbots, broken down by total adults, age group, and whether they use each source for health information.

AI & Emerging Tech

Understanding the Role of AI in Spreading and Creating Faulty Research

  • A correspondence published in The Lancet in May identified more than 4,000 fabricated references across nearly 2.5 million biomedical papers published between 2023 and early 2026. Researchers found that papers containing at least one fabricated citation became substantially more common during the study period, rising from roughly one in 2,800 papers in 2023 to one in 277 papers in early 2026. Many of the fabricated references appeared legitimate, citing real researchers, plausible publication years, and topic-specific article titles, but pointed to studies that did not exist.
  • The authors note that large language models (LLMs) are known to generate fabricated citations that appear authentic, and that the sharp rise in fabricated references coincided with the period following widespread adoption of generative AI tools. While the study could not determine what caused the increase, researchers note that fabricated references can emerge through multiple pathways, including AI-generated citations, paper mills, and other forms of research misconduct.

Here’s the big picture:

  • AI systems can amplify inaccurate or fabricated information. Large language models sometimes generate information that sounds plausible but is unsupported or entirely false, a phenomenon often referred to as "hallucination." A 2025 study found that when fictional medical terms were included in health questions, chatbots elaborated on them in nearly two-thirds of cases, generating explanations and treatments for conditions that do not exist. Researchers demonstrated a similar dynamic in an experiment involving a fictional skin condition called "bixonimania." After uploading fake papers about the condition to a preprint server, they found that several major AI chatbots described the made-up disorder as real and, in some cases, recommended medical care. The fabricated papers were later cited in a peer-reviewed article before being retracted.
  • AI systems increasingly interact with scientific literature that contain fraudulent or unreliable research. Researchers have documented the growing presence of "paper mills," operations that produce and sell fraudulent academic manuscripts. A study in BMJ found that nearly 10% of cancer research papers showed signs of paper mill involvement, with the proportion increasing over time. Because AI systems are trained on large volumes of publicly available content, including scientific literature, concerns have emerged that low-quality or fraudulent research may influence the information these systems retrieve, summarize, or generate. Some research has shown that even when fraudulent papers make up just 0.01% of an AI system's training data, they can contribute to errors in as many as 10% of responses.
  • Generative AI is also lowering barriers to producing convincing scientific content. Researchers have identified AI-generated manuscripts circulating through academic publishing and scholarly databases, sometimes without disclosure of AI assistance. The ability to rapidly generate text, references, and literature reviews raises concerns that AI could accelerate the production of papers that appear credible but contain errors, unsupported claims, or fabricated citations. As a result, some researchers and publishers are calling for stronger screening, reference verification, and disclosure requirements throughout the publication process.

Why This Matters: AI is increasingly involved at multiple stages of the scientific information ecosystem, from generating content and citations to retrieving and summarizing published research. As fabricated references, fraudulent papers, and other forms of low-quality research become harder to distinguish from legitimate scholarship, weaknesses in one part of the system can affect others. New efforts to detect paper mills, verify references, and improve AI reliability are underway, but people are already using AI tools to answer health questions.


What We’re Watching

A Closer Look at the State Level: New Jersey Poll Finds Broad Concern About Misinformation, Alongside Use of Search and Social Platforms

A Rutgers-Eagleton Poll commissioned by the New Jersey Civic Information Consortium found that concerns about misinformation are widespread among New Jersey voters, with 60% describing the spread of false or misleading information as a "very big problem" and another 22% calling it a "moderately big problem." The survey also found that New Jerseyans frequently rely on digital channels for news, including search engines (77%), friends and family (75%), and national news outlets (71%). At the same time, about one-third of voters (34%) said local news coverage in their area has decreased over the past five years. Rutgers researchers noted that concern about misinformation was shared across demographic and political groups, suggesting a rare point of bipartisan agreement.

Why This Matters: The findings are consistent with 2023 KFF polling among the general public, which found that a vast majority of adults (83%) say the spread of false and inaccurate information in the United States is a “major problem.” At the same time, the Rutgers-Eagleton survey sheds light on the role that search engines, social networks, and interpersonal connections play in how people access information and evaluate its credibility.

About The Health Information and Trust Initiative: the Health Information and Trust Initiative is a KFF program aimed at tracking health misinformation in the U.S., analyzing its impact on the American people, and mobilizing media to address the problem. Our goal is to be of service to everyone working on health misinformation, strengthen efforts to counter misinformation, and build trust. 


View all KFF Monitors

The Monitor is a report from KFF’s Health Information and Trust initiative that focuses on recent developments in health information. It’s free and published twice a month.

Sign up to receive KFF Monitor
email updates


Support for the Health Information and Trust initiative is provided by the Robert Wood Johnson Foundation (RWJF). The views expressed do not necessarily reflect the views of RWJF and KFF maintains full editorial control over all of its policy analysis, polling, and journalism activities. The data shared in the Monitor is sourced through media monitoring research conducted by KFF.

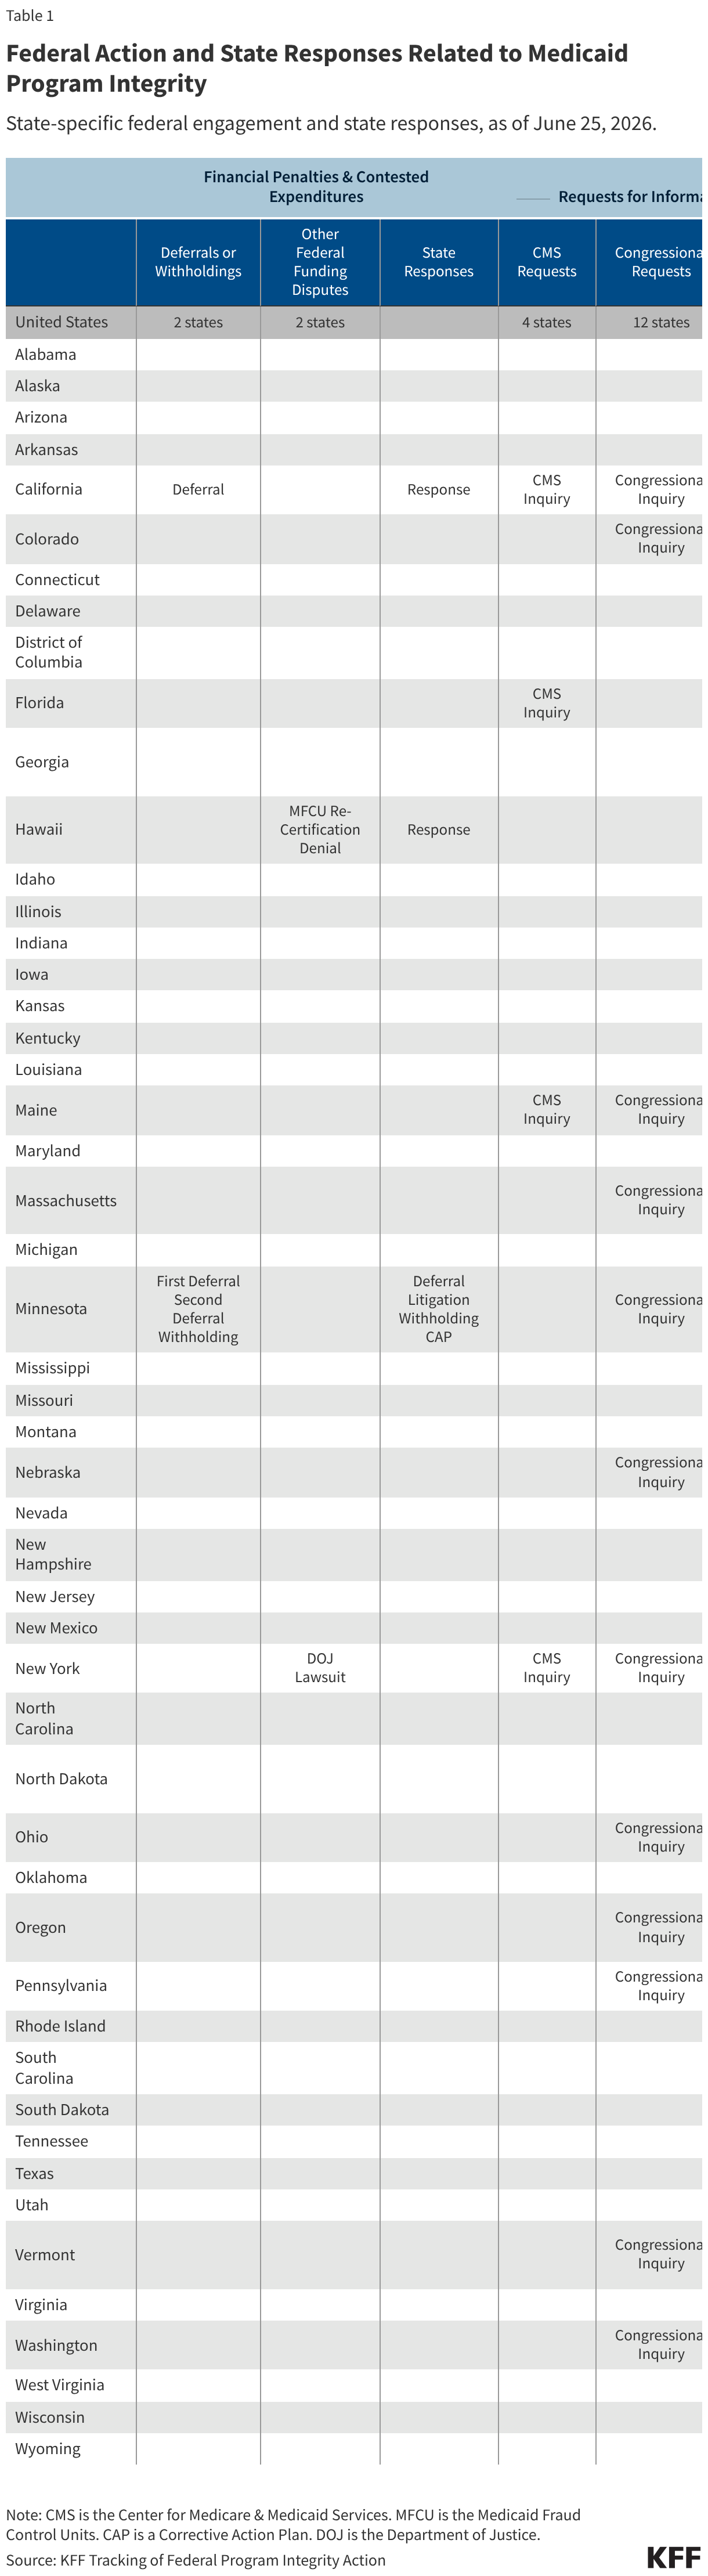
Medicaid Program Integrity: Tracking State-Specific and Nationwide Federal Action

Published: Jun 25, 2026

The Trump Administration and Congress continue to focus on rooting out fraud, waste, and abuse in federal programs, including Medicaid. Those efforts include 50-state initiatives and targeted actions that focus on issues in specific states. Given the quickly evolving Medicaid program integrity landscape, this page tracks emerging developments in the federal government’s approach to program integrity in Medicaid, along with the implications of those actions for different states. For more detailed analyses and context, see ‘Related Resources’ in Section 2.

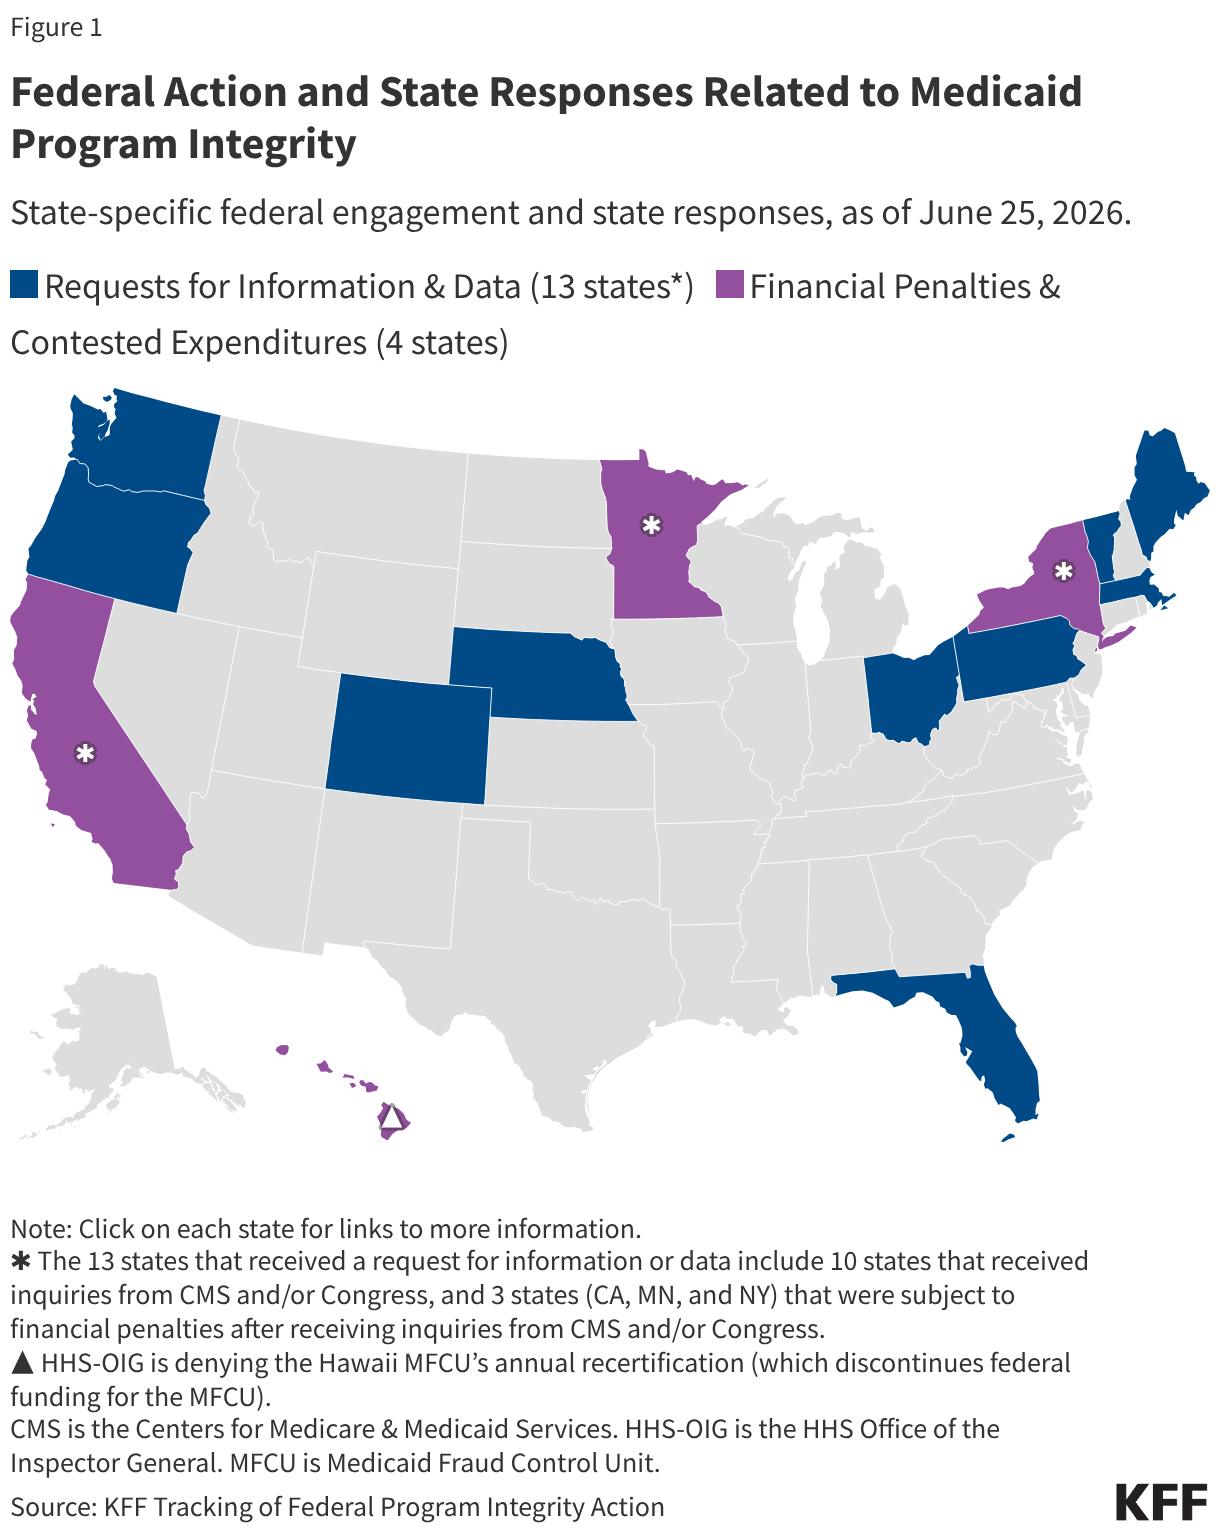
This page tracks the federal government’s 50-state initiatives and targeted actions focused on Medicaid program integrity (Figure 1 and Table 1). The map and tracker include federal actions towards states and exclude actions towards providers (such as those governing providers’ ability to participate in Medicaid and civil or criminal charges).

The following federal actions are included when materials are publicly available, along with states’ publicly available responses:

  • Financial penalties and contested expenditures including:
    • Notices of potential or actual withholding, deferrals, or disallowances of federal funding expressly tied to program integrity concerns; and
    • Other federal Medicaid funding in dispute (e.g., Health and Human Services (HHS)-Office of the Inspector General (OIG) funding for Medicaid Fraud Control Units or Department of Justice (DOJ)-contested state Medicaid program expenses).
  • Requests for state information and state responses, including formal inquiries, probes, or other materials that investigate specific state Medicaid programs or require states to respond with new information or an action plan.

The figure and table exclude the following actions:

  • Routine deferrals/disallowances (i.e., deferrals/disallowances only for longstanding disputed Medicaid claims and/or are not identified by CMS as expressly tied to concerns about fraud/waste/abuse);
  • HHS-OIG audits that are initiated as part of planned work and are more narrow or targeted in scope, and/or are not expressly tied to broader concerns about fraud/waste/abuse;
  • Routine DOJ proceedings (i.e., proceedings which target specific instances of fraud/waste/abuse against a Medicaid program but do not name a state Medicaid official as party to the case nor tie state claims for federal Medicaid funds to a case outcome); and
  • State or federal actions that do not have publicly available documentation (i.e., actions that may be referenced or announced in reporting or on social media but without documentation from federal or state governments).
Federal Action and State Responses Related to Medicaid Program Integrity (Choropleth map)
Federal Action and State Responses Related to Medicaid Program Integrity (Table)

Key Facts About Medicare Spending Trends and Projections from the 2026 Medicare Trustees Report

Published: Jun 24, 2026

On June 9, 2026, the Medicare Trustees issued the annual report on the financial status of the Medicare program for 2026. The Trustees highlighted that the Medicare Part A trust fund is projected to be depleted in 2033, the same year but one quarter earlier than last year’s projection. In addition to discussing the status of the Part A trust fund, the report also provides substantial additional details on federal spending for Medicare Part B and Part D benefits, the distribution of spending for traditional Medicare and Medicare Advantage, and revenue sources for Medicare, along with updated spending and revenue projections and a detailed discussion of factors that have contributed to changes in the program’s financial outlook. This brief provides an overview of key trends in Medicare spending and spending growth, as well as the impact of these trends on out-of-pocket costs for Medicare beneficiaries and Medicare program solvency, as projected by the Medicare Trustees.

Physician Services and Other Outpatient Services Account for Roughly Half of Total Medicare Benefits Spending

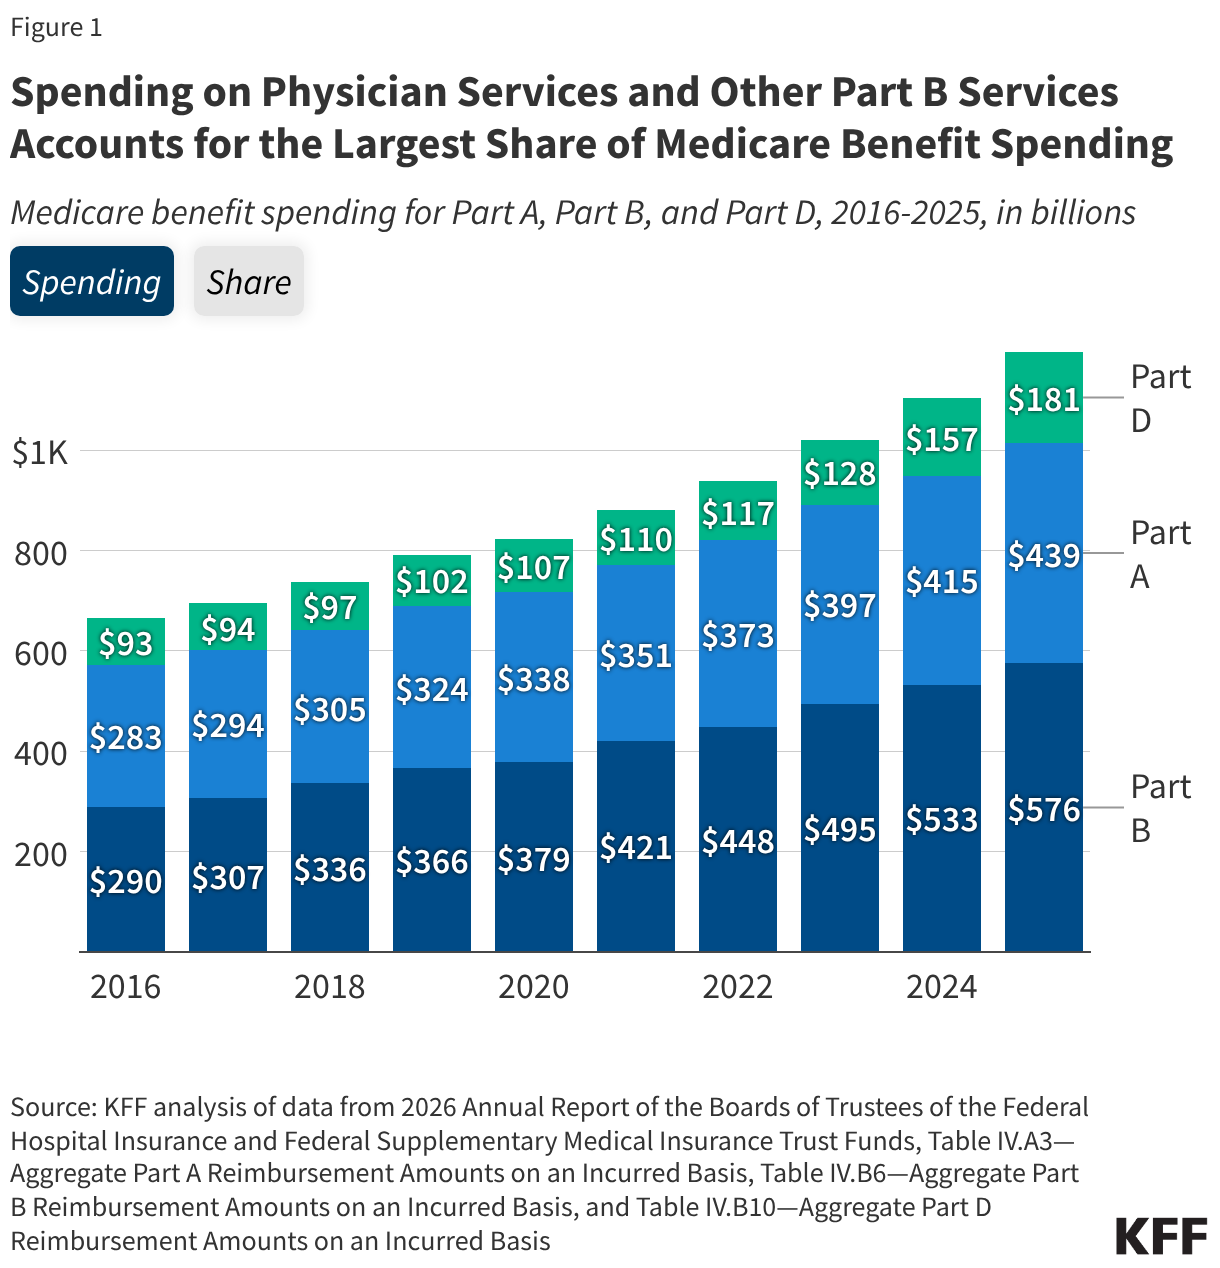
In 2025, Medicare benefit payments totaled $1.2 trillion, up from $666 billion a decade earlier (Figure 1). Spending on Part B services (including physician services, outpatient services, and physician-administered drugs) accounts for the largest share of Medicare benefit spending (48% in 2025), as it has since 2015. In contrast, spending on Part A services (including inpatient hospital services, skilled nursing facility services, and hospice care) has declined as a share of Medicare benefit spending (from 43% in 2016 to 37% in 2025). Over time, this decline has been driven in part by a shift of some services from inpatient to outpatient settings reflecting changes in practice patterns, along with increases in spending on services covered under Part B, including high-cost physician-administered drugs. Spending on Part D prescription drugs has accounted for a relatively constant share of Medicare benefit spending for much of the past decade (12-13%) but rose to 15% in 2025 and is projected to continue growing in the coming years.

Spending on Physician Services and Other Part B Services Accounts for the Largest Share of Medicare Benefit Spending (Stacked column chart)

Spending on Part A and Part B Benefits in Traditional Medicare Was $481 Billion in 2025

Looking at spending by type of service in traditional Medicare, the single largest category of benefit spending in 2025 was for inpatient hospital services covered under Part A (spending by type of service for Medicare Advantage enrollees is unavailable). Although a relatively small share of beneficiaries use inpatient hospital services, these services accounted for roughly one-third of total benefit spending in traditional Medicare ($159 billion or 33%), followed by outpatient hospital services covered under Part B ($76 billion or 16%) (Figure 2). This means that combined spending on hospital services (both inpatient and outpatient) accounted for nearly half of spending on Part A and Part B benefits in traditional Medicare in 2025. Services covered under the Medicare Part B physician fee schedule accounted for $71 billion (15%), and the remaining $174 billion (36%) consisted of payments for all other Part A and Part B services, including physician-administered drugs (8%), skilled nursing facility services (6%), and hospice care (6%), among others.

Figure 2

Spending on the Medicare Part D Prescription Drug Benefit is Projected to be Significantly Higher Over the Coming Decade Compared to Last Year’s Projections

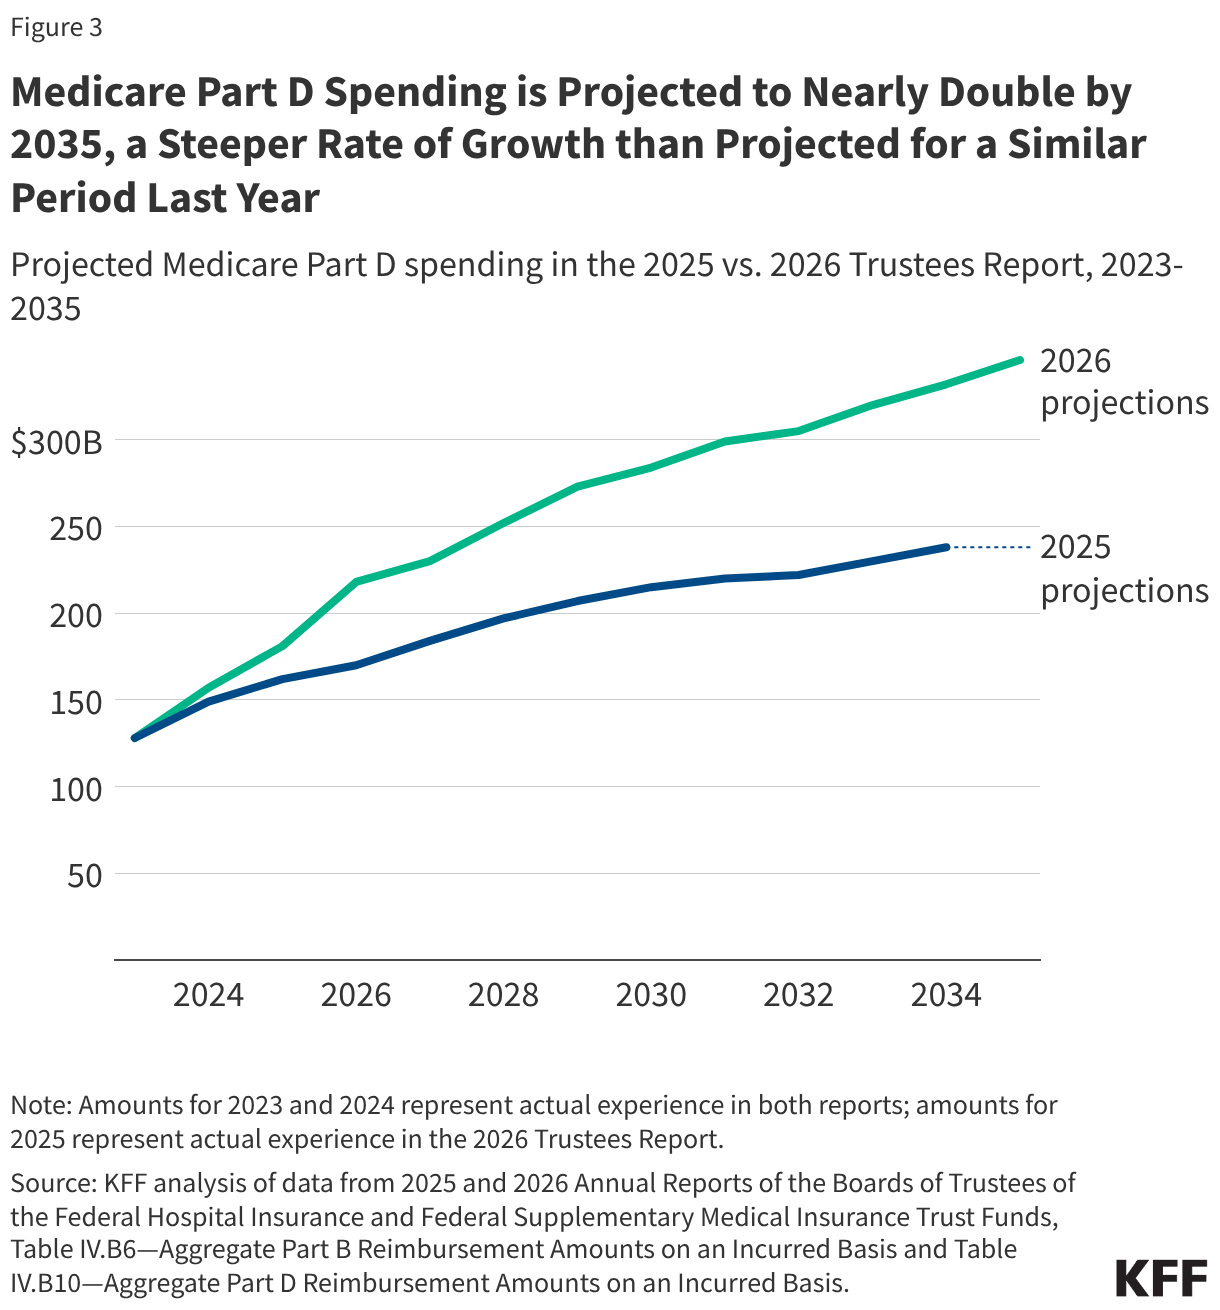
The Medicare Trustees currently project that Medicare Part D spending will nearly double from 2025 ($181 billion) to 2035 ($346 billion), representing an average annual growth rate of 6.7% compared to the 4.8% that was projected for a similar period last year (Figure 3). The Trustees indicate that higher spending projections for Part D in the 2026 report are due to increased use of GLP-1s and other high-cost specialty drugs. The Trustees also point to other factors that have contributed to changes in Part D spending in recent years, including the pharmacy price concessions policy that lowers point-of-sale prices for beneficiaries but reduces rebate revenue to Part D plans, which leads to higher federal Part D spending; the exemption of more orphan drugs from drug price negotiation in the 2025 budget reconciliation bill (H.R. 1), which will lower federal savings from negotiation; and the redesigned Part D benefit that improved the generosity of coverage while shifting more liability onto plans and increased the level of federal subsidies for coverage. These higher spending trends are offset somewhat by the effect of drug price negotiations and inflation rebates established by the Inflation Reduction Act.

Medicare Part D Spending is Projected to Nearly Double by 2035, a Steeper Rate of Growth than Projected for a Similar Period Last Year (Line chart)

Spending on Medicare Advantage was $534 Billion in 2025, Over Half (53%) of Total Medicare Program Spending

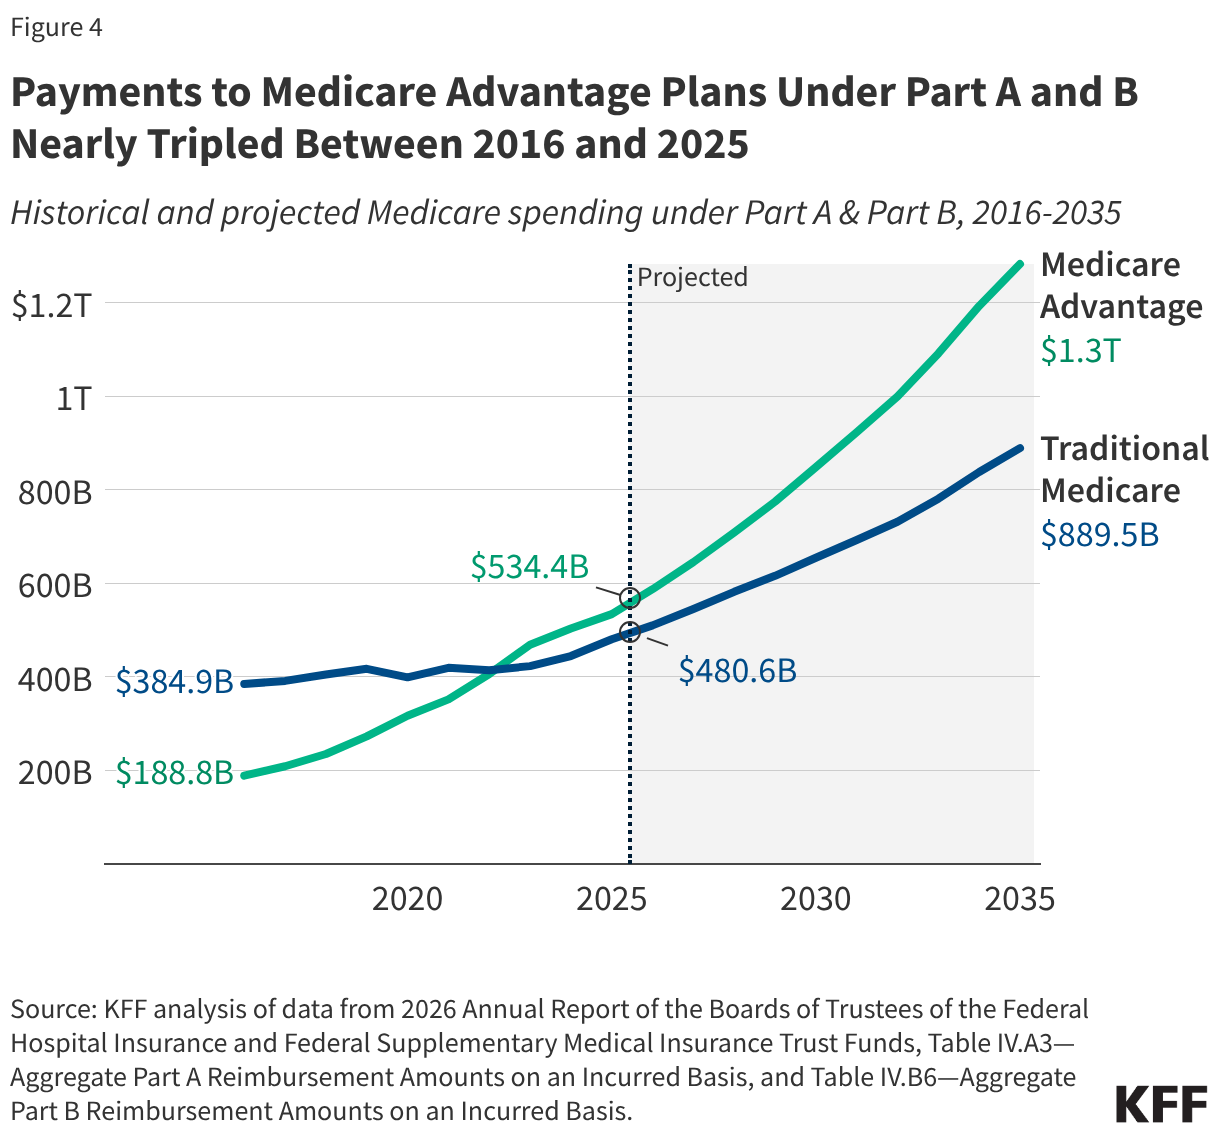
Payments to Medicare Advantage plans under Medicare Part A and Part B nearly tripled as a share of total Part A and Part B spending between 2016 and 2025 (from $189 billion to $534 billion), including payments for the cost of Part A and Part B services, as well as rebates, which must be used to reduce cost sharing, pay for extra benefits, or buy down the Part B and/or Part D premium (Figure 4). This growth is partly due to increased enrollment in Medicare Advantage plans, which rose from 33% to 54% of all eligible beneficiaries over this same period. At the same time, Medicare pays an estimated 14% more per enrollee in Medicare Advantage than it would if the same beneficiary were covered by traditional Medicare, resulting in $76 billion in additional Medicare spending in 2026. Those higher payments largely reflect the impact of higher coding intensity and favorable selection into Medicare Advantage. Growth in Medicare Advantage spending is projected to continue into the next decade, with payments to Medicare Advantage plans under for Part A and B benefits projected to increase to $1.3 trillion in 2035, or 59% of total Part A and Part B spending.

Payments to Medicare Advantage Plans Under Part A and B Nearly Tripled Between 2016 and 2025 (Line chart)

The Medicare Part A Trust Fund is Projected to be Depleted in 2033, Seven Years from Now

The depletion of the reserves in the Medicare Hospital Insurance (Part A) trust fund, which pays for inpatient hospital, skilled nursing facility, home health, and other Part A services, is projected to occur in the second quarter of 2033, based on the latest projections from the Medicare Trustees (Figure 5). This is one quarter earlier than the projection in last year’s report. According to the Medicare Trustees, the earlier depletion date is primarily the result of updated estimates of Social Security tax revenue (one source of Part A funding) that are lower than previously projected due to changes in the 2025 budget reconciliation bill (H.R. 1). If the reserves in the Part A trust fund are fully depleted, Medicare would not have sufficient funds to cover Part A benefit spending for the full year without additional revenues or reductions in spending on benefits or payments to providers.

Figure 5

Projected Increases in Medicare Spending Will Lead to Higher Medicare Premiums and Cost-Sharing Requirements

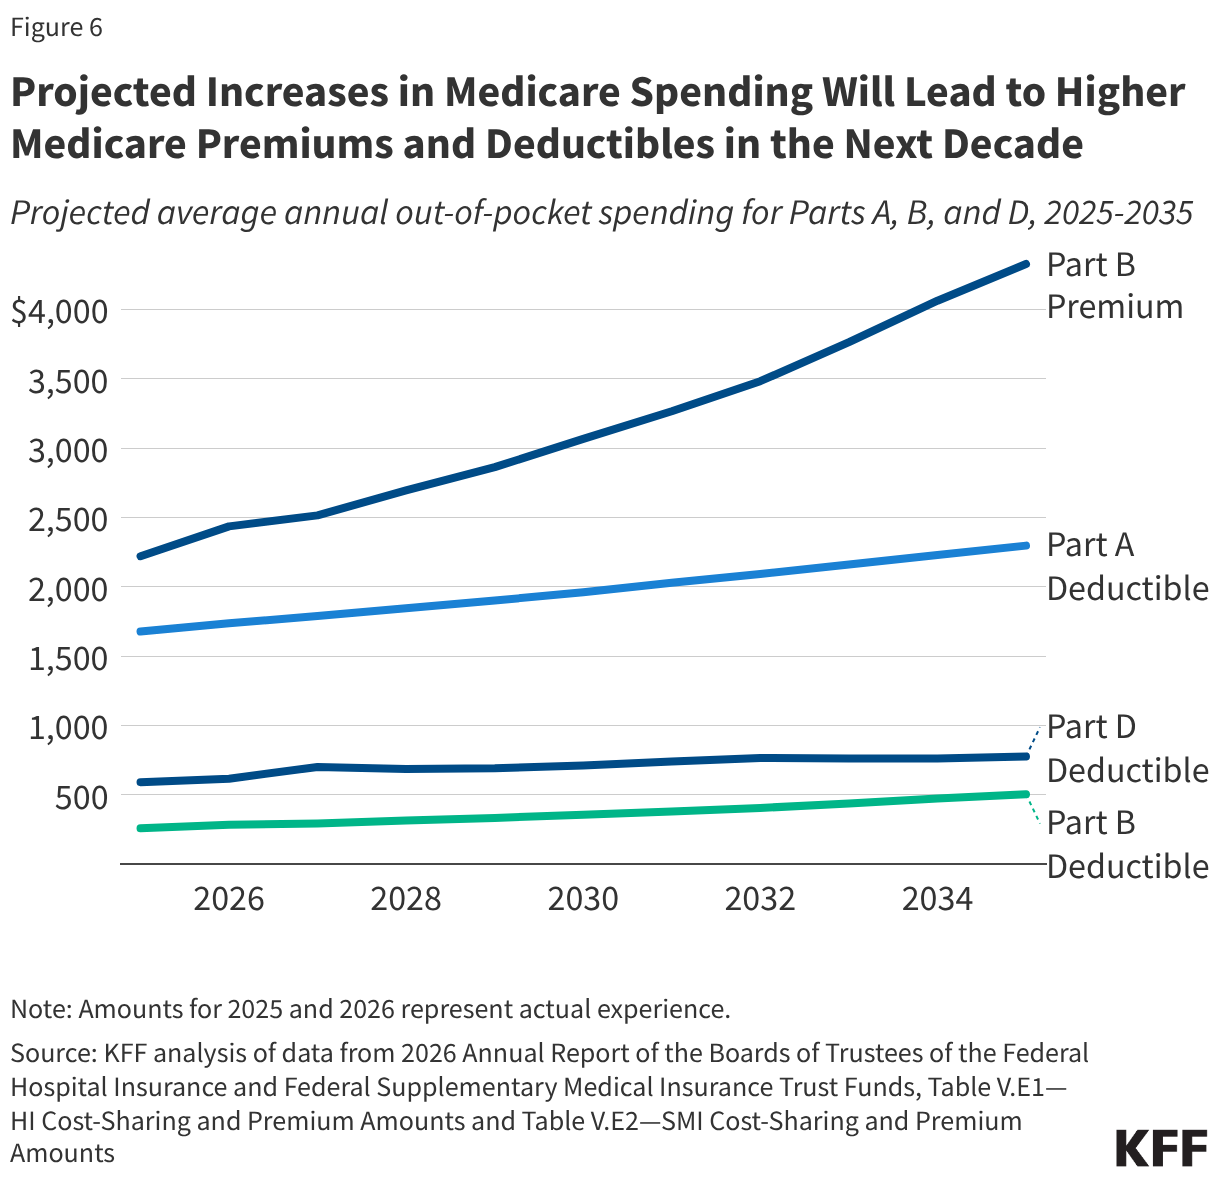
Medicare’s premium and cost-sharing requirements are determined annually based on expected growth in Medicare benefit costs for the coming year (though the exact approach to determining these amounts is different in each part). For 2027, the Trustees project that the monthly Part B premium will increase from $203 to $210 (3.3%), after increasing from $185 to $203 between 2025 and 2026 (9.7%). Likewise, the Part A hospital deductible is projected to increase from $1,736 to $1,788, and the Part D deductible from $283 to $292 in 2027. Further increases are estimated for the duration of the 10-year projection period in the 2026 Trustees report (Figure 6). These amounts may not reflect the costs that all beneficiaries face, particularly enrollees in Medicare Advantage plans, where cost sharing is generally different from the standard cost-sharing requirements for traditional Medicare beneficiaries. In 2024, seven million Medicare beneficiaries spent more than 10% of their income on the Part B premium alone. Increases in Medicare premiums and other out-of-pocket costs may represent a growing burden for many beneficiaries if income growth does not keep pace.

Projected Increases in Medicare Spending Will Lead to Higher Medicare Premiums and Deductibles in the Next Decade (Line chart)

U.S. Global Health Legislation Tracker

Published: Jun 23, 2026

This tracker provides a listing of global health-related legislation being considered by the 119th Congress (Jan. 3, 2025 – Jan. 3, 2027). Currently, there are more than 50 pieces of legislation related to global health. They address topics ranging from global health security to reproductive health to the World Health Organization (WHO). Sometimes a bill may address broader topics, but this tracker focuses on the global health aspects of the legislation.

The tracker includes the bill title, sponsor(s), current status, and topic, as well as a short description of its global health-related provisions. The tracker includes bills only; resolutions are not included. Legislation is listed in alphabetical order by short title. In certain cases, identical bills have been introduced in both chambers of Congress (often referred to as companion bills). For example, the Global Health, Empowerment and Rights Act and the WHO is Accountable Act were each introduced in both chambers. Such companion bills are listed separately in the tracker.

The tracker will be updated periodically.

Global Health Legislation During the 119th Congress
(as of June 17, 2026) (Table)