Assessing PEPFAR’s Health Spillover Effects Beyond HIV: An Update
This represents an update of earlier analyses:
Assessing PEPFAR’s Impact: Analysis of Mortality in PEPFAR Countries
Assessing PEPFAR’s Impact: Analysis of Maternal and Child Health Spillover Effects in PEPFAR Countries
Summary
This analysis updates earlier work that assessed whether PEPFAR, the U.S. global HIV/AIDS program credited with saving 26 million lives, had health impacts beyond HIV (a companion update looks at economic and educational spillover effects). Specifically, the earlier analysis found that PEPFAR investments were associated with significant improvements in all-cause mortality and maternal and child health measures between 2004 and 2018, positive spillover effects that suggest the program has had a greater impact than for HIV alone; this was the case even though PEPFAR funding has been relatively flat for more than a decade. The current analysis updates these estimates through 2022 to capture additional years of data as well as the potential impact of the COVID-19 pandemic, which more broadly affected health and development. It similarly finds that PEPFAR was associated with continued health gains, especially for mortality outcomes. Moreover, where COVID-19 seems to have had a temporary impact, it did so across all countries, not just those receiving PEPFAR support. These findings suggest that more recent changes to the PEPFAR program by the Trump administration, including significantly scaling back funding and services with plans to further do so in the coming years, could not only have negative impacts on the HIV response, but dampen improvements in other health areas.
Introduction
PEPFAR, the U.S. global HIV/AIDS program credited with saving 26 million lives, is the largest commitment by any nation to address a single disease. In many countries, PEPFAR funding had accounted for the biggest share of external health investment, often surpassing domestic HIV spending. Numerous studies have documented PEPFAR’s impact on improving HIV outcomes, including reductions in new HIV infections and HIV-related deaths, reversing the epidemic’s trajectory in sub-Saharan Africa.1 In addition, a growing body of research has also found that PEPFAR investments are associated with improvements in other health areas, such as maternal and child health.2 For example, the prior analyses found that PEPFAR was associated with significant reductions in all-cause mortality and maternal and child mortality, and increases in child immunization rates, between 2004 and 2018. The reasons for this impact are multifaceted and, while often thought of as a “vertical” program focused solely on HIV, PEPFAR has invested significantly in country health systems, including the health care workforce, laboratory strengthening, and supply chain development and management. In addition, PEPFAR had increasingly emphasized integration of services, including reaching women where they received prenatal care and sought immunizations and other services for their children. These investments and approach could account for these broader impacts.
The current analysis, done by researchers at KFF and Boston University, updates earlier work to assess whether the spillover effects found between 2004 and 2018 persisted through 2022, to capture additional years of data as well as the potential impact of the COVID-19 pandemic, which more broadly affected health and development. Specifically, the analysis uses a difference-in-difference, quasi-experimental design to analyze the change in the all-cause mortality rate, maternal and child mortality rates, and childhood immunizations in PEPFAR countries and a comparison group of low- and middle-income countries between 2004 and 2022. Several model specifications were tested. The final model specification controls for numerous baseline variables that could also be expected to influence these health outcomes, which helps to make the non-PEPFAR group more comparable to the PEPFAR group. Still, despite the strengths of the difference-in-difference model design, it is possible that there may be other, unobservable ways in which comparison countries differed from PEPFAR countries, which could account for the results (see Methodology for more detail).
Findings
PEPFAR was associated with significantly lower mortality during the 2004 to 2022 period.
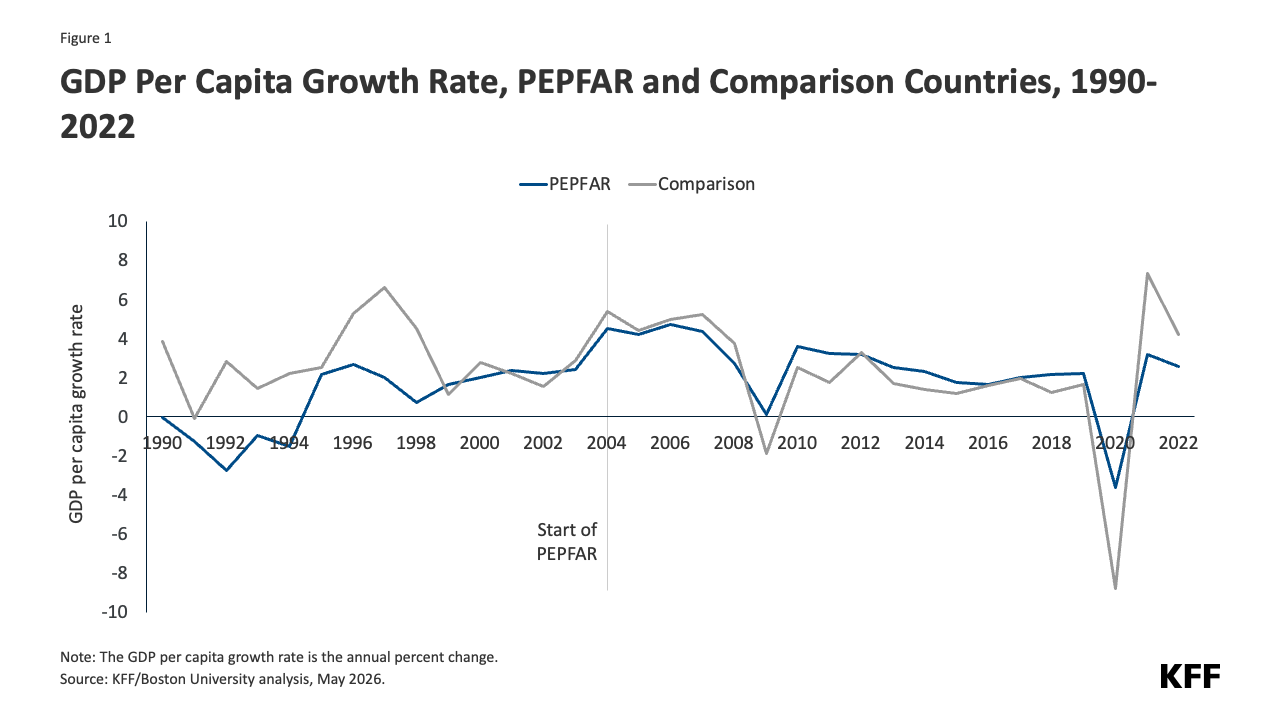
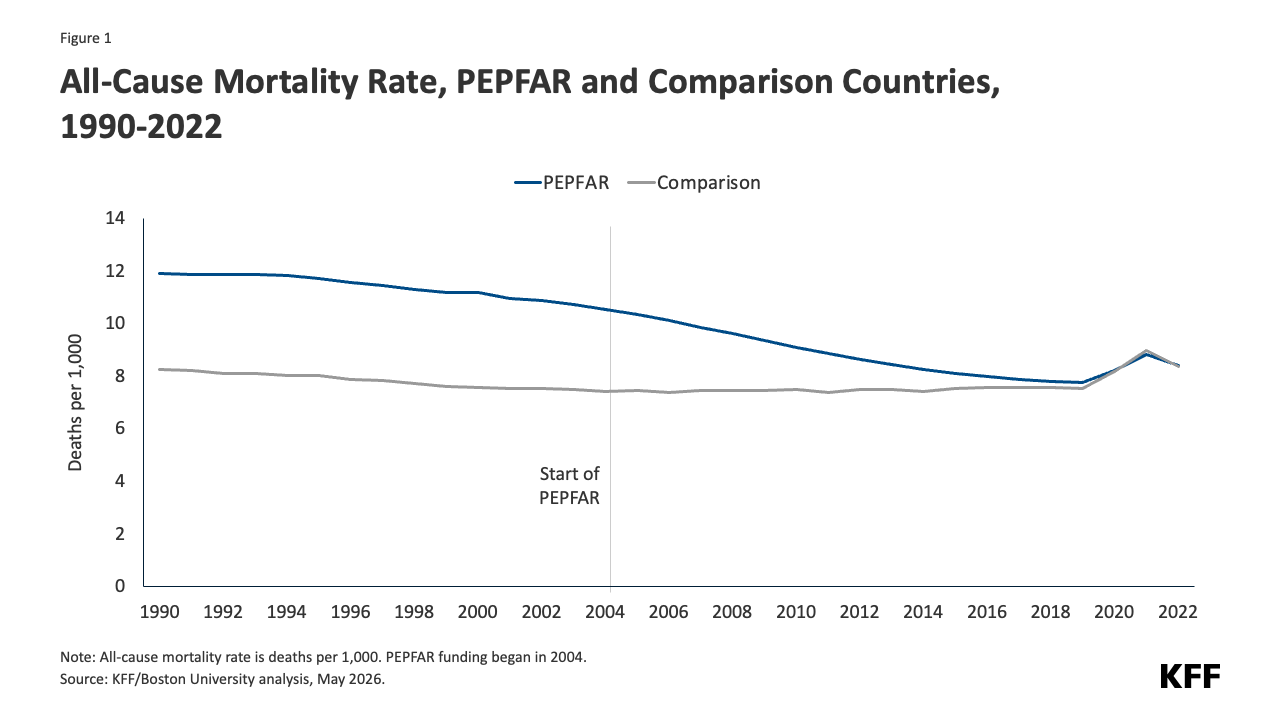
- Prior to the initiation of PEPFAR, all-cause mortality rates were higher in PEPFAR than in comparison countries. Once PEPFAR began, there was a much more rapid decline in mortality in PEPFAR countries, with the average all-cause mortality rate converging with that of comparison countries over time. While there was a substantial uptick during COVID-19, this occurred in both sets of countries (see Figure 1).
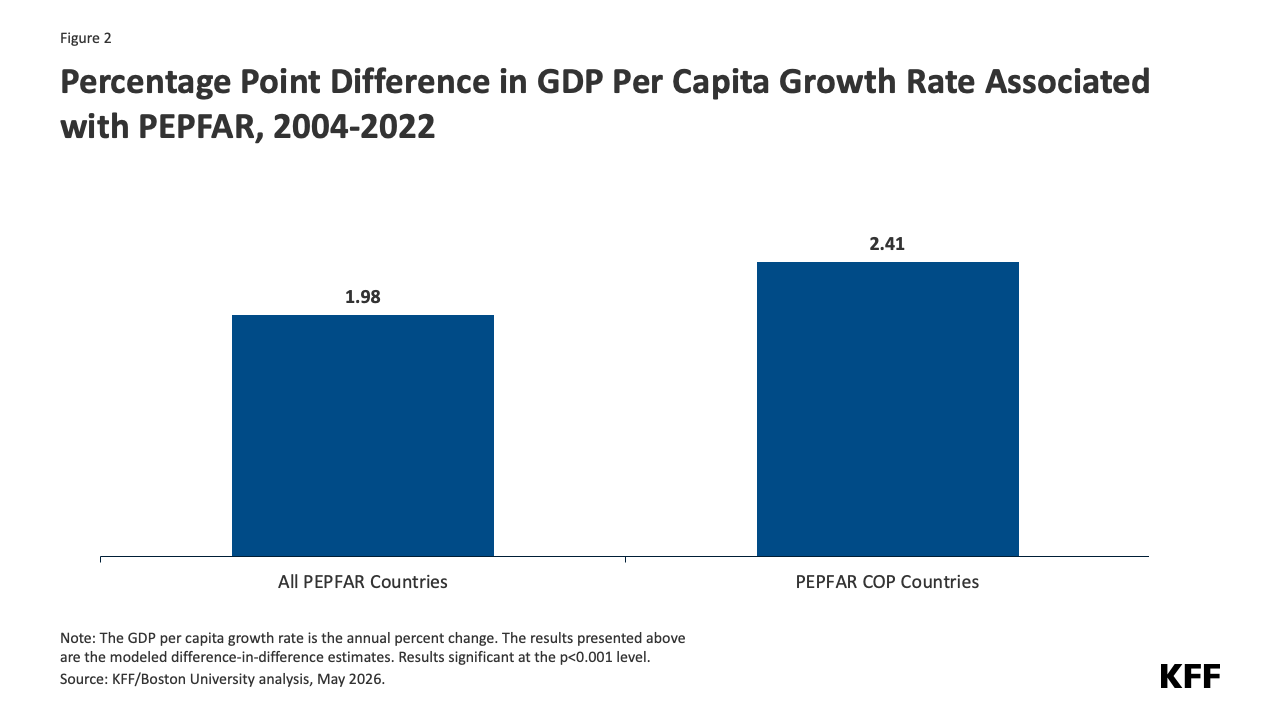
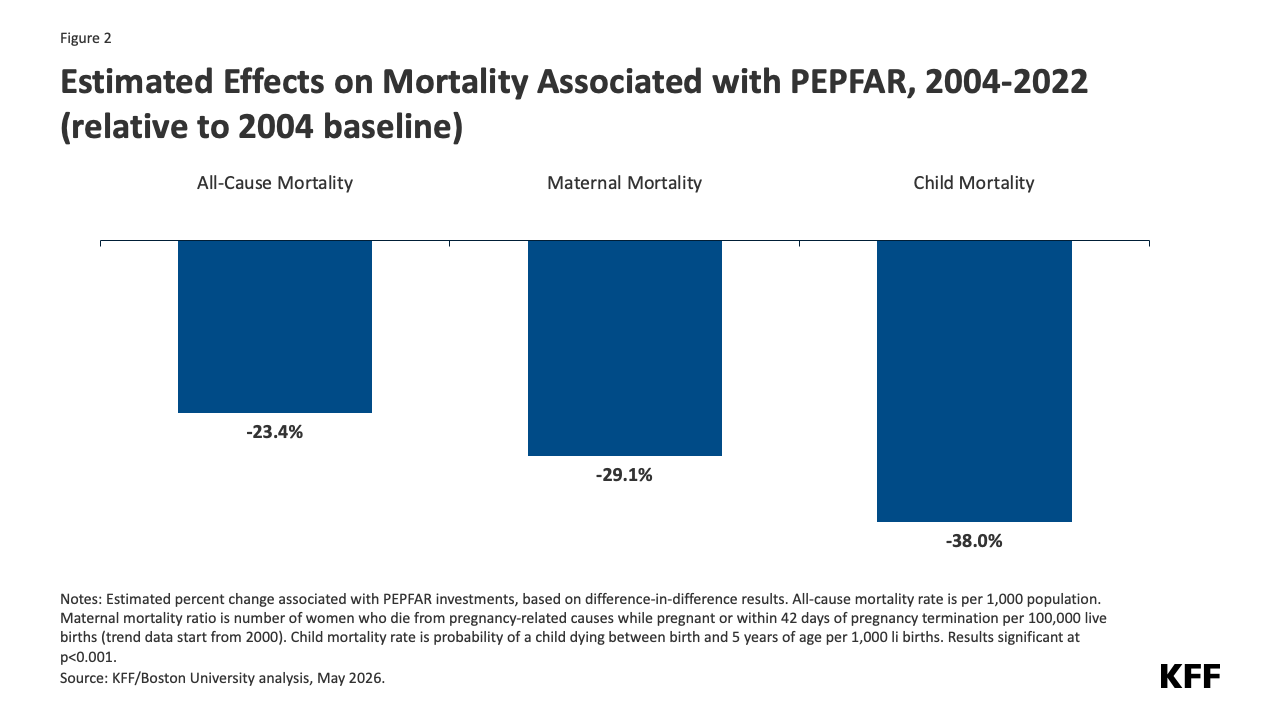
- Moreover, the difference-in-difference analysis finds that PEPFAR investments were associated with an all-cause mortality rate that was 2.5 deaths per 1,000 lower, on average, than would have been expected in the absence of PEPFAR — a 23.4% reduction relative to the 2004 baseline (see Figure 2 and Tables 5-6).
- The estimated effects were larger in PEPFAR’s “COP” countries, those that engaged in more intensive planning and programming, and also generally had greater PEPFAR investments.3[i] In COP countries, the reduction was 28.0% relative to the 2004 baseline (see Tables 5-6).
PEPFAR was associated with even larger reductions in both maternal and child mortality over the period.
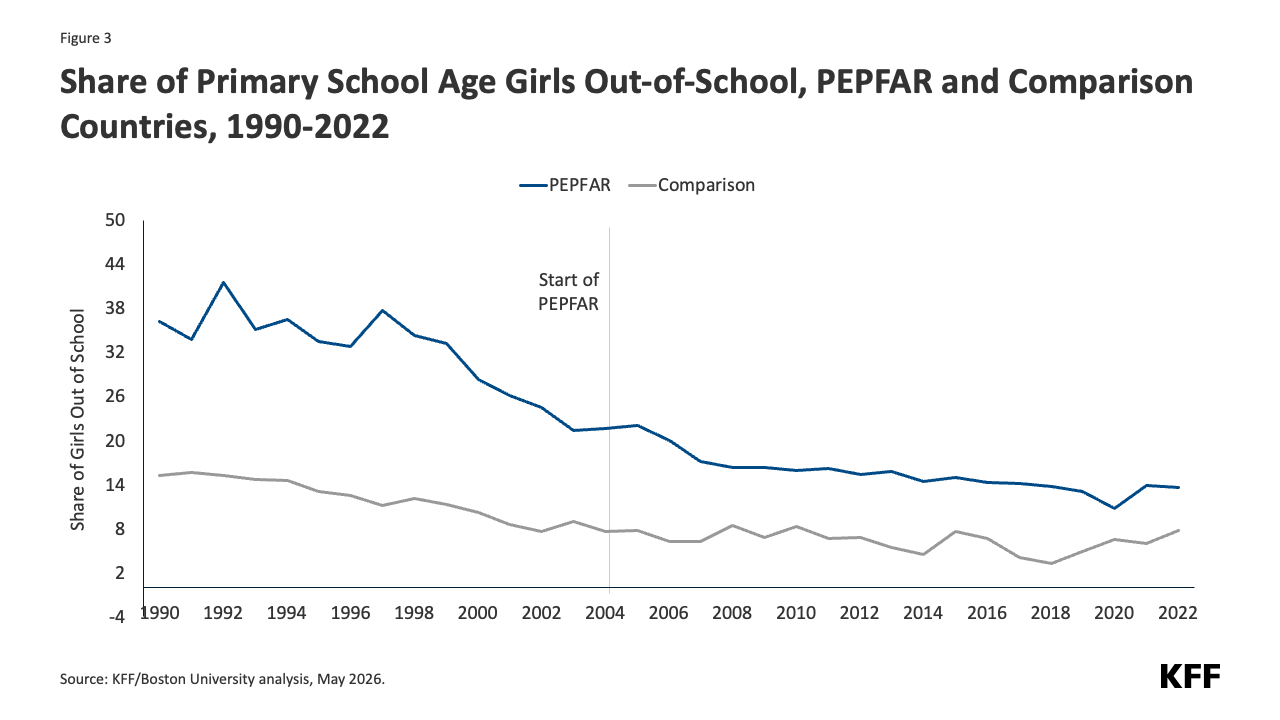
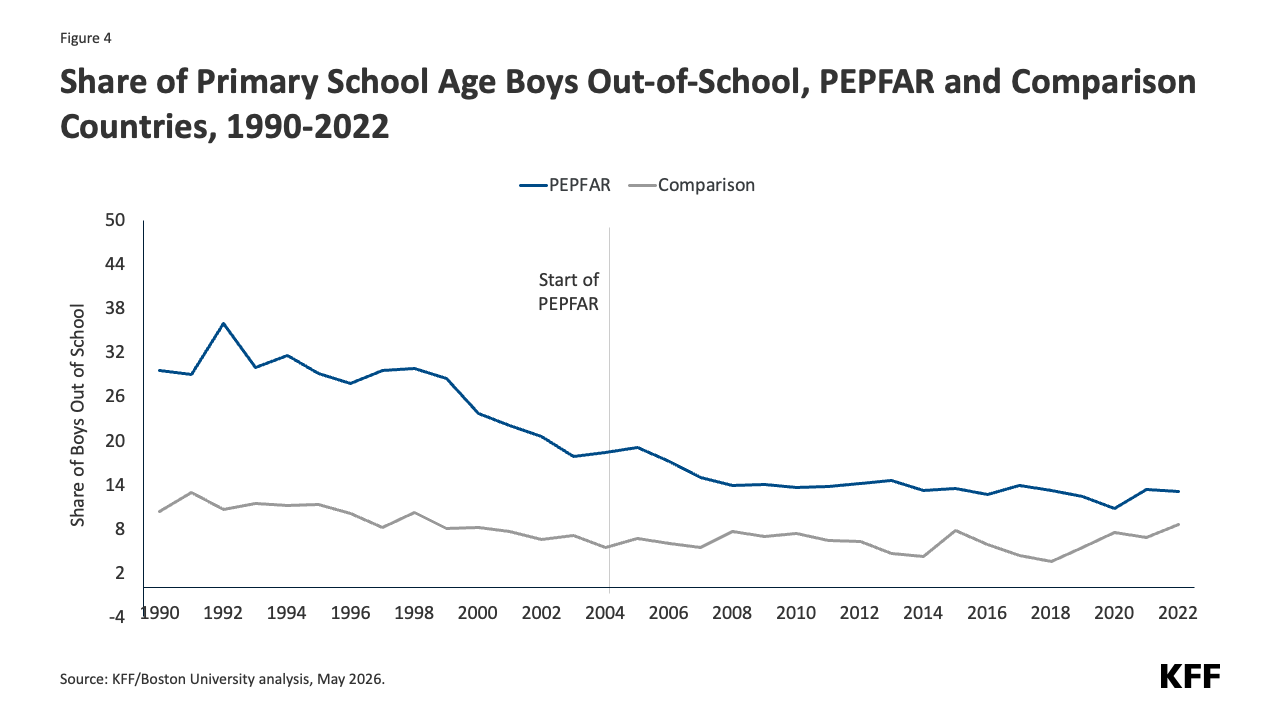
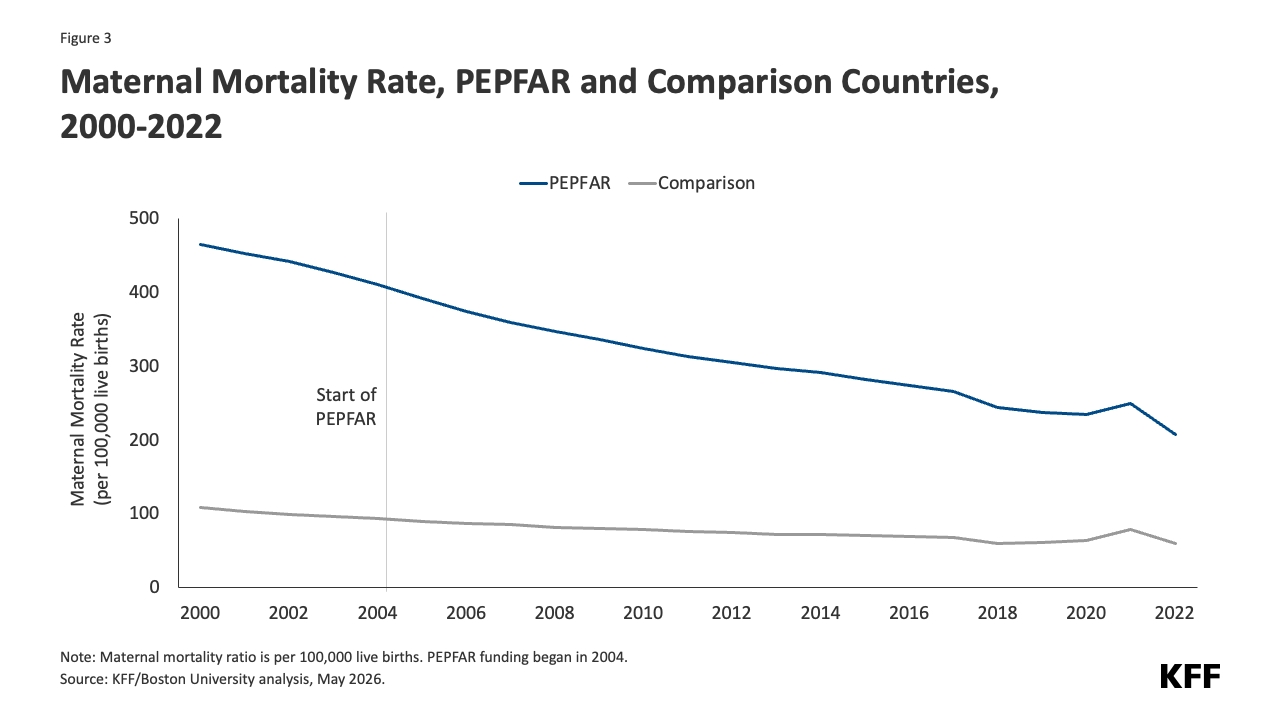
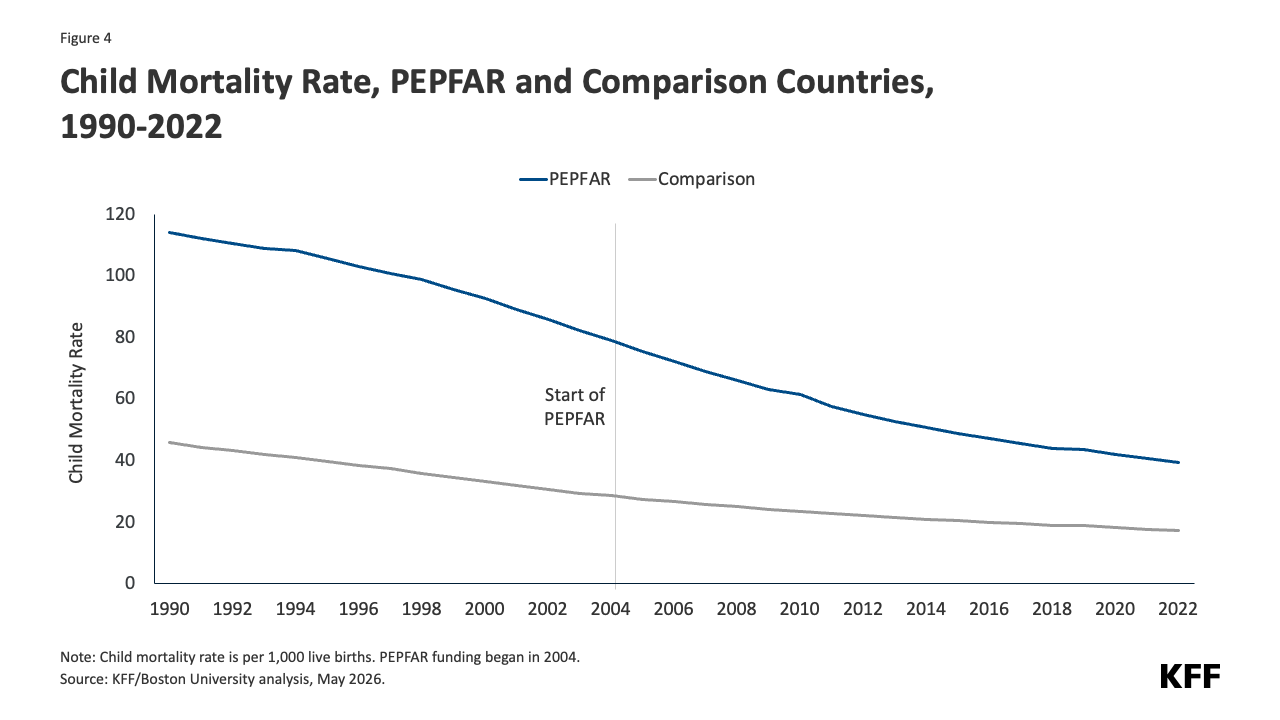
- Maternal and child mortality rates were significantly higher in PEPFAR countries than comparison countries before the start of the program. While their decline accelerated after PEPFAR began, they remained higher over the period. There was some uptick in maternal mortality rates during COVID-19 in both sets of countries (see Figures 3-4).
- As with all-cause mortality rates, PEPFAR investments were associated with significant reductions in both maternal and child mortality, reducing them further than what would have been expected without PEPFAR. Specifically, PEPFAR was associated with a maternal mortality ratio that was 119.1 deaths per 100,000 live births lower than would have been expected without PEPFAR — a 29.1% reduction relative to the 2004 baseline — and a child mortality rate that was 30 deaths per 1,000 live births lower, a 38.0% reduction (see Figure 1 and Tables 5-6).
- These effects were stronger in COP countries. In these countries, maternal mortality was 31.3% lower and child mortality 40.3% lower, relative to the baseline. (see Tables 5-6).
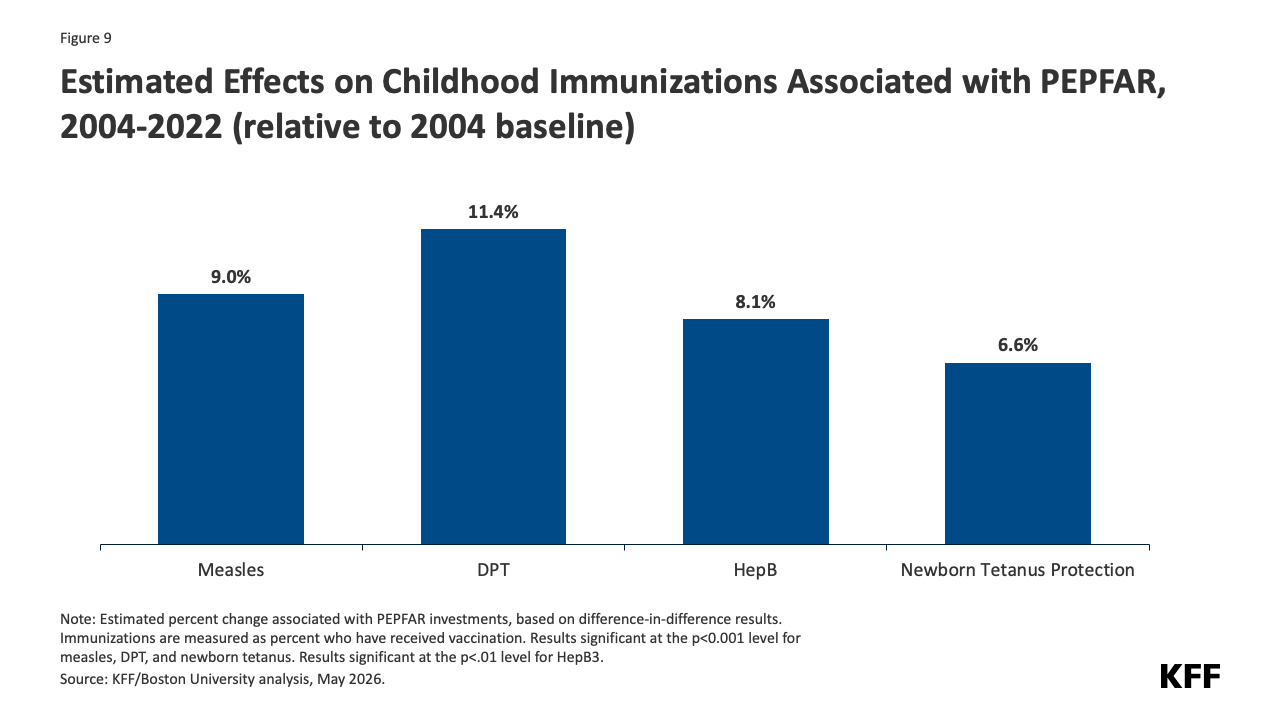
In addition, PEPFAR was associated with significant increases in childhood immunization rates.
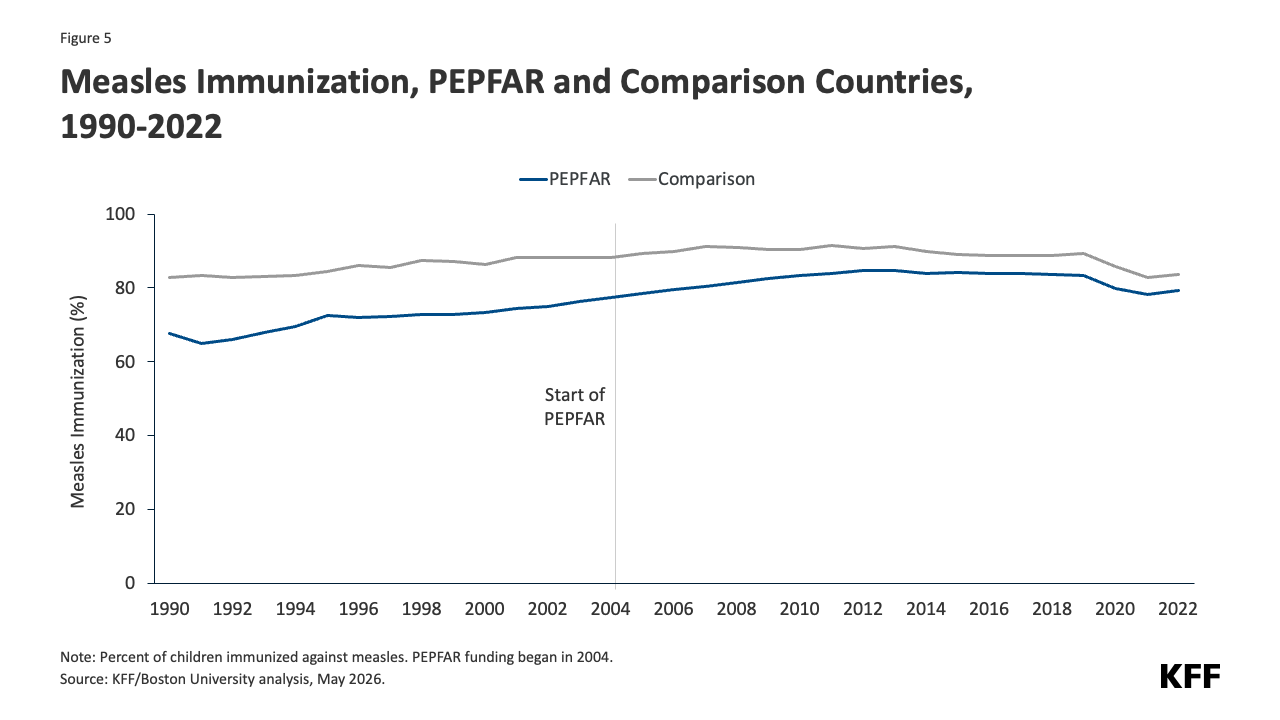
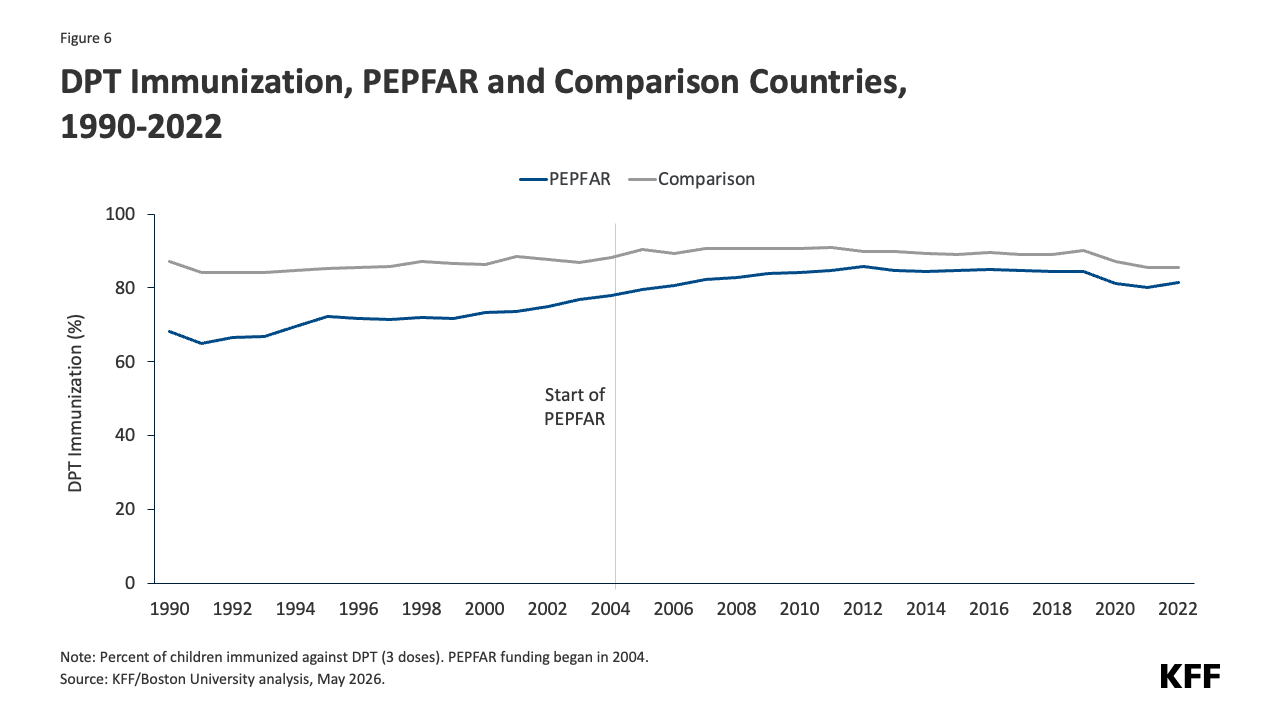
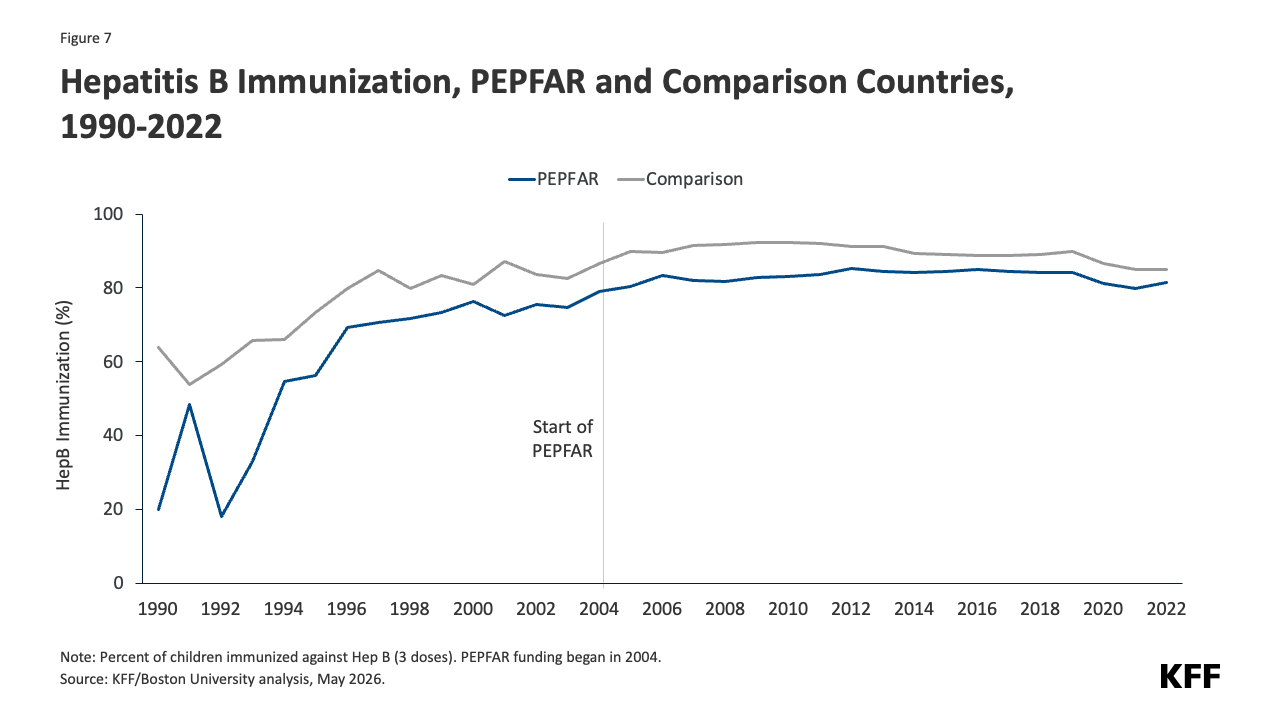
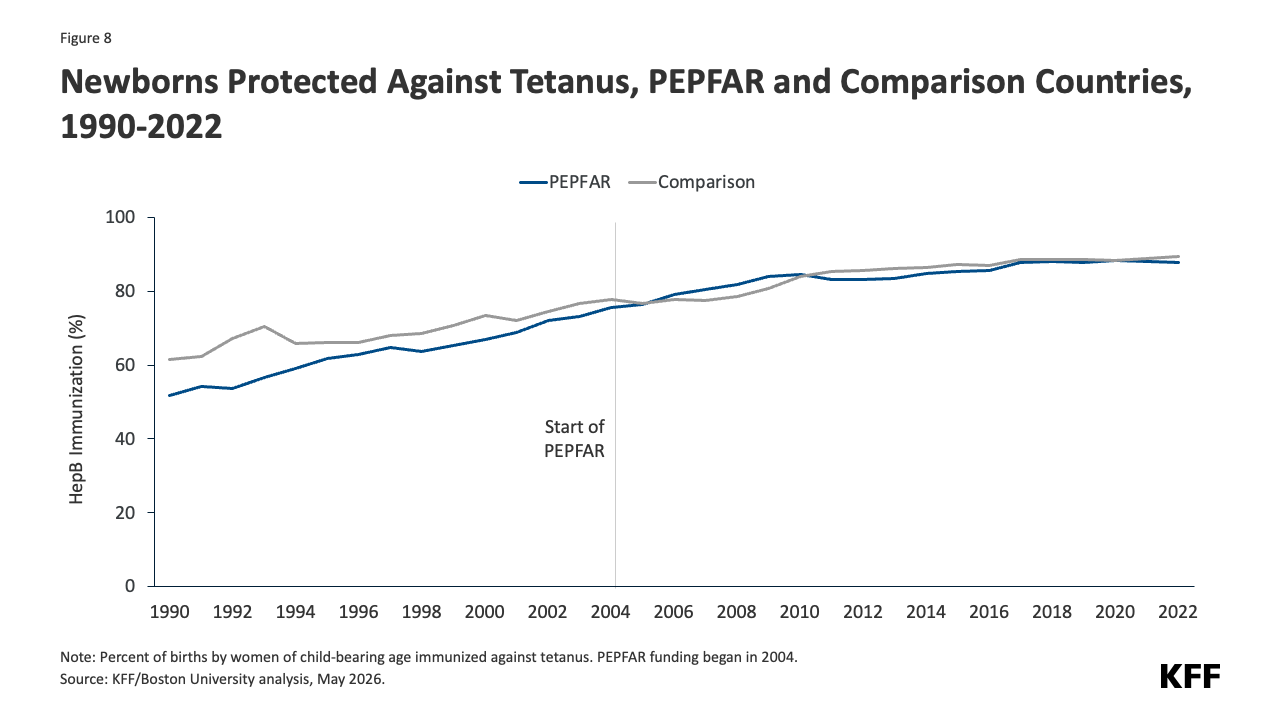
- Immunization coverage increased in PEPFAR countries over time approaching coverage levels in comparison countries for measles, DPT, and hepatitis B and converging for the share of newborns protected from tetanus because their mothers were immunized. Coverage rates for measles, DPT, and hepatitis B fell slightly during COVID-19 in both PEPFAR and comparison countries (see Figures 5-8).
- PEPFAR investments were associated with improvements in immunization coverage rates for all measures compared to what would have been expected without PEPFAR, including measles coverage that was 7 percentage points higher (or a 9% increase relative to the baseline), DPT coverage 8.9 percentage points higher (11.4% increase), and Hepatitis B vaccine coverage of 6.4 percentage points higher (8.1% increase). In addition, the share of newborns protected against tetanus was 5 percentage points higher (6.6%). As with the above measures, these effects were stronger in COP countries (See Figure 9 and Tables 5-6).
Finally, for most outcomes, PEPFAR investments were associated with incremental improvements in each successive phase of the program.
- In each successive phase of the program, corresponding to its different authorization periods, PEPFAR investments continued to be associated with improvements in most outcomes (with the exception of newborn tetanus protection; in addition, other immunization measures did not see incremental improvement in the most recent phase). The greatest incremental improvements were in the first five years of the program, which also marked a significant influx of new funding; PEPFAR funding plateaued after that which may explain the smaller gains in later years. Incremental improvements were largest for the three mortality measures (see Table 7).
Taken together, these findings provide continued evidence of PEPFAR’s knock-on effects for health beyond HIV alone, suggesting that such investments have yielded bigger dividends and served as a wider platform. These findings also suggest that more recent changes made to the PEPFAR program by the Trump administration, including significantly scaling back funding and services with plans to further do so in the coming years, could not only have negative impacts on the HIV response, they could also dampen improvements in these other health areas.
Jen Kates is with KFF. William Crown, Collins Gaba, Monica Jordan and Allyala Nandakumar are with Boston University.
Methods & Tables
A difference-in-difference, quasi-experimental design was used to estimate a “treatment effect” (PEPFAR), based on comparison to a control group (the counterfactual). The difference-in-difference design compares the before and after change in outcomes for the treatment group to the before and after change in outcomes for the comparison group. The outcomes of interest, their definitions and sources are listed in Table 1. Baseline variables are listed in Table 2. The panel data set of 157 low- and middle- income countries used in the prior analysis, covering 1990 to 2018, was updated to include data through 2022 (due to data limitations, the time trend for maternal mortality began in 2000). COVID-related funding was not included. All values were adjusted to constant 2022 dollars.
The PEPFAR group included 90 countries that had received PEPFAR support over the period. The comparison group included 67 low- and middle- income countries that had not received any PEPFAR support or had received minimal PEPFAR support (<$1M over the period or <$.05 per capita) between 2004 and 2022. Data on PEPFAR spending by country were obtained from the U.S. government’s https://foreignassistance.gov/ database and represent U.S. fiscal year disbursements. Data on mortality rates were obtained from the World Bank’s World Development Indicators (WDI) (https://datatopics.worldbank.org/world-development-indicators/. Several different model specifications were explored. Each specification controlled for numerous baseline variables, compared to an unadjusted model, variables which may be expected to influence the outcomes of interest and which help make the comparison group more comparable to the PEPFAR group.
Table 3 provides the model specifications tested in the updated analysis. Each model specification produced similar, statistically significant results. All models were also run with and without China and India, the two most populous countries in the world, to assess whether they were influencing the results. In both cases, PEPFAR’s impact was still significant and results were similar. The final reported results are from model specification 3. The pre-intervention period for this model started in 2002. Almost all results were significant at the p<0.001 level; one result was significant at the p<0.01 level and one at the p<0.05 level. Table 4 provides the mean values for baseline outcomes and Tables 5-6 provide model results. The Table 5 difference-in-difference estimates should be interpreted as the unit change (e.g., in number of deaths per 1,000) in the outcome associated with PEPFAR. The Table 6 estimates should be interpreted as the percent change in the outcome, relative to the baseline, associated with PEPFAR.
Despite the strengths of the difference-in-difference design, there are limitations to this approach. While the models adjusted for numerous baseline factors that could be correlated with the outcomes of interest, there may be other, unobservable factors not captured. Similarly, while baseline factors are also intended to adjust for selection bias, and make the PEPFAR and comparison groups more similar, there may be other ways in which comparison countries differed from PEPFAR countries (and factors which influenced which countries received PEPFAR support), which could bias the estimates. Recent, published research, based on the earlier 2004-2018 period, examined several other model specifications as well as double log transformations for each model. The results were similar across all models, adding to the confidence of the analytic approach used here.4 Another analysis, under review for publication, conducted additional robustness tests and found consistent results.5
| Table 1: Outcome Variables | |
| Variable | Data Source |
| 1. Crude death rate | All causes per 1,000 population |
| 2. Child mortality rate | Probability of a child dying between birth and 5 years of age per 1,000 live births |
| 3. Maternal mortality ratio | Number of women who die from pregnancy-related causes while pregnant or within 42 days of pregnancy termination per 100,000 live births |
| 4. Measles immunization | Percent of children ages 12-23 months who received the measles vaccination |
| 5. DPT immunizations | Percent of children ages 12-23 months who received DPT vaccinations (3 doses) |
| 6. Hepatitis B immunizations | Percent of children ages 12-23 months who received hepatitis B vaccinations (3 doses) |
| 7. Newborns protected against tetanus | Percentage of births by women of child-bearing age who are immunized against tetanus |
| Source: World Bank, WDI, https://datatopics.worldbank.org/world-development-indicators/ | |
| Table 2: Baseline Variables | |
| Variable | Data Source |
| 1. Gross Domestic Product (GDP) per capita (current USD) | World Bank Development Indicators |
| 2. Recipient of U.S. HIV funding prior to 2004 (dummy variable) | https://foreignassistance.gov/ |
| 3. Total population | United Nations, Department of Economic and Social Affairs, Population Division |
| 4. Life expectancy at birth (years) | World Bank Development Indicators |
| 5. Total fertility rate (births per woman) | World Bank Development Indicators |
| 6. Percent urban population (of total population) | World Bank Development Indicators |
| 7. School enrollment, secondary (% gross) | World Bank Development Indicators |
| 8. World Bank country income classification | World Bank |
| 9. HIV prevalence (% of population ages 15-49) | World Bank Development Indicators. To address missing values in some cases, additional data were obtained from the Global Burden of Disease Collaborative Network |
| 10. Per capita donor spending on health (non-PEPFAR) (constant $) | OECD Creditor Reporting System database |
| 11. Per capita domestic health spending, government and private, PPP (current $) | World Bank Development Indicators |
| 12. Measles prevalence in under 5 population (measles immunization models only) | IHME, http://ghdx.healthdata.org/gbd-results-tool |
| 13. Diphtheria prevalence in under 5 population (DPT immunization models only) | IHME, http://ghdx.healthdata.org/gbd-results-tool |
| 14. Whooping cough prevalence 15. in under 5 population (DPT immunization models only) | IHME, http://ghdx.healthdata.org/gbd-results-tool |
| 15. Tetanus prevalence in under 5 population (DPT immunization models only) | IHME, http://ghdx.healthdata.org/gbd-results-tool |
| 16. Hepatitis B prevalence in under 5 population (Hepatitis B immunization models only) | IHME, http://ghdx.healthdata.org/gbd-results-tool |
| Table 3: Model Specifications |
| 1. Unadjusted model |
| 2. Includes baseline variables 1-9 (and an additional baseline variable for disease incidence, 12-16, depending on outcome measure) |
| 3. Includes baseline variables 1-11 (and an additional baseline variable for disease incidence, 12-16, depending on outcome measure) |
| Table 4: Baseline Mean Outcome Values, 2004 | ||
| Outcome | All PEPFAR Countries | PEPFAR COP Countries |
| All-cause mortality rate | 10.5 | 12.6 |
| Maternal mortality ratio | 409.8 | 497.5 |
| Child mortality rate | 78.9 | 97.9 |
| Measles immunization percent | 77.5 | 74.5 |
| DPT immunization percent | 78.0 | 74.2 |
| Hepatitis B immunization percent | 79.1 | 74.4 |
| Prevalence of newborns protected against tetanus | 75.7 | 75.6 |
| Table 5: Difference-in-Difference Estimates Associated with PEPFAR, 2004-2022 (standard errors in parentheses) | ||
| Outcome | All PEPFAR Countries | PEPFAR COP Countries |
| All-cause mortality rate | -2.452*** | -3.523*** |
| (0.171) | (0.235) | |
| Maternal mortality ratio | -119.1*** | -155.9*** |
| (14.618) | (19.101) | |
| Child mortality rate | -30.02*** | -39.48*** |
| (1.329) | (1.979) | |
| Measles immunization percent | 7.004*** | 7.795*** |
| (0.678) | (0.956) | |
| DPT immunization percent | 8.871*** | 9.022*** |
| (0.626) | (0.880) | |
| Hepatitis B immunization percent | 6.435** | 13.67*** |
| (2.133) | (2.915) | |
| Prevalence of newborns protected against tetanus | 4.962*** | 3.303* |
| (1.299) | (1.495) | |
| ***p < 0.001 **p < 0.01 *p < 0.05 | ||
| Table 6: Estimated Percent Change Associated with PEPFAR, 2004-2022 (Relative to 2004 Baseline) | ||
| Outcome | All PEPFAR Countries | PEPFAR COP Countries |
| All-cause mortality rate | -23.4%*** | -28.0%*** |
| Maternal mortality ratio | -29.1%*** | -31.3%*** |
| Child mortality rate | -38.0%*** | -40.3%*** |
| Measles immunization percent | 9.0%*** | 10.5%*** |
| DPT immunization percent | 11.4%*** | 12.2%*** |
| Hepatitis B immunization percent | 8.1%** | 18.4%*** |
| Prevalence of newborns protected against tetanus | 6.6%*** | 4.4%* |
| ***p < 0.001 **p < 0.01 *p < 0.05 | ||
| Table 7: Estimated Incremental Percent Change Associated with PEPFAR by Time Period (Relative to 2004 Baseline) | ||||
| Outcome | 2004 – 2008 | 2009 – 2013 | 2014 – 2018 | 2019 – 2022 |
| All-cause mortality rate | -9.8% | -5.7% | -5.0% | -2.8% |
| Maternal mortality ratio | -14.2% | -6.3% | -4.1% | -4.5% |
| Child mortality rate | -22.0% | -7.0% | -5.7% | -3.3% |
| Measles immunization percent | 5.3% | 2.4% | 1.2% | 0.1% |
| DPT immunization percent | 7.9% | 2.3% | 1.1% | 0.1% |
| Hepatitis B immunization percent | 6.8% | 0.6% | 1.0% | -0.3% |
| Prevalence of newborns protected against tetanus | 9.0% | -1.3% | -0.8% | -0.4% |
Endnotes
- Eran Bendavid E, Bhattacharya J. The President’s Emergency Plan for AIDS Relief in Africa: An Evaluation of Outcomes. Ann Intern Med. 2009;150:688-695. Available at: https://www.acpjournals.org/doi/10.7326/0003-4819-150-10-200905190-00117?url_ver=Z39.88-2003&rfr_id=ori%3Arid%3Acrossref.org&rfr_dat=cr_pub%3Dpubmed&; Bendavid E, Holmes CB, Bhattacharya J, Miller G. HIV Development Assistance and Adult Mortality in Africa. JAMA. 2012;307(19):2060–2067. Available at: https://jamanetwork.com/journals/jama/fullarticle/1157487; IOM (Institute of Medicine). 2013. Evaluation of PEPFAR. Washington, DC: The National Academies Press. Available at: https://www.ncbi.nlm.nih.gov/books/NBK207013/; Wagner Z, Barofsky J, Sood N. PEPFAR Funding Associated With An Increase In Employment Among Males in Ten Sub-Saharan African Countries. Health Aff (Millwood). 2015;34(6):946-953. Available at: https://www.ncbi.nlm.nih.gov/pmc/articles/PMC4782769/; and Daschle T, Frist B. Building Prosperity, Stability, and Security Through Strategic Health Diplomacy: A Study of 15 Years of PEPFAR. Bipartisan Policy Center, Washington DC, 2018. Available at: https://bipartisanpolicy.org/download/?file=/wp-content/uploads/2019/03/Building-Prosperity-Stability-and-Security-Through-Strategic-Health-Diplomacy-A-Study-of-15-Years-of-PEPFAR.pdf; Chun HM, Dirlikov E, Cox MH, et al. Vital Signs: Progress Toward Eliminating HIV as a Global Public Health Threat Through Scale-Up of Antiretroviral Therapy and Health System Strengthening Supported by the U.S. President’s Emergency Plan for AIDS Relief — Worldwide, 2004–2022. MMWR Morb Mortal Wkly Rep 2023;72:317–324. Available at: https://www.cdc.gov/mmwr/volumes/72/wr/mm7212e1.htm?s_cid=mm7212e1_w#suggestedcitation; Gaumer G, Luan Y, Hariharan D, Crown W, Kates J, Jordan M, et al. “Assessing the impact of the president’s emergency plan for AIDS relief on all-cause mortality”. PLOS Glob Public Health 2024; 4(1): e0002467. Available at: https://pmc.ncbi.nlm.nih.gov/articles/PMC10796053/. ↩︎
- “The Future of Investment In PEPFAR: Understanding PEPFAR’s Multiple Economic, Health, And Diplomatic Impacts”, Health Affairs Blog, April 17, 2017. Available at: https://www.healthaffairs.org/content/forefront/future-investment-pepfar-understanding-pepfar-s-multiple-economic-health-and-diplomatic; Crown W, Hariharan D, Kates J, Gaumer G, Jordan M, Hurley C, et al. “Analysis of economic and educational spillover effects in PEPFAR countries.” PLoS ONE 2023; 18(12): e0289909. Available at: https://journals.plos.org/plosone/article?id=10.1371/journal.pone.0289909; ; Gaumer G, Crown WH, Kates J, et al. “Analysis of maternal and child health spillover effects in PEPFAR countries.” BMJ Open 2023;13: e070221. Available at: https://bmjopen.bmj.com/content/13/12/e070221.long. ↩︎
- Historically, a subset of countries receiving PEPFAR support had been required to prepare annual Country Operational Plans (COPs) which documented annual funding levels linked to results and served as budget and tracking tools. These were prepared by country teams who worked intensively to develop these plans in concert with headquarters at the State Department. ↩︎
- Gaumer G, Luan Y, Hariharan D, Crown W, Kates J, Jordan M, Hurley CL, Nandakumar A. “Assessing the impact of the president’s emergency plan for AIDS relief on all-cause mortality”. PLOS Glob Public Health. 2024 Jan 18;4(1):e0002467. doi: 10.1371/journal.pgph.0002467; Gaumer G, Crown WH, Kates J, Luan Y, Hariharan D, Jordan M, Hurley CL, Nandakumar A. “Analysis of maternal and child health spillover effects in PEPFAR countries”. BMJ Open. 2023 Dec 21;13(12):e070221. doi: 10.1136/bmjopen-2022-070221. ↩︎
- Crown W, Stenoien D, Reid MJA, Kumar S, Kates J, Jordan M, Nandakumar A. “The Economic Impact of Lives Saved in PEPFAR Countries”, under review BMJ Global Health. https://doi.org/10.12688/verixiv.2057.1 ↩︎