This fall a new rule takes effect requiring all private health plans to offer a uniform, simple to read, summary of benefits and coverage (SBC). The SBC will provide consumers with standardized information about how plans cover essential health benefits and what coverage limits and cost sharing applies.
The SBC is one of the most popular provisions of the ACA. Consumers often find health insurance difficult to understand and would no doubt welcome a plainly written explanation with illustrations of what plans do and don’t cover. As health plan features become more varied and complex – for example, tiered formularies that vary cost sharing for different kinds of drugs, or the application of benefit-specific deductibles or coverage limits – consumers can find it difficult to compare plans, as well.
The SBC also will include coverage examples that estimate how much a plan would pay for illustrative care scenarios and how much the consumer might be left to pay for deductibles, co-pays, and non-covered services. To derive coverage illustrations, insurers will show how their plans would cover standardized care scenarios developed by HHS with simulated claims for services that include billing codes and charges (based on Medicare payment levels.)
Eventually health plans will have to provide as many as six different illustrations, testing how policies cover more complex and expensive care scenarios, such as for treatment of cancer or a heart attack, which could involve many different types of benefits (e.g., hospitalization, surgical care, medical therapies and rehab services). At the outset, though, insurers will be required to produce only two illustrations involving relatively simple care scenarios – maternity care for an uncomplicated pregnancy, and routine management of type-2 diabetes. These scenarios include a few dozen claims each, with the dollar amount of care involved less than $10,000.
- The maternity care scenario includes a total of 43 claims over 9 months for prenatal labs and vitamins, one ultrasound, routine obstetric care visits and delivery, anesthesia, and a brief hospital stay for the mother and infant.
- The diabetes scenario has a total of 120 claims over 12 months, most of which are for monthly refills of insulin and two other prescription medications and of syringes, test strips, and other testing supplies; also semi-annual lab tests, a blood glucose meter, quarterly visits to a primary care physician, annual eye and foot exams, and preventive care vaccines.
Insurers will simulate the processing of these claims, adding up what consumers would be left to pay for cost sharing and non-covered services. What results is an estimated out-of-pocket cost number that consumers can use to compare different policies.
Recently, insurers and health plans were notified that coverage examples will be further simplified in the first year. Plans will be able to use a standardized “calculator” to estimate values for coverage examples this fall. Instead of ”processing” the maternity and diabetes claims, insurers can input just a few features about their policies into the calculator, which will use simplified assumptions to produce coverage illustration estimates. Instructions for the calculator acknowledge that because it has been simplified, estimates may be inaccurate; nonetheless most insurers and health plans will be allowed to use the calculator in the first year while they design their own automated coverage examples systems.
To assess the effect of the simplifying assumptions built into the calculator, we applied it to two plans offered to federal employees for which details are publicly available. Here are some examples of what we found (full results and details of the two plans are provided in tables below):
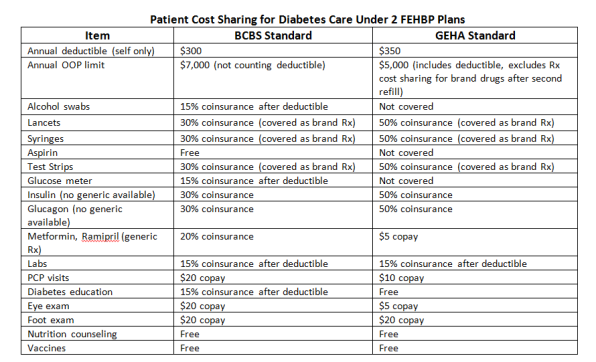
- Prescription drugs – The cost-sharing rules for generic drugs are assumed to apply to all prescription drugs even when there is no generic equivalent. In the diabetes scenario, prescription drugs are the most expensive component ($2,850 of the $5,500 total) and most drug costs (nearly $1,700) are for insulin, which does not have a generic equivalent. Yet, many health insurance policies have tiered drug formularies that impose significantly higher cost sharing for non-generic drugs. For example, under the Federal Employees Health Benefits Program (FEHBP), the Government Employees Health Association (GEHA) Standard Plan requires consumers to pay a $5 copay for generic prescriptions but 50% coinsurance for brand drugs. Under this plan, cost sharing for prescriptions alone under the diabetes scenario would add up to $981. By contrast, the simplified calculator would estimate prescription cost sharing of $200.
- Visits and procedures – The calculator assumes a single level of cost-sharing applies for all visits and procedures, even though many health plans have different cost-sharing or coverage rules depending on the type of visit or provider. For example, under the Blue Cross Standard Option FEHBP plan, 4 of the specialist visits in the diabetes scenario are subject to the annual $350 deductible while the other 6 visits require only a $20 copay.
- Hospital care and anesthesia – Similarly, the calculator assumes uniform cost sharing rules for hospital care and anesthesia, although different cost sharing rules exist under many health plans. For example, under the Blue Cross Standard Option FEHBP plan, hospital care is generally subject to a $250 copay per admission, while anesthesia care would be subject to the annual deductible plus 15% coinsurance. (However, in this plan a special coverage rule for routine maternity care waives the hospital copay as well as cost sharing for the obstetrician and anesthesia charges.)
- Benefit categories – In the diabetes category, the calculator assumes all testing supplies (syringes, lancets, test strips, blood glucose meters and solutions) are covered under the medical equipment benefit and subject to the same cost-sharing. In fact, plans may cover these supplies differently – some plans may cover testing supplies and equipment under the prescription benefit, others cover items under several benefit categories, still other may exclude coverage for some items and supplies altogether. One study found that insurance coverage exclusions for test strips (which cost nearly $1000 per year in the scenario) are particularly problematic for patients with diabetes. The simplified calculator can’t take into account benefit exclusions of this type.
- Annual out-of-pocket limit – The calculator also assumes that all cost sharing – deductibles, copays, and coinsurance – count toward the plan’s annual out-of-pocket limit, though this is often not the case. Under the Blue Cross Standard Option FEHBP plan, for example, the out-of-pocket limit doesn’t include the annual deductible, while under the GEHA Standard plan, the annual deductible does count toward this limit but some prescription cost-sharing does not.
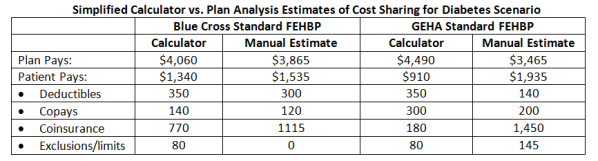
The calculator’s simplified assumptions make it easier for health plans to produce coverage illustrations, but they make them much less useful to consumers because they can mask the effect of plan differences that would lead to significant differences in cost -sharing for consumers. To illustrate, simplified coverage features for diabetes benefits under two FEHBP plans were entered in the calculator and the resulting cost estimates for consumers were compared to estimates derived from a manual analysis of cost sharing and benefit limits rules under the same plans. The simplified calculator underestimated patient cost sharing under both plans. It also mis-estimated the difference in patient costs between the two plans – the calculator estimates signal that diabetes coverage under the GEHA Standard plan is more generous compared to the Blue Cross Standard plan (patients under GEHA would pay $430 less out-of-pocket than under Blue Cross Standard), while the manual analysis shows the Blue Cross plan coverage is more comprehensive for diabetes care (patients under Blue Cross would pay $400 less than under GEHA.)
Initial implementation of the SBC and coverage illustrations is just a first step of an important task to make health insurance more transparent and insurance markets more competitive. Understandably, health plans would like to make this first step as simple and least costly as possible. But over-simplifying the process can mask important plan differences for consumers and cloud transparency.
Results
Key coverage features of two FEHBP plans are compared to services included in the Diabetes Coverage Illustration. Results are summarized below:
The coverage features of two plans were entered into the simplified calculator (to the extent possible), and also were applied manually to claims in the Diabetes Coverage Illustration. Results of the two estimating methods are shown below: