State-by-State Estimates of Changes in Federal Spending on Health Care Under the Graham-Cassidy Bill
A new health care bill recently introduced by a number of senators led by Senators Lindsey Graham and Bill Cassidy would repeal major elements of the Affordable Care Act (ACA), make changes to other ACA provisions, fundamentally alter federal Medicaid financing, and reduce federal spending for health coverage. Key provisions of the Graham-Cassidy proposal would:
- Repeal the ACA Medicaid expansion and individual insurance market subsidies—including premium tax credits, cost-sharing reductions, and the basic health program—as of 2020.
- Create a new block grant program to states, which replaces the ACA’s Medicaid expansion and insurance subsidies, for years 2020-2026. States would have flexibility to use these funds to cover the cost of high-risk patients, assist individuals with premiums and cost-sharing, pay directly for health care services, or provide health insurance to a limited extent to people eligible for Medicaid.
- Convert federal funding for the traditional Medicaid program from an open-ended basis to a capped amount.
The bill also repeals the penalties under the ACA’s individual and employer mandates and allows states to waive benefit requirements and community rating in the individual and small group markets. The proposal would fundamentally alter the current federal approach to financing health coverage for more than 80 million people who have coverage through the ACA (Medicaid expansion or marketplace) or through the traditional Medicaid program.
Graham-Cassidy Plan Would Decrease Federal Funding for States by $160 Billion from 2020-2026
In this brief, we estimate changes in federal funding due to the new block grant program and the Medicaid per enrollee cap on a state-by-state basis under the Graham-Cassidy bill relative to current law. This analysis addresses changes in federal funding for health coverage under the bill but does not project changes in the number of people covered. This analysis is not intended to replace a comprehensive score by the Congressional Budget Office (CBO), which would typically look at changes in federal spending and revenues, coverage, and premiums, addressing all provisions of the bill; however, CBO does not produce state-by-state estimates of the effects of legislation. A description of the methods underlying the analysis is in the “Methods” box at the end of the brief.
Key Findings
- Based on our estimates, overall federal funding for coverage expansions and Medicaid would be $160 billion less than current law under the Graham-Cassidy bill over the period 2020-2026. Thirty-five states plus the District of Columbia would face a loss of funding.
- We estimate that federal funding under the new block grants would be $107 billion less than what the federal government would have spent over the period 2020-2026 for ACA coverage.
- There would be a significant redistribution in federal funding across states under the block grant. Overall expansion states would lose $180 billion for ACA coverage and non-expansion states would gain $73 billion over the 2020-2026 period. A typical Medicaid expansion state would see an 11% reduction in federal funds for coverage compared to an increase of 12% in a typical non-expansion state.
- The Medicaid per enrollee cap would lead federal spending for the traditional Medicaid program to be $53 billion lower from 2020-2026 than it would be under current law. This represents one-third of the reduction in federal funds from the block grant and the per capita cap over that period. Because per enrollee caps become more binding over time, by 2027, federal spending for the traditional Medicaid program would be $15 billion lower than under current law.
- Almost all states face a potential loss of federal funds for their traditional Medicaid programs under the per enrollee cap; thus, the per enrollee cap offsets some or all of the gains some states may realize under the block grant and further cuts federal spending in states that may see a loss under the block grant.
- Block grants under the Graham-Cassidy bill end in 2026. If they are not renewed, federal funding for coverage would decrease by $240 billion in 2027 alone.
State-by-State Effects of Block Grants
Starting in 2020, the Graham-Cassidy bill replaces the ACA’s Medicaid expansion and individual insurance subsidies with a fixed block grant to states. The formula for calculating the block grant is complex but generally works as follows:
- Total federal funding for all states would be $136 billion in 2020 (plus a $10 billion reserve that could be used in future years), $146 billion in 2021, $157 billion in 2022, $168 billion in 2023, $179 billion in 2024, $190 billion in 2025, and $190 billion in 2026. There is no authority in the bill for the block grant to continue after 2026.
- Allotments to states for 2020 would be based on current federal spending by state for the Medicaid expansion and individual insurance market subsidies, trended forward to 2019. States would have some flexibility in choosing a base period for the initial allotments.
- Allotments for 2026 would be based on the distribution of legal residents with incomes from 50% to 138% of the poverty level across states. State allotments would be phased down or up for years between 2020 and 2026.
- If the formula produces total state allotments that are greater (or less) than the designated national amounts, they are phased up (or down) on a prorated basis. There would be adjustments across states for population changes, health risk, and the value of coverage provided to people. In addition, the Secretary has discretion to make additional changes to the allocation based on state population factors that affect health expenditures.
Overall, we estimate that federal funding under the new block grants would be $107 billion less than what the federal government would have spent over the period 2020-2026 for expanded Medicaid coverage, premium tax credits, cost-sharing subsidies, and the basic health program (Table 1 and Figure 1).
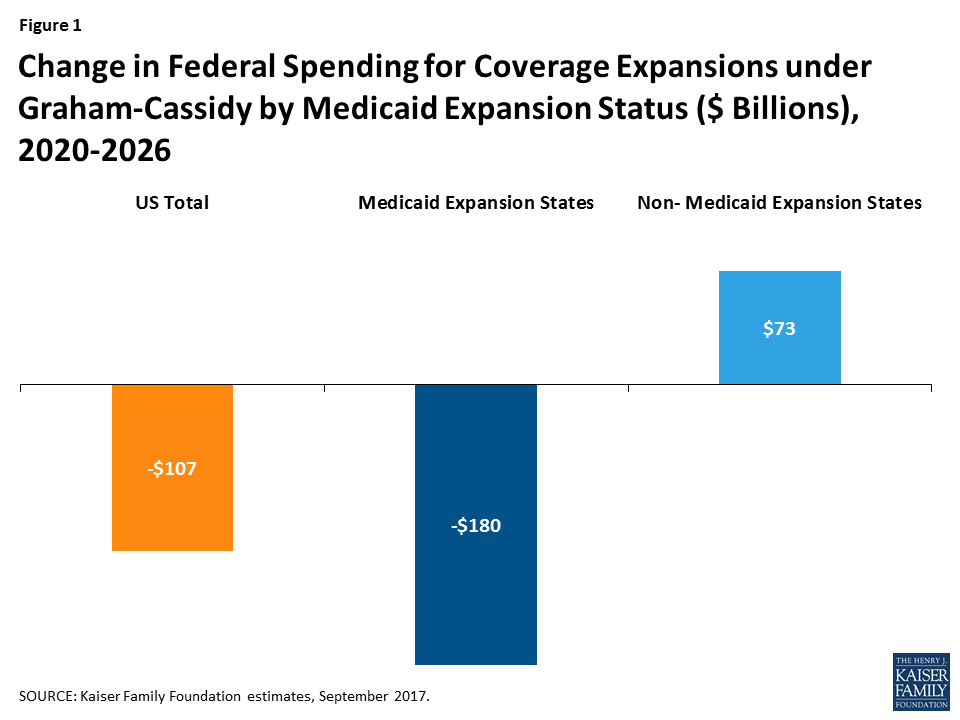
There would be a significant redistribution in federal funding across states under the block grant proposed in the Graham-Cassidy bill. In general, states that have expanded Medicaid under the ACA and/or have had substantial enrollment in the health insurance marketplaces would see reductions in federal spending for coverage expansions, while other states would see increases. The median change in federal funds under the block grant program relative to current law is -11% for Medicaid expansion states, for a total of $180 billion in reduced funding over 2020-2026, versus a median increase of 12% (a total of $73 billion) in states that have not expanded Medicaid (Figure 1).
Five states would see a reduction in federal funds of 30% or more from 2020-2026: New York (-35%), Oregon (-32%), Connecticut (-31%), Vermont (-31%), and Minnesota (-30%). Six states would see at least 40% more in federal funds under the proposal: Tennessee (44%), South Dakota (45%), Georgia (46%), Kansas (61%), Texas (75%), and Mississippi (148%). States with the largest potential loss of federal funds are California (-$56 billion), New York (-$52 billion), and Pennsylvania (-$11 billion). Texas would see $34 billion more in federal funds, and Georgia, Tennessee, and Mississippi would see large gains ($10 billion, $7 billion, and $6 billion, respectively) over the period.
Because actual state allotments under the block grant may vary based on state-specific factors and the Secretary’s authority to further adjust the formula, actual state experiences under the block grant may differ. It is uncertain how additional adjustments would be used to alter states’ allotments up or down.
Unlike the marketplace subsidies and Medicaid expansion under the ACA, the block grants are fixed and would not adjust based on the number of people covered or increases in health care costs. The block grants end after 2026, and further action by Congress would be required to continue them. If Congress did not extend the block grants, we estimate a reduction in federal funding for expanded coverage relative to current law of $225 billion in 2027 alone (Table 3).
State-by-State Effects of Capping Medicaid Spending
The proposal also converts the traditional Medicaid program for low-income parents, children, people with disabilities, and the elderly from one with open-ended federal financing to one in which federal Medicaid spending for most enrollees would be limited to a set amount per enrollee, similar to previous repeal and replace legislation. The capped financing structure would work as follows:
- States would use data from FY 2014-2017 to develop base year per enrollee spending that would be inflated to 2019 based on the medical component of the consumer price index (CPI-M).
- Beginning in 2020, federal spending would be limited to the federal share of spending based on per enrollee amounts calculated by inflating the base year spending by CPI-M for children and adults and CPI-M plus one percentage point for the elderly and disabled.
- Beginning in 2025, these rates would be further limited to the CPI-U (or general inflation) for children and adults and to CPI-M for the elderly and people with disabilities.
As a result of these limits, federal Medicaid financing would grow more slowly than estimates under current law. Over the 2020-2026 period, we estimate that federal Medicaid spending would be $53 billion lower than it would be under current law (Table 2). Per enrollee caps become more binding over time, and in 2027 alone, we estimate that federal spending for the traditional Medicaid program would be $15 billion lower than under current law (Table 3).
State-by-state estimates vary depending on the current size of the state’s Medicaid program and its case mix of enrollment across eligibility groups. However, the vast majority of states1 face a potential loss of federal funds for their traditional Medicaid programs under the per enrollee cap.
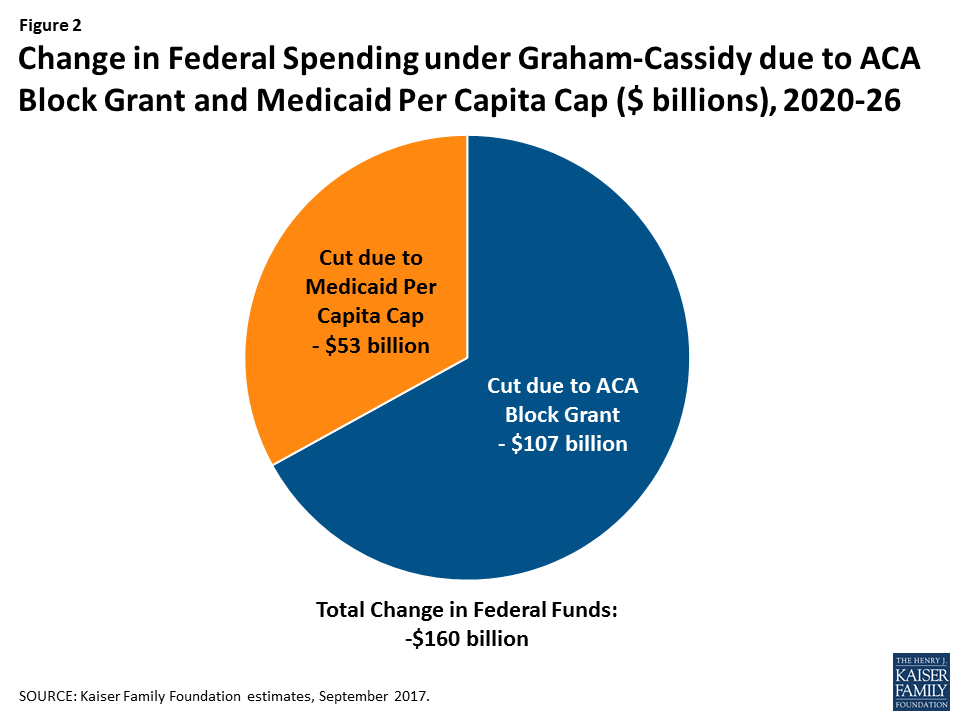
The per enrollee cap offsets some of the gains the state may realize under the block grant or, in states that face a potential loss under the block grant, increases the drop in federal funds. Nationally, we estimate that the two provisions together would lead to a $160 billion reduction in federal funds to states from 2020-2026 (Figure 2 and Table 2). In some states (Ohio, Maine, and Louisiana), the potential loss of funds under the traditional Medicaid program fully offsets potential gains in federal funds under the block grant, leading to a net loss for the state.
Conclusion
The two main provisions in the Graham-Cassidy proposal—converting ACA coverage expansions to a block grant to states and converting traditional Medicaid financing to a federal per enrollee cap—affect coverage for more than 80 million Americans and have substantial implications for states’ ability to finance health coverage for their residents. Most states would lose federal funding under this proposal over the period 2020-2026. Because overall funding for health coverage is lower under the bill than we project under current law, the number of people uninsured would likely grow.
While some states—especially those that did not expand Medicaid under the ACA or did not experience significant enrollment in the health insurance marketplace—may gain new funds under the block grant, they would lose federal funds for their traditional Medicaid program. In addition, states that have already expanded Medicaid under the ACA or have seen big gains in marketplace enrollment would generally lose federal funds.
This bill leaves enormous discretion to states to determine what to do with federal block grant funding and what protections to provide in the individual and small group insurance markets. The bill allows states to roll back the essential health benefits now offered in the nongroup and small group markets and to permit insurers to charge higher premiums to people with pre-existing conditions. Because the ACA’s Medicaid expansion and private insurance subsidies end in 2020, every state would be expected to create new health insurance coverage programs from scratch. It is difficult to anticipate how much of the funds states will devote to coverage or what types of programs they will arrange, so estimating how many people will be covered, and the adequacy of that coverage, is quite difficult. Because the bill does not provide for block grants beyond 2026, federal funding would drop precipitously after that if Congress does not act to reauthorize funding, resulting in a significant increase in the number of people uninsured.
| Table 1: Changes to Federal Spending for ACA Coverage under Graham-Cassidy($ Millions), 2020-2026 | ||||
| State | Current Law Federal Funds for ACA Coverage | Federal Funds under Block Grant Program | Difference ($) | Difference (%) |
| US Total | 1,283,107 | 1,176,000 | -107,107 | -8% |
| Alabama | 12,504 | 16,518 | 4,015 | 32% |
| Alaska | 3,583 | 3,308 | -275 | -8% |
| Arizona | 31,238 | 28,305 | -2,933 | -9% |
| Arkansas | 15,063 | 13,930 | -1,133 | -8% |
| California | 244,640 | 188,672 | -55,969 | -23% |
| Colorado | 17,706 | 15,419 | -2,288 | -13% |
| Connecticut | 17,897 | 12,294 | -5,603 | -31% |
| Delaware | 5,149 | 4,130 | -1,018 | -20% |
| DC | 2,956 | 2,671 | -286 | -10% |
| Florida | 81,451 | 73,894 | -7,557 | -9% |
| Georgia | 21,914 | 31,898 | 9,984 | 46% |
| Hawaii | 5,498 | 5,379 | -119 | -2% |
| Idaho | 4,350 | 5,508 | 1,158 | 27% |
| Illinois | 43,086 | 42,508 | -578 | -1% |
| Indiana | 25,665 | 24,987 | -678 | -3% |
| Iowa | 9,280 | 10,106 | 826 | 9% |
| Kansas | 4,563 | 7,348 | 2,786 | 61% |
| Kentucky | 28,521 | 23,133 | -5,388 | -19% |
| Louisiana | 20,297 | 20,434 | 137 | 1% |
| Maine | 3,879 | 4,204 | 325 | 8% |
| Maryland | 19,685 | 18,082 | -1,603 | -8% |
| Massachusetts | 20,827 | 18,979 | -1,848 | -9% |
| Michigan | 39,891 | 34,960 | -4,931 | -12% |
| Minnesota | 28,178 | 19,834 | -8,344 | -30% |
| Mississippi | 4,079 | 10,102 | 6,024 | 148% |
| Missouri | 12,041 | 16,414 | 4,373 | 36% |
| Montana | 6,010 | 4,490 | -1,520 | -25% |
| Nebraska | 5,649 | 4,923 | -726 | -13% |
| Nevada | 11,471 | 10,601 | -870 | -8% |
| New Hampshire | 3,947 | 3,641 | -306 | -8% |
| New Jersey | 34,315 | 29,077 | -5,237 | -15% |
| New Mexico | 14,092 | 11,914 | -2,178 | -15% |
| New York | 148,062 | 96,438 | -51,623 | -35% |
| North Carolina | 40,378 | 34,673 | -5,704 | -14% |
| North Dakota | 2,138 | 1,975 | -164 | -8% |
| Ohio | 37,526 | 39,281 | 1,755 | 5% |
| Oklahoma | 10,526 | 12,770 | 2,244 | 21% |
| Oregon | 28,744 | 19,544 | -9,200 | -32% |
| Pennsylvania | 57,430 | 46,056 | -11,373 | -20% |
| Rhode Island | 4,938 | 4,191 | -747 | -15% |
| South Carolina | 11,674 | 16,218 | 4,544 | 39% |
| South Dakota | 1,747 | 2,542 | 795 | 45% |
| Tennessee | 15,402 | 22,140 | 6,738 | 44% |
| Texas | 45,519 | 79,792 | 34,273 | 75% |
| Utah | 5,918 | 7,717 | 1,799 | 30% |
| Vermont | 3,477 | 2,407 | -1,070 | -31% |
| Virginia | 15,676 | 20,459 | 4,783 | 31% |
| Washington | 32,947 | 27,631 | -5,317 | -16% |
| West Virginia | 8,657 | 8,128 | -530 | -6% |
| Wisconsin | 11,338 | 14,826 | 3,489 | 31% |
| Wyoming | 1,586 | 1,548 | -38 | -2% |
| SOURCE: Kaiser Family Foundation estimates, September 2017. | ||||
| Table 2: Total Change in Federal Spending under Graham-Cassidy due toACA Block Grant and Medicaid Per Capita Cap ($ Millions), 2020-2026 | |||
| State | Change in Federal Funds Due to Block Grant | Change in Federal Funds Due to Medicaid Per Enrollee Cap | Total Change in Federal Funds ($) |
| US Total | -107,107 | -52,759 | -159,867 |
| Alabama | 4,015 | -585 | 3,430 |
| Alaska | -275 | 0 | -275 |
| Arizona | -2,933 | -1,562 | -4,495 |
| Arkansas | -1,133 | -1,138 | -2,271 |
| California | -55,969 | -5,711 | -61,680 |
| Colorado | -2,288 | -573 | -2,860 |
| Connecticut | -5,603 | -156 | -5,759 |
| Delaware | -1,018 | -146 | -1,164 |
| DC | -286 | -335 | -621 |
| Florida | -7,557 | -2,155 | -9,712 |
| Georgia | 9,984 | -2,645 | 7,339 |
| Hawaii | -119 | -164 | -283 |
| Idaho | 1,158 | -309 | 849 |
| Illinois | -578 | -1,228 | -1,807 |
| Indiana | -678 | -831 | -1,509 |
| Iowa | 826 | -421 | 405 |
| Kansas | 2,786 | -341 | 2,445 |
| Kentucky | -5,388 | -958 | -6,346 |
| Louisiana | 137 | -804 | -667 |
| Maine | 325 | -379 | -54 |
| Maryland | -1,603 | -981 | -2,584 |
| Massachusetts | -1,848 | -1,707 | -3,555 |
| Michigan | -4,931 | -2,280 | -7,211 |
| Minnesota | -8,344 | -1,016 | -9,359 |
| Mississippi | 6,024 | -762 | 5,262 |
| Missouri | 4,373 | -1,331 | 3,042 |
| Montana | -1,520 | 0 | -1,520 |
| Nebraska | -726 | -180 | -906 |
| Nevada | -870 | -282 | -1,153 |
| New Hampshire | -306 | -148 | -454 |
| New Jersey | -5,237 | -1,252 | -6,489 |
| New Mexico | -2,178 | -808 | -2,986 |
| New York | -51,623 | -645 | -52,268 |
| North Carolina | -5,704 | -2,465 | -8,170 |
| North Dakota | -164 | -70 | -233 |
| Ohio | 1,755 | -2,365 | -610 |
| Oklahoma | 2,244 | -947 | 1,298 |
| Oregon | -9,200 | -578 | -9,778 |
| Pennsylvania | -11,373 | -1,004 | -12,377 |
| Rhode Island | -747 | -231 | -977 |
| South Carolina | 4,544 | -1,373 | 3,171 |
| South Dakota | 795 | -109 | 685 |
| Tennessee | 6,738 | -1,978 | 4,759 |
| Texas | 34,273 | -5,823 | 28,449 |
| Utah | 1,799 | -643 | 1,156 |
| Vermont | -1,070 | -207 | -1,277 |
| Virginia | 4,783 | -917 | 3,866 |
| Washington | -5,317 | -1,155 | -6,472 |
| West Virginia | -530 | -435 | -964 |
| Wisconsin | 3,489 | -562 | 2,927 |
| Wyoming | -38 | -62 | -100 |
| SOURCE: Kaiser Family Foundation estimates, September 2017. | |||
| Table 3: Total Change in Federal Spending under Graham-Cassidy due toACA Block Grant and Medicaid Per Capita Cap ($ Millions), 2027 | |||
| State | Loss of Federal Funds for ACA Coverage if Congress Does Not Extend Block Grant | Loss of Federal Funds Due to Medicaid Per Enrollee Cap | Total Loss of Federal Funds |
| US Total | -225,072 | -15,001 | -240,073 |
| Alabama | -2,058 | -155 | -2,212 |
| Alaska | -632 | 0 | -632 |
| Arizona | -5,559 | -462 | -6,021 |
| Arkansas | -2,734 | -326 | -3,060 |
| California | -43,846 | -1,718 | -45,564 |
| Colorado | -3,172 | -164 | -3,335 |
| Connecticut | -3,196 | -51 | -3,248 |
| Delaware | -924 | -41 | -964 |
| DC | -545 | -99 | -643 |
| Florida | -13,403 | -601 | -14,004 |
| Georgia | -3,606 | -763 | -4,369 |
| Hawaii | -998 | -47 | -1,045 |
| Idaho | -716 | -84 | -800 |
| Illinois | -7,656 | -346 | -8,002 |
| Indiana | -4,643 | -226 | -4,869 |
| Iowa | -1,659 | -116 | -1,775 |
| Kansas | -751 | -95 | -846 |
| Kentucky | -5,208 | -268 | -5,477 |
| Louisiana | -3,590 | -211 | -3,801 |
| Maine | -638 | -107 | -745 |
| Maryland | -3,525 | -290 | -3,815 |
| Massachusetts | -3,734 | -508 | -4,243 |
| Michigan | -7,159 | -648 | -7,807 |
| Minnesota | -4,965 | -287 | -5,252 |
| Mississippi | -671 | -208 | -879 |
| Missouri | -1,981 | -358 | -2,339 |
| Montana | -1,048 | 0 | -1,048 |
| Nebraska | -930 | -50 | -980 |
| Nevada | -2,058 | -79 | -2,137 |
| New Hampshire | -704 | -43 | -747 |
| New Jersey | -6,115 | -359 | -6,474 |
| New Mexico | -2,570 | -238 | -2,807 |
| New York | -26,194 | -202 | -26,395 |
| North Carolina | -6,644 | -674 | -7,319 |
| North Dakota | -379 | -19 | -398 |
| Ohio | -6,790 | -687 | -7,477 |
| Oklahoma | -1,732 | -269 | -2,001 |
| Oregon | -5,194 | -162 | -5,356 |
| Pennsylvania | -10,181 | -231 | -10,412 |
| Rhode Island | -893 | -66 | -958 |
| South Carolina | -1,921 | -392 | -2,313 |
| South Dakota | -288 | -31 | -318 |
| Tennessee | -2,534 | -582 | -3,116 |
| Texas | -7,490 | -1,577 | -9,068 |
| Utah | -974 | -180 | -1,154 |
| Vermont | -619 | -59 | -678 |
| Virginia | -2,580 | -259 | -2,838 |
| Washington | -5,984 | -347 | -6,331 |
| West Virginia | -1,553 | -124 | -1,677 |
| Wisconsin | -1,866 | -175 | -2,041 |
| Wyoming | -261 | -17 | -278 |
| SOURCE: Kaiser Family Foundation estimates, September 2017. | |||
Methods
These estimates are based on Kaiser Family Foundation analysis. We combined data from a variety of sources to develop a baseline of future Medicaid enrollment and spending by state and future federal spending by state for marketplace premium tax credits, cost sharing reductions, and Basic Health Program coverage under current law. We then applied the policy changes in the proposal—specifically, the replacement of federal ACA coverage funds with a state block grant program and the use of a per enrollee cap on federal funds for traditional beneficiaries—to project future spending under the proposal and compare these estimates to our baseline. These estimates assume that states make no other policy changes other than those explicitly modeled. They therefore differ from estimates from the Congressional Budget Office (CBO). CBO also must account for all provisions in the legislation and make estimates about how the Secretary will respond to discretion to implement various provisions as well as how states and individuals will respond to changes in the law that are not incorporated into our estimates.
Our estimates for changes in federal spending nationally may differ from those released by CBO for a variety of other reasons. Our estimates are based on the most currently available data for federal spending on the Medicaid expansion and marketplace subsidies. Because the Congressional debate is in the context of a fiscal year 2017 budget resolution, CBO uses its March 2016 baseline to score health reform proposals, and this baseline is not adjusted for more recent data. CBO assumes that some additional states would expand Medicaid in future years under current law, while our estimates are based on current state Medicaid expansion decisions.
Baseline Medicaid Enrollment and Spending. We generated estimates of Medicaid enrollment and spending for full-benefit enrollees in FY2016 based on Kaiser Family Foundation analysis of the FY2015 Medicaid Statistical Information System (MSIS). We adjusted MSIS spending to CMS-64 spending to account for MSIS undercounts of spending. Because FY2015 MSIS data were missing some or all quarters for some states, we also adjusted the enrollment data using secondary data to represent a full fiscal year of enrollment. We accounted for a state’s expansion status, the number of quarters of missing data, and the state’s historical patterns of spending and enrollment in making state-by-state adjustments, using similar methods we used for estimates for earlier years. Because MSIS does not identify adults who are eligible through the ACA expansion versus pre-ACA pathways, we used the FY2015 Medicaid Budget and Expenditure System (MBES) data to break out enrollment and spending for Group VIII (ACA expansion) enrollees. We then inflated to FY2016 based on the CMS Office of the Actuary (OACT) estimates of annual changes in enrollment and spending by eligibility group, with the exception of enrollment for Group VIII, which was obtained from the available FY2016 MBES data. In some cases (e.g., states that expanded after FY2015), we made state-specific adjustments to the data.
We used the FY2016 base year data to project future Medicaid enrollment and spending by eligibility group. Because there is uncertainty around future growth rates in Medicaid and estimates vary widely, we used the average of OACT and Congressional Budget Office (CBO) predictions of future growth in Medicaid enrollment and spending per enrollee by eligibility group. We applied the same growth rates to all states. We calculated the federal/state split in spending by enrollment group for each year based on the relevant FMAP for the eligibility group and year. For non-expansion groups, we used the most recent FMAPs available (FY2018) for all years; for expansion groups, we used the FMAPs for each year as specified under current law, though we did not account for differential match rates for Group VIII enrollees who are not newly eligible and may qualify for a different match rate. Since these projections use national data and uniform growth rates, individual state estimates may have more detailed data.
Baseline Marketplace Spending. We estimated state-level federal spending for advanced premium tax credits (APTCs) for individual coverage through the marketplace based on data reflecting February 2017 effectuated enrollment and average APTCs publicly-available from CMS. Cost-sharing reduction (CSR) payments are based on data by county from CMS for healthcare.gov states, trended forward to 2017. For state-based exchanges, we assumed for each state that CSR payments represent the same percentage of average APTCs as that for healthcare.gov states. We included federal payments for Basic Health Programs for 2017 based on federal spending estimates from CBO, apportioned by state based on enrollment data from CMS. We then projected future total spending for APTCs, CSRs, and BHP based on growth rates from CBO projections of future spending for the sum of these provisions, using the latest CBO report of federal subsidies for health insurance coverage. We assumed that marketplace APTCs and CSRs for Alaska do not grow from 2017 to 2018, since that state is implementing a reinsurance program under an ACA waiver. Premiums are expected to drop in Alaska, lowering APTC amounts, but the federal government is also providing pass-through payments to the state under the waiver. Based on data included in the federal government’s approval letter for the waiver, we assume those amounts are offsetting.
Federal Spending Under Proposed Bill.
Market Based Block Grant Program: We used our estimates of 2017 federal spending for marketplace payments and ACA Medicaid expansion payments. For marketplace payments, we inflated 2017 to 2019 based on CBO projections of CPI-M; for Medicaid payments, we inflated 2017 to 2019 based on CPI-M as the inflations factor specified in the bill were not clear. We used the sum of federal marketplace and Medicaid expansion payments for 2019 to estimate state block grant allocations within the total federal allocation starting in 2020 as specified in the bill: 2020 allocations are based on actual state amounts, prorated up to the US total; 2026 allocations are based on the US total distributed across states according to the state’s share of legal resident population with income between 50% and 138% of poverty; and 2021-2025 are allocated by the difference between the state’s 2020 and 2026 allocations divided by six. Because 2020 actual spending was below the total US allocation, we shifted the $10 billion reserve fund to spending in 2026 as specified in the bill. While it would not affect the block grant allocations, the bill includes another provision that would eliminate Medicaid DSH reductions for 2021-2025 and provide for a one-time DSH increase in 2026 for states that experience “grant shortfalls.” We do not estimate the potential offset of the DSH policy due to limited data on future DSH allocations and cuts across states.
Medicaid Per Enrollee Cap: Our estimates of spending under the proposal to use a per enrollee cap first inflate FY2016 per enrollee spending to FY2019 based on CPI-M as specified in the bill. For FY2020 and on, we apply limits in growth in per enrollee spending as specified in the bill: from FY2020-2024, per enrollee growth is limited to CPI-M for adults and children and CPI-M+1 for aged and disabled; from FY2025 on, per enrollee growth is limited to CPI-U for adults and children and CPI-M for the aged and disabled. We use estimates of CPI-M and CPI-U from the CBO.2 ,3 We calculate the federal/state split in spending based on the most recent FMAPs available (FY2018) for all years. We assume no changes in Medicaid enrollment other than those explicitly modeled and calculate the difference in federal spending compared to the baseline. We exempt Alaska and Montana from the per enrollee cap because these states meet the rules for exemption (based on their block grant allotments) specified in the bill.
- Certain states with low population density are not subject to the per enrollee cap in a given year at Secretary discretion or if their allotment under the new block grant program is below the 2020 allotment increased by CPI-M. We anticipate that this provision will affect at least Alaska and Montana. ↩︎
- Congressional Budget Office. The Budget and Economic Outlook: 2017 to 2027; January 24, 2017. ↩︎
- Congressional Budget Office. Cost Estimate: H.R. 1628, Better Care Reconciliation Act of 2017; June 26, 2017. ↩︎