Understanding Mergers Between Hospitals and Health Systems in Different Markets

Published: Aug 23, 2023

A growing body of evidence shows that consolidation in health care provider markets has led to increases in prices without clear evidence of increases in quality. Policymakers and regulators have historically focused on consolidation within the same geographic area, but there have been a large number of mergers and acquisitions (referred to as “mergers” in this brief) between hospitals and health systems that operate in different regions (referred to as “cross-market mergers” in this brief), including several multi-billion dollar deals over just the past couple of years. Some experts have raised concerns that cross-market mergers could result in hospitals and health systems raising their prices. It is also possible that cross-market mergers could result in the elimination of service lines by some acquired hospitals, which may reduce access to care.

This issue brief explains the role and implications of cross-market mergers in hospital and health system markets and describes the approaches that government antitrust agencies have taken in reviewing these types of transactions.

What Is a Cross-Market Merger?

A “cross-market merger” entails a merger between two health care providers that operate in different geographic markets for patient care.1 , 2  For instance, this term could apply to the following scenarios:

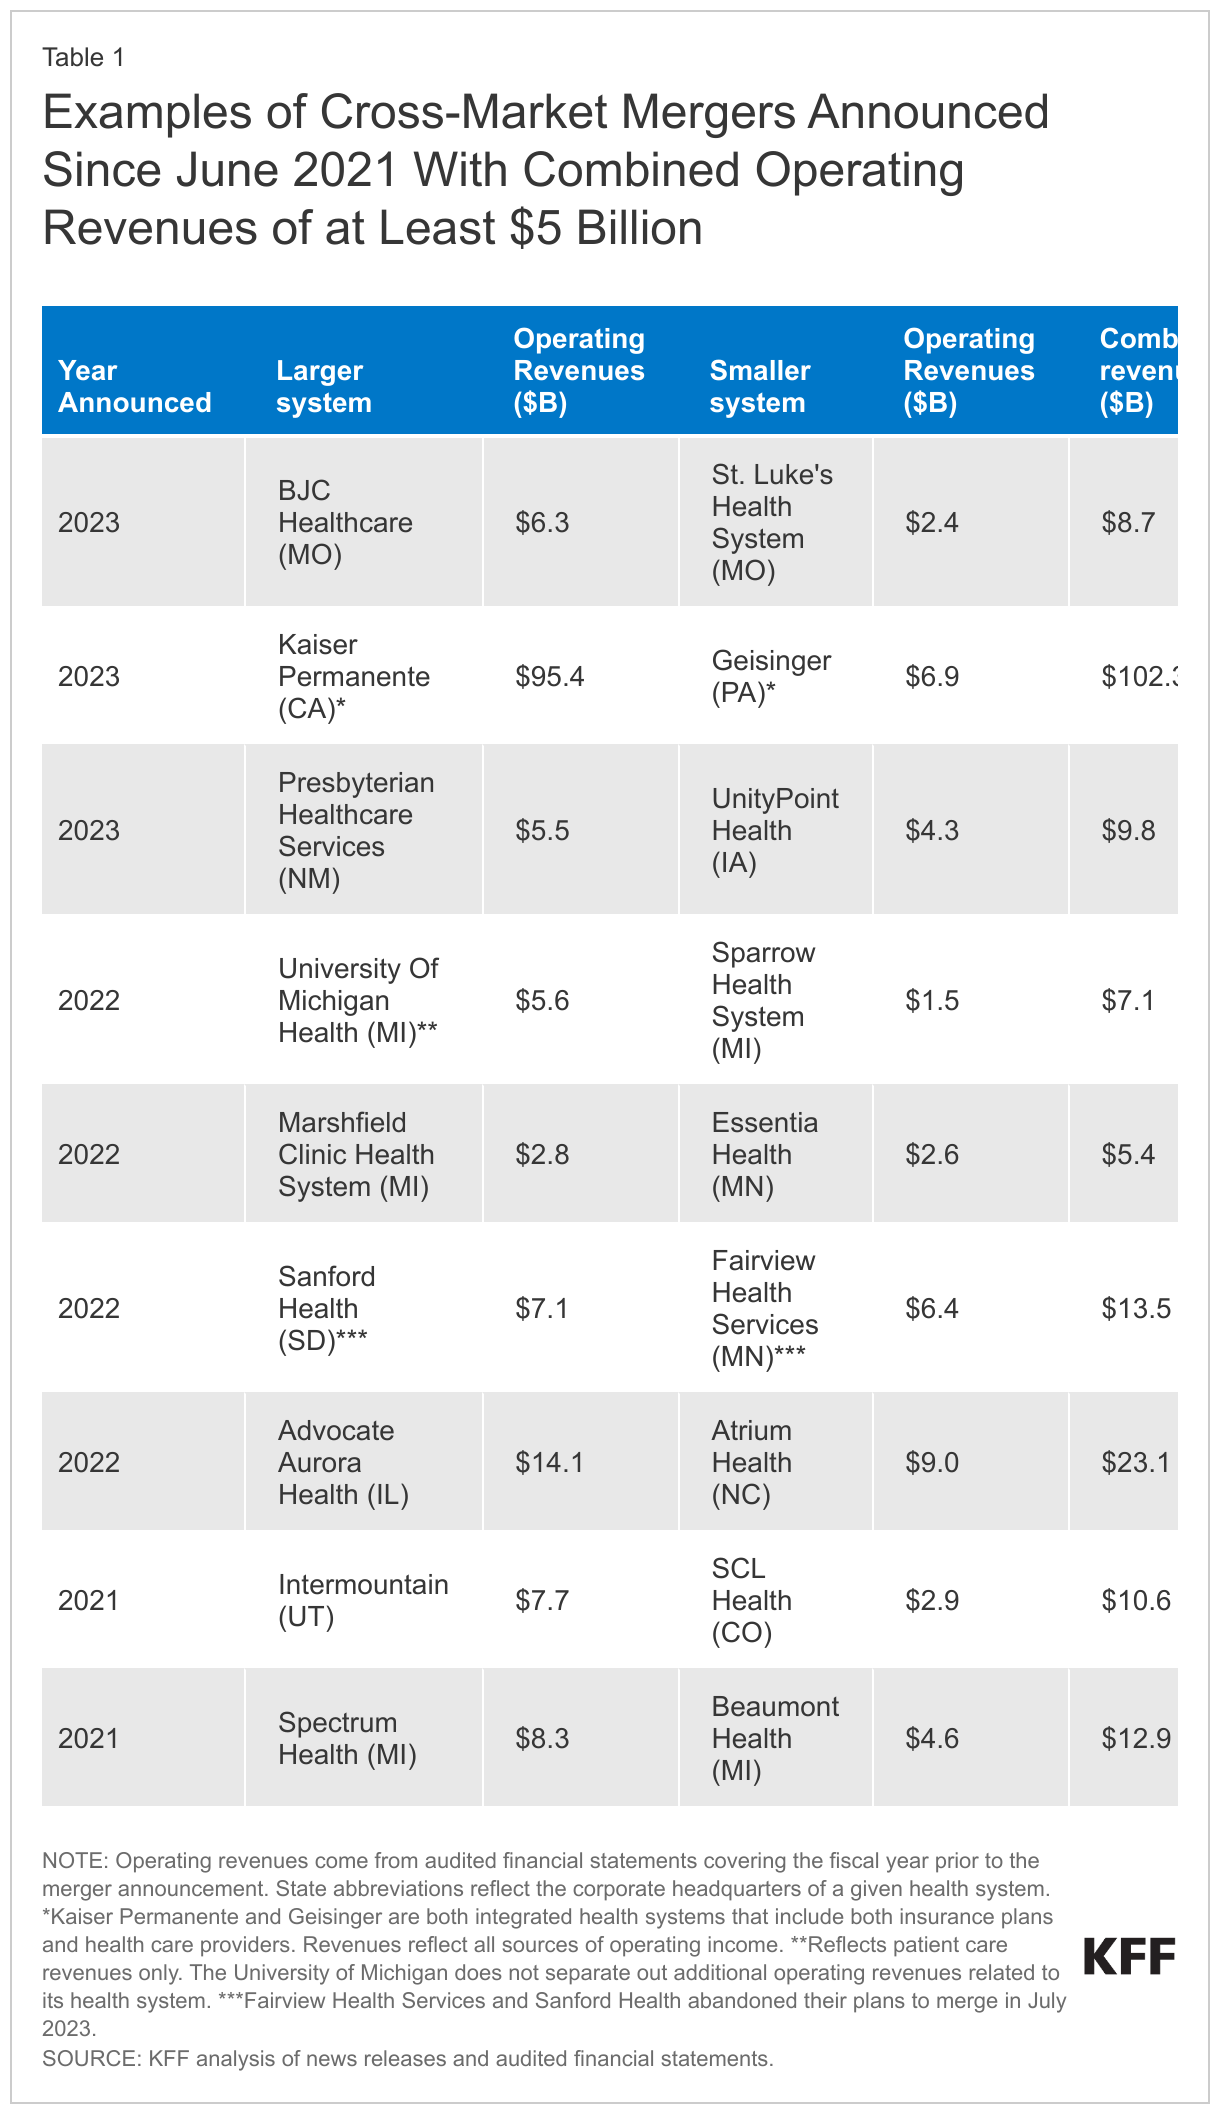
  • Two health systems that operate in different geographic markets merge. For example, in April 2023, Kaiser Permanente and Geisinger announced their plans to merge. These systems operate in different regions of the United States, with Kaiser Permanente operating in five states in the West (including California) and Georgia, Maryland, Virginia, and DC and Geisinger operating in Pennsylvania. In 2022, Kaiser Permanente and Geisinger earned $95 billion and $7 billion in operating revenues, respectively.3 
  • A health system acquires an independent hospital in a geographic market where it does not operate. One example is Christus Health’s acquisition of Gerald Champion Regional Medical Center in July 2023. Christus Health is a large health system based in Texas that includes 28 hospitals, while Gerald Champion Regional Medical Center is an independent hospital in Alamogordo, New Mexico that is over 200 miles away from the nearest Christus Health facility.

Cross-market mergers can involve hospitals and health systems that are in neighboring markets as well as entities that are hundreds or even thousands of miles apart. An example of the former is the recent merger between University of Michigan Health—which is based in Ann Arbor, Michigan—and Sparrow Health System, which is based about 65 miles away in Lansing, Michigan. An example of the latter is the recently proposed merger of UnityPoint Health—which operates in the Midwest (Iowa, Illinois, and Wisconsin)—and Presbyterian Healthcare Services, which operates in New Mexico.

How Common Are Cross-Market Mergers?

Hospital and health system mergers are common, and many of these mergers involve providers in different geographic markets. For example, according to one study, about 1,500 hospitals were targeted as part of a completed merger or acquisition from 2010 through 2019 and most of these deals (55%) involved hospitals or health systems in different commuting zones. According to another study, about one in eight rural hospitals merged with an out-of-market hospital or health system from 2010 through 2018. A series of large, cross-market mergers in recent years have drawn further attention to this topic. Table 1 below provides examples of nine large, cross-market merger deals announced since June 2021, each of which entailed health systems with combined annual operating revenues of at least five billion dollars.

Examples of Cross-Market Mergers Announced Since June 2021 With Combined Operating Revenues of at Least $5 Billion

Cross-market mergers may be appealing to health systems that are seeking to expand for at least a couple of reasons. First, cross-market mergers have received little resistance from government antitrust agencies relative to mergers between health care providers that operate in the same market.4  Second, many health care markets are already highly concentrated, leaving fewer opportunities for health systems to expand within a given region.

What Are the Potential Implications of Cross-Market Mergers?

Cross-market mergers may benefit patients in some instances when hospitals and health systems are able to operate more efficiently as a combined entity. Even if hospitals and health systems are located in different markets, they may be able to share knowledge and best practices with each other, such as by collaborating to develop better clinical practice guidelines and sharing effective strategies and tools for managing patients’ care. Operating at a larger scale may also facilitate providers’ participation in complicated, value-based payment programs, which some health plans offer in an effort to reduce costs and improve the quality of care. Hospitals and health systems merging within and across markets can also potentially achieve efficiencies by purchasing goods and supplies in greater volume.

In some scenarios, small and struggling hospitals may seek to merge with large health systems in order to improve their finances or offer higher-quality services. For example, a large health system with deep pockets could provide a smaller hospital with resources to purchase new equipment and invest in quality improvements or provide a financial backstop and access to capital that may enable a struggling rural hospital to keep its doors open. A large, financially successful system could also share management strategies with hospitals that are losing money to help them operate more efficiently.

However, cross-market mergers may lead to higher prices. In fact, researchers have estimated that these types of deals have led to price increases ranging from 6 to 17 percent, though only a small number of studies have focused on cross-market mergers.

There are at least a few reasons why cross-market mergers could lead to price increases, even though they entail hospitals and health systems that are not competing against each other in the same area. First, a combined health system with providers in, say, different areas of a state may be able to use its dominant position in one market to negotiate higher prices in another when contracting with a given health plan (e.g., a state employee plan with enrollees that reside in several markets). Second, a combined health system may compete with other health systems that also operate across the same markets. In that case, the combined health system may be hesitant to offer lower prices in one market out of concern that their competitor will retaliate by lowering prices and undercutting them in other markets. Finally, a large system that, say, acquires a small hospital may have more expertise in bargaining with insurers, which it could use to negotiate for higher prices.

Another concern that has been raised about certain types of mergers, which could also apply to some cross-market mergers, is that they may reduce access to care. For instance, a large health system that acquires a small rural hospital may be less responsive to community needs and more willing to eliminate service lines, such as obstetric care. Relatedly, a hospital may also reduce spending on community benefits after being acquired by a health system.

How Do Government Antitrust Agencies Approach Cross-Market Mergers?

Federal and state antitrust agencies seek to promote competitive markets—often to benefit consumers—by scrutinizing mergers and other potentially anticompetitive practices. Antitrust agencies have historically focused on mergers between hospitals and health systems that operate in the same geographic market, though there are signs that they have begun to take a closer look at cross-market mergers. While federal antitrust agencies have yet to formally challenge a cross-market merger, the Federal Trade Commission (FTC) has identified these types of deals as an area of interest and has investigated at least two specific cross-market mergers (between Advocate Aurora Health and Atrium Health and between Spectrum Health and Beaumont Health).5 

At the state level, the state attorney general in California has used its legal authority to impose conditions on mergers that have been identified as cross-market deals. These conditions have included, for example, placing restrictions on price increases and requiring that the merged entities maintain certain services, such as by having a minimum number of emergency room, intensive care, and obstetrics beds. In Minnesota, the state attorney general had begun to investigate whether to challenge a proposed merger between Fairview Health Services (based in Minnesota) and Sanford Health (based in South Dakota) before the two systems abandoned their plans in July 2023.

Cross-market mergers have never been fully-litigated by a federal or state antitrust agency, and doing so in the short term may be difficult. First, only a handful of analyses have focused on cross-market mergers, limiting the ability of regulators to cite potential consequences based on empirical evidence. Second, antitrust agencies have not yet released detailed guidelines for evaluating cross-market mergers,6  nor have they tested legal strategies for challenging cross-market mergers in the courts. In contrast, when antitrust agencies challenge within-market mergers, they can rely on years of legal precedent as well as economic frameworks recognized by the courts. Finally, antitrust litigation can be complex and expensive. Without adequate funding, it may be impractical to challenge a large number of health care provider business practices that raise anticompetitive concerns, including cross-market mergers. Given these challenges, it is conceivable that cross-market mergers will continue unabated in the near future.

Discussion

Hospital and health system mergers are common, and these mergers often involve providers in different geographic markets. Cross-market mergers may have benefits in some scenarios, for example, if the providers involved share effective clinical strategies for improving patient care. However, a handful of studies indicate that cross-market mergers can lead to increases in health care prices. It is also possible that some hospitals may become less responsive to community needs after a cross-market merger. Antitrust agencies have begun to take a closer look at mergers of hospitals and health systems across different geographic regions, which may have a bearing on affordability and access to care in many regions across the country, but they have yet to fully-litigate a cross-market merger.

Some policy and regulatory options have been floated that could address some of the concerns about cross-market mergers. For example, government regulators could use their existing authority to scrutinize cross-market mergers, which antitrust agencies have begun to do. States could enact laws to give government agencies authority to require some or all types of providers to obtain prior approval from the government before merging. California has done so, and attorneys general in the state have used this authority to impose conditions on cross-market mergers to limit price hikes and require that merging entities maintain certain services. In addition, regulators could prohibit certain types of clauses in contracts between providers and insurers that may allow merged entities to leverage market power to negotiate for higher prices in one market based on their strong position in another.7 

Each of these policy and regulatory options would involve tradeoffs. For example, determining whether to challenge a given cross-market merger could entail weighing the potential benefits of a merger, such as allowing a small hospital to keep its doors open, against the potential for some harm, such as higher health care prices and potentially less access to care for patients in a given market. As the number of cross-market mergers increases, these concerns and tradeoffs are likely to be on the radar of policymakers and regulators.

This work was supported in part by Arnold Ventures. KFF maintains full editorial control over all of its policy analysis, polling, and journalism activities.

  1. This brief defines cross-market mergers based on providers being in separate geographic markets. We distinguish this from vertical mergers, which occur when there is consolidation between providers that offer different services along the same supply chain, such when a hospital acquires a physician practice. ↩︎
  2. Regulators and researchers have long grappled with how to define the boundaries of geographic markets for health care services. As a result, a merger that is considered to cross markets by some may be identified as occurring within a single market by others. ↩︎
  3. Kaiser Permanente and Geisinger are both integrated health systems that include both insurance plans and health care providers. Revenues reflect all sources of operating income. ↩︎
  4. For example, in 2015, the Federal Trade Commission (FTC) initiated a legal challenge against a planned merger between two Illinois health systems—Advocate Health and Northshore University HealthSystem—arguing that the combined entity would control over half of the market for general acute care inpatient services in the North Shore area of Chicago.  The two systems eventually abandoned their plans to merge. However, Advocate Health was later involved in two cross-market mergers—first with Aurora Health (based in the neighboring state of Wisconsin) to form Advocate Aurora Health and then with Atrium Health (based in North Carolina, South Carolina, Georgia, and Alabama) to form Advocate Health. The Federal Trade Commission investigated the latter merger, but the government did not seek to challenge either merger in the courts. ↩︎
  5. The Department of Justice (DOJ) and FTC have taken additional steps that indicate that they are taking a closer at cross-market mergers. For example: (1) in September 2021, the FTC announced that they would be considering cross-market effects in their reviews of large merger deals, (2) in February 2023 and July 2023, respectively, the two agencies withdrew from their health care policy statements which, among other things, may have created a safety zone for large health systems to acquire small hospitals in other markets, and (3) in July 2023, the two agencies released a draft version of their updated guidelines for reviewing mergers that included language which might be used to challenge cross-market mergers (though this is not yet clear). ↩︎
  6. In July 2023, the FTC and DOJ released a draft version of their updated guidelines for reviewing mergers that included language which might be used to challenge cross-market mergers (though this is not yet clear). ↩︎
  7. This would entail banning “all-or-nothing clauses,” which require an insurer that wants to contract with a particular provider in a system to contract with all providers in that system. ↩︎
Poll Finding

KFF Health Misinformation Tracking Poll Pilot

Published: Aug 22, 2023

Findings

On Sept. 15, KFF released three follow-up reports examining the exposure to, and belief in, health misinformation among key groups, as well as their trust in different sources of health misinformation:

Introduction

While health misinformation and disinformation long preceded the pandemic, the pervasiveness of false and inaccurate information about COVID-19 and vaccines brought into further focus the extent to which misinformation can distort public health policy debates and impact the health choices individuals make. KFF COVID-19 Vaccine Monitor surveys in 2021 and 2022 found that large shares of the public believed or were uncertain about false claims related to COVID vaccines and treatments, including myths about the vaccines’ effects on pregnancy and fertility. These surveys also highlighted the roles of traditional and social media as vehicles for spreading and/or combatting misinformation, showing a strong relationship between individuals’ trusted news sources and their propensity to believe false claims about COVID-19.

KFF has focused on providing reliable, accurate, and non-partisan information to help inform health policy in the United States. Yet, in a time where health-related misinformation is so easily accessible and disseminated, understanding the dynamics of misinformation is important to help ensure a robust and fact-based health policy environment. With this understanding, KFF is designing a new program that will identify and track the rise and prevalence of health-related misinformation in the United States, with a special focus on communities that are most adversely affected by health misinformation.

KFF is releasing our Health Misinformation Tracking Poll Pilot as part of this effort, examining the public’s media use and trust in sources of health information and measuring the reach of specific false and inaccurate claims surrounding three health-related topics: COVID-19 and vaccines, reproductive health, and gun violence. Accompanying this overview report of the pilot poll, KFF also released snapshot reports to the field, examining the implications for understanding and combatting misinformation among Black adults, Hispanic adults, and rural residents. Future surveys will explore other health topics for which misinformation has been found to be circulating.

The Misinformation Tracking Poll will work in tandem with our forthcoming Health Misinformation Monitor, a detailed report of the landscape of current health misinformation messages circulating among the public, sent directly to professionals working to combat misinformation. The Misinformation Monitor will be an integral part of KFF’s efforts to deeper analyze the dynamics of misinformation and inform a robust, fact-based health information environment, and will inform the topics we will ask about on future Health Misinformation Tracking Polls.

Key Takeaways for the Field

Health misinformation is widespread, yet the KFF Health Misinformation Tracking Poll Pilot presents a more nuanced perspective on what information people believe. Beliefs influenced by misinformation are not universally entrenched, and a significant portion of the public falls in the middle, susceptible to false claims, but not already bought in. These individuals hold tentative beliefs that lean towards or against misinformation, providing an opportunity to foster a more fact-based public understanding of health issues and informed dialogue.

While it is true that most adults have heard or read many of the false and inaccurate health claims asked about in the survey, relatively small shares of the public have both heard and believe misinformation about central health topics such as COVID-19 and vaccines, reproductive health, and firearm violence and safety. Moreover, while there are some adults who, when presented with false and inaccurate health misinformation, say they believe them to be definitely true, this is a relatively small share of the public. Most adults are uncertain about various items of health misinformation and fall in a potentially “malleable middle” who say the claims are “probably” true or “probably” false. While exposure to misinformation may not necessarily convert the public into ardently believing false health claims, it is likely adding to confusion and uncertainty about already complicated public health topics and may lead to decision paralysis when it comes to individual health care behaviors and choices. In any case, this “malleable middle” presents an opportunity for tailored interventions.

Furthermore, reinforcing accurate information may need to go hand-in-hand with combatting false health claims. When adults in the survey were asked to provide an example of COVID-19 misinformation they have read or heard, some individuals presented true claims as examples of misinformation. While the focus of some anti-misinformation efforts is on combating false claims that circulate widely, the survey reveals that there is a parallel challenge of true claims not being believed. This finding suggests allocating sufficient attention to addressing the skepticism and disbelief surrounding accurate information.

Some groups seem to be more susceptible to misinformation than others, with larger shares of Black and Hispanic adults, those with lower levels of educational attainment, and those who identify politically as Republicans or lean that way saying many of the misinformation items examined in the poll are “probably true” or “definitely true.” News sources also matter as those who say they regularly consume news from One America News Network (OANN), Newsmax, and to a smaller extent Fox News, are consistently more likely to believe most of the misinformation items asked about in the survey.

Media and other messengers can undoubtedly play a key role in efforts to address and to counter health misinformation. Local TV news and network news are among the most used news sources and also among the most likely to be trusted when it comes to health information. While many adults report frequently using social media, few say they would trust health information they may see on these platforms. Despite this, adults who frequently use social media to find health information and advice are more likely to believe that certain false statements about COVID-19 and reproductive health are definitely or probably true.

In an age of declining trust in institutions, some sources are more trusted than others and may have an important role to play in addressing misinformation. As the most trusted source of health information for the public, individual doctors may have an essential role to play in helping dispel false health claims. Additionally, while few media sources are widely trusted by the public as a source of health information, local news stations and network TV news stand out for their widespread use as a source of news and their relatively high level of trust among the public.

The following are the specific health-related claims that have been shown to be false, which were asked about in this KFF Health Misinformation Tracking Poll pilot survey. See the Appendix for more information the sources used to document each claim:

False claims about COVID-19 and vaccines:

“The COVID-19 vaccines have caused thousands of deaths in otherwise healthy people.”

“Ivermectin is an effective treatment for COVID-19.”

“The COVID-19 vaccines have been proven to cause infertility.”

“More people have died from the COVID-19 vaccines than have died from the COVID-19 virus.”

“The measles, mumps, rubella vaccines, also known as MMR, have been proven to cause autism in children.”

False claims about reproductive health:

“Using birth control like the pill or IUDs makes it harder for most women to get pregnant after they stop using them.”

“Sex education that includes information about contraception and birth control increases the likelihood that teens will be sexually active.”

False claims about gun violence:

“People who have firearms at home are less likely to be killed by a gun than people who do not have a firearm.”

“Most gun homicides in the United States are gang related.”

“Armed school police guards have been proven to prevent school shootings.”

False claim about the Affordable Care Act:

In addition to the false claims above, the survey also asked about the longstanding false claim that the Affordable Care Act established government “death panels” for people of Medicare in the question below:

“To the best of your knowledge, did the Affordable Care Act establish a government panel to make decisions about end-of-life care for people on Medicare?”


Exposure to and Belief in Health Misinformation Claims

Overall, health misinformation is widely prevalent in the U.S. with 96% of adults saying they have heard at least one of the ten items of health-related misinformation asked about in the survey. The most widespread misinformation items included in the survey were related to COVID-19 and vaccines, including that the COVID-19 vaccines have caused thousands of deaths in otherwise healthy people (65% say they have heard or read this) and that the MMR vaccines have been proven to cause autism in children (65%).

Regardless of whether they have heard or read specific items of misinformation, the survey also asked people whether they think each claim is definitely true, probably true, probably false, or definitely false. For most of the misinformation items included in the survey, between one-fifth and one-third of the public say they are “definitely” or “probably true.” While the most frequently heard claims are related to COVID-19 and vaccines, the most frequently believed claims were related to guns, including that armed school police guards have been proven to prevent school shootings (60% say this is probably or definitely true), that most gun homicides in the U.S. are gang-related (43%), and that people who have firearms at home are less likely to be killed by a gun than those who do not (42%).

Combining these measures, the share of the public who both have heard each false claim and believe it is probably or definitely true ranges from 14% (for the claim that “more people have died from the COVID-19 vaccine than from the virus”) to 35% (“armed school police guards have been proven to prevent school shootings”).

Measures of Health Misinformation

This report examines three measures of health misinformation among the public. Adults were asked whether they had heard or read specific false health-related statements. Regardless of whether they have heard or read specific items of misinformation, all were asked whether they thought each claim was definitely true, probably true, probably false, or definitely false. We then combined these two measures in order to examine the share who have heard the false claims and believe it is definitely or probably true.

 Venn Diagram - Measures of Health Misinformation
Large Shares of U.S. Adults Have Heard Items Of Health Misinformation, Though Fewer Say They Are True

Uncertainty is high when it comes to health misinformation. While fewer than one in five adults say each of the misinformation claims examined in the survey are “definitely true,” larger shares are open to believing them, saying they are “probably true.” Many lean towards the correct answer but also express uncertainty, saying each claim is “probably false.” Fewer tend to be certain that each claim is false, with the exception of the claim that more people have died from the COVID-19 vaccines than from the virus itself, which nearly half the public (47%) recognizes as definitely false.

Most Adults Are Uncertain Whether Health Misinformation Items Are Definitely True Or Definitely False

The range of people’s responses when presented with false claims – ranging from definitely true to definitely false – suggests different potential approaches for directing interventions among different groups. Those who say false health claims are “probably false” may benefit from having accurate information reinforced to them by trusted messengers such as their doctor or family and friends in the medical or health fields. However, those who say health-related misinformation items are “probably true” may require a different approach. While adults in each level of belief and disbelief of health misinformation present a unique opportunity for different tactics of interventions and outreach, the remainder of this report focuses on the group who say the false claims examined were “definitely true” or “probably true,” as this group represents adults who have bought in or are at the greatest risk of buying into the health misinformation items asked about in this survey.1 

COVID-19 and Vaccine Misinformation

Across the five COVID-19 and vaccine related misinformation items, adults without a college degree are more likely than college graduates to say these claims are definitely or probably true. Notably, Black adults are at least ten percentage points more likely than White adults to believe some items of vaccine misinformation, including that the COVID-19 vaccines have caused thousands of sudden deaths in otherwise healthy people, and that the MMR vaccines have been proven to cause autism in children. Black (29%) and Hispanic (24%) adults are both more likely than White adults (17%) to say that the false claim that “more people have died from the COVID-19 vaccine than have died from the COVID-19 virus” is definitely or probably true. Those who identify as Republicans or lean towards the Republican Party and pure independents stand out as being more likely than Democratic leaning adults to say each of these items is probably or definitely true. Across community types, rural residents are more likely than their urban and suburban counterparts to say that some false claims related to COVID vaccines are probably or definitely true, including that the vaccines have been proven to cause infertility and that more people have died from the vaccine than from the virus.

Adults Without A College Degree, Republicans, And Independents Are More Likely To Say COVID-19 And Vaccine Misinformation Is Definitely Or Probably True

Educational attainment appears to play a particularly important role when it comes to susceptibility to COVID-19 and vaccine misinformation. Six in ten adults with college degrees say none of the five false COVID-19 and vaccine claims are probably or definitely true, compared to less than four in ten adults without a degree. Concerningly, about one in five rural residents (19%), adults with a high school education or less (18%), Black adults (18%), Republicans (20%), and independents (18%) say four or five of the false COVID-19 and vaccine misinformation items included in the survey are probably or definitely true.

Those With A College Degree And Democrats Are Less Likely To Say COVID-19 And Vaccine Misinformation Items Are True

Reproductive Health Misinformation

The KFF Health Misinformation Tracking Poll asked about two misinformation items related to reproductive health and these two false claims appear to have different audiences. When asked about birth control leading to issues getting pregnant after cessation, younger adults – particularly younger women – are more likely to have heard this and to say this is probably or definitely true. However, when asked about sex education among teens leading to more sexual activity, older adults are more likely to say it is definitely or probably true. For both of these false reproductive health claims, adults without a college education, Republicans, and pure independents are more likely than their counterparts to say the claims are probably or definitely true. Black and Hispanic adults – groups who experience disparities in both health outcomes and in access to care – are more likely than White adults to say both of these false reproductive health claims are definitely or probably true.

Larger Shares Of Younger Adults Say Claim That Birth Control Makes It Harder For Most Women To Get Pregnant After Ceasing Use Is Probably Or Definitely True

When it comes to misinformation on gun-related violence, educational attainment again appears related to susceptibility to misinformation as those without a college degree are more likely than college graduates to say the firearm misinformation items are probably or definitely true. Notably, White (63%) and Hispanic (57%) adults are more likely than Black adults (48%) to say the claim that armed school police have been proven to prevent school shootings is definitely or probably true. Gun-related misinformation appears to be heavily politically charged, with Republicans and independents more likely than Democrats to say each of the claims regarding gun-related violence are probably or definitely true. Nearly three in four rural residents (73%) say that the claim that armed school police have been proven to prevent school shootings is definitely or probably true compared to fewer urban (56%) and suburban (58%) residents.

Gun owners are no more likely to have heard each of these items compared to those who do not own a gun, yet they are more likely to say each is definitely or probably true.

Adults Without A College Degree Are More Likely Than College Graduates To Say Firearm Misinformation Items Are True

Affordable Care Act Misinformation

Some misinformation claims can have longevity and lead to longstanding public confusion and uncertainty. The KFF Health Misinformation Tracking Poll also asked about the false claim that the Affordable Care Act (ACA) established a government panel to make decisions on end-of-life care for people on Medicare. This is a long-standing myth about the ACA and previous KFF research has found that most adults could not accurately identify that the law did not set up such a panel. In the latest survey, seven in ten adults say they are not sure whether the ACA established a government panel to make end-of-life decisions for people on Medicare, and a further 8% incorrectly answer that the law did establish these panels. Just one in four adults (23%) – including three in ten Democrats – know that the ACA did not establish these so-called “death panels.” Notably, adults ages 65 and older (most of whom have Medicare coverage) are more likely than adults under the age of 30 to correctly answer that the ACA did not establish government panels for end-of-life decisions for those on Medicare.

Most Adults Remain Unsure Whether The False Claim That The ACA Established End-Of-Life Decision Panels For Medicare Recipients Is True Or False

Views of Health Misinformation and Responsibility for Combatting It

Large majorities of U.S. adults say that the spread of false and inaccurate information generally (86%) and the spread of false and inaccurate information related to health issues (74%) are major problems. This includes large shares across age, gender, education, and partisanship.

Three-Fourths Of Adults Say The Spread Of False Information About Health Issues Is A Major Problem

While a large majority of the public believes that false and inaccurate health information is a major problem, the COVID-19 pandemic underscored the complex nature of what the public sees as health misinformation in the United States. The current polarized political and media climate can lead to very different views of what constitutes misinformation.

The KFF Health Misinformation Tracking Poll asked adults to provide an example of COVID-19 misinformation that they have read or heard, and many examples were in direct contradiction with one another. For example, many cited things they had heard about facemasks that they perceive to be untrue. However, while some cited claims of masks not helping to curb the spread of the virus as misinformation, others cited claims that masking did help prevent the spread as a misinformation item. Similarly, adults provide contradictory claims about the COVID-19 vaccines’ safety and efficacy as examples of misinformation they have read or heard.

In Their Own Words: Can you provide an example of misinformation related to COVID-19 that you read or heard about in the media or elsewhere?

“That wearing a mask would not help prevent the spread” – 35 year-old Hispanic woman in Mississippi

“That masks stop the spread” – 52 year-old White woman in Ohio

“That masks don’t need to be worn” – 72 year-old White woman in Arizona

“The use of masks reduces chances of getting COVID-19” – 26 year-old Hispanic man in Texas

“Taking the COVID shot will protect you that was all a LIE.” – 54 year-old Hispanic man in Florida

“The vaccines were ok to use” – 27 year-old Black woman in Texas

“Vaccines not being effective” – 62 year-old White woman in Massachusetts

“Vaccines do not work or are dangerous” – 75 year-old White woman in New Jersey

This lack of consensus on what constitutes health misinformation adds to the difficulty of curbing the spread of false and inaccurate health and medical claims. Nonetheless, the public sees a role for government, media, and social media companies to tackle this issue. At least two-thirds of adults say that Congress, President Biden, the U.S. news media, and social media companies are not doing enough to limit the spread of false and inaccurate health information. Despite often divided views on the role of government and media, majorities of adults across age, gender, education, and partisanship say each of these entities is not doing enough.

Most Adults Think Congress, The News Media, Social Media Companies, And President Biden Are Not Doing Enough To Limit Health Misinformation

Trusted Sources of Information and News

With large shares of the public unable to identify many health-related misinformation items as definitely false, trusted messengers and sources have an important role to play in efforts to combat the proliferation of health misinformation. Not surprisingly, individual doctors are the most trusted source, with 93% of the public saying they have a great deal or a fair amount of trust in their own doctor to make the right recommendations on health issues.

When it comes to government agencies, most adults have at least a fair amount of trust in the FDA and CDC to make the right recommendations on health issues, though just one in four have a great deal of trust in the CDC and one in five have a great deal of trust in the FDA. Fewer say they trust the Biden Administration on health issues, and Republicans are less likely than Democrats to trust the Administration, as well as the CDC and the FDA.

Most Adults Have At Least A Fair Amount Of Trust In The CDC, FDA, To Make Right Recommendations, Though There Are Notable Partisan Differences

Traditional News Media Use and Trust

The proliferation of media sources has led to many adults having a varied media diet. Local TV news, national network news, and digital and online news aggregators are the top news sources for U.S. adults, with over half saying they regularly read, watch, or listen to each.

There are variations in consumption of traditional news sources. Adults under age 30 are less likely than older adults to say they regularly watch local news but are more likely to use digital or online news aggregators that summarize various traditional and nontraditional news sources, such as Apple or Yahoo News. More than seven in ten Black (77%) and Hispanic (71%) adults say they regularly watch their local TV news station compared to 59% of White adults. Similarly, White adults (52%) are less likely to watch national network news regularly compared to Black (74%) and Hispanic (65%) adults. A majority of Republicans (57%) say they regularly watch Fox News to say up-to-date on current events, whereas a majority of Democrats (55%) say they watch CNN. Yet notably, more than six in ten Democrats and Republicans say they also regularly watch their local TV news channel, underscoring the wide reach of local news.

Local News, Network News and Digital Aggregators Among The Most Used By Adults To Stay Up-To-Date With The News

Regardless of whether they are regular viewers, the survey measured how much individuals would trust information about health issues that was reported by each of these sources. At least seven in ten U.S. adults say they would have at least “a little” trust in health information reported by their local TV news station, national network news, or their local newspaper. However, fewer than three in ten adults say they would have a lot of trust in health information reported by each of the media sources asked about in the survey.

Local And Network News Among The Most Trusted For Health Information

The picture of trust in health information from various news sources looks somewhat different when looking only at those who are regular users of each source. Not surprisingly, regular users are much more likely than those who do not use each news source to say they would have a lot of trust in health information reported by that source. However, there is variation among news sources in how much their regular users trust the information they report. For example, majorities of regular users of NPR (59%) and the New York Times (52%) say they would trust health information reported on these platforms “a lot,” while a third of regular MSNBC viewers (34%) and Fox News viewers (36%) say they would place a lot of trust in health information reported there. For most other sources, the share of regular users who say they would have a lot of trust in health information they report ranges from three to four in ten.

For Most Media Sources, At Least A Third Of Their Users Would Have A Lot Of Trust In Health Information They May Report

Social Media Use and Trust

Most adults (55%) say they use social media at least once a week to keep up-to-date on news and current events, including a third (33%) who say they use it every day. About one in four (24%) say they use social media at least weekly to find health information and advice, though four in ten say they “never” do this. Larger shares of Hispanic and Black adults compared to White adults, and younger adults compared to older adults, say they regularly use social media for both news and health information. Hispanic adults are particularly likely to say they regularly use social media, with seven in ten (70%) saying they use it weekly for news and current events and half (49%) saying they use it weekly for health information and advice. While similar shares across education and income groups say they use social media for news, larger shares of those without college degrees and those living in lower-income households report using social media to find health information and advice compared to those with college degrees and higher incomes.

About Half Of Hispanic Adults Say They Use Social Media For Health Information Advice Weekly

The most commonly used social media platforms included in the survey are YouTube and Facebook, with more than six in ten saying they use each of these platforms at least weekly. Regardless of whether they use the platforms, about half say they would have at least a little trust in information about health issues if they saw it on YouTube and four in ten say the same about Facebook. However, fewer than one in ten say they would have a lot of trust in health information seen on any of the platforms included in the survey.

While About Two-Thirds Of Adults Use YouTube And Facebook Weekly, Few Would Have A Lot Of Trust In Health Information If They Saw It On Those Platforms

Even among the those who frequently use specific social media sites, very few say they would have a lot of trust in health information if they saw it on these platforms. One in six Reddit weekly users say they would have a lot of trust in health information if they saw it on that platform, with similar shares of weekly TikTok, YouTube, and Twitter users expressing a lot of trust in health information they may see on those platforms.

Few Social Media Users Say They Would Trust Information About Health Issues A Lot If They Saw It On Platforms They Use Weekly

Information Sources and Exposure and Belief in Health Misinformation

Similar to previous KFF surveys, this survey shows that consumption of different types of news media is correlated with belief in health misinformation. For example, when it comes to the falsehoods about COVID-19 and vaccines tested in the survey, just under half (45%) of all adults say they have both heard at least one of these falsehoods and believe it to be probably or definitely true. This share rises to about three in four among regular viewers of Newsmax, two-thirds among regular viewers of OANN, and six in ten among regular viewers of Fox News. In comparison, three in ten of those who regularly get news from NPR or the New York Times, and about four in ten who regularly get news from their local newspaper or national network news said the same.

Adults Who Watch Newsmax, OANN, And Fox News Are More Likely To Have Heard And Believe At Least One Item Of COVID-19 Misinformation

Social media use is also correlated with being exposed and inclined to believe health misinformation. For example, a majority of those who use social media for health information and advice at least weekly say that they have heard at least one of the false COVID-19 or vaccine claims tested in the survey and think it is definitely or probably true, compared to four in ten of those who don’t use social media for health advice.

Adults Who Weekly Use Social Media For Health Information Are More Likely To Have Heard Pieces Of Health Misinformation And Say They Are Probably Or Definitely True

KFF also released additional analysis from the Health Misinformation Tracking Poll Pilot examining media use and trust and exposure and susceptibility to health misinformation among Black adults, Hispanic adults, and rural residents.

Support for this work was provided by the Robert Wood Johnson Foundation (RWJF). The views expressed do not necessarily reflect the views of RWJF. KFF maintains full editorial control over all of its policy analysis, polling, and journalism activities.

Methodology

This KFF Health Misinformation Tracking Poll Pilot was designed and analyzed by public opinion researchers at KFF. The survey was conducted May 23 – June 12, 2023, online and by telephone among a nationally representative sample of N=2,007 U.S. adults in English (1,881) and in Spanish (126). The sample includes 1,532 adults reached through the SSRS Opinion Panel either online or over the phone (n=78 in Spanish). The SSRS Opinion Panel is a nationally representative probability-based panel for which panel members are recruited randomly in one of two ways: (a) Through invitations mailed to respondents randomly sampled from an Address-Based Sample (ABS) provided by Marketing Systems Groups (MSG) through the U.S. Postal Service’s Computerized Delivery Sequence (CDS); (b) from a dual-frame random digit dial (RDD) sample provided by MSG. For the online panel component, invitations were sent to panel members by email followed by up to three reminder emails. 1,445 panel members completed the survey online and panel members who do not use the internet were reached by phone (87).

Another 475 (n=48 in Spanish) interviews were conducted from a random digit dial telephone sample of prepaid cell phone numbers obtained through MSG. Phone numbers used for the prepaid cell phone component were randomly generated from a cell phone sampling frame with disproportionate stratification aimed at reaching Hispanic and non-Hispanic Black respondents. Stratification was based on incidence of the race/ethnicity groups within each frame. Respondents in the prepaid phone samples received a $15 incentive by check received by mail, and panel respondents received a $5 electronic gift card incentive (some harder-to-reach groups received a $10 electronic gift card).

The online questionnaire included two questions designed to establish that respondents were paying attention. Cases that failed both attention check questions, those with over 30% item non-response, and cases with a length less than one quarter of the mean length by mode were flagged and reviewed. Cases were removed from the data if they failed two or more of these quality checks. Based on this criterion, 0 cases were removed.

The combined cell phone and panel samples were weighted to match the sample’s demographics to the national U.S. adult population using data from the Census Bureau’s 2021 Current Population Survey (CPS). Weighting parameters included sex, age, education, race/ethnicity, region, and education. The sample was weighted to match patterns of civic engagement from the September 2017 Volunteering and Civic Life Supplement data from the CPS and to match frequency of internet use from the National Public Opinion Reference Survey (NPORS) for Pew Research Center.  Finally, the sample was weighted to match patterns of political party identification based on a parameter derived from recent ABS polls conducted by SSRS polls. The weights take into account differences in the probability of selection for each sample type (prepaid cell phone and panel). This includes adjustment for the sample design and geographic stratification of the cell phone sample, within household probability of selection, and the design of the panel-recruitment procedure.

The margin of sampling error including the design effect for the full sample is plus or minus 3 percentage points. Numbers of respondents and margins of sampling error for key subgroups are shown in the table below. For results based on other subgroups, the margin of sampling error may be higher. Sample sizes and margins of sampling error for other subgroups are available by request. Sampling error is only one of many potential sources of error and there may be other unmeasured error in this or any other public opinion poll. KFF public opinion and survey research is a charter member of the Transparency Initiative of the American Association for Public Opinion Research.

Support for this work was provided by the Robert Wood Johnson Foundation (RWJF). The views expressed do not necessarily reflect the views of RWJF. KFF maintains full editorial control over all of its policy analysis, polling, and journalism activities.

GroupN (unweighted)M.O.S.E.
Total2007± 3 percentage points
Party ID
Democrat/Lean Democrat968± 5 percentage points
Republican/Lean Republican632± 5 percentage points
Independents382± 7 percentage points
Race/Ethnicity
White, non-Hispanic866± 4 percentage points
Black, non-Hispanic510± 6 percentage points
Hispanic514± 6 percentage points

Appendix

The KFF Health Misinformation Tracking Poll sought to examine the public’s exposure to and belief in a number of health-related misinformation claims. The statements included in the survey were selected based on public media documentation that these are claims that have been shared and spread in recent years and have been shown to be false or inaccurate. Below are some of the documented sources used to establish the existence of these misinformation claims and sources used to document their inaccuracy.

StatementSource documenting presence in public health conversationSource documenting falsehoods and inaccuracy of the statement
The COVID-19 vaccines have caused thousands of deaths in otherwise healthy people.The AtlanticJohn Hopkins Medicine;New York Times;CDC
Ivermectin is an effective treatment for COVID-19.One America News Network;New York TimesFDA;New England Journal of Medicine
The COVID-19 vaccines have been proven to cause infertility.NBC News;American Medical AssociationCDC;National Institutes of Health
The measles, mumps, rubella vaccines, also known as MMR, have been proven to cause autism in children.The Guardian;Health AffairsAnnals of Internal Medicine;World Health Organization;
More people have died from the COVID-19 vaccines than have died from the COVID-19 virus.Twitter/COVID Early Treatment Fund;Reuters;Reuters
Using birth control like the pill or IUDs makes it harder for most women to get pregnant after they stop using them..coda;In The Know (Yahoo)Media MattersContraception and Reproductive Medicine Journal
Sex education that includes information about contraception and birth control increases the likelihood that teens will be sexually active.Austin American-StatemanAmerican College of Obstetricians and Gynecologists;American Academy of Pediatrics
People who have firearms at home are less likely to be killed by a gun than people who do not have a firearm.New York TimesAnnals of Internal Medicine;Scientific American
Most gun homicides in the United States are gang related.Crime Prevention Research CenterCDC;National Youth Gang Analysis
Armed school police guards have been proven to prevent school shootings.PolitifactJAMA

Endnotes

  1.  The subsequent analysis and discussion in this report largely focuses on the share of adults who say each item of health misinformation presented examined in the survey is probably or definitely true, regardless of whether they’ve heard it. While exposure to health misinformation is a concern, the KFF analysis presented focuses on those who are most susceptible to the health misinformation claims when they are presented and say they are probably or definitely true. ↩︎
News Release

Poll: Most Americans Encounter Health Misinformation, and Most Aren’t Sure Whether It’s True or False 

Local TV and Broadcast News Among Most Trusted Sources for Health Information; Fewer Trust Social Media Sources

Published: Aug 22, 2023

A new KFF survey reveals the broad reach of health misinformation, with at least four in 10 people saying that they’ve heard each of 10 specific false claims about COVID-19, reproductive health, and gun violence.

Relatively small shares say that each of those false claims are “definitely true”, ranging from as few as 3% who definitively believe that COVID-19 vaccines have been proven to cause infertility to as many as 18% who definitively believe armed school guards have been proven to prevent school shootings.  

Sign up for emails

Receive periodic emails when we have new information to share about our expanding work on health misinformation and trust. Sign up.

At the same time, roughly half to three-quarters of the public are uncertain whether each of the 10 false claims are true or not, describing them as either “probably true” or “probably false.” This suggests that even when people don’t believe false claims they hear, it can create uncertainty about complicated public health topics.

“Most people aren’t true believers in the lies or the facts about health issues; they are in a muddled middle,” KFF President and CEO Drew Altman said. “The public’s uncertainty leaves them vulnerable to misinformation but is also the opportunity to combat it.”

The new survey is one component of a new KFF program area aimed at identifying and monitoring health misinformation and trust in the United States, placing particular emphasis on communities that are most adversely affected by misinformation, such as people of color, immigrants and rural communities. 

Alongside today’s survey findings, KFF will soon release companion survey reports highlighting the extent of health misinformation among Black and Hispanic adults, as well as rural residents. KFF will also soon release a regular “Health Misinformation Monitor,” which will document emerging health misinformation, identify its primary sources, and examine the role that social media and news outlets play in its spread. Sign up for alerts from KFF on this topic. KFF Health News is also expanding its reporting on this topic in conjunction with the new program. 

“While many Americans struggle to separate health information fact from fiction, our survey shows that credible sources of information, and messengers, represent an opportunity to break through and help increase trust,” said Irving Washington, senior fellow for misinformation and trust at KFF. “We’ll continue to focus on this opportunity and what type of efforts can make a difference.”The misinformation examined in the survey includes: 

  • Vaccines. A third (34%) of adults say the false claim that COVID-19 vaccines have caused thousands of sudden deaths in otherwise healthy people is definitely (10%) or probably (23%) true. Black adults are more likely to believe this false statement than White adults, while Republicans and independents are more likely than Democrats to do so. People with college degrees are less likely than those with a high-school education or less to say this is true.
  • Reproductive health. About a third of adults say the false claim that using birth control such as the pill or an IUD makes it harder for most women to get pregnant once they stop using them is “definitely” (5%) or “probably” true (29%). Adults under the age of 65, Republicans, independents, and Black and Hispanic adults are more likely to say this claim is true than their counterparts.
  • Gun violence. When asked about the inaccurate statement that people who have firearms at home are less likely to be killed with a gun, about four in ten (42%) say it is “definitely” (13%) or “probably” (29%) true. Gun owners are more likely than non-gun owners to say that this false claim is definitely or probably true (55% vs. 37%).

The survey also reveals how varied people’s beliefs and perceptions are about what constitutes misinformation. For example, when asked to describe specific misinformation related to COVID-19 that they’ve heard, people volunteered statements that were in direct contradiction with one another, including about the safety and effectiveness of COVID-19 vaccines and of wearing masks to prevent the virus’ spread.

Who People Trust for Health Information

The survey also gauges people’s trust in various sources of health information:

  • Doctors. Not surprisingly, people overwhelmingly say that they trust their own doctor’s recommendations – with 93% saying they trust their doctors at least a fair amount.
  • Federal agencies. About two thirds of the public say they have at least a fair amount of trust in the Centers for Disease Control (67%) and the Food and Drug Administration (65%) to make the right recommendations when it comes to health issues. Democrats are more likely than either independents or Republicans to trust the two federal agencies. About half of Republicans say they trust both the CDC (49%) and FDA (54%).
  • Traditional news sources. The largest shares of the public say they would have at least a little trust in health information reported by their local TV news stations (80%), national network news (72%), and their local newspaper (72%). CNN is the most trusted cable news network (58%), with smaller shares trusting MSNBC (52%), Fox News (49%), Newsmax (25%) or One American News Network (22%). Fewer than three in ten adults say they have “a lot” of trust in health information from any of these media sources.
  • Social media sources. About a quarter (24%) of adults say that they use social media at least weekly to find health information or advice, including larger shares of Hispanic and Black adults, and people in low-income households. Of eight specific social media sources, half (52%) would trust information about health issues they saw on YouTube at least a little. Fewer say they would trust health information if they saw it on Facebook (40%), Twitter (29%), Instagram (27%), and other platforms. Fewer than one in ten say they have a lot of trust in health information from any of these social media sources.

The survey report examines the sources to which people go to get their news and their susceptibility to misinformation. Less than half (45%) of adults say they have heard one of the five false COVID-19 and vaccine claims and believe it is definitely or probably true. That share rises to 76% of regular Newsmax viewers, and 67% of regular OANN viewers, and 61% of regular Fox News viewers.Similarly, 54% of those who use social media for health information and advice at least weekly say they have heard at least one of the false COVID-19 and vaccine claims and think it is definitely or probably true, compared to 40% of those who don’t use social media for health advice.Designed and analyzed by public opinion researchers at KFF, the KFF Health Misinformation Tracking Poll Pilot was conducted May 23-June 12, 2023, online and by telephone among a representative sample of 2,007 U.S. adults. Interviews were conducted in English and in Spanish. The margin of sampling error is plus or minus 3 percentage points for the full sample. For results based on subgroups, the margin of sampling error may be higher. Support for this work was provided by the Robert Wood Johnson Foundation (RWJF). The views expressed do not necessarily reflect the views of RWJF. KFF maintains full editorial control over all of its policy analysis, polling, and journalism activities.

Obesity Rates Among Children: A Closer Look at Implications for Children Covered by Medicaid

Published: Aug 17, 2023

Obesity in children is caused by a multitude of socioecological, environmental, and genetic factors and has increased in recent decades, with child obesity rates now three times higher than they were in the 1970s. Obesity is a risk factor for many chronic diseases and has been linked to future physical and mental health challenges and increased health care costs. Though obesity has historically been stigmatized as a result of personal choices, there have been recent actions to reduce that stigma and weight bias and increase obesity screening and treatment options. New FDA weight-loss drugs have entered the market, and the American Academy of Pediatrics (AAP) released a new set of clinical practice guidelines for evaluating and treating obesity in early 2023. While addressing obesity among children with all forms of insurance coverage is important, Medicaid is particularly relevant since it now covers half of children in the U.S., including 8 in 10 children living in poverty and over half of Black, Hispanic, and American Indian/Alaska Native children. Obesity prevalence is higher for these groups. This brief examines the share of children with obesity, how obesity screening and treatment is covered under Medicaid for children, and what recent changes may mean for Medicaid programs and enrollees in the future.

What is the share of children with obesity?

KFF analysis of federal survey data show more than one in six children have obesity, with obesity rates varying by insurance coverage type, race and ethnicity, and household income. Based on data from the 2020-2021 National Survey of Children’s Health (NSCH), 17% of children ages 10-17 in the U.S. have obesity (Figure 1). Obesity in children is typically defined as having a Body Mass Index (BMI) equal to or greater than the 95th percentile for their age and sex, although there has been recent pushback on BMI as a screening tool, and research has shown it can incorrectly classify individuals as overweight or obese, especially for people of color. Children with Medicaid are more than two times as likely to have obesity than those with private insurance: Over one-quarter (26.0%) of Medicaid children have obesity compared with 11.4% of children with private insurance alone. Obesity prevalence is also higher for Black, Hispanic, and children of other or multiple races compared with White children as well as for children with lower household incomes compared with children in the highest income households (Figure 1). These disparities in obesity reflect a variety of factors, including social and economic factors such as higher rates of food insecurity, more limited access to healthy food options, more limited time and access to opportunities for physical activity and recreation, and experiences with discrimination and stigma.

Obesity Prevalence Among Children Ages 10-17 by Coverage Type

What other chronic conditions do Medicaid children with obesity have?

Children’s obesity rates in Medicaid claims data are lower than survey estimates of obesity prevalence. In 2019, 7.4% of Medicaid children ages 10-17 had an obesity diagnosis clinically identified in the Medicaid claims data (T-MSIS), suggesting that obesity in children may be undertreated. Other research has found that obesity is generally under-reported in claims data, and when it is reported, it is more likely to identify individuals with morbid obesity or comorbidities than individuals with more moderate obesity. Several factors could be contributing to low rates of reporting including the relative newness in viewing obesity as a disease, interventions being time intensive and difficult for clinicians to implement in a time limited primary care visit, or limited provider reimbursement for obesity treatment services. While there are limitations, analysis of claims data can help to identify the extent to which other chronic health conditions accompany obesity.

For Medicaid children ages 10-17 with an obesity diagnosis, the most common co-occurring chronic condition (across a set of 30 chronic conditions, see Methods for more information) is asthma, followed by certain mental health conditions, hyperlipidemia, anemia, hypertension, and diabetes (Figure 2). Children with obesity are also more likely to have these conditions compared with children without an obesity diagnosis. For example, 13.2% of children with an obesity diagnosis also have an asthma diagnosis compared with 7.3% of children without obesity. Similarly, 12.4% of children with an obesity diagnosis also experience mental health challenges including depression, bipolar disorder, and other depressive mood disorders compared with 7.6% of children without obesity. These findings mirror a body of research that has found a link between childhood obesity and asthma as well as various mental health challenges including depression and anxiety, lower self-esteem and increased bullying. One recent study of Medicaid expenditures also found inpatient and outpatient mental health services were a primary driver of spending among children with obesity. Overall, over one-third (35.6%) of children with an obesity diagnosis have at least one other co-occurring chronic condition (across a set of 30 chronic conditions). 

Chronic Condition Diagnoses Among Medicaid Children with an Obesity Diagnosis Compared to Those Without

What obesity treatment and services does Medicaid cover for children?

Obesity services can include screening, behavioral and nutritional counseling, anti-obesity medications, and bariatric surgery, and these services are covered for children under Medicaid’s Early and Periodic Screening, Diagnostic, and Treatment (EPSDT) program. EPSDT is a Medicaid benefit for children under 21 that provides comprehensive treatment and preventive care. Under EPSDT, states are required to cover all screening services for children as well as any services “necessary… to correct or ameliorate” a child’s physical or mental health condition. EPSDT also allows for unique state flexibility in addressing the range of other factors connected to obesity, including providing behavioral health services and addressing adverse childhood experiences (ACEs) and social determinants of health (SDOH) such as housing, finances, and safety.

While children have access to obesity treatment though EPSDT, it is less clear how states are implementing and covering these services in practice. One old study, from 2010, only found conclusive evidence from 10 states that they were covering obesity-related behavioral and nutritional counseling services. While additional states are likely to have started covering obesity-related services since then, other research has found that some Medicaid-covered children do not receive recommended EPSDT screenings and services. Data from the 2020 Child Core Set, which includes data from participating states on children in Medicaid or the Children’s Health Insurance Program (CHIP), found a median of 73% of children ages 3 to 17 with a primary care visit had evidence of BMI screening, 63% received nutrition counseling, and 59% received physical activity counseling though these rates varied across states.

What to watch looking ahead?

While data indicate a majority of Medicaid children are being screened for obesity, it is difficult to know how many children are receiving recommended services. Research also indicates there are racial disparities in access to obesity treatments. When the Child Core Set quality measures—which include measures related to obesity— become mandatory in 2024, states and health plans will have data on rates of screening and counseling for obesity. Access to such data may prompt the states and health plans to encourage more proactive screening and treatment by pediatricians. Provisions included in recent legislation to bolster Medicaid’s EPSDT benefit may also help more Medicaid-covered children receive all recommended screenings and services, including obesity screening and counseling.

The AAP released a new set of clinical practice guidelines for evaluating and treating obesity and associated conditions in early 2023. The guidelines outline and describe evidence-based screening procedures, comorbidity evaluation and treatment for children ages 2 and older, and recommended obesity treatments (for treatment details, see Table 1). The guidelines emphasize early and intensive treatment, and note the importance of a non-stigmatized, family-centered approach that takes the range of factors that cause obesity into account. The guidelines are not mandatory, and it remains to be seen how quickly and to what extent the guidelines will be adopted by clinicians. There has been some pushback on the intensity of the new guidelines and the potential to cause eating disorders. Concerns with new medications for weight loss include some side effects and studies show people regain the weight if they stop taking the medications. Despite increasing prescribing rates of medications for adults, it is expected that providers may be slower to prescribe children anti-obesity medications .

Summary of Obesity Treatment Recommendations in the American Academy of Pediatrics (AAP) 2023 Clinical Practice Guideline

With Medicaid now covering half of all children in the U.S., and an even larger percentage of children who are likely to be obese, changes in physicians’ practice stemming from the updated treatment recommendations could have a sizable effect on Medicaid programs and enrollees. However, the extent to which the new, more intensive treatment recommendations are considered medically necessary for children may vary by state and provider. While there is evidence that payment rates for obesity treatment, access to IHBLT, and take up of anti-obesity medications is currently limited, there could also be spending implications for Medicaid if more children begin to receive recommended obesity treatments including anti-obesity medications or bariatric surgery.

Methods

Data: This analysis used the 2019 T-MSIS Research Identifiable Files. More specifically, the analysis used the inpatient (IP), long-term care (LT), and other services (OT) claims files merged with the demographic-eligibility (DE) files from the Chronic Condition Warehouse (CCW) to include beneficiary demographic and enrollment information.

Identifying an Obesity Diagnosis: An obesity diagnosis was identified if any enrollee had any claims across the IP, LT, and OT files during the year with ICD-10 diagnosis codes within E66.0, E66.1, E66.2, E66.8, E66.9, Z68.3, Z69.4, Z68.54. This code set was based on previous KFF analysis and other sources.

Chronic Conditions: 30 chronic conditions were identified in this analysis including anemia, asthma, diabetes, depression, bipolar, or other depressive mood disorders, hypertension, and hyperlipidemia, using ICD-10 codes from the CCW Chronic Condition Algorithm. A condition was identified as present if an enrollee had any claims across the IP, LT, and OT files during the year with any of the relevant diagnosis codes listed in the CCW algorithm.

Enrollee Exclusion Criteria: This analysis was limited to children ages 10-17 continuously enrolled in Medicaid with no more than a 45-day gap in enrollment during the year. This definition of continuous enrollment was chosen to align with previous KFF analysis and CMS’ Child Set Core Measures, specifically, those around children’s preventive care, and to give people sufficient time in Medicaid to utilize services.

State Exclusion Criteria: We excluded the following states from our analysis due to concerns with the quality of their enrollment data: Florida, Kentucky, Rhode Island, and Oklahoma. Based on a previous KFF analysis, we relied on data quality assessments from the DQ Atlas to exclude states. We exclude states based on (1) Number of Enrollment Spans – % of Beneficiaries with Only One Enrollment Span in Year ≥ 99.8 (Florida, Kentucky, Rhode Island), (2) Enrollment Patterns Over Time: Number of Enrollment Spans – % Beneficiaries with 3 or More Enrollment Spans in Year ≥ 5% (Oklahoma).

At the state level, we also examined claims volume, the share of children with no health care utilization, and benchmarked the share of children with a well-child visit in 2019 to the 2019 Child Core Set measure for the percentage of children with at least 1 well-care visit with a primary care practitioner or obstetrician/gynecologist. We did not find any significant state outliers across those measures.

News Release

Drugs Used for Weight Loss Could Cost Americans Much More Than People in Peer Countries

Published: Aug 17, 2023

In addition to having the highest obesity rates, the U.S is currently facing significantly higher prices for several major drugs used for weight loss and other health needs, according to a new KFF analysis of the list prices for semaglutide and tirzepatide drugs.

Ozempic, which has been approved in the U.S. for diabetes, is more than five times as expensive in the U.S. ($936) as in Japan ($169), which has the second highest list price. Similarly, Wegovy, which has the same active ingredient and was approved for weight loss, is nearly four times as expensive in the U.S. ($1,349) as in Germany ($328.)

 The bar chart compares the U.S. to seven peer countries by the list price for semaglutide and tirzepatide drugs that are used for weight loss, including Ozempic and Wegovy. Ozempic is over five times as expensive in the U.S. ($936) as in Japan ($169) Wegovy is four times as expensive in the U.S. ($1,349) as in Germany ($328.)

The chart above shows list prices available through website searches for four weekly shots or a 30-day supply. List prices are not necessarily net prices paid as manufacturers provide insurer rebates and patient coupons. Private insurers and employers in the U.S. may also be able to negotiate lower prices with drug manufacturers or get larger rebates.

Even if prices lower some, higher drug prices and higher obesity rates in the U.S. could still lead to a larger impact on overall health spending in the U.S. than in peer countries.

One-third of U.S. adults (33.6%) have obesity compared to an average of 17.1% across peer nations. KFF polling also found that about half of adults in the U.S. would be interested in taking prescription weight-loss drugs, though interest drops if not covered by insurance or after hearing they might gain weight back after end the use.

The full analysis and other data on health costs are available in the Peterson-KFF Health System Tracker, an online information hub dedicated to monitoring and assessing the performance of the U.S. health system.

How Do Prices of Drugs for Weight Loss in the U.S. Compare to Peer Nations’ Prices?

Authors: Krutika Amin, Imani Telesford, Rakesh Singh, and Cynthia Cox
Published: Aug 17, 2023

A class of drugs initially approved for diabetes treatment has captured the public’s and policymakers’ attention as interest in their off-label use for weight loss rises. The weight-loss benefits of these drugs have led to their prescribed use for obesity or overweight treatment.

A new analysis compares list prices for semaglutide—including Ozempic, which has been approved in the U.S. for diabetes, and Wegovy, which has the same active ingredient and has been approved for weight loss—and tirzepatide (Mounjaro) in the U.S. and other large, wealthy OECD nations.

Semaglutide prices are higher in the U.S. than in other countries. Ozempic is more than five times as expensive in the U.S. ($936) as in Japan ($169), which has the second highest list price. Similarly, Wegovy is nearly four times as expensive in the U.S. ($1,349) as in Germany ($328.)

The U.S. has by far the highest rates of adults with obesity. A third of adults (33.6%) have obesity in the U.S. compared to an average of 17.1% across peer nations

The analysis can be found on the Peterson-KFF Health System Tracker, an information hub dedicated to monitoring and assessing the performance of the U.S. health system.

Poll Finding

KFF Tracking Poll July 2023: Substance Use Crisis And Accessing Treatment

Published: Aug 15, 2023

Findings

Key Findings

  • With U.S. overdose deaths hitting a new high in 2022, a majority of adults say they have felt the impact of the substance use crisis facing the country. Two-thirds say either they or a family member have been addicted to alcohol or drugs, experienced homelessness due to addiction, or experienced a drug overdose leading to an emergency room visit, hospitalization, or death.
  • Three in ten U.S. adults (29%) say they or someone in their family have ever been addicted to opioids, including prescription painkillers and illegal opioids like heroin. Opioid addiction impacts substantial shares across demographic groups like income and gender but is more commonly reported among rural residents and White adults. Four in ten of those living in rural areas (42%) report they or a family member have experienced opioid addiction compared to smaller shares of those living in suburban (30%) or urban (23%) areas. In addition, a larger share of White adults (33%) compared to Black adults (23%) report personal or familial experience with opioid addiction. About three in ten (28%) Hispanic adults also report they or a family member have experienced opioid addiction.
  • Among those who say they or a family member experienced addiction to prescription painkillers, alcohol, or any illegal drug, less than half (46%) report they or their family member got treatment for the addiction. The share is larger among White adults (51%), compared to Black adults (35%) and Hispanic adults (35%). Three in ten (29%) of those who report a personal or family issue with addiction report receiving in-patient treatment, and a quarter (26%) say they received out-patient treatment. A quarter (25%) of those who say they or a family member experienced opioid addiction, or 7% of all adults, say they or their family member were treated using medication for opioid use disorder such as buprenorphine or methadone.
  • Among the two-thirds who say they or a family member experienced addiction, three-quarters (76%), or 50% of all adults, say it had at least a minor impact on their relationship with their family. Most also say it impacted their mental health or their family’s financial situation. Substantial shares say these were “major” impacts, with about three in ten adults who say so when asked about their mental health (32%) and their family’s financial situation (29%) and about four in ten (42%) when asked about familial relationships.
  • Beyond direct experience with addiction, the poll finds many adults in the U.S. are worried about substance use. For example, half (51%) of adults are worried that someone in their family will experience substance use disorder or an addiction to drugs or alcohol and one-third (32%) are worried that someone in their family will overdose on opioids, such as prescription painkillers or illegal drugs like heroin. About four in ten adults are worried that someone in their family will unintentionally consume the drug fentanyl (39%), and these concerns loom large in rural areas. About half (48%) of those who live in rural areas compared to around four in ten of those in urban (39%) or suburban (37%) areas say they are worried that someone in their family will unintentionally consume the drug.
  • Recent years have brought an increase in awareness of the dangers of opioid addiction and most of those who have been prescribed an opioid painkiller in the past five years (29% of all adults) say their doctor has spoken to them about the various dangers and considerations when taking this class of drugs. This includes their doctor talking to them about possible side-effects (69%), other ways to manage their pain (60%), keeping their medications in a safe place (58%), or the possibility of dependence (57%).
  • When asked about several policies aimed at reducing drug overdoses, a majority support addiction treatment centers in their community (90%) or making Narcan, a medicine that can reverse an opioid overdose, freely available in places likes bars, health clinics, and fire stations (82%) – including about half who “strongly support” either policy. Fewer, but still nearly half (45%), support safe consumption sites, places where people can use illegal drugs with trained personnel in case of emergency. Majorities across partisan identification support addiction centers in their community and making Narcan publicly available, with at least three-quarters of Democrats, Republicans, and independents who support the policies. However, Republicans are less likely to support safe consumption sites, with a quarter of Republicans who say so compared to six in ten (61%) Democrats and half (49%) of independents.

The Substance Use Crisis In The U.S.

Substance use disorder and addiction issues surged during the COVID-19 pandemic, coming after more than a decade of increased use of alcohol and an opioid crisis that has been labeled by public health officials as “an epidemic.” The latest KFF Health Tracking Poll explores the public’s concern and experiences with alcohol and drug addiction and its consequences, as well as access to treatment and ways to prevent opioid use disorder (OUD) and overdoses.

Most adults in the U.S. report being affected by the addiction crisis facing the country. Two-thirds of adults say they have either personally felt they were addicted or had a family member who was addicted to alcohol or drugs. This includes being addicted to prescription painkillers, illegal drugs, or alcohol, having an overdose that required hospitalization, experiencing homelessness due to addiction, or having a family member who died from a drug overdose.

About one in eight (13%) say they have ever felt they might have been addicted to alcohol, while smaller shares say they felt they might have been addicted to prescription painkillers (5%), or illegal drugs, such as heroin, fentanyl, methamphetamine, or cocaine (4%). Small but notable shares say they have experienced homelessness because of an addiction (3%) or had a drug overdose that required an emergency room visit or hospitalization (2%).

When asked about their family members, more than half of adults (54%) say someone in their family has ever been addicted to alcohol, while about a quarter say someone in their family has been addicted to any illegal drug (27%) or has been addicted to prescription painkillers (24%). One in six say someone in their family has had a drug overdose requiring an ER visit or hospitalization (16%), and one in seven say a family member has experienced homelessness because of an addiction (14%). About one in ten (9%) adults report that someone in their family has died from a drug overdose.

Two-Thirds Of Adults Have Been Impacted By Addiction, Either Personally Or Within Their Family

Experiences with addiction and overdose are widespread, with large shares across income groups, education, race and ethnicity, age, and urbanicity all reporting some experience, though some groups report higher incidence than others. Overall, one in five adults (19%) say they have personally been addicted to drugs or alcohol, had a drug overdose requiring an ER visit or hospitalization, or experienced homelessness because of an addiction.1  The share increases to a quarter (25%) among adults with a household income of under $40,000 a year, compared to almost one in five (18%) of those with an income between $40,000 and $90,000, and one in six (16%) of those with a household income of $90,000 or more annually.

Additionally, White adults are more likely than Black adults and Hispanic adults to say someone in their family has ever experienced addiction or overdose (67% compared to 58% and 56%, respectively). This gap is mostly driven by addiction to alcohol and prescription painkillers. Six in ten White adults (60%) report someone in their family has ever been addicted to alcohol compared to half of Black adults (49%) and Hispanic adults (47%), and nearly three in ten White adults (28%) say someone in their family has been addicted to prescription painkillers compared to two in ten Black adults (18%) and Hispanic adults (20%). Appendix Figures 1 and 2 show personal and familial addiction incidence by racial and ethnic groups as well as income. These racial and ethnicity differences are consistent with KFF analysis finding substance use disorder more common among White adults.

Opioid addiction

Three in ten (29%) say they or someone in their family have been addicted to opioids, including prescription painkillers or illegal opioids such as heroin or fentanyl. The share of adults who say they or a family member have been addicted to opioids increases to four in ten (42%) adults who live in rural areas, a larger share than those in suburban (30%) and urban (23%) areas. Similar to the racial differences reported above, a third of White adults (33%) say they or a family member have been addicted to opioids, a larger share compared to Black adults (23%), with the share of Hispanic adults in between (28%). The slightly larger share of White adults who report experiences with opioid addiction is consistent with KFF analysis,2  yet recent data shows a spike in opioid deaths among people of color.

Three In Ten Say They Or Someone In Their Family Has Ever Been Addicted To Opioids

The Impact of addiction on Families

Among the two-thirds who say they or a family member experienced addiction, three-quarters (76%), or 50% of all adults, say it had at least a minor impact on their relationship with their family. Most also say it impacted their mental health (70%, or 46% of all adults), or their family’s financial situation (57%, or 38% of all adults). Substantial shares say these were “major” impacts, with about three in ten adults who say so when asked about their mental health (32%) and their family’s financial situation (29%), and about four in ten (42%) when asked about familial relationships.

The impact of addiction isn’t just driven by personal addiction. A quarter (27%) of those who have had a family member suffer from addiction, but have not personally experienced addiction themselves, say their mental health was majorly impacted as a result.

Majorities Say Experiences With Addiction In Their Family Impacted Their Relationship With Family, Mental Health, And Financial Situation

Overall, half (51%) of adults are worried that someone in their family will experience substance use disorder or an addiction to drugs or alcohol. Another four in ten are worried that someone in their family will unintentionally consume the drug fentanyl (39%), while a third (32%) are worried that someone in their family will overdose on opioids, such as prescription painkillers or illegal drugs like heroin.

At Least Half Are Worried That Someone In Their Family Will Experience A Serious Mental Health Crisis, Substance Abuse

Concerns about unintentionally consuming the drug fentanyl3  looms large in rural areas. About half (48%) of those who live in rural areas compared to around four in ten of those in urban (39%) or suburban (37%) areas say they are worried that someone in their family will unintentionally consume the drug.

MENTAL HEALTH AND SUBSTANCE USE

In addition to the substance use crisis, adults in the U.S. remain concerned about mental health issues for someone in their family, with new KFF analysis showing suicides at record levels. Significant shares of adults are worried about mental health issues for their families, with 58% who are “very” or “somewhat worried” that someone in their family will experience a serious mental health crisis, and a third who are worried someone in their family will attempt suicide (36%) or experience homelessness (33%). Three-quarters of Hispanic adults (75%), compared to six in ten Black adults (60%) and half of White adults (53%), say they are personally worried about someone in their family experiencing a serious mental health crisis.

Lower income populations are more likely to say they’re worried than those with higher household incomes about a family member experiencing any of the aforementioned concerns, including half (49%) of those with incomes of less than $40,000 a year who say they are worried someone in their family may experience homelessness, compared to one in four (25%) of those with incomes of more than $40,000 annually who say the same.

Interactive DataWrapper Embed

Treatment for Substance Use and Addiction

More than fifty years after the U.S. declared a war on drugs, evidence-based research has suggested that treatment rather than punishment may be the most impactful in addressing addiction, though White adults are more likely to report that they or their family member received treatment compared to Black adults and Hispanic adults.

Slightly less than half (46%) of those who say they or a family member experienced any addiction say the individual ever got treatment for drug addiction or substance use disorder (29% of all adults).4  White adults (51%) are more likely than Black adults (35%) and Hispanic adults (35%) to report that they or their family member received treatment for addiction or substance use disorder. The potential racial and ethnic disparities in accessing treatment, as have been highlighted by past research, may be exacerbated by the changing nature of the opioid epidemic with increasing prevalence among communities of color.

Half Of Those Who Say They Or A Family Member Experienced Addiction Report Ever Receiving Treatment, Larger Shares Of White Adults

Among those who say they or someone in their family experienced addiction to prescription painkillers, illegal drugs, or alcohol, three in ten (29%) said they received in-patient treatment, and a quarter (26%) received out-patient treatment.

A quarter (25%) of those who say they or a family member experienced opioid addiction say they or their family member were treated using medication for opioid use disorder such as buprenorphine or methadone. Despite the rise in opioid deaths, KFF analysis still finds that buprenorphine is being under prescribed for patients, especially Black patients.5 

Four In Ten Who Say They Or Their Family Member Experienced Addiction Ever Received In-Patient Or Out-Patient Treatment

Reasons for not getting treatment

Those who say they or their family member experienced addiction and didn’t receive treatment cite a variety of reasons, including not wanting help or refusing help, overcoming or stopping their addiction on their own, denial that they have an addiction, the cost or affordability associated with care, the shame or stigma, or even that a family member died before they could get help.

In Their Own Words: What is the main reason why you or your family member did not get treatment?

“We are not raised that way.” – 22 year-old Black woman, Georgia

“Brother quit on his on and been sober for 2 years, my dad was addicted to cocaine quit on his own.” – 37 year-old Hispanic man, Texas

“Lack of funding, no insurance coverage- turned away for treatment.” – 50 year-old White woman, South Carolina

“He said he could get better on his own. It hasn’t happened yet.” – 28 year-old American Indian/Alaskan Native woman, Oklahoma

“They passed away before they could.” – 30 year-old White woman, Texas

“Because I was able to quit all on my own. I was just tired of being tired and losing all respect within my family, especially my daughter. It was a long road but I have been clean for 30 years and enjoying everyday of my life, with my daughter.” – 70 year-old, multiracial woman, Arizona

“Affordability and family member didn’t have health insurance.” – 31 year-old multiracial woman, Florida

Understanding the Dangers of Prescription Opioid Use

Though the opioid epidemic has shifted, doctors continue patient education about the risks of prescription opioids. In the past decade, many have examined the role of doctors in the opioid epidemic, including an American Medical Association task force formed in 2014 charged in part with reforming physician practices. Among adults (29% of total) who have been prescribed an opioid painkiller in the past five years, majorities say their doctor talked to them about the possible ramifications of the drugs. About seven in ten (69%) say their doctor talked to them about possible side-effects of the opioid painkillers when they were first prescribed. Around six in ten (60%) say they were talked to about other ways to manage their pain, say their doctors talked to them about keeping their medications in a safe place so they weren’t misused by others (58%), or say their doctors talked to them about the possibility of addiction or dependence (57%). About half (48%) of those who have been prescribed opioids in the past five years say their doctor talked to them about a plan for stopping the medication, while the other half say they did not.

Majorities Say A Doctor Talked To Them About Concerns When First Prescribed Opioids

Policies Aimed at Reducing Drug Overdoses

When asked about several policies aimed at reducing drug overdoses, large majorities support addiction treatment centers in their community (90%) and making Narcan, a medicine that can reverse an opioid overdose, freely available in places likes bars, health clinics, and fire stations (82%) – including about half who “strongly support” either policy. Fewer, but still nearly half (45%), support safe consumption sites, places where people can use illegal drugs with trained personnel in case of emergency.

Large Majorities Support Addiction Treatment Centers In Their Community, Making Narcan Available To Reduce Drug Overdoses

Large majorities across partisanship support addiction centers and Narcan availability. Nine in ten (92%) Democrats and independents (94%) support addiction treatment centers in their community, as do 86% of Republicans. Another nine in ten (89%) Democrats and eight in ten (83%) independents support making Narcan available publicly, compared to three-quarters (73%) of Republicans.

Partisan differences are larger when it comes to safe consumption sites. About a fourth of Republicans (23%) support places for people to use illicit drugs where there are trained personnel in case of emergency, compared to six in ten (61%) Democrats and half (49%) of independents.

Across Party Lines, Majorities Support Addiction Treatment Centers In Their Community And Making Narcan Available Publicly

Methodology

This KFF Health Tracking Poll was designed and analyzed by public opinion researchers at KFF. The survey was conducted July 11-19, 2023, online and by telephone among a nationally representative sample of 1,327 U.S. adults in English (1,246) and in Spanish (81). The sample includes 1,043 adults reached through the SSRS Opinion Panel either online or over the phone (n=46 in Spanish). The SSRS Opinion Panel is a nationally representative probability-based panel where panel members are recruited randomly in one of two ways: (a) Through invitations mailed to respondents randomly sampled from an Address-Based Sample (ABS) provided by Marketing Systems Groups (MSG) through the U.S. Postal Service’s Computerized Delivery Sequence (CDS); (b) from a dual-frame random digit dial (RDD) sample provided by MSG. For the online panel component, invitations were sent to panel members by email followed by up to three reminder emails. 1,022 panel members completed the survey online and panel members who do not use the internet were reached by phone (21).

Another 284 (n=35 in Spanish) interviews were conducted from a random digit dial telephone sample of prepaid cell phone numbers obtained through MSG. Phone numbers used for the prepaid cell phone component were randomly generated from a cell phone sampling frame with disproportionate stratification aimed at reaching Hispanic and non-Hispanic Black respondents. Stratification was based on incidence of the race/ethnicity groups within each frame. Respondents in the phone samples received a $15 incentive via a check received by mail, and web respondents received a $5 electronic gift card incentive (some harder-to-reach groups received a $10 electronic gift card).

The online questionnaire included two questions designed to establish that respondents were paying attention. Cases that failed both attention check questions, those with over 30% item non-response, and cases with a length less than one quarter of the mean length by mode were flagged and reviewed. Cases were removed from the data if they failed two or more of these quality checks. Based on this criterion, no cases were removed.

The combined cell phone and panel samples were weighted to match the sample’s demographics to the national U.S. adult population using data from the Census Bureau’s 2022 Current Population Survey (CPS). Weighting parameters included sex, age, education, race/ethnicity, region, and education. The sample was weighted to match patterns of civic engagement from the September 2019 Volunteering and Civic Life Supplement data from the CPS and to match frequency of internet use from the National Public Opinion Reference Survey (NPORS) for Pew Research Center.  Finally, the sample was weighted to match patterns of political party identification based on a parameter derived from recent ABS polls conducted by SSRS polls. The weights take into account differences in the probability of selection for each sample type (prepaid cell phone and panel). This includes adjustment for the sample design and geographic stratification of the cell phone sample, within household probability of selection, and the design of the panel-recruitment procedure.

The margin of sampling error including the design effect for the full sample is plus or minus 3 percentage points. Numbers of respondents and margins of sampling error for key subgroups are shown in the table below. For results based on other subgroups, the margin of sampling error may be higher. Sample sizes and margins of sampling error for other subgroups are available by request. Sampling error is only one of many potential sources of error and there may be other unmeasured error in this or any other public opinion poll. KFF public opinion and survey research is a charter member of the Transparency Initiative of the American Association for Public Opinion Research.

GroupN (unweighted)M.O.S.E.
Total1,327± 3 percentage points
Race/Ethnicity
White, non-Hispanic727± 4 percentage points
Black, non-Hispanic203± 9 percentage points
Hispanic276± 8 percentage points
Health care provider told them they are overweight or obese in past five years
Yes542± 5 percentage points
No784± 4 percentage points


Appendix

Personal
Family Experiences With Addiction

Endnotes

  1. KFF analysis of NSDUH data finds 18% have experienced mild, moderate, or severe substance use disorder, similar to the 19% of those in the poll findings who have personally experienced addiction to alcohol or drugs or experienced a drug overdose leading to an emergency room visit or hospitalization. ↩︎
  2. The incidence measured in this poll is slightly larger than measured in government data, the KFF polling data has a few key differences. KFF polling data asks about individual use as well as family member use and measures those who have ever experienced addiction to opioids, while the KFF’s State Health Facts, which includes government data, measures opioid addiction in the past year. ↩︎
  3. Fentanyl is recently being added to other illegally produced drugs, such as cocaine, causing fear among recreational drug users that their consumption of other drugs may carry an increased risk of death. ↩︎
  4. The question asked in the poll asks if those who say they or a family member ever experienced any addiction ever received treatment for drug addiction or substance use disorder, indicating a higher share of those who say they received treatment than in NSDUH analysis, with 6.3% of those who experienced substance use disorder received treatment that year, according to this data. ↩︎
  5. The use of medications, in combination with counseling and behavioral therapies are meant to provide a treatment plan for substance use disorders. In 2022, buprenorphine dispensing grew by 24% compared to pre-pandemic levels in 2019, but it remains unclear whether the progress in increasing prescriptions has reached people of color, a group that has remained under-prescribed for the opioid treatment. ↩︎
News Release

KFF Poll: Three-in-Ten People Say They or Someone in Their Family Has Been Addicted to Opioids, with Rural Families Hit Hardest

Two-thirds Report They or a Family Member Has Been Addicted to Alcohol or Drugs, or Has Experienced Homelessness, Hospitalization, or Death as a Result of Addiction

Published: Aug 15, 2023

A new KFF poll assessing the broad reach of the nation’s opioids crisis on families across the United States reveals that three-in-ten adults (29%) say they or someone in their family have ever been addicted to opioids, including prescription painkillers and illegal drugs like heroin. Rural residents (42%) and White adults (33%) are among the groups hardest hit.

The poll also showed that the opioid crisis is part of a much larger picture of addiction affecting American families: two-thirds (66%) of the public report that either they or a family member has been addicted to alcohol or drugs, experienced homelessness because of an addiction, or experienced a drug overdose leading to an emergency room visit, hospitalization, or death. This includes one-in-five adults (19%) who say they have personally been addicted to drugs or alcohol, had a drug overdose requiring an emergency room visit or hospitalization, or experienced homelessness because of an addiction.

Less than half (46%) of those who report addiction in their families say the person suffering from addiction got treatment. A larger share of White adults (51%) than Black adults (35%) and Hispanic adults (35%) report that they or their family member received treatment.

Large shares of those whose families have been impacted by addiction say it had at least a minor impact on their relationship with their family (76%), their mental health (70%), or their family’s financial situation (57%). On each of these questions, at least a quarter say it had a “major impact.”

Among the public overall, half (51%) worry that someone in their family will experience substance use disorder, and one-third (32%) are worried that someone in their family will overdose on opioids, such as prescription painkillers or illegal drugs like heroin. About four-in-ten adults are worried that someone in their family will unintentionally consume the opioid drug Fentanyl (39%). Respondents in rural areas expressed more concern about these issues overall. 

Most adults prescribed an opioid painkiller in the past five years say their doctor talked to them about the possible consequences of the drugs, including possible side-effects. Six in ten (60%) who say they were talked to about other ways to manage their pain also say their doctor has spoken to them about the possibility of addiction or dependence (57%). 

In addition to gauging the public’s experiences with addiction to drugs and alcohol, the poll examined public support for policies aimed at curbing drug overdoses. The public broadly supports two approaches aimed at reducing opioid overdoses, including majorities across partisans. Most people support addiction treatment centers in their community (90%) or making Narcan (naxolone), a medicine that can reverse an opioid overdose, freely available in places like bars, health clinics, and fire stations (82%). About half “strongly support” both policies, and they are also supported by at least three-quarters of Democrats, Republicans, and independents.

Fewer, but still nearly half (45%), support safe consumption sites where people can use illegal drugs monitored by trained personnel in an emergency. A majority of Democrats (61%), half of independents (49%), and fewer Republicans (23%) support safe consumption sites.

Designed and analyzed by public opinion researchers at KFF, the survey was conducted from July 11-19, 2023 online and by telephone among a nationally representative sample of 1,327 U.S. adults. Interviews were conducted in English and in Spanish. The margin of sampling error is plus or minus three percentage points for the full sample. For results based on other subgroups, the margin of sampling error may be higher.

How Many People Use Medicaid Long-Term Services and Supports and How Much Does Medicaid Spend on Those People?

Published: Aug 14, 2023

Data Note

In 2020, KFF estimates that 4.2 million people used Medicaid long-term services and supports (LTSS) delivered in home and community settings and 1.6 million used LTSS delivered in institutional settings (Figure 1). LTSS encompass the broad range of paid and unpaid medical and personal care services that assist with activities of daily living (such as eating, bathing, and dressing) and instrumental activities of daily living (such as preparing meals, managing medication, and housekeeping). They are provided to people who need such services because of aging, chronic illness, or disability and may be provided in institutional settings such as nursing facilities or in people’s homes and the community. Services provided in non-institutional settings are usually referred to as home- and community-based services (HCBS) and include a wide range of services such as adult daycare, home health, personal care, transportation, and supported employment. In 2020, Medicaid was the primary payer for LTSS, covering over half of all LTSS spending in in the U.S. Despite Medicaid’s significant role in funding LTSS in the U.S., eligibility for Medicaid LTSS is complex and varies widely by state. This data note provides an overview of Medicaid coverage of LTSS, KFF estimates of how many Medicaid enrollees used LTSS in 2020, how much Medicaid spent on enrollees who used LTSS, and policy issues to watch in the coming years. Key takeaways include:

  • In 2020, there were 5.6 million people who used Medicaid LTSS, of which 4.0 million (72%) used only HCBS, 1.4 million (24%) used only institutional care, and 0.2 million used both (4%) (Figure 1). The share of people using Medicaid LTSS only in home and community-based settings ranged from 45% in Maine to 94% in North Carolina (Figure 2).
  • Medicaid spending per-person was nearly nine times higher for people who used LTSS than for those who did not use LTSS ($38,769 vs. $4,480), with particularly high spending for people who used institutional LTSS (Figure 4).
  • People who used Medicaid LTSS comprised 6% of Medicaid enrollment but 37% of federal and state Medicaid spending, reflecting the generally high cost of LTSS and more extensive health needs that lead to higher use of other health care services and drugs (Figure 5).

KFF’s estimates differ from the number of people using Medicaid LTSS reported by the Centers for Medicare & Medicaid Services (CMS), which found that about 11 million Medicaid enrollees used LTSS in 2019. CMS counts are higher than KFF counts because CMS defines LTSS more broadly and includes enrollees who may only use LTSS on a single day. CMS counts include people who are using services such as behavioral health, rehabilitation, health homes, and case management, but no other LTSS, whereas KFF only included enrollees if they were using the services identified in the data note below. CMS also counted people as using LTSS if they had one or more claims for a service, but KFF’s definition aims to capture only people who are using the services on an ongoing basis.

Nearly 6 Million Medicaid Enrollees Used LTSS in 2020

What are Medicaid Long-Term Services and Supports?

Medicaid LTSS are generally classified by the location in which they are provided: either in an institutional setting or in home- and community-based settings, also known as HCBS. Institutional care includes care provided in a nursing facility, which is a mandatory Medicaid benefit, and care provided in an intermediate care facility for people with intellectual disabilities, which is an optional benefit that all states currently choose to cover. HCBS include a broader range of benefits, which are all optional except for home health care. HCBS first became available as a Medicaid “waiver” option and in that capacity, services were generally available to certain types of Medicaid enrollees such as those with intellectual disabilities or those with physical disabilities.

In the last 20 years, several new authorities have been created, allowing states to also offer HCBS through the Medicaid state plan (see Appendix Table 1 for a list of HCBS authorities). If services are provided through a state plan, they must be offered to all eligible individuals. In contrast, services provided under waivers, such as 1115s or 1915(c)s, may be restricted to specific groups based on geographic region, income, or type of disability. Waivers may also include a wider range of service types than can be provided under state plans. Historically, Medicaid spent more money on LTSS in institutional settings than on LTSS delivered in home and community-based settings, but initiatives to balance HCBS and institutional care have changed that trend. Since 2013, Medicaid has spent more on HCBS than institutional care.

How Many People Used Medicaid LTSS in 2020?

In 2020, there were 5.6 million people who used Medicaid LTSS, of which 4.0 million (72%) used only HCBS, 1.4 million (24%) used only institutional care, and 0.2 million used both (4%) (Figure 1). These counts and shares did not change notably between 2018 and 2020. KFF’s current count of the number of people using Medicaid LTSS is lower than the number of people using LTSS reported by the Centers for Medicare & Medicaid Services (CMS) because KFF only counted people as using LTSS if they used institutional care or HCBS on an ongoing basis. CMS included a broader set of services in their definition of LTSS and did not require people to use the services on an ongoing basis. KFF’s current counts also differ somewhat from KFF’s annual HCBS survey on account of differences in how states report data in surveys versus how they are reflected in the claims. For example, states do not report unduplicated counts of total enrollees across different types of benefits in KFF’s survey data. See methods for more detail.

In 2020, nearly three-quarters (72%) of people who used Medicaid LTSS were exclusively served in home and community-based settings, but this ranged from 45% in Maine to 94% in North Carolina (Figure 2). The larger share of people receiving care in the community as opposed to in an institution reflects initiatives to make home and community-based care more widely available in recent years and to remove what has been referred to as the “institutional bias” in Medicaid. The shift towards HCBS is readily apparent in analyses of Medicaid spending on LTSS: The percentage of LTSS spending that pays for HCBS has increased from only 12% in 1988 to 59% in 2019. While the number of people using Medicaid HCBS exceeds the number who use institutional care nationally, several states still serve fewer than half of people in exclusively home and community-based settings. Over 5% of Medicaid LTSS users in eight states (MN, IN, TN, NJ, IL, CT, KS, and OH) used both institutional care and HCBS. Such people may have transitioned between institutional and community-based settings due to changes in their level of need during the year.

The Percentage of People Who Used Medicaid LTSS in Only Home and Community Settings Was 72% Nationally But Varied Across States

Among the 4.2 million people who used HCBS in 2020, at least 1.9 million used services provided through a state plan such as home health and personal care and at least 1.7 million received services through a waiver (Figure 3). Federal Medicaid statute requires states to cover home health, but the remainder of HCBS are optional. An additional 837,000 people used other HCBS services that were a mix of state plan and waiver services. Among people who used home health, personal care, and “other” HCBS, 0.5 million used more than one type of HCBS. (KFF categorized people using waiver services as only using waiver services, although in some states, people could potentially receive services through a waiver and through the state plan.) In most states, the range of benefits available through a waiver are more comprehensive than those available through the state plan (see Appendix Table), but most states limit the number of people who may use waiver services, often resulting in waiting lists. In a 2022 survey of states HCBS programs, states reported that there were 656,000 people on waiting lists, with people waiting an average of 45 months to receive waiver services.

Similar Numbers of Medicaid Enrollees Used HCBS Provided Through Medicaid State Plans and Through Waivers

What Do We Know About Spending for People Who Used Medicaid LTSS in 2020?

Medicaid spending per-person is higher for people who use institutional LTSS and people who use HCBS when compared to those who do not use any LTSS, but spending for people using institutional LTSS is particularly high (Figure 4). In 2020, Medicaid spending—including LTSS and other services such as hospital care and prescription drugs—for the 5.6 million enrollees who used Medicaid LTSS, totaled nearly $217 billion. Per-person spending for these enrollees was $38,769. In comparison, Medicaid spent $4,480 per enrollee who did not use Medicaid LTSS, although that total includes children who comprise 40% of Medicaid enrollees and tend to have much lower spending per person. Medicaid spent an average of $36,275 per person for people who used HCBS and $47,279 per person for people who used institutional LTSS.

Medicaid Enrollees Who Used LTSS Had High Per-Enrollee Spending

People who used Medicaid LTSS comprised 6% of Medicaid enrollment but 37% of federal and state Medicaid spending (Figure 5). The 5% of Medicaid enrollees who used HCBS comprised 26% of Medicaid spending and the 2% of Medicaid enrollees who used institutional LTSS comprised 13% of Medicaid spending. High per-person Medicaid spending among enrollees who use LTSS likely reflects the generally high cost of LTSS and more extensive health needs among such groups that lead to higher use of other health care services and drugs as well.

Medicaid Enrollees Who Used LTSS Had Disproportionately High Medicaid Spending in 2020

What Current Policy Questions Could Affect People Who Use Medicaid LTSS?

The COVID-19 pandemic greatly exacerbated shortages of LTSS workers, and many policy questions pertain to expanding the workforce caring for people who use Medicaid LTSS. Recent analysis on the Peterson-KFF Health System Tracker shows that, as of June 2023, the number of workers in LTSS settings was measurably lower than in early 2020. Shortages and high turnover among LTSS workers reflect demanding working conditions and relatively low wages. Workforce shortages have negative effects on the quality of care provided in institutional LTSS settings, and often result in people getting fewer hours or types of HCBS than they need. During the pandemic, states relied on family caregivers to help fill some of those gaps, but many pandemic-era policies will end in November 2023 if they are not transitioned into permanent policies.

The federal government may use its authority to require increased staffing for Medicaid LTSS, but it is not clear what the exact policies will be or how they will be implemented. The Biden Administration is expected to release a proposed rule that would increase nursing facility staffing levels in the near future, but it is unknown what the new staffing levels might be. KFF analysis finds that although nearly all facilities would meet a requirement of 2.5 or fewer HPRD and 85% of facilities would meet a requirement of 3.0 HPRD, but close to half (45%) of all nursing facilities would not meet a 3.5 HPRD requirements, and only 29% would meet an HPRD of 4.0. For HCBS, the Biden Administration recently released a proposed rule aimed at ensuring access to Medicaid services, which has several notable provisions aimed at addressing HCBS workforce challenges. Notably, the states would be required to report payment rates for certain HCBS, to demonstrate that payment rates are “adequate” to provide the level of services in enrollees’ personalized care plans, and to ensure at least 80% of payments are passed through to worker compensation for certain types of HCBS. Higher staffing levels could increase payment rates and spending for LTSS, but it’s unknown who would pay those additional costs.

Although most states have increased payment rates for LTSS, it is unclear where additional funding would come from to further increase payment rates and engage additional staff. In an FY 2022 survey conducted of Medicaid officials in all 50 states and D.C., 44 states implemented Medicaid rate increases in FY 2022 for nursing facilities. Similarly, a 2022 survey of Medicaid HCBS programs found that nearly all states reported experiencing shortages of direct care workers and many reported adopting policies to bolster the HCBS workforce, such as providing recruitment or retention bonuses and increasing provider payment rates. Many of the HCBS initiatives were funded by extra federal funding available through the American Rescue Plan Act, but as that funding expires, states will have to find alternative funding sources if they want to maintain spending levels.

Looking ahead, as the population continues to age, it is likely that more people will need Medicaid LTSS and that workforce challenges will persist. The data on LTSS users provide a rich source of information about who is using LTSS and this data note highlights how many people are currently using LTSS and what types of LTSS they are using.

Appendix Table 1: Medicaid Authorities for Home and Community-Based Services
State Plan Benefits
Home Health ServicesRequired
  • Part-time or intermittent nursing services, home health aide services, and medical supplies, equipment and appliances suitable for use in the home
  • At state option – physical therapy, occupational therapy, and speech pathology and audiology services
Home Health in T-MSIS
Personal CareOptional
  • Assistance with self-care (e.g., bathing, dressing) and household activities (e.g., preparing meals)
Personal Care in T-MSIS
Section 1915(i)Optional
  • Case management, homemaker/home health aide/personal care services, adult day health, habilitation, respite, day treatment/partial hospitalization, psychosocial rehabilitation, chronic mental health clinic services, and/or other services approved by the Secretary
  • Beneficiaries must be at risk of institutional care
  • Population targeting permitted
Personal Care or Other in T-MSIS
Section 1915(j)Optional
  • Allows people who are using HCBS to “self-direct” their services
  • Self-direction allows people to choose their own providers, establish payment rates, and allocated different services within a fixed budget
Home Health, Personal Care, or Other in T-MSIS
Community First Choice (1915(k))Optional
  • Attendant services and supports for beneficiaries who would otherwise require institutional care
  • Income up to 150% FPL or eligible for benefit package that includes nursing home services; state option to expand financial eligibility to those eligible for HCBS waiver
Personal Care or Other in T-MSIS
HCBS Waivers
Section 1915(c)Optional
  • Same services as available under Section 1915 (i)
  • Beneficiaries must otherwise require institutional care
  • Secretary can waive regular program income and asset limits
  • Cost neutrality required (average per enrollee cost of HCBS cannot exceed average per enrollee cost of institutional care)
  • Enrollment caps and waiting lists permitted
  • Geographic limits permitted
  • Population targeting permitted
1915(c) in T-MSIS*
Section 1115Optional
  • Secretary can waive certain Medicaid requirements and allow states to use Medicaid funds in ways that are not otherwise allowable under federal rules for experimental, pilot, or demonstration projects that are likely to assist in promoting program objectives
  • Federal budget neutrality required
  • HCBS enrollment caps permitted
1115 Waiver in T-MSIS*
NOTES: *Indicates the primary category in which KFF categorizes people who use HCBS, though not all states use all fields, so in some cases, many people will be grouped with home health or personal care even though they are using those services under another authority.

Methods

Methods

Data: The KFF State Health Facts on people who use LTSS use the T-MSIS Research Identifiable Demographic-Eligibility and Claims Files (T-MSIS data). Current State Health Facts include data from CY 2018, 2019, and 2020, but the methodology is intended to be applied in all years from 2016 onwards. Each year of data generally has multiple different releases and different releases will produce different counts of people using LTSS.

Overview of Methods: KFF included all people with at least one month of Medicaid enrollment who were using the following types of LTSS: institutional care (care provided in a nursing facility or intermediate care facility) and HCBS (home health, personal care, 1915(c) waiver, 1115 waiver, and “other” HCBS). Several summary level indicators categorize people who used specific types of LTSS as using only institutional care, only HCBS, or both types of care. KFF categorized claims using the type-of-service code from the first line claim, which was applied to the header claim in a merged dataset. More details are below.

Institutional LTSS: KFF defined enrollees who used institutional LTSS if they had a claim for care provided at either a nursing facility or intermediate care facility (see table below).

TOS_CD ValuesKFF Categorization Of Type of Institutional LTSS Description
9Nursing FacilityNursing facility services for individuals age 21 or older (other than services in an institution for mental disease)
45Nursing FacilityNursing facility services for individuals age 65 or older in institutions for mental diseases
46Intermediate Care FacilityIntermediate care facility (ICF)/Intermediate Care Facilities for individuals with Intellectual Disabilities (IIDICF)/Individuals with Intellectual Disabilities (IID) services
47Nursing FacilityNursing facility services, other than in institutions for mental diseases
59Nursing FacilitySkilled nursing facility services for individuals under age 21

Home and Community-Based Services: KFF used eligibility information and claims files to identify people who used HCBS.

  1. Enrollees who had at least one month of 1915(c) enrollment (WVR_1915C_MOS > 0) were identified as using 1915(c) waiver services.
  2. For people who did not have any enrollment in a 1915(c) waiver, KFF used the claims to determine whether they were using HCBS, including home health, personal care, or other HCBS (see table below).
  3. If enrollees used home health, personal care, or other HCBS; and were enrolled in an 1115 waiver (WVR_TYPE_CD equal to 01 or 29), and lived in a state that provided HCBS through an 1115 waiver, they were identified as using 1115 waiver services. From 2018-2020, the following states provided HCBS through an 1115 waiver: AZ, AR, CA, DE, HI, KS, MD, MN, NJ, NM, NY, RI, TN, TX, VT, and WA.
  4. For enrollees who used HCBS but were not enrolled in a 1915(c) or 1115 waiver as described above, KFF categorized the types of services they were using as home health, personal care, or other HCBS. Enrollees could use multiple types of HCBS in those categories. KFF compared the T-MSIS data to older HCBS surveys from 2018 and 2020 and identified discrepancies which suggest that the “other HCBS” group likely includes some people using HCBS through a 1915 state plan authority and some people using HCBS through a waiver in states that did not populate 1915(c) information on the eligibility file.
    • KFF counted only the enrollees with the top 50% of home health claims in each state as people who used home health to exclude people who used short-term home health. The cut-off point reflects the distribution of home health claim counts per enrollee in each state and was selected to calibrate counts such that the number of people using LTSS in each state was similar to the number identified in the older KFF surveys. The specific claim count cut-off varied by state and year. In 2020, the claim counts for the top 50% of people who used home health services in each state ranged from 1 claim in Utah to 28 claims in Massachusetts.
    • Similarly, KFF counted only enrollees with the top 75% of personal care claims as people who used personal care in each state. The claim count cut-off varies by state and year. In 2020, the claim counts for the top 75% of people who used personal care services in each state ranged from 2 claims in Illinois and Delaware to 126 claims in Massachusetts.
TOS_CD ValuesKFF Categorization Of Type of HCBS Description
16Home HealthHome health services — Nursing services
17Home HealthHome health services — Home health aide services
18Home HealthHome health services — Medical supplies, equipment, and appliances suitable for use in the home
19Home HealthHome health services — Physical therapy provided by a home health agency or by a facility licensed by the State to provide medical rehabilitation services
20Home HealthHome health services — Occupational therapy provided by a home health agency or by a facility licensed by the State to provide medical rehabilitation services
21Home HealthHome health services — Speech pathology and audiology services provided by a home health agency or by a facility licensed by the State to provide medical rehabilitation services
51Personal CarePersonal care services
62Other HCBSHCBS — Case management services
63Other HCBSHCBS — Homemaker services
64Home HealthHCBS — Home health aide services
65Personal CareHCBS — Personal care services
66Other HCBSHCBS — Adult day health services
67Other HCBSHCBS — Habilitation services
68Other HCBSHCBS — Respite care services
69Other HCBSHCBS — Day treatment or other partial hospitalization services, psychosocial rehabilitation services and clinic services (whether or not furnished in a facility) for individuals with chronic mental illness
70Other HCBSHCBS — Day Care
71Other HCBSHCBS — Training for family members
72Other HCBSHCBS — Minor modification to the home
73Other HCBSHCBS — Other services requested by the agency and approved by CMS as cost effective and necessary to avoid institutionalization
74Other HCBSHCBS — Expanded habilitation services — Prevocational services
75Other HCBSHCBS — Expanded habilitation services — Educational services
76Other HCBSHCBS — Expanded habilitation services — Supported employment services, which facilitate paid employment
77Other HCBSHCBS65-plus — Case management services
78Other HCBSHCBS-65-plus — Homemaker services
79Home HealthHCBS-65-plus — Home health aide services
80Personal CareHCBS-65-plus — Personal care services
81Other HCBSHCBS-65-plus — Adult day health services
82Other HCBSHCBS-65-plus — Respite care services
83Other HCBSHCBS-65-plus — Other medical and social services
144Other HCBSPayments to individuals for personal assistance services under 1915(j)
Notes: Only people who were not enrolled in either an 1915(c) or 1115 waiver were grouped into home health, personal care, and other HCBS based on the types of service they were using.

Key Limitations: For HCBS, where there are few established benchmarks on the number of people using services, KFF calibrated the selection criteria such that state-level counts were similar to the results from KFF’s HCBS survey. For most states, the approach yielded reasonable results but in several cases, there were significant discrepancies between the survey data and the T-MSIS output. Examples include Maine (where the 1915(c) enrollees appear to be showing up as people who used state plan services), Rhode Island (which has low counts of people using HCBS in all categories), and Wisconsin (where the 1915(c) enrollees are showing up as people who used other HCBS).

Do State Decisions to Prioritize Renewals for Medicaid Enrollees Who are Likely Ineligible Affect Early Disenrollment Rates?

Authors: Bradley Corallo, Jennifer Tolbert, and Robin Rudowitz
Published: Aug 11, 2023

As states resumed disenrolling people from Medicaid earlier this year as part of the “unwinding” of the continuous enrollment provision, early data have shown wide variation in disenrollment rates across states, ranging from 82% of completed renewals in Texas to 10% in Michigan. Although there are a range of state policy choices and other factors contributing to this variation, this policy watch examines which states are prioritizing renewals for enrollees that were flagged as likely ineligible and what effect that may have on disenrollment rates early in the unwinding period.

Prior to the start of the unwinding, many states flagged enrollees they deemed as likely ineligible. Although states could not disenroll anyone while the continuous enrollment provision, many states identified people as likely ineligible if there was information available showing the enrollee had a change in circumstance (e.g., aged out of children’s coverage), a change in income that would make them ineligible, or if they did not respond to renewal requests.

Early data from three states (Arizona, Idaho, and Pennsylvania) show that disenrollment rates for flagged enrollees are higher than for other enrollees. While several states publish total disenrollments among flagged enrollees, only Arizona, Idaho, and Pennsylvania publish enough information to be able to compare disenrollment rates for flagged enrollees to overall disenrollment rates. Based on early unwinding data, the disenrollment rate for flagged enrollees in each of these states exceeded the overall disenrollment rate by about 20 percentage points (Figure 1).

State-Reported Medicaid Disenrollments as a Share of Total Completed Renewals, Flagged Enrollees versus All Enrollees

Some states are prioritizing renewals for enrollees flagged as likely ineligible early in the unwinding period. States have taken different approaches to processing renewals during the unwinding period and some states have chosen to prioritize renewals for enrollees they identified as likely no longer eligible during the first six months. Based on unwinding plans submitted to the Centers for Medicare and Medicaid Services (CMS), a total of 17 states indicated that they would prioritize renewals for enrollees that the state flagged as likely ineligible at the start of their unwinding period (Figure 2). Of these, 11 states plan to work through renewals for flagged enrollees during the first two-to-six months of the unwinding, while the remaining six states will spread renewals for flagged enrollees over the first seven-to-nine months.

Timeframes for When States Plan to Conduct Renewals for Enrollees Flagged as "Likely Ineligible"

State approaches to renewing flagged enrollees may explain some – but not all – variation in disenrollment rates across states. Consistent with the data from Arizona, Idaho, and Pennsylvania showing higher disenrollment rates for flagged enrollees, states that prioritize renewals for flagged enrollees in the first two-to-six months have a higher median disenrollment rate (48%) compared to all other states with available data (33%). However, there is still considerable variation in disenrollment rates among these states, ranging from 82% in Texas to 27% in Maryland (Figure 3). Some variation may reflect how states identified likely ineligible enrollees and the share of flagged enrollees undergoing a renewal each month. Other state policies likely contribute to the variation as well, such as the approach states take to increase the number of automatic (or ex parte) renewals, how states use temporary flexibilities made available by the federal government during the unwinding, and the effectiveness of states’ outreach to enrollees.

Medicaid Disenrollments Rates Among States Renewing All Flagged Enrollees in the First 2-to-6 Months of the Unwinding Period

For states prioritizing likely ineligible enrollees, additional data may be required to identify potential reasons for high Medicaid disenrollments. Generally, states that heavily frontload renewals with flagged enrollees can be expected to have higher early disenrollment rates relative to states that spread out renewals for flagged enrollees over a longer period. But, over time, as these states work through renewals for flagged enrollees, disenrollment rates should moderate. However, if these higher disenrollment rates are because of other issues with a state’s renewal process, waiting several months to see whether disenrollment rates decrease could mean many eligible enrollees may lose coverage. More complete information on the reasons why individuals were flagged as likely ineligible, the share of flagged enrollees being renewed each month, as well as disenrollment data broken out by flagged enrollees versus all other enrollees could help identify the factors that underpin disenrollment rates early in the unwinding period.