Employers Use of Center of Excellence Programs as a Pathway for Behavioral Health Services

Published: Dec 8, 2023

A growing number of employer-sponsored health plans use Center of Excellence (COE) programs as a way to provide enrollees with specialized care for selected health services. COE programs designate providers or facilities based on cost and quality of the care they deliver. Providers participating in COE programs often specialize in selected services, and may provide additional case management and other support services for patients. Participating providers may be chosen based on the outcomes they achieve, such as lower readmission rates, or because they have earned additional accreditations. Plans vary in how they structure their COE programs, with some plans limiting coverage to providers participating in the COE, and others providing lower cost-sharing for enrollees to use a provider within the program. KFF’s 2023 Employer Health Benefits Survey asked employers about the COE programs included in their largest plans, including those focusing on behavioral health services (these include mental health and substance use disorder services).

In 2023, 34% of large firms (firms with 1,000 or more employees) reported sponsoring COE programs, with a higher share (45%) reported among the largest firms (firms with 5,000 or more employees). Firms may sponsor a variety of COE programs for different services. Many of these large firms (firms with 1,000 or more employees) with COE programs reported offering programs for behavioral health services. Among large firms with COE programs, 29% reported offering behavioral health services (this includes 25% offering mental health services and 25% offering substance use services). In other words, one out of ten large firms have a COE program that includes at least some behavioral health services (Figure 1). It should be noted that 13% of large firms with COE programs did not know whether their programs included any of the services listed in KFF’s EHBS survey (bariatric surgery, mental health, substance use, back or spine surgery, or joint replacement).

One-in-Ten Large Firms Have Center of Excellence Programs for Behavioral Health Services

Among large firms (firms with 1,000 or more employees) with a COE program, approximately one-quarter (27%) reported adding a new COE program within the last two years. However, it is not known whether these newly added services pertain to mental health or substance use treatment.

COE programs have often been used for high-cost specialized surgeries, such as transplant, spinal or bariatric surgeries. In recent years several insurers have established COE programs for mental health and substance use disorders, such as programs for autism, eating disorders and residential addiction services. COE programs may limit in-network coverage for select services to a smaller group of providers than participate in the provider network overall. While this may allow enrollees to access more providers who have additional specialized capacities, or achieved outcomes for specific services, enrollees may also face certain limitations. For example, with a limited number of providers, enrollees may have difficulty with timely access to services; and enrollees who prefer providers that do not participate in COE programs may face higher out-of-pocket costs.

A recent report to Congress on federal agency implementation of certain provisions of the Mental Health Parity and Addiction Equity Act (MHPAEA) noted a new enforcement focus on illegal exclusions of coverage for residential treatment and specific treatments for autism. This along with increased scrutiny of behavioral health provider network composition may have resulted in employers adding these services to their benefit packages. Center of Excellence programs might be one way employers have attempted to control costs and channel patients to specific behavioral health providers and residential treatment centers.

News Release

New KFF Survey Documents the Extent and Impact of Racism and Discrimination Across Several Facets of American Life, Including Health Care 

Survey Reveals That Many People Prepare for Health Care Visits By Expecting Insults and Taking Care with Their Appearance; Documents Mental and Physical Impacts Tied to Racism and Discrimination

Published: Dec 5, 2023

In a reflection of how pervasive racism and discrimination can be in daily life, a major new KFF survey shows that many Hispanic, Black, Asian, and American Indian and Alaska Native adults in the U.S. believe they must modify both their mindset and the way they look to stave off potential mistreatment during health care visits. KFF’s 2023 Survey on Racism, Discrimination and Health, the first in a series, also documents the pernicious association of racism and discrimination with worse health and well-being, including heightened tendencies toward feeling anxious, lonely, or depressed.

The large, nationally representative survey finds that among those who used health care in the past three years, six-in-10 (60%) Black adults, about half of American Indian and Alaska Native (52%) and Hispanic (51%) adults, and four-in-10 (42%) Asian adults say they prepare for possible insults from providers or staff and/or feel they must be very careful about their appearance to be treated fairly during health care visits at least some of the time. In addition, one-third of White adults report doing these things.

Such preparations, behaviors documented in other research arenas as “heightened vigilance,” likely are a response to past experience, the survey suggests. A third of adults overall report at least one of several negative experiences with a health care provider in the past three years, and many Black, Hispanic, Asian, and American Indian and Alaska Native adults say they were treated this way because of their race or ethnicity. 

The negative experiences asked about in the survey include a provider assuming something about them without asking; suggesting they were personally to blame for a health problem; ignoring a direct request or question; or refusing to prescribe pain medication they thought they needed. About a quarter (24%) of Black adults and one-in-five (19%) American Indian and Alaska Native adults say they experienced at least one of these and that their race or ethnicity was a reason why they were treated this way, as do 15% of Hispanic adults and 11% of Asian adults, compared with just 4% of White adults. 

For example, 22% of Black adults who were pregnant or gave birth in the past 10 years say they were refused pain medication they thought they needed, roughly twice the share of White adults with a pregnancy or birth experience (10%). 

Having a shared racial and ethnic background between provider and patient often is associated with more positive interactions, the survey finds.

The survey is part of a major effort by KFF to document the extent and implications of racism and discrimination across many aspects of American life, including people’s interactions with the U.S. health care system. It provides new data on individuals’ experiences with racism and discrimination and the impacts of these experiences on health and well-being. The survey also sheds light on how structural inequities in American society and experiences with racism and discrimination vary within racial and ethnic groups by factors such as income, gender, skin tone, age, and LGBT identity. Future KFF analyses and surveys will explore additional topics and delve deeper into results for specific populations.

 “While there have been efforts in health care for decades to document disparities and advance health equity, this survey shows the impact racism and discrimination continue to have on people’s health care experiences,” said KFF President and CEO Dr. Drew Altman. “And people in the survey reported that racism and discrimination have affected not only the care they get, but also their health and well-being,” he added.

 Experiences with racism and discrimination are prevalent in daily life, and are associated with worse health and well-being

The survey reveals that at least half of American Indian and Alaska Native (58%), Black (54%), and Hispanic adults (50%) and about four-in-10 Asian adults (42%) say they have experienced at least one type of discrimination in daily life at least a few times in the past year. These experiences include receiving poorer service than others at restaurants or stores; people acting as if they are afraid of them, or as if they aren’t smart; being threatened or harassed; or being criticized for speaking a language other than English. Black, Hispanic, American Indian and Alaska Native, and Asian adults are more likely to attribute these experiences to their race or ethnicity compared to their White counterparts.

Among Black adults, those with self-reported darker skin tones report more discrimination. Black adults who say their skin color is “very dark,” “dark,” (62%) or “medium” (55%) are more likely to report an experience with discrimination than Black adults who say their skin color is “very light” or “light” (42%).

Specific discrimination experiences also vary by gender, with Black men being the most likely to say people act as if they are afraid of them (27%) and Hispanic women most likely to say they are treated as if they are not smart (37%).

The survey suggests that experiences with racism and discrimination contribute to, or are associated with, reported worse health and well-being. People who experienced discrimination in their everyday lives at least a few times in the past year are more than twice as likely as those who report rarely or never experiencing discrimination to say that in the past year, they “always” or “often” felt anxious (40% vs. 14%), lonely (26% vs. 7%), or depressed (25% vs. 7%). These patterns are similar across racial and ethnic groups and persist even after accounting for other demographic characteristics.

A shared racial and ethnic background between provider and patient is associated with more positive interactions

The survey finds that Black, Hispanic, and Asian adults who have more health care visits with providers who share their racial and ethnic background report more frequent positive and respectful interactions. 

For example, Black adults who had at least half of recent visits with a provider who shares their background are more likely than those who have fewer of these visits to say that their doctor: explained things in a way they could understand (90% vs. 85%); involved them in decision making about their care (84% vs. 73%); understood or respected their cultural values or beliefs (84% vs. 76%); or asked them about their work, housing, or access to food or transportation (39% vs. 24%) during recent visits.

However, reflecting limited racial and ethnic diversity of the health care workforce, at least half of Black (62%), Hispanic (56%), AIAN (56%) and Asian (53%) adults who used health care in the past three years say that fewer than half of their visits were with a provider who shared their racial and ethnic background. In contrast, about three-quarters (73%) of White adults say that half or more of their visits were with a provider who shares their racial and ethnic background.

This survey is part of a broader body of work that builds on KFF’s commitment to amplifying the voices of marginalized populations, including the recently released 2023 KFF/LAT Survey of Immigrants, which provides insight into experiences of immigrants by different factors, including immigration status. The KFF Survey on Racism, Discrimination and Health is a probability-based survey conducted online and via telephone with a total of 6,292 adults, including oversamples of Hispanic, Black, and Asian adults conducted June 6-August 14, 2023. Respondents were contacted via mail or telephone; and had the choice to complete the survey in English, Spanish, Chinese, Korean, or Vietnamese. Survey methodology was developed by KFF researchers in collaboration with SSRS, and SSRS managed sampling, data collection, weighting, and tabulation. The margin of sampling error is plus or minus two percentage points for results based on the full sample; three percentage points for results based on Hispanic adults (n=1,775), Black adults (n=1,991) or White adults (n=1,725); five percentage points for results based on Asian adults (n=693); and eight percentage points for results based on American Indian and Alaska Native adults (n=267). 

Poll Finding

Survey on Racism, Discrimination and Health: Experiences and Impacts Across Racial and Ethnic Groups

Authors: Samantha Artiga, Liz Hamel, Ana Gonzalez-Barrera, Alex Montero, Latoya Hill, Marley Presiado, Ashley Kirzinger, and Lunna Lopes
Published: Dec 5, 2023

Overview

There have been increased attention and calls to address racism in the U.S. in recent years, particularly in the wake of the initial wave of the COVID-19 pandemic and the growth in recognition of the harms caused by systemic racism following the police killings of George Floyd and Breonna Taylor. As a result of historic and ongoing policies often rooted in discriminatory practices, there are stark differences in access to resources, opportunities, and power by race and ethnicity in the U.S., including access to safe housing and neighborhoods, economic and educational opportunities, and health care. Racism and discrimination at multiple levels, intentional or not, result in differences in experiences across many aspects of everyday life as well as in health care settings, which can negatively impact individuals’ health and well-being. Moreover, reflecting the intersectional nature of people’s identities, some individuals experience the combined impacts of racism and discrimination based on other factors such as gender or sexual orientation.

KFF’s 2023 Racism, Discrimination, and Health Survey is a major effort to document the extent and implications of racism and discrimination, particularly with respect to people’s interactions with the health care system. This large, nationally representative survey based on responses from over 6,000 adults provides new data on individuals’ experiences with racism and discrimination and the impacts of these experiences, both broadly and within racial and ethnic groups. It documents racial and ethnic differences in social and economic circumstances, interactions with the police, experiences with unfair treatment in daily life and while seeking health care, and the impacts of such experiences on health and well-being. Moreover, it examines how these inequities and experiences vary within racial and ethnic groups by factors such as income, gender, skin tone, age and LGBT identity where data allow. Future publications will delve deeper into results for specific populations and additional topics. This survey is part of a broader body of work that builds on KFF’s commitment to amplifying the voices of marginalized populations, including the recently released 2023 KFF/LA Times Survey of Immigrants, which provides insight into experiences of immigrants by different factors including immigration status. Having comprehensive and nuanced data to understand individuals’ experiences may inform and direct efforts to address disparities and advance equity.

This report is broadly divided into three sections. The first examines how social and economic circumstances and feelings of safety for Hispanic, Black, Asian, and American Indian and Alaska Native (AIAN) people in the U.S. differ from White individuals in ways that reflect underlying structural inequities. The second section examines experiences with interpersonal racism and discrimination in daily activities and impacts of these experiences on well-being and stress. The third section delves deeper into experiences with racism and discrimination in health care settings.

Acknowledgements:

KFF would like to thank the following individuals and organizations for their invaluable inputs, insights, and suggestions throughout the planning and dissemination of this survey project:

Mayra Alvarez, MHA, The Children’s PartnershipUché Blackstock, MD, Advancing Health EquityKimberly Chang, MD, MPH, Asian Health ServicesJuliet Choi, JD and Mary Smith, JD, Asian and Pacific Islander Health ForumGail Christopher, DN, National Collaborative for Health EquityCarmen Green, MPH, Reproductive Health ImpactDaniel Dawes, JD, Institute of Global Health Equity, Meharry Medical CollegeAdolph P. Falcón, MPP, National Alliance for Hispanic HealthSharlene Kemler, The Loveland FoundationPedro Martinez, MPH, UnidosUSAletha Maybank, MD, MPH, and Fernando De Maio, PhD, American Medical AssociationMeredith Raimondi, National Council of Urban Indian HealthA.C. Locklear, JD, National Indian Health Board

This work was supported in part by a grant from Yield Giving. KFF maintains full editorial control over all of its policy analysis, polling, and journalism activities.

Findings

Key Takeaways

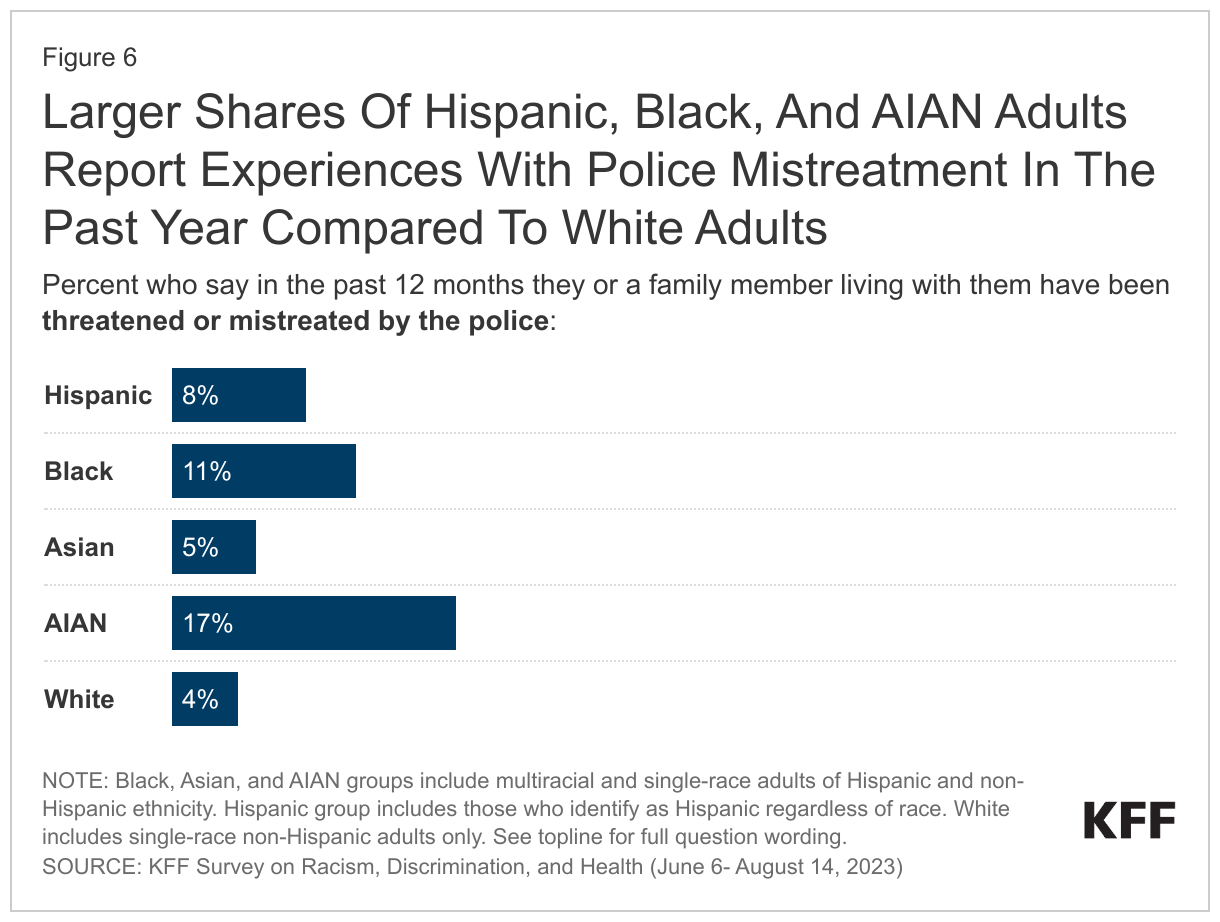
Reflecting ongoing residential segregation patterns rooted in contemporary and historic policies, Hispanic, Black, Asian, and AIAN adults feel less safe in their homes and neighborhoods and experience higher rates of police mistreatment compared to White adults. Hispanic, Black, Asian, and American Indian and Alaska Native (AIAN) adults are significantly less likely than White adults to say they feel “very safe” in their neighborhoods and in their homes, and about one in ten in each of these groups say they or a family member was a victim of violence in the past year, about twice the share of White adults who say so. About one in six AIAN adults and one in ten Black and Hispanic adults say they or a family member living with them have been threatened or mistreated by the police in the past year compared with 4% of White adults. Black and Hispanic adults who have self-reported darker skin tones report even higher rates of police mistreatment. Hispanic, Black, and AIAN adults also report disproportionate challenges with finances and employment due to underlying structural inequities, which are reflected in their daily worries and concerns. Among adults overall and across most racial and ethnic groups, having a strong network of local support is associated with increased feelings of safety in their homes and neighborhoods and reduced frequency of worries and concerns about meeting their family’s basic needs and health.

At least half of AIAN, Black, and Hispanic adults and about four in ten Asian adults say they have experienced at least one type of discrimination in daily life at least a few times in the past year, and they are more likely to say these experiences were due to their race or ethnicity compared to their White counterparts. These experiences include receiving poorer service than others at restaurants or stores, people acting as if they are afraid of them, people acting as if they are not smart, being threatened or harassed, or being criticized for speaking a language other than English. Overall, four in ten Black adults and about three in ten Hispanic, Asian, and AIAN adults say they have experienced at least one of these acts of discrimination in the past year and that their race or ethnicity was a reason for these experiences compared with just 6% of White adults.

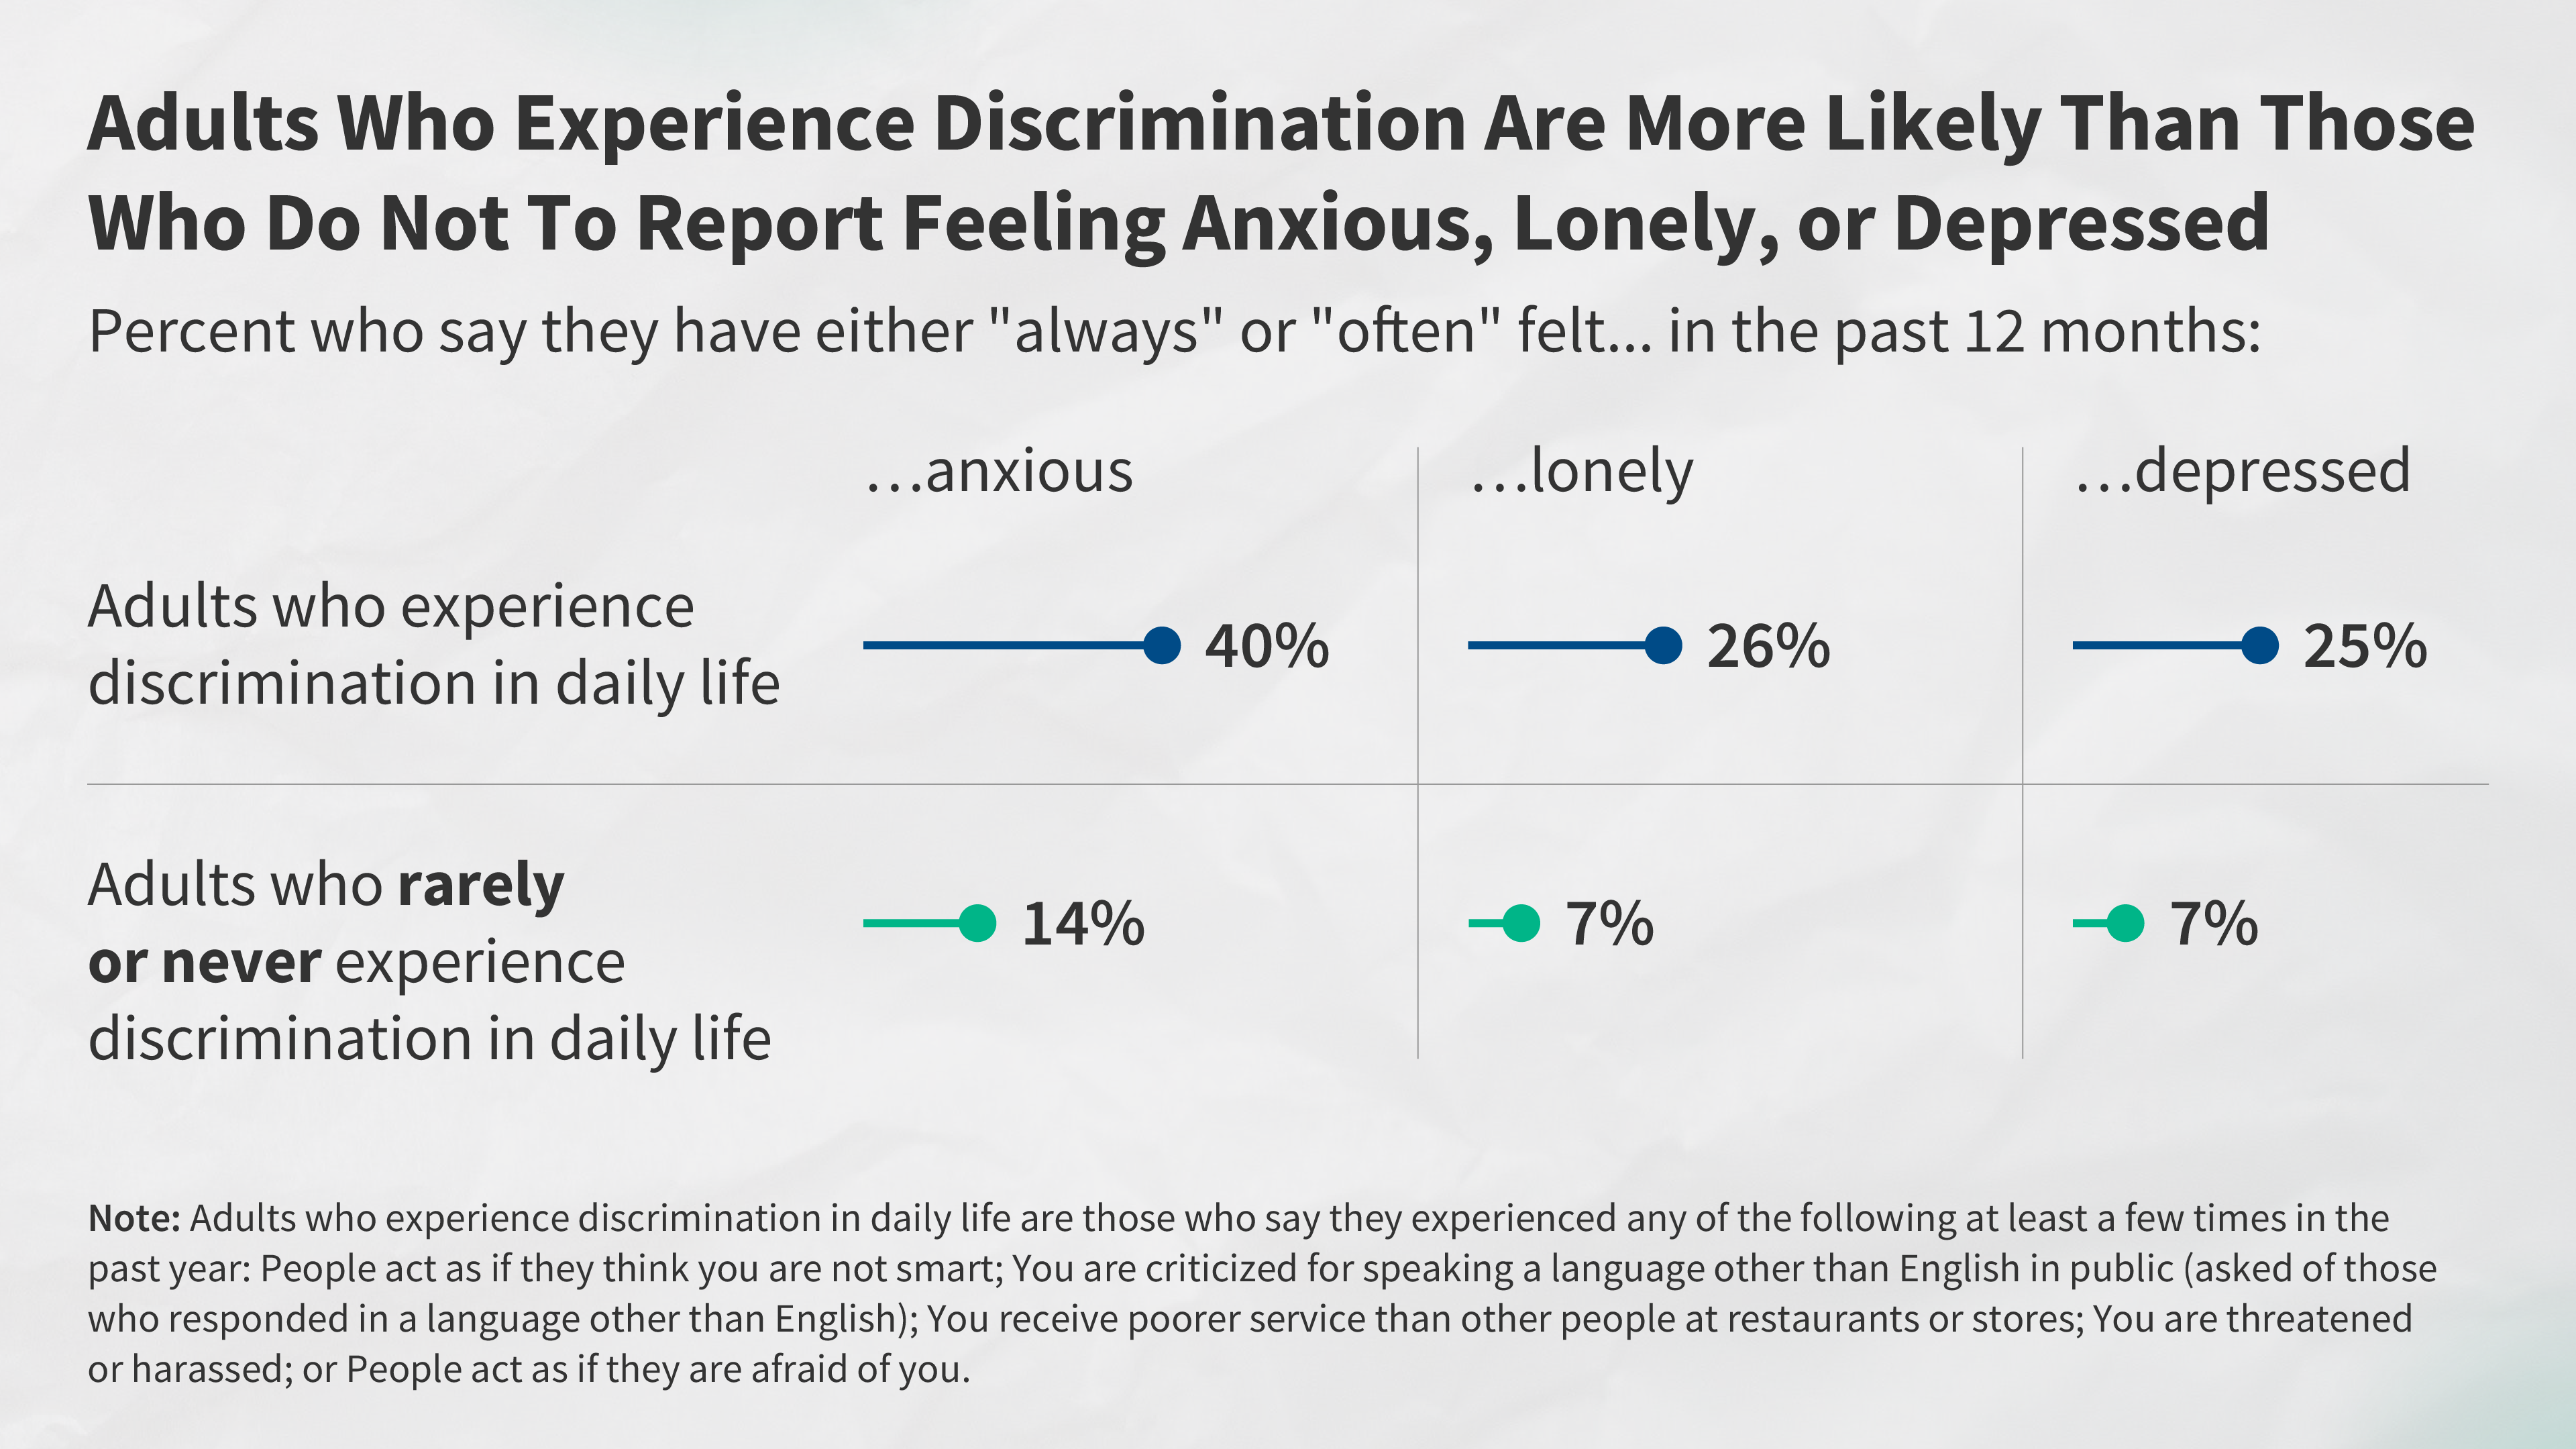
Highlighting the impacts of racism and discrimination on well-being and health, people who report experiences with discrimination in daily life are more likely than those who rarely or never experience discrimination to report adverse effects from worry or stress as well as regular feelings of loneliness, anxiety and depression. For example, those who experienced discrimination in their everyday lives are at least twice as likely as those who report rarely or never experiencing discrimination to say that in the past 30 days worry or stress has led to sleep problems (65% vs. 35%); poor appetite or overeating (52% vs. 20%) frequent headaches or stomachaches (41% vs. 15%); difficulty controlling their temper (34% vs. 11%); worsening of chronic conditions (19% vs. 9%); or an increase in their alcohol or drug use (19% vs. 6%). Similarly, those who have experienced discrimination are more likely than those who haven’t had these experiences to say they always or often felt anxious, lonely, or depressed in the past year. These patterns are similar across racial and ethnic groups and persist even when controlling for other factors like age, income, gender, and LGBT identity.

Black and AIAN adults report facing particularly high rates of discrimination, and among Black adults, those with self-reported darker skin tones are more likely to report discrimination experiences than those with lighter skin tones. AIAN and Black adults are the most likely to report an experience with discrimination in daily life asked about in the survey, with over half of both groups saying they experienced at least one of these types of discrimination at least a few times a year and about three in ten reporting experiencing two or more of these types of discrimination at least a few times a year. Among Black adults, those who say their skin color is “very dark,” “dark,” (62%) or “medium” (55%) are more likely to report an experience with discrimination compared with 42% of Black adults who say their skin color is “very light” or “light.”

Specific discrimination experiences also vary by gender, with Black men being the most likely to say people act as if they are afraid of them and Hispanic women most likely to say they are treated as if they are not smart. About a quarter (27%) of Black men say people acted afraid of them in the past year, as do 17% of Hispanic men and 17% of Black women, compared with about one in ten among Hispanic women and White and Asian adults of either gender. Conversely, the share who say they were treated as if they are not smart is higher among Hispanic women (37%) than Hispanic men (27%). Hispanic women are also more likely than Hispanic men to say they received poorer service than others in stores or restaurants at least a few times in the past year (29% vs. 21%). Discrimination experiences also vary by LGBT identity and age. About two-thirds (65%) of LGBT adults say they experienced at least one form of discrimination measured in the survey in the past year compared to four in ten (40%) non-LGBT adults, although there are no significant differences by race and ethnicity among LGBT adults. Similarly, over half (54%) of adults ages 18-49 report these experiences compared to three in ten (29%) of those ages 50 and over.

Experiences with unfair treatment extend into health care, with Black, Hispanic, AIAN, and Asian adults reporting higher levels of unfair treatment when seeking health care than their White counterparts, and Black women report even higher rates of unfair treatment. About one in five Black adults (18%) and about one in ten Hispanic (11%), Asian (10%) and AIAN (12%) adults say they have been treated unfairly or with disrespect by a health care provider in the past three years because of their race or ethnic background compared with 3% of White adults. Among Black adults, women are more likely than men to say they were treated unfairly by a health care provider because of their racial or ethnic background (21% vs. 13%).

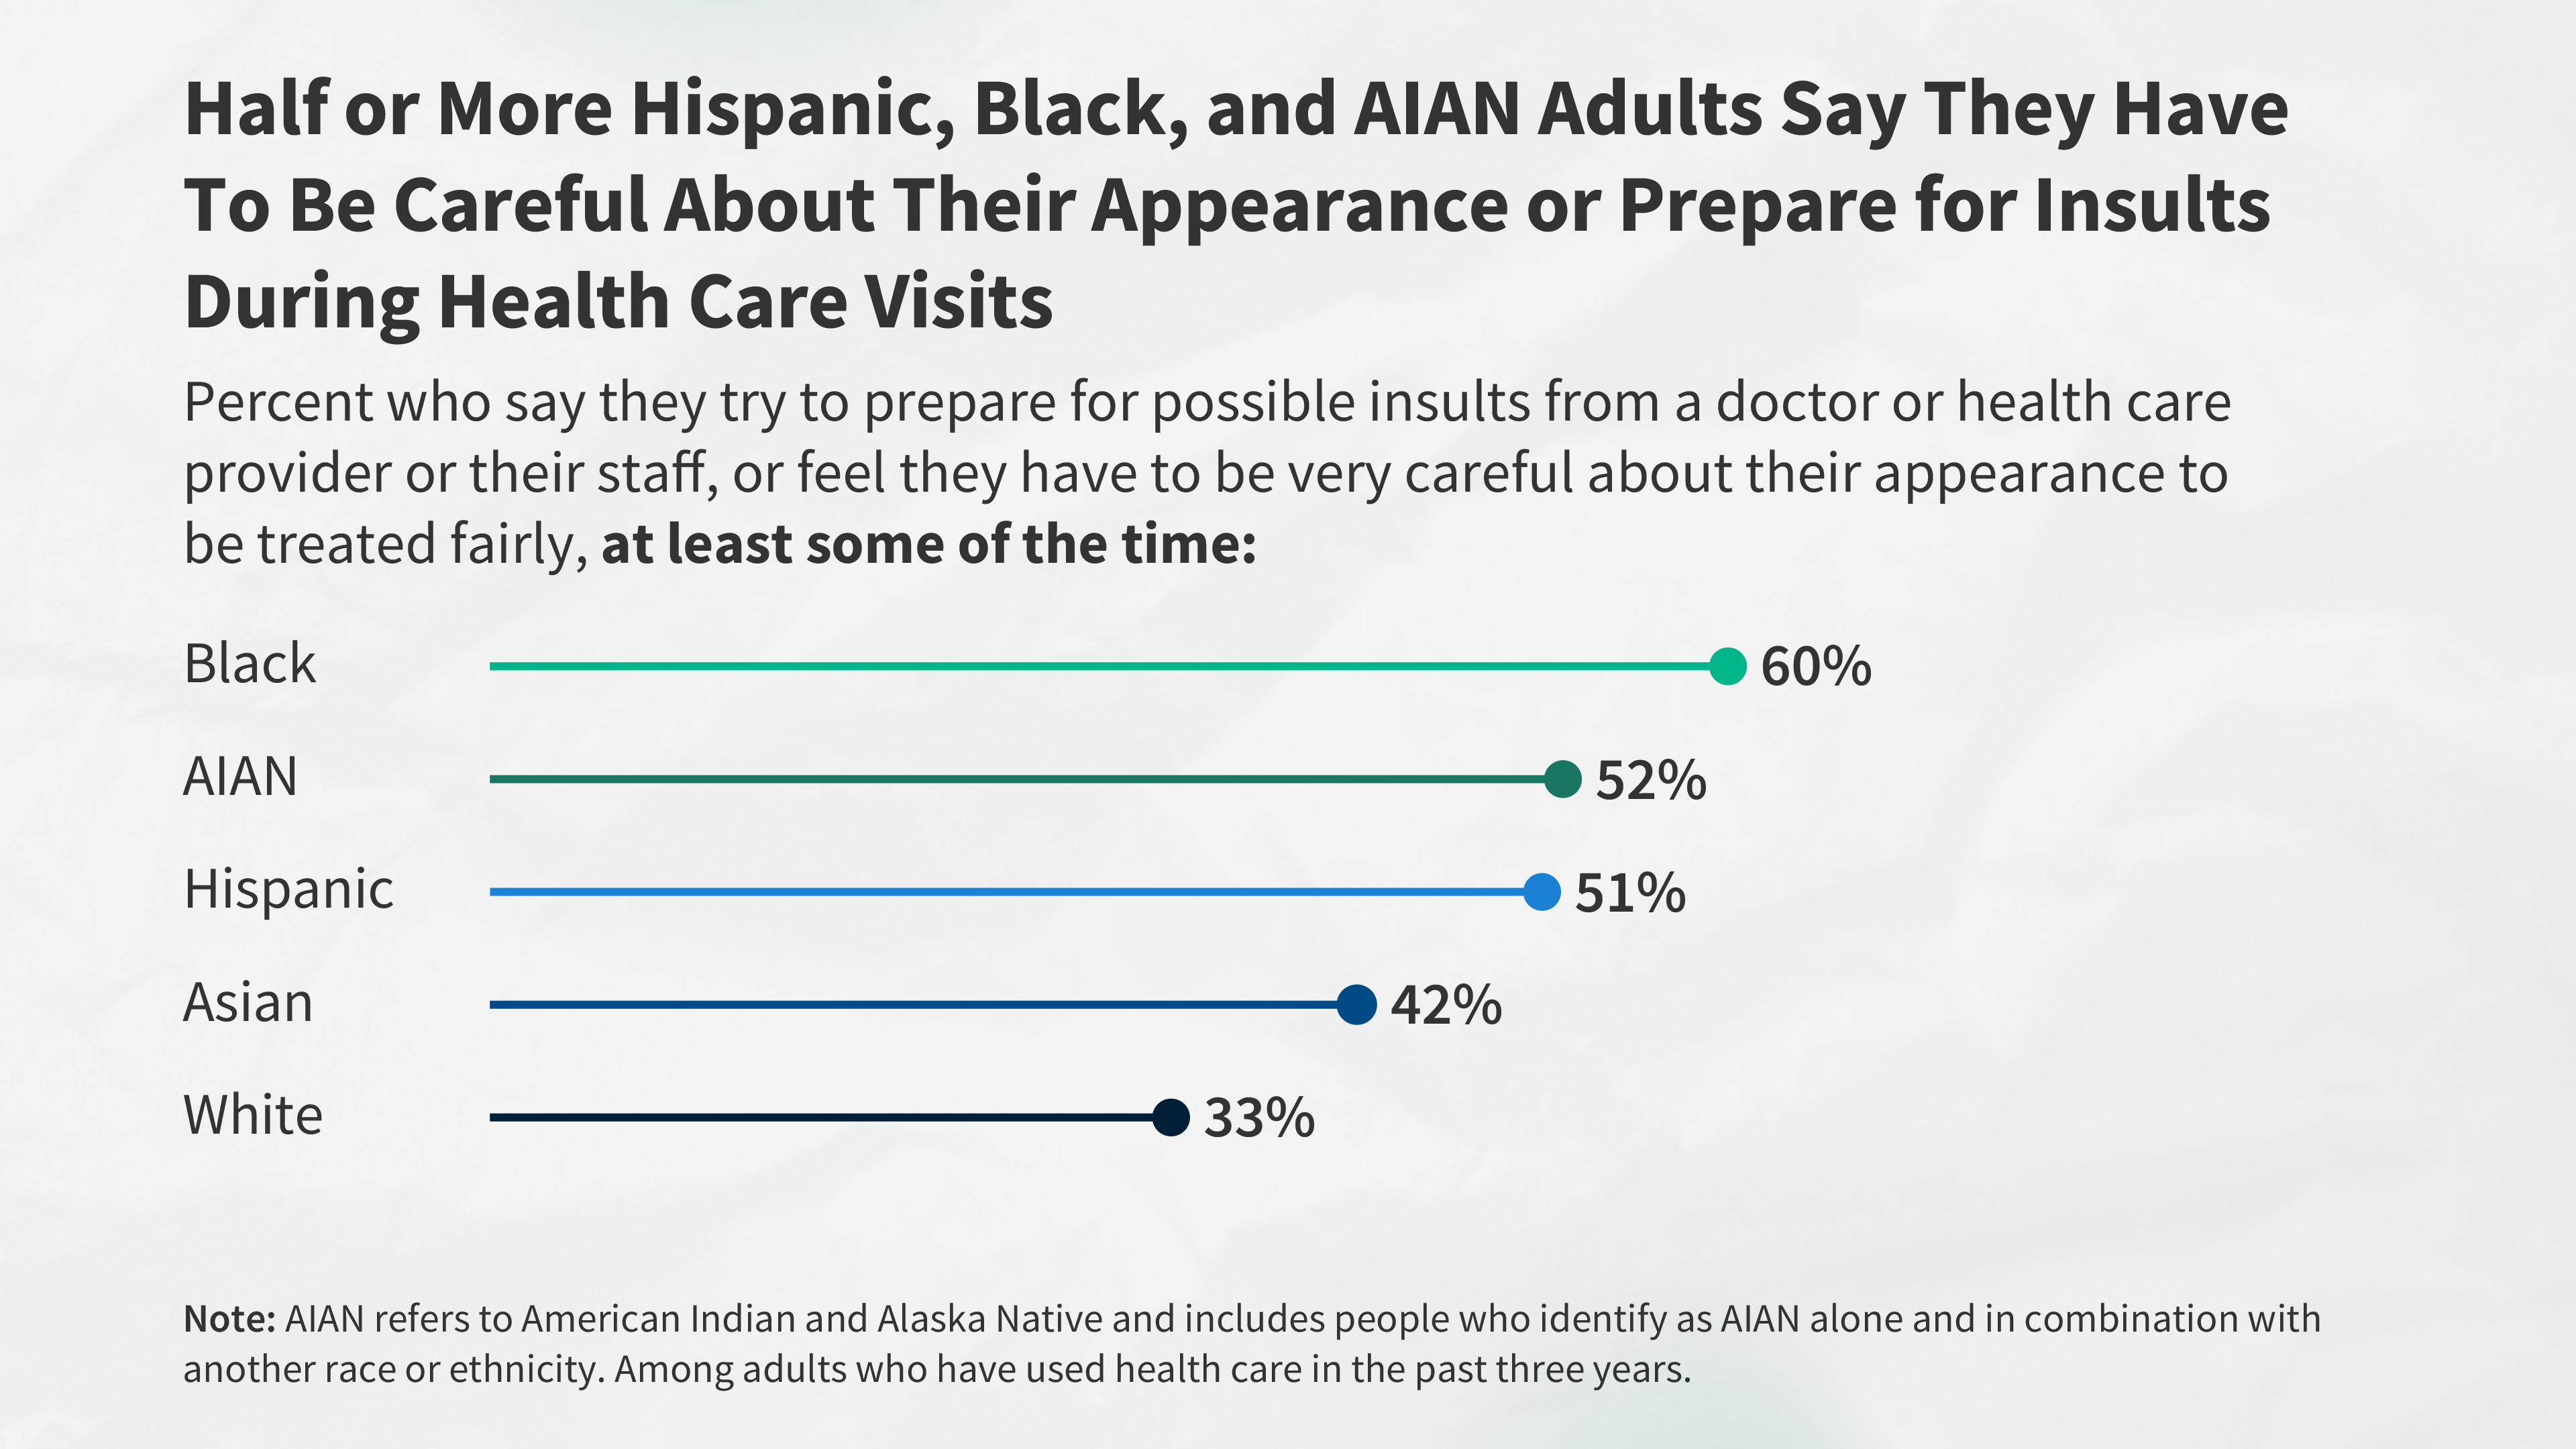
Reflecting experiences with unfair treatment, large shares of Black, AIAN, Hispanic, and Asian adults say they prepare for possible insults or feel they must be very careful about their appearance to be treated fairly during health care visits. Six in ten (60%) Black adults, about half of AIAN (52%) and Hispanic (51%) adults, and four in ten (42%) Asian adults say they prepare for possible insults from providers or staff and/or feel they must be very careful about their appearance to be treated fairly during health care visits at least some of the time compared with one in three (33%) White adults.

Having providers with a shared background matters, as Black, Hispanic, and Asian adults who have more health care visits with providers who share their racial and ethnic background report more frequent positive and respectful interactions. Reflecting limited racial and ethnic diversity of the health care workforce, most Hispanic, Black, Asian, and AIAN adults say that fewer than half of their health care visits in the past three years were with a provider who shared their racial or ethnic background. However, the survey shows how provider racial and ethnic concordance can make a difference in patient interactions. For example, Black adults who had at least half of recent visits with a provider who shares their background are more likely than those who have fewer of these visits to say that their doctor explained things in a way they could understand (90% vs. 85%), involved them in decision-making about their care (84% vs. 73%), understood and respected their cultural values or beliefs (84% vs. 76%), or asked them about social and economic factors (39% vs. 24%) during recent visits.

A third of adults overall report at least one of several negative experiences with a health care provider in the past three years, and many Black, Hispanic, Asian, and AIAN adults say they were treated this way because of their race or ethnicity. These negative experiences include a provider assuming something about them without asking, suggesting they were personally to blame for a health problem, ignoring a direct request or question, or refusing to prescribe pain medication they thought they needed. About a quarter (24%) of Black adults and one in five (19%) AIAN adults say they experienced at least one of these negative experiences and that their race or ethnicity was a reason why they were treated this way, as do 15% of Hispanic and 11% of Asian adults, compared with just 4% of White adults.  Notably, 22% of Black adults who were pregnant or gave birth in the past ten years say they were refused pain medication they thought they needed, roughly twice the share of White adults with a pregnancy or birth experience (10%).

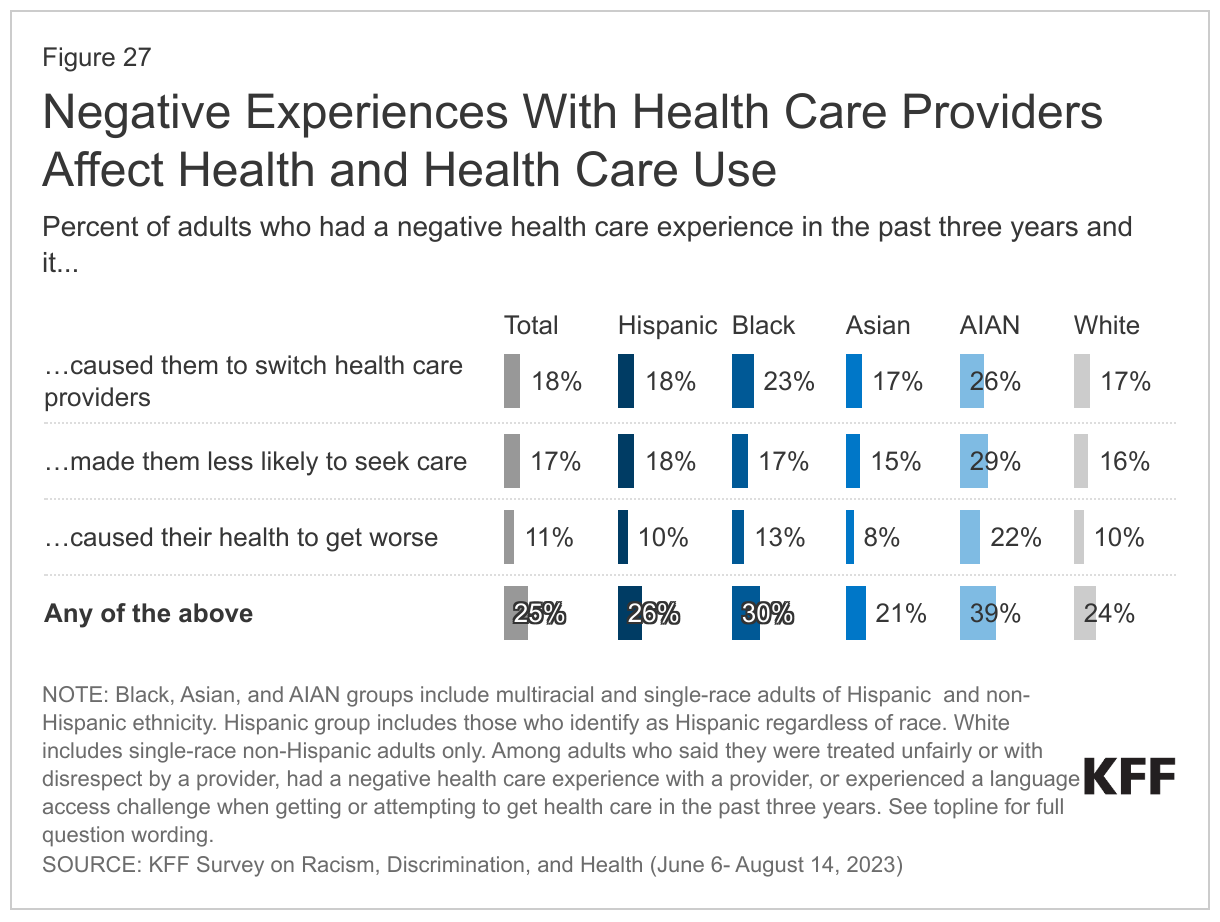
Negative experiences with health care providers as well as language access challenges have consequences for health and health care use. Among adults who used health care in the past three years, one in four (25%) say they had a negative experience (including being treated unfairly or with disrespect, a negative provider interaction, or difficulty with language access), and it led to worse health, being less likely to seek care, and/or switching providers. AIAN and Black adults are more likely than White adults to say they had a negative experience and it contributed to at least one of these consequences.

Implications

The survey reveals that, in wake of the initial COVID-19 pandemic and amid ongoing economic challenges and political division within the U.S., people’s experiences in their everyday lives and in health care settings often vary starkly by race and ethnicity, highlighting the ongoing impacts of racism and discrimination within the health care system and more broadly. The survey shows that many challenges are shared across all adults, including White adults, but that Hispanic, Black, Asian, and AIAN adults face disproportionate challenges and higher rates of unfair treatment due to their race and ethnicity, which have implications for health and well-being. The survey data identify areas for increased attention, resources, and initiatives to address these challenges and disparities, such as mechanisms to improve social and economic circumstances and provide safer communities as well as to address ongoing bias and discrimination, particularly in health care. The survey results also highlight factors that mitigate some of these challenges, including having strong local support networks and more health care visits with providers who have a shared racial and ethnic background. They also illustrate opportunities to increase respectful and positive provider interactions that can support high-quality and culturally competent care. Addressing the challenges identified in the survey is important not only from an equity standpoint but also for improving the nation’s overall health and economic prosperity.

Notes on Racial and Ethnic Groups Included in This Report

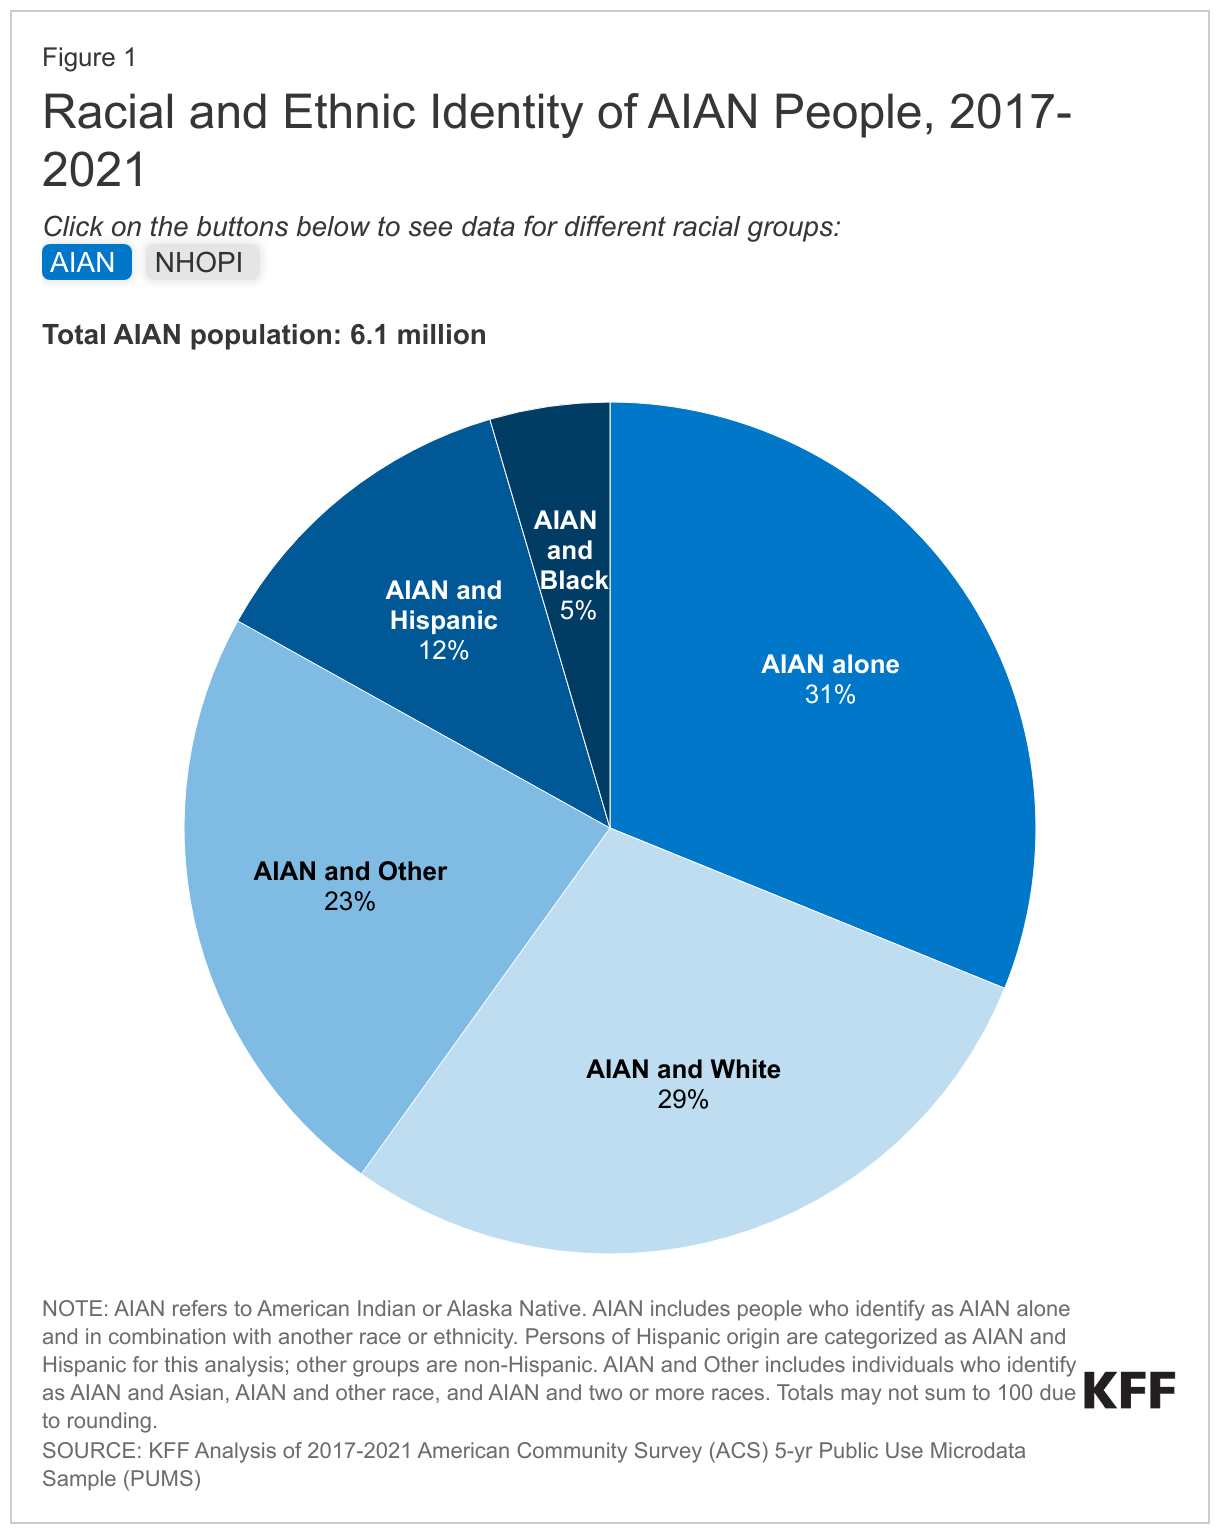
Many surveys and data analyses classify individuals into non-overlapping racial and ethnic categories using single-race and Hispanic ethnicity categories and grouping those who identify as more than one race into a “multiracial” or “other” category. To allow for better representation of experiences of the growing shares of people who identify as multiracial, this report uses an “alone or in combination” approach for classifying individuals so that they are represented within each racial and ethnic group with which they identify, resulting in overlapping racial and ethnic categories. For example, responses from someone who identifies as both Black and Asian are included in the results for both Black adults and Asian adults, and responses from someone who identifies as American Indian and Hispanic are included in the results for both AIAN adults and Hispanic adults. The exception is reporting on White adults, who in this report are defined as those who identify as non-Hispanic and select White as their only race. See Appendix 1 for more details.

The sample sizes for Hispanic adults and Black adults (more than 1,750 each) allow for detailed subgroup reporting, including by age, gender, income, LGBT identity, and urbanicity. The sample of Asian adults (693) allows for a narrower set of demographic breaks within this group. Because of the smaller sample of AIAN adults (267), results are shown for this population as a whole and demographic breaks are not provided.

In addition, the sample of AIAN adults has some limitations and caution should be exercised when interpreting these results (see Appendix 2 for a description of these limitations, adjustments made to make the sample more representative, and considerations for data interpretation). Given ongoing concerns about data erasure and invisibility of smaller populations, including Indigenous people, KFF has decided to include results for the AIAN population in this report despite these limitations.

Section 1: Racial and Ethnic Differences in Social and Economic Factors, Safety, and Police Interactions

Historic and contemporary policies contribute to ongoing structural inequities in access to opportunities and resources, shaping where people live, their education and employment, and other factors that influence their daily lives, experiences, and interactions with systems and institutions. For example, historic housing policies, including discriminatory practices such as redlining, have ongoing impacts today, including residential segregation of Black people into urban areas with fewer resources and educational opportunities and higher rates of poverty, violence and crime. The survey shows racial and ethnic differences in finances and employment, feelings of safety and exposure to violence, and interactions with the police that reflect these types of underlying inequities.

Finances and Employment

Black, AIAN, Hispanic, and Asian adults face increased challenges across an array of social and economic factors relative to White adults, which reflect underlying structural inequities, including access to employment and educational opportunities. About three in ten AIAN (29%) and Black (28%) adults, one quarter (24%) of Hispanic adults, and one in five (20%) Asian adults say they or a family member experienced problems getting or keeping a job in the past year compared with 15% of White adults (Figure 1). Just under half of AIAN (48%) and Black (45%) adults say they or a family member had a problem paying for food, housing, transportation, or other necessities in the past year, nearly twice the share of White adults (27%) who report these issues. Similarly, about one in five Black (22%) and AIAN (22%) adults and one in seven Hispanic adults (15%) say they have difficulty affording their bills each month, larger than the share of White adults who say this (11%). In contrast, paying for health care is a common challenge across racial and ethnic groups. At least one in five adults across racial and ethnic groups say they or a family member living with them had a problem paying for health care in the past 12 months. Hispanic adults are more likely than White adults to report problems affording health care in the past year (27% vs. 23%), reflecting that they have a higher rate of being uninsured.

Larger Shares Of Black, AIAN, And Hispanic Adults Report Financial And Employment Challenges Compared To White Adults

Differences in finances and employment may also reflect bias and discrimination, with Black and AIAN adults more likely than White adults to report unfair treatment in the workplace and in housing. About four in ten Black (42%) and AIAN (42%) adults say they have ever been paid less than other people doing the same job compared with a third (33%) of White adults (Figure 2). Black adults are also more likely than White adults to say they have ever been fired, denied a job, or denied a promotion for unfair reasons (27% vs. 20%), and Black and AIAN adults are more likely than White adults to say they have ever been evicted or denied housing (14% and 13% vs. 5%).

Black And AIAN Adults Are More Likely Than White Adults To Report Issues With Unfair Treatment In The Workplace, Housing

Safety, Exposure to Violence, and Police Interactions

Reflecting ongoing residential segregation patterns rooted in historic and contemporary policies, Black, Hispanic, Asian, and AIAN adults say they feel less safe in their homes and neighborhoods compared to White adults. Large majorities of adults across racial and ethnic groups report feeling at least somewhat safe in their neighborhoods. However, Black, Hispanic, Asian, and AIAN adults are less likely than White adults to say they feel “very safe.” Roughly half of each group say they feel very safe in their neighborhood compared to about two-thirds of White adults (Figure 3). Similarly, vast majorities of adults across racial and ethnic groups say they feel at least somewhat safe in their homes, but the shares of Black, Hispanic, and AIAN adults (61% each) and Asian adults (55%) who report feeling very safe in their home are lower than the share of White adults who say this (73%).

Hispanic, Black, Asian, And AIAN Adults Are Less Likely Than White Adults To Report Feeling Very Safe Where They Live

Having a strong network of local support is associated with increased feelings of safety. Specifically, adults who say they have “a lot” or a “fair amount” of family members or friends living near them who they can ask for help or support are more likely to say they feel “very safe” in their home or neighborhood than those who have “just a few” or no family members or friends nearby that they can ask for support. For example, among Asian adults, about six in ten (62%) of those with “a lot” or a “fair amount” of family and friends nearby say they feel very safe in their home compared with about half (47%) of those with “just a few” or no close by family and friends available for support (Figure 4). Among adults overall and across most racial and ethnic groups, this relationship between having a local support network and feelings of safety remains significant even after controlling for other demographic characteristics including education, income, gender, LGBT identity, and age.1 

Having A Local Support Network Is Associated With Increased Feelings of Safety

While few adults overall say they or a family member have been a victim of violence, the shares are higher among Hispanic, AIAN, Black, and Asian adults as well as those living in urban areas. About one in ten Hispanic (12%), AIAN (11%), Black (9%), and Asian adults (9%) say they or a family member in their household was a victim of an act of violence such as a robbery, carjacking, or shooting in the past year, about twice the share of White adults (5%) who report the same (Figure 5). Among all adults, those living in urban areas are more likely than those who live in suburban and rural communities to say they or a family member have been a victim of violence in the past year, with about one in ten Hispanic (13%), Black (12%), and White (9%) adults living in urban areas reporting this. Among those living in rural communities, however, Black adults are significantly more likely than White adults to say they or someone in their family have been a victim of violence in the past year (9% vs. 2%).

Hispanic, Black, Asian And AIAN Adults Are More Likely Than White Adults To Report Having Recently Been A Victim Of Violence

Beyond differences in safety and experiences with violence, Black, AIAN, and Hispanic adults are more likely than White adults to say they or a family member experienced recent mistreatment by the police, particularly Black and Hispanic adults with self-reported darker skin tones. About one in six AIAN adults (17%) and about one in ten Black (11%) and Hispanic (8%) adults say they or a family member living with them have been threatened or mistreated by the police in the past year compared with 4% of White adults (Figure 6). For Black and Hispanic adults, the shares reporting recent police mistreatment are larger among those with self-described darker skin tones compared to those with lighter skin tones. For example, 12% of Black adults with self-described “very dark,” “dark,” or “medium” skin tones say they or a family member living with them have been threatened or mistreated by police compared to 7% of those with lighter skin tones. Similar differences occur among Hispanic adults between those with darker vs. lighter skin tones (10% vs. 5%).

Larger Shares Of Hispanic, Black, And AIAN Adults Report Experiences With Police Mistreatment In The Past Year Compared To White Adults

Daily Worries and Concerns

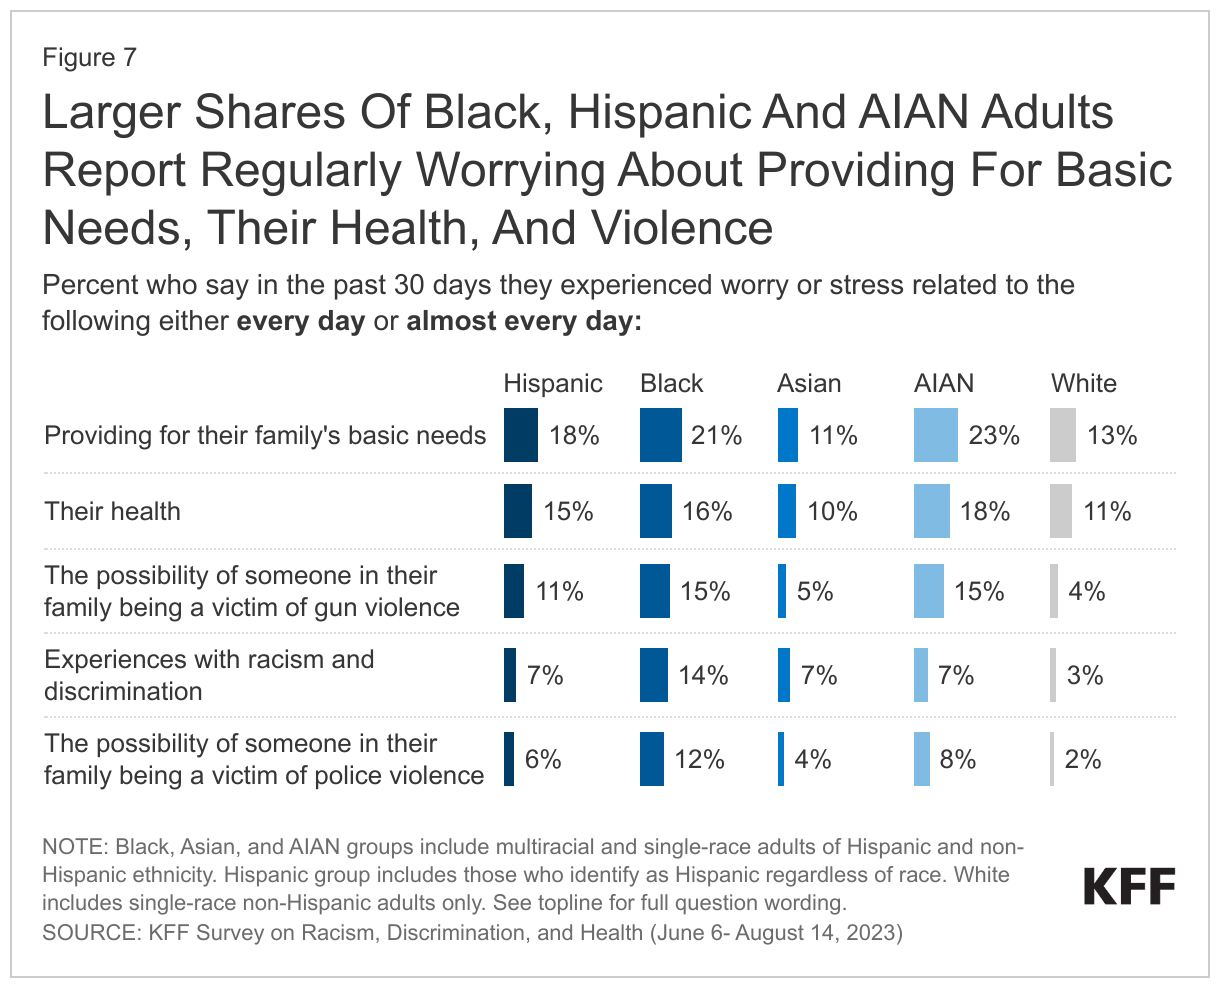
People’s frequent daily worries and concerns reflect these racial and ethnic differences in finances and employment, safety, and police interactions. About one in five AIAN (23%), Black (21%), and Hispanic (18%) adults say that in the past 30 days they experienced worry or stress related to providing for their family’s basic needs either “every day” or “almost every day” compared to fewer White adults (13%) (Figure 7). Similarly, larger shares of AIAN, Black, and Hispanic adults compared to White adults say they experienced daily or near-daily worry about experiences with racism and discrimination and the possibility of someone in their family being a victim of gun or police violence. AIAN, Black, and Hispanic adults are also more likely to say they frequently experienced worry or stress related to their health in the past 30 days compared to their White counterparts. Having a strong local support network, as measured by having at least a “fair amount” of friends and family living nearby who you can ask for help or support, mitigates the frequency of worries and concerns about providing for basic needs and health among adults overall and across most racial and ethnic groups.2 

Larger Shares Of Black, Hispanic And AIAN Adults Report Regularly Worrying About Providing For Basic Needs, Their Health, And Violence

Section 2: Experiences with Discrimination in Daily Life and Their Impacts on Wellbeing and Stress

Black, AIAN, Hispanic, and Asian adults are more likely to report certain experiences with discrimination in daily life compared with their White counterparts, with the greatest frequency reported among Black and AIAN adults. For example, about one-third of Black adults (35%) and about a quarter of AIAN (28%), Hispanic (25%), and Asian adults (25%) say that they received poorer service than other people at restaurants or stores at least a few times in the past year, all higher than the share of White adults who say the same (16%) (Figure 8). Similarly, about four in ten AIAN adults (42%) and one-third (33%) of both Black and Hispanic adults say that people have acted as if they think they are not smart at least a few times in the past year, higher than the one-quarter (26%) of White adults who say so. In addition, Asian (17%) and Black adults (16%) are somewhat more likely than White adults (13%) to say they were threatened or harassed at least a few times in the past year. Further, about one in five Black (21%) and AIAN adults (19%) as well as 13% of Hispanic adults say people acted as if they were afraid of them at least a few times in the past year, compared to 9% of White adults. Among those who completed the survey in a language other than English, one-quarter (24%) say they were criticized for speaking another language in public in the past year, including 28% of Hispanic adults who responded in Spanish. Cumulatively, at least half of AIAN (58%), Black (54%), and Hispanic adults (50%) say they have experienced one of these forms of discrimination at least a few times in the past year, as do four in ten Asian adults (42%). About four in ten (38%) White adults also say they have experienced at least one of these types of discrimination in the past year.3 

AIAN, Black, Hispanic, And Asian Adults Are More Likely Than White Adults To Report Experiences Of Discrimination

Black, AIAN, Hispanic, and Asian adults are more likely than White adults to report experiencing more than one of these types of discrimination. Three in ten Black (31%) and AIAN adults (28%) and about one in four Hispanic (26%) and Asian adults (25%) say they experienced at least two of these types of discrimination at least a few times in the past year, all higher than the share of White adults who say so (18%) (Figure 9).

Black, AIAN, Hispanic, And Asian Adults Are More Likely Than White Adults To Report Experiences With Multiple Types Of Discrimination In Daily Life

When discrimination in daily life occurs, Black, Hispanic, AIAN, and Asian adults are far more likely than White adults to say their race or ethnicity was a factor in these experiences. Among those who say they experienced at least one form of discrimination measured in the survey, most Black, Hispanic, AIAN, and Asian adults say their race or ethnicity was a major or minor reason they were treated this way, compared to a much smaller share of White adults. Overall, four in ten Black adults (40%) and about three in ten Hispanic (30%), AIAN (30%), and Asian adults (28%) say they experienced at least one of these acts of discrimination in the past year and say their race or ethnicity was at least a minor reason for these experiences. By contrast, only 6% of White adults report this (Figure 10).

Large Shares Of Black, Hispanic, AIAN, And Asian Adults Report Experiencing Discrimination Based On Their Race Or Ethnicity

Across racial and ethnic groups, reports of experiences with discrimination in daily life are particularly high among younger adults and LGBT adults. There is a strong relationship between age and reports of discrimination in daily life, with a majority of adults ages 18-29 (62%) and about half of 30-49 year-olds (49%) reporting such experiences compared to smaller shares of those ages 50-64 (36%) and 65 and over (22%) (Figure 11). This pattern is consistent across racial and ethnic groups. Similarly, about two-thirds (65%) of LGBT adults say they experienced at least one form of discrimination measured in the survey at least a few times in the past year compared to four in ten non-LGBT adults (40%). Among LGBT adults, there are no differences by race and ethnicity, with about two-thirds of Hispanic (69%), Black (64%), and White (64%) LGBT adults reporting discrimination experiences in the past year.

Across Racial And Ethnic Groups, Younger Adults More Likely To Report Experiences With Discrimination In Their Daily Lives

A somewhat larger share of women compared to men report at least one of these discrimination experiences, but this overall pattern masks some differences in individual measures. For example, a larger share of women compared to men say they were treated as if they were not smart in the past year (33% vs. 23%), while men are more likely than women to say people acted as if they were afraid of them (14% vs. 9%).

The combination of race, ethnicity, and gender also highlights disproportionate discrimination for certain groups. For example, 27% of Black men say people acted afraid of them in the past year, as do 17% of Hispanic men and 17% of Black women. For Hispanic women and White and Asian adults of either gender, these shares are about one in ten. Conversely, the share who say they were treated as if they are not smart is higher among Hispanic women (37%) than Hispanic men (27%). Hispanic women are also more likely than Hispanic men to say they received poorer services than others in stores or restaurants at least a few times in the past year (29% vs. 21%) (Figure 12).

Shares Reporting Certain Discrimination Experiences Vary By Gender And Race, Ethnicity

Black adults who self-describe as having darker skin color report more experiences of discrimination in their everyday lives compared to those with lighter skin color. Most Black adults who say their skin color is “very dark” or “dark” (62%) or “medium” (55%) report at least one of these experiences of discrimination, compared with 42% of Black adults who say their skin color is “very light” or “light.” For example, four in ten Black adults who say their skin color is “very dark” or “dark” (42%) say they have received poorer service at restaurants or stores in the past year, compared with about a quarter of those who say their skin color is “very light” or “light” (27%). Black adults with self-reported darker skin color are also more likely to say people acted as if they were afraid of them in the past year compared with those with lighter skin color (25% vs. 18%) (Figure 13).

Black Adults With Self-Reported Darker Skin Color Are More Likely To Report Discrimination In Their Daily Lives

Among Black adults, those with higher educational attainment report more experiences with discrimination compared to their counterparts with lower educational attainment. Black adults with a four-year college degree are more likely to report experiences of discrimination in their everyday lives compared to those without college education (59% vs. 52% respectively) (Figure 14). Specifically, about four in ten Black adults with a college degree (42%) say they received poorer service at restaurants or stores at least a few times in the past year compared with one-third of Black adults without a college degree (33%). Black adults with a college degree are also more likely to report people acting as if they are afraid of them compared to those without a four-year degree (28% vs. 19%). These findings are consistent with previous research, and may reflect increased exposure to perceived discrimination among those with higher incomes and education levels as well as having greater awareness of racism and therefore greater ability to identify it in different aspects of life.

Among Black Adults, College Graduates More Likely To Report Some Experiences With Discrimination In Their Daily Lives

Relationship Between Discrimination Experiences and Well-being

Racism is an underlying driver of health disparities and repeated and ongoing exposure to perceived experiences of racism and discrimination can increase risks for poor health outcomes. Research has shown that the exposure to racism and discrimination can lead to negative mental health outcomes and certain negative impacts on physical health, including depression, anxiety, and hypertension. Studies also show that perceived discrimination can negatively impact healthy behaviors by increasing smoking and alcohol use and lowering adherence to medical guidance and preventative screenings.

Among all U.S. adults and across racial and ethnic groups, those who report experiences with discrimination in daily life are more likely than others to report adverse effects from worry or stress such as appetite and sleep issues, increased substance use, and worsening of chronic health conditions. Adults who report experiences with at least one type of discrimination in daily life as measured in the survey are more likely than adults who “rarely” or “never” experienced such discrimination to report certain adverse effects of worry or stress. For example, those who experienced discrimination in their everyday lives are more likely than others to say that in the past 30 days worry or stress has led to sleep problems (65% vs. 35%); poor appetite or overeating (52% vs. 20%) frequent headaches or stomachaches (41% vs. 15%); difficulty controlling their temper (34% vs. 11%); worsening of chronic conditions (19% vs. 9%); or an increase in their alcohol or drug use (19% vs. 6%) (Figure 15). Overall, eight in ten (79%) adults who experienced discrimination in the past year say they have had at least one of these adverse effects of worry and stress, compared to about half (47%) of adults who say they rarely or never had these experiences in the past year. These patterns are similar across racial and ethnic groups. While other underlying factors beyond discrimination may contribute to these differences, the relationship between adverse effects of stress and experiences with discrimination remains significant even after controlling for other demographic characteristics including education, income, gender, LGBT identity, and age.4 

Adults Who Experience Discrimination Are More Likely Than Those Who Do Not To Report Adverse Effects Of Worry And Stress

Adults who report discrimination experiences in daily life are more likely than those who say they rarely or never experience discrimination to report always or often feeling lonely, depressed, or anxious in the past 12 months. Among those with discrimination experiences, four in ten (40%) say they “always” or “often” felt anxious in the past year, compared to 14% of adults who rarely or never experience such discrimination. Those with discrimination experiences in their daily life are more than three times as likely as others to say they always or often felt lonely (26% vs. 7%) or depressed (25% vs. 7%) in the past year (Figure 16). These patterns are similar across racial and ethnic groups and persist even after controlling for other demographic characteristics including education, income, gender and age.5 

Adults Who Experience Discrimination Are More Likely Than Those Who Do Not To Report Feeling Anxious, Lonely, Or Depressed

Section 3: Experiences in Health Care Settings

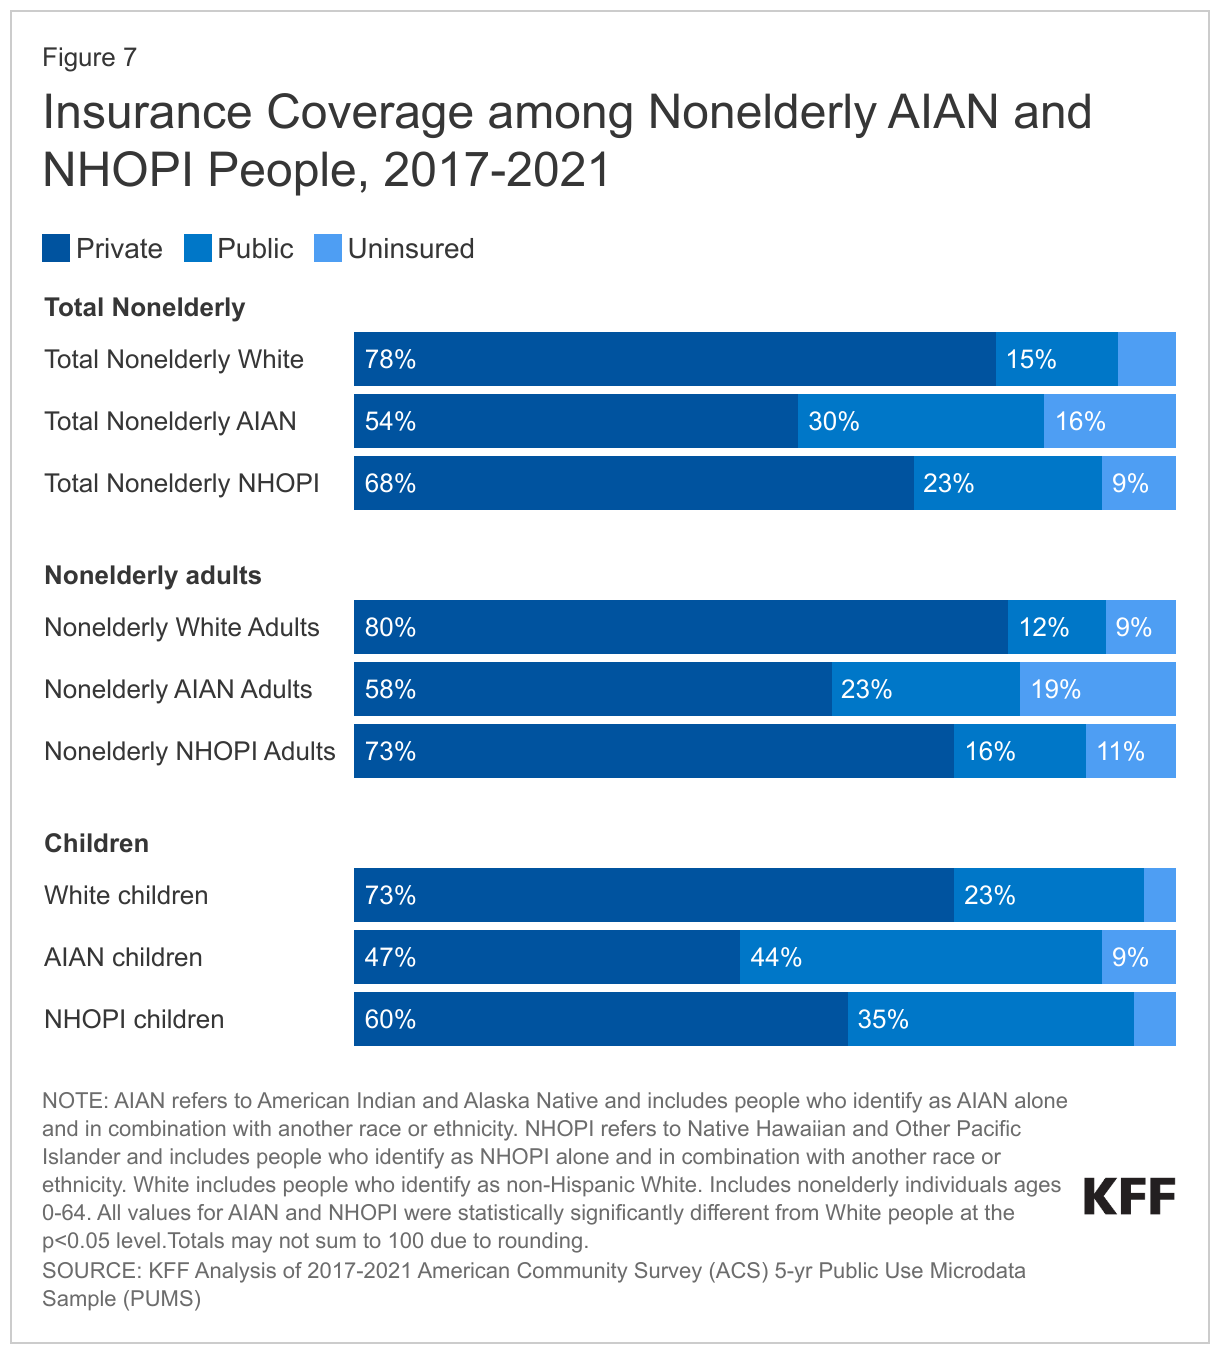
Reflecting underlying structural inequities in the U.S., there are ongoing racial and ethnic disparities in health and health care. AIAN, Hispanic, and Black people have higher uninsured rates compared to their White counterparts and face other increased barriers to accessing care. Among adults in the survey, Hispanic (20%), AIAN (14%), and Black (10%) adults are more likely to report being uninsured compared to White (6%) adults. However, beyond differences in the ability to access care, the survey highlights differences in experiences within the health care system, including interactions with providers, experiences with unfair treatment, and the consequences of these experiences.

Provider Interactions

Among those who used health care within the past three years, most adults across racial and ethnic groups report having positive and respectful interactions with their health care providers most of the time. Health care that is respectful and responsive to individual preferences, needs, and values is an important component of health care quality and equitable health care. Among those who used health care in the past three years, large shares say that their health care providers explained things in a way they could understand (89%), respected their cultural values and beliefs (84%), involved them in decision-making about their care (81%), and spent enough time with them (76%) most of the time or every time during visits. Across racial and ethnic groups, at least two-thirds say their provider did each of these things at least most of the time.

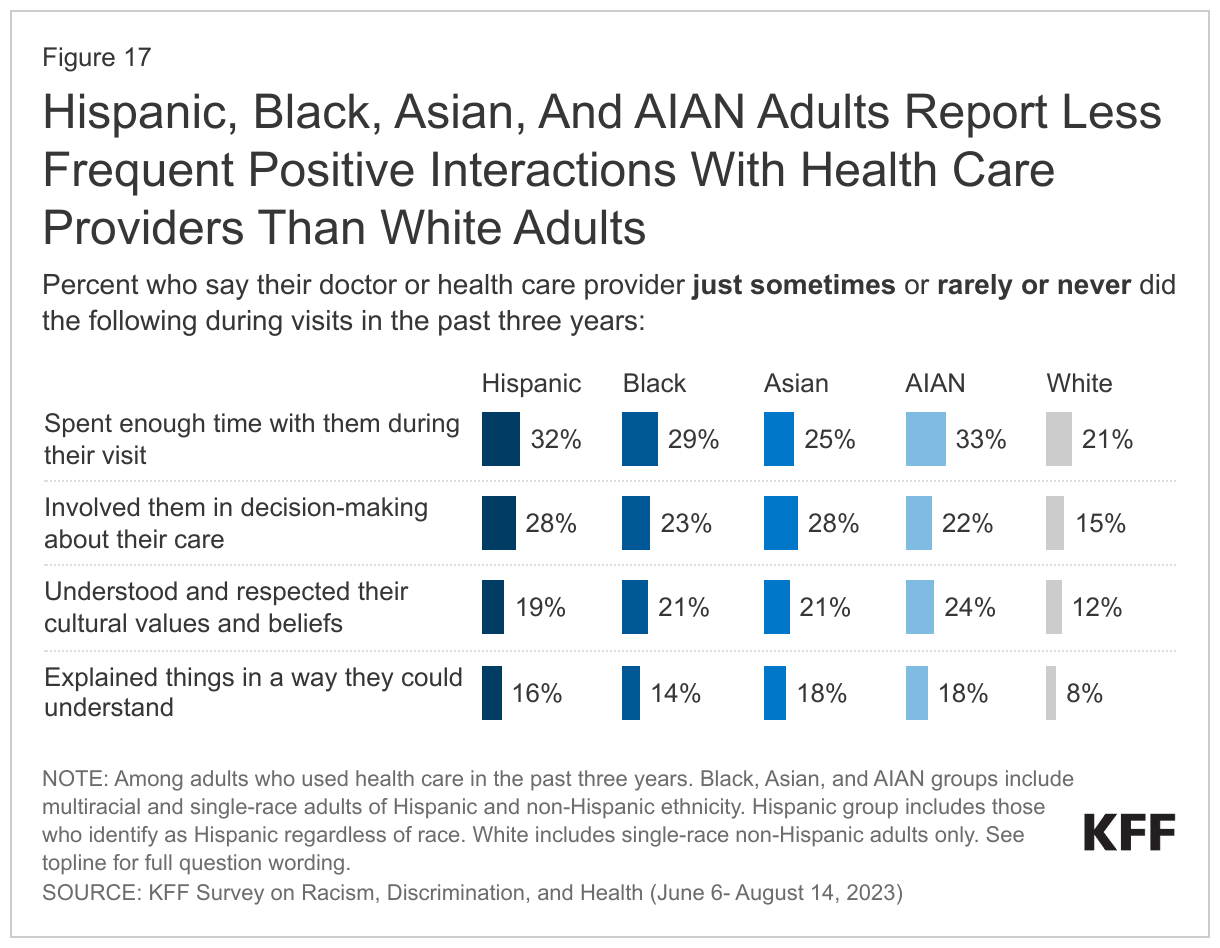
However, Hispanic, Black, Asian, and AIAN adults report having these positive and respectful interactions with health care providers less often than White adults. For example, AIAN (18%), Asian (18%), and Hispanic (16%) adults are about twice as likely as White adults (8%) to say their health care providers explained things in a way they could understand just some of the time, rarely, or never in the past three years (Figure 17). Similarly, about one in four AIAN adults (24%) and about one in five Black (21%), Asian (21%) and Hispanic (19%) adults say their health care providers understood and respected their cultural beliefs just some of the time, rarely, or never compared with about one in ten White adults (12%). These groups also are more likely than their White counterparts to say their providers did not frequently involve them in decision-making about their care during their visits in the past three years. Many of these racial and ethnic differences persist among adults with higher incomes and those with health coverage. Among Hispanic adults there also are some differences by English proficiency. For example, Hispanic adults who have limited English proficiency are about twice as likely as those who are English proficient to say they their providers rarely or never involved them in decision-making about their care in the past three years (16% vs. 9%).

Hispanic, Black, Asian, And AIAN Adults Report Less Frequent Positive Interactions With Health Care Providers Than White Adults

Few adults across racial and ethnic groups say a health care provider frequently asked them about their work, housing situation, or access to food or transportation in the last three years. While health coverage and access to health care shape health, social and economic factors, such as employment, housing, food access, and transportation also play a major role. Research indicates that screening for social and economic risks can positively impact health, and there are growing efforts among some providers focused on serving low-income populations to screen for social risks and needs. However, just over one in four (27%) adults who used health care in the last three years say a health care provider asked about their work, housing situation, or access to food or transportation at least most of the time during visits (Figure 18). Overall, and among Hispanic and Asian adults, lower income adults are more likely than higher income adults to say a provider asked about these factors most of the time or every time, but majorities of lower income adults still say this happens just some of the time, rarely, or never.

Few Adults Say a Health Care Provider Frequently Asked Them About Social or Economic Factors

Reflecting limited racial and ethnic diversity of the health care workforce, Black, Hispanic, AIAN, and Asian adults are less likely than White adults to say most of their recent health care visits were with a provider who shares their racial and ethnic background. At least half of Black (62%), Hispanic (56%), AIAN (56%) and Asian (53%) adults who used health care in the past three years say that fewer than half of their visits were with a provider who shared their racial and ethnic background (Figure 19). In contrast, about three-quarters (73%) of White adults say that half or more of their visits were with a provider who shares their racial and ethnic background.

Most Hispanic, Black, Asian, And AIAN Adults Say Less Than Half of Recent Health Care Visits Were With a Provider Who Shared Their Racial And Ethnic Background

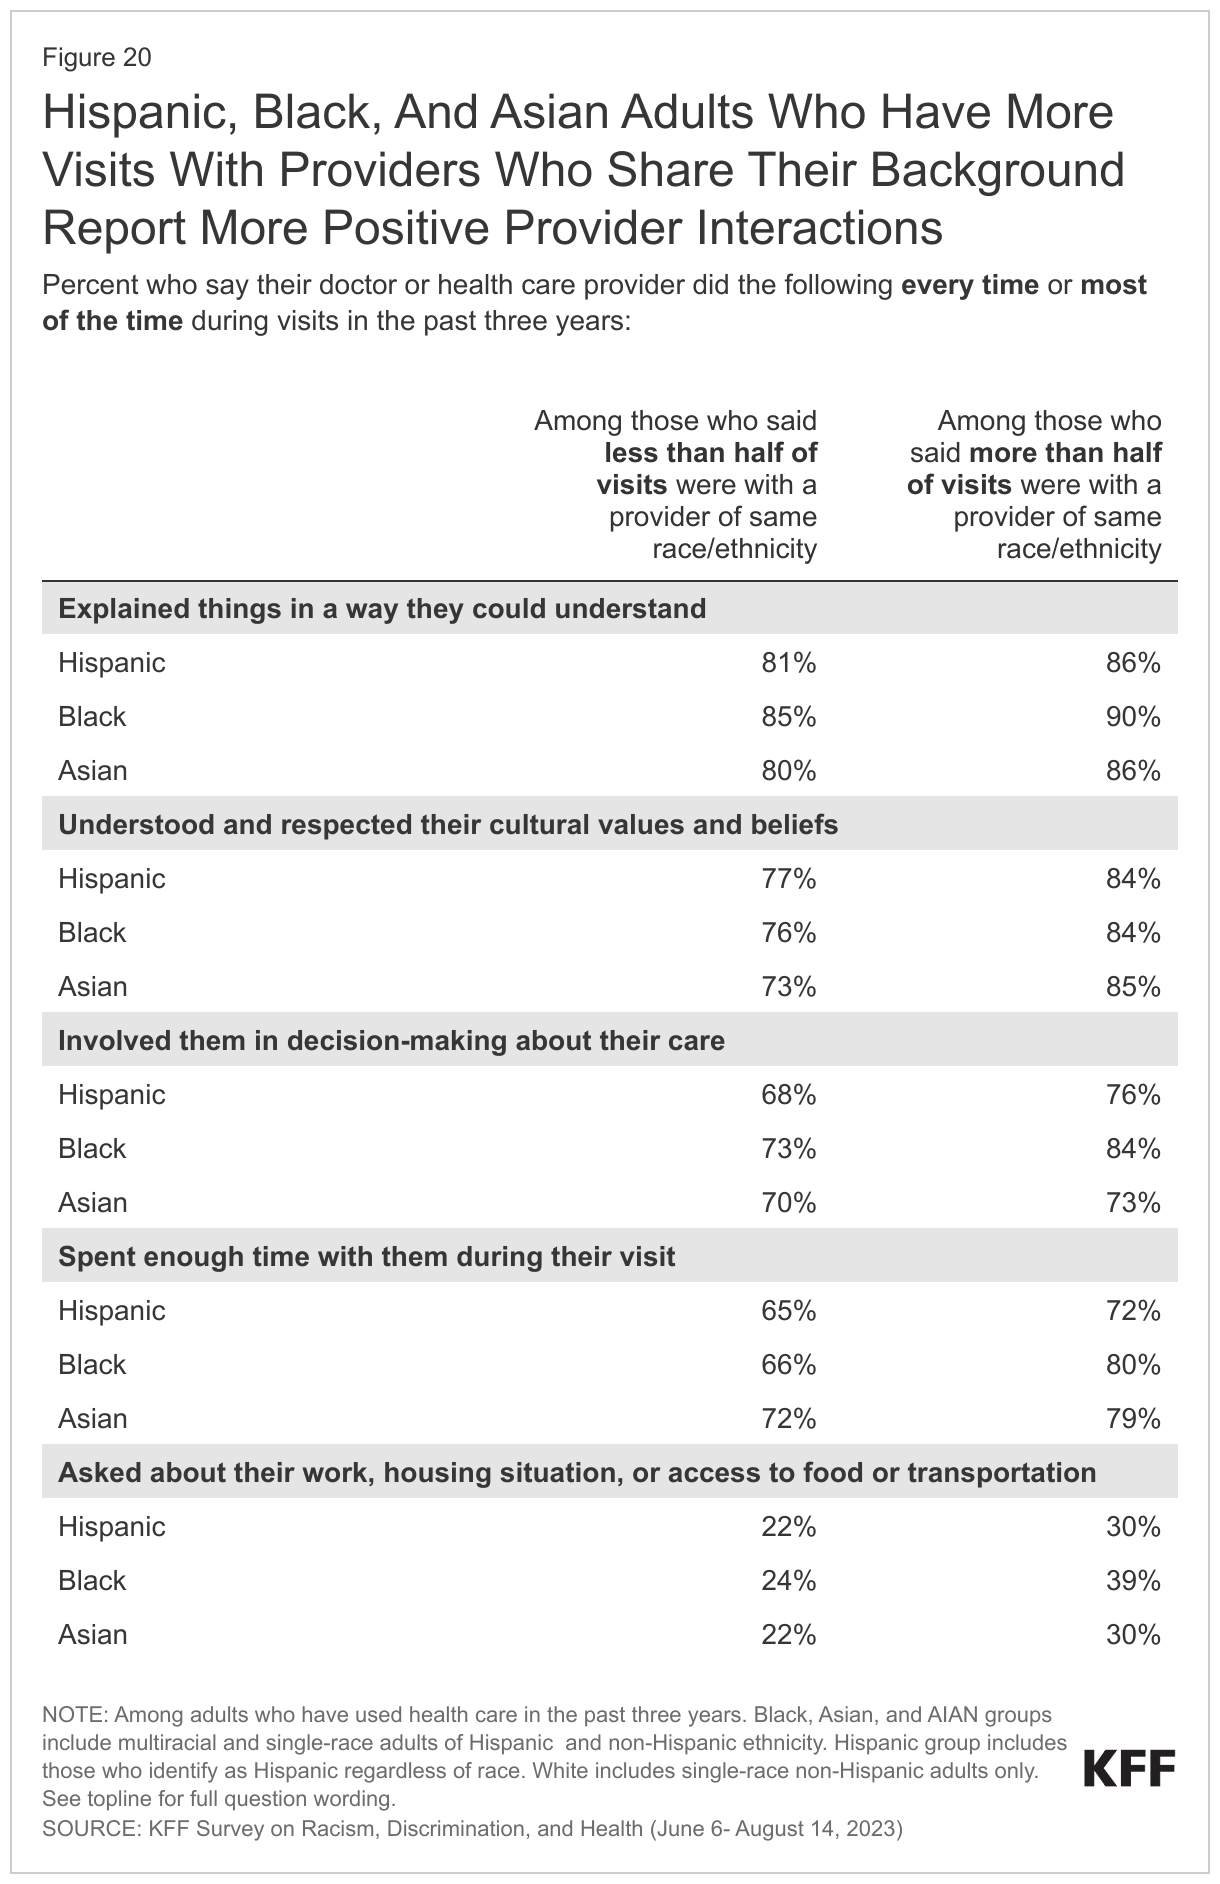
Black, Hispanic and Asian adults who have at least half of their visits with providers who share their racial or ethnic background report having more frequent positive and respectful interactions with providers. For example, among those who used health care in the past three years, Black adults who had at least half of recent visits with a provider who shares their background are more likely than those who have fewer of these visits to say that their doctor explained things in a way they could understand (90% vs. 85%), involved them in decision making about their care (84% vs. 73%), understood or respected their cultural values or beliefs (84% vs. 76%), or asked them about social and economic factors (39% vs. 24%) at least most the time (Figure 20). Patterns are similar for Hispanic adults. Asian adults who had half or more visits with a provider who shared their racial or ethnic background are more likely than those who had fewer such visits to say their provider understood and respected their cultural values and beliefs every time or most of the time.

Hispanic, Black, And Asian Adults Who Have More Visits With Providers Who Share Their Background Report More Positive Provider Interactions

Despite these differences, few Black, Hispanic, Asian, and AIAN adults say they think they either would or do receive better care from health care providers who share their racial and ethnic background. About a quarter of Black (27%), Hispanic (26%), and Asian adults (24%) and about one in five AIAN adults (19%) say they think they would receive better care from doctors who share their racial or ethnic background, while majorities in each of these groups say they don’t think the race or ethnicity of their provider makes much difference in the quality of care they receive. Other research has shown an association between patients and providers having shared racial and ethnic backgrounds and improved communication but mixed impacts of this patient-provider concordance on patient experiences and health outcomes. However, other recent research suggests racial concordance may contribute to improved health care use and health outcomes including lower emergency department use, reductions in racial disparities in mortality for Black infants, and increased visits for preventative care and treatment.

Experiences with Unfair Treatment by Health Care Providers

About one in five (18%) Black adults and roughly one in ten AIAN (12%), Hispanic (11%), and Asian (10%) adults who received health care in the past three years report being treated unfairly or with disrespect by a health care provider because of their racial or ethnic background. These shares are higher than the 3% of White adults who report this. Among Black adults, women are more likely than men to say they were treated unfairly by a health care provider because of their racial or ethnic background (21% vs. 13%). AIAN (26%) and Black (18%) adults also are more likely than White adults (13%) to say they have been treated unfairly or with disrespect by a health care provider in the past three years due to some other factor, such as their gender, health insurance status, or ability to pay for care (Figure 21). Overall, roughly three in ten (29%) AIAN adults and one in four (24%) Black adults say they were treated unfairly or with disrespect by a health care provider in the past three years for any reason compared with 14% of White adults. Additionally, LGBT adults are about twice as likely as non-LGBT adults to say they experienced unfair treatment by health care provider for any reason in the past three years (33% vs. 15%). Among LGBT adults, similar shares of Black (33%), White (33%), and Hispanic adults (26%) report these experiences.

About One In Five Black Adults And One In Ten Hispanic, Asian, And AIAN Adults Report Unfair Treatment By A Health Care Provider Due To Race Or Ethnicity

Reports of unfair treatment by health care providers due to race and ethnicity persist among Black, Hispanic, and Asian adults with higher incomes, who have health coverage, or who have a usual source of care. Overall and among Hispanic adults, those with lower incomes are more likely than those with higher incomes to report unfair or disrespectful treatment by a provider in the past three years. However, even among those with higher incomes (annual household incomes of $90,000 or more), 15% of Black adults report being treated unfairly or with disrespect by a health care provider because of their race or ethnic background, as do higher shares of Asian (8%) and Hispanic (5%) adults compared with White adults (1%) (Figure 22). Among adults with health coverage, 18% of Black adults and one in ten Asian (11%) and Hispanic (10%) adults say they have been treated unfairly by a health care provider in the past three years because of their race or ethnicity compared with 3% of White adults. Similarly, among adults with a usual source of care, one in five Black adults (18%) and about one in ten Hispanic (9%), and Asian (9%) adults report being treated unfairly or with disrespect by a health care provider due to their race or ethnic background compared with just 3% of White adults.

Among Black Adults, Reports Of Unfair Treatment By A Health Care Provider Due To Race Or Ethnicity Persist Among Those With Higher Incomes

In Their Own Words: Descriptions of Being Treated Unfairly or Disrespectfully by Health Care Providers

In open-ended responses describing instances of unfair treatment, individuals describe experiences such as not being taken seriously or not being believed about pain, rude or harassing behavior, assumptions being made about them, and being blamed for health conditions or problems they were experiencing:

“I went to the hospital with a 104 temperature and a UTI. While I understand the nurses and doctors wanted to run all tests possible, I was given more than three tests to check for STDs. I have had UTIs before and expressed that STDs were not a concern (due to sexual inactivity), and each nurse told me that ‘typically, people from my background have unprotected sex, so it is the hospitals policy to check us multiple times (even if the test results come back negative)’” – 30-year-old multiracial (Black and White) woman from Tennessee

“I am overweight and Latino with a doctorate degree. Most times when the nurse staff does intake, they often assume I work an hourly job and are surprised I am a professor. I often have to dress up for appointments or wear my university’s logo to signal where I work. I often notice I am listened to more and involved in care decisions when I do this change.” – 30-year-old Hispanic man from Illinois

“After having surgeries within a year of each other, I had questions about aftercare and issues that I was experiencing but the doctors did not take my concerns seriously and shunned me off. Unfortunately, both times there were serious complications that resulted in further health issues and irreparable health conditions.” – 63-year-old Black woman from Mississippi

“White male doctors tend to give me the worst care. I once saw a doctor about breathing issues, and he told me I was probably just thinking too hard about breathing which was probably causing the issues. Turns out I have asthma.” – 44-year-old Asian woman from California

“After having a c-section nurse would not listen to my complaints about the pain that I was experiencing. My White husband had to explain that I was worried it might have to do with the preeclampsia that I had.” – 35-year-old Black woman from Florida

“The doctor scolded me for not maintaining healthy lifestyle just by looking at my diabetes counts and not trying to understand my situation where I was between jobs and insurance, so wasn’t not able to take medications on time which caused the fluctuations that caused the counts in my blood sugar levels.” – 41-year-old Asian man from California

Reflecting these experiences with unfair treatment, large shares of Black, AIAN, Hispanic and Asian adults say that they prepare for possible insults from a provider or staff or feel they need to be very careful about their appearance to be treated fairly during health care visits. Vigilant behaviors, such as preparing for insults or considering one’s appearance, are sometimes adopted by people who experience discrimination as a means of protection from the threat of possible discrimination and to reduce exposure. Research has shown that heightened vigilance is associated with poor physical and mental health outcomes, including hypertension, sleep difficulties, and depression. Over half (55%) of Black adults, about half of AIAN (49%) and Hispanic (47%) adults, and about four in ten (39%) Asian adults say they feel they must be very careful about their appearance at least some of the time to be treated fairly when receiving health care (Figure 23), including one in five (21%) Black adults who say they feel they have to be careful “every time.” Each of these groups is more likely than White adults to report being vigilant about their appearance during health care visits at least some of the time, although notably about three in ten (29%) White adults say they take these actions. About three in ten (29%) Black adults and roughly a quarter of AIAN (26%) and Hispanic (23%) adults say they try to prepare for possible insults during health care visits, all higher than the share of White adults who say this (16%). About one in five Asian adults (19%) also report preparing for insults. Together, six in ten (60%) Black adults, about half of AIAN (52%) and Hispanic (51%) adults, and about four in ten (42%) Asian adults say they engage in at least one of these practices at least some of the time during health care visits compared with one in three (33%) White adults. These shares are also particularly high among LGBT adults across racial and ethnic groups, with at least six in ten Black (63%), Hispanic (61%), and White (60%), LGBT adults saying they take either of these steps.

Half Or More Hispanic, Black, And AIAN Adults Say They Have To Be Careful About Their Appearance Or Prepare For Insults During Health Care Visits

Among higher income adults and those with health coverage, Black, Hispanic, and Asian adults remain more likely than White adults to say they prepare for insults during health care visits or feel they need to be very careful about their appearance to be treated fairly at least some of the time. While higher income adults generally are less likely than those with lower incomes to say they take these steps, among those with higher incomes ($90,000 or more annually), about half of Black adults (51%) and about four in ten Hispanic (41%) and Asian (38%) adults say they take either of these steps at least some of the time during health care visits, higher than the share of White adults (22%) who say this. Similarly, among adults with coverage, Black (59%), Hispanic (51%), and Asian (42%) adults are more likely than their White (34%) counterparts to say they take either of these steps at least some of the time, including 47% of insured Black adults who say they feel they have to be very careful about their appearance (Figure 24).

Among Those With Higher Incomes, Black, Hispanic, And Asian Adults Are More Likely Than White Adults To Report Being Careful About Appearance Or Preparing For Insults During Health Care Visits

Negative Experiences When Receiving Health Care

A third of adults who received health care in the past three years report at least one of several negative experiences with a health care provider, including a provider assuming something about them without asking, suggesting they were personally to blame for a health problem, ignoring a direct request or question, or refusing to prescribe pain medication they thought they needed. While many of these negative experiences are shared across racial and ethnic groups, including White adults, AIAN adults are more likely than their White counterparts to say a provider assumed something without asking (29% vs. 19%), ignored a direct request or question (29% vs. 15%), and refused to prescribe pain medication they thought they needed (19% vs. 9%) (Figure 25). In addition, Black adults are more likely than White adults to say a provider ignored a direct request or question (19% vs. 15%) or refused them pain medication they thought they needed (15% vs. 9%). These differences persist among Black adults with health coverage but are not significant after controlling for income.

AIAN, Black, Hispanic, and Asian adults are more likely than White adults to say they had at least one of these negative experiences with a health care provider due to their race and ethnicity. Among adults who received health care in the past three years, about a quarter (24%) of Black adults and one in five (19%) AIAN adults say they experienced at least one of these negative experiences and that their race or ethnicity was a major or minor reason why they were treated this way, as do 15% of Hispanic and 11% of Asian adults. Just 4% of White adults who received care report a negative experience due to their race or ethnicity.

One-Third Of All Adults Report At Least One Of Several Negative Experiences With A Health Care Provider In Recent Visits

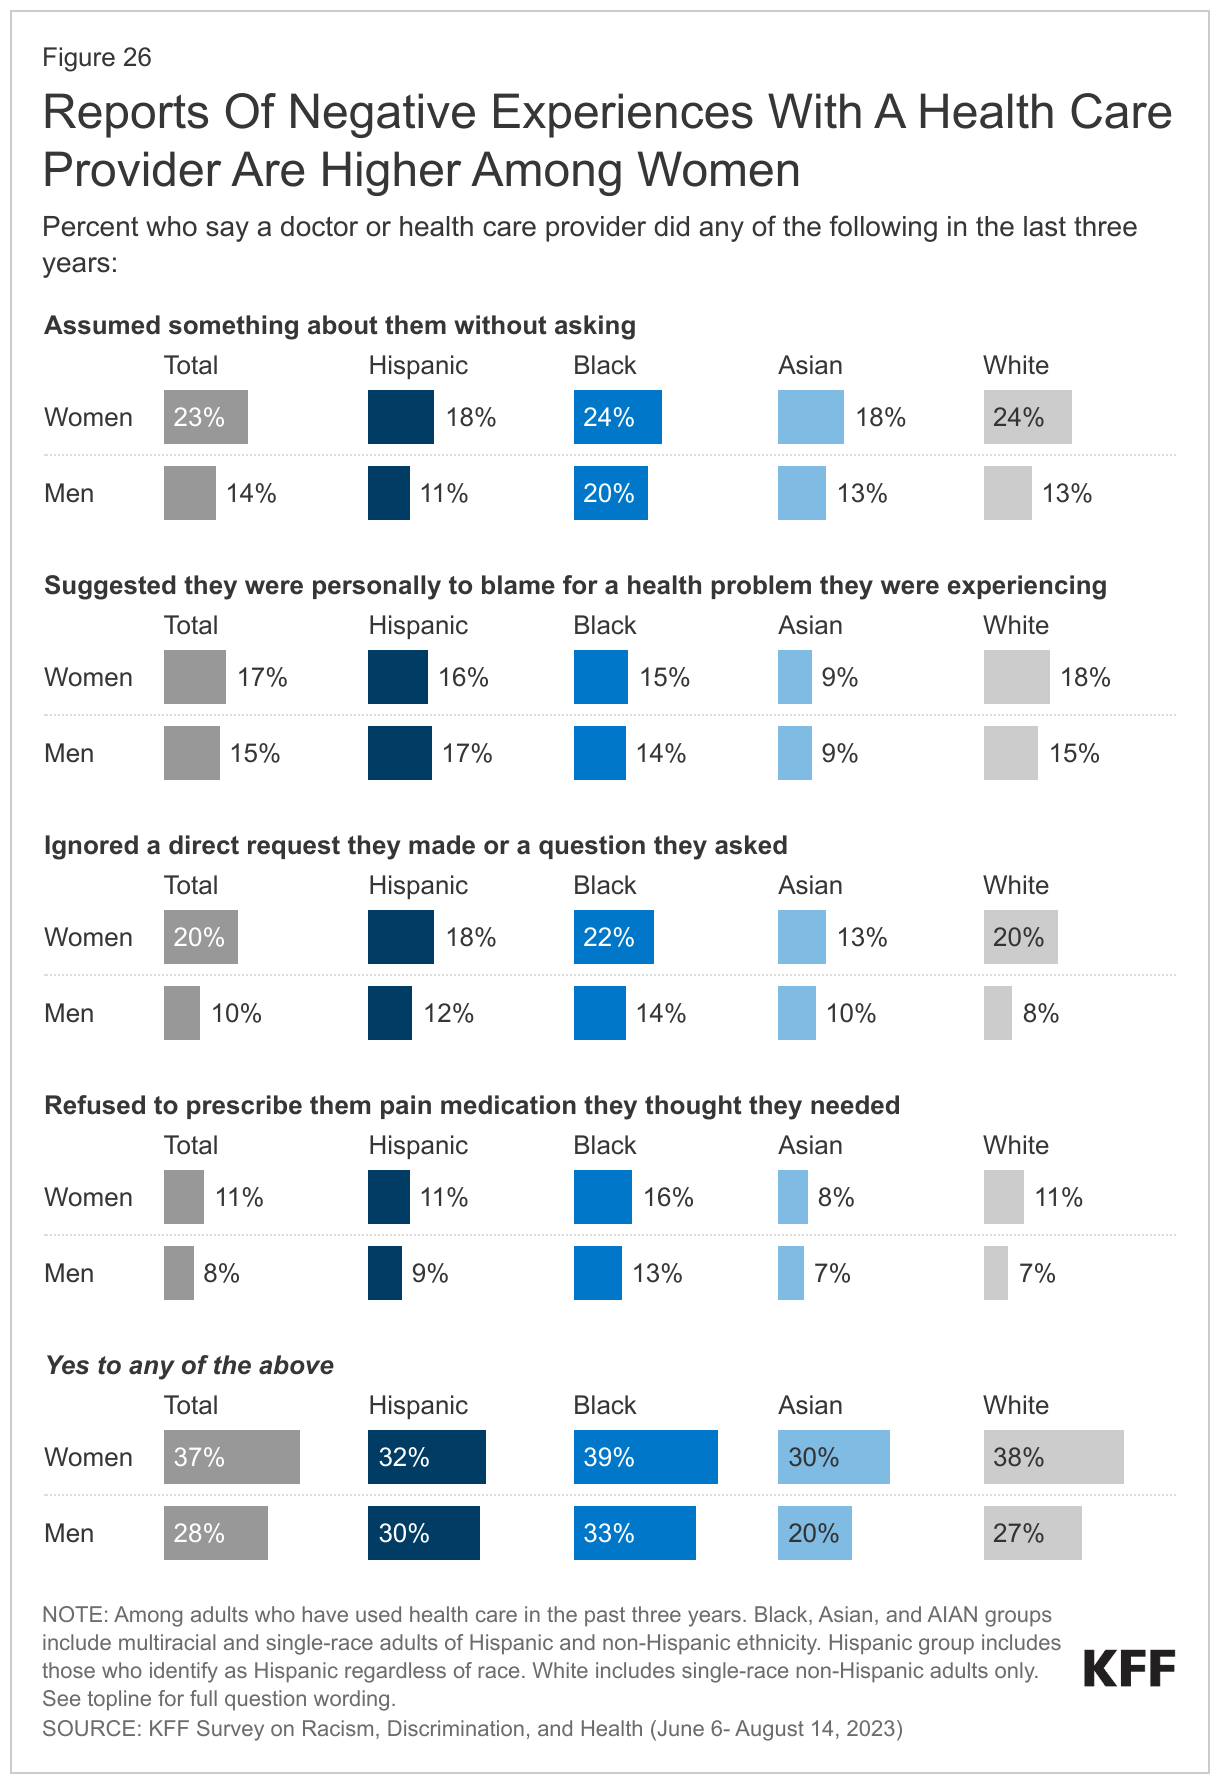
White and Asian women are more likely than their male counterparts to report at least one of these negative experiences with health care providers, but there are no significant differences between Hispanic and Black women and men. Among adults overall, the largest differences by gender include women being more likely than men to say a provider assumed something without asking and a provider ignoring a direct request or question (Figure 26). Additionally, 22% of Black adults who were pregnant or gave birth in the past ten years say they were refused pain medication they thought they needed, roughly twice the share of White adults with a pregnancy or birth experience (10%).

Reports Of Negative Experiences With A Health Care Provider Are Higher Among Women

Among adults with limited English proficiency, about half (48%) say that difficulty speaking or reading English made it difficult to complete at least one of several activities related to using health care in the past three years. These activities include filling out forms at a doctor’s office (34%), communicating with staff at a doctor’s office (33%), understanding instructions from a health care provider (30%), filling a prescription or knowing how to use it (27%), or scheduling a medical appointment (25%).

One in four adults who used health care in the past three years report that they had one or more of these negative experiences with a health care provider and/or a language access challenge and that it resulted in worse health, them being less likely to seek care, and/or them switching providers. About four in ten (39%) AIAN adults and three in ten (30%) Black adults say they had a negative experience with one of these consequences compared with about one in four (24%) White adults (Figure 27). The shares of Hispanic and Asian adults reporting a negative experience with at least one of these consequences are similar to that of White adults.

Negative Experiences With Health Care Providers Affect Health and Health Care Use

Implications

The survey reveals that, in wake of the initial COVID-19 pandemic and amid ongoing economic challenges and political division within the U.S., people’s experiences in their everyday lives and in health care settings often vary starkly by race and ethnicity, highlighting the ongoing impacts of racism and discrimination within the health care system and more broadly. The survey shows that many challenges are shared across all adults, including White adults, but that Hispanic, Black, Asian, and AIAN adults face disproportionate challenges and higher rates of unfair treatment due to their race and ethnicity, which have implications for health and well-being. The survey data identify areas for increased attention, resources, and initiatives to address these challenges and disparities, such as mechanisms to improve social and economic circumstances and provide safer communities as well as to address ongoing bias and discrimination, particularly in health care. The survey results also highlight factors that mitigate some of these challenges, including having strong local support networks and more health care visits with providers who have a shared racial and ethnic background. They also illustrate opportunities to increase respectful and positive provider interactions that can support high-quality and culturally competent care. Addressing the challenges identified in the survey is important not only from an equity standpoint but also for improving the nation’s overall health and economic prosperity.

Methodology

The Survey on Racism, Discrimination, and Health was designed and analyzed by researchers at KFF. The survey was conducted June 6 – August 14, 2023, online and by telephone among a nationally representative sample of 6,292 U.S. adults in English (5,706), Spanish (520), Chinese (37), Korean (16), and Vietnamese (13).

The sample includes 5,073 adults who were reached through an address-based sample (ABS) and completed the survey online (4,529) or over the phone (544). An additional 1,219 adults were reached through a random digit dial telephone (RDD) sample of prepaid (pay-as-you-go) cell phone numbers. Marketing Systems Groups (MSG) provided both the ABS and RDD sample. All fieldwork was managed by SSRS of Glen Mills, PA; sampling design and weighting was done in collaboration with KFF.

Sampling strategy:

The project was designed to reach a large sample of Black adults, Hispanic adults, and Asian adults. To accomplish this, the sampling strategy included increased efforts to reach geographic areas with larger shares of the population having less than a college education and larger shares of households with a Hispanic, Black, and/or Asian resident within the ABS sample, and geographic areas with larger shares of Hispanic and non-Hispanic Black adults within the RDD sample.

The ABS was divided into areas (strata) based on the share of households with a Hispanic, Black, and/or Asian resident, as well as the share of the population with a college degree within each Census block group. To increase the likelihood of reaching the populations of interest, strata with higher incidence of Hispanic, Black, and Asian households, and with lower educational attainment, were oversampled in the ABS design. The RDD sample of prepaid (pay-as-you-go) cell phone numbers was disproportionately stratified to reach Hispanic and non-Hispanic Black respondents based on incidence of these populations at the county level.

Incentives:

Respondents received a $10 incentive for their participation, with interviews completed by phone receiving a mailed check and web respondents receiving a $10 electronic gift card incentive to their choice of six companies, a Visa gift card, or a CharityChoice donation.

Community and expert input:

Input from organizations and individuals that directly serve or have expertise in issues facing historically underserved or marginalized populations helped shape the questionnaire and reporting. These community representatives were offered a modest honorarium for their time and effort to provide input, attend meetings, and offer their expertise on dissemination of findings.

Translation:

After the content of the questionnaire was largely finalized, SSRS conducted a telephone pretest in English and adjustments were made to the questionnaire. Following the English pretest, Cetra Language Solutions translated the survey instrument from English into the four languages outlined above and checked the CATI and web programming to ensure translations were properly overlayed. Additionally, phone interviewing supervisors fluent in each language reviewed the final programmed survey to ensure all translations were accurate and reflected the same meaning as the English version of the survey.

Data quality check:

A series of data quality checks were run on the final data. The online questionnaire included two questions designed to establish that respondents were paying attention and cases were monitored for data quality including item non-response, mean length, and straight lining. Cases were removed from the data if they failed two or more of these quality checks. Based on this criterion, 4 cases were removed.

Weighting:

The combined cell phone and ABS samples were weighted to match the sample’s demographics to the national U.S. adult population using data from the Census Bureau’s 2021 Current Population Survey (CPS). The combined sample was divided into five groups based on race or ethnicity (White alone, non-Hispanic; Hispanic; Black alone, non-Hispanic; Asian alone, non-Hispanic; and other race or multi-racial, non-Hispanic) and each group was weighted separately. Within each group, the weighting parameters included sex, age, education, nativity, citizenship, census region, urbanicity, and household tenure. For the Hispanic and Asian groups, English language proficiency and country of origin were also included in the weighting adjustment. The general population weight combines the five groups and weights them proportionally to their population size.

A separate weight was created for the American Indian and Alaska Native (AIAN) sample using data from the Census Bureau’s 2022 American Community Survey (ACS). The weighting parameters for this group included sex, education, race and ethnicity, region, nativity, and citizenship. For more information on the AIAN sample including some limitations, adjustments made to make the sample more representative, and considerations for data interpretation, see Appendix 2.

All weights also take into account differences in the probability of selection for each sample type (ABS and prepaid cell phone). This includes adjustment for the sample design and geographic stratification of the samples, and within household probability of selection.

The margin of sampling error including the design effect for the full sample is plus or minus 2 percentage points. Numbers of respondents and margins of sampling error for key subgroups are shown in the table below. Appendix 1 provides more detail on how race and ethnicity was measured in this survey and the coding of the analysis groups. For results based on other subgroups, the margin of sampling error may be higher. All tests of statistical significance account for the design effect due to weighting. Dependent t-tests were used to test for statistical significance across the overlapping groups.

Sample sizes and margins of sampling error for other subgroups are available by request. Sampling error is only one of many potential sources of error and there may be other unmeasured error in this or any other public opinion poll. KFF public opinion and survey research is a charter member of the Transparency Initiative of the American Association for Public Opinion Research.

GroupN (unweighted)M.O.S.E.
Total6,292± 2 percentage points
Race/Ethnicity
White, non-Hispanic (alone)1,725± 3 percentage points
Black (alone or in combination)1,991± 3 percentage points
Hispanic1,775± 3 percentage points
Asian (alone or in combination)693± 5 percentage points
American Indian and Alaska Native (alone or in combination)267± 8 percentage points

Appendix

Appendix 1

Racial and ethnic groups included in this report are defined using a two-question format. The initial question asks respondents if they are of Latino or Hispanic origin or descent. The second question asks respondents to select as many racial identity groups as apply from a list that includes eight response options: White, Black or African-American, Asian, American Indian, Alaska Native, Native Hawaiian, Pacific Islander, and “some other race” (with a text box for respondents to provide details). The wording for these questions is similar to the standard two-question measure used by the U.S. Census Bureau, other government organizations, and some survey research organizations. Using the two-question format and “select all that apply” for racial identity allows respondents to self-identify into multiple categories that better reflect their racial and/or ethnic identity or identities.

The table below provides some breakdown on the racial and ethnic identities for the Hispanic, Black, Asian, and American Indian and Alaska Native (AIAN) groups. It includes both the unweighted number of interviews and the weighted proportion within each group, including the share who selected only one race (single race), the share who selected more than one race (multiracial), and the share who selected Hispanic ethnicity within each of these groups. About nine in ten Hispanic adults identify as Hispanic and a single race, and at least eight in ten Black and Asian adults identify as a single race and non-Hispanic. By contrast, most AIAN adults identify as multiracial and about one-third identify as Hispanic.

Racial And Ethnic Identities

Appendix 2: Reporting on the Experiences of American Indian and Alaska Native Adults

Sample and Population Represented: The KFF Survey on Racism, Discrimination, and Health was designed to include large samples of adults identifying as Black or African American, Latino or Hispanic, and Asian, with the goal of reporting results specifically for these populations. More details on the sampling strategy are available in the project Methodology.

In addition to these planned larger samples, the sample design also yielded 267 interviews with individuals identifying as American Indian (n=263) and/or Alaska Native (n=6). The American Indian and Alaska Native (AIAN) sample includes individuals who identified AIAN as their only racial identity as well as those who selected AIAN and at least one other race, as well as those who identified as having Hispanic and non-Hispanic ethnicity (see Appendix 1 for more details on how racial and ethnic groups were categorized in this analysis).

Limitations and Data Quality Considerations: Given ongoing concerns about data erasure and invisibility of smaller populations, including Indigenous people, KFF has decided to include results for the AIAN population in this report despite some limitations. The following describes the limitations of the sample, adjustments made to make the sample more representative, and considerations for data interpretation.

Because the survey was not explicitly designed to include a representative sample of AIAN people, the research falls short of some recommended best practices for surveying this population. These include advance outreach to Tribal organizations, face-to-face interviews for some groups, and geographic oversampling of federally recognized Indian reservations and other Tribal lands. The small size of the AIAN sample also does not allow for reporting on more detailed groups (such as within the AIAN population by age, geography, and other demographics).

To increase representativeness of the results, the AIAN sample was weighted to the most current demographic data available for this population: the U.S. Census Bureau’s 2022 American Community Survey (ACS). The weighting parameters include education, age by gender, region, nativity (U.S.-born vs. foreign-born), race and ethnicity, and U.S. citizenship.

Researchers also took other steps to assess the representativeness of the AIAN sample. While Tribal lands were not explicitly included in the sampling strategy, the sample was analyzed to assess whether individuals living on federally recognized Indian reservations and other Tribal lands could have responded to the survey using the Census tracts and zip codes of survey respondents. Overall, 19% of respondents in the AIAN sample live in geographic areas where Tribal lands are located, including 25% of those who identify as AIAN alone. In addition, researchers compared this AIAN sample to other federally available data across a series of benchmarks not included in the weighting such as insurance status, insurance type, income, and the use of English in the household.

Despite these efforts, we suggest using caution when interpreting the results of the AIAN sample in the report. The data included may not be reflective of the entirety of experiences of the AIAN adult population. It may particularly fall short of capturing the experiences of those living on federally recognized Indian reservations and other Tribal lands. In addition, the Census data used for weighting is imperfect and may overrepresent the experiences of multiracial AIAN individuals, which may lead to a similar imbalance in the survey results.

KFF is committed to improving our future efforts and working to more fully represent and reflect the diversity of experiences among Indigenous people in our survey and other work.

Endnotes

  1. To examine the relationship between variables of interest throughout the report, a series of logistic regression models were conducted to test whether these relationships hold after controlling for demographics. The demographic variables used across models include educational attainment, income, age, gender, LGBT identity, and region. Race and ethnicity were also included as control variables in the overall model. To test the same relationships within racial and ethnic groups, separate logistic regressions were conducted among Hispanic adults, Black adults, Asian adults, and White adults, controlling for the same demographics listed. ↩︎
  2. Based on regression analysis as described above. ↩︎
  3. The survey questionnaire was designed by KFF researchers, drawing on previous research. Several items measuring discrimination in everyday life were informed by the Everyday Discrimination Scale. For more information see: https://scholar.harvard.edu/davidrwilliams/node/32397 ↩︎
  4. Based on regression analysis as described above. ↩︎
  5. Based on regression analysis as described above. ↩︎
News Release

Poll: By a Wide Margin, Democratic Voters Now Care More About the Affordable Care Act Than Republican Voters Do, And Voters Trust Democrats More Than Republicans to Handle Its Future

Most Medicaid Enrollees Have Heard Little or Nothing About States’ Ongoing Redetermination Efforts

Published: Dec 1, 2023

The future of the Affordable Care Act, an issue that was once a key health care issue for Republican voters, is now more important to Democratic voters, a new KFF Health Tracking Poll finds

About half (49%) of voters say it is a “very important” issue for the candidates to discuss, including more than twice the share of Democratic voters (70%) than Republican voters (32%). 

Fielded prior to former President Donald Trump’s recent social media comments on replacing the 2010 law, the poll also finds that voters give the Democratic Party a 20 percentage-point advantage over the Republican Party on who they trust more to handle the issue (59% versus 39%). The Democratic Party is more trusted on this issue among the vast majority of Democratic voters (94%) and most independent voters (61%), while three in four Republican voters (77%) say they trust the GOP to better handle the future of the ACA.

The findings come from a survey that asked voters about a range of health care and other issues that they want the 2024 presidential candidates to talk about. Inflation (86%) as expected topped the list but notably the affordability of health care (80%) was a close second for the share of voters saying they were “very important” to discuss. 

Large shares of voters also say that the future of Medicare and Medicaid (75%), access to mental health care (70%), immigration (65%), gun violence (65%), and prescription drug costs (64%) are “very important” for the candidates to discuss. 

The poll also examines:

The Medicaid unwinding. Most Medicaid enrollees (58%) have heard little or nothing about ongoing efforts by states to review enrollees’ eligibility that can result in individuals losing their Medicaid coverage. State Medicaid programs began to review enrollees’ eligibility earlier this year after pandemic-era protections expired, leading to millions of adults and children losing their Medicaid coverage. Among the general public, an even larger share (68%) say they have heard little or nothing about the issue. 

Medicare drug-price provisions. About a third (32%) of the public know that the Inflation Reduction Act enacted last year requires the federal government to negotiate prices for some prescription drugs for people with Medicare, up from 25% in July.  About a quarter are aware of two other Medicare drug provisions: capping monthly insulin costs at $35 for people with Medicare (26%) and limiting Medicare enrollees’ annual out-of-pocket drug costs (23%). Even among people at least 65 years old – the age when most people become eligible for Medicare – only a minority are aware of each of the provisions.

Abortion as a voting issue. A quarter (24%) of voters say they would only vote for a candidate who shares their views on abortion, including larger shares of Democratic women (31%) and Democratic men (35%) – both groups where large majorities say abortions should be legal. A quarter (27%) of Republican voters who believe abortion should be illegal in all or most cases also say they would only vote for a candidate who shares their views on abortion. 

Designed and analyzed by public opinion researchers at KFF, the survey was conducted from October 31-November 7, 2023, online and by telephone among a nationally representative sample of 1,401 U.S. adults, including 1,072 registered voters. Interviews were conducted in English and in Spanish. The margin of sampling error is plus or minus 4 percentage points for the full sample and the registered voter sample. For results based on other subgroups, the margin of sampling error may be higher.

Poll Finding

KFF Health Tracking Poll: Health Care Issues Emerge as Important Topics on 2024 Campaign Trail, Plus Concerns Loom Large Around Medicaid Unwinding

Published: Dec 1, 2023

Findings

Key Takeaways

  • With the 2024 presidential election cycle in full swing, voters want to hear the candidates talk about many different issues, and voters identify inflation, including the rising cost of household expenses, as the most important topic for discussion. Notably, the affordability of health care came in a close second with eight in ten voters saying it is “very important” for candidates to discuss on the campaign trail.
  • Once a longstanding issue for the Republican Party, former President Trump has recently resurrected the debate around the future of the 2010 Affordable Care Act (ACA). Surveyed prior to this discussion, Democratic voters are more than twice as likely as Republicans voters to say the future of the ACA is a “very important” issue for the candidates to discuss (70% v. 32%). The Democratic Party holds an advantage on which party voters trust to do a better job of handling the ACA with six in ten (59%) voters saying they trust the Democratic Party more, compared to four in ten (39%) who say they trust the Republican Party more. Partisans differ, with nearly all Democratic voters saying they trust the Democratic Party (94%), while three in four (77%) Republican voters say they trust the Republican Party. The Democratic Party holds the advantage among independent voters (61% v. 36%).
  • The 2024 election will be the first presidential election since the Dobbs decision. While few voters overall (4%) say abortion is the “most important” issue for 2024 presidential candidates to talk about as they campaign, the Democratic Party holds a strong advantage over the Republican Party on voters’ trust to handle abortion (58% vs. 41%). The Democratic Party hold the advantage on trust on this issue across key voting blocs including women voters overall (61%), women voters ages 18 to 49 (66%), independent women voters (66%), and almost all Democratic women voters (94%).
  • While two-thirds of the public now say abortion should be legal in “all” or “most” cases, most voters (57%) say a candidate’s position on abortion is only one of many factors in their vote choice. About a quarter of voters (24%) say they would only vote for a candidate who shares their views on the issue, including larger shares of Democratic voters (33%), including three in ten Democratic women (31%) and one-third of Democratic men (35%) – groups where large majorities say abortions should be legal. Notably, one in four (27%) Republican voters who believe abortion should be illegal in “all” or “most” cases also say they would only vote for a candidate who shares their views on abortion. Among Republican voters who believe abortion should be legal in all or most cases, very few (4%) say they would only vote for a candidate who shares their views on the issue.
  • The poll also takes a look at public awareness around two key health policy issues including the unwinding of the Medicaid continuous enrollment provision and the prescription drug provisions included in the 2022 Inflation Reduction Act, revealing that most of the public is unaware of these actions. Medicaid enrollees themselves are among the most likely to say they are aware of the unwinding, but still a majority say they have heard either “nothing” or “only a little” about the unwinding. Among those who are aware, large majorities are worried that this means many adults and children will become uninsured.

Key Issues in the 2024 Election

Less than one year until the 2024 election, there are many issues that voters are eager to hear about from presidential candidates, with two economic issues topping the list: inflation and the affordability of health care. Although inflation is now at a 2-year low, consumers continue to notice high prices. At least eight in ten voters say it is “very important” for the 2024 presidential candidates to talk about inflation (86%) or affordability of health care (80%). These are closely followed by the future of Medicare and Medicaid (75%) and access to mental health care (70%). About two-thirds of voters say it is “very important” for candidates to discuss immigration (65%), gun violence (65%) and prescription drug costs (64%) while on the campaign trail. For about half of voters, it is “very important” that candidates discuss the opioid crisis (53%), abortion (52%), the future of the ACA (49%), and climate change (48%), while fewer say it is “very important” for candidates to discuss aid to foreign countries (44%). On the other hand, fewer than one-fourth (22%) of voters say it is “very important” for candidates to be discussing COVID-19 heading into the 2024 election.

When asked to pick their top issue, four in ten (41%) voters say the “most important” issue for candidates to discuss is inflation, including the rising cost of household expenses. This is about three times the share of voters who say any other issue is the “most important” for candidates to discuss, such as gun violence (14%) or immigration (12%). Fewer voters say the affordability of health care (8%), the future of Medicare and Medicaid (6%), climate change (5%), abortion (4%), access to mental health care (3%), aid to foreign countries (2%), the opioid crisis (1%), prescription drug costs (1%), or the future of the Affordable Care Act are the “most important” topics on the campaign trail.

Inflation, Affordability Of Health Care Are Among The Most Important For Candidates To Discuss

Partisan voters differ slightly on what issues they want the presidential candidates to discuss on the campaign trail. For Democratic voters, nine in ten say it is “very important” that candidates talk about affordability of health care (90%) and gun violence (89%), followed by about eight in ten who say inflation (81%) and access to mental health care (78%) are “very important.” The list of issues that are important to Republicans differs slightly, with nearly all Republican voters (96%) saying it is “very important” that inflation is discussed, eight in ten (82%) saying immigration is “very important,” and about seven in ten wanting to hear about the affordability of health care (71%) or the future of Medicare and Medicaid (70%).

Further down the list for partisans, some of the most polarized issues are climate change, with Democratic voters 51 percentage points more likely than Republicans to say this is a “very important” issue for candidates to talk about (73% v. 22%). Nearly three-fourths (72%) of Democratic voters say that abortion is a “very important” issue for candidates to discuss, compared to about four in ten (38%) Republican voters who say the same (a 34 percentage point difference). The future of the Affordable Care Act, an issue that was once a key health care issue for Republican voters, is now ranked as a “very important” issue for larger shares of Democratic voters (70%) than Republican voters (32%). This survey was fielded before former President Donald Trump reignited the issue by announcing that he plans to replace the 2010 health care law.

Large Majorities Across Partisans Say Inflation Is A Very Important Issue To Discuss; Republicans Prioritize Immigration, Democrats Prioritize Gun Violence

Yet, across partisans and among other key voting groups, inflation emerges among the top issues when voters are asked for their “most important” issue for candidates to discuss. For Democratic voters, Black voters, and voters ages 65 and older, similar shares rank gun violence and inflation as the most important issue. The future of Medicare and Medicaid emerges in the top five issues for adults over age 50, including 13% of adults ages 65 and older, and abortion makes its way into the top five issues for Democratic voters and younger voters.

In the figure below, use the drop-down menu to explore the top five “most important” issues among key subgroups:

Across Groups Of Voters, Inflation Is the Most Important Issue, Tied With Gun Violence For Democratic Voters, Older Voters, And Black Voters

When voters are asked which political party they trust to handle each of the issues presented, the Republican Party has a slight edge on inflation and the Democratic Party has the edge on health care related issues, climate change, abortion, and gun violence. Just over half (54%) of voters say they trust the Republican Party to do a better job to address inflation including the rising cost of household expenses, compared to 45% of voters who say they trust the Democratic Party more on this issue. The Republican Party also holds the advantage among voters on immigration (57% v. 41%) and aid to foreign countries (55% v. 41%).

The Democratic Party, however, has the edge on handing health care related issues such as access to mental health care (61% v. 37%), affordability of health care (59% v. 39%), the future of the ACA (59% v. 39%), the future of Medicare and Medicaid (59% v. 40%), abortion (58% v. 41%), and prescription drug costs (57% v. 42%). Nearly two-thirds of voters also say they trust the Democratic Party (63%) over the Republican Party (35%) to address climate change, and more than half (54%) say they trust the Democratic Party over the Republican Party (44%) to do a better job addressing gun violence.

Voters are split on which party they trust to do a better job handling the opioid crisis with half saying they trust the Democratic Party (50%) and a similar share saying they trust the Republican Party (48%).

Democratic Party More Trusted On Key Health Care Issues, Gun Violence, And Climate Change; Republican Party Holds Advantage On Immigration, Foreign Aid, And Inflation

Top Issues and Party Trust for Key Voting Groups:

While inflation is the “most important” issue across voters when asked to choose one issue they want to hear from candidates about, other issues emerge for different types of voters. Below is a selection of some key voting groups and issues that are important to them:

The issues that top the list for Black voters when asked to select the “most important” issue they want to hear presidential candidates discuss are inflation (32%) and gun violence (31%). On each of these issues, Black voters are at least three times as likely to trust the Democratic Party as the Republican Party.

Voters ages 65 and older want to hear candidates talk about a myriad of issues, including 13% who say that the future of Medicare and Medicaid is the most important issue for candidates to discuss. Six in ten trust the Democratic Party (61%) to handle this, while about four in ten trust the Republican Party (38%).

Half of rural voters say inflation is the most important issue for presidential candidates discuss, and six in ten say that they trust the Republican Party better to handle it, compared to four in ten who trust the Democratic Party.

Voters ages 18 to 29 say that the most important issues they want to hear about from candidates are inflation (54%) and the affordability of health care (13%). On inflation and rising household expenses generally, young voters are split, with half saying they trust the Democratic Party and half saying they trust the Republican Party. But, when it comes to health care expenses, two-thirds (68%) say they trust the Democratic Party, while three in ten (31%) say they trust the Republican Party.

Immigration is among the most important issues White voters want to hear about from presidential candidates (13% say this is the most important issue), and two-thirds (63%) say they trust the Republican Party better to handle this issue, while one-third (35%) say they trust the Democratic Party.

By far, the most important issue Hispanic voters want to hear from candidates about is inflation and the rising cost of household expenses. On this issue, a majority of Hispanic voters say they trust the Democratic Party (57%) while four in ten (43%) say they trust the Republican Party.

For suburban women, the most important issue they want to hear about is inflation. On this issue, suburban women are split, with half (52%) saying they trust the Republican party more to handle it, and half (47%) saying they trust the Democratic Party.

To explore how key groups rank their top five “most important” issues they want candidates to discuss, and which political party they trust on each of those issues, use the toggles on the figure below:

Key Voter Groups And Which Party They Trust To Handle Their Top Five "Most Important" Issues They Want To Hear Candidates Discuss

Abortion in the 2024 Election

After the Dobbs decision overturned Roe v. Wade in June 2022, decisions about abortion access are now left up to the states. In October 2023, a few state elections that included abortion-related ballot measures gave some insight into how voters react when presented directly with ballot questions related to abortion rights.

Overall, most voters say they think abortion should be legal in either “all cases” (29%) or “most cases” (36%), while one in four voters say it should be illegal in most (26%) cases and just one in ten (9%) say it should be illegal in all cases. A majority of Democratic voters, independent voters, women, men, and voters across age, racial, and ethnic groups say that abortion should be legal in all or most cases. A majority of Republican voters (60%)—including 55% of Republican women—say that abortion should be illegal in all or most cases. Currently, abortion is banned in 14 states in the U.S., and limited in an additional 11 states.

Most Voters Overall Say Abortion Should Be Legal In All Or Most Cases, Including Four In Ten Republican Voters

Overall, while most voters say that abortion is an important issue they would like 2024 presidential candidates to discuss, few (4%) voters say it is rises to the most important issue to discuss during this campaign. Most Democratic voters (72%), including seven in ten Democratic women, say that abortion is a very important issue for candidates to discuss, as do seven in ten (68%) Black voters and more than half (55%) of Hispanic voters. Yet, it rises to the most important issue for discussion for just one in ten (11%) of Democratic voters, and fewer than five percent of Black or Hispanic voters.

When it comes to which party voters trust to do a better job handling the issue of abortion, majorities across race, ethnicity, and gender say they trust the Democratic Party, as do majorities of Democrats and independents. Republican voters are much more likely to say they trust the Republican Party to handle the issue of abortion (80%), though four in ten (40%) Republican voters who say abortion should be legal in all or most cases say they trust the Democratic Party more on this issue. For these voters, just one-fourth say abortion is a very important issue to them.

Majorities Of Voters Across Race, Ethnicity, And Gender Say They Trust The Democratic Party To Handle The Issue Of Abortion, Though Most Republicans Trust The Republican Party

While few voters identify abortion as the most important issue for candidates to discuss, it does appear that the issue could influence a small group of voters’ decisions during the 2024 election. While most voters (57%) say a candidate’s position on abortion is just one of many important factors, one in four (24%) voters say they would only vote for a candidate who shares their views on abortion. Larger shares of Democratic voters (33%) say they would only vote for a candidate who shares their view on abortion, including three in ten (31%) Democratic women. Overall, about one in five voters (19%) say abortion is not an important factor in their vote choice including about three in ten (29%) Republican women.

Abortion does not seem to be a deciding issue in determining which candidates to support for many Republicans, especially those Republicans who think abortion should be legal in all or most cases. Just 4% of this group say they would only vote for a candidate who shares their views on abortion, while half (53%) of Republicans who say abortion should be legal say “a candidate’s position on abortion is just one of many important factors” and four in ten say abortion is not an important factor in their vote choice. This is compared to the nearly three in ten Republican voters who think that abortion should be illegal in all or most cases who say that they would only vote for a candidate who shares their views on abortion.

Abortion as a top issue in the election: A Trend Update

Earlier this year, KFF polling began tracking the role abortion may play in the upcoming 2024 election and found that many voters, including large shares of Democratic women voters, were motivated by the Dobbs decision to vote. At the time, about half (52%) of Democratic women voters said they would only vote for a candidate who shares their views on abortion, and an additional four in ten (41%) said a candidate’s views on abortion is just one of many factors to their vote. Although large shares of Democratic women continue to say that abortion is at least an important factor to their vote, fewer (31%) now say that they would only vote for a candidate who shares their view on abortion. With other issues dominating recent headlines, abortion may be an issue that voters are considering, but not hanging their hat on.

Abortion Is More Of A Deciding Issue For Democratic Voters Than For Republican Voters

Many Voters are Pessimistic Heading into the 2024 Election

Less than one year until the 2024 election, many voters are not feeling confident with the way things are going in the U.S. Eight in ten (81%) voters say that things in this country “have gotten off on the wrong track,” compared to about one in five (18%) who say things are generally going in the right direction. While this finding is consistent with past polling of voters since 2014, the latest KFF poll shows that Democratic voters are less pessimistic than Republican voters, with about one-third of Democratic voters saying things in the U.S. are generally going in the right direction (32%) and just six percent of Republican voters saying the same.

Voters Are Generally Pessimistic About The Direction The U.S. Is Going, Though Democrats Are Less Pessimistic

Voters who say that things in the U.S. have gotten off on the wrong track are most interested in hearing about inflation, including the rising cost of household expenses (46%), from 2024 presidential hopefuls. About six in ten (62%) of these pessimistic voters say they trust the Republican party better to address inflation and the rising cost of household expenses, while about four in ten (37%) say they trust the Democratic Party on this issue. Voters who say things in the U.S. are headed in the right direction are most interested in hearing about gun violence (24%) and inflation (21%), and larger shares say they trust the Democratic Party on each of these issues.

Medicaid Unwinding and the Inflation Reduction Act (IRA)

Enacted at the start of the pandemic, the Families First Coronavirus Response Act (FFCRA) required state Medicaid programs to keep people enrolled throughout the COVID-19 public health emergency (PHE). However, the Consolidated Appropriations Act (CAA) ended continuous enrollment on March 31, 2023, and required states to conduct redeterminations for all Medicaid enrollees by the end of May 2024. As of November 27, 2023, more than 11 million people have been disenrolled from Medicaid, and by KFF estimates, up to 24 million people could be disenrolled from Medicaid during this period of unwinding of the continuous enrollment provision. Just over half (53%) of U.S. adults say they have heard at least “a little” about states removing adults and children from Medicaid as the pandemic policies end, while half (47%) have heard nothing at all about this. Adults who are currently on Medicaid are most likely to say they have heard of this (65%).

Large Shares Of The Public Are Unaware Of Medicaid Unwinding; Those Currently On Medicaid Are Most Aware

Many states are working to support their Medicaid enrollees in the active renewal process, but enrollees may face barriers renewing Medicaid enrollment. Among those who have heard at least a little about the issue of Medicaid unwinding, a large majority are very (42%) or somewhat (46%) concerned about more adults and children becoming uninsured because of problems obtaining and renewing their coverage through Medicaid. Adults with household incomes under $40,000 and those currently on Medicaid are the most likely to say they are very concerned.

Of Those Who Are Aware Of Medicaid Unwinding, Large Majorities Are Concerned About People Becoming Uninsured

Inflation Reduction Act

More than a year after being signed into law, few adults are aware of the prescription drug regulations included in the Inflation Reduction Act (IRA). About one-fourth are aware that there are federal laws in place that cap monthly insulin costs at $35 for people with Medicare (26%) or that place a limit on annual out-of-pocket drug costs for people with Medicare (23%), and even fewer adults are aware there is a law in place that penalizes drug companies for increasing prices faster than the rate of inflation for people with Medicare (13%). These shares are relatively unchanged from when KFF first explored this in July 2023. However, slightly larger shares of adults now than in July say they are aware that there is a federal law in place that requires the federal government to negotiate the price of some prescription drugs for people with Medicare (32% v. 25% in July). This may be related to the media coverage of the recent announcement by HHS regarding the first 10 drugs covered under Medicare Part D selected for negotiation.

Majorities Of The Public Do Not Know About Inflation Reduction Act Provisions

While adults ages 65 and older are more likely to say they are aware of the Inflation Reduction Act’s cap on the cost of insulin for people with Medicare (44%) than younger adults, majorities are still unaware of these provisions. Few seniors are aware that there is a federal law requiring the federal government to negotiate drug costs (36%), placing an annual limit on out-of-pocket drug costs (25%), or penalizing drug companies for increasing prices faster than the rate of inflation for people with Medicare (8%).

A Minority Of Adults Ages 65 And Over Know About The Medicare Prescription Drug Provisions In The Inflation Reduction Act

Methodology

This KFF Health Tracking Poll/COVID-19 Vaccine Monitor was designed and analyzed by public opinion researchers at KFF. The survey was conducted October 31- November 7, 2023, online and by telephone among a nationally representative sample of 1,301 U.S. adults in English (1,222) and in Spanish (79). The sample includes 1,016 adults (n=52 in Spanish) reached through the SSRS Opinion Panel either online (n=991) or over the phone (n=25). The SSRS Opinion Panel is a nationally representative probability-based panel where panel members are recruited randomly in one of two ways: (a) Through invitations mailed to respondents randomly sampled from an Address-Based Sample (ABS) provided by Marketing Systems Groups (MSG) through the U.S. Postal Service’s Computerized Delivery Sequence (CDS); (b) from a dual-frame random digit dial (RDD) sample provided by MSG. For the online panel component, invitations were sent to panel members by email followed by up to three reminder emails.

Another 285 (n=27 in Spanish) interviews were conducted from a random digit dial telephone sample of prepaid cell phone numbers obtained through MSG. Phone numbers used for the prepaid cell phone component were randomly generated from a cell phone sampling frame with disproportionate stratification aimed at reaching Hispanic and non-Hispanic Black respondents. Stratification was based on incidence of the race/ethnicity groups within each frame.

Respondents in the phone samples received a $15 incentive via a check received by mail, and web respondents received a $5 electronic gift card incentive (some harder-to-reach groups received a $10 electronic gift card). In order to ensure data quality, cases were removed if they failed attention check questions in the online version of the questionnaire, or if they had over 30% item non-response, or had a length less than one quarter of the mean length by mode. Based on this criterion, one case was removed.

The combined cell phone and panel samples were weighted to match the sample’s demographics to the national U.S. adult population based on parameters derived from the Census Bureau’s 2022 Current Population Survey (CPS), 2021 Volunteering and Civic Life Supplement data from the CPS, and the 2023 KFF Benchmarking survey with ABS and prepaid cell phone samples. The demographic variables included in weighting for the general population sample are sex, age, education, race/ethnicity, region, education, civic engagement, internet use, and political party identification by race/ethnicity. The sample of registered voters was weighted separately to match the U.S. registered voter population using the parameters above plus recalled vote in the 2020 presidential election by county quintiles grouped by Trump vote share. Both weights take into account differences in the probability of selection for each sample type (prepaid cell phone and panel). This includes adjustment for the sample design and geographic stratification of the cell phone sample, within household probability of selection, and the design of the panel-recruitment procedure.

The margin of sampling error including the design effect for the full sample and registered voters is plus or minus 4 percentage points. Numbers of respondents and margins of sampling error for key subgroups are shown in the table below. For results based on other subgroups, the margin of sampling error may be higher. Sample sizes and margins of sampling error for other subgroups are available by request. Sampling error is only one of many potential sources of error and there may be other unmeasured error in this or any other public opinion poll. KFF public opinion and survey research is a charter member of the Transparency Initiative of the American Association for Public Opinion Research.

GroupN (unweighted)M.O.S.E.
Total1,301± 4 percentage points
Total Registered Voters1,072± 4 percentage points
Republican Registered Voters342± 7 percentage points
Democratic Registered Voters333± 7 percentage points
Independent Registered Voters296± 7 percentage points
 
Race/Ethnicity
White, non-Hispanic719± 5 percentage points
Black, non-Hispanic218± 9 percentage points
Hispanic247± 8 percentage points

A Look at State Take-Up of ARPA Mobile Crisis Services in Medicaid

Published: Nov 30, 2023

Rising concerns about mental health and substance use disorder have led to new policy initiatives and funding to improve access and quality of services to address the mental health crisis. Notably, a relatively new three-digit number to reach the 988 Suicide and Crisis Lifeline provides 24/7 access to crisis counselors for everyone, regardless of financial ability. In addition to 988, federal guidelines detail a comprehensive crisis continuum that contains three core components: crisis call centers, mobile crisis units and short-term crisis stabilization centers.

While crisis call centers are accessible nationwide, the availability and characteristics of other components of the crisis continuum–mobile crisis units and stabilization centers–vary across and within states, as does the financing of these systems. Medicaid is a larger payer of behavioral health services and enrollees are disproportionately affected by behavioral health conditions, which include mental health and substance use disorders. The American Rescue Plan Act (ARPA), passed in 2021, had several Medicaid-focused provisions to improve access to mobile crisis. This policy watch examines what mobile crisis is, what changes to mobile crisis were included in ARPA and how many states are implementing ARPA approved mobile crisis services.

What is mobile crisis?

Mobile crisis units provide in-person crisis stabilization services for people experiencing a mental health or substance use disorder crisis. These mobile crisis units–typically activated by crisis hotlines, providers, or first responders–provide community-based interventions in settings that feel comfortable to the individual, like their homes. For instance, in areas with a robust continuum of behavioral health crisis services, if an individual calls the 988 lifeline and their needs surpass what can be managed over the phone, the counselor on the line may dispatch a mobile crisis team directly to the caller’s location—similar to how 911 can dispatch an ambulance. Upon arrival, this team could deliver face-to-face crisis stabilization services to help address the mental health crisis. Per Substance Abuse and Mental Health Services Administration (SAMHSA) guidelines mobile crisis teams are made up of master’s level mental health clinicians and paraprofessionals (such as peer support workers) and are available 24/7. However, however, the actual composition and availability of teams may vary. These services may help to reduce unnecessary involvement by law enforcement, emergency room visits, and hospitalizations by providing in-person crisis intervention services and linkages to subsequent behavioral health care.

Many states offer some kind of mobile crisis service and most state Medicaid programs reimburse for mobile crisis services, but the characteristics, delivery, and accessibly of these services vary widely across states. Most states report the presence of mobile crisis services in their state, but only half of states have these services available statewide and even fewer states have these services available 24/7. In 2022, about three-quarters of Medicaid programs (33 in total) reported some coverage for mobile crisis services. However, it’s unclear how closely these services follow the guidelines provided in SAMHSA’s crisis guidelines.

What changes did ARPA include for Medicaid mobile crisis services?

ARPA included several provisions to improve and expand mobile crisis systems in Medicaid. The changes were intended to better align the delivery of mobile crisis with SAMHSA’s crisis guidelines and make these services more robust and uniform in Medicaid. ARPA included $15 million in state planning grants for qualifying mobile-crisis services, a higher federal match rate for qualifying mobile crisis services, and federal administrative matching funds for the development or implementation of technology to support crisis continuum–such as technology to help dispatch mobile crisis units.

Under ARPA, the federal government provides a temporary enhanced Medicaid match rate for qualifying community mobile crisis services. To be eligible for enhanced ARPA funding, the services need to meet specific standards–listed in ARPA legislation which are detailed in a letter to state health officials, and include requirements such as the following:

  • Availability of services: These community-based teams must be available 24/7, every day of the year.
  • Training requirements: All team members must be trained in trauma-informed care, de-escalation strategies, and harm reduction.
  • Team composition: Mobile crisis teams should have at least one behavioral health professional and may also include a paraprofessional, such as a peer support specialist or nurse.
  • Community linkages: Mobile crisis must have established linkages to community partners.

Medicaid programs can access the 85% enhanced federal match for ARPA mobile crisis services for eligible Medicaid enrollees between the period April, 1, 2022 to March 31, 2027, for up to 12 fiscal quarters. To access this funding, states must first gain approval by amending their state plan or through a waiver authority unless existing mobile crisis services meet ARPA standards. States must also detail their approach for reimbursement in their state plan and/or managed care contracts. Similar to other services, Medicaid reimbursement for benefits are tied to approved services for eligible enrollees. To the extent an individual needs mobile crisis and is uninsured, providers may work to help enroll that individual in Medicaid. If eligible, providers can file claims with retroactive coverage and individuals may be able to access additional follow-up care.

How many states have approval to implement ARPA community-based mobile crisis services?

As of November 2023, 13 states obtained CMS approval for state plans amendments to cover ARPA community-based mobile crisis intervention services, making them eligible for enhanced federal matching funds under the American Rescue Plan Act (ARPA) option (Figure 1). Twenty-five other states reported some coverage for mobile-crisis services in 2022, but it is unclear whether they meet standards for crisis services laid out in ARPA. More than half of all states in a 2022 survey reported plans to adopt the ARPA community-based mobile crisis services option so more states may be in the process of obtaining approvals for these services. Some states may also have ARPA qualifying mobile crisis approved through waivers not captured in count of state plan amendments.

States with Approved Medicaid State Plan Amendments (SPA) for ARPA Community-Based Mobile Crisis Services as of November 2023

Twenty (20) states received state planning grants for ARPA community-based mobile crisis intervention services. Of these, eight received approvals for coverage of these services through state plan amendments. The other 12 states that were awarded planning grants have not yet received approval through state plan amendments, though they may have requests under review with CMS.

Looking ahead

Beyond the ARPA incentives, recent Department of Justice (DOJ) investigations into police handling of mental health calls could spur expansion of mobile crisis. Specifically, in March 2023 a DOJ investigation found that Louisville violated the Americans with Disabilities Act (ADA) by using police for mental health calls that posed no safety threat and could have been managed by a behavioral health response, such as a mobile crisis team. More recently, the DOJ reported similar violations of the ADA against people with behavioral health disabilities in the city of Minneapolis and other investigations are underway. More broadly, a continuum of crisis services can mitigate use of law enforcement, emergency departments, and sometimes jails in responses to mental health emergencies.

Despite developments and recent expansions, implementation challenges may pose barriers to expanding mobile crisis services. Medicaid officials reported workforce shortages as a primary obstacle in expanding mobile crisis services, which affect 24/7 staffing for mobile crises and timely care delivery in rural regions. Officials also pointed to gaps in provider training, lack of technological infrastructure needed to link crisis services, and lack of adequate and sustainable funding as other barriers facing mobile crisis expansions.

The introduction of the 988 Suicide and Crisis Lifeline, with its simple three-digit access prompted a 30% increase in contact volume its first year, highlighting the demand for straightforward, easily navigable, and affordable mental health services. Although 988 has facilitated easier contact with crisis counselors, the availability of follow-up services and other mental health services vary across states. This includes mobile crisis units and crisis stabilization centers, as well as a comprehensive outpatient system, which together would provide a fuller range of support than 988 can offer by itself.

Health Coverage Among American Indian and Alaska Native and Native Hawaiian and Other Pacific Islander People

Published: Nov 30, 2023

Introduction

American Indian and Alaska Native (AIAN) and Native Hawaiian and Other Pacific Islander (NHOPI) people have faced significant and longstanding disparities in health and health care, including high uninsured rates. Moreover, these groups face unique challenges in accessing health care, including geographic isolation, economic challenges, and limited access to culturally appropriate care. Although the federal government has a trust responsibility to meet the health care needs of AIAN people, the Indian Health Service (IHS) has historically been underfunded and unable to meet their health care needs. Adding to the challenges, these groups are often excluded from data and analysis due to their smaller population sizes. This limits the visibility and understanding of the challenges they face in accessing health services and inhibits efforts to address them.

Given the importance of increasing understanding of experiences among these groups as part of advancing equity, this brief provides an overview of AIAN and NHOPI people and their health coverage, as well as the implications for access to health care. It is based on KFF analysis of 2017-2021 five-year American Community Survey (ACS) data and includes data for subgroups among AIAN and NHOPI people where possible. The larger sample size of the ACS with multiple years of data allows for this subgroup analysis. However, research suggests these data may undercount some parts of these populations. See Box 1 for notes on data and methods. Key takeaways include the following:

AIAN and NHOPI people come from diverse backgrounds with unique relationships to the U.S. Many AIAN and NHOPI people identify with more than one race and ethnicity. With over 570 federally recognized tribes, AIAN people vary in their cultures and languages, which has important implications for access to health services and other federal benefits. While some live in rural areas and on or near reservations, the majority live in metropolitan areas. NHOPI people have origins in several islands in the Pacific Ocean that have varying relationships with the U.S. Among NHOPI people residing in the 50 states and DC, most live in Hawai’i and California.

AIAN and NHOPI people vary across key factors that influence health, including citizenship, English proficiency, and income. While nearly all AIAN people are U.S. citizens and are English proficient, there is significant variation among NHOPI people in citizenship and English proficiency by ethnicity, reflecting differing relationships of their areas of ethnic origin to the United States. Although the majority of nonelderly AIAN and NHOPI people are in working families, they have higher rates of poverty than White people (20% and 15% vs. 10%, respectively), with significant variation among AIAN and NHOPI subgroups. For example, among nonelderly AIAN people, those who identify as AIAN alone, AIAN and Black, and AIAN and Hispanic are significantly more likely to be low income compared to their AIAN and White counterparts.

Nonelderly AIAN (16%) and NHOPI (9%) people are more likely to be uninsured than White (7%) people, with wide variation in uninsured rates among subgroups. Among nonelderly AIAN people, uninsured rates are higher among those who identify as AIAN alone (22%) and AIAN and Hispanic (20%) than among those who identify as AIAN and White (12%). Additionally, nonelderly AIAN people who live in Alaska and the Southern Plains (23%) have higher uninsured rates compared to other regions. Among nonelderly NHOPI people, uninsured rates range from less than one in ten of Chamorro (8%), Samoan (8%), and Native Hawaiian (9%) people to nearly one in four (24%) Marshallese people.

These disparities in coverage have important implications for AIAN and NHOPI people. Higher uninsured rates among AIAN and NHOPI people contribute to barriers to accessing and utilizing care, which, in turn, can contribute to worse health outcomes. Although the IHS is the primary mechanism through which the federal government fulfills its trust responsibility to provide health care to AIAN people, it is not health insurance and has been historically underfunded and unable to meet their health care needs. As such, coverage remains important for facilitating access to care. Beyond coverage, AIAN and NHOPI people face significant geographic, cultural, and linguistic barriers to accessing health care, further widening disparities in health and health care. AIAN and NHOPI people also face challenges accessing culturally competent care. Improving data available to understand AIAN and NHOPI peoples’ health and health care experiences, engaging with communities to gather input about their priorities and needs, and community led research may further efforts to address these disparities.

Box 1: Notes on Data and Methods

This analysis is based on data from the 2017-2021 five-year American Community Survey (ACS) and includes people who identify as AIAN or NHOPI as defined by the U.S. Census. We include people who identify as AIAN or NHOPI alone or in combination with another race or ethnicity except where specified as AIAN alone or NHOPI alone. In cases where specified as AIAN alone or NHOPI alone, the data are limited to individuals who identify their race solely as AIAN or NHOPI and report non-Hispanic ethnicity.

Data are limited to people in these groups residing within the 50 states and DC. People who identify as AIAN and NHOPI who reside in areas outside the contiguous 50 states and DC, including US territories and the Federated States of Micronesia are not included in this analysis due to data limitations.

Among AIAN people, data are reported by racial and ethnic subgroup, self-attested Tribal status, and IHS region.

  • The AIAN racial and ethnic subgroups include AIAN alone, AIAN and White, AIAN and Black, AIAN and Hispanic, AIAN and Asian, AIAN and two or more other races.
  • Tribal affiliation is only reported among individuals who identify as AIAN alone due to data limitations and is based on whether respondents write the name of an “enrolled or principal tribe” in set aside boxes in the ACS. In this brief, individuals who report a specific Tribe are defined as Tribally affiliated and individuals who do not are classified as not Tribally affiliated.
  • IHS region is defined using state level groupings commonly used by some federal agencies and in published researched. This definition divides the states into six regions: East, Northern Plains, Southern Plains, Southwest, Pacific Coast, and Alaska (see Appendix 1A). While the IHS divides its services into 12 regions, the six-region definition was selected to align with the available geographies in the ACS data file.

Among NHOPI people, data are reported for ethnic identity, and geographic region. Data reported by ethnic identity are limited to NHOPI people who identify as NHOPI alone and includes people who identify as Native Hawaiian alone, Samoan alone, Tongan alone, Chamorro alone, Marshallese alone, Fijian alone, and other Pacific Islander alone. Geographic region is categorized using the Census geographic regions and include Northeast, Midwest, South, and West.

Overview of AIAN and NHOPI People in the U.S.

The AIAN and NHOPI populations have grown over time and become increasingly multiracial. Compared with other racial groups, AIAN and NHOPI people are more likely to identify as multiracial. Nearly one in three (31%) AIAN people identify as AIAN alone while 69% identify as AIAN and another racial or ethnic group, including 29% who say they are AIAN and White, 13% who say they are AIAN and Hispanic, and 23% who say they are AIAN and another race, including those who say they are AIAN and Black, AIAN and Asian, or AIAN and more than two other races (Figure 1). Similarly, among the nearly 1.4 million people in the U.S. who identify as NHOPI, 36% identify as NHOPI alone while nearly two in three (64%) say they are NHOPI and another racial or ethnic group, including 38% who say they are NHOPI and two or more other races, 13% who say they are NHOPI and White, 7% who say they are NHOPI and Asian, and smaller shares who report they are NHOPI and Hispanic (4%) or NHOPI and Black (1%). The numbers of AIAN and NHOPI people who identify with more than one racial or ethnic group have grown over time, likely reflecting some demographic shifts as well as changes in the design of questions used to identify race and ethnicity.

Racial and Ethnic Identity of AIAN People, 2017-2021

Some AIAN people are enrolled in a federally recognized Tribe or a state-recognized Tribe, and others are not enrolled in a Tribe. Tribal enrollment has important implications for access to benefits since members and descendants of members of federally recognized Tribes have broader access to certain federal programs, including the Indian Health Service. Overall, 89% of people who identify as AIAN alone indicate they are affiliated with a Tribe in the ACS data, while 11% do not identify a Tribal affiliation.

NHOPI people include diverse populations originating from several islands in the Pacific Ocean with varying relationships with the U.S. The majority of people who identify as NHOPI alone and are residing in the 50 states and DC are Native Hawaiian (31%), while another 17% are Samoan, 13% are Chamorro, and less than on in ten are Fijian, Marshallese, and Tongan (Figure 2).

Native Hawaiian and Other Pacific Islander People by Ethnicity, 2017-2021

AIAN and NHOPI people live across the country but are concentrated in certain states (Figure 3). Three quarters (75%) of AIAN people live in the Southern (34%) and Western (41%) regions of the country with four in ten residing in just five states: California (15%), Oklahoma (9%), Texas (7%), Arizona (7%), and New Mexico (4%). (Among people who identify as AIAN alone, nearly half (49%) live in the Western region, with most living in Oklahoma, Arizona, and New Mexico.) While many AIAN people live in rural areas, only 13% live on reservations or land trusts. As of 2020, 60% of AIAN people live in metropolitan areas. Among NHOPI people living within the 50 states and DC, nearly half reside in Hawai’i (26%) and California (23%) (Figure 3). NHOPI people also reside outside of the states in the U.S. territories of Guam, Samoa, the Commonwealth of the Northern Mariana Islands (CNMI), and the Freely Associated States (FAS) of Micronesia, the Republic of the Marshall Islands, and the Republic of Palau. However, data available for NHOPI people living in the territories and FAS are limited.

Distribution of AIAN People by State, 2017-2021

While nearly all AIAN people (96%) are U.S. citizens, citizenship status among NHOPI people residing in the U.S. varies, reflecting differences in citizenship rights across locations to which NHOPI people trace their origins. For example, nearly all Native Hawaiian and Chamorro people are U.S. citizens while over half (55%) of Marshallese, 25% of Fijian, 19% of Tongan, and 11% of Samoan people are noncitizens (Figure 4). This variation reflects differences in constitutional and birth citizenship rights across locations to which NHOPI people trace their origins. For instance, people born in Hawai’i and the U.S. territories Guam (Chamorro people) and Northern Mariana Islands are U.S. citizens by birth. However, those born in the U.S. territory American Samoa are not granted citizenship but instead are considered U.S nationals, a status that excludes them from voting and holding any government office or certain government jobs. People born in the FAS (the Marshall Islands, Micronesia, and Palau) are not conferred U.S. citizenship at birth. Instead, the FAS are independent nations that each have a Compact of Free Association (COFA) with the U.S. government. The remaining Pacific Islands — including Tonga, Fiji, and Samoa — are independent nations and therefore NHOPI people born in these countries are not provided U.S. citizenship at birth.

Percent of NHOPI People who are Noncitizens, 2017- 2021

English Proficiency, Work Status and Income

Among the nonelderly population, AIAN and NHOPI people vary across key factors that influence health coverage, including English proficiency, work status and income.

AIAN and NHOPI people are more likely to have limited English proficiency compared to their White counterparts. Nearly one in ten nonelderly AIAN (7%) people and NHOPI (7%) people report speaking English less than very well compared to 1% of White people, reflecting that these groups have their own languages that were used prior to colonization. There are wide variations in English proficiency among AIAN and NHOPI subgroups (Figure 5). Among nonelderly AIAN people, the share of people who report speaking English less than very well ranges from less than one percent for people who identify as both AIAN and White to 25% for those who identify as AIAN and Hispanic. Among NHOPI people, the share of people who report speaking English less than very well ranges from 2% for Native Hawaiian people to 35% for Marshallese people.

Limited English Proficiency Among Nonelderly AIAN People, 2017-2021

The majority of nonelderly AIAN and NHOPI people are in working families, but there is significant variation in income among AIAN and NHOPI people. More than nine in ten nonelderly NHOPI (95%) and AIAN (92%) people are in a family with at least one worker, similar to the share of nonelderly White people (95%). Although the majority are in working families, nonelderly AIAN (20%) and NHOPI (15%) people are significantly more likely to have income below the poverty level than their White counterparts (10%), reflecting disproportionate employment in lower wage jobs. Among nonelderly AIAN people, the share of households with incomes below the federal poverty level ranges from 14% among people who identify as AIAN and Asian to 26% among people who identify as AIAN alone and those who identify as AIAN and Black, largely reflecting differences in family work status (Figure 6). Among NHOPI people, the share of households with incomes below the federal poverty level ranges from over one quarter of Marshallese people (27%) to 11% among Fijian people.

Work Status and Family Income Among Nonelderly AIAN and NHOPI People, 2017-2021

Health Coverage for AIAN and NHOPI People

Among the nonelderly population residing in the U.S., 16% of AIAN people and 9% of NHOPI people were uninsured compared with 7% of White people (Figure 7). Both AIAN (54%) and NHOPI (68%) people have lower rates of private coverage compared to their White counterparts (78%) reflecting disproportionate employment in lower wage jobs that are less likely to offer health coverage. Medicaid coverage helps fill some of this gap in private coverage, particularly among children. Three in ten (30%) nonelderly AIAN people and nearly one quarter (23%) of nonelderly NHOPI people have Medicaid coverage compared to 15% of their White counterparts. Medicaid and the Children’s Health Insurance Program (CHIP) cover larger shares of children than adults, reflecting more expansive eligibility levels for children. Over four in ten AIAN children (44%) and 35% of NHOPI children are covered by Medicaid or CHIP. However, AIAN (9%) and NHOPI (5%) children still remain more likely to be uninsured compared with their White peers (4%), although the difference for NHOPI children is small.

Insurance Coverage among Nonelderly AIAN and NHOPI People, 2017-2021

Health Coverage Among AIAN People

Health coverage for AIAN people is important despite the role of the IHS (see Box 2). Under treaties and laws, the U.S. has a unique responsibility to provide certain rights, protections, and services to AIAN people, including health care. The IHS is the primary vehicle the U.S. government uses to fulfill this responsibility, although chronic underfunding and other barriers continue to limit access to care for AIAN people. The IHS provides health care and disease prevention services to AIAN people through a network of hospitals, clinics, and health stations. The services provided through the IHS consist largely of primary care and include some ancillary and specialty services. Direct services provided through IHS and Tribally operated facilities generally are limited to members or descendants of members of federally recognized Tribes who live on or near federal reservations. Urban Indian health programs serve a wider group of AIAN people. AIAN people receiving services through IHS providers are not charged or billed for the cost of their services. Although IHS provides some health services, it is not health insurance coverage. IHS has historically been underfunded and unable to meet the health care needs of AIAN people. Given its limitations, health coverage is important for facilitating access to care for AIAN people and helping support providers serving AIAN people. However, some AIAN people prefer relying on IHS for care versus enrolling in health coverage because they believe that the federal government has the responsibility to provide and fund all needed care through the IHS. Others may be unaware of the availability of other coverage options or find the enrollment process confusing or challenging.

Box 2: Overview of the Indian Health Service

The IHS provides health care and disease prevention services to AIAN people through a network of hospitals, clinics, and health stations. In addition to medical care, the IHS provides a wide range of other services, including sanitation and public health functions. In exchange for lands and resources, the federal government provides health services through facilities that are managed directly by IHS, by Tribes or Tribal organizations under contract or compact with the IHS, and urban Indian health programs. As of 2021, there are a total of 687 IHS and Tribally owned or operated facilities located mostly on or near reservations. In addition, there are 41 urban Indian programs operating in 39 sites located in cities throughout the U.S.

If facilities are unable to provide needed care, the IHS and Tribes may contract for health services from private providers through the IHS Purchased/Referred Care (PRC) program. However, due to limited funding, services through PRC are often rationed based on medical need, such as emergency care for life-threatening illnesses and injuries. Urban Indian health organizations do not participate in the PRC program and do not receive PRC funding for health services beyond the scope of what they can provide.

Direct services provided through IHS and Tribally operated facilities generally are limited to members or descendants of members of federally recognized Tribes who live on or near federal reservations. AIAN people receiving services through IHS providers are not charged or billed for the cost of their services. Urban Indian health programs serve a wider group of AIAN people, including those who are not able to access IHS or Tribally operated facilities because they do not meet eligibility criteria or because they reside outside their service areas. However, funding to urban Indian health programs is limited to 1% of the IHS budget despite the overall demographic shift of AIAN people away from reservations. To address the needs of AIAN people who live in metropolitan areas, there have been recent recommendations to fully fund urban Indian health services.

The IHS is a discretionary program with limited funding that relies on Congressional appropriations each fiscal year. This funding process contributed to uncertainty, operations challenges, and, in some cases, disruptions in care if the Congress was delayed in passing appropriations. Beginning in FY 2023, Congress enacted advanced appropriations for the IHS, which is expected to provide greater stability in funding in the event of a government shutdown by allowing IHS to request funding for the upcoming fiscal year as well as the following year. However, funding will remain constrained to appropriated amounts.

Although the IHS discretionary budget has increased over time, funds are not equally distributed across IHS facilities and remain insufficient to meet health care needs. As such, access to IHS services varies significantly across locations, and AIAN people who rely solely on IHS often lack access to needed care. Moreover, access to services through the PRC is significantly limited with IHS data showing that over 250,000 services worth an estimated $1.1 billion were denied or deferred in FY 2020. The IHS also experiences medical staff shortages and continues to have challenges recruiting and retaining health professionals.

Given that appropriations have been insufficient to enable many IHS providers to meet the needs of the populations they serve, they often rely on revenues from third party payers, including Medicare, Medicaid, the Veterans Administration, and private insurance, to help reduce shortfalls between capacity and need. Medicaid is the largest third-party payer accounting for two-thirds (67%) of total third-party revenues as of 2021. In contrast to IHS funds, Medicaid funds are not subject to annual appropriation limits and, since Medicaid claims are processed throughout the year, facilities receive Medicaid funding on an ongoing basis for covered services. As such, Medicaid revenues help facilities cover operational costs, including provider payments and infrastructure developments.

Unlike other Medicaid costs which are shared by the federal government and states, the federal government covers 100% of costs for services provided to AIAN Medicaid enrollees through an IHS or Tribally operated facility, whether operated by the IHS or on its behalf by a Tribe. Urban Indian health programs do not currently receive this 100% federal Medicaid match. The American Rescue Plan authorized 100% match for urban Indian health programs for a temporary period that expired. There have been calls for and proposed legislation to permanently extend 100% funding to urban Indian health programs.

There are wide variations in uninsured rates among AIAN people by racial subgroup, IHS region, and Medicaid expansion status (Figure 8). Among nonelderly AIAN people, those who identify as AIAN alone (22%) and AIAN and Hispanic (20%) have higher uninsured rates than people who identify as AIAN and other racial groups. Among nonelderly people who identify as AIAN alone, uninsured rates are higher among people who indicate they are affiliated with a Tribe (23%) compared to people who do not indicate a Tribal affiliation (17%). This may, in part, reflect greater reliance on IHS for health care among those affiliated with a Tribe. However, IHS is not insurance and people relying solely on IHS may face gaps in care as noted above. Uninsured rates also vary by IHS region, ranging from 10% for those in the Pacific Coast region to 23% for those in the Alaska and Southern Plains region. The higher uninsured rate in Alaska largely reflects a lower rate of private coverage (37% vs. 54% of nonelderly AIAN overall), while the higher rate in the Southern Plains region largely reflects a relatively low rate of Medicaid coverage (21% vs. 30% for nonelderly AIAN overall) which is largely driven by the fact that two (Texas and Kansas) out of three states in the region have not implemented the ACA Medicaid expansion to low-income adults. Overall, uninsured rates among nonelderly AIAN people are higher in states that have not implemented the ACA Medicaid expansion than in expansion states, based on expansion status as of 20211  (Figure 8). In non-expansion states, eligibility for parents remains limited to very low income levels and other adults are not eligible.

Health Coverage of Nonelderly AIAN People by Racial/Ethnic Identity, Geographic Region, and Medicaid Expansion Status, 2017-2021

Health Coverage Among NHOPI People

Uninsured rates among NHOPI people vary by where they live as well as by ethnicity. Uninsured rates are lowest among nonelderly NHOPI people living in the Western region of the country (7%) compared to the Northeast (8%), Midwest (11%), and South (17%) (Figure 9). This regional variation likely reflects differences in state Medicaid expansion decisions, with more non-expansion states in the South. Among NHOPI people, uninsured rates are two times higher among those who reside outside of Hawai’i (10%) compared to those who live in Hawai’i (5%). The lower uninsured rate in Hawai’i largely reflects a higher rate of private coverage as a result of the Hawai’i employer mandate. Overall, uninsured rates for nonelderly NHOPI people in states that had not expanded Medicaid as of 2021 are twice as high compared to rates in states that had expanded (16% vs. 8%). Uninsured rates also vary by ethnicity among nonelderly people who identify as NHOPI alone, ranging from 8% for Samoan people to 24% for Marshallese people. These differences are largely driven by differences in Medicaid coverage rates, which range from 17% among Chamorro people to 29% among Samoan and Marshallese people (Figure 9). These differences in Medicaid coverage largely reflect higher shares of noncitizen immigrants among some subgroups of NHOPI people since noncitizen immigrants face restrictions on eligibility for Medicaid and CHIP coverage. Across ethnic subgroups of people who identify as NHOPI alone, noncitizen immigrants are significantly more likely to be uninsured than their citizen counterparts (data not shown). Moreover, many of these same groups have higher rates of limited English proficiency which can also increase barriers to accessing health coverage.

Health Coverage of Nonelderly NHOPI People by Ethnicity, Geographich Region, and Medicaid Expansion Status, 2017-2021

Implications for Health Care for AIAN and NHOPI People

Higher uninsured rates among AIAN and NHOPI people contribute to barriers to accessing and utilizing care, which, in turn, can contribute to worse health outcomes. Health insurance coverage makes a difference in whether and when people receive medical care, where they get their care, and ultimately how healthy they are. Uninsured people are far more likely than those with insurance to postpone or forgo health care. Postponed or forgone care can lead to preventable conditions or chronic diseases going undetected and worsening. In addition, for many uninsured people, health care costs create financial distress and can lead to debt as well as difficult choices between health care costs and paying for other needs, like housing, food, and transportation. AIAN and NHOPI people are more likely to report lacking a usual source of care as well as foregoing care due to cost compared to White people. Moreover, the end of the Medicaid continuous enrollment provision may lead to higher uninsured rates and widening disparities for AIAN and NHOPI people, particularly those with limited English proficiency. As of November 14, 2023, an estimated 10.6 million people have been disenrolled.

Beyond coverage, AIAN and NHOPI people face other challenges that limit their ability to access health care and can negatively influence health. Reflecting ongoing structural inequities, AIAN and NHOPI people fare worse than their White counterparts on many social and economic measures that can affect the ability to access health care and negatively influence health, including having lower levels of income and educational attainment, being less likely to own a home, being more likely to live in crowded housing, and being less likely to own a vehicle. AIAN people also are less likely to have internet access. Given that some AIAN and NHOPI people live in rural and isolated areas that may require long travel distances to health care, transportation can be a key challenge to accessing health care. These challenges are exacerbated by the limited availability of providers and provider shortages in rural areas. In particular, analysis points to challenges filling provider positions in IHS facilities. Similarly, analysis of provider patterns in Hawai’i, which is home to a large share of NHOPI people, finds an overall physician shortage, as well as a shortage of NHOPI physicians and limited availability of these physicians in areas where NHOPI people live. AIAN and NHOPI people also face challenges accessing culturally and linguistically appropriate care. AIAN and NHOPI people have experienced a long history of abuse and mistreatment by the federal government, including forcible removal from their native lands and efforts to eliminate their languages and cultural practices. Differing cultural beliefs and values about health and limited cultural understanding among providers can present barriers to accessing health care.

These barriers to accessing care and other underlying drivers of health and health care inequities contribute to poor health outcomes for AIAN and NHOPI people. Across many measures of health, AIAN people fare worse than their White counterparts, including self-reported health status, infant and pregnancy-related mortality, and deaths due to suicide and drug overdoses. AIAN people have the shortest life expectancy across racial and ethnic groups and experienced a recent sharp decline in life expectancy, likely as a result of COVID-19. Data on health outcomes for NHOPI people remain more limited, although they also fare worse compared to their White counterparts for many of the measures for which data are available, including high rates of infant mortality.

Continued efforts to increase data available to understand AIAN and NHOPI peoples’ health and health care experiences and to engage with community members will be important for addressing disparities. Prioritizing data collection and reporting to identify and address disparities is an important component of advancing health equity. There are efforts underway to expand and improve availability of disaggregated data, including a charge from the Biden Administration to address the systemic lack of disaggregated data. These federal-level efforts to disaggregate data may help identify health disparities among smaller racial and ethnic groups and subgroups of larger racial and ethnic groups. They also may inform more culturally attuned and community-informed responses to addressing disparities, including initiatives focused on cultural connection and language preservation. Practices that exclude data for small racial and ethnic groups can leave these groups invisible, masking the disparities they may face and potentially impacting the allocation of resources to address their needs. Engaging with AIAN and NHOPI communities to gather input about their priorities and needs and addressing issues such as data sovereignty and community led research also will be important for addressing disparities, as well as working with providers, officials, and institutions to earn trust with individuals and communities by directly addressing concerns and recognizing historic and ongoing racism and discrimination within the health care system.

KFF would like to thank Dr. Donald Warne and Mr. Brett Lee Shelton with the Johns Hopkins Center for Indigenous Health for helpful review and comments.

Appendix

Map of Indian Health Service (IHS) Regions (Copy)
  1. For this analysis, state Medicaid expansion status is determined as of 2021, however there were changes in the number of states that implemented Medicaid expansion between 2017 and 2021. Therefore, coverage estimates by Medicaid expansion status may be under or overestimated given the changes in state expansion status during this period. ↩︎
News Release

Many Immigrants, Including Naturalized Citizens, Don’t Feel Well-Represented by Either Political Party, Though More Align with Democrats than Republicans

KFF-Los Angeles Times Survey of Immigrants Explores Diverse Views on Immigration Policy and Politics

Published: Nov 30, 2023

Immigrants, including those who are naturalized citizens, are more likely to align with the Democratic party and its positions on immigration issues than they are with the Republican party and its positions, though many say that neither party represents their views, the KFF-Los Angeles Times Survey of Immigrants reveals.

A new report based on the KFF-Los Angeles Times partnership survey explores the diverse views of immigrants on the politics and policies surrounding immigration law – a polarizing political issue that rarely includes the views of immigrants themselves, most of whom are naturalized U.S. citizens eligible to vote in elections. The Los Angeles Times features the survey data as part of its ongoing “Immigrant Dreams” project, including a column focused on politics.

Immigrants overall are twice as likely to say that the Democratic Party (32%) represents their political views better than the Republican Party (16%). The gap is similar among naturalized citizens (37% say the Democratic Party, 21% say the Republican party). Immigrants, including naturalized citizens, also much more likely to say to immigrants as a group have fared better under President Biden than under President Trump.

Immigrants overall are twice as likely to say that the Democratic Party (32%) represents their political views better than the Republican Party (16%). The gap is similar among naturalized citizens (37% say the Democratic Party, 21% say the Republican party). Immigrants, including naturalized citizens, also much more likely to say to immigrants as a group have fared better under President Biden than under President Trump. Still, large shares don’t lean towards either party on these questions. One quarter say neither party represents their personal political views and a similar share (27%) say they’re not sure, and about half (47%) say that when it comes to lives of immigrants, it makes no difference who the president is.

“Like many Americans, many immigrants don’t see politics as dramatically changing their lives,” KFF President and CEO Drew Altman said. “Those that do favor Democrats and Biden about two to one. But there is no immigrant vote; there are many immigrant groups and many immigrant votes state by state.” 

Among the survey’s other findings:

  • Support for the DREAM Act. Similar to people born in the United States, a large majority of immigrants (79%) say that it is a “good idea” to allows undocumented immigrants brought to the U.S. as children to apply for citizenship – a policy known as the DREAM Act which Congress has considered in various forms over the past two decades. This includes at least three quarters of naturalized citizens, green-card or visa holders, and immigrants who are likely undocumented.
  • Health coverage for undocumented immigrants. Most immigrants say that allowing undocumented immigrants to sign up for government health insurance is a good idea (59%), though naturalized citizens are divided, with nearly equal shares saying the idea is “good” and “bad” (49% and 48%, respectively). Among people born in the United States, a large majority (69%) say such coverage is a “bad idea.”
  • Enforcement of immigration laws. Immigrants hold mixed views on the nation’s enforcement of its immigration laws, with nearly one in five saying enforcement is “too tough” (19%) and a similar share saying it is “not tough enough.” Naturalized citizens are more likely to say that enforcement is not tough enough, while those who are likely undocumented or hold green cards or visas are more likely to say that enforcement is “too tough.” 

The largest nationally representative survey of immigrants, the KFF-Los Angeles Times Survey of Immigrants is a probability-based survey of 3,358 immigrant adults (people ages 18 and over living in the U.S. who were born outside the U.S. and its territories) conducted between April 10-June 12, 2023. Respondents were contacted via mail or telephone; had the choice to complete the survey in English, Spanish, Chinese, Korean, Vietnamese, Portuguese, Haitian-Creole, Arabic, French, or Tagalog; and responded either online, via telephone, or on a paper questionnaire. SSRS managed sampling, data collection, weighting, and tabulation for the project. Teams from KFF and the Los Angeles Times worked together to develop the questionnaire and analyze the data. Each organization is solely responsible for its content. The margin of sampling error is plus or minus 2 percentage points for results based on the full sample. 

Poll Finding

Political Preferences and Views on U.S. Immigration Policy Among Immigrants in the U.S.: A Snapshot from the 2023 KFF/LA Times Survey of Immigrants

Published: Nov 30, 2023

Findings

Immigration has been a hot-button issue in U.S. political debate for decades, with policymakers trying to balance economic, security, and humanitarian concerns, and candidates on both sides using immigration talking points to appeal to their base. Immigration policy at the federal level has often shifted dramatically between presidential administrations, and enforcement differs between states. However, debates over immigration policies, including those that restrict or promote pathways to citizenship and access to benefits for undocumented immigrants, often leave out the viewpoints of immigrants themselves, and in some cases, immigrant feel they are treated as pawns in a political game.

A majority of immigrants are naturalized citizens (58%) and thus eligible to vote in U.S. elections, but their views are not often explored in polls of the general public. Immigrants who are noncitizens may have other ways to influence the U.S. political process, but many face language barriers and immigration-related fears that make it difficult for them to engage in the political process.

The Survey of Immigrants, a partnership between KFF and The Los Angeles Times, is the largest nationally representative survey focused on immigrants, interviewing 3,358 immigrant adults in 10 languages. This report focuses on the political engagement, attitudes, and policy preferences of the growing immigrant population in the U.S.

Highlights

  • Most immigrants (62%) say they pay attention to politics and government in the U.S. a least a “fair amount,” though few (17%) say they pay “a lot” of attention. Older immigrants, naturalized citizens and those who are English proficient are among the most likely groups of immigrants to say they pay a lot of attention to U.S. affairs.
  • Immigrants, including naturalized citizens, lean more towards the Democrats when asked which political party represents their own views, which party best represents the interests of immigrants overall, and whether immigrants were better off under the Biden or Trump presidencies.
  • However, many immigrants do not feel that their views or the interests of immigrants generally are well represented by either of the two major U.S. political parties, and half of all immigrants say that who the president is makes no difference in the lives of immigrants.
  • Like most U.S.-born adults, a large majority (79%) of immigrant adults support allowing undocumented immigrants who were brought to the U.S. as children to apply for citizenship. A smaller majority of immigrants (59%) also supports allowing undocumented immigrants to sign up for government-sponsored health insurance, though immigrants who are naturalized citizens are split on this question and a majority (69%) of U.S.-born adults are opposed.

Attention to Politics and Political Leanings of Immigrants

Most immigrants report paying at least some attention to U.S. politics, with those who are older, English proficient, and naturalized citizens being the most engaged. About six in ten (62%) immigrants say they follow politics and government in the U.S. a lot (17%) or a fair amount (45%), with majorities across age and immigration statuses saying they follow it at least a fair amount. Immigrants ages 65 and older, naturalized citizens, and immigrants who speak English at least “very well” are most likely to report that they pay “a lot” of attention to politics and government in the U.S.

A Majority Of Immigrants Say They Pay Attention To U.S. Politics At Least A  Fair Amount

Twice as many immigrants say that immigrants in general are better off under a Biden presidency than a Trump presidency, but about half say who the president is makes no difference in the lives of immigrants. One in three (33%) say immigrants are better off under Biden, and one in six (16%) say immigrants were better off under Trump.

Immigrants who say they follow U.S. politics “a lot” or “a fair amount” are more likely than those who do not to say who the president is makes a difference, yet across levels of political interest, immigrants lean towards President Biden when asked which recent president was better for immigrants. While, unsurprisingly, six in ten immigrants who say they are best represented by the Democratic Party say immigrants are better off under Biden and about half (53%) of Republican-identifying immigrants say immigrants are better off under Trump, one-third of immigrants who say they are best represented by either the Democrats (34%) or Republicans (32%) say it “makes no difference” who the president is.

Twice As Many Immigrants Say They Are Better Off Under President Biden Than Trump, But Half Say It Makes No Difference

Larger shares of immigrants say that the Democratic Party represents their own personal political views better than the Republican Party. Immigrants overall are twice as likely to say that the Democratic Party (32%) represents their political views better than the Republican Party (16%). However, this still leaves about half of immigrants saying that neither party (25%) best represents their views or that they are not sure (27%). Majorities of undocumented immigrants (76%), recent immigrants (67%), immigrants who do not pay attention to U.S. politics (65%), and younger immigrants (ages of 18 and 29) (65%) say they are “not sure” or that neither party represents their political views.

Immigrants differ by race and ethnicity on their partisan leanings, with Hispanic, Asian, and Black immigrants leaning towards the Democratic Party and White immigrants more evenly split between saying the Democratic and Republican parties best represent their views. Across racial and ethnic groups, large shares—between four in ten and six in ten—say neither party best represents them or that they are not sure.

Although more Hispanic immigrants say they feel better represented by the Democratic Party, there are some differences by country or region of origin. Immigrants from South America (18%), Central America (15%), and the Caribbean (18%) are about twice as likely as those from Mexico (7%) to say the Republican Party best represents their political views. Roughly equal shares—three in ten—across these countries and regions say they feel represented by the Democrats, though larger shares of immigrants from Central America (41%) and Mexico (38%) say they are “not sure” which party better represents their views compared to those from South America (26%) or the Caribbean (23%). Among immigrants from Asia, there are few differences by country or region of origin.

Immigrants in California are more likely to say the Democratic party represents their views (36%) while a smaller share in Texas says the same (25%). Yet in both states, about three in ten immigrants say they are not sure and about one in four say neither party better represents their political views.

Twice As Many Immigrants Say The Democratic Party Represents Their Own Views Than The Republicans, Though Many Say "Neither Party" Or They Are Not Sure

Nearly half of immigrants (46%) say they think the Democratic Party represents the interests of immigrants at least “somewhat well,” more than twice the share who say the same about the Republican Party (20%). Immigrants across immigration statuses are more likely to say the Democratic Party represents immigrants’ interests well than the Republican Party. Three in ten say they are “not sure” about how well the Republican (33%), or Democratic (31%) Parties represent the interests of immigrants. Noncitizens are more likely to say they are “not sure” how well each of the political parties represent the interests of immigrants.

More Say The Democratic Rather Than The Republican Party Represents Immigrants' Interests Well, Though One-Third Are Unsure

In Their Own Words: Views and Attitudes Towards U.S. Politics and Enforcement Policies

In focus groups, many immigrants expressed that they felt their lives were better off under President Biden than President Trump, though some participants expressed that who the president is does not matter. Many said they feel they are “used as pawns” or “just for their vote.” When asked whether they think their voices are heard, many in these focus groups expressed that they thought voting “doesn’t make a difference,” and many voiced frustrations with the U.S. political system. These mixed feelings are captured in the quotes below.

“I feel the whole thing about politics and immigration is like putting the immigrants as a bait. I see a lot of promises. They come to power and say we are going to do this and that for the immigrants but nothing ever happens. But I feel personally they put the immigrants as bait and of course everybody is better than Trump, which I have to agree but I don’t see any progress.” – 47-year-old Indian immigrant woman in New York

“I feel like they give us the right by voting when a Latino can vote. But other than that, forget it. They just take our vote.” – 36-year-old Mexican immigrant woman in Texas

“During that Trump Administration he built his platform on being stricter on immigration specifically. He said we are going to send out ICE agents to capture all the illegal immigrants and there [were] videos in the media of people being arrested and deported. My family, although we are of legal status here, the process for getting to that point for us was very traumatic. So even though we were of legal status, we still felt scared because all that kind of very extremist stuff about anti-immigration was very scary.” – 24-year-old Korean immigrant woman in New York

“I feel more human right now. Even if the money is not doing well, I feel human. Those of us who are here, we would want documents but I am very pleased that our current President [Biden] gives asylum to refugees” – 34-year-old Mexican immigrant woman in California

Attitudes Towards Immigration Policies

Immigrants have mixed views in their assessments of whether U.S. enforcement of immigration laws is too tough or not tough enough, which stands in stark contrast to the views of U.S.-born adults.1  About one in five immigrant adults say the U.S. is “too tough” (19%) and a similar share say the U.S. is “not tough enough” (18%) in enforcing immigration laws, while about one-fourth (27%) say enforcement is “about right,” and about one-third (35%) say they are not sure. U.S.-born adults are much more likely to say that enforcement of these laws is “not tough enough” (52%), while one in six say enforcement is “too tough” (15%) or “about right” (14%). Immigrants vary somewhat in their assessments of immigration enforcement by immigration status, as naturalized citizens are somewhat more likely to say the U.S. is not tough enough in enforcement, while those who are likely undocumented are more likely to say they are “not sure.”

One In Five Immigrants Say The U.S. Is Too Tough In Immigration Enforcement, Including Three In Ten Likely Undocumented Immigrants

Immigrants’ views on U.S. enforcement of immigration laws are also largely divided by their political leanings. Immigrants who say their views are best represented by the Democratic Party (referred to here as Democratic-leaning) are more likely than Republican-leaning immigrants or immigrants who do not feel represented by either political party to say that enforcement in the U.S. is “too tough” (29%). Republican-leaning immigrants are most likely to say that enforcement in the U.S. is “not tough enough” (48%). However, many immigrants are not sure if immigration enforcement in the U.S. is too tough or not, including about one in four Democratic-leaning (26%) immigrants, one in five Republican-leaning (22%) immigrants and 45% of immigrants who do not have a political leaning.

About Half Of Republican-Leaning Immigrants Say U.S. Enforcement Of Immigration Policy Is Not Tough Enough, Few Others Say The Same

The idea of allowing undocumented immigrants who were brought to the U.S. as children to apply for citizenship is widely popular, with about eight in ten immigrants (79%) and two-thirds of U.S.-born adults saying this is a “good idea.” This proposal has been introduced to Congress in a variety of forms over the past two decades as The Development, Relief, and Education for Alien Minors Act, or DREAM Act, but has failed to pass. Immigrants across partisan affiliation and citizenship status largely support the policy, though fewer (55%) Republican-leaning immigrants say this is a good idea. Under the Deferred Action for Childhood Arrivals (DACA) program created in 2012, eligible young adults who were brought to the U.S. as children can receive protection from deportation and work authorization for temporary, renewable periods. However, DACA does not provide a pathway to U.S. citizenship, and the federal government is not currently processing new DACA requests due to court orders.

While a majority of immigrants support allowing undocumented immigrants to sign up for government-sponsored health insurance, a majority of U.S.-born adults say this is a “bad idea.” Nearly twice the share (59%) of immigrants than U.S.-born adults (30%) say this policy is a “good idea.” Even still, immigrants are split by immigration status and partisan affiliation on their support for this policy. Immigrants who are likely undocumented or lawfully present are more likely to say this policy is a “good idea” (85% and 68%) while naturalized citizens are split, with half saying it is a “good idea” (49%) and half saying it is a “bad idea” (48%). Similar shares of Democratic-leaning immigrants say the policy is a good idea (71%) and Republican-leaning immigrants say it is a bad idea (71%).

Notably, these questions did not offer arguments for or against the policies, and support may be higher or lower in a more contextualized situation.

Large Shares Of Immigrants And U.S.-Born Adults Support The Dream Act, But Are Split On Support For Government Insurance For Undocumented Immigrants

KFF would like to thank the Association of Asian Pacific Community Health Organizations, the Black Alliance for Just Immigration, Dr. May Sudhinaraset, the National Immigration Law Center, the National Resource Center for Refugees, Immigrants, and Migrants, and UnidosUS for their invaluable inputs, insights, and suggestions throughout the planning, fielding, and dissemination of this survey project.

Methodology

The KFF/LA Times Survey of Immigrants is a partnership survey conducted by KFF and the LA Times examining the U.S. immigrant experience.

The survey was conducted April 10-June 12, 2023, online, by telephone, and by mail among a nationally representative sample of 3,358 immigrants, defined as adults living in the U.S. who were born outside the U.S. and its territories. Respondents had the option to complete the survey in one of ten languages: English (n=2,435), Spanish (n=627), Chinese (n=171), Korean (n=52), Vietnamese (n=22), Portuguese (n=16), Haitian-Creole (n=13), Arabic (n=9), French (n=9), and Tagalog (n=4). These languages were chosen as they are most commonly spoken by immigrant adults from countries of focus for the survey with limited English proficiency (LEP), based on the 2021 American Community Survey (2021).

Teams from KFF and The Los Angeles Times worked together to develop the questionnaire and both organizations contributed financing for the survey. KFF researchers analyzed the data, and each organization bears the sole responsibility for the work that appears under its name. Sampling, data collection, weighting, and tabulation were managed by SSRS of Glenn Mills, Pennsylvania in collaboration with public opinion researchers at KFF.

Respondents were reached through one of three sampling modes: an address-based sample (ABS) (n=2,661); a random digit dial telephone (RDD) sample of prepaid (pay-as-you go) cell phone numbers (n=565); and callbacks to telephone numbers that that were previously randomly sampled for RDD surveys and were identified as speaking a language other than English or Spanish (n=132). Respondents from all three samples were asked to specify their country of birth and qualified for the survey if they were born outside of the U.S.

Project design was informed by a pilot study conducted from January 31-March 14, 2022 among a sample of 1,089 immigrants in collaboration with SSRS. Prior to fielding the pilot study, KFF and SSRS conducted interviews with experts who had previous experience surveying immigrants. These conversations informed decisions on sampling, modes of data collection, recruitment strategies, and languages of interviews. The pilot test measured incidence of immigrant households across four different sample types and offered a short survey in 8 different languages both online and on the telephone. Based on the results of the pilot test, the following recruitment and data collection protocol was implemented:

Sampling strategy and interview modes:

The ABS was divided into areas (strata), defined by Census tract, based on the incidence of immigrants among the population overall and by countries of origin. Within each stratum, the sample was further divided into addresses that were flagged by Marketing Systems Group (MSG) as possibly occupied by foreign-born adults and unflagged addresses. To increase the likelihood of reaching immigrant adults, strata with higher incidence of immigrant households overall, and of immigrants from certain countries of origin were oversampled.

Households in the ABS were invited to participate through multiple mail invitations: 1) an initial letter in English with a short paragraph of instructions in each of the 10 survey languages on the back; 2) a reminder postcard in English plus up to two additional languages; 3) a follow-up letter accompanied by hardcopy questionnaires in English and one additional language; and 4) a final reminder including short messages in all 10 languages. For mailings 2 and 3, additional languages were chosen by using flags to identify the language other than English likely spoken at home. Invitation letters requested the household member ages 18 or older who was born outside of the U.S. with the most recent birthday to complete the survey in one of three ways: by going online, dialing into a toll-free number, or returning the completed paper questionnaire. In addition, interviewers attempted outbound calls to telephone numbers that were matched to sampled addresses. ABS respondents completed the survey online (n=2,087), over the phone (n=105), or by mail on paper (n=469). The random sample of addresses was provided by MSG.

The RDD sample of prepaid (pay-as-you-go) cell phone numbers was obtained through MSG. The prepaid cell phone component was disproportionately stratified to effectively reach immigrants from different countries based on county-level information. To increase the likelihood of reaching immigrant adults, counties with higher incidence of immigrants overall, and of certain countries of origin were oversampled.

The callback sample included 132 respondents who were reached by calling back telephone numbers that were previously randomly sampled for SSRS RDD surveys within two years and coded by interviewers as non-English or non-Spanish speaking.

Incentives:

Initial mailings to the ABS sample included $2 as part of the invitation package, and respondents received a $10 incentive if they completed the survey in the first two weeks after the initial mailing. In order to increase participation among under-represented groups, the incentive increased to $20 for those who did not respond within the first two weeks. ABS phone respondents received this incentive via a check received by mail, paper respondents received a Visa gift card by mail, and web respondents received an electronic gift card incentive. Respondents in both phone samples received a $25 incentive via a check received by mail.

Questionnaire design and translation:

In addition to collaboration between KFF and the LA Times, input from organizations and individuals that directly serve or have expertise in issues facing immigrant populations helped shaped the questionnaire. These community representatives were offered a modest honorarium for their time and effort to review questionnaire drafts, provide input, attend meetings, and offer their expertise on dissemination of findings.

After the content of the questionnaire was largely finalized, SSRS conducted a telephone pretest in English and adjustments were made to the questionnaire. Following the English pretest, Research Support Services Inc. (RSS) translated the survey instrument from English into the nine languages outlined above and performed cognitive testing through qualitative interviews in all languages including English. The results of the cognitive testing were used to adjust questionnaire wording in all languages including English to ensure comprehension and cohesiveness across languages and modes of interview. As a final check on translation and its overlay into the web and CATI program, translators from Cetra Language Solution reviewed each question, as it appears in the program, and provided feedback. The questionnaire was revised and finalized based on this feedback.

Data quality checks:

A series of data quality checks were run on the final data. The online questionnaire included two questions designed to establish that respondents were paying attention and cases were monitored for data quality. Fifteen cases were removed from the data because they failed two or more quality checks, failed both attention check questions, or skipped over 50% of survey questions. An additional 67 interviews were removed after deemed ineligible by SSRS researchers (they were not U.S. immigrants).

Weighting:

The combined sample was weighted to adjust for the sampling design and to match the characteristics of the U.S. adult immigrant population, based on data from the Census Bureau’s 2021 American Community Survey (ACS). Weighting was done separately for each of 11 groups defined by country or region of origin (Mexico, China, Other East/Southeast Asia, South Asia, Europe, Central America, South America, Caribbean, Middle East/North Africa, Sub-Sahara Africa, all others). The samples were weighted by sex, age, education, race/ethnicity, census region, number of adults in the household, presence of children in the household, home ownership, time living in the U.S., English proficiency, and U.S. citizenship. The overall sample was also weighted to match the share of U.S. adult immigrants from each country/region of origin group. The weights take into account differences in the probability of selection for each of the three sample types. This includes adjustment for the sample design and geographic stratification, and within household probability of selection. Subgroup analysis includes data checks to ensure that the weighted demographics of subgroups are within reasonable range from benchmarks whenever possible.

The margin of sampling error including the design effect for the full sample is plus or minus 2 percentage points. Numbers of respondents and margins of sampling error for key subgroups are shown in the table below. For results based on other subgroups, the margin of sampling error may be higher. Sample sizes and margins of sampling error for other subgroups are available by request. Sampling error is only one of many potential sources of error and there may be other unmeasured error in this or any other public opinion poll. KFF public opinion and survey research is a charter member of the Transparency Initiative of the American Association for Public Opinion Research.

GroupN (unweighted)M.O.S.E.
Total3,358± 2 percentage points
Race/Ethnicity
Black immigrants274± 8 percentage points
Hispanic immigrants1,207± 4 percentage points
Asian immigrants1,318± 4 percentage points
White immigrants495± 6 percentage points
Immigration Status
Naturalized citizen2,134± 3 percentage points
Green card or valid visa holder819± 5 percentage points
Likely undocumented372± 6 percentage points
English Proficiency
Speaks English only or “very well”1,713± 3 percentage points
Speaks English “less than very well”1,635± 3 percentage points

Focus group methodology:

As part of this project, KFF conducted 13 focus groups with immigrant adults across the country to help inform survey questionnaire development, provide deeper insights into the experiences of immigrant groups that had a smaller sample size in the survey, and to provide a richer understanding of some of the survey findings.

Two rounds of focus groups were completed. The first round of 6 groups was conducted between September-October 2022 virtually among participants living across the country who are Hispanic immigrants (conducted in Spanish), Asian (excluding Chinese) immigrants (conducted in English), or Chinese immigrants (conducted in Mandarin Chinese). The groups were separated by gender, lasted 90 minutes, and included 5-7 participants each.

The second round of groups were conducted in-person between May-June 2023 in Los Angeles, CA and Fresno, CA with Hispanic immigrants conducted in Spanish; and in Houston, TX and Irvine, CA with Vietnamese immigrants conducted in Vietnamese. In addition, virtual groups were conducted among participants living in the Texas border region (Hispanic immigrants), the Miami, FL region (Haitian immigrants), and nationally (Black immigrants from sub-Saharan Africa). Groups were mixed gender, lasted between 90 minutes and two hours, and were conducted in English, Spanish, Vietnamese, and Haitian-Creole with 5-8 participants each.

For each group, participants were chosen based on the following criteria: Must be at least 18 years of age and have been born outside of the U.S. and its territories; for groups conducted in languages other than English, must speak English “less than very well” and be able to speak conversationally in the group’s language (i.e., Spanish). In addition, groups were chosen to represent a mix of household composition, including at least some participants who are parents; a mix of household income levels, with a preference for recruiting lower income participants; a mix of health insurance types; and a mix of immigration statuses. Goodwin Simon Strategic Research (GSSR) recruited and hosted the first round of focus groups. PerryUndem recruited and hosted the second round of focus groups. The screener questionnaire and discussion guides were developed by researchers at KFF in consultation with the firms who recruited and hosted the groups. Groups were audio and video recorded with participants’ permission. Each participant was given $150-$175 after participating.

Appendix

Demographic Profile of U.S. Adults by Citizenship and Immigration Status

Country Of Origin By Regions

Endnotes

  1. u00a0u00a0Supplemental to the Survey of Immigrants, KFF also conducted a representative survey of 1,049 U.S.-born adults. to compare the immigrant and native-born experience. KFF/LA Times Survey of Immigrants: U.S. Born Adult Comparison (June 29 u2013 July 9, 2023). ↩︎

A Look at Waiting Lists for Medicaid Home- and Community-Based Services from 2016 to 2023

Authors: Alice Burns, Maiss Mohamed, and Molly O’Malley Watts
Published: Nov 29, 2023

Home- and community-based services (HCBS) waivers allow states to offer a wide range of benefits and to choose—and limit—the number of people who receive services. The only HCBS that states are required to cover is home health, but states may choose to cover personal care and other services such as private duty nursing through the Medicaid state plan. Those benefits are generally available to all Medicaid enrollees who need them. States may use HCBS waivers to offer expanded personal care benefits or to provide additional services such as adult day care, supported employment, and non-medical transportation. Because waivers may only be offered to specific populations, states often provide specialized benefits through waivers that are specific to the population covered, such as providing supported employment only to people under age 65. KFF estimates that over 4 million Medicaid enrollees use HCBS, and that the numbers of people using HCBS through the state plan are similar to the numbers using HCBS through waivers.

States’ ability to cap the number of people enrolled in HCBS waivers can result in waiting lists when the number of people seeking services exceeds the number of waiver slots available. Waiting lists reflect the populations a state chooses to serve, the services it decides to provide, the resources it commits, and the availability of workers to provide services. In addition, states’ waiting list management approaches differ with regard to prioritization and eligibility screening processes, making comparisons across states difficult. States are only able to use waiting lists for optional services so the number of people on waiting lists can increase when states offer a new waiver or make new services available within existing waivers; in these cases, the number of people receiving services increases, but so does the number of people on a waiting list. In many cases, people may need additional services, but the state doesn’t offer them to anyone or only offers them to people with certain types of disabilities. Waiting lists would not capture the unmet needs of those people. Finally, although people may wait a long time to receive waiver services—36 months on average—most people are eligible for other types of HCBS while they wait.

Even though HCBS waiting lists are an imperfect measure of unmet need, there are no alternative measures available. Many HCBS programs were enacted or expanded in response to the Olmstead decision, a court ruling that found the unjustified institutionalization of people with disabilities is illegal discrimination. As the 25th anniversary of Olmstead nears, waiting lists are sometimes described as contributing to the risk of unnecessary institutionalization for people with disabilities, and policy makers across political parties have proposals to address them. A recent proposed rule would require states to report the number of people are on waiting lists but is not clear how that requirement would be defined.

This data note provides new information about waiting lists from KFF’s most recent survey of state Medicaid HCBS programs, including a discussion of why waiting lists are an incomplete measure of unmet need and why they are not necessarily comparable across states or over time. In the 2023 survey, KFF asked states to report the number of people who were on “interest” lists for HCBS, as well as waiting lists, a difference from prior years (see Box 1). Key takeaways include:

  • The number of states that maintain waiting lists or interest lists for people who would like to receive HCBS has fluctuated little between 2016 and 2023.
  • In most years since 2016, there have been close to 0.7 million people on waiting lists or interest lists, with a total of over 692,000 in 2023.
  • Most people on waiting lists or interest lists have intellectual or developmental disabilities and most live in states that do not screen any people for eligibility prior to adding them to waiting lists.
  • Most people on waiting lists or interest lists are eligible for personal care provided through states’ regular Medicaid programs or for services provided through specialized state plan HCBS benefits.

KFF also recently updated the waiting list indicators on State Health Facts to help people better understand who is on waiting lists and what those waiting lists mean.

How did the number of states with waiting lists change between 2016 and 2023?

Between 2016 and 2023 the number of states with waiting lists has fluctuated between 35 and 41 and is currently at 38 states (Figure 1). While some Affordable Care Act (ACA) opponents have cited waiver waiting lists to argue that expanding Medicaid diverts funds from seniors and people with disabilities, research shows that ACA Medicaid expansion has led to gains in coverage for people with disabilities and chronic illnesses. Waiting lists for HCBS predate the ACA Medicaid expansion, which became effective in most states in 2014, and both expansion and non-expansion states have waiting lists. Waiver enrollment caps have existed since HCBS waiver authority was added to federal Medicaid law in the early 1980s.

Box 1: Changes to KFF’s 2023 Survey on Waiting Lists and Interest Lists

In 2023, KFF asked states to report the total number of people who were on a “waiting list, referral list, interest list, or another term” for HCBS whereas older surveys only asked about waiting lists or referral lists. The change reflects states’ increasing use of terms other than “waiting list” to keep track of people who had expressed interest in HCBS but are not receiving services. KFF broadened the survey to increase the comparability of data across states and across years if states transition to use of different terms.

Prior to 2023, some states used terms other than waiting lists to describe their lists and reported data in the KFF survey, but periodically a state would change its terminology and approach, resulting in what appeared a large fluctuation in the number of people on “waiting lists.” For example, in 2018, Louisiana had nearly 30,000 people on a waiting list for their intellectual or developmental disability waiver. The state implemented a new system to screen people for urgent HCBS needs. Those that met the criteria for urgent needs were placed immediately in services and people with less pressing needs were placed on a “registry” that replaced the older waiting list. By 2020, the waiting list was eliminated. KFF’s assessment is that the broader survey question will capture data that are as consistent with the older years’ data as possible and provide for more meaningful comparisons between states.

When asked specifically, the 2023 survey showed how widespread the use of interest lists was: In 2023, there were more people on interest lists (361,000) than on waiting lists (331,000). The use of the term “interest lists” has important ramifications for a proposed rule on Medicaid access. Under that rule, states would be required to report the number of people on waiting lists, but it’s unclear whether the requirement would apply to lists that are described as interest lists or registries.

A smaller change to KFF’s survey in 2023 was to ask the states to report the number of people on the waiting list at the time the survey was completed. Historically, KFF asked states to report the number of people on waiting lists in the prior year. In the spring of 2023, KFF asked states to report the number of people on waiting lists in 2022, but also the number of people currently on the list. Future years’ surveys will only ask about current waiting list numbers.

The Number of States with Waiting Lists or Interest Lists for Medicaid HCBS has Been Fairly Stable Since 2016

Despite the changes to KFF’s survey question, there were few changes in the number of states that reported any waiting lists between the 2022 survey (which requested data from 2021) and the 2023 survey. There were more changes in waiting lists for specific types of waivers, however, with three states eliminating waiting lists for specific waivers, including Connecticut for people with intellectual or developmental disabilities, and North Carolina and West Virginia for people with traumatic brain or spinal cord injuries. Connecticut reported a new list for people with mental health conditions and South Carolina reported several new “processing lists,” that track people’s movement from intake to enrollment for people who are 65 and older or with physical disabilities, for medically-fragile or technology-dependent children, for people with mental health conditions, and for people with HIV or AIDs.

How did the number of people on waiting lists change between 2016 and 2021?

In most years between 2016 and 2023, nearly 0.7 million people have been on waiting lists or interest lists for HCBS (Figure 2). One factor that contributes to changes over time—especially the notable decline between 2018 and 2020—is that not all states screen for Medicaid eligibility prior to adding people to waiting lists and changes in this policy may result in changes in waiting list volumes. For example, between 2018 and 2020, the total number of people on waiting lists decreased by 155,000 or 19%. However, nearly half of that change came from Ohio’s implementation of a waiting list assessment of waiver eligibility, which reduced the size of the state’s waiting list by nearly 70,000 people. In 2023, most states (32) with waiting lists screened individuals for waiver eligibility among at least one waiver, but even among those states, 5 did not screen for all waivers. There were 6 states that do not screen for eligibility among any waivers and those 6 states (Alaska, Illinois, Iowa, Oklahoma, Oregon, and Texas) account for over half of all people on waiting lists. Changes in total waiting lists over time may reflect changes in states’ policies towards eligibility screening (Figure 2).

Over Half of People on HCBS Waiting Lists or Interest Lists Live in States That do not Screen People for Eligibility Prior to Adding Them to the List

In all years since 2016, over half of people on HCBS waiting lists or interest lists lived in states that did not screen people on waiting lists for eligibility. One reason waiting lists provide an incomplete picture of need is that not all people on waiting lists will be eligible for services. Stakeholder interviews about HCBS waiting lists found that when waiver services are provided on a first-come, first-served basis, people enrolled in waiting lists are in anticipation of future need. That study found that in some states, families would add their children to waiting lists for people with intellectual or developmental disabilities (I/DD) at a young age, assuming that by the time they reached the top of the waiting list, their children would have developed the immediate need for services. Many of those waivers offer comprehensive HCBS packages that include supported employment, supportive housing, or round-the-clock services. Among the six states that do not screen people for eligibility on any lists, five have only waiting lists and the sixth uses interest lists (Illinois does not establish eligibility until selection but does do a preliminary evaluation of eligibility prior to placing someone on the list).

Between 2021 and 2023, total enrollment in waiting lists and interest lists increased by 6%. Overall, there was an increase in the number of people on waiting or interest lists in 18 states and a decrease in 16 states. Some states had significant decreases in their waiting lists such as New Mexico which used additional federal funding from the American Rescue Plan Act to decrease their waiting list for people with I/DD from 3,500 in 2022 to fewer than 300 in 2023. Virginia’s waiting list also decreased significantly from 23,000 in 2021 to under 15,000 in 2022 and 2023.

Increases in waiting lists may reflect improved data about people seeking services. For example, Texas revised its questionnaire to gather more data about people who are interested in HCBS and the number of people on waiting lists/interest lists statewide rose from 312,000 in 2021 to 343,000 in 2023. New York is currently building a portal to track the services received and the number of people waiting for services. The portal will help target provider capacity but may also show an increase in the number of people “waiting” for services that is attributable to improved data collection rather than an increase in unmet needs (New York reported that they had an interest or referral list but that the number of people on it was unknown).

Who is on waiting lists for HCBS?

Most people on waiting lists have intellectual or developmental disabilities (I/DD), particularly in states that do not screen for waiver eligibility before placing someone on a waiting list. People with I/DD comprise 88% of waiting lists in states that do not screen for waiver eligibility, compared with 51% in states that do determine waiver eligibility before placing someone on a waiting list (Figure 3). People with I/DD comprise almost three-quarters (72%) of the total waiver waiting list population. Seniors and adults with physical disabilities account for one-quarter (25%), while the remaining share (3%) includes children who are medically fragile or technology dependent, people with traumatic brain or spinal cord injuries, people with mental illness, and people with HIV/AIDS. People who are on HCBS waiting lists are generally not representative of the Medicaid population or the population that uses HCBS. Most people on waiting lists have I/DD, but KFF analysis shows that people with I/DD comprise fewer than half of the people served through 1915(c) waivers (the largest source of Medicaid HCBS spending).

Most People on Medicaid HCBS Waiting Lists or Interest Lists Have Intellectual or Developmental Disabilities

How long do people on HCBS waiting lists wait to access services and do they have access to HCBS while waiting?

In 2023, people on the waiting or interest lists waited an average of 36 months to receive HCBS waiver services (27 of 38 states responding), down from 45 months in 2021. People with I/DD waited the longest for services, 50 months on average. The average waiting period for other waiver populations ranged from 5 months for waivers targeting seniors to 37 months for waivers that serve people with autism. People with I/DD residing in states that do not screen for eligibility wait longer for services than people with I/DD residing in states that do screen for waiver eligibility (61 months versus 45 months, on average).

Most people on waiting or interest lists are eligible to receive other types of HCBS while they wait. Among the nearly 700,000 people on lists for waiver services in 2023, living arrangements are unknown for more than 600,000. Among the people whose living arrangements are known, 97% (77,000) lived in the community and 3% (2,000) lived in institutional settings. While waiting for waiver services, people living in the community are likely to be eligible for other HCBS through Medicaid state plans. Of the over 4 million people who use HCBS, KFF estimates that roughly half use services provided through the Medicaid state plan, such as personal care to help with bathing or preparing meals, therapies to help people regain or acquire independent living skills, and assistive technology. States may not use waiting lists to restrict the number of people eligible to use such services and over 80% of people on HCBS waiting lists are eligible for personal care or other state plan services. They would not, however, have access to more specialized services such as supported employment or adult day care. People on waiting lists who receive state plan services may also have fewer hours of personal care than they would in a waiver program, or they may not have assistance with some of the activities they need help with such as bathing, dressing, preparing meals, or managing medication.

What to watch?

How might shortages of HCBS workers create problems for states seeking to reduce the number of people on waiting lists? The COVID-19 pandemic exacerbated existing workforce shortages across all HCBS settings and KFF’s most recent survey of state HCBS programs highlighted states efforts to try and address those shortages. Waiting lists may reflect both shortages of workers and insufficient state funds. Although states reported increasing provider payment rates and other efforts to bolster the workforce, challenges remain and some of states’ policies for addressing those challenges have ended with the conclusion of pandemic-era programs. It remains to be seen how policy changes enacted during the pandemic will affect the provision of HCBS in future years and whether the investments in HCBS through the American Rescue Plan Act will result in capacity increases even after the federal funding ends.

How might recently proposed rules affect the number of people on waiting lists or interest lists? One proposed rule on Medicaid access would require states to report on the number of people “who are waiting to enroll in the waiver program,” but it’s unclear whether that requirement would also apply to interest lists, which may include people who are interested in services but not “waiting to enroll.” The rule would make other changes, also intended to increase Medicaid enrollees’ access to HCBS. Increased access to HCBS would increase Medicaid spending, but there is no new federal funding beyond the standard federal matching payments provided to states for Medicaid costs. Funding challenges for states may be particularly relevant given other potential requirements for more staffing in nursing homes, which would tend to increase states’ spending on institutional long-term services and supports. Another proposed rule would codify the Olmstead court decision that requires services to be provided in the most integrated setting appropriate and has spurred many expansions of HCBS waivers.