News Release

Updated Health Spending Explorer Features the Latest National Data on How Much People Spend and Who Pays the Bills

Published: Dec 15, 2023

The latest data on U.S. health spending are now available on the Health Spending Explorer, an interactive tool that allows users to explore trends in health spending by federal and local governments, insurers, nursing care, hospital, and other service providers, and consumers.

The tool captures just-released 2022 data from the federal government, when national health expenditures totaled nearly $4.5 trillion. Overall spending rose 4.1% in 2022, with almost all categories of health spending experiencing growth. This rise was muted by lower federal public health spending related to the pandemic. Meanwhile, consumers’ out-of-pocket costs rose 6.6%, a large but less dramatic increase than in 2021.

The tool allows users to build and download custom charts, with spending broken out for hospitals, nursing care, prescription drugs, and more and other services and payments broken out for Medicare, Medicaid and CHIP, private insurance, and consumers’ out-of-pocket costs. 

The data are based on the latest national health spending report from actuaries at the Centers for Medicare & Medicaid Services, covering the years from 1960 through 2021. Custom-made charts can be easily shared through social media and email. In addition to the interactive, the new data is also reflected in an updated chart collection on changes to U.S. healthcare spending over time. The KFF-Peterson Health System Tracker is an online information hub dedicated to monitoring and assessing the performance of the U.S. health system.

Poll Finding

KFF Misinformation Poll Snapshot: Public Views Misinformation As A Major Problem, Feels Uncertain About Accuracy Of Information On Current Events

Published: Dec 15, 2023

Findings

As part of KFF’s ongoing effort to identify and track the rise and prevalence of misinformation in the U.S, KFF released the Health Misinformation Tracking Poll Pilot earlier this year. The pilot poll found that adults across demographics were uncertain about the accuracy of many health-related false and inaccurate claims and had limited trust in both traditional and social media as sources of health information1 . The latest poll examines the public’s view of misinformation as a problem and their perception of the accuracy of information on four major news topics in the U.S. today.

The findings suggest two potential scenarios both of which likely exist to some extent. On one hand, since so many people are dubious of the information they see including any false and misleading claims, perhaps these claims do not sink in as often as they are identified, therefore limiting the impact of misinformation on people who are skeptical of most of the information they come across. On the other hand, people, without a strong sense of what to trust, might be more susceptible to misinformation and disinformation. Regardless, the poll suggests an opportunity to help the public get more clarity on how to know when to trust a source or piece of information.

Large Majorities Across Groups See Misinformation As A “Major Problem”

The latest KFF poll finds a vast majority of adults (83%) say the spread of false and inaccurate information in the United States is a “major problem,” which is relatively unchanged since June.

At least three-quarters of Black adults (84%), Hispanic adults (76%), and White adults (85%) say the spread of false and inaccurate information is a “major problem” in the U.S. In an area of partisan agreement, large majorities of Democrats and Democrat-leaning independents (88%), Republicans and Republican-leading independents (81%), and independents (78%) say the same.

Majorities of adults across educational levels also agree that the spread of false and inaccurate information is a “major problem,” though a somewhat smaller share (79%) of adults with a high school education or less say this compared to adults with a college degree or higher (88%).

About Eight In Ten Adults Say The Spread Of False Information Is A Major Problem In The United States

Most Are Uncertain About Information They Come Across On Current News Topics

With majorities across demographic groups saying the spread of false information is a problem in the U.S., the latest polling from KFF finds that a majority of adults express uncertainty about the accuracy of information they come across relating to four major news topics.

Most of the public say they feel uncertain about the accuracy “all or most of the time” or “sometimes” when they come across information on the four news topics asked about, with at least one in four saying they feel uncertain about the accuracy of information “all or most of the time” regarding the conflict in Gaza and Israel (32%), the upcoming 2024 presidential election (31%), and COVID-19 (27%). A smaller share, roughly one-fifth of adults (18%), say the same regarding information about abortion and reproductive health-related issues.

On the other hand, one in four or fewer adults say they are “rarely” uncertain about the accuracy when they come across information about abortion and reproductive health (23%), COVID-19 (19%), the conflict in Gaza and Israel (13%), and the presidential election (10%). Even smaller shares, fewer than one in ten, say they are “never” uncertain about the accuracy of information about each issue.

At Least One-Fourth Of Adults Express Persistent Uncertainty About The Accuracy Of Information Surrounding The Conflict In The Middle East, The Presidential Election, And COVID-19

Some Groups Are More Likely To Express Uncertainty About Information About Specific News Topics

While a majority of the public say they feel uncertain at least “sometimes” about the accuracy of information they come across on all these topics, there are some differences by key groups. Namely, Republicans and Republican-leaning independents are far more likely than Democrats and Democratic-leaning independents to say they feel uncertain “all or most of the time” about the accuracy of information around the 2024 presidential election, COVID-192 , and abortion and reproductive health issues.

Republicans and Republican-leaning independents are nearly four times as likely to say they feel uncertain about the accuracy of COVID-19 information “all or most of the time” (43%) compared to Democrats and Democratic-leaning independents (11%). About three in ten (29%) independents report the same. A third of Democrats (34%) and one-fourth (25%) of independents say they feel uncertain about the accuracy of COVID-19 information they come across “rarely” or “never,” compared to 14% of Republicans.

Republicans are also more likely to report feeling uncertainty about the accuracy of information related to the presidential election. About four in ten (39%) Republicans and Republican-leaning independents say they feel uncertain “all or most of the time” about the accuracy of information on this news topic, compared to a quarter of Democrats and Democratic-leaning independents. Three in ten independents say they feel uncertain “all or most of the time” about the accuracy of presidential election-related information.

Republicans More Likely Than Democrats To Question The Accuracy Of Information About The Upcoming Presidential Election And COVID-19

Uncertainty about the accuracy of information people come across about COVID-19 is also related to COVID-19 vaccination status. Adults who have never received a COVID-19 vaccine are about twice as likely as adults who have received at least one dose of a COVID-19 vaccine to say that they are uncertain “all or most of the time” about the accuracy of information pertaining to the virus (46% vs 22%, respectively).

Unvaccinated Adults Twice As Likely As Vaccinated Adults To Feel Uncertain All Or Most Of The Time About The Accuracy Of COVID-19 Information

About one in five (18%) adults say they feel uncertain “all or most of the time” when it comes to the accuracy of information they come across about abortion and reproductive health issues. Uncertainty about the accuracy of information on this issue is similar for adults across age, educational attainment, and race and ethnicity, as well as of whether they live in a state where abortion is restricted or even banned. However, women of reproductive age (ages 18-49), for whom information about abortion and reproductive health is particularly relevant, are more likely than men in their same age group to say the feel uncertain “all or most of the time” about the accuracy of information about those topics (21% vs. 13%, respectively).

When asked about information they come across about the conflict in Gaza and Israel, 35% of adults ages 18-49 say they feel uncertain about the accuracy “all or most of the time,” a larger share than their older counterparts (27%).

The findings suggest potential scenarios about the current information environment. Since so many people are dubious of the information they see including any false and misleading claims, perhaps these claims do not sink in as often as they are identified, therefore limiting the impact of misinformation on people who are skeptical of most of the information they come across. On the other hand, people, without a strong sense of what to trust, might be more susceptible to misinformation and disinformation. Regardless, the poll suggests an opportunity to help people get more clarity on how to know when to trust a source or piece of information.

Methodology

This KFF Health Tracking Poll/COVID-19 Vaccine Monitor was designed and analyzed by public opinion researchers at KFF. The survey was conducted October 31- November 7, 2023, online and by telephone among a nationally representative sample of 1,301 U.S. adults in English (1,222) and in Spanish (79). The sample includes 1,016 adults (n=52 in Spanish) reached through the SSRS Opinion Panel either online (n=991) or over the phone (n=25). The SSRS Opinion Panel is a nationally representative probability-based panel where panel members are recruited randomly in one of two ways: (a) Through invitations mailed to respondents randomly sampled from an Address-Based Sample (ABS) provided by Marketing Systems Groups (MSG) through the U.S. Postal Service’s Computerized Delivery Sequence (CDS); (b) from a dual-frame random digit dial (RDD) sample provided by MSG. For the online panel component, invitations were sent to panel members by email followed by up to three reminder emails.

Another 285 (n=27 in Spanish) interviews were conducted from a random digit dial telephone sample of prepaid cell phone numbers obtained through MSG. Phone numbers used for the prepaid cell phone component were randomly generated from a cell phone sampling frame with disproportionate stratification aimed at reaching Hispanic and non-Hispanic Black respondents. Stratification was based on incidence of the race/ethnicity groups within each frame.

Respondents in the phone samples received a $15 incentive via a check received by mail, and web respondents received a $5 electronic gift card incentive (some harder-to-reach groups received a $10 electronic gift card). In order to ensure data quality, cases were removed if they failed attention check questions in the online version of the questionnaire, or if they had over 30% item non-response, or had a length less than one quarter of the mean length by mode. Based on this criterion, one case was removed.

The combined cell phone and panel samples were weighted to match the sample’s demographics to the national U.S. adult population based on parameters derived from the Census Bureau’s 2022 Current Population Survey (CPS), 2021 Volunteering and Civic Life Supplement data from the CPS, and the 2023 KFF Benchmarking survey with ABS and prepaid cell phone samples. The demographic variables included in weighting for the general population sample are sex, age, education, race/ethnicity, region, education, civic engagement, internet use, and political party identification by race/ethnicity. The sample of registered voters was weighted separately to match the U.S. registered voter population using the parameters above plus recalled vote in the 2020 presidential election by county quintiles grouped by Trump vote share. Both weights take into account differences in the probability of selection for each sample type (prepaid cell phone and panel). This includes adjustment for the sample design and geographic stratification of the cell phone sample, within household probability of selection, and the design of the panel-recruitment procedure.

The margin of sampling error including the design effect for the full sample and registered voters is plus or minus 4 percentage points. Numbers of respondents and margins of sampling error for key subgroups are shown in the table below. For results based on other subgroups, the margin of sampling error may be higher. Sample sizes and margins of sampling error for other subgroups are available by request. Sampling error is only one of many potential sources of error and there may be other unmeasured error in this or any other public opinion poll. KFF public opinion and survey research is a charter member of the Transparency Initiative of the American Association for Public Opinion Research.

GroupN (unweighted)M.O.S.E.
Total1,301± 4 percentage points
Total Registered Voters1,072± 4 percentage points
Republican Registered Voters342± 7 percentage points
Democratic Registered Voters333± 7 percentage points
Independent Registered Voters296± 7 percentage points
 
Race/Ethnicity
White, non-Hispanic719± 5 percentage points
Black, non-Hispanic218± 9 percentage points
Hispanic247± 8 percentage points

Endnotes

  1. The Health Misinformation Tracking Poll Pilot asked about the traditional and social media sources that the public regularly uses, as well as the level of trust in health-related information from each source. This KFF Misinformation Poll Snapshot asks how often the public is uncertain when they come across information on four news topics, without specifying the source of that information. ↩︎
  2. Past KFF COVID-19 Vaccine Monitor surveys from 2021 and 2022, as well as the KFF Health Misinformation Tracking Poll Pilot, found that significant shares of adults were uncertain about false claims pertaining to COVID-19, including, but not limited to: the effectiveness of COVID-19 vaccines and various treatments such as Ivermectin, the effect of vaccines on pregnancy and fertility, and the U.S. government’s reporting of COVID-19 related-deaths. ↩︎
News Release

Who Decides When a Patient Qualifies for an Abortion Ban Exception? Doctors vs. the Courts

Published: Dec 14, 2023

Earlier this week, the Texas Supreme Court overturned a lower court order that would have allowed a Texas woman—who was more than 20 weeks pregnant carrying a fetus diagnosed with a fatal condition—to get an abortion in the state. The woman has reportedly travelled out of Texas to obtain an abortion.

A new KFF brief examines the difficulties presented by the vagueness and narrowness of exceptions in state abortion bans, which leave physicians in limbo, uncertain about what they can and cannot do. 

The case in Texas highlights the dilemma in which many doctors and patients find themselves when faced with a pregnancy that they believe qualifies for an exception while fearing criminal prosecution and penalties if they provide an abortion. The brief describes the circumstances underpinning the Texas case, as well as medical exceptions in other states with abortion and gestational bans currently in effect. 

The Texas abortion ban specifies that the physician must determine that the abortion is necessary based on their “reasonable medical judgement.” The brief also explores the tensions between “reasonable medical judgment” and “good faith” standards, which leave physicians legally vulnerable and reluctant to certify that a patient qualifies for an abortion ban exception.

Who Uses Medicaid Long-Term Services and Supports?

Published: Dec 14, 2023

Introduction

KFF estimates that nearly 6 million people receive Medicaid long-term services and supports (LTSS) for assistance with activities of daily living (such as eating, bathing, and dressing) and instrumental activities of daily living (such as preparing meals, managing medication, and housekeeping). LTSS are provided to people who need such services because of aging, chronic illness, or disability and may be provided in institutional settings such as nursing facilities (1.6 million people) or in people’s homes and the community (4.2 million people). This analysis examines the characteristics of Medicaid enrollees who use LTSS, how enrollees who use LTSS differ from those who do not use LTSS, and how enrollees who use different types of LTSS differ from each other. For details on methods, please see KFF’s previous data note, which described the number of people who use LTSS and how much Medicaid spends on those people.

Key takeaways include:

  • Age, Sex, and Race: Over half (56%) of Medicaid enrollees who use LTSS broadly are under 65, but the age distribution varies by type of service. Most enrollees who use Medicaid home- and community-based services (HCBS) are under age 65, while most enrollees who use institutional LTSS are ages 65 and older. Among enrollees who use LTSS, males are generally younger than females. Over twice as many males are under the age of 18 compared with females (16% vs. 8%). Just over half (51%) of all Medicaid enrollees who use LTSS are White, 19% are Black, and 14% are Hispanic.
  • Eligibility Group: Over two-thirds (70%) of enrollees who use LTSS and are under 65 qualify for Medicaid because of a disability. The Affordable Care Act (ACA) Medicaid expansion has expanded access to LTSS: 1 in 5 enrollees under 65 who use institutional LTSS and 1 in every 10 enrollees under 65 who use Medicaid HCBS are eligible for Medicaid through the ACA expansion.
  • Medicare Coverage: 62% of Medicaid enrollees that use LTSS are also enrolled in Medicare, and the share is higher among those who use institutional LTSS (79%) compared with those who use HCBS (56%).
  • Health Conditions: Enrollees who use LTSS are much more likely to be diagnosed with ongoing health conditions than enrollees who do not use LTSS, with the highest rates of diagnoses among older enrollees who use institutional LTSS.

What are the demographic characteristics of Medicaid enrollees who use LTSS?

Over half (56%) of Medicaid enrollees who use LTSS are under 65, but those who use LTSS are still older than those who do not use LTSS (Figure 1). LTSS are commonly associated with people ages 65 and older, but many younger enrollees use LTSS because of chronic illness or disability. The remaining 45% of enrollees who use LTSS are 65 and older. In comparison, only 5% of Medicaid enrollees who do not use LTSS are ages 65 and older.

Male Medicaid enrollees who use LTSS are more likely to be under 65 and twice as likely to be under 18 as female enrollees who use LTSS (Figure 1). The younger age distribution of males may be related to higher rates of diagnoses of intellectual and developmental disabilities among young boys than among young girls. Male enrollees who use LTSS may also be younger than female enrollees who use LTSS since women generally live longer than men.

Medicaid enrollees who use LTSS are more likely to be White and less likely to be Hispanic compared to those who don’t use LTSS (Figure 1). These data are from the 31 states that reported “low/medium concern” data quality levels with their race and ethnicity data in 2020. People who are White comprise just over half (51%) of all Medicaid enrollees who use LTSS, but only 39% of enrollees who don’t use LTSS. People who are Hispanic comprise just 14% of all Medicaid enrollees who use LTSS, but 25% of enrollees who don’t use LTSS. This pattern may, in part, reflect differences in age distribution across racial and ethnic groups, with over half (53%) of Hispanic enrollees under age 19 compared with 37% of White enrollees (data not shown). The share of enrollees who are Black is similar among those who use LTSS and those who do not (19% and 20% respectively).

Just over two-thirds (70%) of people who use Medicaid LTSS and are under age 65 qualify for Medicaid because of a disability (Figure 1). Among Medicaid enrollees under age 65 who do not use LTSS, only 12% are eligible for Medicaid because of a disability. The remaining 30% of enrollees who use LTSS are eligible through the child eligibility group, the Affordable Care Act (ACA) expansion group, or through another adult eligibility group.

Enrollees Who Use LTSS Have Different Characteristics From Those Who Do Not

Enrollees who use Medicaid HCBS are more likely to be younger, Black or Hispanic, and receive Medicaid because of a disability when compared to enrollees who use institutional LTSS (Figure 2). There are notable differences in the characteristics of people who use HCBS and institutional LTSS. Among people who use HCBS, 14% are under age 19, and 49% are ages 19-64, whereas over two-thirds of people who use institutional LTSS are ages 65 and older. Among both groups, females who use LTSS have an older age distribution than males who use the same type of LTSS. Enrollees who use HCBS are more likely to be Black or Hispanic (36%) than enrollees who use institutional LTSS (24%). People who are White comprise 47% of people who use HCBS but 64% of people who use institutional LTSS. These differences likely reflect to the younger age distribution of Hispanic enrollees who use any LTSS: 19% of Hispanic enrollees who use LTSS are ages 0-18 compared with 10% of White enrollees (data not shown). Among both enrollees who use institutional LTSS or HCBS, most people under the age of 65 are eligible for Medicaid because of a disability, but the percentage of people eligible for Medicaid through an ACA expansion is 10% among people who use HCBS and 20% among people who use institutional LTSS.

Enrollees Who Use HCBS Differ From Enrollees Who Use Institutional LTSS

What share of Medicaid enrollees who use LTSS are also enrolled in Medicare?

Most (62%) Medicaid enrollees who use LTSS are also enrolled in Medicare (“dual-eligible individuals”) (Figure 3). Only 8% of Medicaid enrollees who don’t use LTSS have Medicare. The high rate of Medicare coverage among Medicaid enrollees who use LTSS reflects the older age distribution of enrollees who use LTSS and high rates of eligibility for Medicaid based on a disability. To be eligible for Medicare, people must generally be ages 65 and older, or have a disability that qualifies them for the federal disability insurance program (people in that program are only eligible for Medicare after a 2-year waiting period). Nearly all enrollees over age 65 are enrolled in Medicare regardless of whether they use LTSS. Enrollees under 65 who use LTSS have higher rates of Medicare coverage when compared to those who do not use LTSS (35% compared with 4%).

The percentage of enrollees with Medicare is higher among those who use institutional LTSS (79%) compared with those who use HCBS (56%) (Figure 3). 34% of enrollees who are under 65 and use HCBS also have Medicare coverage, compared to 40% of enrollees who are under 65 and use institutional LTSS. Nearly all enrollees over 65 who use either HCBS or institutional LTSS have Medicare coverage.

Medicaid Enrollees Who Use LTSS Are More Likely To Be Enrolled In Medicare Than Those Who Do Not

What share of Medicaid enrollees who use LTSS have a diagnosis of at least one ongoing health condition?

Rates of ongoing health conditions are higher among Medicaid enrollees under 65 without Medicare who use LTSS compared with those who don’t use LTSS (Figure 4). Rates of chronic conditions are only available for Medicaid enrollees who do not have Medicare because for dual-eligible individuals, Medicare is the primary payer of acute care services and health conditions may not show up in the Medicaid data (Box 1). All enrollees 65 and older are also excluded because fewer than five percent of people 65 and older do not have Medicare. Health conditions include a list of 30 chronic conditions maintained by the Centers for Medicare & Medicaid Services and an indicator for whether enrollees had an obesity diagnosis in the Medicaid claims data (defined as ICD-10 diagnosis codes within E66.0, E66.1, E66.2, E66.8, E66.9, Z68.3, Z69.4, and Z68.54.)

Among enrollees under 65 without Medicare, 33% of enrollees ages 0-18 who use LTSS have a diagnosis of at least one ongoing health condition compared with 15% of those who don’t use LTSS. Similarly, 76% of those 19-64 who use LTSS have a diagnosis of at least one ongoing health condition compared to 38% who do not use LTSS. Enrollees who do not have a diagnosis for an ongoing health condition may receive LTSS for any number of other reasons, including frailty. Frailty is a complex health state that describes the decline in health and increased physical vulnerability that comes with aging, chronic and progressive illness, or in the aftermath of a major accident or stroke. People with frailty may not have a diagnosis for any ongoing health conditions, but frailty is a significant reason that people need help with daily personal care activities such as bathing or dressing.

Rates of health conditions are only slightly higher among those who use institutional LTSS compared with those who use HCBS (Figure 4). For enrollees who use HCBS, 33% of those ages 0–18 have a chronic condition compared with 74% of those ages 19-64. These rates are only slightly lower than enrollees who use institutional LTSS. For enrollees who use institutional LTSS, 37% of enrollees ages 0–18 have a chronic condition compared with 89% of enrollees ages 19-64.

Ongoing Health Conditions Are More Common Among Medicaid Enrollees Who Use LTSS

Among Medicaid enrollees under age 65, certain health conditions, in particular, are higher among those who use LTSS than among those who don’t (Appendix Table 1). Among enrollees ages 0-18, 9% of enrollees without Medicare who use LTSS have a mental health diagnosis compared with only 3% of those who don’t use LTSS. Similarly, among enrollees 19-64, 33% of enrollees who use LTSS have a mental health condition compared with only 12% of those who don’t use LTSS; and 18% of enrollees who use LTSS have an obesity diagnosis compared with 8% of enrollees who don’t. Other health conditions, such as pneumonia (10% vs 2%) and diabetes (27% vs 7%), are similarly more common among enrollees ages 19-64 using LTSS when compared to those who don’t.

For Medicaid enrollees under age 65 who use LTSS, the most common chronic conditions are similar for people who use HCBS and institutional care, although the rates of those conditions are somewhat higher among people who use institutional care (Appendix Table 1). Among enrollees under age 19, the three most common conditions include: mental health conditions (affecting 9% of children who use HCBS and 18% of children who use institutional LTSS), asthma (affecting 11% of children who use HCBS and 10% of children who use institutional LTSS), and obesity (affecting 6% of children who use HCBS and 7% of people who use institutional LTSS). Among enrollees ages 19-64, the most common conditions include hypertension (affecting 36% of adults who use HCBS and 57% of adults who use institutional LTSS), mental health conditions (affecting 31% of adults who use HCBS and 45% of adults who use institutional LTSS), and diabetes (affecting 26% of adults who use HCBS and 35% of adults who use institutional LTSS).

Box 1: Identifying Health Conditions Among Medicaid Enrollees

KFF identifies people’s health conditions through diagnosis codes on Medicaid claims and encounter data. Claims are records of bills submitted by providers in order to be reimbursed by the state Medicaid program. Encounter data are records of the services received by people who are enrolled in Medicaid health plans. Unlike claims, they do not include payment information because the health plans pay providers instead of the state Medicaid program.

Some Medicaid enrollees—known as dual-eligible individuals—also have Medicare and for those people, Medicare is the primary payer for most health care services. Medicaid pays for Medicare premiums and in most cases, cost sharing. For dual-eligible individuals who are eligible for full Medicaid, Medicaid also covers supplemental benefits such as LTSS and non-emergency medical transportation. In many cases, there will be no Medicaid claims or encounter data when services are covered by Medicare. Without claims, there are no diagnosis codes for dual-eligible individuals. As a result, it is impossible to accurately identify rates of health conditions in Medicaid data for dual-eligible individuals. Approximately 9.7 million full-benefit duals are excluded from the calculations in Figure 4.

What key issues may impact those who use Medicaid LTSS?

Are there sufficient workers to meet the higher staffing levels sought in proposed rules? Long-standing staffing shortages in long-term care facilities predate the COVID-19 pandemic, but the pandemic exacerbated them and the number of workers employed at skilled nursing care and elderly care facilities was still below pre-pandemic levels in October 2023. The federal government recently released a proposed rule that would create new requirements for nurse staffing levels in nursing facilities. KFF analysis finds that fewer than 1 in 5 could currently meet the required number of hours for registered nurses and nurse aides, but facilities will have several years to come into compliance and the proposed rule includes hardship exemptions. For HCBS, the Biden Administration recently released a proposed rule aimed at ensuring access to Medicaid services, which has several notable provisions aimed at addressing HCBS workforce challenges. States would be required to report payment rates for certain HCBS, to demonstrate that payment rates are “adequate” to provide the level of services in enrollees’ personalized care plans, and to ensure at least 80% of payments are passed through to worker compensation for certain types of HCBS.

Will there be additional barriers to accessing Medicaid HCBS as public health emergency authorities end and enhanced federal funding runs out? Recognizing the importance of keeping people out of congregate settings and that HCBS workforce challenges were exacerbated during the COVID-19 public health emergency, the federal government provided states with new authorities and funding to maintain access to HCBS during the public health emergency (PHE). States used the additional funding and flexibility to increase payment rates, pay family caregivers, and expand access to HCBS. Although many states are working to make the PHE changes permanent, KFF findings indicate that some states will revert to their pre-PHE policies, potentially reducing access to HCBS or payments to providers. Funding made available by the American Rescue Plan Act to “enhance, expand, and strengthen” HCBS is also set to expire in March 2025, although states may exhaust the additional funding before that time.

As the population continues to age and more people need Medicaid LTSS, how might policy makers aim to expand access to care? As the 25th anniversary of the Olmstead court decision—which requires people with disabilities to be served in the most integrated setting that is appropriate—nears, there may be increased attention on the extent to which integration has occurred and where further integration is still needed. Along those lines, a recent proposed rule clarifies the obligation for states to provide services in the most integrated setting appropriate—codifying the Olmstead decision and clarifying that failing to provide services in the most integrated setting appropriate is a form of discrimination. Data describing the differences between people who are using institutional LTSS and HCBS helps illuminate which populations are most likely to receive integrated care and which are still served in primarily segregated settings. Beyond the people who are currently using Medicaid LTSS, there are close to 0.7 million people on waiting lists or interest lists for Medicaid HCBS. While these data are an imperfect measure of unmet need, they do suggest there has been consistent unmet need for these services and have been described as contributing to the risk of unnecessary institutional for people with disabilities. Recent research also finds that there are disparities in HCBS spending, access, and outcomes among communities of color, including higher rates of unmet LTSS needs.

Appendix Table

Rates of Ongoing Health Condition Diagnoses Among Medicaid Enrollees, By Age and LTSS Use

Who Decides When a Patient Qualifies for an Abortion Ban Exception? Doctors vs. the Courts

Authors: Laurie Sobel, Mabel Felix, and Alina Salganicoff
Published: Dec 14, 2023

While all eyes were on Texas and the recent case of Kate Cox, a woman seeking a court order allowing her abortion under an exception to the Texas abortion ban, the conflict could have played out in many states. Like many physicians in states with abortion bans, Ms. Cox’s physician and the hospital where she practices did not want to risk criminal and professional penalties by providing an abortion without obtaining a court order that it qualified for an exception. The KFF 2023 National OBGYN survey found that over half of OBGYNs practicing in states where abortion is banned reported being concerned about their legal risk when making decisions about patient care and the necessity for abortions. The risk to doctors is so high that many doctors are hesitant to provide life-saving abortion care unless the threat to life is imminent. The difficulties presented by the simultaneous vagueness and narrowness of the exceptions in state abortion bans are exacerbated by the lack of deference given to clinicians’ medical judgment to determine when an abortion falls under an exception. This leaves pregnant people who require abortion care in a potentially untenable situation, not just in Texas but any state that has a narrow exception to their abortion ban.

The case in Texas highlights the impossible situation that many doctors and patients find themselves in when faced with a pregnancy that may qualify for an exception. Fearing prosecution for providing abortion care that she believed it fit under the abortion ban’s exception based upon her good faith medical judgement, Ms. Cox’s physician asked a Texas District Court to determine that providing the abortion was not a violation of the state’s ban. After that court effectively signed off on the physician’s judgement by issuing an order blocking the Texas Attorney General from enforcing the abortion ban against Ms. Cox’s physician and hospital, the Attorney General wrote a letter to the hospital stating that his office would still enforce the state abortion ban if the abortion care was provided. The Texas Supreme Court soon overruled the district court order by stating that it did not want to get involved in medical judgments and it is the doctor, not the courts, who decide who qualifies for an abortion. However, if doctors are prosecuted for providing abortions under an exception, the courts will nonetheless end up determining whether the abortions qualified for an exception and physicians will still be vulnerable to having their judgment second-guessed by judges and juries. Unable to get a determination from a court ahead of providing care, yet vulnerable to prosecution after providing care, doctors and their patients caught in a “Catch-22.” In this case, Ms. Cox was reportedly able to leave the state to receive the abortion care her doctor believed she needed, but others may not have the resources to travel out of state to get medically-indicated care.

Medical Exceptions in State Abortion Bans Are Vague

All 20 states with abortion and gestation bans currently in effect contain exceptions to “prevent the death” or “preserve the life” of the pregnant person. Like Texas, these exceptions are not clear how much risk of death or how close to death a pregnant patient may need to be for the exception to apply, and the determination is not explicitly up to the physician treating the pregnant patient.

Exceptions to State Abortion Bans and Early Gestational Limits in Effect, as of December 13, 2023

Five states with abortion bans in effect (Arkansas, Idaho, Mississippi, Oklahoma, and South Dakota) do not have any exceptions for the “health” of the pregnant person, only to preserve “life.” The remaining 15 states with bans and restrictions in effect contain a health exception. Most of these exceptions permit abortion care when there is a serious risk of substantial and irreversible impairment of a major bodily function. The ability to operationalize these exceptions, however, is limited by the lack of specific clinical definitions of the conditions qualifying for the exception. Arizona’s ban explicitly defines the bodily functions that may be considered “major.” Most other states that use this language in their bans do not define what constitutes a “major bodily function,” nor what constitutes a “substantial impairment” to a major bodily function. This vague language can put physicians providing care to pregnant people in an untenable situation should their patients need an abortion to treat a condition jeopardizing their health, and ultimately can leave the determination of whether an abortion can be legally provided to lawyers for the institution in which the clinician practices or the courts.

‘Reasonable Medical Judgment’ vs. ‘Good Faith’

The Texas abortion ban specifies that the physician must determine that the abortion is necessary based on their “reasonable medical judgement.” This standard leaves physicians in a legally vulnerable situation and understandably reluctant to certify a pregnancy as qualifying for a life or health exception. This reluctance stems from the concern of being found guilty of violating the law if the court relies on the testimony of other medical experts that say that the treating physician didn’t meet the standard for “reasonable medical judgement.” Due to the concern that a court would later second-guess her judgment, in the Texas lawsuit, Ms. Cox’s physician requested an order from the court allowing her to perform the abortion on the basis of her “good faith” belief that her patient fell under the exception. Additionally, she was unsure how close to death Ms. Cox needed to be before she would be permitted to legally perform the abortion in the state and sought the court’s confirmation. While the District court agreed with the plaintiffs that the case qualified for an exception, the Texas Supreme Court did not. They did not rule specifically on the medical situation facing the patient. Instead, they found that the physician’s “good faith belief” was insufficient to qualify for the exception, and only abortions that are certified to be necessary under the “reasonable medical judgement” standard are allowable under Texas law. A similar situation could arise in the other states that have narrow life or health exceptions and don’t grant deference to the physician’s judgment.

Currently, most states with health or life exceptions require a physician to exercise “reasonable medical judgement” to determine if the exception applies, though a few do not specify a standard. Arizona, however, requires only that a physician make the determination based on their “good faith clinical judgment.” Some states with more than one abortion ban or restriction on the books have different standards in each of these laws, further complicating what a doctor needs to do to certify that an abortion qualifies for an exception

While the case in Texas garnered national attention, this situation will inevitably arise again in states with abortion bans or restrictions. People seeking abortion care – even when their physicians believe they may qualify for an exception – will likely have to travel out of state if they are able, risk their health, or wait until the pregnancy jeopardizes their life.

Poll Finding

KFF COVID-19 Vaccine Monitor: MAGA Republicans’ Relationship With COVID-19 Vaccines

Published: Dec 14, 2023

Findings

The KFF COVID-19 Vaccine Monitor has been tracking intentions to get a COVID-19 vaccine since December 2020, when the initial vaccine first became available. Throughout the past three years, partisanship has continued to play an outsized role in predicting both intentions to get a COVID-19 vaccine as well as other pandemic-related attitudes and behaviors. With the latest COVID-19 vaccine rollout, Republicans are once again among the groups least likely to report having gotten the updated shot. This data note examines how vaccine attitudes and uptake differ between Republicans who sit on different sides of a particular ideological divide within Republican Party – support of the Make America Great Again (MAGA) movement.

The MAGA movement has attracted many Republicans and Republican-leaning independents, with six in ten (58%) saying they support the MAGA movement, representing about one quarter (23%) of all U.S. adults, according to the latest KFF Tracking Poll.

Generally, MAGA supporting Republicans tend to be older and have lower levels of education than Republicans who do not support the MAGA movement, with a larger share of MAGA Republicans being ages 50 and older (58% vs. 41%) and having less than a college degree (81% vs. 53%). MAGA supporting Republicans and Republicans who do not support the MAGA movement look similar across gender, race, and ethnicity.

MAGA Supporting Republicans Tend To Be Older, Less Educated Than Those Who Don't Support The MAGA Movement

MAGA Supporters Are Among Groups Least Likely To Get Updated COVID-19 Vaccine

Majorities of adults across partisan groups have reported receiving at least one dose of the COVID-19 vaccine that has been on the market since December 2020, though larger shares of Republicans compared to Democrats and independents remained resistant, with at least a quarter saying they would “definitely not” get a COVID-19 vaccine throughout the three years of KFF COVID-19 Vaccine Monitor surveys.

The November COVID-19 Vaccine Monitor finds that among Republicans and Republican-leaning independents, similar majorities of both those who support the MAGA movement (60%) and those who do not support the MAGA movement (70%) say they have received at least one dose of a COVID-19 vaccine (10 percentage points is within the margin of sampling error).

However, Republicans under 50 years old who support the MAGA movement are particularly resistant to getting a COVID-19 vaccine, with about four in ten saying they have received at least one dose, 20 percentage points lower than their non-MAGA supporting counterparts (39% vs. 59%). Given the increased vulnerability of adults ages 50 and older to the virus, and consistent with our findings that across party lines, older people have been more likely to get the COVID-19 vaccine, large majorities of older MAGA and non-MAGA supporting Republicans ages 50 and older report having gotten a COVID-19 dose.

Younger Republicans Who Support The MAGA Movement Are Less Likely Than Those Who Don't To Have Gotten A Dose Of A COVID-19 Vaccine

The newest COVID-19 vaccine recently became available in September of this year, with somewhat muted uptake compared to initial vaccine uptake. As of early November, two in ten adults say they have gotten the updated vaccine including one in three Democrats (32%), 16% of independents, and 12% of Republicans. Among Republicans, alignment with the MAGA movement is a strong predictor of vaccine intentions with supporters of the MAGA movement the fiercest in their opposition to the latest shot.

Among Republicans and Republican-leaning independents, about one in four (26%) of those who do not support MAGA say they have gotten or “probably” or “definitely” will get the latest updated COVID-19 vaccine, compared to about one in six (17%) of those who support MAGA saying they have gotten or plan to get the vaccine.

Most Republicans, regardless of MAGA support, say they will not get the latest updated COVID-19 vaccine with nearly two-thirds (63%) of MAGA Republicans saying they will “definitely not” get the newest vaccine, a slightly larger share than the half of their non-MAGA counterparts (52%) who say the same. The difference between Republican MAGA supporters and non-supporters in the share who have gotten the updated COVID-19 vaccine or say they will persists even after controlling for other demographics of age, gender, community type (such as urban, rural, or suburban communities), education, and household income.

In addition to being among the least likely to be vaccinated against COVID-19 at all, younger MAGA Republicans are among the most adamant that they will “definitely not” get the updated vaccine. Seven in ten (70%) MAGA supporting Republicans under age 50 say they will “definitely not” get the updated shot, compared to 54% of Republicans and leaners in this age group who do not support the MAGA movement (and 34% of the public overall).

Two-Thirds Of Republicans Who Identify As Part Of The MAGA Movement Say They Will "Definitely Not" Get The Updated COVID-19 Vaccine

MAGA Republicans Are Also Less Likely To Get The Flu Shot Or View Other Vaccines As Safe

As of September, almost six in ten (57%) non-MAGA identifying Republicans said they had already gotten or definitely will get the flu shot this season, compared to 43% of MAGA supporting Republicans. Interestingly, Republicans who do not identify with the MAGA movement are not significantly more likely than MAGA Republicans to say they normally get an annual flu shot. This could suggest that the MAGA impact on vaccine uptake could be a relatively new phenomenon that public health officials may be facing in the years to come.

Larger Shares Of Republicans Who Don't Identify With MAGA Have Gotten Or Will Get Their Flu Shot This Year

The differences between Republican MAGA supporters and non-supporters are not only evident in their uptake of vaccines, but also in their assessment of the safety of different types of vaccines. Republicans and Republican-leaning independents who support the MAGA movement are less likely than their non-MAGA counterparts to express confidence in the safety of COVID-19 vaccines (29% vs. 44%), respiratory syncytial virus, or RSV, vaccines (41% vs. 61%), and flu vaccines (53% vs. 74%).

MAGA Supporting Republicans Are Less Likely To Be Confident In The Safety Of Vaccines, Especially The COVID-19 Vaccine

Methodology

This KFF Health Tracking Poll/COVID-19 Vaccine Monitor was designed and analyzed by public opinion researchers at KFF. The survey was conducted October 31- November 7, 2023, online and by telephone among a nationally representative sample of 1,301 U.S. adults in English (1,222) and in Spanish (79). The sample includes 1,016 adults (n=52 in Spanish) reached through the SSRS Opinion Panel either online (n=991) or over the phone (n=25). The SSRS Opinion Panel is a nationally representative probability-based panel where panel members are recruited randomly in one of two ways: (a) Through invitations mailed to respondents randomly sampled from an Address-Based Sample (ABS) provided by Marketing Systems Groups (MSG) through the U.S. Postal Service’s Computerized Delivery Sequence (CDS); (b) from a dual-frame random digit dial (RDD) sample provided by MSG. For the online panel component, invitations were sent to panel members by email followed by up to three reminder emails.

Another 285 (n=27 in Spanish) interviews were conducted from a random digit dial telephone sample of prepaid cell phone numbers obtained through MSG. Phone numbers used for the prepaid cell phone component were randomly generated from a cell phone sampling frame with disproportionate stratification aimed at reaching Hispanic and non-Hispanic Black respondents. Stratification was based on incidence of the race/ethnicity groups within each frame.

Respondents in the phone samples received a $15 incentive via a check received by mail, and web respondents received a $5 electronic gift card incentive (some harder-to-reach groups received a $10 electronic gift card). In order to ensure data quality, cases were removed if they failed attention check questions in the online version of the questionnaire, or if they had over 30% item non-response, or had a length less than one quarter of the mean length by mode.  Based on this criterion, one case was removed.

The combined cell phone and panel samples were weighted to match the sample’s demographics to the national U.S. adult population based on parameters derived from the Census Bureau’s 2022 Current Population Survey (CPS), 2021 Volunteering and Civic Life Supplement data from the CPS, and the 2023 KFF Benchmarking survey with ABS and prepaid cell phone samples. The demographic variables included in weighting for the general population sample are sex, age, education, race/ethnicity, region, education, civic engagement, internet use, and political party identification by race/ethnicity.  The sample of registered voters was weighted separately to match the U.S. registered voter population using the parameters above plus recalled vote in the 2020 presidential election by county quintiles grouped by Trump vote share. Both weights take into account differences in the probability of selection for each sample type (prepaid cell phone and panel). This includes adjustment for the sample design and geographic stratification of the cell phone sample, within household probability of selection, and the design of the panel-recruitment procedure.

The margin of sampling error including the design effect for the full sample and registered voters is plus or minus 4 percentage points. Numbers of respondents and margins of sampling error for key subgroups are shown in the table below. For results based on other subgroups, the margin of sampling error may be higher. Sample sizes and margins of sampling error for other subgroups are available by request. Sampling error is only one of many potential sources of error and there may be other unmeasured error in this or any other public opinion poll. KFF public opinion and survey research is a charter member of the Transparency Initiative of the American Association for Public Opinion Research.

GroupN (unweighted)M.O.S.E.
Total1,301± 4 percentage points
Total Registered Voters1,072± 4 percentage points
Republican Registered Voters342± 7 percentage points
Democratic Registered Voters333± 7 percentage points
Independent Registered Voters296± 7 percentage points
 
Race/Ethnicity
White, non-Hispanic719± 5 percentage points
Black, non-Hispanic218± 9 percentage points
Hispanic247± 8 percentage points


How are States Implementing New Requirements for Medicaid Home- and Community-Based Services?

Authors: Maiss Mohamed, Alice Burns, and Molly O’Malley Watts
Published: Dec 13, 2023

In January 2014, the Centers for Medicare and Medicaid Services (CMS) published a final rule that created new requirements for Medicaid home- and community-based services (HCBS) programs. That rule has been informally called the “settings rule.” Enforcement of the rule was delayed multiple times, so the requirements only took effect this year, nearly a decade after the rule was originally finalized. States are still coming into compliance with the rule’s provisions. It will have significant effects on how HCBS are delivered to the four million people using Medicaid HCBS services, and on the states implementing the rule. In 2023, 47 states provided HCBS through a combined 258 1915(c) waivers and 14 provided HCBS through an 1115 waiver, all of which are required to comply with the settings rule.

The settings rule aims to ensure that individuals receiving services through HCBS programs are integrated into the community and creates tangible requirements for what it means to provide Medicaid HCBS through the most integrated setting that is appropriate, as is required under the Supreme Court’s Olmstead ruling. As the 25th anniversary of Olmstead nears, the Administration released a proposed rule that would codify the Olmstead decision more broadly and apply to services beyond those covered in the settings rule. States’ challenges—and successes—in implementing the settings rule may foreshadow barriers to more widespread integration and promising practices to overcome those barriers.

In KFF’s 2023 survey of state Medicaid HCBS programs, 10 states reported that compliance with the rule was the top priority for one or more of their HCBS programs, and an additional 22 states reported that it was the second priority for one or more of their programs. This issue brief describes the settings rule, implementation of the rule across states and HCBS waivers, and what to watch as implementation continues. Key takeaways include:

  • The settings rule establishes new requirements for HCBS settings, including full integration of individuals into the community and rights to privacy, dignity, and autonomy for people receiving services.
  • 24 states report full implementation of the settings rule among all HCBS waivers, and 19 states report partial implementation of criteria across waivers.
  • Most 1915(c) and 1115 waivers serving people with intellectual or developmental disabilities, seniors or people with physical disabilities, and people with traumatic brain or spinal cord injuries have components of the settings rule that they are still working to implement.

What is the settings rule?

The HCBS Settings Rule made numerous changes to Medicaid HCBS programs, the most notable of which include updating the requirements for the settings in which HCBS are provided. For HCBS that are provided under sections 1915(c) and 1115, the rule requires all HCBS settings to:

  • Be integrated into the larger community with individuals having full access to community resources and opportunities;
  • Be selected by the individual seeking care among different options;
  • Ensure rights to privacy, dignity, respect, and freedom from coercion and restraint;
  • Optimize autonomy and independence of residents and participants; and
  • Provide people with choices of services and providers.

There are additional requirements for provider-owned or controlled settings, which include: a lease or other legally enforceable agreement for residents, privacy in the unit with lockable doors, freedom to choose roommates and furnish the unit, control of schedule, access to food at any time, allowance of visitors at any time, and physical accessibility.

Beyond establishing requirements for the settings in which HCBS are provided, the rule made other changes intended to improve people’s access to HCBS. Such changes include:

  • Allowing states to streamline the administration of programs by combining multiple waivers into one,
  • Requiring HCBS programs to use a person-centered approach when establishing plans of care for participants and ensuring that participant goals and preferences guide the delivery of services, and
  • Implementing section 1915(i) of the Affordable Care Act, which allows states to provide optional HCBS through their state Medicaid plans and establish new eligibility categories for people who need HCBS.

The rule was finalized in 2014, but only took effect in March 2023 and many states are continuing to implement some of the rule’s requirements. The rule went into effect in March 2014 and states were initially given one year to submit a transition plan for existing services and five years to come into compliance. In total, states had until 2020 to implement the requirements. However, in 2017, CMS extended the compliance period until 2022 in recognition that states had many reforms underway, but would also need more time to complete the transition. In 2020, CMS once again extended the transition period to 2023 to account for the impact of the COVID-19 pandemic.

In May 2022, CMS updated the implementation strategy and introduced the option for states to request corrective action plans (CAPs). The new strategy required states to receive approval on their final Statewide Transition Plan and to implement all settings criteria not impacted by the COVID-19 public health emergency. Some examples of settings criteria that states may have needed more time to comply with include ensuring that individuals have access to the broader community, facilitating opportunities for employment, and providing the option for a private housing unit or choice of roommate. CMS encouraged states to apply for CAPs if they needed additional time to achieve full compliance.

Which HCBS waivers are most likely to have fully implemented the settings rule?

In KFF’s most recent survey of state HCBS programs, 43 states reported that at least one HCBS waiver had fully implemented the settings rule, and of those states, 24 reported full implementation by all waivers. In contrast, only 7 states report that no waivers have fully implemented the criteria. Most states (37) have requested or been granted a CAP for at least one waiver and among those states, the timelines for full implementation range from July 2023 to January 2026.

Use of CAPs was most common for waivers serving people with intellectual or developmental disabilities and people who are ages 65 and older or have physical disabilities (Figure 1, Appendix Table 1). Among the 45 states with waivers for people who have intellectual or developmental disabilities that responded, 16 states had fully implemented the rule and 29 had CAPs. Among the 43 states with waivers for people who are over age 65 or have physical disabilities that responded, 20 had fully implemented the rule and 23 had CAPs.

Full Implementation of the HCBS Settings Rule Varies by Waiver Type

What to watch as states implement the settings rule?

What have been states’ biggest challenges in implementing the rule? Some of the biggest challenges for states in implementing the settings rule stem from the requirement for waivers to determine compliance for all HCBS providers that serve waiver participants. Several states indicated that full implementation was pending because only one provider or agency was yet to be deemed compliant, including Montana’s waiver for people with intellectual or developmental disabilities and Connecticut’s waiver serving people who are ages 65 and older. For other states, the biggest challenges have been tied to the COVID-19 pandemic, which particularly affected the HCBS workforce. New York reported that the state applied for a corrective action plan because they needed time to hire sufficient staff to support community integration on account of workforce challenges, and 9 states reported full implementation of all settings criteria except for those impacted by the pandemic.

How is the settings rule expected to affect the services received by people with disabilities through the Medicaid program? The settings rule is intended to provide people with disabilities with greater autonomy and independence while they receive HCBS in the most integrated community settings, as is required by the Olmstead ruling. People affected by the rule note that it improves their quality of life in a number of areas, including rights to work a job, choose one’s schedule, and privacy within one’s home. However, some have raised concerns with the rule including its generalization of the needs of all people receiving HCBS and the impracticality of states being able to implement all criteria. States’ progress on implementing the settings rule and addressing these challenges could have implications for a new proposed rule on discrimination, that may apply the principals of the settings rule to more Medicaid HCBS settings.

Full Implementation of HCBS Settings Rule or Corrective Action Plan, by State and Waiver Type

Disparities in Health Measures By Race and Ethnicity Among Beneficiaries in Medicare Advantage: A Review of the Literature

Published: Dec 13, 2023

Executive Summary

During the past decade, Medicare Advantage enrollment has increased steadily, with particularly rapid growth among people of color. Today, just over half of all eligible Medicare beneficiaries are enrolled in Medicare Advantage plans, with higher enrollment rates among Black, Hispanic, and Asian and Pacific Islander beneficiaries than among White beneficiaries. As of 2021, 59% of Black Medicare beneficiaries, 67% of Hispanic beneficiaries, and 55% of Asian and Pacific Islander beneficiaries were enrolled in a Medicare Advantage plan as compared with 43% of White beneficiaries.

Despite the relatively high Medicare Advantage enrollment rates among people of color relative to White beneficiaries, little is known about whether there are racial and ethnic disparities in quality of care and health care experiences among Medicare Advantage enrollees.

A previous KFF review of 62 studies compared Medicare Advantage and traditional Medicare on measures of beneficiary experience and quality of care. The prior review identified relatively few studies that examined differences among beneficiaries by race and ethnicity between Medicare Advantage and traditional Medicare, making it difficult to compare the experiences of people of color across the two sources of Medicare coverage.

This review examines differences in measures of quality of care and beneficiary experience between people of color in Medicare Advantage plans and White Medicare Advantage enrollees or the total Medicare Advantage population. The analysis synthesizes findings from 20 identified studies that were published during the 5-year period between January 2018 and April 2023. These 20 studies collectively report on 46 different measures of quality of care and beneficiary experience, but not all studies examined all groups or included all measures. All differences described in this report are statistically significant unless noted otherwise (e.g., for results that are reported as similar). Most of the studies (17 of 20) controlled for differences in enrollee health status and other demographic characteristics in some fashion. (See Methods for additional information about the criteria used to select studies, Appendix Table 1 for a complete list of measures included in these studies, and Appendix Table 2 for more a detailed description of each study.)

While the scope of this review is limited to Medicare Advantage enrollees, the racial and ethnic disparities in quality of care and beneficiary described in this report mirror disparities in health and health care in traditional Medicare, the overall Medicare population, and more broadly, the U.S adult population.

Black Medicare Advantage Enrollees Fare Worse Than White Enrollees on More Than Half of All Measures Examined

Key Takeaways

Black enrollees: Results are less favorable for Black Medicare Advantage enrollees than White Medicare Advantage enrollees on more than half (24) of the 46 measures examined for this group in 19 studies. Results were more favorable on eight measures, similar on five measures, inconsistent across studies on two measures, and for seven measures, study authors described differences as not practically significant. For example:

  • Preventive service use: a higher share of Black Medicare Advantage enrollees than White enrollees received breast cancer screenings, colorectal cancer screenings, and pap smears, but a lower share of Black enrollees received prostate cancer screenings and flu vaccines.
  • Hospitalizations: a higher share of Black than White Medicare Advantage enrollees were admitted to the hospital for an ambulatory care sensitive condition – a measure of potentially preventable hospitalizations – and a higher share of Black than White enrollees were readmitted to the hospital within 30 days.
  • Mental health: a lower share of Black than White enrollees with depression were treated with antidepressant medication and remained on the medication for at least 12 weeks.
  • Experiences with care: a lower share of Black than White Medicare Advantage enrollees reported seeing a specialist in the past year, but similar shares of Black and White enrollees reported having well-coordinated care and getting needed prescription drugs.
  • Plan ratings: a lower share of Black than White enrollees were enrolled in higher-rated Medicare Advantage plans.

Hispanic enrollees: Findings are less favorable for Hispanic than White Medicare Advantage enrollees on more than a third (16) of the 42 measures examined for this group in 17 studies. Findings were more favorable on eight measures, similar on five measures, inconsistent across studies on three measures, and for 10 measures, study authors described differences as not practically significant. For example:

  • Preventive service use: a higher share of Hispanic than White Medicare Advantage enrollees reported getting screenings for breast cancer, but a lower share received flu vaccines.
  • Disease management: a lower share of Hispanic than White Medicare Advantage enrollees received follow-up care after emergency department visits for certain conditions, such as for mental health and a set of multiple high-risk chronic conditions.
  • Experiences with care: a lower share of Hispanic than White Medicare Advantage enrollees reported getting appointments and care quickly.
  • Hospitalizations: Hispanic and White enrollees had similar rates of hospital readmissions and hospitalizations for ambulatory care sensitive conditions.
  • Plan ratings: A lower share of Hispanic than White enrollees were enrolled in higher-rated Medicare Advantage plans.

Asian and Pacific Islander enrollees: Findings are less favorable for Asian and Pacific Islander enrollees than White enrollees on nine of the 36 measures in 13 studies. Findings were more favorable on seven measures, similar on seven measures, inconsistent across studies on three measures, and for 10 measures, study authors described differences as not practically significant. For example:

  • Preventive services: a higher share of Asian and Pacific Islander than White enrollees received a flu vaccine, while similar shares received colorectal cancer screenings.
  • Disease management: a higher share of Asian and Pacific Islander enrollees than White enrollees received statin therapy as part of their diabetes care, but a lower share of Asian and Pacific Islander enrollees with a new episode of alcohol or other drug dependence initiated treatment for alcohol or other drug dependence.
  • Hospitalizations: Asian and Pacific Islander and White enrollees had similar rates of hospitalizations for ambulatory care sensitive conditions.

American Indian and Alaska Native enrollees: Less than half of the studies identified in this review (9 of 20 studies) presented findings for American Indian and Alaska Native Medicare Advantage enrollees, and collectively, they included fewer measures (25) than studies of Black (46), Hispanic (42) or Asian and Pacific Islander (36) Medicare Advantage enrollees. Findings were less favorable for American Indian and Alaska Native enrollees that White Medicare Advantage enrollees on seven measures, more favorable on four measures, similar on 12 measures, inconsistent across studies on one measure, and for one measure, study authors described differences as not practically significant. For example:

  • Preventive services: a higher share of American Indian and Alaska Native enrollees than White enrollees received breast cancer screenings, and similar shares received a flu vaccine.
  • Disease management: a lower share of American Indian and Alaska Native enrollees than White enrollees had their blood sugar and blood pressure controlled as part of diabetes care.

Gaps in the research and data present challenges in understanding the experiences of specific racial and ethnic groups in Medicare Advantage plans.

  • Medicare Advantage insurers do not report data on prior authorization rates and denials by race or ethnicity, or the use of supplemental benefits for the overall Medicare Advantage population or by race or ethnicity.
  • None of the studies examine outcomes of care such as mortality rates or hospital-acquired infections.
  • None examine the use of post-acute care among Medicare Advantage enrollees by race and ethnicity.
  • None of the studies report findings for Native Hawaiians or other Pacific Islanders separately from other groups, and none of the studies compare measures of quality of care and beneficiary experience between people identifying as two or more racial or ethnic groups with White enrollees.
  • None of the studies present stratified estimates for all of the racial and ethnic groups listed in current federal minimum standards. Studies also varied in how they identified race and ethnicity, with some using self-identified data and others using imputed race/ethnicity data.
  • Few studies stratify race/ethnicity findings among Medicare Advantage enrollees by gender or rural residence.
  • None of the studies stratify findings among Medicare Advantage enrollees by race/ethnicity and dual eligibility status, even though people of color comprise a disproportionate share of Medicare Advantage enrollees who are dual-eligible individuals.

With more than half of Black, Hispanic, and Asian and Pacific Islander beneficiaries enrolled in Medicare Advantage plans, the studies in this review provide some insight into how well Medicare Advantage plans are serving people of color relative to White enrollees. However, the relatively small number of studies coupled with gaps in research present challenges for beneficiaries in making coverage decisions and for policymakers in understanding how best to make Medicare Advantage work well generally and for people of color.

Report

Racial and Ethnic Health Equity in Medicare Advantage: Literature Review

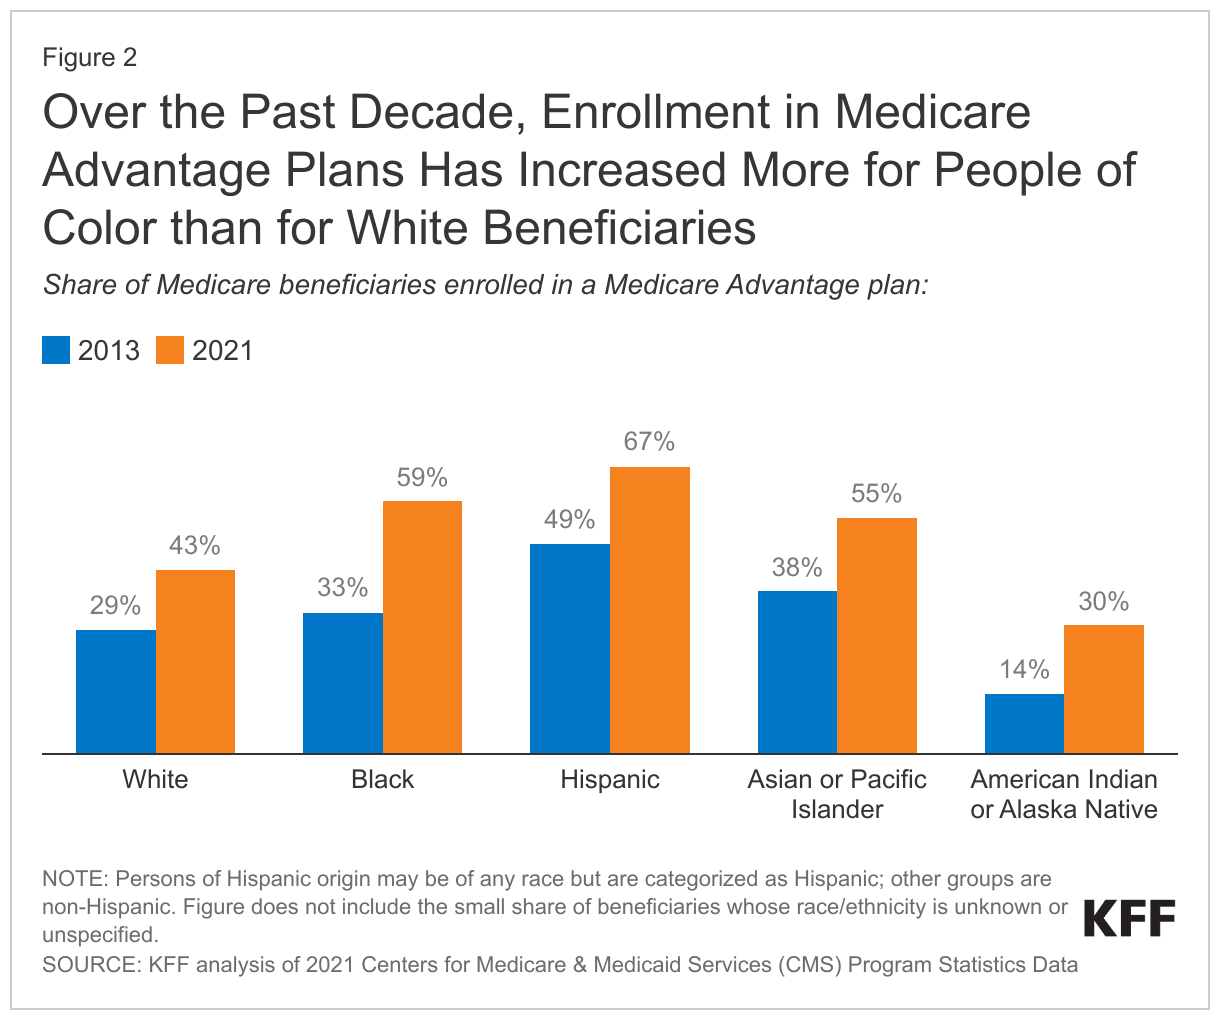
Medicare Advantage is now the dominant form of Medicare coverage for Black, Hispanic, and Asian or Pacific Islander beneficiaries, while the share of American Indian or Alaska Native enrollees in these plans has more than doubled within the past decade (Figure 2). Medicare Advantage plans have several features that may attract enrollees, including people of color. These private plans are often available at little or no extra premium (other than the Part B premium), generally include an out-of-pocket limit (unlike traditional Medicare), and typically offer extra benefits such as dental, vision, and hearing services. Given relatively high Medicare Advantage enrollment rates among people of color, questions have emerged from policy makers, consumers, and others in the general community about whether there are racial and ethnic disparities in quality of care and beneficiary experience among Medicare Advantage enrollees.

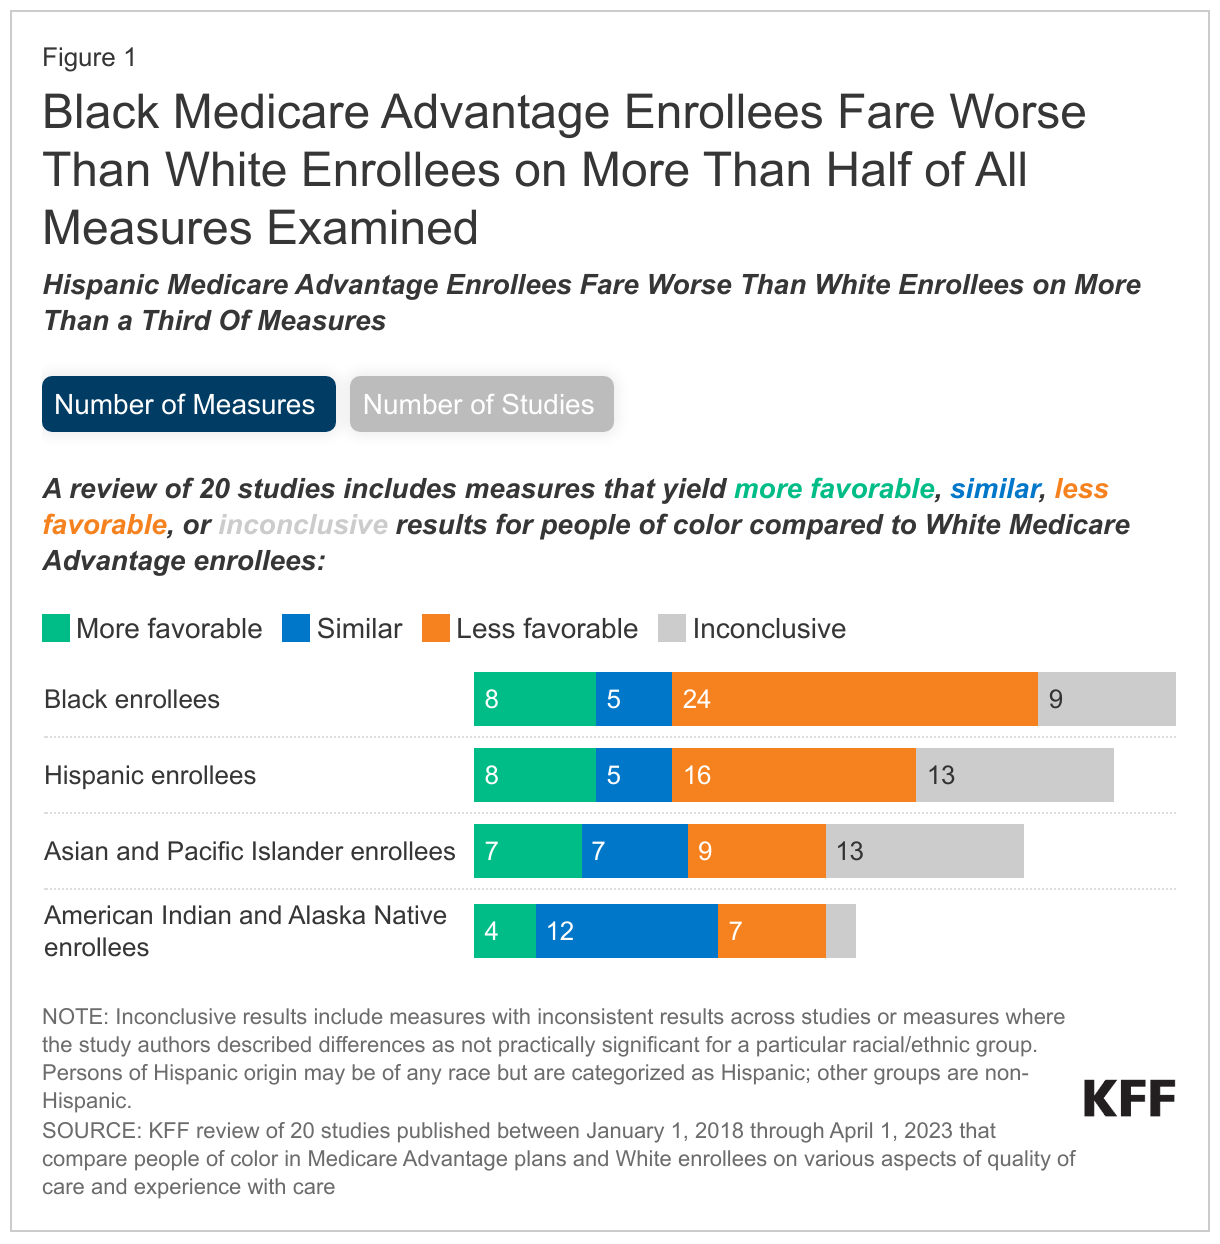
To inform these questions, this brief summarizes findings from 20 studies published between January 1, 2018 and April 1, 2023 that compare quality of care and beneficiary experiences between people of color in Medicare Advantage and White enrollees, or the total Medicare Advantage population. These studies evaluated 46 different measures of quality of care and enrollee experience in Medicare Advantage. This report also discusses gaps in data and in the literature that contribute to challenges in understanding racial and ethnic disparities in quality of care and beneficiary experience in Medicare Advantage.

Over the Past Decade, Enrollment in Medicare Advantage Plans Has Increased More for People of Color than for White Beneficiaries

How do measures of quality of care and beneficiary experience compare between Black and White Medicare Advantage enrollees?

Nineteen studies examined 46 measures of quality of care and beneficiary experience among non-Hispanic Black enrollees (hereafter referred to as “Black enrollees”), including 17 studies that compared estimates for Black enrollees to White enrollees, and two studies that compared estimates for Black enrollees to the overall Medicare Advantage population, which is comprised of mostly White enrollees. These 19 studies examined hospital readmission rates (1 study), potentially avoidable hospitalizations for ambulatory care sensitive conditions (ACSCs) (2 studies), specific measures of disease management (8 studies), quality of plans (3 studies), measures related to experiences with care (8 studies), and utilization of preventive services (7 studies) (Appendix Table 1, Appendix Table 2). Most studies included multiple measures, and some measures were examined among enrollees with different conditions (e.g., receipt of statin therapy examined separately for enrollees with diabetes and cardiovascular conditions).

Among the 19 studies included in this review that compared measures for Black and White Medicare Advantage enrollees, results were less favorable for Black Medicare Advantage enrollees on more than half (24) of the measures examined for this group, more favorable on eight measures, similar on five measures, inconsistent across studies on two measures, and for seven measures, study authors described differences as not practically significant. A description of these results follows.

Hospital Readmissions and Potentially Avoidable Hospitalization
  • Black Medicare Advantage enrollees had higher rates of hospitalization for ambulatory care sensitive conditions than White enrollees, based on two studies that controlled for differences in enrollees’ health status.1 , 2  One of these studies also examined hospitalizations for ambulatory care sensitive conditions in different health care markets and found that differences persisted across geographic areas.3 
  • An additional study found that among enrollees in skilled nursing facilities, Black enrollees had higher rates of 30-day hospital readmissions than White enrollees after adjusting for differences in enrollee health status and other demographic characteristics.4  The differences were lower, but persisted when comparing Black and White enrollees who had stays at the same skilled nursing facility.
Disease management
  • Mental health and substance use care: Compared to both White enrollees and the overall Medicare Advantage population, a lower share of Black enrollees with depression received antidepressant medication management (i.e., treated with antidepressant medication and remained on the medication for at least 12 weeks),5 , 6 , 7  and among those who were hospitalized or who had an emergency department visit for treatment of selected mental health conditions, a lower share of Black enrollees received follow-up care within 30 days of the hospital stay8 , 9 , 10  or emergency department visit.11 , 12  However, among enrollees with a new episode of alcohol or other drug dependence, a higher share of Black enrollees than White enrollees and the overall Medicare Advantage population initiated treatment for alcohol or other drug dependence within 14 days of diagnosis.13 , 14 
  • Cardiovascular health: Compared to White enrollees and the overall Medicare Advantage population, a lower share of Black enrollees who were hospitalized and discharged with a diagnosis of acute myocardial infarction (i.e., a heart attack) received beta-blocker treatments;15 , 16  a lower share of Black enrollees with cardiovascular disease adhered to statin therapy;17 , 18  and a lower share of Black enrollees with hypertension had their blood pressure controlled.19 , 20 , 21  Additionally, among enrollees with a history of a cardiac event, a lower share of Black enrollees than White enrollees had their cholesterol adequately controlled.22 
  • Diabetes care: Among enrollees with diabetes, a lower share of Black enrollees than White enrollees and the overall Medicare Advantage population had their blood sugar and blood pressure under control and adhered to statin therapy.23 , 24  A lower share of Black enrollees than White enrollees used diabetes technology (e.g., insulin pump, continuous glucose monitoring).25  Conversely, a higher share of Black enrollees with diabetes than White enrollees and the overall Medicare Advantage population received eye exams.26 , 27 
  • Multiple high-risk chronic conditions: Among enrollees with multiple high-risk chronic conditions, a lower share of Black enrollees than White enrollees and the overall Medicare Advantage population received follow-up care within seven days of an emergency department visit.28 , 29 
  • Other conditions: Among enrollees with chronic kidney disease, a lower share of Black enrollees than White enrollees were not dispensed a prescription for a potentially harmful medication,30  and a higher share of Black enrollees than White enrollees had their kidney function decline at a faster rate over time.31  Conversely, among enrollees with dementia, a higher share of Black enrollees than White enrollees and the overall Medicare Advantage population were not dispensed a prescription for a potentially harmful medication for dementia.32 , 33  A similar share of Black and White women ages 67 to 85 years who suffered a fracture had their osteoporosis adequately managed,34  and a similar share of Black and White enrollees were dispensed a prescription for their rheumatoid arthritis.35 
Experiences with care
  • A lower share of Black enrollees than White enrollees reported having a specialist visit in the past year, having a usual source of care, and having a primary care clinician as the source of regular care.36 
  • A similar share of Black and White enrollees reported well-coordinated care and getting needed prescription drugs.37  Findings related to getting needed care were mixed: one study found that a similar share of Black and White enrollees reported getting needed care,38  while a second study, which did not control for differences in enrollee characteristics, found that a lower share of Black enrollees than White enrollees reported getting needed care.39 
  • A similar share of Black enrollees and the overall Medicare Advantage population reported getting appointments and care quickly and that it was easy to get needed prescription drugs.40 
  • A similar share of Black and White enrollees were enrolled in plans with narrow networks (i.e., less than 25% of available providers included in network) of primary care, psychiatry, and mental and behavioral health providers, based on a study that calculated the share of enrollees with various characteristics who were enrolled in plans with networks of different breadths.41  In a second study, a lower share of Black enrollees with end-stage renal disease were enrolled in plans with narrow networks of dialysis facilities than White enrollees.42 
Utilization of preventive services
  • Vaccines: A lower share of Black enrollees than White enrollees and the overall Medicare Advantage population received flu vaccines43 , 44 , 45 , 46  and pneumonia vaccines,47  but a higher share of Black enrollees than White enrollees completed the full regimen of COVID-19 vaccines.48 
  • Preventive cancer screenings: A lower share of Black enrollees than White enrollees and the overall Medicare Advantage population received prostate cancer screenings49  but a higher share of Black enrollees received breast cancer screenings.50 , 51 , 52  A higher share of Black enrollees than White enrollees received colorectal cancer screenings53  and pap smears.54  However, a similar share of Black enrollees and the overall Medicare population received colorectal cancer screenings.55 
  • Other preventive screenings: A lower share of Black enrollees than White enrollees had their cholesterol levels tested.56  A similar share of Black and White enrollees without diabetes had their blood sugar tested to detect diabetes.57 
Quality Ratings of plans
  • A lower share of Black enrollees than White enrollees were enrolled in higher-rated plans (i.e., 4-, 4.5- or 5-star plans), a result attributed to limited offerings of higher-rated Medicare plans in counties where Black enrollees reside.58 
  • Black enrollees were more likely than White beneficiaries to be enrolled in lower-rated plans based on quality ratings calculated from the subset of measures included in the Consumer Assessment of Healthcare Providers and Systems (CAHPS) survey responses.59 
  • A lower share of Black enrollees than White enrollees were in a vertically integrated plan (defined by the study authors as plans that were associated with a hospital health system that provides care), which the study found had higher overall star ratings.60 

How do measures of quality of care and beneficiary experience compare between Hispanic and White Medicare Advantage enrollees?

Seventeen studies examined 42 measures of quality of care and beneficiary experience among Hispanic enrollees, including 15 studies that compared estimates for Hispanic enrollees to White enrollees, and two studies that compared estimates for Hispanic enrollees to the overall Medicare Advantage population. These 17 studies examined hospital readmission rates (1 study), potentially avoidable hospitalizations for ACSCs (1 study), specific measures for disease management (8 studies), quality of plans (3 studies), and measures related to experiences with care (7 studies) (Appendix Table 1, Appendix Table 2). Most studies included multiple measures, and some measures were examined among enrollees with different conditions (e.g., receipt of statin therapy examined separately for enrollees with diabetes and cardiovascular conditions).

Among the 17 studies included in this review that compared measures for Hispanic and White Medicare Advantage enrollees, results were less favorable for Hispanic than White Medicare Advantage enrollees on more than a third (16) of measures examined for this group, more favorable on eight measures, similar on five measures, inconsistent across studies on three measures, and for 10 measures, study authors described differences as not practically significant. A description of these results follows.

Hospital Readmissions and Potentially Avoidable Hospitalization

  • Hispanic and White enrollees had similar rates of hospitalization for ambulatory care sensitive conditions after controlling for differences in enrollees’ characteristics, including health status.61 
  • An additional study found that among enrollees in skilled nursing facilities, Hispanic and White enrollees had similar rates of 30-day hospital readmissions, after adjusting for differences in enrollee characteristics, such as health status.62 

Disease management

  • Mental health and substance use care: Compared to White Medicare Advantage enrollees and the overall Medicare Advantage population, a lower share of Hispanic enrollees received antidepressant medication management (among those with depression),63 , 64 , 65  received follow-up care within 30 days of an emergency department visit for treatment of selected mental health conditions,66 , 67  and initiated treatment within 14 days of a new episode of alcohol or other drug dependence.68 , 69 , 70  Among two studies that examined the share of enrollees receiving a follow-up visit within 30 days of hospitalization for treatment of select mental health conditions, one study found that a similar share of Hispanic and White enrollees received this follow-up care,71  while the other study found that a higher share of Hispanic enrollees than White enrollees received this follow-up care.72 
  • Cardiovascular health: Compared to White enrollees and the overall Medicare Advantage population, a lower share of Hispanic enrollees who were hospitalized for a heart attack received beta-blocker treatments,73 , 74  and a lower share of Hispanic enrollees with cardiovascular disease adhered to statin therapy.75 , 76  A similar share of Hispanic and White enrollees with a history of a cardiac event had their cholesterol adequately controlled.77  Findings on a measure related to blood pressure control were mixed: one study found that a higher share of Hispanic enrollees with hypertension had their blood pressure under control compared to White enrollees with hypertension,78  while the second study found that the rates were similar between Hispanic and White enrollees.79 
  • Diabetes care: Among Medicare Advantage enrollees with diabetes, a lower share of Hispanic enrollees than White enrollees and the overall Medicare Advantage population adhered to statin therapy80  and used diabetes technology,81  but a higher share of Hispanic enrollees received eye exams82 , 83  and statin therapy,84 , 85  and had their blood pressure under control.86  While a similar share of Hispanic and the overall Medicare Advantage population had their blood sugar controlled,87  differences between Hispanic and White enrollees on this measure were mixed: one study found that a lower share of Hispanic enrollees than White enrollees had their blood sugar under control,88  while the second study found that the rates were similar between Hispanic and White enrollees.89 
  • Multiple high-risk chronic conditions: Among enrollees with multiple high-risk chronic conditions, a lower share of Hispanic enrollees than White enrollees and the overall Medicare Advantage population received follow-up care within seven days of an emergency department visit.90 , 91 
  • Other conditions: Among enrollees with chronic kidney disease, a lower share of Hispanic enrollees than White enrollees and the overall Medicare Advantage population were not dispensed a prescription for a potentially harmful medication,92 , 93  and Hispanic enrollees had their kidney function decline at a faster rate over time than White enrollees.94  Among enrollees with dementia, a lower share of Hispanic enrollees than White enrollees and the overall Medicare Advantage population were not dispensed a prescription for a potentially harmful medication.95 , 96 , 97  Conversely, among women ages 67 to 85 years in Medicare Advantage plans who suffered a fracture, a higher share of Hispanic enrollees than White enrollees and the overall Medicare Advantage population had their osteoporosis adequately managed.98 , 99 

Experiences with care

  • A lower share of Hispanic enrollees than White enrollees and the overall Medicare Advantage population reported getting appointments and care quickly.100 , 101  Additionally, a lower share of Hispanic than White enrollees reported getting needed care,102 , 103  including in one study that did not control for differences in enrollee characteristics.104 
  • A similar share of Hispanic enrollees and the overall Medicare Advantage population reported that it was easy to get needed prescription drugs.105 
  • Higher shares of Hispanic enrollees than White enrollees were enrolled in plans with narrow networks (i.e., less than 25% of available providers included in network) of primary care providers,106  psychiatrists,107  and dialysis facilities.108  The study that looked at narrow networks of primary care and psychiatry providers presented bivariate comparisons of enrollees with various characteristics who were enrolled in plans with networks of different breadths,109  while the study that focused on narrow networks of dialysis facilities presented both bivariate and multivariate comparisons.110 

Utilization of preventive services

  • Vaccines: A lower share of Hispanic enrollees than White enrollees received flu vaccines,111 , 112  including a study that did not present multivariate comparisons.113  A higher share of Hispanic enrollees than White enrollees received COVID-19 vaccinations.114 
  • Preventive cancer screenings: A higher share of Hispanic enrollees than White enrollees and the overall Medicare population received appropriate screenings for breast cancer115 , 116  and pap smears.117  A similar share of Hispanic and White enrollees were screened for prostate cancer.118 
  • Other preventive screenings: A higher share of Hispanic enrollees than White enrollees had their cholesterol levels tested119  and among enrollees without diabetes, a higher share of Hispanic enrollees than White enrollees had their blood sugar tested to detect diabetes.120 

Quality of plans

  • A lower share of Hispanic enrollees than White enrollees were enrolled in 5-star rated plans, but a somewhat higher share of Hispanic than White enrollees were enrolled in 4-, 4.5, or lower (2- to 3.5) star rated plans, after adjusting for availability of plans at the county level.121 
  • A separate study found that Hispanic enrollees were more likely than White enrollees to be enrolled in lower-rated plans based on quality ratings calculated from the subset of measures included in the Consumer Assessment of Healthcare Providers and Systems (CAHPS) survey responses. 122 
  • A third study found similar shares of Hispanic and White beneficiaries were enrolled in vertically integrated Medicare Advantage plans (i.e., plans associated with a hospital health system that provides care), which the study found had higher overall star ratings.123 

How do measures of quality of care and beneficiary experience compare between Asian and Pacific Islander and White Medicare Advantage enrollees?

Thirteen studies examined 36 measures of quality of care and beneficiary experience among Asian and Pacific Islander enrollees, including 11 studies that compared estimates for Asian and Pacific Islander enrollees to White enrollees and two studies that compared estimates for Asian and Pacific Islander enrollees to the overall Medicare Advantage population. Of the 13 studies, three studies presented estimates for Asian enrollees separately, seven studies presented findings for Asian and Pacific Islander enrollees as a single category, and three studies grouped Asian, Pacific Islander, and Native Hawaiians into a single category (See Appendix Table 1 for results for each group).

These 13 studies examined potentially avoidable hospitalizations for ACSCs (1 study), specific measures of disease management (8 studies), quality of plans (2 studies), measures related to experiences with care (6 studies), and utilization of preventive services (4 studies) (Appendix Table 1, Appendix Table 2). Most studies included multiple measures, and some measures were examined among enrollees with different conditions (e.g., receipt of statin therapy examined separately for enrollees with diabetes and cardiovascular conditions).

Among the 13 studies that compared measures for Asian and Pacific Islander and White Medicare Advantage enrollees, results were less favorable for Asian and Pacific Islander enrollees than White enrollees on nine of the measures examined for this group, more favorable on seven measures, similar on seven measures, inconsistent across studies on three measures, and for 10 measures, study authors described differences as not practically significant. A description of these results follows.

Potentially Avoidable Hospitalization

  • Asian and Pacific Islander and White enrollees had similar rates of hospitalization for ambulatory care sensitive conditions, after controlling for differences in enrollee health status.124 

Disease management

  • Mental health care: Among Medicare Advantage enrollees with depression, a lower share of Asian and Pacific Islander enrollees than White enrollees and the overall Medicare Advantage population received antidepressant medication management,125 , 126 , 127  and among enrollees with a new episode of alcohol or other drug dependence, a lower share of Asian and Pacific Islander enrollees than both groups initiated treatment for the condition.128 , 129 Conversely, a higher share of Asian and Pacific Islander enrollees than White enrollees and the overall Medicare Advantage population were not prescribed opioids at a high dosage for more than 14 days.130 , 131  A similar share of Asian and Pacific Islander enrollees and White enrollees received follow-up care within 30 days of an emergency department visit for select mental health conditions.132  Findings on receipt of follow-up care after hospital stays for mental illness were mixed: one study found that a higher share of Asian and Pacific Islander enrollees than White enrollees received this follow-up care,133  while the second study found that a similar share of Asian and Pacific Islander and White enrollees received this follow-up care.134 
  • Diabetes care: A lower share of Asian and Pacific Islander enrollees with diabetes than White enrollees used diabetes technology (either insulin pump or continuous glucose monitoring).135  Conversely, among enrollees with diabetes, a higher share of Asian and Pacific Islander enrollees than White enrollees and the overall Medicare Advantage population received statin therapy and eye exams,136 , 137  and a higher share of Asian and Pacific Islander than White enrollees with diabetes had their blood pressure under control.138  Two studies that examined blood sugar control for Asian and Pacific Islander enrollees compared to White enrollees had mixed findings: one study found that a lower share of Asian and Pacific Islander enrollees than White enrollees had their blood sugar controlled,139  while a second study found that a higher share of Asian and Pacific Islander enrollees than White enrollees had their blood sugar controlled.140  An additional study found that a higher share of Asian and Pacific Islander enrollees than the share of Medicare Advantage enrollees overall had their blood sugar controlled.141  Among enrollees with diabetes, a similar share of Asian and Pacific Islander enrollees and the overall Medicare Advantage population had their blood pressure under control.142 
  • Cardiovascular health: Compared to White enrollees and the overall Medicare Advantage population, a similar share of Asian and Pacific Islander enrollees who were hospitalized for a heart attack received beta-blocker treatments,143  and a similar share of Asian and Pacific Islander enrollees with a history of a cardiac event had their cholesterol adequately controlled.144  In the two studies that examined the share of enrollees with hypertension who had their blood pressure under control, differences in the shares of Asian and Pacific Islander and White enrollees on this measure were mixed.145 , 146  An additional study comparing the share of Asian and Pacific Islander enrollees with hypertension to the overall Medicare Advantage population found that a higher share of Asian and Pacific Islander enrollees had their blood pressure controlled than the overall Medicare Advantage population.147 
  • Other conditions: Compared to White enrollees and the overall Medicare Advantage population, a higher share of Asian and Pacific Islander enrollees with dementia were not dispensed a prescription for a potentially harmful medication,148 , 149 , 150  and a higher share of Asian and Pacific Islander women ages 67 to 85 years who suffered a fracture had their osteoporosis adequately managed.151 , 152  Asian and Pacific Islander and White enrollees with chronic kidney failure experienced similar progression of the disease over time.153 
  • Multiple high-risk chronic conditions: Among enrollees with multiple high-risk chronic conditions, a higher share of Asian and Pacific Islander enrollees than the overall Medicare Advantage population received follow-up care within seven days of an emergency department visit.154 

Experiences with care

  • A lower share of Asian and Pacific Islander enrollees than White enrollees and the overall Medicare Advantage population reported getting needed care, getting appointments and care quickly, having their care well-coordinated, and getting needed prescription drugs.155 , 156 
  • A higher share of Asian and Pacific Islander enrollees than White enrollees were enrolled in plans with narrow networks (i.e., less than 25% of available providers included in network) of primary care providers,157  psychiatrists,158  mental and behavioral health providers,159  and dialysis facilities.160  One of these studies presented bivariate comparisons of enrollees with various characteristics who were enrolled in plans with networks of primary care, psychiatry, and mental health providers of different breadths,161  while the other study, focusing on networks of dialysis facilities, presented both bivariate and multivariate comparisons.162 

Utilization of preventive services

  • Vaccines: A higher share of Asian and Pacific Islander than White enrollees and the overall Medicare Advantage population received a flu vaccine.163 , 164 Preventive cancer screenings: The share of Asian and Pacific Islander enrollees receiving colorectal cancer screenings was similar to the share among White enrollees and the overall Medicare Advantage population.165 , 166 

Quality of plans

  • A lower share of Asian and Pacific Islander enrollees than White enrollees were enrolled in 4-, 4.5-, and 5-star rated plans and a higher share of Asian and Pacific Islander than White enrollees were enrolled in plans with ratings of 3.5 stars or below, after adjusting for availability of plans at the county level. 167 
  • A similar share of Asian and Pacific Islander and White enrollees were enrolled in vertically integrated Medicare Advantage plans.168 

How do measures of quality of care and beneficiary experience compare between American Indian and Alaska Native Medicare Advantage enrollees and White enrollees?

Nine studies examined 25 measures of quality of care received by American Indian and Alaska Native enrollees, including seven studies that compared estimates for American Indian and Alaska Native enrollees to White enrollees, and two studies that compared estimates for American Indian and Alaska Native enrollees to the overall Medicare Advantage population. These nine studies examined measures for disease management (5 studies), quality of plans (1 study), experiences with care (7 studies), and utilization of preventive services (7 studies) (Appendix Table 1, Appendix Table 2). Most studies included multiple measures, and some measures were examined among enrollees with different conditions (e.g., receipt of statin therapy examined separately for enrollees with diabetes and cardiovascular conditions). These nine studies did not further disaggregate American Indian and Alaska Native enrollees living in tribal areas, likely due to sample size limitations.

Among the nine studies included in this review that compared American Indian and Alaska Native and White Medicare Advantage enrollees, findings were less favorable for American Indian and Alaska Native enrollees that White Medicare Advantage enrollees on seven measures, more favorable on four measures, similar on 12 measures, inconsistent across studies on one measure, and for one measure, study authors described differences as not practically significant.

Disease management

  • Mental health care: A lower share of American Indian and Alaska Native enrollees than White enrollees initiated treatment for alcohol or other drug dependence within 14 days of diagnosis,169  but a higher share of American Indian and Alaska Native enrollees was not prescribed opioids at a high dosage.170  A similar share of American Indian and Alaska Native enrollees and White enrollees with depression received antidepressant medication management.171 Compared to the overall Medicare Advantage population, a lower share of American Indian and Alaska Native enrollees received antidepressant medication management, but a higher share of American Indian and Alaska Native enrollees with a new episode of alcohol or other drug dependence initiated treatment for the condition.172 
  • Cardiovascular health: A lower share of American Indian and Alaska Native enrollees with hypertension than White enrollees with hypertension had their blood pressure under control.173  A similar share of American Indian and Alaska Native and White enrollees with cardiovascular disease received and adhered to statin therapy,174  and a similar share of both groups of enrollees with a prior-year history of a cardiac event had their cholesterol under control.175  However, compared to the overall Medicare Advantage population, a lower share of American Indian and Alaska Native enrollees with cardiovascular disease received and adhered to statin therapy.176 
  • Diabetes care: Among enrollees with diabetes, a lower share of American Indian and Alaska Native enrollees than White enrollees and the overall Medicare Advantage population adhered to statin therapy177 , 178  and had their blood sugar controlled.179 , 180  Additionally, a lower share of American Indian and Alaska Native enrollees with diabetes than White enrollees had their blood pressure controlled.181  A similar share of American Indian and Alaska Native and White enrollees with diabetes received statin therapy and blood sugar testing.182  Compared to the overall population of Medicare Advantage enrollees with diabetes, a lower share of American Indian and Alaska Native enrollees received statin therapy, and a similar share received eye exams.183 
  • Other conditions: Among enrollees with rheumatoid arthritis, a higher share of American Indian and Alaska Native enrollees than White enrollees received therapy for rheumatoid arthritis, and among enrollees with dementia, a higher share of American Indian and Alaska Native enrollees than White enrollees were not dispensed a prescription for a potentially harmful medication.184  The share of American Indian and Alaska Native enrollees who were not dispensed a prescription for a potentially harmful medication for chronic renal failure was similar to the share among White enrollees185  and the overall Medicare Advantage population.186  Compared to the overall population of Medicare Advantage enrollees with dementia, a similar share of American Indian and Alaska Native enrollees with dementia were not dispensed a prescription for a potentially harmful medication.187 
  • Multiple high-risk chronic conditions: Among enrollees with multiple high-risk chronic conditions, the share of American Indian and Alaska Native enrollees receiving follow-up care within seven days of an emergency department visit was similar to the share among White enrollees188  and the overall Medicare Advantage population.189 

Experiences with care

  • Compared to White enrollees and the overall Medicare Advantage population, a similar share of American Indian and Alaska Native enrollees reported getting needed care, getting appointments and care quickly, and having their care coordinated.190 , 191  However, a lower share of American Indian and Alaska Native enrollees than White enrollees reported that it was easy to get needed prescription drugs.192 
  • Among enrollees with end-stage renal disease, a higher share of American Indian and Alaska Native enrollees than White enrollees were enrolled in plans with narrow networks (e., less than 25% of available providers included in network) of dialysis facilities.193  A similar share of American Indian and Alaska Native enrollees and White enrollees were enrolled in plans with narrow networks of primary care, psychiatry, and mental and behavioral health providers, based on a study that calculated the share of enrollees with various characteristics who were enrolled in plans with networks of different breadths.194 

Utilization of preventive services

  • Vaccines: A similar share of American Indian and Alaska Native and White enrollees received a flu vaccine.195  This review did not identify studies that compared utilization of other vaccines (e.g., pneumonia and COVID-19 vaccines) among American Indian and Alaska Native enrollees to White enrollees or to the total Medicare Advantage population.
  • Preventive cancer screenings: A higher share of American Indian and Alaska Native women ages 50 to 74 in Medicare Advantage plans than White women of the same age in Medicare Advantage plans received breast cancer screening,196  but a lower share of American Indian and Alaska Native women than women in the overall Medicare Advantage population received this screening.197 

Gender. Only three studies in this review further stratified findings pertaining to Medicare Advantage enrollees by race and ethnicity and gender, with findings that generally mirrored the overall pattern for each racial or ethnic groups.198 , 199 , 200  For example, one study found that compared to White women and men enrolled in Medicare Advantage, a lower share of Asian and Pacific Islander women and men in Medicare Advantage, respectively, reported getting needed care, getting appointments and care quickly, having their care well-coordinated, and getting needed prescription drugs, and a higher share of Asian and Pacific Islander women and men than White women and men in Medicare Advantage reported getting an annual flu vaccine.201 

Rural residence. Just two studies examine measures of quality of care and beneficiary experience among enrollees in rural areas by race and ethnicity, with findings that mirrored the overall pattern in some, but not all measures.202 , 203 For example, consistent with the overall pattern, a lower share of Black and Hispanic enrollees in rural areas than White enrollees in rural areas received beta-blocker treatments, but higher shares of Black and Hispanic enrollees in rural areas received breast cancer screenings.204  However, while a lower share of Hispanic enrollees than White enrollees overall reported getting appointments and care quickly, a similar share of Hispanic and White enrollees in rural areas reported getting appointments and care quickly. 205 

Dual-eligible individuals. This review did not identify any studies that examined how measures of quality of care and beneficiary experience compare between dual-eligible people of color and dual-eligible White beneficiaries. Among dual-eligible individuals, higher shares of people of color are enrolled in Medicare Advantage plans than White beneficiaries: in 2020, a higher share of Black (54%), Hispanic (65%), and Asian/Pacific Islander (48%) dual-eligible individuals were enrolled in Medicare Advantage plans than White (41%) and American Indian or Alaska Native (25%) dual-eligible individuals. A better understanding of how these groups compare on measures of quality of care and beneficiary experiences could help inform an understanding of the extent to which Medicare Advantage plans are meeting the needs of dually-eligible individuals enrolled in these plans.

Discussion

With Medicare Advantage now covering more than half of all Black, Hispanic, and Asian and Pacific Islander Medicare beneficiaries, this review of the literature provides some insight into quality of care and beneficiary experiences for people of color enrolled in Medicare Advantage plans compared to White Medicare Advantage enrollees.

Overall, this review of these studies finds that while higher shares of Black Medicare Advantage enrollees than White enrollees received some preventive services, such as breast cancer screenings, findings were less favorable for Black enrollees than White enrollees on other preventive services, such as receipt of prostate cancer screenings, along with more than half of quality of care and beneficiary experience measures analyzed across the studies, such as higher rates of hospitalization for ambulatory care sensitive conditions. This review of the literature also finds that while higher shares of Hispanic enrollees than White enrollees received preventive services such as breast cancer screenings, findings were less favorable for Hispanic enrollees than White enrollees on more than a third of the measures, such as antidepressant medication management.

While a higher share of Asian and Pacific Islander enrollees than White enrollees received flu vaccines, few differences were found for Asian and Pacific Islander enrollees relative to White enrollees on other measures. Overall, fewer studies focused on American Indian and Alaska Native enrollees, making it difficult to assess the strength of the findings or how broadly they apply for this population. For instance, while a few studies examined receipt of breast cancer screenings among this population, this report did not identify studies that examined, or had sufficient sample size to examine, use of other preventive cancer screenings (e.g., colorectal, prostate, and cervical cancer screenings) among American Indian and Alaska Native enrollees compared with White enrollees or the overall Medicare Advantage population. None of the studies examined outcomes of care such as mortality rates or hospital-acquired infections by race and ethnicity, and very few studies focused on subgroups within each racial or ethnic group, such as gender and rural status. None of the identified studies examined the use of post-acute care or the total number or duration of hospital admissions among Medicare Advantage enrollees by race and ethnicity.

Substantial gaps in Medicare Advantage data hinder researchers’ ability to examine specific areas of interest in the context of Medicare Advantage, such as use of supplemental benefits offered by Medicare Advantage plans or the application of prior authorization and denials, by race and ethnicity. More concerted research efforts and more robust data to understand the experiences of people of color in Medicare Advantage plans would help inform policymakers and beneficiaries as enrollment in these plans continues to climb.

While the scope of this review is limited to Medicare Advantage enrollees, reflecting higher enrollment of Black, Hispanic, and Asian and Pacific Islander enrollees in these plans, the racial and ethnic disparities described in this report mirror disparities in health and health care in traditional Medicare, the overall Medicare population, and more broadly, the U.S adult population. Such disparities are influenced by a multitude of structural factors including systemic racism that accumulate over the course of a lifetime and may contribute to racial disparities in health experiences and outcomes in older ages.

This work was supported in part by Arnold Ventures. KFF maintains full editorial control over all of its policy analysis, polling, and journalism activities.

Appendix

Data and Methods for Comparing Racial/Ethnic Disparities in Medicare Advantage

Study inclusion and exclusion criteria

This literature review summarizes findings from 20 studies published between January 1, 2018 and April 1, 2023. These 20 studies include 18 studies that compare measures of quality of care and beneficiary experience between people of color in Medicare Advantage plans and White enrollees, and two studies that report findings for people of color relative to all Medicare Advantage enrollees rather than just White enrollees. Two of the 20 studies presented estimates for specific subgroups (e.g., Black enrollees in rural areas in Medicare Advantage plans) without presenting overall estimates for a particular racial or ethnic group (e.g., Black enrollees in Medicare Advantage plans overall).

Studies were selected for the review if they included data for at least one year from 2013 or later. Twelve studies used data from a year between 2018 and 2023, while the remaining (8 studies) used data from a year between 2013 and 2017 (Appendix Table 2). The data period is relevant because the Affordable Care Act made substantial changes to how Medicare Advantage plans are paid, which were not fully phased in for several years after that legislation was enacted in 2010, and so their effects may not be fully captured by studies that use older data.

To meet the inclusion criteria, studies also had to include a transparent discussion of methods and data sources, including discussion of limitations. Most studies included in this literature review are articles from peer-reviewed journals, but this review also includes studies published by independent policy and research groups as well as government reports. The brief excludes studies that were fully funded by advocacy or industry groups.

To collect relevant studies, keyword searches were conducted of PubMed, Google Scholar, and other academic search engines, as well as the websites of governmental, research, and policy organizations that publish work related to health care. Additional studies were found using a snowball technique based on bibliographies of previously pulled studies. While the approach was designed to be as comprehensive as possible in including studies that meet the criteria, it is possible that some relevant studies were overlooked.

All differences reported in the text are statistically significant (with p-value less than or equal to 0.05) unless noted otherwise (e.g., for results that are reported as similar). In a few studies, researchers distinguished differences that were statistically significant, but not practically significant due to very small differences in estimates, although the threshold for practical significance varied across studies (Appendix Table 1).

Methods and data used in studies to compare Medicare Advantage enrollees by race and ethnicity

Studies in this review presented stratified estimates for some but not all of the racial and ethnic groups listed in current federal minimum standards. Current federal minimum standards for collecting and presenting data on race and ethnicity, as specified by the Office of Management and Budget (OMB), include the following ethnic groups: 1) not Hispanic or Latino and 2) Hispanic or Latino; and the following racial groups: 1) American Indian and Alaska Native, 2) Asian, 3) Black or African American, 4) Native Hawaiian or Other Pacific Islander, and 5) White. These standards were last updated in 1997, with OMB proposing to update them again in 2023 to reflect the increasing diversity of the U.S population and evolved immigration patterns. A report by the Office of Inspector General (OIG) found that Medicare’s enrollment data are inconsistent with federal data collection standards, limiting researchers’ ability to ensure that their racial/ethnic stratifications are in alignment with federal data collection standards. This report describes results for each of the racial or ethnic groups included in the 20 studies. If a particular racial or ethnic group is not mentioned, it means that estimates for that particular racial or ethnic group for that specific measure were not presented.

Data sources used in these studies varied in how they identified race and ethnicity of enrollees. For example, a study that used the Health Outcomes Survey used self-reported data to identify enrollees’ race and ethnicity. The Healthcare Effectiveness Data and Information Set (HEDIS), which was used as a source of data in eight studies, uses an imputed methodology that combines CMS’ administrative data, surname, and residential information to identify enrollees by race or ethnicity. This method is recommended for providing estimates for White, Black, Hispanic, and Asian and Pacific Islander enrollees, but not for American Indian and Alaska Native enrollees. Therefore, some studies were able to present estimates for American Indian and Alaska Native enrollees on CAHPS measures, but not HEDIS measures. Two studies used claims data from a single insurer (UnitedHealth), which uses a proprietary imputation method that cross-references enrollees’ names and zip code to a nationally recognized supplier of consumer marketing data to generate a weighted prediction of race/ethnicity from over 180 ethnicities.

Analyses varied in data sources used to compare measures of quality of care and beneficiary experience by race and ethnicity. Most studies reviewed here (17 out of 20 studies) used nationally representative data sources (Appendix Table 2), such as the Medicare Current Beneficiary Survey and the HEDIS. Two studies used claims data collected from a single health plan (UnitedHealth) that covered enrollees within the plan nationally, and one study used electronic health records data from primary care facilities across 10 states. No studies were identified that used Medicare Advantage encounter data.

Most studies used multivariate regression models to account for differences in beneficiary characteristics, including differences in health status. Of the 20 studies in this review, most (17 studies) used multivariate models to account for differences in the characteristics of enrollees in Medicare Advantage including demographic, socioeconomic, and health risks, though they varied in methodology and transparency (Appendix Table 2). A few studies further controlled for plan and contract-level characteristics, such as county-level market penetration rates, plan type (e.g., HMO versus PPO), integrated health system status, and whether the contract had one or more Special Needs Plans. In the case of studies that presented both bivariate and multivariate estimates, the adjusted estimates are reported in this review. The remaining three studies that did not present findings from multivariate models examined measures of beneficiary experience, rather than quality of care.

The use of more advanced statistical methods varied. Two studies created matched samples (e.g., using propensity score matching to balance samples of enrollees in vertically-integrated plans versus other Medicare Advantage plans) or included inverse probability of treatment weights in the regression model as a further attempt to adjust for differences in the likelihood of certain groups to enroll in certain Medicare Advantage plans over others (i.e., integrated plans versus non-integrated plans) (Appendix Table 2). No studies were identified that used a quasi-experimental design, such as difference-in-differences or an instrumental variable approach, to isolate the effect of race/ethnicity among Medicare Advantage enrollees on outcomes of interest.

Appendix Tables

Seventeen of 20 Studies Compared Measures of Quality of Care and Beneficiary Experience Between People of Color and White Enrollees
Twenty Studies Comparing Measures of Quality of Care and Beneficiary Experience in Medicare Advantage by Race and Ethnicity

Endnotes

  1. Sungchul Park, Paul Fishman, and Norma B. Coe, “Racial Disparities in Avoidable Hospitalizations in Traditional Medicare and Medicare Advantage,” Medical Care 59 no. 11 (November 2021): 989-996, doi:10.1097/MLR.0000000000001632 ↩︎
  2. Sungchul Park, Rachel Werner, and Norma Coe, “Association of Medicare Advantage Star Ratings With Racial and Ethnic Disparities in Hospitalizations for Ambulatory Care Sensitive Conditions,” Medical Care 60 no. 12 (December 2022): 872-879, DOI: 10.1097/MLR.0000000000001770 ↩︎
  3. Sungchul Park, Paul Fishman, and Norma B. Coe, “Racial Disparities in Avoidable Hospitalizations in Traditional Medicare and Medicare Advantage,” Medical Care 59 no. 11 (November 2021): 989-996, doi:10.1097/MLR.0000000000001632 ↩︎
  4. Maricruz Rivera-Hernandez, Momotazur Rahman, Vincent Mor, and Amal N. Trivedi, “Racial disparities in readmission rates among patients discharged to skilled nursing facilities,” Journal of the American Geriatrics Society 67 no. 8 (August 2019): 1672-1679, https://doi.org/10.1111/jgs.15960 ↩︎
  5. Steven C. Martino et al, Racial, Ethnic, & Gender Disparities in Health Care in Medicare Advantage (Baltimore, MD: Centers for Medicare & Medicaid Services Office of Minority Health, April 2021), https://www.cms.gov/files/document/racial-ethnic-gender-disparities-health-care-medicare-advantage.pdf ↩︎
  6. Joshua Breslau et al., “Racial And Ethnic Differences In The Attainment Of Behavioral Health Quality Measures In Medicare Advantage Plans,” Health Affairs 37 no. 10 (October 2018): 1685-1692, https://doi.org/10.1377/hlthaff.2018.0655 ↩︎
  7. Steven C. Martino et al, Disparities in Health Care in Medicare Advantage by Race, Ethnicity, and Sex (Baltimore, MD: Centers for Medicare & Medicaid Services Office of Minority Health, April 2023), https://www.cms.gov/files/document/disparities-health-care-medicare-advantage-race-ethnicity-and-sex.pdf-0 ↩︎
  8. Steven C. Martino et al, Racial, Ethnic, & Gender Disparities in Health Care in Medicare Advantage (Baltimore, MD: Centers for Medicare & Medicaid Services Office of Minority Health, April 2021), https://www.cms.gov/files/document/racial-ethnic-gender-disparities-health-care-medicare-advantage.pdf ↩︎
  9. Joshua Breslau et al., “Racial And Ethnic Differences In The Attainment Of Behavioral Health Quality Measures In Medicare Advantage Plans,” Health Affairs 37 no. 10 (October 2018): 1685-1692, https://doi.org/10.1377/hlthaff.2018.0655 ↩︎
  10. Steven C. Martino et al, Disparities in Health Care in Medicare Advantage by Race, Ethnicity, and Sex (Baltimore, MD: Centers for Medicare & Medicaid Services Office of Minority Health, April 2023), https://www.cms.gov/files/document/disparities-health-care-medicare-advantage-race-ethnicity-and-sex.pdf-0 ↩︎
  11. Steven C. Martino et al, Racial, Ethnic, & Gender Disparities in Health Care in Medicare Advantage (Baltimore, MD: Centers for Medicare & Medicaid Services Office of Minority Health, April 2021), https://www.cms.gov/files/document/racial-ethnic-gender-disparities-health-care-medicare-advantage.pdf ↩︎
  12. Steven C. Martino et al, Disparities in Health Care in Medicare Advantage by Race, Ethnicity, and Sex (Baltimore, MD: Centers for Medicare & Medicaid Services Office of Minority Health, April 2023), https://www.cms.gov/files/document/disparities-health-care-medicare-advantage-race-ethnicity-and-sex.pdf-0 ↩︎
  13. Joshua Breslau et al., “Racial And Ethnic Differences In The Attainment Of Behavioral Health Quality Measures In Medicare Advantage Plans,” Health Affairs 37 no. 10 (October 2018): 1685-1692, https://doi.org/10.1377/hlthaff.2018.0655 ↩︎
  14. Steven C. Martino et al, Disparities in Health Care in Medicare Advantage by Race, Ethnicity, and Sex (Baltimore, MD: Centers for Medicare & Medicaid Services Office of Minority Health, April 2023), https://www.cms.gov/files/document/disparities-health-care-medicare-advantage-race-ethnicity-and-sex.pdf-0 ↩︎
  15. Steven C. Martino et al, Racial, Ethnic, & Gender Disparities in Health Care in Medicare Advantage (Baltimore, MD: Centers for Medicare & Medicaid Services Office of Minority Health, April 2021), https://www.cms.gov/files/document/racial-ethnic-gender-disparities-health-care-medicare-advantage.pdf ↩︎
  16. Steven C. Martino et al, Disparities in Health Care in Medicare Advantage by Race, Ethnicity, and Sex (Baltimore, MD: Centers for Medicare & Medicaid Services Office of Minority Health, April 2023), https://www.cms.gov/files/document/disparities-health-care-medicare-advantage-race-ethnicity-and-sex.pdf-0 ↩︎
  17. Steven C. Martino et al, Racial, Ethnic, & Gender Disparities in Health Care in Medicare Advantage (Baltimore, MD: Centers for Medicare & Medicaid Services Office of Minority Health, April 2021), https://www.cms.gov/files/document/racial-ethnic-gender-disparities-health-care-medicare-advantage.pdf ↩︎
  18. Steven C. Martino et al, Disparities in Health Care in Medicare Advantage by Race, Ethnicity, and Sex (Baltimore, MD: Centers for Medicare & Medicaid Services Office of Minority Health, April 2023), https://www.cms.gov/files/document/disparities-health-care-medicare-advantage-race-ethnicity-and-sex.pdf-0 ↩︎
  19. Steven C. Martino et al, Racial, Ethnic, & Gender Disparities in Health Care in Medicare Advantage (Baltimore, MD: Centers for Medicare & Medicaid Services Office of Minority Health, April 2021), https://www.cms.gov/files/document/racial-ethnic-gender-disparities-health-care-medicare-advantage.pdf ↩︎
  20. Steven C. Martino et al, Disparities in Health Care in Medicare Advantage by Race, Ethnicity, and Sex (Baltimore, MD: Centers for Medicare & Medicaid Services Office of Minority Health, April 2023), https://www.cms.gov/files/document/disparities-health-care-medicare-advantage-race-ethnicity-and-sex.pdf-0 ↩︎
  21. Shayla N. M. Durfey et al, “Neighborhood disadvantage and chronic disease management,” Health Services Research 54 no.S1 (February 2019): 206-216, https://doi.org/10.1111/1475-6773.13092 ↩︎
  22. Shayla N. M. Durfey et al, “Neighborhood disadvantage and chronic disease management,” Health Services Research 54 no.S1 (February 2019): 206-216, https://doi.org/10.1111/1475-6773.13092 ↩︎
  23. Steven C. Martino et al, Racial, Ethnic, & Gender Disparities in Health Care in Medicare Advantage (Baltimore, MD: Centers for Medicare & Medicaid Services Office of Minority Health, April 2021), https://www.cms.gov/files/document/racial-ethnic-gender-disparities-health-care-medicare-advantage.pdf ↩︎
  24. Steven C. Martino et al, Disparities in Health Care in Medicare Advantage by Race, Ethnicity, and Sex (Baltimore, MD: Centers for Medicare & Medicaid Services Office of Minority Health, April 2023), https://www.cms.gov/files/document/disparities-health-care-medicare-advantage-race-ethnicity-and-sex.pdf-0 ↩︎
  25. Mallika Kommareddi, Kael Wherry, and Robert A Vigersky, “Racial/Ethnic Inequities in Use of Diabetes Technologies Among Medicare Advantage Beneficiaries With Type 1 Diabetes,” Journal of Clinical Endocrinology & Metabolism (January 2023), https://doi.org/10.1210/clinem/dgad046 ↩︎
  26. Steven C. Martino et al, Racial, Ethnic, & Gender Disparities in Health Care in Medicare Advantage (Baltimore, MD: Centers for Medicare & Medicaid Services Office of Minority Health, April 2021), https://www.cms.gov/files/document/racial-ethnic-gender-disparities-health-care-medicare-advantage.pdf ↩︎
  27. Steven C. Martino et al, Disparities in Health Care in Medicare Advantage by Race, Ethnicity, and Sex (Baltimore, MD: Centers for Medicare & Medicaid Services Office of Minority Health, April 2023), https://www.cms.gov/files/document/disparities-health-care-medicare-advantage-race-ethnicity-and-sex.pdf-0 ↩︎
  28. Steven C. Martino et al, Racial, Ethnic, & Gender Disparities in Health Care in Medicare Advantage (Baltimore, MD: Centers for Medicare & Medicaid Services Office of Minority Health, April 2021), https://www.cms.gov/files/document/racial-ethnic-gender-disparities-health-care-medicare-advantage.pdf ↩︎
  29. Steven C. Martino et al, Disparities in Health Care in Medicare Advantage by Race, Ethnicity, and Sex (Baltimore, MD: Centers for Medicare & Medicaid Services Office of Minority Health, April 2023), https://www.cms.gov/files/document/disparities-health-care-medicare-advantage-race-ethnicity-and-sex.pdf-0 ↩︎
  30. Steven C. Martino et al, Racial, Ethnic, & Gender Disparities in Health Care in Medicare Advantage (Baltimore, MD: Centers for Medicare & Medicaid Services Office of Minority Health, April 2021), https://www.cms.gov/files/document/racial-ethnic-gender-disparities-health-care-medicare-advantage.pdf ↩︎
  31. Clarissa Diamantidis et al., “Disparities in Chronic Kidney Disease Progression by Medicare Advantage Enrollees,” American Journal of Nephrology 52 no. 12 (January 2022): 949–957, https://doi.org/10.1159/000519758 ↩︎
  32. Steven C. Martino et al, Racial, Ethnic, & Gender Disparities in Health Care in Medicare Advantage (Baltimore, MD: Centers for Medicare & Medicaid Services Office of Minority Health, April 2021), https://www.cms.gov/files/document/racial-ethnic-gender-disparities-health-care-medicare-advantage.pdf ↩︎
  33. Joshua Breslau et al., “Racial And Ethnic Differences In The Attainment Of Behavioral Health Quality Measures In Medicare Advantage Plans,” Health Affairs 37 no. 10 (October 2018): 1685-1692, https://doi.org/10.1377/hlthaff.2018.0655 ↩︎
  34. Steven C. Martino et al, Racial, Ethnic, & Gender Disparities in Health Care in Medicare Advantage (Baltimore, MD: Centers for Medicare & Medicaid Services Office of Minority Health, April 2021), https://www.cms.gov/files/document/racial-ethnic-gender-disparities-health-care-medicare-advantage.pdf ↩︎
  35. Steven C. Martino et al, Racial, Ethnic, & Gender Disparities in Health Care in Medicare Advantage (Baltimore, MD: Centers for Medicare & Medicaid Services Office of Minority Health, April 2021), https://www.cms.gov/files/document/racial-ethnic-gender-disparities-health-care-medicare-advantage.pdf ↩︎
  36. Kenton J. Johnston et al., “Association of Race and Ethnicity and Medicare Program Type With Ambulatory Care Access and Quality Measures,” JAMA 326, no. 7 (August 2021): 628-636, doi:10.1001/jama.2021.10413 ↩︎
  37. Steven C. Martino et al, Racial, Ethnic, & Gender Disparities in Health Care in Medicare Advantage (Baltimore, MD: Centers for Medicare & Medicaid Services Office of Minority Health, April 2021), https://www.cms.gov/files/document/racial-ethnic-gender-disparities-health-care-medicare-advantage.pdf ↩︎
  38. Steven C. Martino et al, Racial, Ethnic, & Gender Disparities in Health Care in Medicare Advantage (Baltimore, MD: Centers for Medicare & Medicaid Services Office of Minority Health, April 2021), https://www.cms.gov/files/document/racial-ethnic-gender-disparities-health-care-medicare-advantage.pdf ↩︎
  39. Anuj Gangopadhyaya, Stephen Zuckerman, and Nikhil Rao, “Assessing the Difference in Racial and Ethnic Disparities in Access to and Use of Care Between Traditional Medicare and Medicare Advantage,” Health Services Research (March 2023): 1-10, https://doi.org/10.1111/1475-6773.14150 ↩︎
  40. Steven C. Martino et al, Disparities in Health Care in Medicare Advantage by Race, Ethnicity, and Sex (Baltimore, MD: Centers for Medicare & Medicaid Services Office of Minority Health, April 2023), https://www.cms.gov/files/document/disparities-health-care-medicare-advantage-race-ethnicity-and-sex.pdf-0 ↩︎
  41. David J. Meyers, Momotazur Rahman, and Amal N. Trivedi, “Narrow Primary Care Networks in Medicare Advantage,” Journal of General Internal Medicine 37 (February 2022): 488-491, https://doi.org/10.1007/s11606-020-06534-2 ↩︎
  42. Eunhae Grace Oh, David J. Meyers, Kevin H. Nguyen, and Amal N. Trivedi, “Narrow Dialysis Networks In Medicare Advantage: Exposure By Race, Ethnicity, And Dual Eligibility,” Health Affairs 42, no. 2 (February 2022): 252-260, https://doi.org/10.1377/hlthaff.2022.01044 ↩︎
  43. Steven C. Martino et al, Racial, Ethnic, & Gender Disparities in Health Care in Medicare Advantage (Baltimore, MD: Centers for Medicare & Medicaid Services Office of Minority Health, April 2021), https://www.cms.gov/files/document/racial-ethnic-gender-disparities-health-care-medicare-advantage.pdf ↩︎
  44. Steven C. Martino et al, Disparities in Health Care in Medicare Advantage by Race, Ethnicity, and Sex (Baltimore, MD: Centers for Medicare & Medicaid Services Office of Minority Health, April 2023), https://www.cms.gov/files/document/disparities-health-care-medicare-advantage-race-ethnicity-and-sex.pdf-0 ↩︎
  45. Kenton J. Johnston et al., “Association of Race and Ethnicity and Medicare Program Type With Ambulatory Care Access and Quality Measures,” JAMA 326, no. 7 (August 2021): 628-636, doi:10.1001/jama.2021.10413 ↩︎
  46. Anuj Gangopadhyaya, Stephen Zuckerman, and Nikhil Rao, “Assessing the Difference in Racial and Ethnic Disparities in Access to and Use of Care Between Traditional Medicare and Medicare Advantage,” Health Services Research (March 2023): 1-10, https://doi.org/10.1111/1475-6773.14150 ↩︎
  47. Kenton J. Johnston et al., “Association of Race and Ethnicity and Medicare Program Type With Ambulatory Care Access and Quality Measures,” JAMA 326, no. 7 (August 2021): 628-636, doi:10.1001/jama.2021.10413 ↩︎
  48. Jason Lane et al., “Access to Health Care Improves COVID-19 Vaccination and Mitigates Health Disparities Among Medicare Beneficiaries,” Journal of Racial and Ethnic Health Disparities (September 2022): https://doi.org/10.1007/s40615-022-01343-1 ↩︎
  49. Anuj Gangopadhyaya, Stephen Zuckerman, and Nikhil Rao, “Assessing the Difference in Racial and Ethnic Disparities in Access to and Use of Care Between Traditional Medicare and Medicare Advantage,” Health Services Research (March 2023): 1-10, https://doi.org/10.1111/1475-6773.14150 ↩︎
  50. Steven C. Martino et al, Racial, Ethnic, & Gender Disparities in Health Care in Medicare Advantage (Baltimore, MD: Centers for Medicare & Medicaid Services Office of Minority Health, April 2021), https://www.cms.gov/files/document/racial-ethnic-gender-disparities-health-care-medicare-advantage.pdf ↩︎
  51. Steven C. Martino et al, Disparities in Health Care in Medicare Advantage by Race, Ethnicity, and Sex (Baltimore, MD: Centers for Medicare & Medicaid Services Office of Minority Health, April 2023), https://www.cms.gov/files/document/disparities-health-care-medicare-advantage-race-ethnicity-and-sex.pdf-0 ↩︎
  52. Anuj Gangopadhyaya, Stephen Zuckerman, and Nikhil Rao, “Assessing the Difference in Racial and Ethnic Disparities in Access to and Use of Care Between Traditional Medicare and Medicare Advantage,” Health Services Research (March 2023): 1-10, https://doi.org/10.1111/1475-6773.14150 ↩︎
  53. Kenton J. Johnston et al., “Association of Race and Ethnicity and Medicare Program Type With Ambulatory Care Access and Quality Measures,” JAMA 326, no. 7 (August 2021): 628-636, doi:10.1001/jama.2021.10413 ↩︎
  54. Anuj Gangopadhyaya, Stephen Zuckerman, and Nikhil Rao, “Assessing the Difference in Racial and Ethnic Disparities in Access to and Use of Care Between Traditional Medicare and Medicare Advantage,” Health Services Research (March 2023): 1-10, https://doi.org/10.1111/1475-6773.14150 ↩︎
  55. Steven C. Martino et al, Disparities in Health Care in Medicare Advantage by Race, Ethnicity, and Sex (Baltimore, MD: Centers for Medicare & Medicaid Services Office of Minority Health, April 2023), https://www.cms.gov/files/document/disparities-health-care-medicare-advantage-race-ethnicity-and-sex.pdf-0 ↩︎
  56. Anuj Gangopadhyaya, Stephen Zuckerman, and Nikhil Rao, “Assessing the Difference in Racial and Ethnic Disparities in Access to and Use of Care Between Traditional Medicare and Medicare Advantage,” Health Services Research (March 2023): 1-10, https://doi.org/10.1111/1475-6773.14150 ↩︎
  57. Anuj Gangopadhyaya, Stephen Zuckerman, and Nikhil Rao, “Assessing the Difference in Racial and Ethnic Disparities in Access to and Use of Care Between Traditional Medicare and Medicare Advantage,” Health Services Research (March 2023): 1-10, https://doi.org/10.1111/1475-6773.14150 ↩︎
  58. Sungchul Park, Rachel M. Werner, and Norma B. Coe, “Racial and ethnic disparities in access to and enrollment in high-quality Medicare Advantage plans,” Health Services Research 58 no.2 (April 2023): 303-313, https://doi.org/10.1111/1475-6773.13977 ↩︎
  59. David J. Meyers et al., “Association of Medicare Advantage Star Ratings With Racial, Ethnic, and Socioeconomic Disparities in Quality of Care,” JAMA Health Forum 2 no.6 (June 2021): e210793, doi:10.1001/jamahealthforum.2021.0793 ↩︎
  60. Sungchul Park, Brent A. Langellier, and David J. Meyers, “Differences between integrated and non-integrated plans in Medicare Advantage,” Health Services Research (November 2022): 1-9 https://doi.org/10.1111/1475-6773.14101 ↩︎
  61. Sungchul Park, Rachel Werner, and Norma Coe, “Association of Medicare Advantage Star Ratings With Racial and Ethnic Disparities in Hospitalizations for Ambulatory Care Sensitive Conditions,” Medical Care 60 no. 12 (December 2022): 872-879, DOI: 10.1097/MLR.0000000000001770 ↩︎
  62. Maricruz Rivera-Hernandez, Momotazur Rahman, Vincent Mor, and Amal N. Trivedi, “Racial disparities in readmission rates among patients discharged to skilled nursing facilities,” Journal of the American Geriatrics Society 67 no. 8 (August 2019): 1672-1679, https://doi.org/10.1111/jgs.15960 ↩︎
  63. Steven C. Martino et al, Racial, Ethnic, & Gender Disparities in Health Care in Medicare Advantage (Baltimore, MD: Centers for Medicare & Medicaid Services Office of Minority Health, April 2021), https://www.cms.gov/files/document/racial-ethnic-gender-disparities-health-care-medicare-advantage.pdf ↩︎
  64. Joshua Breslau et al., “Racial And Ethnic Differences In The Attainment Of Behavioral Health Quality Measures In Medicare Advantage Plans,” Health Affairs 37 no. 10 (October 2018): 1685-1692 https://doi.org/10.1377/hlthaff.2018.0655 ↩︎
  65. Steven C. Martino et al, Disparities in Health Care in Medicare Advantage by Race, Ethnicity, and Sex (Baltimore, MD: Centers for Medicare & Medicaid Services Office of Minority Health, April 2023), https://www.cms.gov/files/document/disparities-health-care-medicare-advantage-race-ethnicity-and-sex.pdf-0 ↩︎
  66. Steven C. Martino et al, Racial, Ethnic, & Gender Disparities in Health Care in Medicare Advantage (Baltimore, MD: Centers for Medicare & Medicaid Services Office of Minority Health, April 2021), https://www.cms.gov/files/document/racial-ethnic-gender-disparities-health-care-medicare-advantage.pdf ↩︎
  67. Steven C. Martino et al, Disparities in Health Care in Medicare Advantage by Race, Ethnicity, and Sex (Baltimore, MD: Centers for Medicare & Medicaid Services Office of Minority Health, April 2023), https://www.cms.gov/files/document/disparities-health-care-medicare-advantage-race-ethnicity-and-sex.pdf-0 ↩︎
  68. Steven C. Martino et al, Racial, Ethnic, & Gender Disparities in Health Care in Medicare Advantage (Baltimore, MD: Centers for Medicare & Medicaid Services Office of Minority Health, April 2021), https://www.cms.gov/files/document/racial-ethnic-gender-disparities-health-care-medicare-advantage.pdf ↩︎
  69. Joshua Breslau et al., “Racial And Ethnic Differences In The Attainment Of Behavioral Health Quality Measures In Medicare Advantage Plans,” Health Affairs 37 no. 10 (October 2018): 1685-1692 https://doi.org/10.1377/hlthaff.2018.0655 ↩︎
  70. Steven C. Martino et al, Disparities in Health Care in Medicare Advantage by Race, Ethnicity, and Sex (Baltimore, MD: Centers for Medicare & Medicaid Services Office of Minority Health, April 2023), https://www.cms.gov/files/document/disparities-health-care-medicare-advantage-race-ethnicity-and-sex.pdf-0 ↩︎
  71. Joshua Breslau et al., “Racial And Ethnic Differences In The Attainment Of Behavioral Health Quality Measures In Medicare Advantage Plans,” Health Affairs 37 no. 10 (October 2018): 1685-1692 https://doi.org/10.1377/hlthaff.2018.0655 ↩︎
  72. Steven C. Martino et al, Racial, Ethnic, & Gender Disparities in Health Care in Medicare Advantage (Baltimore, MD: Centers for Medicare & Medicaid Services Office of Minority Health, April 2021), https://www.cms.gov/files/document/racial-ethnic-gender-disparities-health-care-medicare-advantage.pdf ↩︎
  73. Steven C. Martino et al, Racial, Ethnic, & Gender Disparities in Health Care in Medicare Advantage (Baltimore, MD: Centers for Medicare & Medicaid Services Office of Minority Health, April 2021), https://www.cms.gov/files/document/racial-ethnic-gender-disparities-health-care-medicare-advantage.pdf ↩︎
  74. Steven C. Martino et al, Disparities in Health Care in Medicare Advantage by Race, Ethnicity, and Sex (Baltimore, MD: Centers for Medicare & Medicaid Services Office of Minority Health, April 2023), https://www.cms.gov/files/document/disparities-health-care-medicare-advantage-race-ethnicity-and-sex.pdf-0   ↩︎
  75. Steven C. Martino et al, Racial, Ethnic, & Gender Disparities in Health Care in Medicare Advantage (Baltimore, MD: Centers for Medicare & Medicaid Services Office of Minority Health, April 2021), https://www.cms.gov/files/document/racial-ethnic-gender-disparities-health-care-medicare-advantage.pdf ↩︎
  76. Steven C. Martino et al, Disparities in Health Care in Medicare Advantage by Race, Ethnicity, and Sex (Baltimore, MD: Centers for Medicare & Medicaid Services Office of Minority Health, April 2023), https://www.cms.gov/files/document/disparities-health-care-medicare-advantage-race-ethnicity-and-sex.pdf-0 ↩︎
  77. Shayla N. M. Durfey et al, “Neighborhood disadvantage and chronic disease management,” Health Services Research 54 no.S1 (February 2019): 206-216, https://doi.org/10.1111/1475-6773.13092 ↩︎
  78. Steven C. Martino et al, Racial, Ethnic, & Gender Disparities in Health Care in Medicare Advantage (Baltimore, MD: Centers for Medicare & Medicaid Services Office of Minority Health, April 2021), https://www.cms.gov/files/document/racial-ethnic-gender-disparities-health-care-medicare-advantage.pdf ↩︎
  79. Shayla N. M. Durfey et al, “Neighborhood disadvantage and chronic disease management,” Health Services Research 54 no.S1 (February 2019): 206-216, https://doi.org/10.1111/1475-6773.13092 ↩︎
  80. Steven C. Martino et al, Racial, Ethnic, & Gender Disparities in Health Care in Medicare Advantage (Baltimore, MD: Centers for Medicare & Medicaid Services Office of Minority Health, April 2021), https://www.cms.gov/files/document/racial-ethnic-gender-disparities-health-care-medicare-advantage.pdf ↩︎
  81. Mallika Kommareddi, Kael Wherry, and Robert A Vigersky, “Racial/Ethnic Inequities in Use of Diabetes Technologies Among Medicare Advantage Beneficiaries With Type 1 Diabetes,” Journal of Clinical Endocrinology & Metabolism (January 2023), https://doi.org/10.1210/clinem/dgad046 ↩︎
  82. Steven C. Martino et al, Racial, Ethnic, & Gender Disparities in Health Care in Medicare Advantage (Baltimore, MD: Centers for Medicare & Medicaid Services Office of Minority Health, April 2021), https://www.cms.gov/files/document/racial-ethnic-gender-disparities-health-care-medicare-advantage.pdf ↩︎
  83. Steven C. Martino et al, Disparities in Health Care in Medicare Advantage by Race, Ethnicity, and Sex (Baltimore, MD: Centers for Medicare & Medicaid Services Office of Minority Health, April 2023), https://www.cms.gov/files/document/disparities-health-care-medicare-advantage-race-ethnicity-and-sex.pdf-0 ↩︎
  84. Steven C. Martino et al, Racial, Ethnic, & Gender Disparities in Health Care in Medicare Advantage (Baltimore, MD: Centers for Medicare & Medicaid Services Office of Minority Health, April 2021), https://www.cms.gov/files/document/racial-ethnic-gender-disparities-health-care-medicare-advantage.pdf ↩︎
  85. Steven C. Martino et al, Disparities in Health Care in Medicare Advantage by Race, Ethnicity, and Sex (Baltimore, MD: Centers for Medicare & Medicaid Services Office of Minority Health, April 2023), https://www.cms.gov/files/document/disparities-health-care-medicare-advantage-race-ethnicity-and-sex.pdf-0 ↩︎
  86. Steven C. Martino et al, Disparities in Health Care in Medicare Advantage by Race, Ethnicity, and Sex (Baltimore, MD: Centers for Medicare & Medicaid Services Office of Minority Health, April 2023), https://www.cms.gov/files/document/disparities-health-care-medicare-advantage-race-ethnicity-and-sex.pdf-0   ↩︎
  87. Steven C. Martino et al, Disparities in Health Care in Medicare Advantage by Race, Ethnicity, and Sex (Baltimore, MD: Centers for Medicare & Medicaid Services Office of Minority Health, April 2023), https://www.cms.gov/files/document/disparities-health-care-medicare-advantage-race-ethnicity-and-sex.pdf-0 ↩︎
  88. Steven C. Martino et al, Racial, Ethnic, & Gender Disparities in Health Care in Medicare Advantage (Baltimore, MD: Centers for Medicare & Medicaid Services Office of Minority Health, April 2021), https://www.cms.gov/files/document/racial-ethnic-gender-disparities-health-care-medicare-advantage.pdf ↩︎
  89. Shayla N. M. Durfey et al, “Neighborhood disadvantage and chronic disease management,” Health Services Research 54 no.S1 (February 2019): 206-216, https://doi.org/10.1111/1475-6773.13092 ↩︎
  90. Steven C. Martino et al, Racial, Ethnic, & Gender Disparities in Health Care in Medicare Advantage (Baltimore, MD: Centers for Medicare & Medicaid Services Office of Minority Health, April 2021), https://www.cms.gov/files/document/racial-ethnic-gender-disparities-health-care-medicare-advantage.pdf ↩︎
  91. Steven C. Martino et al, Disparities in Health Care in Medicare Advantage by Race, Ethnicity, and Sex (Baltimore, MD: Centers for Medicare & Medicaid Services Office of Minority Health, April 2023), https://www.cms.gov/files/document/disparities-health-care-medicare-advantage-race-ethnicity-and-sex.pdf-0 ↩︎
  92. Steven C. Martino et al, Racial, Ethnic, & Gender Disparities in Health Care in Medicare Advantage (Baltimore, MD: Centers for Medicare & Medicaid Services Office of Minority Health, April 2021), https://www.cms.gov/files/document/racial-ethnic-gender-disparities-health-care-medicare-advantage.pdf ↩︎
  93. Steven C. Martino et al, Disparities in Health Care in Medicare Advantage by Race, Ethnicity, and Sex (Baltimore, MD: Centers for Medicare & Medicaid Services Office of Minority Health, April 2023), https://www.cms.gov/files/document/disparities-health-care-medicare-advantage-race-ethnicity-and-sex.pdf-0 ↩︎
  94. Clarissa Diamantidis et al., “Disparities in Chronic Kidney Disease Progression by Medicare Advantage Enrollees,” American Journal of Nephrology 52 no. 12 (January 2022): 949–957, https://doi.org/10.1159/000519758 ↩︎
  95. Steven C. Martino et al, Racial, Ethnic, & Gender Disparities in Health Care in Medicare Advantage (Baltimore, MD: Centers for Medicare & Medicaid Services Office of Minority Health, April 2021), https://www.cms.gov/files/document/racial-ethnic-gender-disparities-health-care-medicare-advantage.pdf ↩︎
  96. Joshua Breslau et al., “Racial And Ethnic Differences In The Attainment Of Behavioral Health Quality Measures In Medicare Advantage Plans,” Health Affairs 37 no. 10 (October 2018): 1685-1692 https://doi.org/10.1377/hlthaff.2018.0655 ↩︎
  97. Steven C. Martino et al, Disparities in Health Care in Medicare Advantage by Race, Ethnicity, and Sex (Baltimore, MD: Centers for Medicare & Medicaid Services Office of Minority Health, April 2023), https://www.cms.gov/files/document/disparities-health-care-medicare-advantage-race-ethnicity-and-sex.pdf-0 ↩︎
  98. Steven C. Martino et al, Racial, Ethnic, & Gender Disparities in Health Care in Medicare Advantage (Baltimore, MD: Centers for Medicare & Medicaid Services Office of Minority Health, April 2021), https://www.cms.gov/files/document/racial-ethnic-gender-disparities-health-care-medicare-advantage.pdf ↩︎
  99. Steven C. Martino et al, Disparities in Health Care in Medicare Advantage by Race, Ethnicity, and Sex (Baltimore, MD: Centers for Medicare & Medicaid Services Office of Minority Health, April 2023), https://www.cms.gov/files/document/disparities-health-care-medicare-advantage-race-ethnicity-and-sex.pdf-0 ↩︎
  100. Steven C. Martino et al, Racial, Ethnic, & Gender Disparities in Health Care in Medicare Advantage (Baltimore, MD: Centers for Medicare & Medicaid Services Office of Minority Health, April 2021), https://www.cms.gov/files/document/racial-ethnic-gender-disparities-health-care-medicare-advantage.pdf ↩︎
  101. Steven C. Martino et al, Disparities in Health Care in Medicare Advantage by Race, Ethnicity, and Sex (Baltimore, MD: Centers for Medicare & Medicaid Services Office of Minority Health, April 2023), https://www.cms.gov/files/document/disparities-health-care-medicare-advantage-race-ethnicity-and-sex.pdf-0 ↩︎
  102. Steven C. Martino et al, Racial, Ethnic, & Gender Disparities in Health Care in Medicare Advantage (Baltimore, MD: Centers for Medicare & Medicaid Services Office of Minority Health, April 2021), https://www.cms.gov/files/document/racial-ethnic-gender-disparities-health-care-medicare-advantage.pdf ↩︎
  103. Anuj Gangopadhyaya, Stephen Zuckerman, and Nikhil Rao, “Assessing the Difference in Racial and Ethnic Disparities in Access to and Use of Care Between Traditional Medicare and Medicare Advantage,” Health Services Research (March 2023): 1-10, https://doi.org/10.1111/1475-6773.14150 ↩︎
  104. Anuj Gangopadhyaya, Stephen Zuckerman, and Nikhil Rao, “Assessing the Difference in Racial and Ethnic Disparities in Access to and Use of Care Between Traditional Medicare and Medicare Advantage,” Health Services Research (March 2023): 1-10, https://doi.org/10.1111/1475-6773.14150 ↩︎
  105. Steven C. Martino et al, Disparities in Health Care in Medicare Advantage by Race, Ethnicity, and Sex (Baltimore, MD: Centers for Medicare & Medicaid Services Office of Minority Health, April 2023), https://www.cms.gov/files/document/disparities-health-care-medicare-advantage-race-ethnicity-and-sex.pdf-0 ↩︎
  106. David J. Meyers, Momotazur Rahman, and Amal N. Trivedi, “Narrow Primary Care Networks in Medicare Advantage,” Journal of General Internal Medicine 37 (February 2022): 488-491, https://doi.org/10.1007/s11606-020-06534-2 ↩︎
  107. David J. Meyers, Momotazur Rahman, and Amal N. Trivedi, “Narrow Primary Care Networks in Medicare Advantage,” Journal of General Internal Medicine 37 (February 2022): 488-491, https://doi.org/10.1007/s11606-020-06534-2 ↩︎
  108. Eunhae Grace Oh, David J. Meyers, Kevin H. Nguyen, and Amal N. Trivedi, “Narrow Dialysis Networks In Medicare Advantage: Exposure By Race, Ethnicity, And Dual Eligibility,” Health Affairs 42, no. 2 (February 2022): 252-260, https://doi.org/10.1377/hlthaff.2022.01044 ↩︎
  109. David J. Meyers, Momotazur Rahman, and Amal N. Trivedi, “Narrow Primary Care Networks in Medicare Advantage,” Journal of General Internal Medicine 37 (February 2022): 488-491, https://doi.org/10.1007/s11606-020-06534-2 ↩︎
  110. Eunhae Grace Oh, David J. Meyers, Kevin H. Nguyen, and Amal N. Trivedi, “Narrow Dialysis Networks In Medicare Advantage: Exposure By Race, Ethnicity, And Dual Eligibility,” Health Affairs 42, no. 2 (February 2022): 252-260, https://doi.org/10.1377/hlthaff.2022.01044 ↩︎
  111. Steven C. Martino et al, Racial, Ethnic, & Gender Disparities in Health Care in Medicare Advantage (Baltimore, MD: Centers for Medicare & Medicaid Services Office of Minority Health, April 2021), https://www.cms.gov/files/document/racial-ethnic-gender-disparities-health-care-medicare-advantage.pdf ↩︎
  112. Anuj Gangopadhyaya, Stephen Zuckerman, and Nikhil Rao, “Assessing the Difference in Racial and Ethnic Disparities in Access to and Use of Care Between Traditional Medicare and Medicare Advantage,” Health Services Research (March 2023): 1-10, https://doi.org/10.1111/1475-6773.14150 ↩︎
  113. Anuj Gangopadhyaya, Stephen Zuckerman, and Nikhil Rao, “Assessing the Difference in Racial and Ethnic Disparities in Access to and Use of Care Between Traditional Medicare and Medicare Advantage,” Health Services Research (March 2023): 1-10, https://doi.org/10.1111/1475-6773.14150 ↩︎
  114. Jason Lane et al., “Access to Health Care Improves COVID-19 Vaccination and Mitigates Health Disparities Among Medicare Beneficiaries,” Journal of Racial and Ethnic Health Disparities (September 2022): https://doi.org/10.1007/s40615-022-01343-1 ↩︎
  115. Steven C. Martino et al, Racial, Ethnic, & Gender Disparities in Health Care in Medicare Advantage (Baltimore, MD: Centers for Medicare & Medicaid Services Office of Minority Health, April 2021), https://www.cms.gov/files/document/racial-ethnic-gender-disparities-health-care-medicare-advantage.pdf ↩︎
  116. Anuj Gangopadhyaya, Stephen Zuckerman, and Nikhil Rao, “Assessing the Difference in Racial and Ethnic Disparities in Access to and Use of Care Between Traditional Medicare and Medicare Advantage,” Health Services Research (March 2023): 1-10, https://doi.org/10.1111/1475-6773.14150 ↩︎
  117. Anuj Gangopadhyaya, Stephen Zuckerman, and Nikhil Rao, “Assessing the Difference in Racial and Ethnic Disparities in Access to and Use of Care Between Traditional Medicare and Medicare Advantage,” Health Services Research (March 2023): 1-10, https://doi.org/10.1111/1475-6773.14150 ↩︎
  118. Anuj Gangopadhyaya, Stephen Zuckerman, and Nikhil Rao, “Assessing the Difference in Racial and Ethnic Disparities in Access to and Use of Care Between Traditional Medicare and Medicare Advantage,” Health Services Research (March 2023): 1-10, https://doi.org/10.1111/1475-6773.14150 ↩︎
  119. Anuj Gangopadhyaya, Stephen Zuckerman, and Nikhil Rao, “Assessing the Difference in Racial and Ethnic Disparities in Access to and Use of Care Between Traditional Medicare and Medicare Advantage,” Health Services Research (March 2023): 1-10, https://doi.org/10.1111/1475-6773.14150 ↩︎
  120. Anuj Gangopadhyaya, Stephen Zuckerman, and Nikhil Rao, “Assessing the Difference in Racial and Ethnic Disparities in Access to and Use of Care Between Traditional Medicare and Medicare Advantage,” Health Services Research (March 2023): 1-10, https://doi.org/10.1111/1475-6773.14150 ↩︎
  121. Sungchul Park, Rachel M. Werner, and Norma B. Coe, “Racial and ethnic disparities in access to and enrollment in high-quality Medicare Advantage plans,” Health Services Research 58 no.2 (April 2023): 303-313, https://doi.org/10.1111/1475-6773.13977 ↩︎
  122. David J. Meyers et al., “Association of Medicare Advantage Star Ratings With Racial, Ethnic, and Socioeconomic Disparities in Quality of Care,” JAMA Health Forum 2 no.6 (June 2021): e210793, doi:10.1001/jamahealthforum.2021.0793 ↩︎
  123. Sungchul Park, Brent A. Langellier, and David J. Meyers, “Differences between integrated and non-integrated plans in Medicare Advantage,” Health Services Research (November 2022): 1-9 https://doi.org/10.1111/1475-6773.14101 ↩︎
  124. Sungchul Park, Rachel Werner, and Norma Coe, “Association of Medicare Advantage Star Ratings With Racial and Ethnic Disparities in Hospitalizations for Ambulatory Care Sensitive Conditions,” Medical Care 60 no. 12 (December 2022): 872-879, DOI: 10.1097/MLR.0000000000001770 ↩︎
  125. Steven C. Martino et al, Racial, Ethnic, & Gender Disparities in Health Care in Medicare Advantage (Baltimore, MD: Centers for Medicare & Medicaid Services Office of Minority Health, April 2021),  https://www.cms.gov/files/document/racial-ethnic-gender-disparities-health-care-medicare-advantage.pdf   ↩︎
  126. Joshua Breslau et al., “Racial And Ethnic Differences In The Attainment Of Behavioral Health Quality Measures In Medicare Advantage Plans,” Health Affairs 37 no. 10 (October 2018): 1685-1692 https://doi.org/10.1377/hlthaff.2018.0655 ↩︎
  127. Steven C. Martino et al, Disparities in Health Care in Medicare Advantage by Race, Ethnicity, and Sex (Baltimore, MD: Centers for Medicare & Medicaid Services Office of Minority Health, April 2023), https://www.cms.gov/files/document/disparities-health-care-medicare-advantage-race-ethnicity-and-sex.pdf-0 ↩︎
  128. Steven C. Martino et al, Racial, Ethnic, & Gender Disparities in Health Care in Medicare Advantage (Baltimore, MD: Centers for Medicare & Medicaid Services Office of Minority Health, April 2021),  https://www.cms.gov/files/document/racial-ethnic-gender-disparities-health-care-medicare-advantage.pdf ↩︎
  129. Joshua Breslau et al., “Racial And Ethnic Differences In The Attainment Of Behavioral Health Quality Measures In Medicare Advantage Plans,” Health Affairs 37 no. 10 (October 2018): 1685-1692 https://doi.org/10.1377/hlthaff.2018.0655 ↩︎
  130. Steven C. Martino et al, Racial, Ethnic, & Gender Disparities in Health Care in Medicare Advantage (Baltimore, MD: Centers for Medicare & Medicaid Services Office of Minority Health, April 2021),  https://www.cms.gov/files/document/racial-ethnic-gender-disparities-health-care-medicare-advantage.pdf ↩︎
  131. Steven C. Martino et al, Disparities in Health Care in Medicare Advantage by Race, Ethnicity, and Sex (Baltimore, MD: Centers for Medicare & Medicaid Services Office of Minority Health, April 2023), https://www.cms.gov/files/document/disparities-health-care-medicare-advantage-race-ethnicity-and-sex.pdf-0 ↩︎
  132. Steven C. Martino et al, Racial, Ethnic, & Gender Disparities in Health Care in Medicare Advantage (Baltimore, MD: Centers for Medicare & Medicaid Services Office of Minority Health, April 2021),  https://www.cms.gov/files/document/racial-ethnic-gender-disparities-health-care-medicare-advantage.pdf ↩︎
  133. Joshua Breslau et al., “Racial And Ethnic Differences In The Attainment Of Behavioral Health Quality Measures In Medicare Advantage Plans,” Health Affairs 37 no. 10 (October 2018): 1685-1692 https://doi.org/10.1377/hlthaff.2018.0655 ↩︎
  134. Steven C. Martino et al, Racial, Ethnic, & Gender Disparities in Health Care in Medicare Advantage (Baltimore, MD: Centers for Medicare & Medicaid Services Office of Minority Health, April 2021),  https://www.cms.gov/files/document/racial-ethnic-gender-disparities-health-care-medicare-advantage.pdf ↩︎
  135. Mallika Kommareddi, Kael Wherry, and Robert A Vigersky, “Racial/Ethnic Inequities in Use of Diabetes Technologies Among Medicare Advantage Beneficiaries With Type 1 Diabetes,” Journal of Clinical Endocrinology & Metabolism (January 2023), https://doi.org/10.1210/clinem/dgad046 ↩︎
  136. Steven C. Martino et al, Racial, Ethnic, & Gender Disparities in Health Care in Medicare Advantage (Baltimore, MD: Centers for Medicare & Medicaid Services Office of Minority Health, April 2021),  https://www.cms.gov/files/document/racial-ethnic-gender-disparities-health-care-medicare-advantage.pdf ↩︎
  137. Steven C. Martino et al, Disparities in Health Care in Medicare Advantage by Race, Ethnicity, and Sex (Baltimore, MD: Centers for Medicare & Medicaid Services Office of Minority Health, April 2023), https://www.cms.gov/files/document/disparities-health-care-medicare-advantage-race-ethnicity-and-sex.pdf-0 ↩︎
  138. Steven C. Martino et al, Racial, Ethnic, & Gender Disparities in Health Care in Medicare Advantage (Baltimore, MD: Centers for Medicare & Medicaid Services Office of Minority Health, April 2021),  https://www.cms.gov/files/document/racial-ethnic-gender-disparities-health-care-medicare-advantage.pdf ↩︎
  139. Shayla N. M. Durfey et al, “Neighborhood disadvantage and chronic disease management,” Health Services Research 54 no.S1 (February 2019): 206-216, https://doi.org/10.1111/1475-6773.13092 ↩︎
  140. Steven C. Martino et al, Racial, Ethnic, & Gender Disparities in Health Care in Medicare Advantage (Baltimore, MD: Centers for Medicare & Medicaid Services Office of Minority Health, April 2021),  https://www.cms.gov/files/document/racial-ethnic-gender-disparities-health-care-medicare-advantage.pdf ↩︎
  141. Steven C. Martino et al, Disparities in Health Care in Medicare Advantage by Race, Ethnicity, and Sex (Baltimore, MD: Centers for Medicare & Medicaid Services Office of Minority Health, April 2023), https://www.cms.gov/files/document/disparities-health-care-medicare-advantage-race-ethnicity-and-sex.pdf-0 ↩︎
  142. Steven C. Martino et al, Disparities in Health Care in Medicare Advantage by Race, Ethnicity, and Sex (Baltimore, MD: Centers for Medicare & Medicaid Services Office of Minority Health, April 2023), https://www.cms.gov/files/document/disparities-health-care-medicare-advantage-race-ethnicity-and-sex.pdf-0 ↩︎
  143. Steven C. Martino et al, Racial, Ethnic, & Gender Disparities in Health Care in Medicare Advantage (Baltimore, MD: Centers for Medicare & Medicaid Services Office of Minority Health, April 2021),  https://www.cms.gov/files/document/racial-ethnic-gender-disparities-health-care-medicare-advantage.pdf ↩︎
  144. Shayla N. M. Durfey et al, “Neighborhood disadvantage and chronic disease management,” Health Services Research 54 no.S1 (February 2019): 206-216, https://doi.org/10.1111/1475-6773.13092 ↩︎
  145. Steven C. Martino et al, Racial, Ethnic, & Gender Disparities in Health Care in Medicare Advantage (Baltimore, MD: Centers for Medicare & Medicaid Services Office of Minority Health, April 2021),  https://www.cms.gov/files/document/racial-ethnic-gender-disparities-health-care-medicare-advantage.pdf ↩︎
  146. Shayla N. M. Durfey et al, “Neighborhood disadvantage and chronic disease management,” Health Services Research 54 no.S1 (February 2019): 206-216, https://doi.org/10.1111/1475-6773.13092 ↩︎
  147. Steven C. Martino et al, Disparities in Health Care in Medicare Advantage by Race, Ethnicity, and Sex (Baltimore, MD: Centers for Medicare & Medicaid Services Office of Minority Health, April 2023), https://www.cms.gov/files/document/disparities-health-care-medicare-advantage-race-ethnicity-and-sex.pdf-0 ↩︎
  148. Steven C. Martino et al, Racial, Ethnic, & Gender Disparities in Health Care in Medicare Advantage (Baltimore, MD: Centers for Medicare & Medicaid Services Office of Minority Health, April 2021),  https://www.cms.gov/files/document/racial-ethnic-gender-disparities-health-care-medicare-advantage.pdf ↩︎
  149. Joshua Breslau et al., “Racial And Ethnic Differences In The Attainment Of Behavioral Health Quality Measures In Medicare Advantage Plans,” Health Affairs 37 no. 10 (October 2018): 1685-1692 https://doi.org/10.1377/hlthaff.2018.0655 ↩︎
  150. Steven C. Martino et al, Disparities in Health Care in Medicare Advantage by Race, Ethnicity, and Sex (Baltimore, MD: Centers for Medicare & Medicaid Services Office of Minority Health, April 2023), https://www.cms.gov/files/document/disparities-health-care-medicare-advantage-race-ethnicity-and-sex.pdf-0 ↩︎
  151. Steven C. Martino et al, Racial, Ethnic, & Gender Disparities in Health Care in Medicare Advantage (Baltimore, MD: Centers for Medicare & Medicaid Services Office of Minority Health, April 2021),  https://www.cms.gov/files/document/racial-ethnic-gender-disparities-health-care-medicare-advantage.pdf ↩︎
  152. Steven C. Martino et al, Disparities in Health Care in Medicare Advantage by Race, Ethnicity, and Sex (Baltimore, MD: Centers for Medicare & Medicaid Services Office of Minority Health, April 2023), https://www.cms.gov/files/document/disparities-health-care-medicare-advantage-race-ethnicity-and-sex.pdf-0 ↩︎
  153. Clarissa Diamantidis et al., “Disparities in Chronic Kidney Disease Progression by Medicare Advantage Enrollees,” American Journal of Nephrology 52 no. 12 (January 2022): 949–957, https://doi.org/10.1159/000519758 ↩︎
  154. Steven C. Martino et al, Racial, Ethnic, & Gender Disparities in Health Care in Medicare Advantage (Baltimore, MD: Centers for Medicare & Medicaid Services Office of Minority Health, April 2021),  https://www.cms.gov/files/document/racial-ethnic-gender-disparities-health-care-medicare-advantage.pdf ↩︎
  155. Steven C. Martino et al, Racial, Ethnic, & Gender Disparities in Health Care in Medicare Advantage (Baltimore, MD: Centers for Medicare & Medicaid Services Office of Minority Health, April 2021),  https://www.cms.gov/files/document/racial-ethnic-gender-disparities-health-care-medicare-advantage.pdf ↩︎
  156. Steven C. Martino et al, Disparities in Health Care in Medicare Advantage by Race, Ethnicity, and Sex (Baltimore, MD: Centers for Medicare & Medicaid Services Office of Minority Health, April 2023), https://www.cms.gov/files/document/disparities-health-care-medicare-advantage-race-ethnicity-and-sex.pdf-0 ↩︎
  157. David J. Meyers, Momotazur Rahman, and Amal N. Trivedi, “Narrow Primary Care Networks in Medicare Advantage,” Journal of General Internal Medicine 37 (February 2022): 488-491, https://doi.org/10.1007/s11606-020-06534-2 ↩︎
  158. David J. Meyers, Momotazur Rahman, and Amal N. Trivedi, “Narrow Primary Care Networks in Medicare Advantage,” Journal of General Internal Medicine 37 (February 2022): 488-491, https://doi.org/10.1007/s11606-020-06534-2 ↩︎
  159. David J. Meyers, Momotazur Rahman, and Amal N. Trivedi, “Narrow Primary Care Networks in Medicare Advantage,” Journal of General Internal Medicine 37 (February 2022): 488-491, https://doi.org/10.1007/s11606-020-06534-2 ↩︎
  160. Eunhae Grace Oh, David J. Meyers, Kevin H. Nguyen, and Amal N. Trivedi, “Narrow Dialysis Networks In Medicare Advantage: Exposure By Race, Ethnicity, And Dual Eligibility,” Health Affairs 42, no. 2 (February 2022): 252-260, https://doi.org/10.1377/hlthaff.2022.01044 ↩︎
  161. David J. Meyers, Momotazur Rahman, and Amal N. Trivedi, “Narrow Primary Care Networks in Medicare Advantage,” Journal of General Internal Medicine 37 (February 2022): 488-491, https://doi.org/10.1007/s11606-020-06534-2 ↩︎
  162. Eunhae Grace Oh, David J. Meyers, Kevin H. Nguyen, and Amal N. Trivedi, “Narrow Dialysis Networks In Medicare Advantage: Exposure By Race, Ethnicity, And Dual Eligibility,” Health Affairs 42, no. 2 (February 2022): 252-260, https://doi.org/10.1377/hlthaff.2022.01044 ↩︎
  163. Steven C. Martino et al, Racial, Ethnic, & Gender Disparities in Health Care in Medicare Advantage (Baltimore, MD: Centers for Medicare & Medicaid Services Office of Minority Health, April 2021),  https://www.cms.gov/files/document/racial-ethnic-gender-disparities-health-care-medicare-advantage.pdf ↩︎
  164. Steven C. Martino et al, Disparities in Health Care in Medicare Advantage by Race, Ethnicity, and Sex (Baltimore, MD: Centers for Medicare & Medicaid Services Office of Minority Health, April 2023), https://www.cms.gov/files/document/disparities-health-care-medicare-advantage-race-ethnicity-and-sex.pdf-0 ↩︎
  165. Steven C. Martino et al, Racial, Ethnic, & Gender Disparities in Health Care in Medicare Advantage (Baltimore, MD: Centers for Medicare & Medicaid Services Office of Minority Health, April 2021),  https://www.cms.gov/files/document/racial-ethnic-gender-disparities-health-care-medicare-advantage.pdf ↩︎
  166. Steven C. Martino et al, Disparities in Health Care in Medicare Advantage by Race, Ethnicity, and Sex (Baltimore, MD: Centers for Medicare & Medicaid Services Office of Minority Health, April 2023), https://www.cms.gov/files/document/disparities-health-care-medicare-advantage-race-ethnicity-and-sex.pdf-0 ↩︎
  167. Sungchul Park, Rachel M. Werner, and Norma B. Coe, “Racial and ethnic disparities in access to and enrollment in high-quality Medicare Advantage plans,” Health Services Research 58 no.2 (April 2023): 303-313, https://doi.org/10.1111/1475-6773.13977 ↩︎
  168. David J. Meyers et al., “Association of Medicare Advantage Star Ratings With Racial, Ethnic, and Socioeconomic Disparities in Quality of Care,” JAMA Health Forum 2 no.6 (June 2021): e210793, doi:10.1001/jamahealthforum.2021.0793 ↩︎
  169. Steven C. Martino et al., “Disparities In The Quality Of Clinical Care Delivered To American Indian/Alaska Native Medicare Advantage Enrollees,” Health Affairs 41, no. 5 (May 2022): 663:670, https://doi.org/10.1377/hlthaff.2021.01830 ↩︎
  170. Steven C. Martino et al., “Disparities In The Quality Of Clinical Care Delivered To American Indian/Alaska Native Medicare Advantage Enrollees,” Health Affairs 41, no. 5 (May 2022): 663:670, https://doi.org/10.1377/hlthaff.2021.01830 ↩︎
  171. Steven C. Martino et al., “Disparities In The Quality Of Clinical Care Delivered To American Indian/Alaska Native Medicare Advantage Enrollees,” Health Affairs 41, no. 5 (May 2022): 663:670, https://doi.org/10.1377/hlthaff.2021.01830 ↩︎
  172. Steven C. Martino et al, Disparities in Health Care in Medicare Advantage by Race, Ethnicity, and Sex (Baltimore, MD: Centers for Medicare & Medicaid Services Office of Minority Health, April 2023), https://www.cms.gov/files/document/disparities-health-care-medicare-advantage-race-ethnicity-and-sex.pdf-0 ↩︎
  173. Shayla N. M. Durfey et al, “Neighborhood disadvantage and chronic disease management,” Health Services Research 54 no.S1 (February 2019): 206-216, https://doi.org/10.1111/1475-6773.13092 ↩︎
  174. Steven C. Martino et al., “Disparities In The Quality Of Clinical Care Delivered To American Indian/Alaska Native Medicare Advantage Enrollees,” Health Affairs 41, no. 5 (May 2022): 663:670, https://doi.org/10.1377/hlthaff.2021.01830 ↩︎
  175. Shayla N. M. Durfey et al, “Neighborhood disadvantage and chronic disease management,” Health Services Research 54 no.S1 (February 2019): 206-216, https://doi.org/10.1111/1475-6773.13092 ↩︎
  176. Steven C. Martino et al, Disparities in Health Care in Medicare Advantage by Race, Ethnicity, and Sex (Baltimore, MD: Centers for Medicare & Medicaid Services Office of Minority Health, April 2023), https://www.cms.gov/files/document/disparities-health-care-medicare-advantage-race-ethnicity-and-sex.pdf-0 ↩︎
  177. Steven C. Martino et al., “Disparities In The Quality Of Clinical Care Delivered To American Indian/Alaska Native Medicare Advantage Enrollees,” Health Affairs 41, no. 5 (May 2022): 663:670, https://doi.org/10.1377/hlthaff.2021.01830 ↩︎
  178. Steven C. Martino et al, Disparities in Health Care in Medicare Advantage by Race, Ethnicity, and Sex (Baltimore, MD: Centers for Medicare & Medicaid Services Office of Minority Health, April 2023), https://www.cms.gov/files/document/disparities-health-care-medicare-advantage-race-ethnicity-and-sex.pdf-0 ↩︎
  179. Shayla N. M. Durfey et al, “Neighborhood disadvantage and chronic disease management,” Health Services Research 54 no.S1 (February 2019): 206-216, https://doi.org/10.1111/1475-6773.13092 ↩︎
  180. Steven C. Martino et al, Disparities in Health Care in Medicare Advantage by Race, Ethnicity, and Sex (Baltimore, MD: Centers for Medicare & Medicaid Services Office of Minority Health, April 2023), https://www.cms.gov/files/document/disparities-health-care-medicare-advantage-race-ethnicity-and-sex.pdf-0 ↩︎
  181. Steven C. Martino et al., “Disparities In The Quality Of Clinical Care Delivered To American Indian/Alaska Native Medicare Advantage Enrollees,” Health Affairs 41, no. 5 (May 2022): 663:670, https://doi.org/10.1377/hlthaff.2021.01830 ↩︎
  182. Steven C. Martino et al., “Disparities In The Quality Of Clinical Care Delivered To American Indian/Alaska Native Medicare Advantage Enrollees,” Health Affairs 41, no. 5 (May 2022): 663:670, https://doi.org/10.1377/hlthaff.2021.01830 ↩︎
  183. Steven C. Martino et al, Disparities in Health Care in Medicare Advantage by Race, Ethnicity, and Sex (Baltimore, MD: Centers for Medicare & Medicaid Services Office of Minority Health, April 2023), https://www.cms.gov/files/document/disparities-health-care-medicare-advantage-race-ethnicity-and-sex.pdf-0 ↩︎
  184. Steven C. Martino et al., “Disparities In The Quality Of Clinical Care Delivered To American Indian/Alaska Native Medicare Advantage Enrollees,” Health Affairs 41, no. 5 (May 2022): 663:670, https://doi.org/10.1377/hlthaff.2021.01830 ↩︎
  185. Steven C. Martino et al., “Disparities In The Quality Of Clinical Care Delivered To American Indian/Alaska Native Medicare Advantage Enrollees,” Health Affairs 41, no. 5 (May 2022): 663:670, https://doi.org/10.1377/hlthaff.2021.01830 ↩︎
  186. Steven C. Martino et al, Disparities in Health Care in Medicare Advantage by Race, Ethnicity, and Sex (Baltimore, MD: Centers for Medicare & Medicaid Services Office of Minority Health, April 2023), https://www.cms.gov/files/document/disparities-health-care-medicare-advantage-race-ethnicity-and-sex.pdf-0 ↩︎
  187. Steven C. Martino et al, Disparities in Health Care in Medicare Advantage by Race, Ethnicity, and Sex (Baltimore, MD: Centers for Medicare & Medicaid Services Office of Minority Health, April 2023), https://www.cms.gov/files/document/disparities-health-care-medicare-advantage-race-ethnicity-and-sex.pdf-0 ↩︎
  188. Steven C. Martino et al., “Disparities In The Quality Of Clinical Care Delivered To American Indian/Alaska Native Medicare Advantage Enrollees,” Health Affairs 41, no. 5 (May 2022): 663:670, https://doi.org/10.1377/hlthaff.2021.01830 ↩︎
  189. Steven C. Martino et al, Disparities in Health Care in Medicare Advantage by Race, Ethnicity, and Sex (Baltimore, MD: Centers for Medicare & Medicaid Services Office of Minority Health, April 2023), https://www.cms.gov/files/document/disparities-health-care-medicare-advantage-race-ethnicity-and-sex.pdf-0 ↩︎
  190. Steven C. Martino et al, Racial, Ethnic, & Gender Disparities in Health Care in Medicare Advantage (Baltimore, MD: Centers for Medicare & Medicaid Services Office of Minority Health, April 2021),  https://www.cms.gov/files/document/racial-ethnic-gender-disparities-health-care-medicare-advantage.pdf ↩︎
  191. Steven C. Martino et al, Disparities in Health Care in Medicare Advantage by Race, Ethnicity, and Sex (Baltimore, MD: Centers for Medicare & Medicaid Services Office of Minority Health, April 2023), https://www.cms.gov/files/document/disparities-health-care-medicare-advantage-race-ethnicity-and-sex.pdf-0 ↩︎
  192. Steven C. Martino et al, Racial, Ethnic, & Gender Disparities in Health Care in Medicare Advantage (Baltimore, MD: Centers for Medicare & Medicaid Services Office of Minority Health, April 2021),  https://www.cms.gov/files/document/racial-ethnic-gender-disparities-health-care-medicare-advantage.pdf ↩︎
  193. Eunhae Grace Oh, David J. Meyers, Kevin H. Nguyen, and Amal N. Trivedi, “Narrow Dialysis Networks In Medicare Advantage: Exposure By Race, Ethnicity, And Dual Eligibility,” Health Affairs 42, no. 2 (February 2022): 252-260, https://doi.org/10.1377/hlthaff.2022.01044 ↩︎
  194. David J. Meyers, Momotazur Rahman, and Amal N. Trivedi, “Narrow Primary Care Networks in Medicare Advantage,” Journal of General Internal Medicine 37 (February 2022): 488-491, https://doi.org/10.1007/s11606-020-06534-2 ↩︎
  195. Steven C. Martino et al, Racial, Ethnic, & Gender Disparities in Health Care in Medicare Advantage (Baltimore, MD: Centers for Medicare & Medicaid Services Office of Minority Health, April 2021),  https://www.cms.gov/files/document/racial-ethnic-gender-disparities-health-care-medicare-advantage.pdf ↩︎
  196. Steven C. Martino et al., “Disparities In The Quality Of Clinical Care Delivered To American Indian/Alaska Native Medicare Advantage Enrollees,” Health Affairs 41, no. 5 (May 2022): 663:670, https://doi.org/10.1377/hlthaff.2021.01830 ↩︎
  197. Steven C. Martino et al, Disparities in Health Care in Medicare Advantage by Race, Ethnicity, and Sex (Baltimore, MD: Centers for Medicare & Medicaid Services Office of Minority Health, April 2023), https://www.cms.gov/files/document/disparities-health-care-medicare-advantage-race-ethnicity-and-sex.pdf-0 ↩︎
  198. Steven C. Martino et al, Racial, Ethnic, & Gender Disparities in Health Care in Medicare Advantage (Baltimore, MD: Centers for Medicare & Medicaid Services Office of Minority Health, April 2021), https://www.cms.gov/files/document/racial-ethnic-gender-disparities-health-care-medicare-advantage.pdf ↩︎
  199. Steven C. Martino et al, Disparities in Health Care in Medicare Advantage by Race, Ethnicity, and Sex (Baltimore, MD: Centers for Medicare & Medicaid Services Office of Minority Health, April 2023), https://www.cms.gov/files/document/disparities-health-care-medicare-advantage-race-ethnicity-and-sex.pdf-0 ↩︎
  200. Anuj Gangopadhyaya, Stephen Zuckerman, and Nikhil Rao, “Assessing the Difference in Racial and Ethnic Disparities in Access to and Use of Care Between Traditional Medicare and Medicare Advantage,” Health Services Research (March 2023): 1-10, https://doi.org/10.1111/1475-6773.14150 ↩︎
  201. Steven C. Martino et al, Racial, Ethnic, & Gender Disparities in Health Care in Medicare Advantage (Baltimore, MD: Centers for Medicare & Medicaid Services Office of Minority Health, April 2021), https://www.cms.gov/files/document/racial-ethnic-gender-disparities-health-care-medicare-advantage.pdf ↩︎
  202. Steven C. Martino et al., Rural-Urban Disparities in Health Care in Medicare (Baltimore, MD: Centers for Medicare & Medicaid Services Office of Minority Health, November 2020), https://www.cms.gov/files/document/omh-rural-urban-report-2020.pdf ↩︎
  203. Steven C. Martino et al., Rural-Urban Disparities in Health Care in Medicare (Baltimore, MD: Centers for Medicare & Medicaid Services Office of Minority Health, November 2022), https://www.cms.gov/files/document/rural-urban-disparities-11-2022.pdf ↩︎
  204. Steven C. Martino et al., Rural-Urban Disparities in Health Care in Medicare (Baltimore, MD: Centers for Medicare & Medicaid Services Office of Minority Health, November 2020), https://www.cms.gov/files/document/omh-rural-urban-report-2020.pdf ↩︎
  205. Steven C. Martino et al, Racial, Ethnic, & Gender Disparities in Health Care in Medicare Advantage (Baltimore, MD: Centers for Medicare & Medicaid Services Office of Minority Health, April 2021), https://www.cms.gov/files/document/racial-ethnic-gender-disparities-health-care-medicare-advantage.pdf ↩︎

The New Help for Medicare Beneficiaries with High Drug Costs That Few Seem to Know About

Published: Dec 12, 2023

The Inflation Reduction Act of 2022 includes several provisions to lower out-of-pocket drug costs for people with Medicare. Some provisions of the law have already taken effect, including a $35 cap on monthly cost sharing for insulin and free vaccines under Part D, Medicare’s outpatient drug benefit. Medicare’s new drug price negotiation program is also getting underway, with negotiated prices first taking effect in 2026. And a new cap on Part D out-of-pocket prescription drug costs for people with Medicare takes effect in January 2024 – a change that will save thousands of dollars for people who take high-cost drugs.

Beginning in 2024, people enrolled in Part D plans will no longer be required to pay 5% coinsurance after they reach the catastrophic threshold. Eliminating this 5% coinsurance requirement means that in 2024, Part D enrollees will pay no more than about $3,300 for all brand-name drugs they take – a change KFF estimates will help well over 1 million Medicare beneficiaries. And starting in 2025, out-of-pocket drug spending will be capped at a lower amount, $2,000 (indexed annually for growth in Part D costs.)

To illustrate the impact of Part D’s new out-of-pocket cap, consider three drugs taken to treat various forms of cancer – Lynparza, Ibrance, and Xtandi – each with annual retail prices well over $100,000. In 2023, Medicare Part D enrollees who used any of these drugs for the entire year faced annual out-of-pocket costs around $12,000, but in 2024, out-of-pocket costs will drop to about $3,300 for each of these drugs (Figure 1). This translates to annual savings of $8,100 to $9,200 compared to 2023. Out-of-pocket costs for these drugs will drop even further beginning in 2025 when the $2,000 cap takes effect.

Medicare Part D Enrollees Using Expensive Drugs Will Save Thousands of Dollars in 2024 Due to the Inflation Reduction Act's Out-of-Pocket Spending Cap

The current 5% coinsurance requirement for catastrophic coverage may seem like a small amount, but with many drugs coming to market priced at $150,000 or more, that 5% translates into thousands of dollars in annual out-of-pocket costs for expensive drugs. Paying this amount can be a particular burden for older adults, many of whom live on fixed incomes and have limited financial resources to tap to pay for high-cost medications.

Although changes to prescription drug costs in the Inflation Reduction Act are underway, recent KFF polling finds low levels of awareness among older adults about key features of the law. Only a quarter of all older adults know about the new cap on out-of-pocket prescription drug costs for people with Medicare that takes effect in January. A larger share, but still less than half, of all older adults knows about the new insulin copay cap for Medicare beneficiaries, and around one-third know about the change that requires the government to negotiate prices for some high-cost drugs in Medicare (Figure 2).

Most Older Adults are Unaware of Key Drug Provisions in the Inflation Reduction Act, Including Medicare's New Cap on Out-of-Pocket Drug Spending

At a time when the affordability of health care is among the key issues that voters want to hear about from presidential candidates, the results of KFF polling suggest that more work could be done to inform people with Medicare about the prescription drug changes in the 2022 law. But regardless of what people do or don’t know about these changes, more older adults will begin to see real savings very soon, particularly those who take high-cost drugs.

New Federal Support for the Public Health Workforce: Analysis of Funding by Jurisdiction

Published: Dec 11, 2023

Findings

Key Takeaways

  • New federal funding of $3 billion provided to health departments from the American Rescue Plan is designed to build and bolster what has been a depleted public health workforce in the United States.
  • The funding, distributed through the CDC’s Public Health Infrastructure Grants (PHIG) program, has been provided to 107 different jurisdictions, including state, county, city, and territorial health departments.
  • By region, health departments in the South have received the largest share of funding (39%), followed by those in the West (23%), Midwest (20%) and Northeast (17%).
  • State health departments have received the greatest share of workforce funding (70.6%) followed by counties (17.1%), cities (10.4%), and territories (1.9%).
  • Among states, Florida received the largest amount of workforce support ($141.4 million), followed by Texas ($140.8 million), and New York ($107.8 million). Together the top ten funded states accounted for 47% of all state funding and 33% of funding overall.
  • Jurisdictions report that they plan to use PHIG workforce funds to hire or retain more than 6,000 staff over the five-year grant period, with most planned hires/retentions in Texas, Florida, and Missouri by the end of the grant.
  • The size, scope, and flexibility of this funding is unprecedented, as it exceeds any funding provided for the workforce thus far, reaches many more jurisdictions, and extends over a five-year period.
  • Data on outcomes and impacts will take longer to materialize, and challenges remain, including the remaining gap between estimated workforce needs and planned staff hires and retentions, and questions about workforce sustainability after the five-year grant period ends. 

Introduction

COVID-19 highlighted and exacerbated existing weaknesses in the U.S. public health system, particularly in the public health workforce, which had already been depleted. Public health departments at all levels – including states, counties, large cities, and territories – faced numerous challenges in mounting a response to the pandemic due to a lack of staff, limited funding, and outdated data and communication capabilities, among other issues, and concerns remain about preparedness for future pandemics. In response, Congress provided $7.7 billion through the American Rescue Plan to help shore up the public health workforce, which included funds to be directed to public health departments. In turn, the Centers for Disease Control and Prevention used some of these funds to create a new, five-year, $3 billion Public Health Infrastructure Grants (PHIG) program to help public health departments recruit, retain, and train workers, including to better prepare for future pandemics (the PHIG also includes an additional $140 million for “foundational capabilities” and $200 million for “data modernization”). PHIG launched in 2022 with the $3 billion in workforce funds awarded to health departments in the first year of the grant. The PHIG program is significant for several reasons:

  • It is a “non-categorical and cross-cutting” grant mechanism, in contrast to most federal public health funding which is generally targeted to specific diseases, activities, or populations;
  • It provides funding for a multi-year period – in this case, five years – as opposed to most public health funding which is typically provided annually (or at most over a two- to three-year period, as was done with other ARPA funding);
  • The number of local jurisdictions eligible for funding is significantly greater than other CDC funding mechanisms, including others funded through ARPA; and
  • The amount of funding made available for public health jurisdictions to expand their workforce exceeds any prior grant mechanism; for example, the next largest amount was $2 billion in ARPA funds1  awarded in 2021 for a two-year period primarily to address COVID (although those funds could be used for preparedness).

Using newly available data from the CDC, this issue brief analyzes the distribution of PHIG workforce funding by jurisdiction, as well as jurisdictional plans for enhancing the workforce (data on foundational capacities and data modernization are not included), to provide an initial snapshot of how this new funding will be used. Data are as of September 30, 2023.

Overview of PHIG Workforce Funding

As described in the grant announcement, PHIG workforce funds are intended to “reinforce and expand the public health workforce by hiring, retaining, supporting, and training the workforce and by strengthening relevant workforce planning, systems, processes, and policies.” Jurisdictions can use these funds to fill vacancies and create new positions, as well as invest in worker well-being and engagement, along with other activities. Key characteristics and requirements of the grant include:

  • As many as 111 jurisdictions, including state2 , county, city, and territorial health departments, are eligible to receive PHIG funds. Counties serving a population of 2,000,000 or more and cities serving a population 400,000 or more are eligible as direct recipients.
  • A funding formula based on the size of the population served by a jurisdiction as well as an adjustment factor for “community vulnerability”, using the U.S. Census’s Community Resilience Estimates, is used to determine allocations. The base funding amount for all awards is set at $2.5 million and the ceiling at $150 million.
  • Jurisdictions are expected to focus their workforce efforts on six key activities and have some flexibility to choose among these (see Table 1). While encouraged to include all six activities in their plans, they are required to include #1 (recruit and hire new public health staff) and #6 (strengthen support for implementation). Under #6, recipients must hire a Workforce Director to help oversee implementation and at least one staff member to conduct evaluation.
Table 1: PHIG Workforce Strategy Key Activities and Examples
Key ActivityExamples
1. Recruit and hire new public health staffConduct workforce needs assessments, expand recruitment efforts, revise job pay scales, offer hiring incentives, establish internships and fellowships
2. Retain public health staffOffer retention incentives such as loan repayment and moving expenses, revise terms for existing jobs to allow for more pay or benefits, maximize hybrid work opportunities
3. Support and sustain the public health workforceAdopt workplace programs for staff well-being, strengthen employee engagement, conduct staff viewpoint surveys, share and use employee input in strategic planning and other workplace initiatives
4. Train new and existing public health staffAdd training offerings, establish or revise training tracks or certificate programs, support staff who enroll in outside trainings
5. Strengthen workforce planning, systems, processes, and policiesCreate or revise a workforce development strategy, catalyze the collection and use of workforce data, refresh online recruitment and hiring portals, conduct quality improvement on existing systems
6. Strengthen support for implementation of this grantHire a Workforce Director to manage the grant, staff to conduct program evaluation and performance measurement, and a Data Modernization Director.
SOURCE: HHS/CDC PHIG Grant Opportunity – “U.S. Public Infrastructure, Workforce, and Data Systems” June 2022.

Findings

PHIG workforce funding has been awarded to 107 public health departments across the country, with most channeled to state jurisdictions, and the largest share to the South, largely reflecting the size of a jurisdiction’s population.

  • The 107 health department recipients include those in all 50 states and Washington D.C., 27 counties, 21 cities, and eight territories (see Figure 1).
  • State health departments have received the largest share of funding (70.6%), followed by counties (17.1%), cities (10.4%), and territories (1.9%) (see Figure 2).
    • The top ten funded states accounted for 47% of all state funding and 33% of funding overall. Among states, Florida received the largest amount ($141.4 million), followed by Texas ($140.8 million), and New York ($107.8 million) (see Figure 3).
    • The top ten funded counties accounted for 61% of all county funding and 10% of funding overall. Among counties, Los Angeles County, California received the largest amount ($79.8 million), followed by Maricopa County, Arizona ($38.0 million), and Miami-Dade County, Florida ($27.8 million).
    • The top ten funded cities accounted for 71% of all city funding and 7% of funding overall. Among cities, New York City received the largest amount ($84.6 million), followed by Chicago ($27.1 million), and Houston ($23.3 million).
    • The eight territories received 2% of funding overall. Among territories, Puerto Rico received the largest amount ($34.9 million), followed by Guam ($4.3 million), and the U.S. Virgin Islands ($3.6 million).
  • By region, health departments in the South have received the largest share of funding (39%), followed by the West (23%), Midwest (20%) and Northeast (17%) (see Figure 4).
PHIG Workforce Funding by Recipient - States
PHIG Workforce Funding by Health Department Jurisdiction Level
Top Recipients by PHIG Workforce Funding - States
PHIG Workforce Funding by U.S. Region

Funding per capita for all recipients combined was $8.95, with significant variation in some cases. For example, per capita funding for territories was almost twice that of states. This partly reflects the fact that there is a base funding amount for all jurisdictions, regardless of population size.3 

  • Per capita funding was $8.95 overall, though it ranged among all jurisdictions from a low of $7.49 for the state of Utah to a high of $125.69 for the territory of Palau.
  • Comparing across jurisdiction types, states had the lowest per capita funding ($8.57), followed by counties ($9.10) and cities ($11.00). Territories, which generally have the lowest population size of any jurisdiction, received $15.91 per capita.
  • Within states, funding per capita ranged from $7.49 in Utah to $11.75 in Wyoming. In counties, it ranged from $8.03 in King County, Washington to $11.87 in Douglas County, Nebraska. Among city recipients per capita funding amounts ranged from $9.43 in Columbus to $13.88 in Long Beach, and in territories it ranged from $11.27 in Puerto Rico to $125.69 in Palau (see Figure 5).
Top Recipients by PHIG Workforce Funding per Capita - States

Most workforce funding is being channeled to the two required workforce activities under the grant – “strengthening grant implementation” and “recruitment and hiring” – although there is variation across jurisdictions.

  • More than a third ($1.1 billion or 36%) of funding is to “Strengthen support for implementation of this grant”, which includes hiring a Workforce Director and evaluation staff. The next largest category is recruitment and hiring of staff ($613 million or 20%) followed by staff retention ($342 million or 11%). The remaining 33% is divided among four other activities (see Figure 6).
  • There is some variation by jurisdiction level. For example, states were more likely to use funds for strengthening grant implementation (38%) than counties (28%), and counties were more likely to use funding for recruitment and hiring (23%) than territories (11%) (see Figure 7).
  • Only seven jurisdictions did not channel most workforce funding to the two required categories. For example, in two jurisdictions (Washington and Fulton County, Georgia), “Support and sustain the public health workforce” was the top funded category and in two jurisdictions (Austin and Dallas County, Texas), “Retain public health staff” was the top category.
PHIG Workforce Funding by Activity
PHIG Workforce Funding by Activity and Health Department Jurisdiction Level

Jurisdictions report that they plan to hire or retain more than 6,000 staff over the five-year grant period, with the largest share expected to support organizational competencies.4 

  • In year 1, jurisdictions plan to hire or retain 3,862 staff, rising to 6,152 by year 5.
  • State jurisdictions plan to hire the greatest number of staff (2,471 staff in year 1 and 3,822 by year 5), followed by counties (800 and 1,207), cities (377 and 754), and territories (214 and 369). The average number of staff to be hired/retained across all jurisdictions is 36.4 in year 1 and 58.0 in year 5, though this varies by health department level.
  • The jurisdictions planning to hire/retain the most staff in year 1 are Texas (433), Los Angeles County (189), and Florida (186); by year 5, it is Texas, Florida, and Missouri.
  • When asked for expected hiring/retention numbers across ten defined public health program areas, jurisdictions reported the largest share of expected hires/retained staff by year 5 in “Organizational competencies” (38% of all staff hires and retentions), followed by “Assessment and surveillance” (14%) and “Other” (14%). The program areas with the smallest shares of planned hires/retained staff are “Maternal, child, and family health” (2%), “Chronic disease and injury prevention (3%), and “Environmental public health” (4%). There is some variation by health department level. For example, by year 5, 42% of staff hired/retained by states are expected in organizational competencies compared to 31% by territories in that category. Territories plan for a greater share of staff in assessment and surveillance (25%) compared to other jurisdiction types (see Figure 8).
Share of Staff to be Hired/Retained by Program Area and Health Department Jurisdiction Level

Discussion

New federal funding of $3 billion provided to health departments from the American Rescue Plan is designed to build and bolster what has been a depleted public health workforce in the United States. The size, scope, and flexibility of the funding is unprecedented, as it exceeds any funding provided for the workforce thus far, reaches many more jurisdictions, and extends over a five-year period. This analysis of initial data from the CDC provides an early look at how funding has been distributed across the country and what jurisdictions plan to do with this support. As shown here, states have received the largest share of funding, (70.6%), followed by counties (17.1%), cities (10.4%), and territories (1.9%), reflecting the size of the populations they serve. Jurisdictions plan to use funds to hire or retain more than 6,000 staff by the end of the five-year period, with states leading the way in this area. Most funding will be channeled to the two required areas of the grant, strengthening support for implementation through hiring key personnel and recruitment and hiring of staff, followed by staff retention more generally. Across all these areas there is notable variation among recipients, which appears to reflect the design of the PHIG in allowing flexibility to address the unique needs of different jurisdictions.

Still, while these data provide an early snapshot of how this funding will be used, data on outcomes and impacts will take a much longer time to materialize. Moreover, despite the size of the grant and multi-year nature of the funding, there are challenges that remain. First, the planned number of staff hires and retentions represent only a fraction of estimates of the need for a public health workforce in the U.S.  Additionally, while funding is provided for a five-year period, longer than most jurisdictional grants, there are questions about the sustainability of hiring beyond this period, with jurisdictions already expressing concerns about the future. More broadly, the extent to which this funding can help plug the very deep hole, even temporarily, in the public health workforce that would be required to adequately prepare and respond to future threats remains to be seen. Monitoring the impact of these investments, including how enduring they may be, will be important for assessing the strength of the nation’s public health infrastructure and its ability to handle new challenges going forward.

Appendix

PHIG Workforce Funding Data by Health Department
PHIG Staffing Data by Health Department

Endnotes

  1. At least 25% of these awards were required to be used school-based health programs. ↩︎
  2. The grant also requires that no less than 40% of workforce funds provided to state health departments be distributed to local health departments that have not received direct funding from the grant. ↩︎
  3. Population served estimates consider counties within states and cities within states and counties, so population is not counted more than once. ↩︎
  4. Data on staff to be hired/retained based on workforce and foundational capabilities funds. Jurisdictions potentially will have additional hires via data modernization funds, but that data is not yet available. ↩︎