Addressing Abortion Access through State Ballot Initiatives

Authors: Mabel Felix, Laurie Sobel, and Alina Salganicoff
Published: Feb 9, 2024

This brief is not updated as efforts to get abortion-related measures on the ballot progress. For an up-to-date list of states that may have abortion-related state constitutional amendment measures on the ballot, please see our ballot tracker.

Updated on February 9, 2024

Key Takeaways

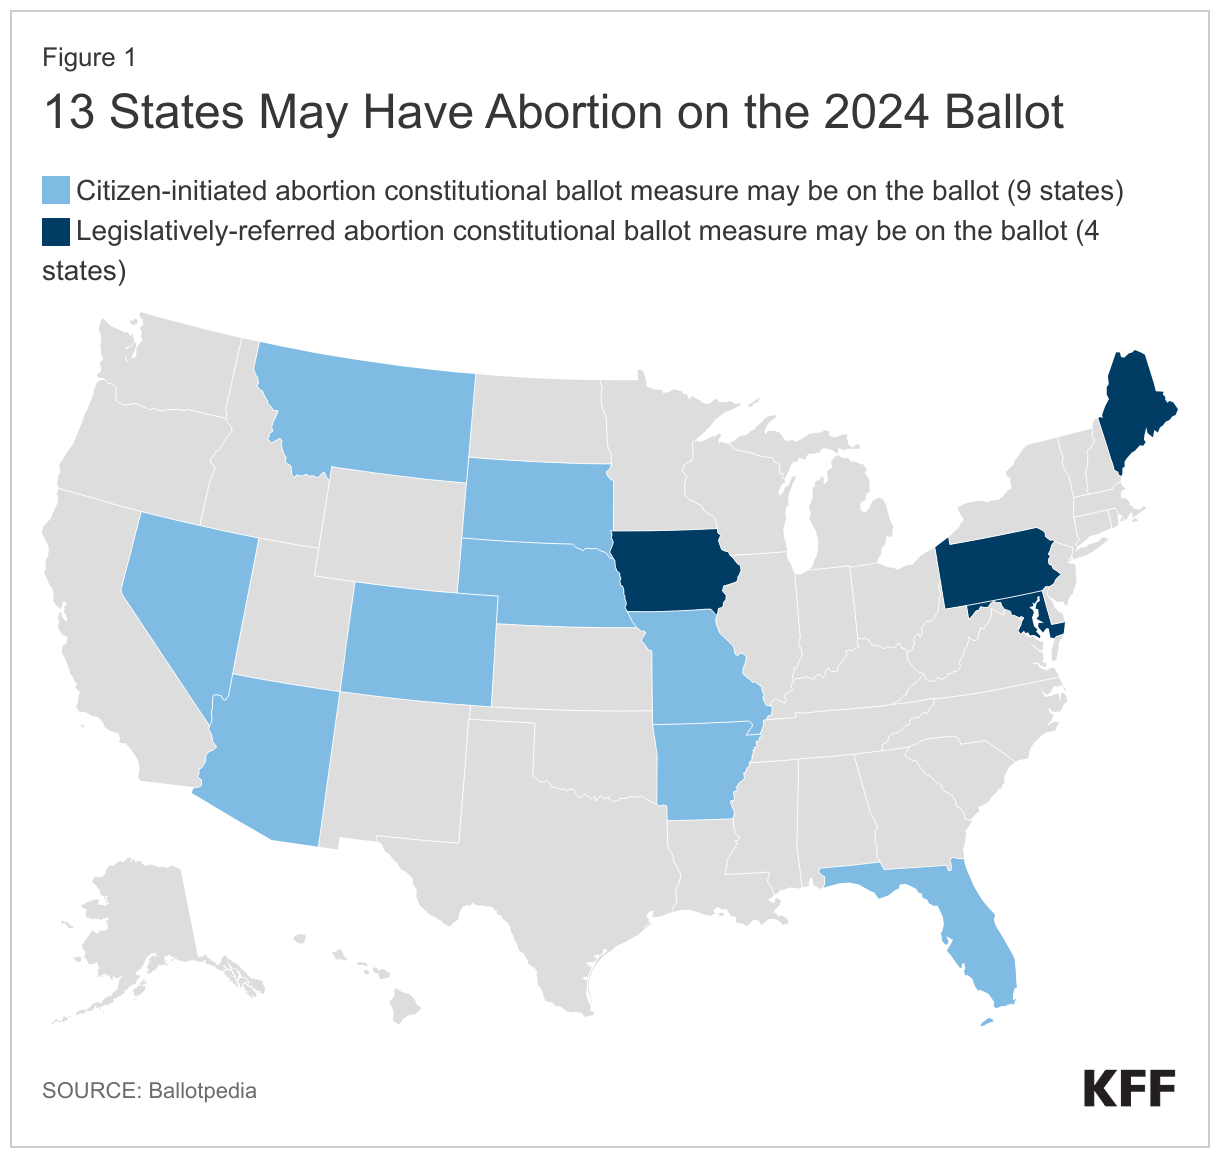
  • There are efforts underway to put constitutional amendments regarding abortion on the 2024 ballot in as many as 13 states: Arizona, Arkansas, Colorado, Florida, Iowa, Maine, Maryland, Missouri, Montana, Nebraska, Nevada, Pennsylvania, and South Dakota.
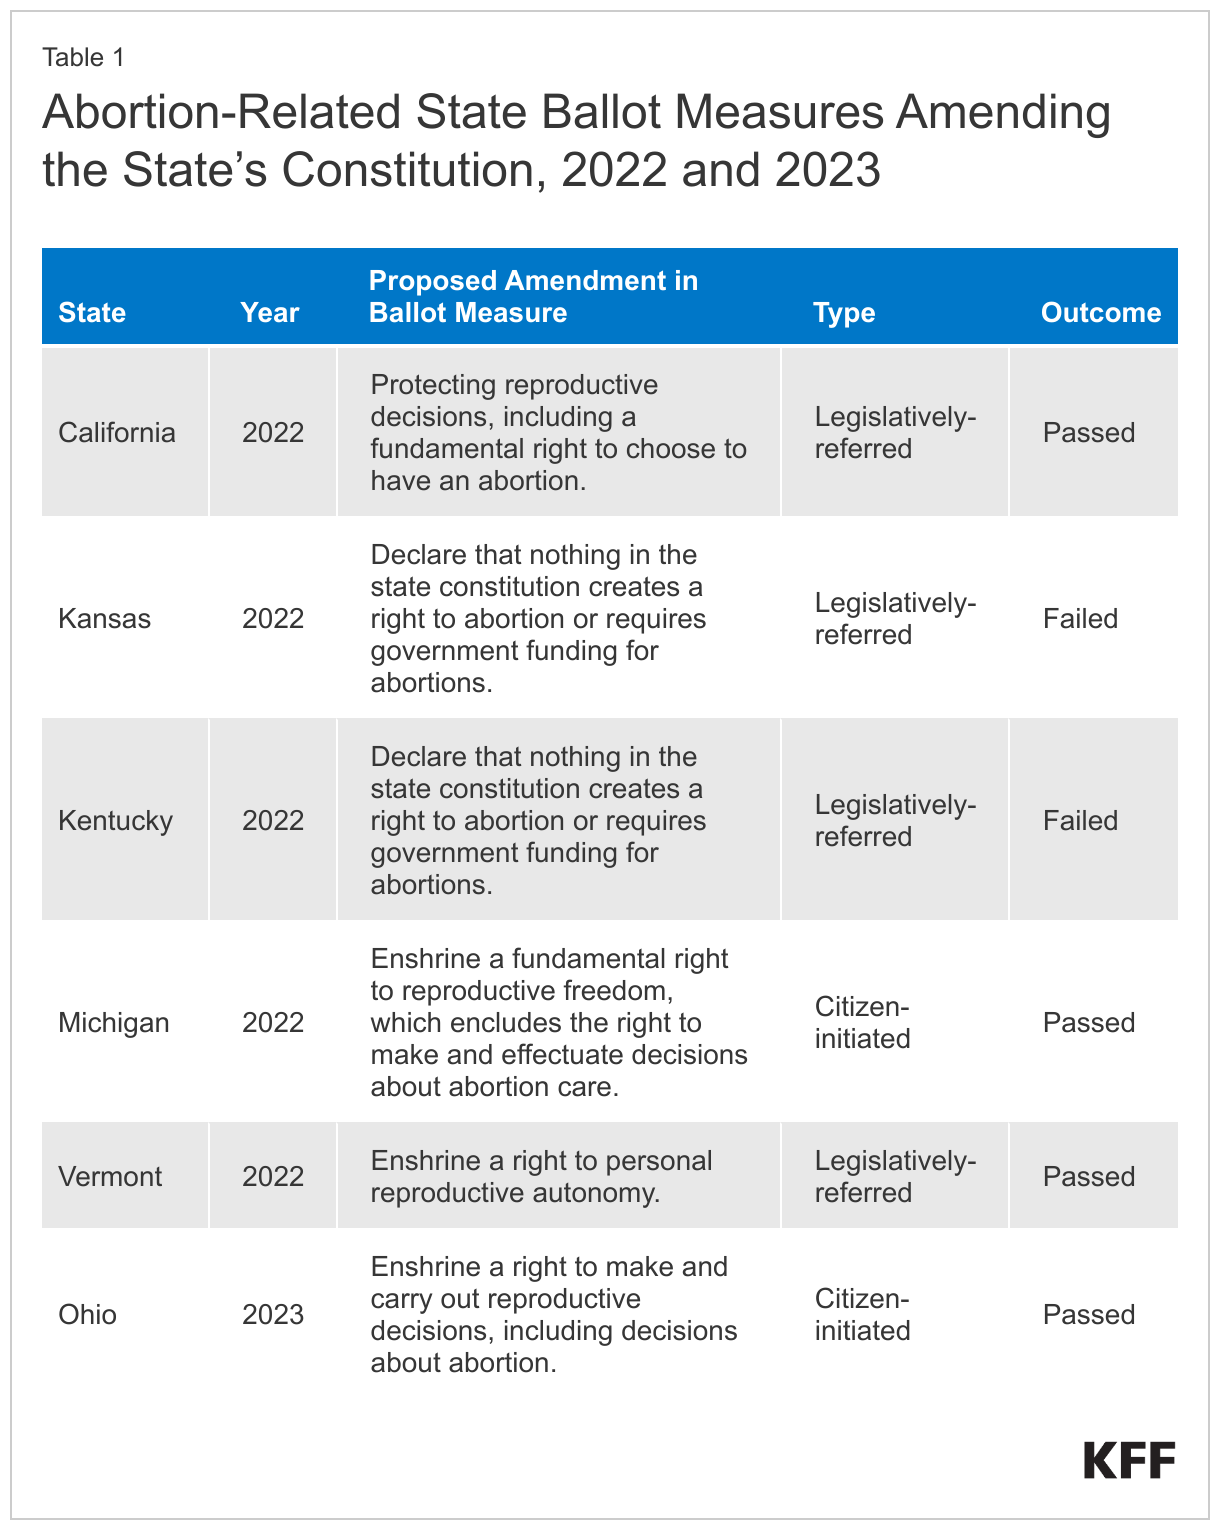
  • Since Dobbs, 6 states – California, Kansas, Kentucky, Michigan, Vermont, and Ohio – have voted on abortion related constitutional amendments, and the side favoring access to abortion prevailed in every state.
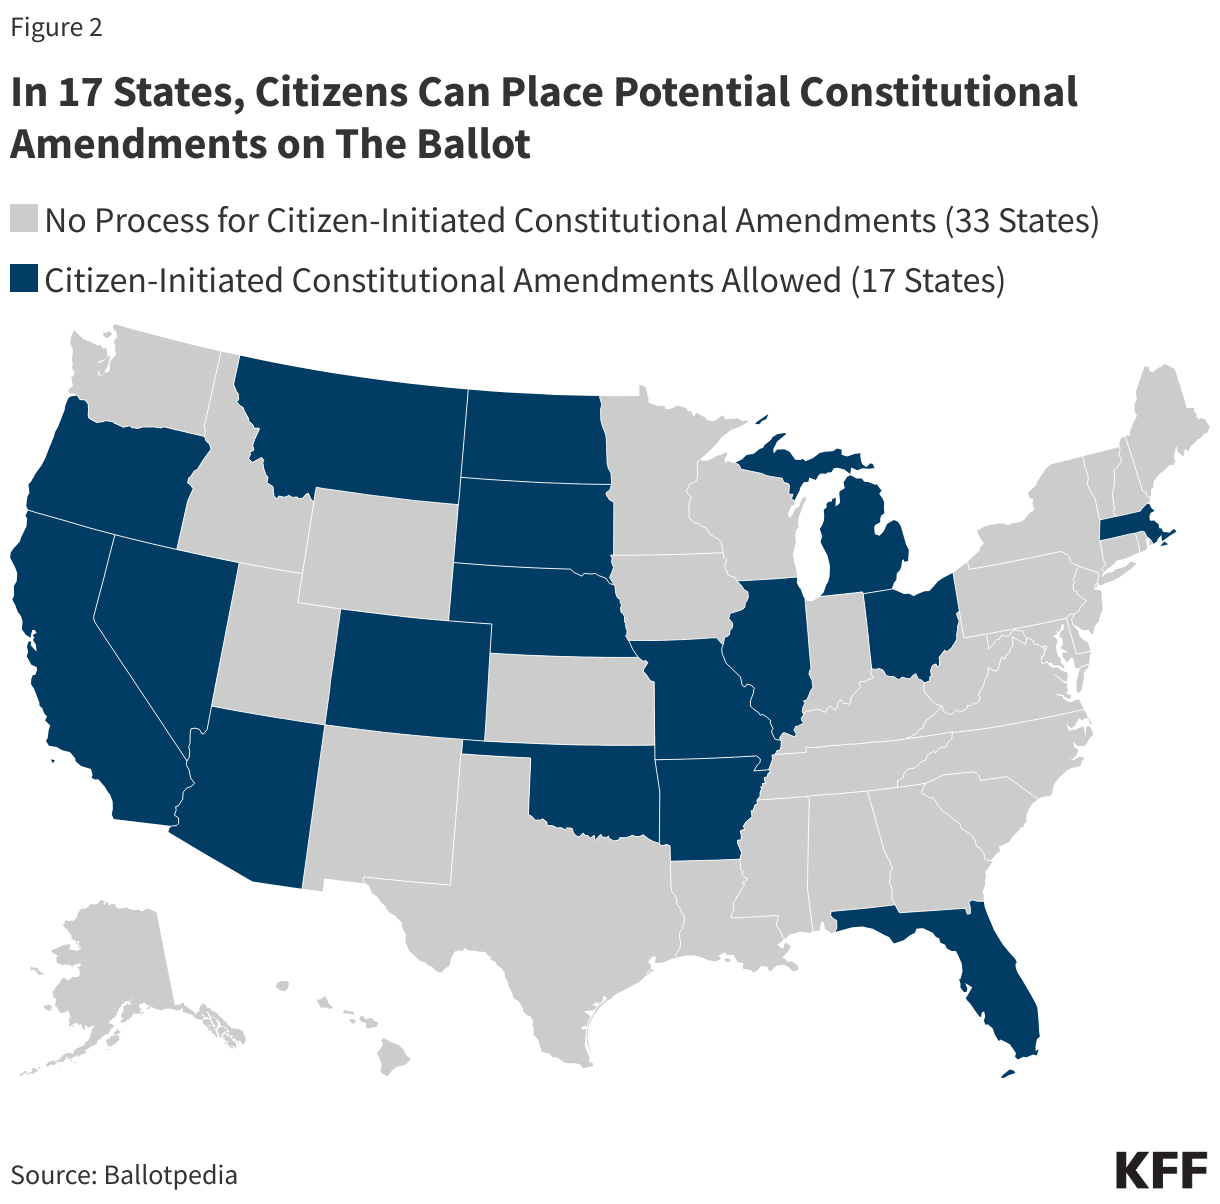
  • Citizen-initiated constitutional amendments are a powerful tool that is being utilized to allow voters to garner signatures to place abortion on the ballot without directly involving the legislature or the governor.
  • This approach, however, cannot be used in 15 of the states that currently have abortion bans or early gestational limits on the books because they do not have a pathway for citizens to place potential constitutional amendments on the ballot. In those states, the legislature controls the process.

Since the Supreme Court’s Dobbs decision overturning Roe v. Wade, voters in 6 states have weighed in on constitutional amendments regarding abortion. Every time these constitutional amendments have been on the ballot, voters have elected to approve measures that would explicitly protect abortion and deny those that sought to limit abortion. Since then, potential ballot initiatives have captured nationwide attention, and in 2024, 13 states may have abortion measures on their ballot. These measures seek to either explicitly affirm that the state constitution protects the right to abortion or that nothing in the constitution confers such a right. Advocates on both sides are hoping that having abortion on the ballot will motivate voter turnout in this election cycle. This issue brief explains why initiatives have become so popular with advocates on both sides of the issue, reviews the current initiatives that are in progress and may appear in on state ballots the next general election, and outlines the processes states have available to them to use to place initiatives on the ballot.

13 States May Have Abortion on the 2024 Ballot

Interest in Reproductive Rights Ballot Measures Post-Dobbs

State constitutional amendments have drawn much interest since SCOTUS’ decision in Dobbs because they provide more stable protections than laws or state Supreme Courts’ decisions recognizing a right to abortion. Laws are relatively easy to amend or repeal if there is a change in the make-up of the state legislature. For swing states, where neither party has a strong hold on the majority of the legislature, it is difficult to ensure that abortion protections or restrictions will not be repealed if there is a change in party control. Additionally, state Supreme Court rulings recognizing a right to abortion – or stating that there is no such right – in the state constitution may be overruled when there are subsequent changes in the make-up of the court. For example, the South Carolina Supreme Court ruled in January 2023 that the state’s 6-week ban was unconstitutional, but after the legislature appointed a new justice to replace a retiring justice, the Court reversed its ruling in August 2023 and found the restriction is constitutional. Constitutional amendments, on the other hand, would have to be repealed with a ballot measure receiving a majority of the popular vote.

Furthermore, in states where their supreme court has interpreted and recognized a right to abortion based on the state constitution, a constitutional amendment declaring there is no right to abortion would supersede the Court’s decision and allow abortion restrictions and bans to survive judicial review. For example, the goal of the 2022 Kansas ballot measure was to negate the state Supreme Court’s ruling that the Kansas constitution protects the right to abortion. If the ballot measure had passed and the Kansas constitution had been amended to state that nothing in it creates a right to abortion, the state legislature would have been able to ban or severely restrict abortion in Kansas. Conversely, in states where their supreme court has ruled the state constitution does not protect the right to abortion, amending the state constitution to include an explicit right to abortion would supersede supreme court precedent and require the court to block an abortion ban.

Importantly, aside from providing stronger, more stable protections and changing the judicial review of abortion laws, ballot measures seeking to amend state constitutions place issues directly in front of voters. In states where the legislature has sought to limit abortion in ways that are more restrictive than the public favors, a citizen-initiated ballot measure is a way to enact constitutional protections for abortion without directly involving the legislature or Governor. And once the constitution is amended, state policy makers cannot repeal these protections or fully ban or restrict abortion. Citizen-initiated ballot measures provide a direct pathway for the electorate to decide whether or not abortion should be legal in their state, regardless of how their elected representatives have decided to approach abortion policy. According to a recent KFF poll, nationally, the majority of voters say abortion should be legal in all or most cases.

Constitutional Ballot Measures in 2022 and 2023

Due to the advantages presented by ballot measures amending state constitutions, legislatures and citizen groups in several states have moved to add measures enshrining a right to abortion in their constitutions or declaring that there is no such right in the constitution. In 2022, there were four legislatively referred measures on the ballot regarding abortion or reproductive rights more broadly. In 2022, Michigan voters passed the first citizen-initiated constitutional measure protecting the right to abortion and in 2023, Ohio voters also passed a similar citizen-initiated constitutional measure protecting the right to abortion.

Abortion-Related State Ballot Measures Amending the State’s Constitution, 2022 and 2023

Constitutional Ballot Measures That May Be on the 2024 Ballot

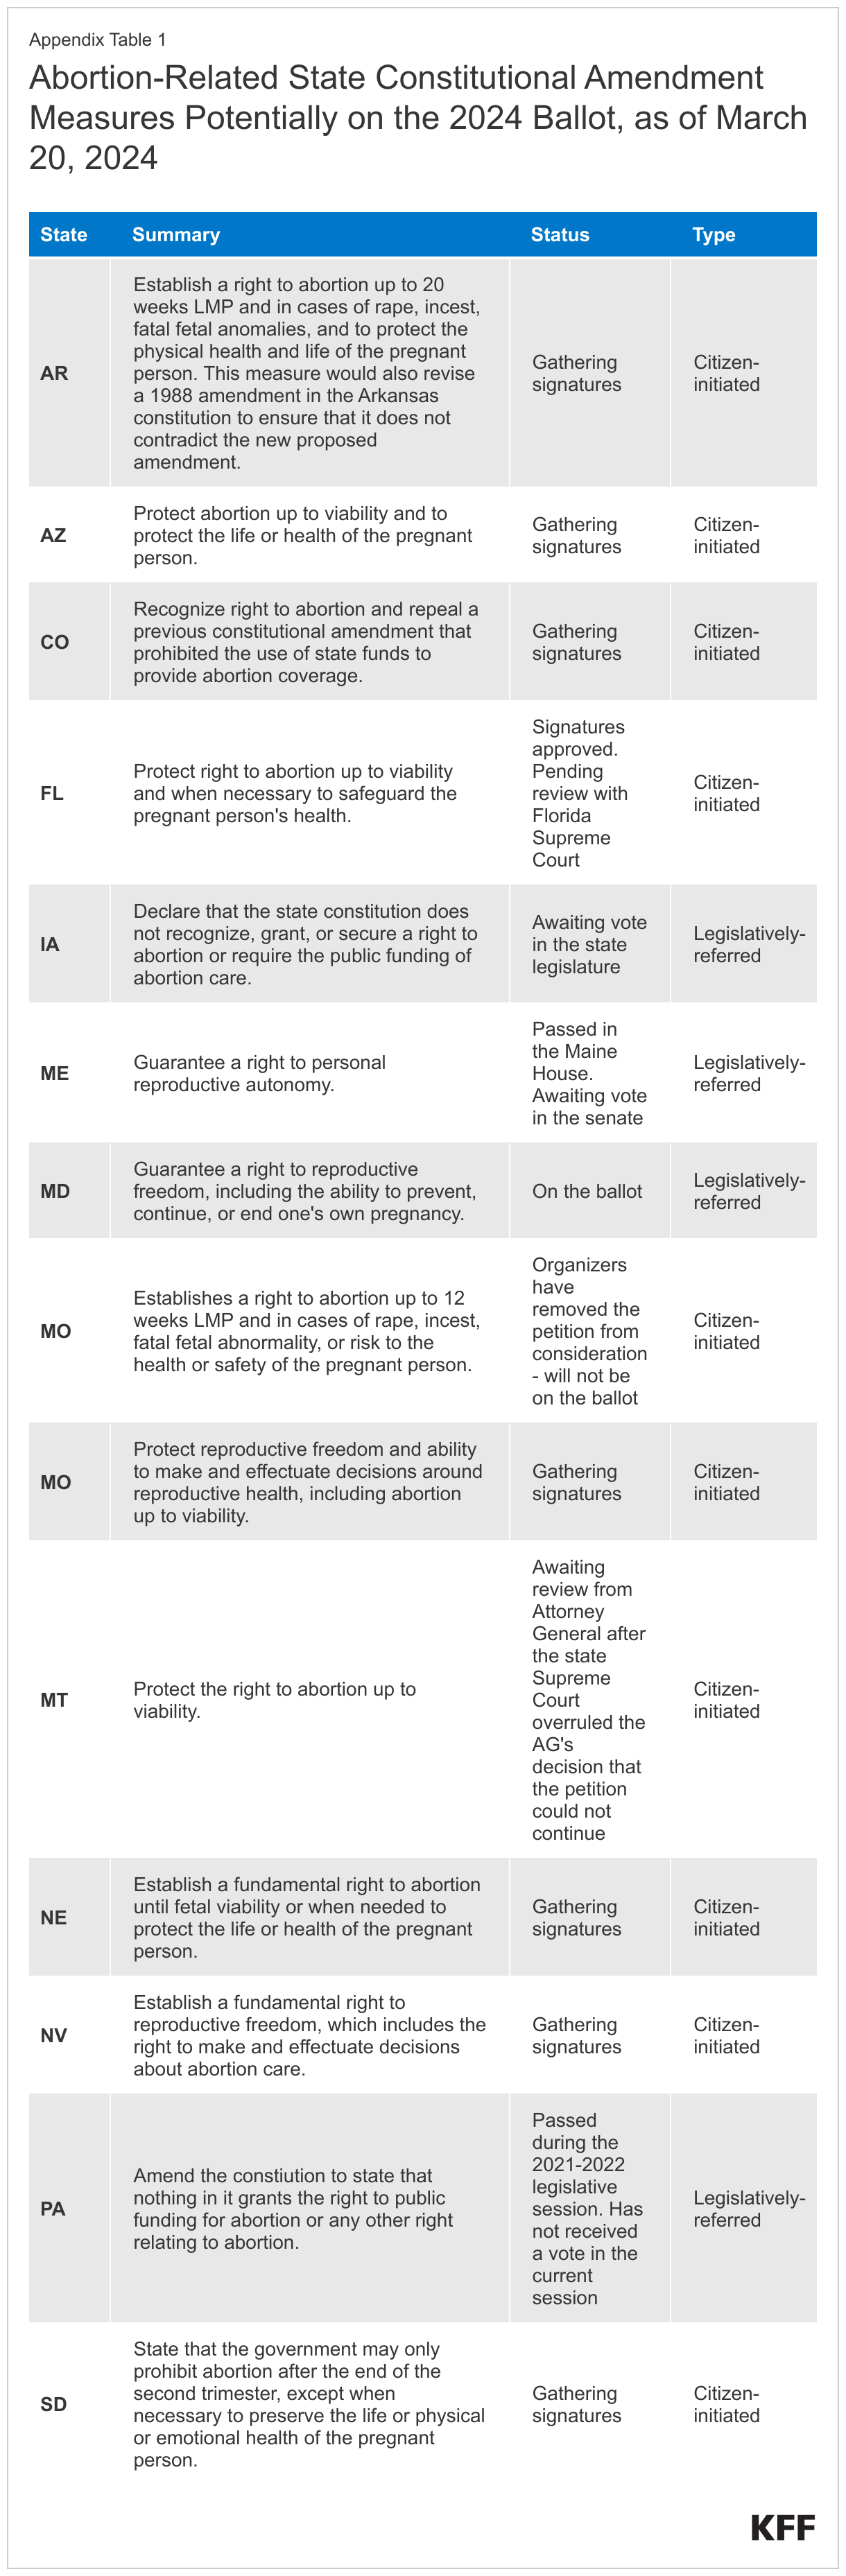
Abortion rights groups are seeking to qualify ballot initiatives to uphold abortion rights in three states (Colorado, Montana, and Nevada) where there is no early gestational limit and in six states that ban abortion or have early gestational limits (Arizona, Arkansas, Florida, Missouri, Nebraska, South Dakota) in 2024. There is ongoing litigation challenging the abortion bans in most of these states, but without a constitutional amendment establishing a right to abortion, it is not certain that the respective supreme courts in these states will find the bans unconstitutional, or in the case of Florida, that the Court will uphold its prior decisions recognizing a right to abortion. However, if the initiatives establishing a right to abortion succeed in these states, abortion-rights advocates would have the certainty that these bans will be blocked in court.

Four state legislatures have constructed potential initiatives for constitutional amendments pertaining to abortion. The legislatures in Iowa and Pennsylvania have introduced measures that would amend the state constitution to declare that it does not protect the right to abortion. In Maine and Maryland, state representatives drafted initiatives protecting the right to reproductive freedom or autonomy (which includes the right to abortion). The Maryland initiative passed in the legislature and so far, is the only measure that is certain to appear on the 2024 ballot. The remaining legislatively-referred initiatives must pass in both chambers of the state legislatures, and the citizen-initiated measures are either gathering signatures, or awaiting initial approval or signature certification. See Appendix A for state-by-state details.

Pathways to Getting an Initiative on the Ballot

Legislatively-Referred Initiatives

For legislatively-referred initiatives seeking to amend a state constitution by the electorate, state legislators draft language for the initiative and introduce it to the legislature, in a process that is similar to how they introduce language for bills. Both chambers of the state’s legislature must vote to approve the language before it is placed on the ballot. In every state except for Delaware, initiatives seeking to amend a state’s constitution must be placed on the ballot and cannot be enacted without voter approval.

The process of approving a ballot initiative in the state legislature differs from state to state. While most states require the initiative to pass only once in the legislature, some states require it to pass over two successive legislative sessions. States also have differing requirements for what percentage of the legislature must vote in favor of the initiative for it to move forward, ranging from a simple majority to a two-thirds majority. Once the measure is on the ballot, there are also differing requirements for what share of the votes it must receive to become law.

Citizen-Initiated Measures

Citizens are allowed to propose a constitutional amendment for the ballot in 17 states. The rules for doing so differ slightly from state to state, but generally, citizen groups must submit a draft of the proposed amendment and ballot title to a government official – usually the Secretary of State – for approval. Once the petition has been approved, groups must gather signatures in support of their measure, often with distribution requirements across the states’ congressional districts, and submit their support signatures for validation. If enough signatures from a sample are deemed valid, the measure is cleared to be on the ballot, where it must receive anywhere from a simple majority to 60% of the vote in favor to be approved.

In 17 States, Citizens Can Place Potential Constitutional Amendments on The Ballot

There are different stages of review for ballots in each state. Some states require that ballot measures address only one subject, and the reviewing body or official might reject a petition if they decide it violates this requirement. Petitions may also be rejected if they contain vague or confusing language. However, beyond these considerations, state officials are generally not allowed to reject a petition based on its substance. In the past few years, this has meant that state attorneys general, secretaries of state, or electoral boards that oppose abortion have nevertheless had to approve petitions for ballot measures that would enshrine the right to abortion in the state’s constitution. This has also resulted in state legislatures taking steps to attempt to make it more difficult for measures to pass or even get on the ballot in the first place. For instance, in Ohio, Missouri, Florida, Oklahoma, and Utah, these attempts have included proposed measures to increase the percentage of the vote needed for the ballot initiative to pass. Lawmakers in Missouri and North Dakota have additionally attempted to increase the number of signatures needed to get a measure approved. The North Dakota 2024 constitutional ballot measure additionally seeks to require that constitutional ballot initiatives pass in two separate elections (the primary and general elections) before they can successfully amend the constitution.

Citizen-Initiated Ballot Measures Are Not an Option in All States

Not every state has a pathway for a citizen-initiated constitutional amendment. In twelve states that currently ban abortion or have early gestational limits in effect, there is no process for a citizen-initiated ballot measure. Three additional states (Wyoming, Iowa, and Utah) that have abortion bans currently blocked by courts, also have no process for a citizen-initiated ballot measure. In these fifteen states, unless the state legislatures repeal their bans, the only avenue reproductive rights supporters have to potentially change the legal status of abortion, short of electing pro-choice legislators and policy makers, is to challenge these bans in court. If the State Supreme Court upholds the bans, they will remain in place. This is the current situation in Idaho, Indiana, and South Carolina. Their respective supreme courts ruled their state constitutions do not protect the right to abortion and that the states’ abortion bans are constitutional. Since these rulings, abortion-rights advocates have not had any avenues to change the legal status of abortion in these states. Litigation challenging abortion bans in seven other states (Georgia, Iowa, Kentucky, Louisiana, North Carolina, Utah, Wyoming) with bans and no process for a citizen-initiated ballot measure is making its way through the courts. There are no legal challenges to the bans in Alabama, Mississippi, or West Virginia.

15 States with Abortion Bans or Early Gestational Limits Do Not Have a Pathway for Citizen-Initiated Constitutional Amendments

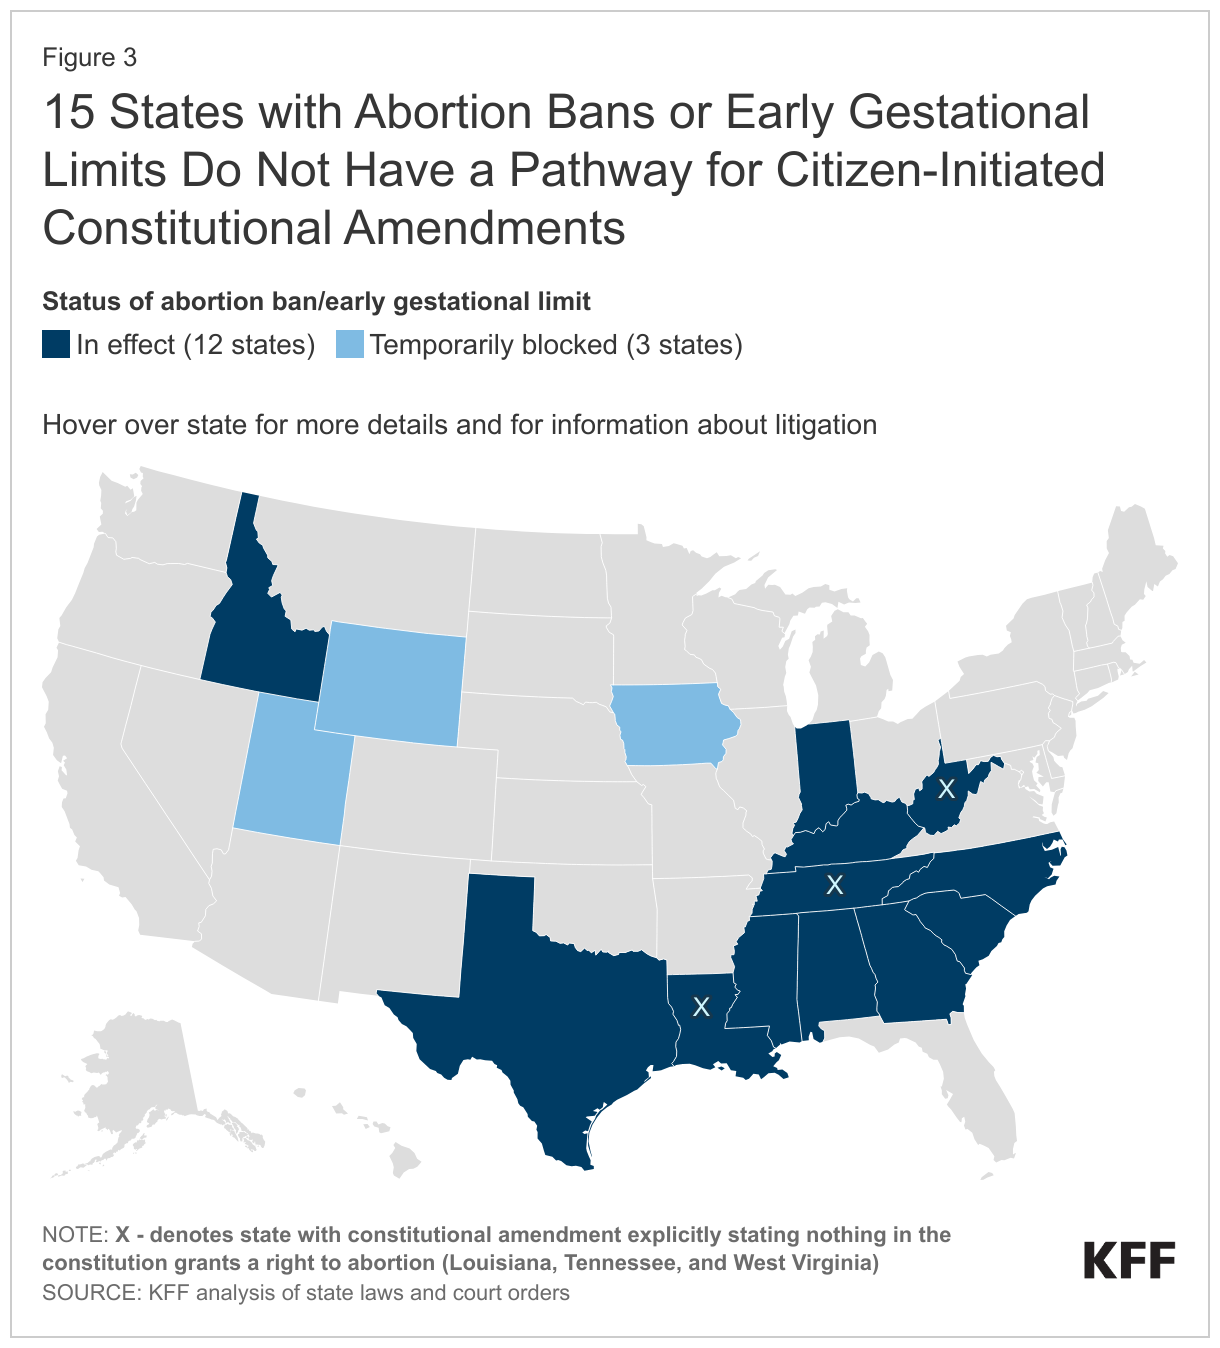
Moreover, three states with abortion bans in place and no process for a citizen-initiated ballot measure (Louisiana, Tennessee, and West Virginia), have state constitutional amendments that explicitly state their constitutions do not protect the right to abortion. These amendments preclude these states’ Supreme Courts from ruling that an abortion ban is unconstitutional because it violates a right to abortion. In other words, the only way for the legal status of abortion to change in these states is for their legislatures to repeal their bans or pass a new constitutional amendment protecting the right to abortion. In two of these states (Louisiana and Tennessee) and in Idaho, Indiana, and Texas, there is ongoing litigation focused only on whether the exceptions to the bans are constitutional, but not challenging the underlying bans

Citizen-Initiated Ballot Measures for State Statutes

In 21 states, citizens can initiate laws and place proposed laws on the ballot. The process for placing on the ballot an initiative that would enact a law is very similar to that for placing constitutional amendment initiatives, except that they typically require either fewer signatures for approval or fewer affirmative votes to pass. Some states with processes for statute ballot initiatives restrict the legislature’s ability to repeal or amend laws initiated by citizens. Other states simply treat these laws as they would any other law written by state representatives, and as such, can be repealed or amended as easily as any other law. This process allows citizens to propose laws that the current state legislators would not support. Currently, there are two proposed citizen-initiated statutes, brought by anti-abortion advocates, that may appear on the 2024 ballot, one in Colorado and the other in Nebraska. Both proposed statutes would ban abortion in each respective state, and both have been cleared for signature gathering. If they obtain the required number of signatures, these measures may appear on the ballot in 2024. In both states, abortion rights supporters are also seeking to place constitutional amendments protecting the right to abortion on the ballot. The placement of a statute seeking to ban abortion, and a constitutional amendment to protect the right to abortion on the same ballot is anticipated to cause confusion. In the unlikely event that both measures pass, the constitutional amendment would block the implementation of the abortion ban.

Looking Ahead

When the Supreme Court’s decision in Dobbs gave states the ability to ban or limit abortion, the legal landscape at the state level was activated as never before. In many states, legislators moved quickly to pass new statutes banning, or severely limiting access to abortion, and reproductive rights supporters turned to courts to challenge many of these new and already-existing laws. As the legality of and restrictions of abortion has been debated in state legislatures and courthouses, ballot measures amending state constitutions have emerged as a potential tool for proponents on both sides of the issue. State constitutional amendments explicitly stating whether the state’s constitution protects the right to abortion offer more stable protections for individuals’ right to abortion or the state’s right to ban abortion. These initiatives are being closely watched and it remains to be seen whether they will have an impact on voter turnout, as well as the outcome of candidate races.

Additionally, as the post-Dobbs legal landscape has shifted and begun to settle, many states have abortion laws on the books that do not reflect popular sentiment around abortion. Citizen-initiated constitutional ballot measures allow citizens to put abortion rights directly before the voters, although this is not an option in every state. Still, in many of the states where this is an option, advocacy groups on both sides of the issue are seeking to use this powerful tool to address the legality of abortion in their state.

Appendix

Abortion-Related State Constitutional Amendment Measures Potentially on the 2024 Ballot, as of January 23, 2024
News Release

New $2,000 Medicare Part D Cap Could Reduce Out-of-Pocket Drug Costs for Over One Million Beneficiaries Beginning Next Year, Including Tens of Thousands of Beneficiaries in Most States 

Millions More Will Reach the Spending Threshold and Benefit From the Cap Over Time

Published: Feb 8, 2024

A KFF analysis shows that a new out-of-pocket spending cap in Medicare Part D could translate into savings for well over 1 million beneficiaries when it takes effect next year, including more than 100,000 people each in California, Florida and Texas, based on analyses of drug spending in 2021.

The $2,000 cap, part of the Inflation Reduction Act of 2022, will lead to thousands of dollars in savings for Medicare patients who take high-cost drugs for cancer, rheumatoid arthritis, and other serious conditions. This new limit follows the elimination this year of a longstanding requirement that Part D enrollees pay 5% of their drug costs out-of-pocket after their drug expenditures reach a certain threshold. 

Based on KFF’s review of Part D drug claims data, if the cap been in place in 2021, 1.5 million Medicare beneficiaries would have benefited because their out-of-pocket costs for prescription drugs exceeded $2,000. Of the total 1.5 million, about 200,000 Medicare beneficiaries spent $5,000 or more for their prescriptions that year, while another 300,000 expended between $3,000 and $5,000. The rest spent between $2,000 and $3,000. 

Moreover, the number of people who will see savings from the cap will rise over a longer period of time. A total of 5 million Part D enrollees had out-of-pocket drug costs of $2,000 or more in at least one year during the 10-year period ending in 2021, for instance.

In most states, tens of thousands of Medicare beneficiaries could save money from the new cap next year. In six states — New York, Pennsylvania, Ohio, Illinois, North Carolina, and New Jersey — between 50,000 and 82,000 beneficiaries spent more than $2,000 out-of-pocket for prescription drugs in 2021. The numbers were higher in California, Florida, and Texas, where more than 100,000 Part D enrollees exceeded the threshold that year. 

Millions of People with Medicare Will Benefit from the New Out-of-Pocket Drug Spending Cap Over Time

Authors: Juliette Cubanski, Tricia Neuman, and Anthony Damico
Published: Feb 8, 2024

In 2025, Medicare beneficiaries will pay no more than $2,000 out of pocket for prescription drugs covered under Part D, Medicare’s outpatient drug benefit. This is due to a provision in the Inflation Reduction Act of 2022, which included several changes to the Medicare Part D program designed to lower patient out-of-pocket costs and reduce what Medicare spends on prescription drugs. This new $2,000 cap (indexed annually to the rate of change in Part D costs) comes on top of the elimination of 5% coinsurance in the catastrophic coverage phase of the Part D benefit, in effect for 2024, which translates to a cap of about $3,300 out of pocket for brand-name drugs. These benefit design changes will save thousands of dollars for people who take high-cost drugs for cancer, rheumatoid arthritis, and other serious conditions.

If a $2,000 cap on out-of-pocket drug spending had been in place in 2021, 1.5 million Medicare beneficiaries enrolled in Part D plans would have saved money because they spent $2,000 or more out of pocket on prescription drugs that year. This estimate is based on KFF analysis of Medicare Part D prescription drug claims data for enrollees without Part D low-income subsidies in 2021 (the most recent year available for this analysis). Among these 1.5 million enrollees, most (1.0 million or 68%) spent between $2,000 and $3,000 out of pocket, while 0.3 million (20%) had spending of $3,000 up to $5,000, and 0.2 million (12%) spent $5,000 or more out of pocket.

Over the course of several years, however, far more Part D enrollees will stand to see savings from this new out-of-pocket spending cap than in any single year. A total of 5 million Part D enrollees had out-of-pocket drug costs of $2,000 or more in at least one year during the 10-year period between 2012 and 2021, while 6.8 million Part D enrollees have paid $2,000 or more out of pocket in at least one year since 2007, the first full year of the Part D program (Figure 1).

Five Million Medicare Part D Enrollees Spent $2,000 or More Out of Pocket on Prescription Drugs in at Least One Year Between 2012 and 2021

In most states, tens of thousands, if not hundreds of thousands, of Medicare beneficiaries will feel relief from the new Part D out-of-pocket spending cap (Table 1). In California, Florida, and Texas, more than 100,000 Part D enrollees faced out-of-pocket costs of $2,000 or more in 2021, and in another 6 states (New York, Pennsylvania, Ohio, Illinois, North Carolina, and New Jersey), between 50,000 and 82,000 did so. As at the national level, more Part D enrollees in each state will benefit over time. For example, in Iowa, Louisiana, and Maryland, 73,000 Part D enrollees faced out-of-pocket costs of $2,000 or more in at least one year between 2012 and 2021. In Michigan, New Jersey, and Georgia, 148,000, 158,000, and 159,000 Part D enrollees, respectively, spent $2,000 or more in at least one year over this same 10-year period. In Texas, 364,000 Part D enrollees did so; in Florida and California, around 400,000 enrollees or more.

Capping out-of-pocket spending will help Part D enrollees with relatively high drug costs, which may include only a relatively small number of Part D enrollees in any given year but, as this analysis shows, a larger number over time. People who will be helped include those who have persistently high drug costs over multiple years and others who have high costs in one year but not over time. While a cap on out-of-pocket costs will help millions of Part D enrollees over time, higher plan costs to provide the Part D benefit could also mean higher plan premiums, a dynamic that the Inflation Reduction Act’s premium stabilization provision was designed to mitigate. Although KFF polling shows that a relatively small share of older adults is aware of the Inflation Reduction Act’s $2,000 cap on out-of-pocket drug costs for Part D enrollees that takes effect in 2025, millions of them will benefit from this cap in the years to come.

In Most States, Tens of Thousands, if Not Hundreds of Thousands, of Medicare Beneficiaries Will Benefit from the New Part D Out-of-Pocket Spending Cap Over Time

Juliette Cubanski and Tricia Neuman are with KFF. Anthony Damico is an independent consultant.

This work was supported in part by Arnold Ventures. KFF maintains full editorial control over all of its policy analysis, polling, and journalism activities.

State Profiles for Women’s Health

  • Abortion Policies: State gestational limits, waiting periods & ultrasound requirements, insurance coverage and medication abortion restrictions
  • Abortion Data: Share of abortions by age, gestational age and method type
  • Maternal and Infant Health: Data on births by race/ethnicity, teen birth rates, preterm and low weight births, and maternal and infant mortality
  • Demographics: Age distribution, race/ethnicity, poverty level
  • Coverage: Health insurance coverage, ACA Medicaid expansion, Medicaid eligibility levels, Medicaid family planning programs, coverage policies on contraception and fertility care
  • Access and Utilization: Rates of cancer screenings, HPV vaccination, provider visits
  • Health Status: Rates of breast and cervical cancer by race/ethnicity, physical and mental health status, chronic conditions, pre-existing conditions
  • Sexual Health: Data on rates of STIs, HIV infections, cervical cancer screening and incidence
News Release

3 Charts: Drug Prices in the United States

Published: Feb 7, 2024

This post was updated to clarify that less than 10% of the nation’s total health spending is spent on retail prescription drugs and does not include spending on drugs administrated by physicians or in hospitals.Prescription drug costs are a top concern for the American public. While retail prescription drugs represent less than 10% of total U.S. health spending and are not the primary driver of the nation’s high health costs, Americans often pay more for the same prescription drugs than people in other countries spend. Ahead of Thursday’s expected Senate HELP Committee testimony from the CEOs of three major pharmaceutical companies, here are three charts about drug prices in the United States.

1. More than 6 in 10 adults (63%) say that drugs developed over the past 20 years have improved the lives of Americans, though an even larger majority (82%) say drug prices are unreasonable. That may explain why majorities of Republicans, independents and Democrats say there is too little regulation of drug prices and support a wide range of policy actions to rein them in.

2.    List prices for brand-name drugs are often much higher in the U.S. than in other large, wealthy countries. Net prices, which take into account rebates and coupons, also are often higher than in other countries, though it’s hard to say how much due to the lack of transparency in the amount of the rebates. One example: The list prices for the new wave of weight-loss drugs are often more than 4 times higher in the U.S. than in other countries. American paying for these drugs without any help from their health insurance can get Wegovy coupons worth up to $500 per month, but that would still leave them paying more than double the list prices in Germany or the Netherlands.

3.    For the first time, the federal government is negotiating drug prices on behalf of the Medicare program and its beneficiaries as authorized by the Inflation Reduction Act of 2023. Medicare collectively spent about $50 billion in one year on the 10 drugs initially selected for negotiations – drugs that treat diabetes, blood clots, heart failure, psoriasis, rheumatoid arthritis, Crohn’s disease, and blood cancers. The total suggests that there could be significant savings in 2026 and future years as a result of these negotiations. Some affected drug manufacturers and other industry groups are challenging the negotiations process on both constitutional and procedural grounds that, if successful, could end or alter the process.

Learn more:

News Release

Roughly 1 in 5 Adolescents Report Experiencing Symptoms of Anxiety or Depression

Although Some Are Getting Mental Health Care, Many Teenagers Say They Are Not Receiving the Therapy They Need

Published: Feb 6, 2024

About 1 in 5 adolescents report symptoms of anxiety or depression, according to a KFF analysis of a new federal survey of teen health.

While some teens are getting mental health care, a significant share say they are not receiving the therapy they need due to costs, fear of what others will think, and/or not knowing how to get help.

Data from the recently released Teen National Health Interview Survey from July 2021 to December 2022, reveals that 21% of adolescents ages 12-17 report experiencing symptoms of anxiety in the past two weeks, and 17% said they had symptoms of depression. 

Female adolescents were more than twice as likely as their male peers to report feelings of anxiety (31% vs. 12%) and depression (25% vs. 10%) during the survey period. Rates were highest among LGBT+ adolescents, with 43%reporting symptoms of anxiety and 37% saying they had symptoms of depression.

The results of the survey — unique in that they represent direct responses from adolescents themselves, rather than from their parents or guardians – come at a time of heightened concern about the state of American teenagers’ mental health.

The analysis also examines data on the rates of adolescent drug overdoses, suicide and self-harm, by race/ethnicity and sex.  It also examines access to therapy and the share of adolescents who report negative experiences, such as bullying.

While studies have documented rising mental health problems among adolescents in the U.S. for years, the trend was exacerbated by the COVID-19 pandemic. Since 2021, the U.S. Surgeon General has twice issued advisories about the challenges to youth mental health, including the threat posed by excessive social media use. 

Among the other key takeaways from KFF’s analysis:

  • Although some adolescents received mental health care, 20% reported not receiving the mental health therapy they needed because of cost, fear of what others would think, and/or because they didn’t know how to get help. This lack of needed therapy or counseling was more pronounced among female (32%) and LGBT+ adolescents (38%).
  • Deaths due to drug overdose among adolescents have more than doubled in recent years — fueled by the rise of the synthetic opioid fentanyl — increasing from 253 deaths in 2018 to 722 deaths in 2022. The largest increases in these overdose deaths were among Hispanic and Black adolescents.
  • Ninety-two percent of adolescents reported at least two hours of weekday screen time not associated with schoolwork. Research has found that social media use may be associated with poor well-being among youth, with a higher risk of depression for female adolescents. 
  • Many adolescents reported enduring negative experiences such as bullying (34%), emotional abuse by a parent (17%), and neighborhood violence (15%) in 2021 and 2022, all of which can influence mental health.

The full analysis, Recent Trends in Mental Health and Substance use Concerns Among Adolescents, is available here.

Also recently released by KFF are two related analyses: One takes stock of the latest efforts in the states to combat the opioid epidemic and another describes the supply and characteristics of substance use and mental health treatment facilities across the U.S.

  • As Congress discusses reauthorizing the expired 2018 SUPPORT Act, state Medicaid programs are taking active steps to address the opioid epidemic. State Medicaid efforts include improving access to OUD treatment medications, covering over the counter Narcan, and extending OUD treatment to soon-to-be-released inmates–a population at high risk of overdose death upon release. 
  • Low treatment rates for substance use and mental health conditions may be due, in part, to limited treatment options and workforce shortages. In the U.S., there are about 14,700 substance use and 9,500 mental health treatment facilities. Most offer outpatient services, while fewer offer more intensive inpatient or residential care. Facility ownership and insurance participation vary—with private ownership more common in substance use treatment and notable state-by-state variation in many areas. 

Commercialization of COVID-19 Vaccines, Treatments, and Tests: Implications for Access and Coverage

Published: Feb 6, 2024

Originally published in February 2023, this brief was updated on Feb. 6, 2024, to include more recent information.

In response to the unprecedented nature of the COVID-19 pandemic, the federal government spent billions of dollars in emergency funds between 2020 and 2022 to purchase medical countermeasures – vaccines, including boosters, treatments, and tests – and provided them free of charge to the public. In addition, Congress enacted several bills1  that included special requirements for their coverage by both public and private insurers, and the administration issued guidance2  and regulations to protect patient access and promote equitable distribution. The effective dates of many, though not all, of these requirements were tied to the public health emergency (PHE) declaration made pursuant to Section 319 of the Public Health Service Act, first declared in January of 2020 and renewed every 90 days through February 9, 2023, effectively ending the PHE on May 11, 2023. The availability of federally-purchased COVID-19 medical countermeasures ensured that they were provided free to all.

Now that the PHE has ended, the federal government has been transitioning these products to the commercial market, where their provision and availability varies by insurance status and other factors. In some cases, access will be curtailed while in others, the federal government is continuing some programs to assist those with limited coverage. This document provides a side-by-side comparison of how vaccines, treatments, and tests were provided during the PHE and with a federally purchased supply compared to the current situation, organized by payer.

Table 1: COVID-19 VaccinesTable 2: COVID-19 TreatmentsTable 3: COVID-19 Tests

Table 1: COVID-19 Vaccines
PAYERPRIOR STATUS(WITH FEDERAL SUPPLY & § 319 PHE IN PLACE)END OF FEDERAL SUPPLY ANDEND OF § 319 PHE
MEDICAREMedicare covered COVID-19 vaccines, including boosters, for beneficiaries at no cost in traditional Medicare and Medicare Advantage under Medicare Part B. This is due to statutory changes that were made by the CARES Act which added coverage of FDA-approved COVID-19 vaccines to Part B. In addition, CMS issued regulations requiring no-cost Medicare coverage of COVID-19 vaccines that had been granted emergency use authorization (EUA) but not yet licensed by the FDA.

Medicare paid providers for COVID-19 vaccine administration, but not for the vaccine itself, since the vaccine was free to providers through the US government purchased inventory.

Medicare beneficiaries continue to have access to COVID-19 vaccines, including boosters, at no cost under Part B.

With the government-purchased inventory of COVID-19 vaccines now superseded by new commercial products, Medicare determines payment rates and allowances for providers, based on 95% of the average wholesale price, and pays providers for the vaccine itself along with administration of the vaccine.

MEDICAID/CHIPMedicaid and CHIP covered COVID-19 vaccines, including boosters, with no cost sharing for all Medicaid enrollees, including those enrolled in limited benefit coverage, except those eligible only for Medicare cost sharing assistance, per provisions in the Families First Coronavirus Response Act (FFCRA) and the American Rescue Plan Act (ARPA).

States reimbursed providers for the cost of administering the vaccine and received 100% federal matching payments for these costs.

Provisions in the American Rescue Plan Act (ARPA) and the Inflation Reduction Act  (IRA) require Medicaid and CHIP programs to cover all ACIP-recommended vaccines, including COVID-19 vaccines/boosters, with no cost sharing even when the PHE ends and there is no longer any supply of federally purchased vaccines.

States receive 100% federal matching payments for the costs associated with administering the vaccine through the end of the last day of the first quarter that begins one year after the PHE ends (September 30, 2024). After that, state costs will be matched at the state’s regular federal matching percentage (FMAP) and enhanced FMAP for CHIP.

For children on Medicaid, the Vaccines for Children Program (VFC) provides free COVID-19 vaccines. The VFC program purchases the vaccine and makes it available to VFC-registered providers. Providers can bill Medicaid for costs of administering the  vaccines. For other Medicaid and CHIP enrollees, states will pay providers for the vaccine plus an administration fee. These state Medicaid and CHIP costs will be matched at the state’s regular and enhanced (for CHIP) FMAPs.

PRIVATE No one with private insurance should have been asked to pay for federally-purchased COVID vaccines, including boosters, or for vaccine administration while there was a federal supply of vaccines.

Vaccine providers participating in the CDC COVID-19 Vaccination Program (i.e., those receiving federally-purchased vaccine doses) were allowed to seek reimbursement from private health insurers for the cost of administering the vaccine, but they were prohibited from billing patients even if the patient’s health plan did not reimburse the provider or did not cover the full cost of the vaccine administration. Most private insurers reimbursed vaccine providers for administration costs, in part because the Affordable Care Act (ACA) requires most plans to cover preventive services, including any vaccine recommended by the CDC’s Advisory Committee on Immunization Practices (ACIP), as all COVID-19 vaccines in the U.S. are. While the ACA requires coverage of ACIP-recommended vaccines no later than one year after their recommendation, the CARES Act shortened this to 15 days for COVID-19 vaccines. This is irrespective of whether the vaccine is under an emergency use authorization or fully approved by the FDA.

Even in cases when the insurer was not subject to the ACA coverage requirement (e.g. for out-of-network care or grandfathered health plans), the patient could not be billed for the vaccine, its administration, or the associated visit when the vaccine dose was purchased by the federal government.

In cases when private plans did not cover or did not fully cover the cost of administering the vaccine, vaccine providers were at one point able to submit claims for reimbursement from the federal government. However, due to a lack of funding, the federal government stopped accepting these claims on April 5, 2022.

Most people with private insurance will continue to pay nothing out-of-pocket for COVID-19 vaccines/boosters, but there will be exceptions (e.g. in the case of out-of-network care and grandfathered plans) now that federally purchased vaccines are no longer available.

Under the ACA, people enrolled in non-grandfathered plans (i.e., the vast majority of people with private insurance) continue to pay nothing for recommended COVID-19 vaccines and associated appointments, so long as they receive this care from an in-network provider. The requirement that private plans/issuers cover out-of-network COVID-19 vaccines without cost sharing ended when the PHE ended. However, in the unusual event the enrollee is unable to access a vaccine at any in-network provider, the ACA requires plans to cover out-of-network delivery of preventive services.

The ACA’s preventive services coverage requirement does not apply to grandfathered plans and Short-Term Limited Duration (STLD) plans. Therefore, these plans may impose cost sharing or decide not to cover vaccines at all.

Private insurers will be required to take on more of the cost of vaccines (including paying for the doses themselves in the commercial market), which could have a small upward effect on premiums.

UNINSURED Uninsured individuals could obtain COVID-19 vaccines, including boosters, for free  from any provider participating in the CDC COVID-19 Vaccination Program. To participate in the program, providers agreed to provide the vaccine at no cost to every individual regardless of insurance status.

Until April 5, 2022, providers could submit claims for the costs of administering the vaccine to people who were uninsured to the HRSA COVID-19 Uninsured Program, but due to a lack of funding, this program was discontinued.

Fifteen states adopted a temporary option to provide Medicaid coverage for COVID-19 vaccines, testing, and treatment to uninsured individuals and received 100% federal matching funds to cover the costs of providing care. This coverage ended when the PHE ended.

Even with commercialization of COVID-19 vaccines, the government still purchases vaccines for uninsured children to access for free through the VCF Program. VFC providers cannot charge for the cost of the vaccine but can charge an administration fee. Federal funding for this program is mandatory, meaning necessary funding is provided by Congress each year based on the number of vaccines needed to cover eligible children.

Uninsured adults, however, have no guaranteed access to free vaccines recommended for routine use.

To address the lack of guaranteed access to free COVID-19 vaccines, the Biden administration created the “Bridge Access Program”, a public-private partnership to provide vaccine access at local pharmacies, through existing public health infrastructure, and at local health centers. Financed with $1.1 billion in funds already appropriated during the COVID-19 emergency, vaccines are purchased through the CDC’s Section 317 program, which provides vaccines to uninsured adults, and distributed through that network of state and local health departments and community health centers. Additionally, CDC has partnered with three pharmacy chains, providing them with a per-dose payment to support vaccine administration costs. This program will run through December 2024.

(Back to top)

Table 2: COVID-19 Treatments
PAYERCURRENT STATUS(WITH FEDERAL SUPPLY & § 319 PHE IN PLACE)END OF FEDERAL SUPPLY AND/OREND OF § 319 PHE
MEDICAREBeneficiaries in traditional Medicare and Medicare Advantage paid no cost sharing for COVID-19 monoclonal antibody treatments and certain other COVID-19 treatments, including oral antiviral medications authorized by the FDA (Paxlovid and molnupiravir) during the PHE.

Medicare beneficiaries with COVID-19 who received remdesivir during an inpatient stay did not pay separately for the drug, since what patients pay for inpatient hospital stays is generally unrelated to the cost of any services they receive. (Traditional Medicare beneficiaries pay a $1,632 deductible in 2024 and daily copays for extended stays. Medicare Advantage enrollees typically pay a flat amount for each hospital stay and/or day.)

Medicare paid providers for COVID-19 monoclonal antibody treatments (when it was not received by the provider for free through the US government purchased inventory) and made a separate payment for its administration. Medicare did not provide payment for the monoclonal antibody products to treat COVID-19 that health care providers received for free, as was the case upon the product’s initial availability in response to the PHE. While physicians and other Medicare providers and suppliers could not bill Medicare for the product they receive for free, they could be paid for its administration.

During the PHE, oral antiviral medications for COVID-19 were purchased by the US government and distributed directly to pharmacies. As such, there was no direct payment to providers under Medicare for these treatments. CMS issued guidance to Part D plans that they were permitted to pay dispensing fees to pharmacies that submit claims for these products, but not for the product itself if obtained from the federally-purchased supply.

Typically, Part D does not cover drugs that are not approved by the FDA, such as oral antiviral drugs to treat COVID-19 that were authorized for use by the FDA under an Emergency Use Authorization (EUA) prior to receiving full approval by the FDA. The Consolidated Appropriations Act (CAA), 2023 made a temporary change in the definition of a covered Part D drug to explicitly include oral antiviral drugs (such as Paxlovid) authorized for use under an EUA but this coverage will end on December 31, 2024.

COVID-19 oral antiviral treatments (Paxlovid, Lagevrio, and Veklury) have begun to transition to the commercial market (note that monoclonal antibody treatments are no longer being used). Paxlovid and Veklury have been approved by the FDA; Lagevrio has been authorized for emergency use.

The federal government will continue to provide federally-procured Paxlovid for free to Medicare beneficiaries through the end of 2024, whether through Part D plans or a standalone patient assistance program run by the manufacturer (Pfizer). Thereafter, it will only be covered for Medicare beneficiaries in Part D plans, and they may face cost sharing. More generally, oral antivirals are covered by Part D, but beneficiaries may face cost sharing. This is the case for Lagevrio, for which there is no patient assistance program available to Medicare beneficiaries.

Based on changes in the CAA 2023, oral antivirals are covered whether they are authorized for emergency use or approved by the FDA, although the allowance for coverage of drugs available under EUA expires at the end of 2024. Once the supply of oral antivirals fully transitions to the commercial market, Part D plans will pay for the cost of the drug and its administration, and Part D enrollees are expected to face varying cost sharing amounts, since costs vary across Part D plans.

Medicare pays providers who administer COVID-19 treatments for commercially purchased products for both the treatment and its administration.


MEDICAID/CHIPMedicaid and CHIP covered COVID-19 treatments with no cost sharing for full-benefit enrollees, due to provisions in the American Rescue Plan Act (ARPA). These treatments included monoclonal antibody treatments and oral antiviral medications.

States reimbursed providers for COVID-19 monoclonal antibody treatments (when they are not received by the provider for free through the US government purchased inventory) and for the costs related to administering the treatments; states received federal matching payments at the regular and enhanced (for CHIP) FMAPs for these costs.

Oral antivirals were paid for by the federal government, so there was no cost to Medicaid/CHIP for the medications themselves.

Provisions in the American Rescue Plan Act (ARPA) require Medicaid and CHIP programs to cover all drugs and biological products for the treatment or prevention of COVID–19 with no cost sharing for full-benefit enrollees through the end of the last day of the first quarter that begins one year after the PHE ends (September 30, 2024). In addition, the federal government will continue to provide federally-procured Paxlovid for free to Medicaid beneficiaries through the end of 2024.

Once the coverage period mandated by ARPA ends, treatments that have FDA approval will be covered but could be subject to cost sharing requirements and utilization limits. However, whether treatments that are still under emergency use authorization (EUA) – that is, without FDA approval – will be covered will vary by state, based on state decisions.

PRIVATE There was no federal law specifically addressing private insurance coverage of COVID-19 treatment or setting limits on out-of-pocket costs for COVID-19 treatment. However, Affordable Care Act (ACA) requirements that non-grandfathered plans sold to individuals and small businesses cover Essential Health Benefits (like hospitalizations, laboratory services, and prescription drugs) apply to COVID-19 treatments, just as they would to other conditions. Plans may charge cost-sharing, but the ACA annual out-of-pocket maximum limits how much most insurers may impose in cost sharing for in-network services.

Early in the pandemic, most insurers voluntarily waived out-of-pocket costs for COVID-19 treatment. However, most insurers began to reimplement cost sharing by late-2021. Still, oral antivirals were purchased by the federal government during this period and were provided free of charge.

Because there is no federal law specifically addressing how COVID-19 treatment should be covered by private insurance, there was no change with the end of the PHE. People with COVID-19 hospitalizations continue to face cost-sharing, which often exceeds $1,000.

As the federal supply of Paxlovid has been directed toward people who are insured through public programs or uninsured, privately insured individuals now face cost-sharing for these oral antivirals in accordance with their health plan requirements.  Paxlovid’s manufacturer (Pfizer) will operate a copay assistance program for those who are commercially insured through 2028.

With commercialization, private insurers will take on more of the cost of medications like Paxlovid that had previously been supplied by the federal government, and this transition could have a small upward effect on premiums.

UNINSUREDUninsured individuals in the 15 states that had adopted the temporary Medicaid coverage option were able to obtain COVID-19 treatment services, including oral antivirals and monoclonal antibodies, with no cost sharing.

Uninsured individuals in other states were not required to pay for the costs of government-purchased COVID-19 treatments, including oral antivirals and monoclonal antibodies; however, they could be charged for any necessary physician or hospital outpatient visit to obtain a prescription or to administer the treatment, though some were able to access care provided on a sliding-scale from safety-net providers.

With the end of the PHE, the temporary Medicaid coverage option also ended, and uninsured individuals in the states that had adopted the option would face costs for related visits and treatments.  However, in the case of Paxlovid, the federal government announced that those who are uninsured will have free access to federally-procured Paxlovid through 2024, via a patient assistance program and thereafter, the manufacturer (Pfizer) will run a patient assistance program to provide free Paxlovid to uninsured individuals through 2028. For other oral antivirals, there are also patient assistance programs available.

(Back to top)

Table 3: COVID-19 Tests
PAYERCURRENT STATUS(WITH FEDERAL SUPPLY & § 319 PHE IN PLACE)END OF FEDERAL SUPPLY AND/OREND OF § 319 PHE
MEDICAREClinical diagnostic testing, including testing for COVID-19 (as distinct from rapid antigen at-home tests) was covered at no cost for traditional Medicare beneficiaries under Medicare Part B.

In addition, under a Biden Administration initiative, beneficiaries in traditional Medicare and Medicare Advantage had no cost sharing for COVID-19 at-home testing (up to eight tests per month) during the PHE.

A provision in the Families First Coronavirus Response Act (FFCRA) eliminated beneficiary cost sharing for COVID-19 testing-related services, including the associated physician visit or other outpatient visit (such as hospital observation, E-visit, or emergency department services). A testing-related service is a medical visit furnished during the PHE that results in ordering or administering a COVID-19 lab test. The law also eliminated cost sharing for Medicare Advantage enrollees for both the COVID-19 lab test and testing-related services and prohibited the use of prior authorization or other utilization management requirements for these services during the PHE.

Beneficiaries in traditional Medicare continue to receive clinical diagnostic testing for COVID-19 at no cost since Medicare covers their diagnostic lab testing under Part B, but they face cost sharing for testing-related services. However, they have faced the full cost of at-home tests since the PHE ended.


Beneficiaries in Medicare Advantage plans may face cost sharing for clinical diagnostic testing for COVID-19, depending on whether their plan charges cost sharing for this service, and face cost sharing for testing-related services. Some Medicare Advantage plans may cover the cost of at-home COVID-19 tests through an over-the-counter benefit or other coverage approach.

MEDICAID/CHIPUnder the American Rescue Plan Act (ARPA), Medicaid and CHIP programs were required to cover FDA-authorized COVID-19 tests, including at-home COVID-19 tests, without cost sharing for full-benefit enrollees. States could require a prescription for the at-home test or apply medical necessity criteria.Medicaid and CHIP programs must cover COVID-19 testing and testing-related services, including at-home tests, for full-benefit enrollees at no cost through the end of the last day of the first quarter that begins one year after the PHE ends (September 30, 2024).

Once the mandated coverage period ends, states will continue to cover COVID-19 testing as a mandatory laboratory service if the test is ordered by a physician and provided in an office or similar facility. States may continue to cover COVID-19 tests provided without a physician’s order, including at-home tests, as an optional service, but coverage could vary by state. States may also impose cost sharing for the tests and/or testing-related services.

PRIVATE In most cases, people with private insurance were able to receive COVID-19 testing without cost sharing during the PHE.

If the COVID-19 test was considered to be medically appropriate (e.g., for diagnostic purposes or out of a reasonable concern for COVID-19 exposure), private health plans – including grandfathered plans  were required to cover the cost of the test and the associated visit without cost sharing for the duration of the PHE. This coverage requirement applied to both rapid antigen and PCR COVID-19 tests performed or ordered by a provider. During the PHE there was no limit to the number of tests an individual can receive if deemed medically appropriate. Insurers were also required to reimburse for tests performed by out-of-network providers during the PHE.

Additionally, beginning January 15, 2022 and lasting for the duration of the PHE, people with private insurance plans were able to order or seek reimbursement for eight (8) FDA-authorized rapid at-home COVID-19 tests per month. No prescription or medical management was required. Federal guidance allowed for a reimbursement cap of $12 per test in certain circumstances.

If testing was done for a reason that was not medically indicated (e.g., a work-place testing requirement or for public health surveillance purposes), the health plan was allowed to apply cost sharing or refuse to cover the cost of the test altogether. Through the end of the PHE, providers were required to make public the cash price of COVID-19 tests on their websites.

The COVID-19 testing coverage requirements did not apply to Short-Term Limited Duration (STLD) plans, as enrollees in these plans are considered uninsured.

Now that the PHE has ended, most people with private insurance are likely subject to cost sharing for COVID-19 tests. The typical price of a COVID-19 test is roughly $45, and private health plan enrollees will often have to pay at least some portion of that out-of-pocket, and may also face cost-sharing for the physician visit to receive the test. There is no longer a requirement that at-home (over-the-counter) COVID-19 tests continue to be covered.

The Affordable Care Act (ACA) requires non-grandfathered plans sold to individuals and small businesses to cover laboratory services as an Essential Health Benefit (EHB), which includes lab-based or provider administered COVID-19 testing. However, the ACA allows insurers to impose cost sharing (deductibles, coinsurance, and copayments). Insurers may also limit coverage of COVID-19 testing to in-network providers, require a prescription or physician’s order for COVID-19 testing, and impose cost sharing for the associated physician visit. Insurers may also limit the number of tests that are covered.

Although the ACA requires non-grandfathered health plans to cover without cost sharing any preventive service with an “A” or “B” rating from the U.S. Preventive Services Task Force (USPSTF), to date, the USPSTF has not considered, for purposes of rating, any COVID-19 test, meaning that plans may impose cost sharing for the test and the associated visit.

Grandfathered plans are exempt from both the ACA’s EHB and preventive service coverage requirements. With the end of the PHE, these plans can impose cost sharing or stop covering the cost of COVID-19 tests. STLD plans are exempt from the requirement.

UNINSUREDUninsured individuals in the 15 states that had adopted the temporary Medicaid coverage option were able to obtain COVID-19 testing services, including at-home tests, with no cost sharing. This coverage ended when the PHE ended.

Uninsured individuals in other states were not charged for the cost of any test purchased by the federal government but likely paid full cost for any testing-related services. Uninsured individuals could get COVID-19 tests at no cost or on a sliding-scale from local health departments or certain safety providers; however, individuals without access to these providers paid full cost for the test and any testing-related services.

Uninsured individuals have to pay the full cost of COVID-19 tests and testing-related services, although they may be able to obtain free or reduced-cost tests from local health departments or safety net providers. In addition, the CDC operates the Increasing Community Access to Testing (ICATT) for COVID-19 program, which provides no-cost COVID-19 testing for people who are uninsured who are symptomatic or have been exposed to COVID-19.

(Back to top)

  1. Families First Coronavirus Response Act (FFCRA), https://www.congress.gov/bill/116th-congress/house-bill/6201 and KFF summary of FFCRA, https://modern.kff.org/coronavirus-covid-19/issue-brief/the-families-first-coronavirus-response-act-summary-of-key-provisions/; The Coronavirus Aid, Relief, and Economic Security (CARES) Act, https://www.congress.gov/bill/116th-congress/house-bill/748 and KFF summary of the CARES Act, https://modern.kff.org/coronavirus-covid-19/issue-brief/the-coronavirus-aid-relief-and-economic-security-act-summary-of-key-health-provisions/; The American Rescue Plan Act of 2021 (ARPA), https://www.congress.gov/bill/117th-congress/house-bill/1319/text and KFF brief on ARPA Medicaid provisions, https://modern.kff.org/medicaid/issue-brief/medicaid-provisions-in-the-american-rescue-plan-act/; The Inflation Reduction Act of 2022(IRA), https://www.congress.gov/bill/117th-congress/house-bill/5376/text and KFF summaries of health provisions in the IRA, https://modern.kff.org/medicare/understanding-the-health-provisions-in-the-senate-reconciliation-legislation/, and Medicaid changes, https://modern.kff.org/policy-watch/medicaid-and-the-inflation-reduction-act-of-2022/. ↩︎
  2. See, for example, https://www.medicaid.gov/resources-for-states/coronavirus-disease-2019-covid-19/other-agency-guidance/cms-guidance/index.html and https://www.dol.gov/sites/dolgov/files/EBSA/about-ebsa/our-activities/resource-center/faqs/aca-part-51.pdf. ↩︎

Recent Trends in Mental Health and Substance Use Concerns Among Adolescents

Author: Nirmita Panchal
Published: Feb 6, 2024

In light of growing mental health concerns among adolescents in the United States, a National State of Emergency in Child and Adolescent Mental Health was issued in 2021, followed by advisories from the U.S. Surgeon General in 2021 and 2023. This comes at a time when many adolescents have reported adverse experiences, youth drug overdose deaths have spiked, and gun violence has increased. In 2021, 42% of adolescents reported feelings of sadness and hopelessness – which can be indicative of depressive disorder – up from 28% in 2011. Further, a recent KFF poll found that 55% of the public see youth mental health issues as a crisis in the U.S.; and that many children and teenagers are not able to get the mental health services they need.

Data on youth mental health is limited and when it is available, parents or guardians often complete survey questionnaires on behalf of youth in their household. However, the recently released Teen National Health Interview Survey (NHIS-Teen) surveyed adolescents (ages 12-17) directly, which allows for a more direct representation of adolescent mental health. This brief uses the NHIS-Teen data – which was collected for an 18 month period from 2021 to 2022 – to provide an up-to-date analysis of adolescent mental health, utilization of mental health care, and unmet needs and how they vary across demographics, including sex and sexual identity.1  Other survey data collected directly from adolescent populations, including the Youth Risk Behavior Surveillance System (YRBSS) and the National Survey on Drug Use and Health (NSDUH), are included to supplement and provide more context.

Key takeaways include:

  • In 2021 and 2022, 21% of adolescents reported experiencing symptoms of anxiety in the past two weeks and 17% reported experiencing symptoms of depression. Female and LGBT+ adolescents were more likely than their counterparts to report experiencing anxiety or depression.
  • Deaths due to drug overdose among adolescents more than doubled from 2018 (253 deaths) to 2022 (723 deaths). The largest increases in these deaths were among Hispanic and Black adolescents.
  • Suicides are the second leading cause of death among adolescents. These deaths peaked in 2018 but have declined in recent years. In 2022, suicide death rates were highest among American Indian and Alaska Native adolescents (22.2 per 100,000) followed by White adolescents (7.2 per 100,000). Adolescent males had higher rates of suicide compared to their female peers (8.1 vs. 3.8 per 100,000) in 2022; however, thoughts of suicide and suicide attempts were higher (and increased faster) for females.
  • In 2021 and 2022, 20% of adolescents reported receiving mental health therapy and 14% reported taking prescription medication. In general, LGBT+ and female adolescents were more likely to report receiving treatment than their counterparts.
  • Many adolescents reported adverse experiences, including bullying (34%), emotional abuse by a parent (17%), and neighborhood violence (15%) in 2021 and 2022. Ninety-two percent of adolescents reported extended use of screens, which can also negatively impact mental health and well-being.

What share of adolescents experience poor mental health and how does that vary?

Approximately one in five adolescents reported experiencing symptoms of anxiety or depression (Figure 1). In 2021 and 2022, 21% of adolescents reported experiencing symptoms of anxiety in the past two weeks and 17% reported experiencing symptoms of depression. Anxiety and depression can co-occur with other mental health disorders and are associated with suicide and substance use. Additionally, these conditions can impact school attendance and performance among youth.

Share of Adolescents Reporting Symptoms of Anxiety or Depression in the Past Two Weeks by Sex and Sexual Identity

Female adolescents were more likely than their male peers to report anxiety (31% vs. 12%) and depression (25% vs. 10%) in 2021 and 2022 (Figure 1). These differences among adolescents by sex are consistent with other historical survey data on experiences of poor mental health. In recent years, other indicators of poor mental health, including self-harm and eating disorders, which commonly co-occur with anxiety, have increased, particularly among adolescent females. Analyses of emergency department visits, hospital admissions, and privately-insured youth found that, compared to prior to the pandemic, the presentation of eating disorders increased sharply for adolescent females. Historically, eating disorders affect females more than males. Eating disorders can be very harmful for physical health and even result in death.

In 2021 and 2022, LGBT+ adolescents were more likely than their non-LGBT+ peers to report anxiety (43% vs. 14%) and depression (37% vs. 11%) (Figure 1). Prior survey data has found similar differences in experiences of poor mental health between LGBT+ and non-LGBT+ adolescents.

While data on racial and ethnic groups from NHIS-Teen is not included in this analysis, data from NSDUH and YRBSS shows little variation in mental health conditions among adolescents by racial and ethnic groups. For example, in 2022, 20% of adolescents experienced a major depressive episode in the past year, with no significant differences across racial and ethnic groups. The 2021 YRBSS survey found that the share of Hispanic high school students that reported persistent feelings of sadness and hopelessness (46%) – which can be indicative of depressive disorder – was slightly higher than the share reported by their White (41%), Black (39%), and Asian peers (35%). However, mental health conditions among adolescents of color may be underreported as a result of underdiagnosis, gaps in culturally sensitive mental health carestructural barriers, and stigma associated with accessing care. Note that the NHIS-Teen survey data does not disaggregate data on non-Hispanic adolescents by racial groups and, therefore, was not included in this analysis.

Deaths due to drug overdose among adolescents more than doubled since the onset of the COVID-19 pandemic, largely driven by the synthetic opioid, fentanyl. After remaining stable for several years, KFF analysis of CDC WONDER data found that drug overdose deaths among adolescents increased from 253 deaths in 2018 to 723 deaths in 2022 (Figure 2). During the same period, the share of these overdose deaths involving opioids increased from 57% to 78%.

Nearly Four out of Five Adolescent Drug Overdose Deaths Involved Opioids in 2022

Although White adolescents continue to account for the largest share of adolescent drug overdose deaths, Black and Hispanic adolescents have experienced the fastest increase in these deaths in recent years. In 2022, White adolescents accounted for 49% of total adolescent drug overdose deaths, down from 63% in 2018.2  This decrease reflects the rapid increase in drug overdose deaths among adolescents of color since the onset of the pandemic. By 2022, the drug overdose death rate of both Hispanic and Black adolescents (3.3 and 2.8 per 100,000) surpassed the overdose death rate of White adolescents (2.7 per 100,000) (Figure 3). Further, these drug overdose death rates increased more than fourfold among Hispanic and Black adolescents compared to prior to the pandemic.

Drug Overdose Death Rates Have Increased Faster Among Black and Hispanic Adolescents

Since the COVID-19 pandemic began, drug overdose deaths increased for both adolescent males and females, with an initial spike among males. From 2018 to 2022, the drug overdose death rate more than doubled among adolescent males (from 1.1 to 3.0 per 100,000) and females (from 1.0 to 2.5 per 100,000) (Figure 3).

Although drug overdose deaths among adolescents have increased, their use of some substances has declined over time. YRBSS data from 2011 to 2021 shows declines in adolescent use of several substances, including current alcohol use (from 39% to 23%), current marijuana use (from 23% to 16%), and ever used illicit drugs (from 19% to 13%). However, findings on whether substance use has increased among adolescents during the pandemic are mixed. Some research has shown that substance use decreased in 2021 among adolescents and then largely held steady in 2022. Other research found that among high school students who used substances prior to the pandemic, nearly one in three reported increases in substance use in 2021. Early initiation of substance use is associated with increased risk of addiction later in life.

Mental health and substance use issues can often co-occur among adolescents. Data from NSDUH found that adolescents experiencing a past year major depressive episode in 2022 were more likely than peers to have used illicit drugs (26% vs 12%) and marijuana (22% vs 9%) in the past year, misused opioids (3% vs 1%) in the past year, and engaged in binge drinking (6% vs 3%) in the past month. In total, 4% of adolescents reported both a past year major depressive episode and substance use disorder in 2022. A recent analysis found that 41% of youth ages 10-19 that died from a drug overdose between 2019 and 2021 had a documented mental health condition.

How have suicide and self-harm among adolescents changed in recent years?

In the past decade, CDC data show that adolescent deaths due to suicide increased and peaked in 2018 (1,750 deaths) before slowing and declining by 2022 (1,540 deaths). Suicide remains the second leading cause of death among adolescents.3  However, from 2021 to 2022, the adolescent suicide death rate decreased by 8% (from 6.5 to 6.0 per 100,000) while the total population suicide death rate slightly increased. It is possible that some suicides are misclassified as drug overdose deaths since it can be difficult to determine whether drug overdoses are intentional. Forty-four percent of adolescent suicides were by firearm in 2022, compared to 40% in 2012.4 

The rate of suicide deaths is increasing faster among adolescents of color compared to their White peers. Suicide death rates remain highest among American Indian and Alaska Native (AIAN) adolescents; in 2022, the death rate for AIAN youth was three times higher than White youth (22.2 vs. 7.2 per 100,000, respectively; Figure 4). Although their suicide death rates were lower than White adolescents, Black, Asian, and Hispanic adolescents experienced larger increases in these death rates from 2012 to 2022 (129%, 48%, 30%, respectively; Figure 4) compared to their White peers (26%). Further, in 2021, Black high school students were more likely to report attempting suicide than their Asian, Hispanic, and White peers.

Suicide Death Rates Among Adolescents, by Race/Ethnicity and Sex, 2012-2022

Among adolescents, male suicide rates are more than double the rates among females. Although the suicide death rate among adolescent females has increased faster than their male counterparts over the past decade, the adolescent female suicide death rate remains significantly lower than the death rate of their male peers (3.8 vs. 8.1 per 100,000 in 2022) (Figure 4). However, the share of adolescent females reporting serious thoughts of suicide remains higher and has increased faster over time (from 19% in 2011 to 30% in 2021) compared to adolescent males (from 13% in 2011 to 14% in 2021). Similar trends were seen in suicide attempts: from 10% in 2011 to 13% in 2021 among adolescent females, and from 6% to 7% over the same period for adolescent males. Additionally, as the pandemic progressed, emergency department visits for suicide attempts increased among adolescents, primarily driven by females.

LGBQ+ adolescents are more likely to experience suicidal thoughts compared to their heterosexual peers. Data from YRBSS found that in 2021, higher shares of LGBQ+ adolescents reported serious thoughts of suicide (45% vs. 15%) and suicide attempts (22% vs. 6%) compared to heterosexual adolescents.5  Data on suicide deaths by LGBQ+ identity were not available.

What share of adolescents report receiving mental health treatment in the past year and how does that vary?

Access to and sources of mental health services

Among all adolescents, 20% reported receiving mental health therapy or counseling and 14% reported taking prescription medication for mental health in the past year (Figure 5). LGBT+ adolescents were more likely to report receiving mental health therapy or counseling (35%) and prescription medication (24%) for mental health in the past year than their counterparts (15% and 11%, respectively). Higher shares of female adolescents reported receiving mental health therapy or counseling compared to their male peers (24% vs. 16%).

Share of Adolescents Who Received Mental Health Treatment in the Past Year

Among adolescents with a past year major depressive episode, mental health services were most often accessed through outpatient care and telehealth. Data from NSDUH found that in 2022, 19.5% of adolescents (or 4.8 million) had a past year major depressive episode. Major depressive episode refers to a period of at least two weeks when an individual experienced a depressed mood or loss of interest or pleasure in daily activities and had a majority of specified depression symptoms. Among these adolescents with a past year major depressive episode, 48% received mental health services in an outpatient setting, which includes general medical and education settings (Figure 6). Thirty-four percent of adolescents with a past year major depressive episode received mental health care via telehealth (care received via phone or video from a therapist or other health care professional) in 2022. Additionally, 8% of adolescents with a past year major depressive episode accessed mental health care at emergency departments. There has been an uptick in mental health-related emergency visits in recent years; however, emergency departments may have limited capacity to address psychiatric illnesses.

Sources of Mental Health Services Among Adolescents With a Past Year Major Depressive Episode

Unmet need for mental health services

Although some adolescents received mental health care, 20% reported not receiving the mental health therapy they needed because of cost, fear of what others would think, and/or they did not know how to get help (Figure 7). This lack of needed therapy or counseling was more pronounced among female (32%) and LGBT+ adolescents (38%). While data on racial and ethnic groups from NHIS-Teen is not included in this analysis, other KFF analyses have found that receipt of mental health treatment is generally lower among people of color compared to their White peers.

Share of Adolescents Who Did Not Receive Needed Mental Health Therapy or Counseling in the Past Year

Other factors that may contribute to limited mental health care access among adolescents include insurance barriers, a lack of providers, and the absence of culturally competent care. Additionally, in light of the COVID-19 pandemic, access and utilization of mental health care may have worsened. Among Medicaid and CHIP beneficiaries, utilization of mental health services declined by 25% for beneficiaries 18 and younger from March 2020 to July 2022 compared to prior to the pandemic; and utilization of substance use disorder services declined by 31% for beneficiaries ages 15-18 during the same period. Nearly two out of five children under the age of 18 in the U.S. are Medicaid or CHIP beneficiaries.

Although adolescent drug overdose deaths have increased, access to buprenorphine and residential addiction treatment facilities is limited. The dispensing of buprenorphine, a medication approved to treat opioid use disorder, is low among adolescents. Additionally, many residential addiction treatment facilities do not have availability for adolescents and are costly. These facilities often do not provide buprenorphine to adolescents with opioid use disorder.

If untreated, mental health conditions can persist into adulthood and limit quality of life. In 2021 and 2022, just over half of teens (55%) reported discussing their mental or emotional health with their health care provider in the past year; and only 20% reported discussing transitions in their health care services that will go into effect when they turn 18.

What experiences among adolescents may negatively impact their mental health and well-being?

Many adolescents report negative experiences that can impact their mental health and well-being, including bullying (34%) and, specifically, electronic bullying (11%) (Figure 8). Higher shares of LGBT+ adolescents reported experiencing bullying (49%), and electronic bullying (23%), compared to their peers (28% and 8%, respectively). Bullying can increase the risk of mental health conditions, substance use, and self-harm. Electronic bullying may be associated with depression among youth and is more often experienced by female and sexual minority youth compared to their peers.

Share of Adolescents Who Experienced Bullying in the Past Year

Adolescents are also spending more time on screens, including social media, which may lead to depression and poor well-being. Ninety-two percent of adolescents reported at least two hours of weekday screentime not associated with schoolwork. Emerging research has found that both smartphone use and social media use may be associated with poor well-being among youth, with a higher risk of depression for female adolescents. Social media use can also lead to difficulties with sleep and maintaining attention.

Many adolescents report adverse experiences which can lead to both mental and physical health concerns. In 2021 and 2022, 21% and 18% of adolescents reported living with a household member experiencing mental illness or substance use issues, respectively; 17% reported emotional abuse by a parent or adult in their household; 15% reported neighborhood violence; and 11% reported having a parent in jail or prison. Adverse childhood experiences are linked to mental illness, substance use, and chronic physical health problems in adolescence and can extend into adulthood. Social supports, including relationships with peers, can be a protective factor among adolescents in the face of adverse experiences. However, only 50% of adolescents reported having peer support “a lot of the time” in 2021 and 2022.

Gun violence continues to rise and may lead to negative mental health impacts among children and adolescents. An increasing number of children and adolescents have been exposed to gun violence in recent years. School shootings have increased and, beginning in 2020, firearms became the leading cause of death among children and teens ages 19 and below. Children and adolescents may experience negative mental health impacts, including symptoms of anxiety, in response to school shootings and gun-related injuries or deaths in their communities. Youth antidepressant use has also been shown to increase following exposures to fatal school shootings.

Looking Ahead

National efforts to address youth mental health concerns include recommendations for mental health screenings and strengthening social media safety protocols, and federal legislation to expand school-based mental health services. The U.S. Preventive Services Task Force put forth recommendations for youth anxiety and depression screenings and the U.S. Surgeon General also issued several advisories, including an advisory on youth mental health and social media that highlights potential solutions for strengthening social media safety protocols and encouraging digital and media literacy. Recently, the U.S. Senate Judiciary Subcommittee held a hearing on the impact of social media on youth mental health and well-being. In light of the increase in mental health-related pediatric ED visits, the American Academy of Pediatrics, the American College of Emergency Physicians and the Emergency Nurses Association released a statement including recommendations to improve care for mental health emergencies. Recent legislation allows for the expansion of school-based mental health care through a number of strategies, including growing the number of school-based mental health providers, leveraging Medicaid to further build out services, and providing trauma care to students.

At the state and local level, initiatives to improve access to youth mental health care include promoting school-based Medicaid behavioral health services and connecting youth to virtual care at no cost. State Medicaid programs have taken a variety of approaches to promote access to Medicaid behavioral health services provided in schools. These include working closely with local education agencies, taking advantage of the reversal of the free care policy, and increasing reimbursements for school-based providers. Local initiatives have also been proposed, including a partnership with New York City’s Department of Health and Mental Hygiene and the mental health app Talkspace to allow for teenagers to connect virtually with licensed therapists at no cost. However, the quality and clinical effectiveness of emerging mental health apps remains unclear. Looking ahead, data on adolescent populations will be pivotal in understanding how to further address and mitigate rising mental health and substance use concerns.

This work was supported in part by the Well Being Trust. KFF maintains full editorial control over all of its policy analysis, polling, and journalism activities.

  1. The NHIS-Teen data does not disaggregate data on non-Hispanic adolescents by racial groups and, therefore, was not included in this analysis. ↩︎
  2. Drug overdose death distributions by race and ethnicity do not include non-Hispanic individuals of more than one race. KFF analysis of CDC WONDER. Accessed at: https://wonder.cdc.gov/mcd-icd10-provisional.html ↩︎
  3. KFF analysis of Centers for Disease Control and Prevention, National Center for Injury Prevention and Control. Web-based Injury Statistics Query and Reporting System (WISQARS). Accessed at: https://webappa.cdc.gov/sasweb/ncipc/leadcause.html ↩︎
  4. KFF analysis of Centers for Disease Control and Prevention, National Center for Injury Prevention and Control. Web-based Injury Statistics Query and Reporting System (WISQARS). Accessed at: https://wisqars.cdc.gov/fatal-reports ↩︎
  5. The 2021 YRBSS did not include questions on gender identity. ↩︎

State Approaches to Addressing the Opioid Epidemic: Findings from a Survey of State Medicaid Programs

Authors: Heather Saunders and Kathy Gifford
Published: Feb 6, 2024

Opioid overdoses rose to 81,051 in 2022, a slight increase from 80,411 in 2021, but a substantial 63% jump from 2019 (49,860). The sharp rise in recent years is mainly due to fentanyl, as the illicit supply of this drug has risen substantially. Notably, rises in overdose deaths have been particularly sharp among people of color and young people. Adding to these data, recent KFF polling shows that 29% of adults say either they or a family member have experienced an opioid addiction. Three medications for opioid use disorder (MOUD) are FDA approved: methadone, buprenorphine, and naltrexone. Under the SUPPORT Act (major legislation passed in 2018 to address the opioid epidemic) these medications must be covered by Medicaid through 2025.1  Many provisions of the SUPPORT Act expired in September 2023 and Congress continues to debate legislation to reauthorize some expiring provisions and adopt new policies to address the opioid epidemic. There are a variety of efforts at the state level to address the epidemic. State Medicaid programs play a particular role in the opioid epidemic, covering nearly 40% of people with opioid use disorder (OUD).

To better understand how states are using Medicaid to help address the opioid epidemic, the 23rd annual Medicaid budget survey, conducted by KFF and Health Management Associates (HMA) asked about the following specific strategies adopted or planned by state Medicaid officials for state fiscal years (SFYs) 2023 and 2024 to address the opioid epidemic: removing prior authorization for buprenorphine (a medication treatment for OUD), reimbursing for the initiation of buprenorphine treatment via telehealth, covering over-the-counter (OTC) Narcan, and implementing other initiatives. Key takeaways include:

  • Most states have removed prior authorization requirements for certain buprenorphine treatments, but other barriers remain and are complicated by the fentanyl epidemic. Prior authorization requirements for standard buprenorphine treatment have decreased substantially in recent years, but other hurdles, such as counseling mandates or prior authorization requirements for higher doses—potentially necessary for treating people who used fentanyl—still remain.
  • Most Medicaid programs cover buprenorphine induction via telehealth, but this policy is dependent on evolving federal regulations. Over three-quarters of states provide fee-for-service (FFS) reimbursement for buprenorphine induction over telehealth, but the future of this policy is subject to evolving federal regulations on prescribing controlled substances via telehealth.
  • At least one-third of states have or plan to add OTC Narcan to FFS Medicaid OTC formularies. One-third of states commented on plans or actions to add over the counter Narcan to their state’s FFS formularies. Increased accessibility may also be impacted by effective Medicaid communication about OTC reimbursement policies and procedures.
  • A number of states are pursuing options to add pre-release Medicaid coverage for incarcerated populations. At the time of the survey, two states secured CMS approval to provide Medicaid coverage to incarcerated individuals before release, including OUD treatment. As of January 2024, two states (California and Washington) have obtained CMS approval, and 15 other states have waivers pending.

Opioid Use Disorder Treatment without Prior Authorization

Medicaid programs must cover medications to treat OUD, like buprenorphine and methadone, but the actual access to these medications may vary for a variety of reasons, including utilization management strategies such as prior authorization (PA) that vary across Medicaid FFS programs and managed care organizations (MCO). In states without PA, patients may have longer buprenorphine treatment episodes, and Medicare data suggests that removing PA can reduce hospital and emergency department use. Although a number of states have enacted laws prohibiting PA for medications to treat OUD, many have not, leaving PA policy decisions up to the state Medicaid programs and sometimes their contracted health plans.

As of SFY 2024, most states no longer require prior authorization for at least one standard formulation of buprenorphine medication therapy under fee-for-service (FFS), reflecting a policy shift in recent years. As of SFY 2024, nearly all states cover at least one standard formulation and dosage of oral buprenorphine, such as buprenorphine-naloxone, without PA (Figure 1).2  Just a few years ago, in 2018, MACPAC reported that 30 states required PA for buprenorphine-naloxone, but as of SFY 2024, only a small number of Medicaid programs still have that requirement for at least one standard formulation or dosage. Many states impose PA requirements on non-standard forms of buprenorphine, such as higher doses or buprenorphine monotherapy, and PA requirements may vary across Medicaid managed care organizations within a state. Categorizing prior authorization policy is complex due to rapidly evolving policies and differences in prior authorization requirements that can vary across dosing, formulations, and populations.3 

Most States Report No Prior Authorization (PA) for At Least One Standard Oral Buprenorphine Formulation under FFS

Even though most states removed prior authorization requirements for certain buprenorphine treatments, enrollees may still encounter ongoing and emerging barriers, including policies that have not yet adapted to the spread of the more potent fentanyl. While many states removed prior authorization for specific buprenorphine formulations, they often maintain prior authorization for higher doses. Yet, some physicians report that higher dosing may be necessary for patients with a history of fentanyl use, and research shows that higher dosing has implications for treatment retention. Beyond prior authorization policies, some states impose other criteria such as urine screening requirements, quantity limits, and counseling mandates—additional restrictions that may impact access to or retention in care. Provider reimbursement rates may also play a role in attracting workforce to provide services.

Coverage of Buprenorphine Treatment Initiation via Telehealth

During the COVID-19 Public Health Emergency (PHE), the Drug Enforcement Administration (DEA) temporarily relaxed federal regulations to allow patients to start buprenorphine treatment for OUD via telehealth, eliminating the initial in-person visit requirement. This change boosted access and retention in care without increasing buprenorphine-related overdoses, and may have also helped to mitigate workforce shortages. While most states expanded telehealth coverage for behavioral health services in both FFS and managed care programs during the PHE, the extent of telehealth coverage for buprenorphine treatment varies by state, as Medicaid programs individually set their telehealth policies, as long as they are aligned with federal and state policy. Recently, the DEA, jointly with the Department of Health and Human Services, authorized a second temporary extension of COVID-19 telemedicine flexibilities, which continues the pandemic-era policies that allow controlled substance prescribing without an initial in-person visit through the end of 2024.

Over three-quarters of states reported covering buprenorphine induction via telehealth under fee-for-service in SFY 2023. However, six states did not allow this coverage, and one state reported plans to discontinue coverage. The continuation of this policy is dependent on federal regulations pertaining to telehealth and prescribing of controlled substances. During the pandemic, federal regulations were relaxed to facilitate treatment access, allowing buprenorphine to be prescribed via telehealth without an in-person visit–a temporary measure set to expire on December 31st 2024. However, state policies can still mandate in-person visits, potentially complicating treatment access in those states.

Most Medicaid Programs Cover Buprenorphine Treatment Induction for OUD via Telehealth Due to Temporary Changes in Federal Policy

Coverage of Over-the-Counter Narcan

Naloxone, commonly known as Narcan, a life-saving medication that can reverse opioid overdoses, is now available over the counter as a nasal spray. While the FDA has approved two versions of OTC Narcan, only one is currently available in pharmacies. Its price tag, roughly $45 for a 2-dose, 4mg nasal spray, may be unaffordable for many who lack OTC insurance coverage including Medicaid enrollees in states that have not added OTC Narcan to their Medicaid OTC formularies and/or required their MCOs to do so. To obtain federal matching funds, federal Medicaid law also requires Medicaid enrollees to obtain a prescription for covered OTC products – another hurdle that may impede access. The most recent KFF budget survey asked states about their strategies to enhance enrollee access to OTC Narcan and many states offered comments regarding their coverage or planned coverage of OTC Narcan.

About one-third of states reported that they had added or planned to add OTC Narcan to their state’s OTC formularies. This is likely an undercount of states currently covering OTC Narcan as not all states chose to specifically comment on their Medicaid coverage policy. In addition to adding OTC Narcan to their formularies, Massachusetts commented that Narcan is exempt from Medicaid copay requirements and California mentioned the state’s Naloxone Distribution Project ships free naloxone directly to eligible entities such as law enforcement, schools, community organizations, and city, county, and Tribal organizations. Other states mentioned standing order policies or other initiatives that make it easier for pharmacists to dispense Narcan. Although these policies might make it easier for enrollees to access OTC Narcan, factors such as clear enrollee communication about the reimbursement for OTC Narcan, where Narcan is placed in stores, and Narcan access for family members may also play a role in its overall accessibility.

Other State Initiatives

States were asked about other Medicaid initiatives to combat the opioid epidemic.

The most frequently mentioned initiative was the pursuit of Section 1115 Demonstration Waiver authority to cover OUD services for inmates prior to release. At the time of the survey, two states obtained CMS approval (California and Washington) and 14 states had waiver requests under review for these demonstration projects under section 1115, which permits Medicaid programs to provide services before inmate release (including OUD treatment). As of January 2024, two states have approvals and an additional 15 states have re-entry waiver requests under CMS review. Following release from prison, individuals face a significantly higher risk of overdose and death, primarily from opioids, with a study in one state showing a 40 times greater risk of opioid overdose in the first two weeks after release compared to the general public. In states that expanded Medicaid, most individuals recently released from prison meet income and eligibility requirements for Medicaid coverage, but the Medicaid Inmate Exclusion Policy under federal Medicaid law prohibits federal dollars from paying for health care services of inmates in most cases. CMS guidance requires that states seeking pre-release waivers must cover medication-assisted treatment, but other details vary.

States reported other initiatives; some that are specific to Medicaid and others that are broader:

  • Expanding access to services by removing copays, expanding provider types, or adjusting reimbursement. For example, Maryland added coverage of peer recovery support services for SUD services provided at specific locations and Indiana began to reimburse Opioid Treatment Programs using a weekly bundled rate, rather than a per diem rate. More broadly, Medicaid programs are continuing to broaden coverage for mental health and substance use disorder services. In FY 2023 and 2024, more than a third of states reported benefit enhancements or additions and about three-quarters of states reported increases or plans to increase, the fee-for-service payment rates for at least one type of behavioral health provider.
  • Innovative programs or solutions. Some states are testing out new delivery methods or innovative programs. For example, Delaware submitted a waiver amendment to allow coverage for contingency management Texas is continuing to provide services under the Maternal Opioid Misuse (MOM) model to provide treatment services to pregnant women with OUD. Often, state efforts involve collaborations that span across several state agencies. For example, Arizona is working to expand access to mobile opioid treatment programs to bring treatment to those in underserved areas and is partnering with other state agencies to coordinate an opioid response plan. Vermont has a longstanding approach, Hub and Spoke model, to address OUD that spans multiple agencies.
  • Alternative opioid treatment or safe opioid prescribing. Other states are working to reduce reliance on prescriptions opioids. For example, Idaho and Alaska reported focusing on safe opioid prescribing policies and Pennsylvania reported revising prior authorization guidelines for opioid prescriptions. Missouri’s health plans offer a program intended to help provide alternatives to opioids for the treatment of chronic pain.

Looking ahead

Despite recent increased access to OUD treatment, a notable treatment gap remains as one-third of diagnosed Medicaid enrollees are not receiving treatment. This issue is particularly acute among Black people, youth, and those with disabilities, where substantial disparities in access to MOUD persist. Behavioral health workforce shortages, prevalent across the continuum of behavioral health services and provider types, are also present in Medicaid– along with a lack of provider diversity and few culturally competent care options. Medicaid programs in many states are addressing these challenges by implementing strategies to address workforce shortages and by using managed care contracts to address and reduce disparities, with some efforts specifically focused on reducing disparities in substance use disorders. Regulatory authorities recently made permanent the pandemic-era policy that allows opioid treatment patients to take home methadone doses, previously dispensed only onsite.

Both the House and Senate are engaged in reauthorizing the recently expired SUPPORT Act, though the outcome remains uncertain. The House passed a bill to reauthorize and extend the Act, focusing on reauthorizing programs and expanding support for prevention and treatment, workforce initiatives, and programs to address trauma. The House bill also includes several Medicaid-specific measures, such as making permanent the requirement that states cover medications for opioid use disorder, such as buprenorphine and methadone. Other Medicaid specific provisions include making the state plan amendment option to allow payment for treatment in institutions of mental disease (IMD) permanent, preventing Medicaid disenrollment due to incarceration, and expanding the CMS substance use disorder data book to include mental health conditions. It also proposes classifying Xylazine as a controlled substance and reevaluating the drug scheduling for medications that combine buprenorphine and naloxone (generally considered lower risk). The Senate will soon debate a separate version of the SUPPORT Act reauthorization, although the full details are not yet available. The Senate HELP Committee also marked up another bill aimed at broadening access to methadone by extending prescribing privileges to qualified practitioners outside of federally registered opioid treatment programs and allowing dispensing at pharmacies. Further, the FEND off Fentanyl Act, a bill that has recently been attracting attention, focuses on reducing the illicit supply of fentanyl.

Broader state-level opportunities and challenges are at play in efforts to address the opioid epidemic. States are deciding how to use opioid settlement funds, but questions about state spending decisions and transparency have been raised. While some states and counties are using the funds to invest in treatment for uninsured, expand treatment infrastructure, and increase access to naloxone, some counties have made more questionable decisions–such as using the settlement funds to plug holes in debt or purchase police patrol cars. Meanwhile, innovative state approaches to address the opioid epidemic have also emerged. For example, Pennsylvania built a “warm handoff” program, which offers direct referrals to SUD treatment for overdose survivors, enhancing access to care. Similarly, to combat overdoses, some states are investing funds in installing vending machines stocked with Narcan. Despite these efforts, some state policies may present obstacles. For example, state laws that treat fentanyl test strips as drug paraphernalia and a lack of protections for individuals who prescribe or administer Narcan during an overdose may hinder progress in reducing opioid overdoses.

Medicaid unwinding may lead to loss or interruptions in coverage for people who depend on Medicaid for OUD treatment, potentially disrupting their access to necessary treatment and increasing the risk of overdose and death. The recent resumption of Medicaid renewals following a three-year pandemic halt – ‘Medicaid unwinding’ – has led to millions individuals losing Medicaid coverage, primarily due to procedural reasons. Many people who lose Medicaid have alternative insurance options. However, for those who rely on Medicaid to cover OUD treatment, the loss of Medicaid coverage could disrupt their access to ongoing OUD treatment. Such a loss may disrupt treatment and increase overdose risks, especially in the midst of the ongoing fentanyl crisis that is recently further complicated by emerging threats like Nitazenes and Xylazine.

This brief draws on work done under contract with Health Management Associates (HMA). Kathleen Gifford is an expert on state Medicaid programs and a Principal at HMA.

  1. According to a recent OIG report, Hawaii, South Dakota, and Wyoming were granted an exception from the SUPPORT requirement to cover all FDA-approved MOUD. However, the report found that all these programs covered or reimbursed buprenorphine or naltrexone in 2021. ↩︎
  2. While TN has no FFS enrollees, outpatient drug coverage for all TennCare enrollees is provided through a single PBM that imposes reduced buprenorphine PA requirements on prescribers participating in the state’s “BESMART” medication assisted treatment (MAT) provider network. PA may be required for providers outside of this network. ↩︎
  3. KFF considers states as having “no prior authorization” for buprenorphine products used in OUD treatment if they offer at least one type of buprenorphine medication (brand or generic, solo or combined with naloxone) without prior authorization requirements, despite possible age or dose limits. Other studies on buprenorphine prior authorization might differ by lookup dates, formulations, and other methodological differences, leading to differences in reported counts across studies. ↩︎
News Release

Low Incomes, Little Savings: Many Medicare Beneficiaries Have Modest Financial Resources to Draw Upon in Retirement 

Published: Feb 5, 2024

A new KFF analysis shows that most Medicare beneficiaries live on relatively low incomes and have modest financial resources for retirement – posing a risk to their economic well-being, particularly if they were to have a major, unanticipated expense, such as a need for long-term nursing home care.

The financial picture is especially bleak among Black and Hispanic Medicare beneficiaries, who tend to have lower incomes, savings, and home equity than White beneficiaries, the analysis shows. Women have lower incomes and less savings than men, and beneficiaries’ income and savings tend to decline with age.Key takeaways from the analysis include:

  • Overall, 1 in 4 Medicare beneficiaries, or 16.3 million people, lived on incomes below $21,000 per person in 2023, while half (32.6 million people) lived on incomes below $36,000 per person.   Median per capita income was higher among White Medicare beneficiaries ($40,750) than among Black ($27,250) or Hispanic ($19,800) beneficiaries, and lower among women than men ($33,750 vs. $38,950).
  • One in 4 Medicare beneficiaries had savings below $16,950 per person in 2023, while half had savings below $103,800 per person. Ten percent of seniors had no savings at all or were in debt.
  • Disparities in savings by race and ethnicity were substantial. Median savings among White beneficiaries ($158,950 per person) was more than seven times higher than among Black beneficiaries ($22,100), and more than eight times higher than among Hispanic beneficiaries ($20,050). More than one in five Black and Hispanic beneficiaries (22% and 21%) had no savings or were in debt, compared to 7% of White beneficiaries.

Having limited income and savings may prove challenging for Medicare beneficiaries as they grow older, particularly for older women, who tend to live longer than men and may be more likely to need expensive long-term services and supports. Nationally, the median annual cost of a private room in a nursing home was $108,405 in 2021 – more than the average Medicare beneficiary has in savings — and $54,000 for an assisted living facility. (Medicare does not cover such care except in limited circumstances. Some poorer beneficiaries may also qualify for Medicaid, the nation’s primary payer for nursing home care.) The full analysis of the income, assets, and home equity of Medicare beneficiaries, overall and by age, race and ethnicity, and gender, is available on kff.org. The analysis relies on data derived from the Urban Institute’s Dynamic Simulation of Income Model (DYNASIM4) for 2023.