News Release

Poll: Costs Are the Top Health Care Issue for Voters in the Midterms, But Fraud Tops Republicans’ List As Trump Administration Pushes Crackdown

Voters More Likely to See Fraud in the Tax System, Defense, and Foreign Aid Than Health Programs and Least Likely to See It in the ACA Marketplaces

Published: Jul 16, 2026

Health care costs top the list of voters’ health care priorities for the midterm elections, with half (51%) of all voters and more than half of Democratic (60%) and independent (55%) voters saying the issue is extremely important for candidates to talk about, according to a new KFF Health Tracking Poll. At the same time, Trump administration statements about and actions targeting suspected health care fraud appear to be registering with Republican voters—more than half (55%) of whom say it is extremely important for candidates to discuss the issue of fraud in government health programs. 

Voter Perceptions of Fraud in Government Health Programs
Most voters say there is at least “some” fraud in government health programs, but larger shares say there is fraud in other areas of government. About half of all voters say there is “a lot” of fraud in the federal tax system (52%), federal military and defense contracts (46%), and foreign aid programs (46%). Smaller shares of voters say there is a lot of fraud in Medicaid (40%), Medicare (36%), and the Affordable Care Act (ACA) Marketplaces (29%). 

Compared to the other areas of government asked about in the survey, fewer voters (29%) say there is a lot of fraud in the ACA Marketplaces—though nearly half of Republican voters (47%) say a lot of fraud is occurring there. Trump administration officials have attributed this year’s drop in ACA enrollment to their efforts to combat fraud, rather than the expiration of the enhanced tax credits that made coverage much more costly for some Marketplace enrollees. 

Partisan divisions also emerge over fraud in other health care programs, including Medicaid and Medicare, in which Republican voters are more likely (62% and 54% respectively) than both Democratic (21% and 19%) and independent voters (39% and 38%) to say there is a lot of fraud. 

Across partisans, however, voters are much more likely to attribute fraud in Medicaid and Medicare primarily to health care providers, rather than individual patients, but about three in ten are not sure who is primarily responsible. About half of Democratic, Republican and independent voters say providers are mostly responsible for fraud in these programs, compared to between one in ten and three in ten who say patients are mostly responsible.

Voter Perceptions of Federal Fraud Actions in Medicaid
The Trump administration has launched sweeping fraud, waste, and abuse initiatives across all 50 states and taken targeted actions—including deferring federal Medicaid payments and decertifying fraud control units—that have so far mostly focused on Democratic-led states. Asked about the potential impact of deferred Medicaid payments, voters are much more likely to say these actions will harm beneficiaries and unfairly target states based on politics than reduce fraud or lower costs.

When asked to choose, most (71%) voters say ensuring Medicaid beneficiaries can access the care they need should be a higher priority than reducing fraud, even if it means some fraud may occur. Republican voters are closely split on this trade-off, with about half (52%) saying access to care should be a priority and half (47%) saying preventing fraud should be a priority, even if it harms access for some eligible people. Three-fourths of voters (77%) say delayed federal payments to state Medicaid programs would likely cause some eligible low-income people to lose access to health care services, including majorities of Democratic (89%), independent (81%), and Republican (61%) voters.

Nearly two-thirds of voters overall—including large majorities of Democratic (89%) and independent (70%) voters—say the Medicaid deferral approach is motivated by politics, while most Republicans (69%) say it is mostly motivated by protecting Medicaid. Meanwhile, voters are evenly split (50% vs. 50%) over whether delaying federal funding to states is likely to significantly reduce fraud, and fewer than half of voters across partisans say it is likely to lower health costs for people like them, including 46% of Republican voters and smaller shares of independent (25%) and Democratic (26%) voters.

Designed and analyzed by public opinion researchers at KFF, this survey was conducted June 25 – June 30, 2026, online and by telephone among a nationally representative sample of 1,321 U.S. adults, including 1,055 voters, in English and in Spanish. The margin of sampling error is plus or minus three percentage points for the full sample and plus or minus four percentage points for the sample of voters. For results based on other subgroups, the margin of sampling error may be higher.

Medicaid Postpartum Coverage Extension Tracker

Published: Jul 15, 2026

The Medicaid program finances about 4 in 10 births in the U.S. Federal law requires states to provide pregnancy-related Medicaid coverage through 60 days postpartum. After that period, some postpartum individuals may qualify for Medicaid through another pathway, but others may lose coverage, particularly in non-expansion states. To help improve maternal health and coverage stability and to help address racial disparities in maternal health, a provision in the American Rescue Plan Act of 2021 gave states a new option to extend Medicaid postpartum coverage to 12 months via a state plan amendment (SPA). This new option took effect on April 1, 2022 and was originally available for five years; however, the option was made permanent by the Consolidated Appropriations Act 2023. The Centers for Medicare and Medicaid Services (CMS) released guidance on December 7, 2021 on how states could implement this option.

States that sought to implement extended postpartum coverage prior to April 1, 2022 have done so through a section 1115 waiver or by using state funds. This page tracks state actions to implement extended Medicaid postpartum coverage, including states that have implemented a 12-month postpartum extension, states that are planning to implement a 12-month extension, states with pending legislation to seek federal approval through a SPA or 1115 waiver, and states that have proposed or received approval for a limited coverage extension.

Medicaid Postpartum Coverage Extensions: Approved and Pending State Action as of July 15, 2026

Postpartum Coverage Tracker Map (Choropleth map)

Medicaid Postpartum Coverage Extensions: Approved and Pending State Action as of July 15, 2026

>

A Profile of Dual-Eligible Individuals

Published: Jul 15, 2026

Medicare and Medicaid provide health insurance coverage to tens of millions of people in the U.S. Medicaid is the nation’s largest public health insurance program for low-income Americans and the primary payer for long-term care. Approximately 12 million people are enrolled in both Medicare and Medicaid, referred to as dual-eligible individuals, receiving their primary health insurance coverage through Medicare and additional assistance from their state Medicaid program. Within this group, nearly 9 million people are “full-benefit” dual-eligible individuals, meaning they are eligible for Medicaid benefits that are not otherwise covered by Medicare, including long-term care, vision, and dental services. The remaining 3 million are “partial-benefit” dual-eligible individuals, and are only eligible for assistance with Medicare premiums and, in many cases, cost sharing through the Medicare Savings Programs.

The 2025 budget reconciliation law made major policy changes resulting in significant reductions in future federal Medicaid spending. Those provisions are expected to reduce the number of low-income Medicare beneficiaries who are also enrolled in Medicaid and could also affect the services that dual-eligible individuals receive if state Medicaid programs respond to increased fiscal pressures by reducing coverage of optional benefits. To better understand the low-income Medicare beneficiaries who may be affected by these changes, this brief examines the demographic, socioeconomic, and health characteristics of dual-eligible individuals compared with Medicare beneficiaries without Medicaid using the 2023 Medicare Current Beneficiary Survey (MCBS).

Key Takeaways

  • Compared with Medicare beneficiaries without Medicaid, dual-eligible individuals are more likely to be younger, have lower incomes, and be people of color. Specifically, larger shares of dual-eligible individuals than Medicare beneficiaries without Medicaid are under age 65 (34% vs. 6%), have incomes below $20,000 per person (64% vs. 9%), and are people of color (52% vs. 18%).
  • Dual-eligible individuals are more likely to be in poorer health and have greater health needs than Medicare beneficiaries without Medicaid. For example, 44% of dual-eligible individuals report being in fair or poor health, nearly half (48%) have at least one limitation in an activity of daily living (ADL), and more than one-third (36%) report having a cognitive impairment. Among Medicare beneficiaries without Medicaid, 14% report being in fair or poor health, 21% have at least one ADL limitation, and 12% report having a cognitive impairment.
  • There are some differences in the demographic and health characteristics of full- and partial-benefit dual-eligible individuals. For example, compared with partial-benefit dual-eligible individuals, a larger share of full-benefit dual-eligible individuals are under the age of 65 (36% vs. 28%), have at least one ADL limitation (50% vs. 39%), and report an intellectual or developmental disability (15% vs. 5%).

Demographics of Dual-Eligible Individuals

More than one-third (34%) of dual-eligible individuals are under age 65 and qualify for Medicare on account of having a long-term disability, compared with fewer than one in ten (6%) Medicare beneficiaries without Medicaid (Figure 1). Additionally, larger shares of full-benefit dual-eligible individuals than partial-benefit dual-eligible individuals are under age 65 (36% vs. 28%). People under age 65 may qualify for Medicare if they are eligible for Social Security Disability Insurance benefits. Medicare beneficiaries younger than age 65 differ from beneficiaries ages 65 and older in terms of having worse health status, higher per capita Medicare spending, and lower incomes. Similar shares of dual-eligible individuals (10%) and Medicare beneficiaries without Medicaid (11%) are over the age of 85.

Nearly two-thirds (64%) of dual-eligible individuals live on an annual income below $20,000 per person compared with one in ten (9%) Medicare beneficiaries without Medicaid coverage. There are multiple pathways through which Medicare beneficiaries become eligible for Medicaid benefits. All of the Medicaid pathways that are specific to adults ages 65 and older and people with disabilities, including the two most common for dual-eligible individuals – Supplemental Security Income and the Medicare Savings Programs – require beneficiaries to have income and assets below certain thresholds (which vary by pathway). Medicare beneficiaries with higher incomes may become eligible for Medicaid if they “spend down” their income due to large medical or long-term care expenses. Some low-income Medicare beneficiaries may not be qualified to enroll in Medicaid because their assets exceed the limit, they are unaware of the programs, or because administrative burdens prevent them from enrolling.

Over one in three (34%) dual-eligible individuals have less than a high school degree compared with 7% of Medicare beneficiaries without Medicaid. Additionally, similar shares of full-benefit dual-eligible individuals (35%) and partial-benefit dual-eligible individuals (32%) have less than a high school degree.

A slightly larger share of dual-eligible individuals are female compared with Medicare beneficiaries without Medicaid. Six in ten (60%) dual-eligible individuals are female, while just over half (53%) of Medicare beneficiaries without Medicaid are female. The same share of full-benefit and partial-benefit dual-eligible individuals (60%) are female.

A Larger Share of Dual-Eligible Individuals are Under Age 65, Have Incomes Less Than ,000 Per Person, Have Less Than a High School Degree, and are Female Compared With Medicare Beneficiaries Without Medicaid (Grouped column chart)

Dual-eligible individuals are disproportionately people of color compared with Medicare beneficiaries without Medicaid (Figure 2). Higher shares of dual-eligible individuals are Black (22% compared with 8% among Medicare beneficiaries without Medicaid), Hispanic (21% compared with 6% of Medicare beneficiaries without Medicaid), or an other non-White, non-Hispanic race and ethnic group (9% compared with 5% of Medicare beneficiaries without Medicaid).

Dual-Eligible Individuals are Disproportionately People of Color Compared With Medicare Beneficiaries Without Medicaid (Stacked column chart)

Dual-eligible individuals are more likely than Medicare beneficiaries without Medicaid to live in a long-term care nursing home or other institutional facility (Figure 3). In particular, more full-benefit dual-eligible individuals (10%) live in an institutional setting relative to other Medicare beneficiaries (1% or less of both partial-benefit dual-eligible individuals and Medicare beneficiaries without Medicaid). This likely reflects Medicaid eligibility provisions and the fact that Medicaid is the nation’s primary payer for long-term care services. The average cost of a private room in a nursing facility was $116,800 in 2023. After spending their income and savings to pay for those costs, Medicare beneficiaries without Medicaid may become eligible for Medicaid coverage of long-term care services. In addition, Medicare beneficiaries who use long-term care and who meet other eligibility criteria may qualify for Medicaid if, for example, they can demonstrate the need for an institutional level of care and meet other income and asset criteria.

A slightly larger share of dual-eligible individuals than Medicare beneficiaries without Medicaid live in a rural area. Nearly one in five (19%) dual-eligible individuals compared with 16% of Medicare beneficiaries without Medicaid live in a rural area. There are similar shares of full- and partial-benefit dual-eligible individuals who live in rural areas.

Dual-Eligible Individuals are More Likely to Live in Facilities than Medicare Beneficiaries Without Medicaid, but Both Groups Have Similar Shares Living in Rural Areas (Grouped column chart)

Health Characteristics of Dual-Eligible Individuals

More than four in ten (44%) dual-eligible individuals report being in fair or poor health compared with 15% of Medicare beneficiaries without Medicaid coverage (Figure 4). Conversely, over half (57%) of Medicare beneficiaries without Medicaid report being in very good or excellent health, which is twice as large as the share of dual-eligible individuals (25%) that report very good or excellent health. A slightly larger share of partial-benefit dual-eligible individuals report being in very good or excellent health (28%) compared with full-benefit dual-eligible individuals (24%).

Larger Shares of Dual-Eligible Individuals Report Being in Fair or Poor Health Compared to Medicare Beneficiaries Without Medicaid (Stacked column chart)

Dual-eligible individuals are more likely than Medicare beneficiaries without Medicaid to report having difficulty with one or more activities of daily living (such as eating, bathing, and dressing) (Figure 5). Just under half (47%) of dual-eligible individuals report having difficulty performing at least one activity of daily living (ADL), including about one in four (24%) who report difficulty with three or more ADLs. That compares with about one in five (21%) Medicare beneficiaries without Medicaid who report at least one ADL limitation, including just 7% who report limitations with at least three ADLs. A larger share of full-benefit (50%) than partial-benefit (39%) dual-eligible individuals report difficulties with at least one ADL.

Dual-Eligible Individuals Report Having More Limitations of Activities of Daily Living (ADLs) Than Medicare Beneficiaries Without Medicaid (Stacked column chart)

Dual-eligible individuals report higher rates of mental health conditions, cognitive impairments, and intellectual and developmental disabilities. Most dual-eligible individuals receive their Medicare and Medicaid benefits through separate coverage arrangements. Difficulty navigating the Medicare and Medicaid programs can lead to fragmented care, lower quality, and higher costs. For people with mental health conditions, cognitive impairments, or intellectual or developmental disabilities, the challenge of navigating coverage under both programs could be even larger.

Dual-eligible individuals are about twice as likely to report having a mental health condition as Medicare beneficiaries without Medicaid coverage (Figure 6). About half (47%) of dual-eligible individuals report having a mental health condition, such as depression, compared with less than one-fourth (24%) of Medicare beneficiaries without Medicaid coverage. The share of full-benefit dual-eligible individuals with a mental health condition (49%) is somewhat higher than the share of partial-benefit dual-eligible individuals with a mental health condition (41%).

The share of beneficiaries who report having a cognitive impairment is three times larger among dual-eligible individuals than among Medicare beneficiaries without Medicaid. Specifically, 36% of dual-eligible individuals report a cognitive impairment, including difficulty concentrating, remembering, or making decisions, compared with 12% of Medicare beneficiaries without Medicaid. The share of full-benefit dual-eligible individuals (39%) that report a cognitive impairment is larger than the share of partial-benefit dual-eligible individuals (27%) reporting a cognitive impairment.

The share of dual-eligible individuals who report having an intellectual or developmental disability is much higher than that of Medicare beneficiaries without Medicaid. Overall, 13% of dual-eligible individuals report having an intellectual or developmental disability compared with only 1% of Medicare beneficiaries without Medicaid coverage. Full-benefit dual-eligible individuals are about three times as likely to report having an intellectual or developmental disability than partial-benefit dual-eligible individuals (15% vs. 5%, respectively).

Dual-Eligible Individuals Report Higher Rates of Mental Health Conditions, Cognitive Impairments, and Intellectual/Developmental Disabilities Than Medicare Beneficiaries Without Medicaid (Grouped column chart)
Characteristics of Medicare Beneficiaries by Medicaid Coverage Status, 2023 (Table)

This work was supported in part by Arnold Ventures. KFF maintains full editorial control over all of its policy analysis, polling, and journalism activities.

Five Key Facts About Spending and Enrollment for People with Medicare and Medicaid (Dual-Eligible Individuals)

Published: Jul 15, 2026

There are approximately 12 million people enrolled in both Medicare and Medicaid, who are also known as dual-eligible individuals. Compared with people who are only covered by Medicare or Medicaid, this group is more likely to report being in fair or poor health and require assistance with activities of daily living and often experiences more fragmented or disjointed health care on account of having two sources of coverage.

For dual-eligible individuals, Medicare is the primary payer and covers medical and post-acute care, while Medicaid wraps around Medicare coverage by paying Medicare premiums and in most cases, cost-sharing. Among the approximately 12 million dual-eligible individuals, 8.6 million are “full-benefit” dual-eligible individuals, meaning they are eligible for Medicaid benefits that are not covered by Medicare, including long-term care, vision, and dental. The remaining 3.5 million dual-eligible individuals are “partial-benefit” dual-eligible individuals, who are eligible only for assistance with Medicare premiums, and in many cases, cost sharing through the Medicare Savings Programs (see Appendix, “How do Medicare Beneficiaries Become Eligible for Medicaid?”).

This issue brief analyzes linked Medicare and Medicaid administrative and claims data from 2022 and 2023 to provide a profile of enrollment and spending on dual-eligible individuals, drawing on new analysis of data on chronic conditions to show how higher rates of chronic conditions contribute to higher average spending among this population (see Methodology). The analysis finds that dual-eligible individuals comprise disproportionately high shares of spending in Medicare and Medicaid relative to their enrollment shares because of higher per-person costs than people who are not dual-eligible individuals. Those high per-person costs to some extent reflect higher rates of chronic conditions than other people with Medicare or Medicaid, and per person spending among dual-eligible individuals increases with the number of chronic conditions.

1. Dual-eligible individuals represent 21% of Medicare beneficiaries and 13% of Medicaid enrollees nationally, although state shares vary.

Dual-eligible individuals comprise 21% of the total Medicare population (including beneficiaries in both traditional Medicare and Medicare Advantage) and 13% of the total Medicaid population, but the shares vary widely across states. Dual-eligible individuals comprise 30% or more of all Medicare beneficiaries in the District of Columbia, New York, Connecticut, and Louisiana, but only 11% in Utah. Dual-eligible individuals comprise 20% or more of all Medicaid enrollees in Maine and Mississippi, but less than 10% in Utah, Colorado, and Alaska. Variation across states reflects an array of factors including the distribution of income and wealth among the state populations, the age distribution of state populations, and Medicaid eligibility criteria.

Dual-Eligible Enrollment as a Share of Total Medicare and Medicaid Enrollment Varies Across States (Split Bars)

2. Dual-eligible individuals account for disproportionate shares of Medicare and Medicaid spending.

Dual-eligible individuals account for a larger share of spending in each program than their respective shares of Medicare and Medicaid enrollment. Dual-eligible individuals comprise 15% of the traditional Medicare population but account for 29% of traditional Medicare spending (or $127 billion of $434 billion). (Those estimates include spending for the 5.3 million dual-eligible individuals in traditional Medicare only, excluding the 9.2 million dual-eligible individuals who had Medicare Advantage coverage in the year because Medicare spending data are not available for beneficiaries enrolled in Medicare Advantage plans). Dual-eligible individuals comprise 13% of Medicaid enrollment but 30% of federal and state Medicaid spending (or $241 billion of $796 billion).

Dual-Eligible Individuals Account for Disproportionate Shares of Medicare and Medicaid Spending (Stacked column chart)

3. Medicare and Medicaid spend more per person on full-benefit dual-eligible individuals compared with other enrollees.

Traditional Medicare spending per person averages $24,811 for full-benefit dual-eligible individuals, $19,950 for partial-benefit dual-eligible individuals, and $10,413 for beneficiaries without Medicaid. Higher average Medicare per person spending among full-benefit dual-eligible individuals reflects greater use of medical care among this population, which could be related to their higher rates of chronic conditions (see below). Higher Medicare spending among full-benefit dual-eligible individuals may also reflect their ability to access health care services without substantial financial barriers associated with cost sharing, since most full-benefit dual-eligible individuals receive Medicaid coverage of Medicare cost sharing. In addition, this group has access to certain Medicaid benefits, such as non-emergency medical transportation and case management, which could ease access barriers and increase use of Medicare-covered services.

Per person Medicaid spending averages $27,250 for full-benefit dual-eligible individuals, $2,536 for partial-benefit dual-eligible individuals, and $5,973 for Medicaid enrollees without Medicare. Medicaid only pays for premiums and, in many cases, cost sharing for partial-benefit dual-eligible individuals. Even though Medicare is the primary payer for acute care, Medicaid per person spending for full-benefit dual-eligible individuals is several times larger than for Medicaid enrollees without Medicare. That difference likely reflects several factors: increased use of long-term care and other services not covered by Medicare; higher rates of chronic conditions among dual-eligible individuals, which is associated with higher spending (or greater use of services); and the fact that most other Medicaid enrollees are children, parents, and others under age 65 who tend to have lower per enrollee spending.

Medicare and Medicaid Spend More on Full-Benefit Dual-Eligible Individuals Compared With Partial-Benefit Dual-Eligible Individuals and Non Dual-Eligible Individuals (Grouped column chart)

4.  Full-benefit dual-eligible individuals have more chronic conditions than other people with Medicare or Medicaid.

Rates of chronic conditions are higher among full-benefit and partial-benefit dual-eligible individuals compared with other people with Medicare or Medicaid coverage. Fifty seven percent of full-benefit and 56% of partial-benefit dual-eligible individuals have five or more chronic conditions, compared with less than half (47%) of all other Medicare beneficiaries and just 2% of enrollees with Medicaid only. The relatively high rates of Medicare beneficiaries with multiple chronic conditions reflects that the Medicare population consists primarily of adults ages 65 and older, where chronic conditions such as hypertension, hyperlipidemia, and arthritis are more common than among younger adults. Medicaid-only enrollees are less likely than dual-eligible individuals to have chronic conditions, which reflects the fact that most Medicaid enrollees are children, parents, and others under age 65. Nearly two-thirds of Medicaid-only enrollees (64%) have no chronic conditions, compared with 17% of non-dual Medicare beneficiaries, and just 8% of full- and 9% of partial-benefit dual-eligible individuals.

Full-Benefit Dual-Eligible Individuals Have More Chronic Conditions Than Other People With Medicare or Medicaid (Stacked column chart)

5.  Among full-benefit dual-eligible individuals with traditional Medicare, Medicare and Medicaid spending increase with the number of chronic conditions.

Among full-benefit dual-eligible individuals enrolled in traditional Medicare, Medicare and Medicaid spending increase with the number of chronic conditions. For a full-benefit dual-eligible individual without any chronic conditions, traditional Medicare spending averages $3,955 and Medicaid spending averages $4,751. In comparison, among those with five or more chronic conditions, traditional Medicare spending averages $40,341 (over 10 times higher) and Medicaid spending averages $27,681 (almost 6 times higher). Although Medicare is the primary payer for dual-eligible individuals’ acute care, Medicaid spending on dual-eligible individuals is often higher than that of Medicare. This outcome likely occurs because Medicare generally doesn’t cover long-term care, which can be extremely expensive, and accounts for nearly one-third of all Medicaid spending. Spending on Medicaid enrollees who use long-term care is eight times higher than that of enrollees who don’t use long-term care, and over 60% of enrollees who use long-term care are dual-eligible individuals.

Among Full-Benefit Dual-Eligible Individuals With Traditional Medicare, Medicare and Medicaid Spending Increases as the Number of Chronic Conditions Increases (Stacked column chart)

This work was supported in part by Arnold Ventures. KFF maintains full editorial control over all of its policy analysis, polling, and journalism activities.

How do Medicare Beneficiaries Become Eligible for Medicaid?

  • States are required to cover Medicare beneficiaries who receive Supplemental Security Income and may choose to cover an array of additional groups such as people with significant disabilities and income less than the federal poverty level, those with high medical spending, and those who need long-term care.
  • Most, but not all, full-benefit dual-eligible individuals are also eligible for Medicare premium and cost-sharing assistance covered under the Medicare Savings Programs, which are administered by states.
  • Federal law defines minimum income and resource limits for each of the Medicare Savings Programs, which are updated annually by the Centers for Medicare and Medicaid Services (CMS).
  • Income and asset limits can also vary by state; generally, Medicare beneficiaries must have income below $1,861 each month for an individual ($2,455 for a couple) and resources below $9,500 for an individual ($14,910 for a couple) in 2026. States can raise those limits above the federal floor to provide coverage to individuals who qualify based on the higher eligibility criteria for the Medicare Savings Programs.

Data: This analysis uses data available from various data sources to identify dual-eligible individuals’ enrollment, spending, and chronic conditions. Data sources include: 

  • Dual-eligible enrollment and spending: KFF analytic files that merge the Centers for Medicare & Medicaid Services Chronic Conditions Data Warehouse 2022-2023 research-identifiable Master Beneficiary Summary File (MBSF) Base and the 2022-2023 Transformed Medicaid Statistical Information System (T-MSIS) Analytic Files (TAF) Research Identifiable Files (RIF) file using a Chronic Conditions Warehouse (CCW) beneficiary identifier crosswalk.
  • Chronic condition counts for Medicare-only and dual-eligible individuals: 20% sample of Centers for Medicare & Medicaid Services Chronic Conditions Data Warehouse research-identifiable Master Beneficiary Summary File (MBSF) Base, Claims, and Medicare Advantage Encounter Data, 2022 (merged with T-MSIS data for dual-eligible individuals).
  • Chronic condition counts for Medicaid-only and dual-eligible individuals: Transformed Medicaid Statistical Information System (T-MSIS) Analytic Files (TAF) Research Identifiable Files (RIF) file, 2022 (merged with MBSF and Medicare Advantage Encounter Data for dual-eligible individuals).

Identifying Dual-Eligible Individuals Using Medicare and Medicaid Administrative Data

  • Preparing Medicaid data: Enrollee-level T-MSIS data for the 50 states and D.C. are stacked to create a national file. Enrollees are assigned to a Medicaid state using STATE_CD. Enrollees with missing national identifiers (BENE_ID) are dropped. In some cases, multiple unique records (MSIS_ID) in a state are assigned to the same national identifier (BENE_ID). To handle duplicates within a state, one unique record is selected based on non-missing key variables, and spending for all records associated with the national identifier (BENE_ID) are summed to determine total Medicaid spending on behalf of the enrollee in the state in the year.
  • Preparing Medicare data: Using the MBSF, enrollees are identified using unique national identifiers (BENE_ID). Enrollees are assigned to a Medicare state using STATE_CODE.
  • Merging prepared Medicaid and Medicare data: The prepared Medicaid and Medicare data files are merged using the CCW beneficiary identifier crosswalk which links an enrollee’s unique national identifier in T-MSIS to the enrollee’s unique national identifier in MBSF. All enrollees with a record in both files are kept. For enrollees with T-MSIS records in multiple states, KFF assigned the state that matched the Medicare state is selected. If no states match, the state with the highest spending is selected. Medicaid spending for all records associated with the national identifier (BENE_ID) are summed to determine total Medicaid spending on behalf of the enrollee in the year.
  • Classifying dual-eligible individuals using merged file: Individuals are categorized as dual-eligible if they have matching records in both the MBSF and T-MSIS files. Dual-eligible individuals are assigned to full- or partial-benefit status as follows:
    • Enrollees with at least one month of full Medicaid (defined as Medicare monthly DUAL_STUS_CD_MM values of 02,04,08), are assigned as full-benefit status.
    • Enrollees have at least one month of partial Medicaid (defined as Medicare monthly DUAL_STUS_CD_MM values of 01,03,05,06), are assigned partial-benefit status.
    • Dual-eligible enrollees that do not have full-benefit or partial-benefit status from the Medicare monthly DUAL_STUS_CD_MM, are assigned using the Medicaid monthly DUAL_ELGBL_CD_MM from T-MSIS (values 02,04,08 indicate full benefits and 01,03,05,06 indicate partial benefits). Similar to above, individuals with any months of full Medicare are full-benefit.
    • Dual-eligible enrollees that are not assigned using either the Medicare or Medicaid dual status indicators, are classified using the monthly code RSTRCTD_BNFTS_CD_MM from T-MSIS (at least one month with RSTRCTD_BNFTS_CD_MM with values of 1,A,D,4,5,7 indicates full-benefit status, and all others are assigned partial-benefit status).

Enrollment and Spending for Dual-Eligible Individuals, based on Medicare Claims

  • Enrollment Used to Calculate Shares: For dual-eligible enrollment as a share of total Medicare enrollment nationally and by state, we included beneficiaries in both traditional Medicare and Medicare Advantage.
  • Spending: Medicare beneficiaries included in spending analyses had to meet the enrollment sample requirements and have no Medicare Advantage coverage during the year. Total Medicare spending was calculated as the sum of all Medicare Part A, Part B, and Part D service category payments in the MBSF Cost and Utilization Segment. Medicare spending (total and per person) does not include beneficiary cost-sharing liability.

Enrollment and Spending for Dual-Eligible Individuals, based on Medicaid Claims

  • Enrollment Used to Calculate Shares: Dual-eligible individual enrollment and spending are reported as a share of total Medicaid enrollment and spending.
  • Spending: Medicaid spending is derived from two data sources. T-MSIS spending includes Medicaid spending on fee-for-service spending on health care and payments to managed care plans. Data on Medicare premiums (which are not in T-MSIS) for Part A and Part B are estimated for dual-eligible individuals based on months of Medicare enrollment as a Medicaid beneficiary. Premiums change slightly year-to-year and are based on the amounts reported by CMS.
    • Assigning Medicare Premiums to Medicaid Individuals: Data on Medicare premiums (which are not in T-MSIS) for Part A and Part B are estimated for dual-eligible individuals based on months of Medicare enrollment as a Medicaid beneficiary. Part A premiums were assigned to every month a dual-eligible individual had a monthly dual eligibility code of 05 and Part B premiums were assigned each month for which individuals had codes of 01, 02, 03, 04, or 06. Premiums change slightly year-to-year and are based on the amounts reported by CMS. For 2023, the Centers for Medicare & Medicaid Services reported monthly Part A premiums were $506 and monthly Part B premiums were $164.90.

Chronic Conditions for Dual-Eligible Individuals, based on Medicare and Medicaid claims

  • Medicare and Medicaid Claims Data Used to Identify Chronic Conditions: Medicare fee-for-service and Medicare Advantage encounter data were used. Fee-for-service claims and encounters across all service types—inpatient, outpatient, carrier, home health, and skilled nursing facility—are included. Durable medical equipment encounters are excluded. The analysis incorporates Part D prescription drug event data, which provides information on fills of prescription drugs. Medicare Advantage encounters that were chart reviews, as identified using the Chart Review Switch and in-home health risk assessments, identified using HCPCS codes (GO438, GO402, 99341, 99342, 99343, 99344, 99345, 99347, 99348, 99350) and place of service codes (12, 13, 14, 16) were removed. T-MSIS inpatient, other, long-term care, and pharmacy data were used.
  • Inclusion Criteria: All Medicaid enrollees were included in this analysis. Additional criteria was used to limit the sample of Medicare-only and dual-eligible individuals included in counting chronic conditions:
    • Medicare-only Inclusion Criteria: Medicare enrollees were included if they are in the MBSF 20% sample. Medicare Advantage enrollees enrolled in plans where over 80% individuals did not have any utilization were removed from the sample.
    • Dual-Eligible Individuals Inclusion Criteria: Dual-eligible individuals were included if (1) they were in both the MBSF and TMSIS files using the CCW crosswalk, (2) they were included in the MBSF 20% sample, (3) and they had full Medicaid benefits for at least one month throughout 2022.
  • Medicare Advantage: Individuals who had at least one month of Medicare Advantage coverage in the year are considered Medicare Advantage enrollees.
  • Defining Chronic Conditions: This analysis used the CCW algorithm for identifying chronic conditions in the Medicare Advantage Encounter data 20% sample in 2022, the Medicare fee-for-service data 20% sample in 2022, and the 2022 Transformed Medicaid Statistical Information System (T-MSIS) Analytic Files (TAF) Research Identifiable Files (RIF) file. This analysis also included in its definition of chronic conditions substance use disorder, mental health, obesityHIV, hepatitis C, and intellectual and developmental disabilities. The counts of chronic conditions are higher than reported using other data, such as the Medicare Current Beneficiary Survey, because a larger set of conditions are included. In total, 29 chronic conditions were included:
    • Behavioral health conditions: Any mental health condition and any substance use disorder. See KFF’s brief, “5 Key Facts About Medicaid Coverage for Adults with Mental Illness,” KFF brief “SUD Treatment in Medicaid: Variation by Service Type, Demographics, States and Spending,” and the Urban Institute, Behavioral Health Services Algorithm for additional details (Victoria Lynch, Lisa Clemans-Cope, Doug Wissoker, and Paul Johnson. Behavioral Health Services Algorithm. Version 4. Washington, DC: Urban Institute, 2024).
    • Physical health conditions: Hypertension, transient ischemic attack, acute myocardial infarction, hyperlipidemia, ischemic heart disease, atrial fibrillation, heart failure, obesity, chronic obstructive pulmonary disease, pneumonia, asthma, diabetes, arthritis, hip fracture, osteoporosis, cataracts, glaucoma, chronic kidney disease, cancer (colorectal, endometrial, urologic, breast, prostate, or lung), benign prostatic hyperplasia, hepatitis, HIV, anemia, hypothyroidism.
    • Cognitive impairment conditions: Alzheimer’s and/or dementia, intellectual and developmental delay, and Parkinson’s.

Medicaid Waiver Tracker: Approved and Pending Section 1115 Waivers by State

Published: Jul 14, 2026

Section 1115 Medicaid demonstration waivers offer states an avenue to test new approaches in Medicaid that differ from what is required by federal statute, if [in the HHS Secretary’s view] the approach is likely to “promote the objectives of the Medicaid program.” They can provide states additional flexibility in how they operate their programs, beyond the considerable flexibility that is available under current law. Waivers generally reflect priorities identified by states as well as changing priorities from one presidential administration to another. Nearly all states have at least one active Section 1115 waiver and some states have multiple 1115 waivers. See the “Key Themes Maps” tab for a discussion of recent waiver trends.

This page tracks approved and pending Section 1115 waiver provisions (including expansions and restrictions) related to eligibility, benefits, and social determinants of health and other delivery system reforms, once such waivers are posted to the state waivers list on Medicaid.gov. For more information on inclusion criteria and on each provision, as well as a list of acronyms, see the Definitions tab.

Landscape of Approved and Pending Section 1115 Waivers (Stacked Bars)


Waivers with Eligibility Changes

(back to top)

Waivers with Benefit Changes

(back to top)

Waivers with SDOH & Other DSR Changes

(back to top)

All Approved Waivers by Topic

(back to top)

Approved Section 1115 Medicaid Waivers (Table)

All Pending Waivers by Topic

(back to top)

Pending Section 1115 Medicaid Waivers (Table)

See KFF's Work Requirements Tracker for additional state and national-level data related to work requirement implementation, including related KFF resources on work requirements.

The 2025 reconciliation law requires states to condition Medicaid eligibility for adults in the ACA Medicaid expansion group on meeting work requirements starting January 1, 2027; however, states have the option to implement requirements sooner through a state plan amendment (SPA) or through an approved 1115 waiver.

State Plan Amendments (SPAs)

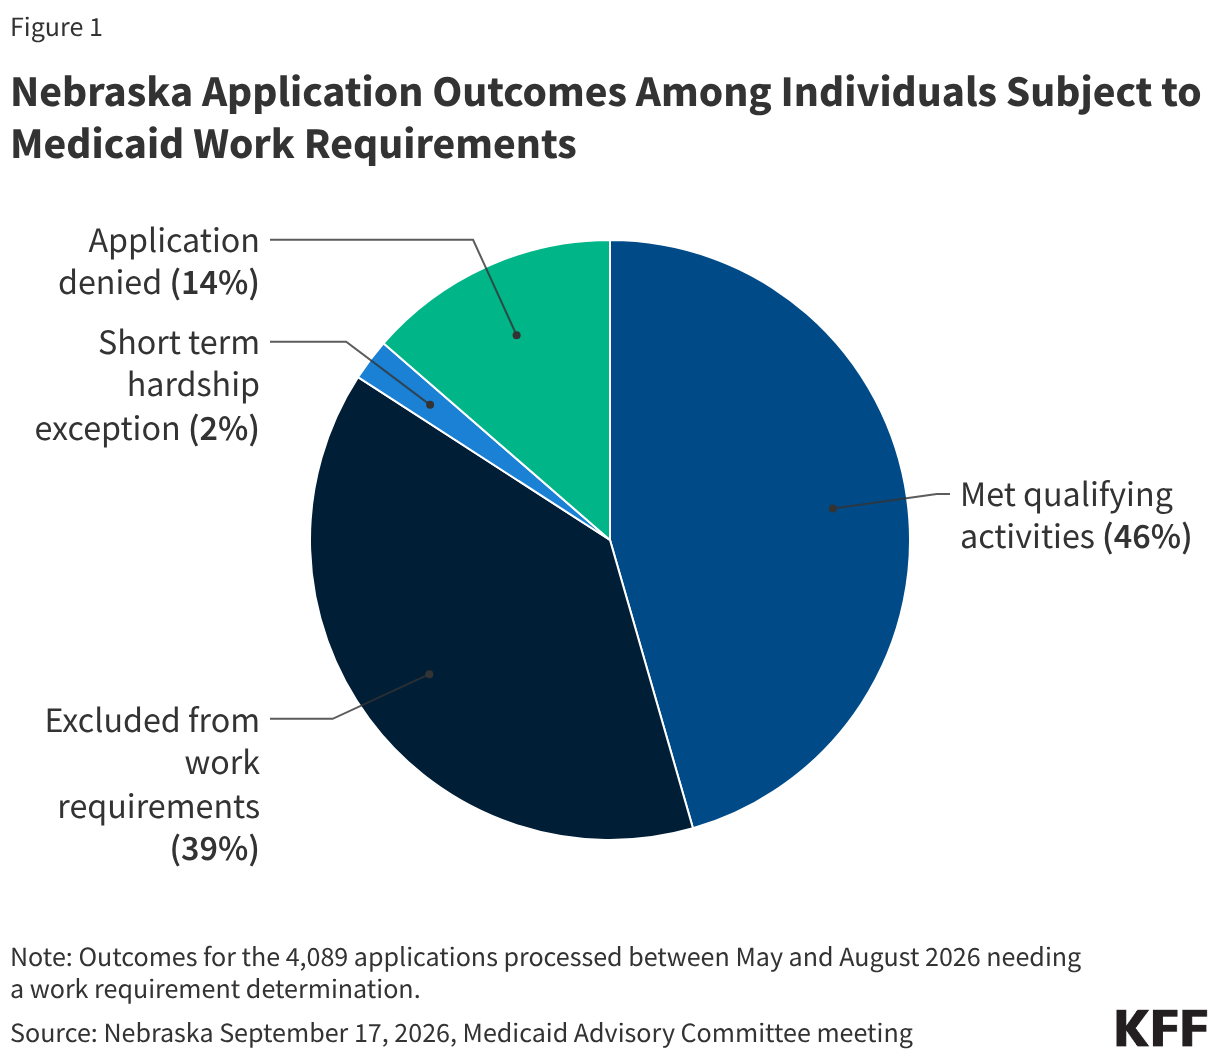
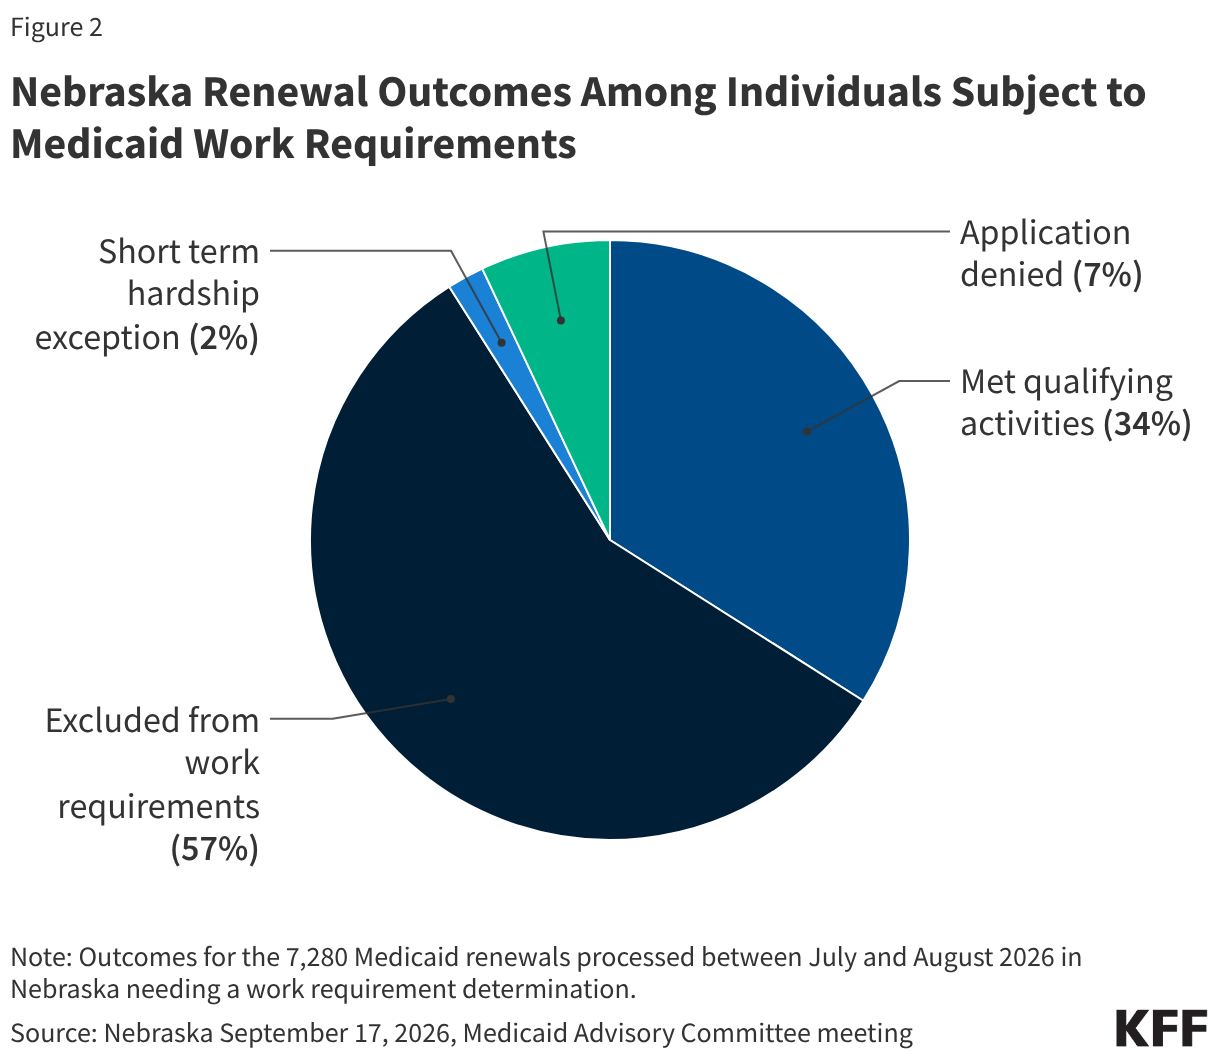
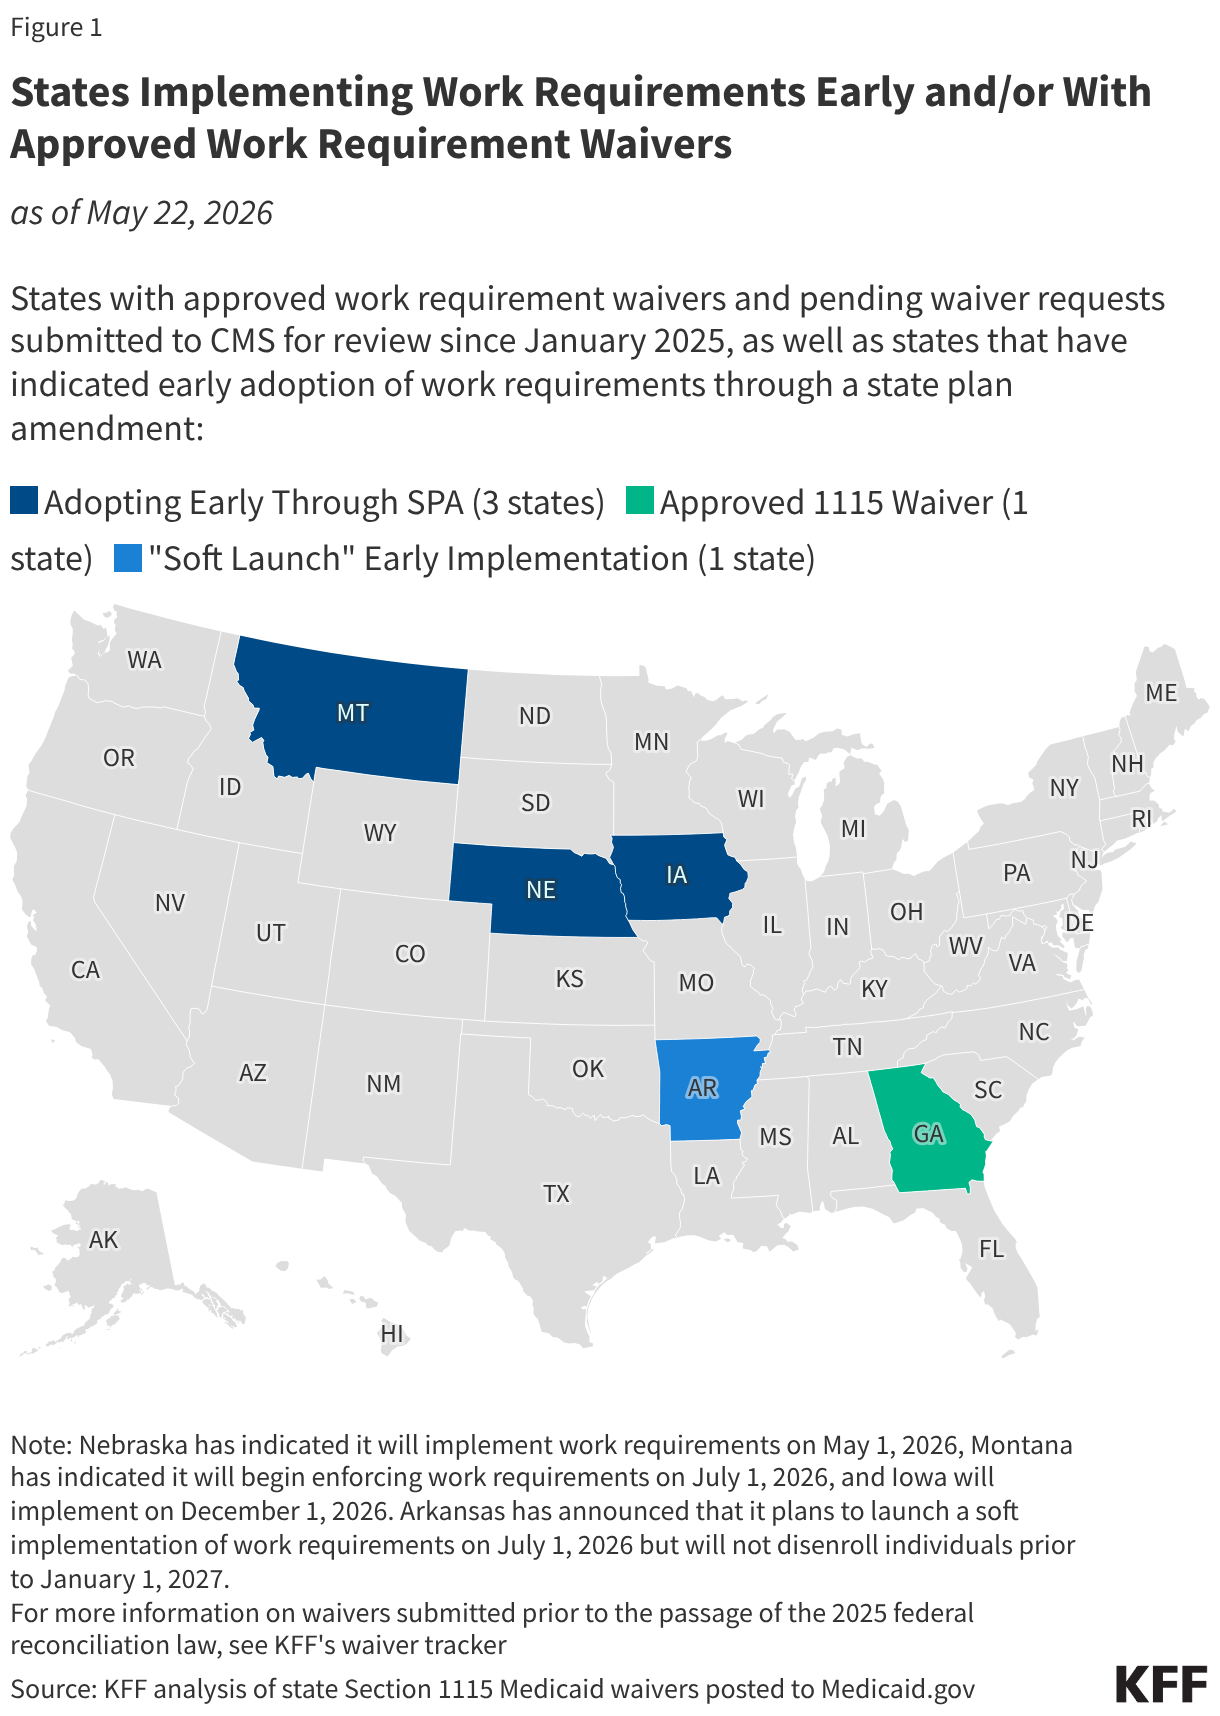
States may choose to implement work requirements prior to the required January 1, 2027 implementation date through a state plan amendment. Nebraska is the first state to announce that it will begin enforcing federal work requirements early through a state plan amendment, starting May 1, 2026. Two other states are also planning to implement before January 2027–Montana on July 1, 2026 and Iowa on December 1, 2026. Arkansas has announced that it plans to launch a soft implementation of work requirements on July 1, 2026 but will not disenroll individuals prior to January 1, 2027.

1115 Waivers

Since the start of the second Trump administration, several states have submitted waivers to implement work requirements. However, states are unlikely to be moving forward with proposed 1115 waivers at this time due to the passage of federal work requirements. States that plan to implement federal work requirements early will do so through a state plan amendment. Currently, Georgia is the only state with a Medicaid work requirement waiver in place following litigation over the Biden administration’s attempt to stop it. Georgia’s waiver will expire December 31, 2026; the state is required to come into compliance with the new federal requirements effective January 1, 2027.

Early Implementation and Waiver Status

The map below identifies states that have indicated they will implement work requirements early through a state plan amendment as well as approved (Georgia) and pending work requirement waivers (submitted to CMS since the start of the second Trump administration). The table below the map provides more detailed state waiver information.

States Implementing Work Requirements Early and/or Pursuing Work Requirement Waivers (Choropleth map)

States with Work Requirement Waiver Activity (Table)

Section 1115 waivers generally reflect priorities identified by states as well as changing priorities from one presidential administration to another.  Key Biden administration 1115 initiatives included waivers addressing enrollee health-related social needs (HRSN), pre-release coverage for individuals who are incarcerated, and multi-year continuous eligibility for children.

In March 2025, the Trump administration rescinded HRSN guidance issued by the Biden administration. CMS indicates this does not nullify existing HRSN 1115 approvals but going forward they will consider HRSN / SDOH requests on a case-by-case basis. In April 2025, the Trump administration announced it would be phasing out federal funding for “Designated State Health Programs” (DSHP) in waivers. In July 2025, the Trump administration released guidance indicating it will not approve (new) or extend (existing) continuous eligibility waivers for children or adults. CMS also announced in July it would be phasing out initiatives to strengthen the Medicaid workforce for primary care, behavioral health, dental, and home and community based services (not depicted in maps below).

This page tracks pending and approved waivers in key areas of recent state activity and will track Trump administration action in these areas going forward. Hover over individual states to display waiver expiration dates.

Social Determinants of Health

Social determinants of health (SDOH) are the conditions in which people are born, grow, live, work and age. SDOH include but are not limited to housing, food, education, employment, healthy behaviors, transportation, and personal safety. In 2022, CMS (under the Biden administration) announced a demonstration waiver opportunity to expand the tools available to states to address enrollee “health-related social needs” (or “HRSN”) including housing instability, homelessness, and nutrition insecurity, building on CMS’s 2021 guidance. In 2023, CMS issued a detailed Medicaid and CHIP HRSN Framework accompanied by an Informational Bulletin, which were updated in 2024.

In March 2025, the Trump administration rescinded the Biden administration HRSN guidance. CMS indicates this does not nullify existing HRSN approvals but going forward they will consider HRSN / SDOH requests on a case-by-case basis.

The “HRSN Waivers” map below identifies states with approval under the Biden administration HRSN framework. The “All SDOH Waivers” map identifies SDOH-related 1115 waivers more broadly, including those that pre-date or were approved outside of the HRSN framework. For more detailed waiver information, refer to KFF’s Medicaid Waiver Tracker (“SDOH” table) and HRSN waiver watch  (March 2024).

Section 1115 Waivers: Social Determinants of Health (SDOH) (Choropleth map)

Medicaid Pre-release Coverage for Individuals Who Are Incarcerated

In April 2023, the Biden administration released guidance encouraging states to apply for a new Section 1115 demonstration opportunity to test transition-related strategies to support community reentry for people who are incarcerated. This demonstration allows states a partial waiver of the inmate exclusion policy, which prohibits Medicaid from paying for services provided during incarceration (except for inpatient services). Reentry services aim to improve care transitions and increase continuity of health coverage, reduce disruptions in care, improve health outcomes, and reduce recidivism rates. The Biden administration approved 19 state waivers to facilitate reentry for individuals who are incarcerated. The map below identifies states with approved and pending waivers to provide pre-release services to Medicaid-eligible individuals who are incarcerated.  Medicaid pre-release waivers have been pursued by both Republican and Democratic governors. For more information, refer to KFF’s Medicaid Waiver Tracker (“Eligibility Changes” table) and related pre-release waiver watch (August 2024).

Section 1115 Waivers: Medicaid Pre-release Coverage for Individuals Who Are Incarcerated (Choropleth map)

Multi-year Continuous Eligibility for Children

The Consolidated Appropriations Act, 2023 required all states to implement 12-month continuous eligibility for children beginning on January 1, 2024. The Biden administration approved 9 waivers that allow states to provide multi-year continuous eligibility for children (e.g., from birth to age six). Continuous eligibility has been shown to reduce Medicaid disenrollment and “churn” rates (rates of individuals temporarily losing Medicaid coverage and then re-enrolling within a short period of time).

In July 2025, the Trump administration released guidance indicating it will not approve (new) or extend (existing) continuous eligibility waivers for children or adults. The map below displays states with waiver approval to provide multi-year continuous eligibility for children.  For more information, refer to KFF’s Medicaid Waiver Tracker (“Eligibility Changes” table) and related continuous eligibility waiver watch (February 2024).

Section 1115 Waivers: Multi-year Continuous Eligibility for Children (Choropleth map)
Section 1115 Waiver Tracker: Key Definitions and Notes (Table)

Recent Developments

General/Overview Resource

Eligibility and Enrollment Expansions

Eligibility and Enrollment Restrictions

Work Requirements:

Other:

Benefit Expansions

Benefit Restrictions, Copays, and Healthy Behaviors

Social Determinants of Health

Delivery System Reform

988 Enters Its Fourth Year as Demand Grows and the Mental Health and Substance Use Landscape Shifts

Published: Jul 14, 2026

On July 16, 2022, the federally mandated crisis number988, became available to all phone users at no charge. This three-digit number connects users–via phone, text, or chat–to a network of over 200 local and state-funded crisis call centers that provide access to crisis counseling, resources, and referrals through the 988 Suicide & Crisis Lifeline. The introduction of 988 came against the backdrop of rising suicide rates. Between 2014 and 2024, more than half a million lives (516,790) were lost to suicide, and over half of those involved firearms. In 2024, suicide and substance-related deaths, combined, were the third leading cause of death in the U.S., behind heart disease and cancer.     

Data as of March 2026 show that demand for 988 continues to rise, with the volume of calls, texts, and chats 15% higher than a year earlier and nearly 50% higher than two years ago. States are also answering more calls in-state, where counselors are more likely to be familiar with local resources. The broader crisis continuum, including mobile crisis and crisis stabilization services, has expanded across states. Suicide deaths declined modestly in 2024, and remained relatively stable in provisional 2025 data. Research examining  988’s relationship to suicides found lower-than-expected deaths among people ages 15 to 34 after 988 launched, suggesting that 988 may have contributed to improved outcomes for some populations.

Despite some positive signs, sustaining momentum may become more difficult as demand grows and fiscal pressures increase. Relatively few states have adopted telecom fees intended to provide dedicated funding for 988 call centers and other crisis services, leaving many states to rely on other funding mechanisms, which vary widely. Uneven or uncertain funding may affect call center capacity, and staffing is already a challenge, with many call centers reporting staffing shortages. Further, federal changes to Medicaid and the ACA Marketplaces, along with other federal policy changes, are expected to increase the number of people without health coverage. Coverage losses stemming from these changes could disrupt access to behavioral health care and increase demand on 988, just as federal cuts are likely to place greater pressure on state budgets.  

Taken together, 988 is reaching more people and early suicide-related outcome data show some signs of improvement, but sustaining call center capacity and community-based crisis services may become more difficult as demand grows and state resources become more limited. This policy watch examines 988 on its fourth anniversary, drawing from the latest Lifeline data available through May 2026 for state call data and through March 2026 for national call, text, and chat data.

988 received 23.3 million contacts since its launch in July 2022, including 15.8 million calls, 4.2 million texts, and 3.4 million chats. Monthly contact volume has steadily increased, consistently surpassing 600,000 contacts per month over the past year and often approaching or exceeding 700,000 per month since late 2025—more than double the contacts recorded before launch (277,407 in June 2022) (Figure 1). Growing public awareness of  988 likely contributed to this increase, though contact volume may have been slowed by the 2025 elimination of the specialized LGBTQ+ service for young people, which had accounted for 10% of all 988 contacts. Recent reporting suggests that the specialized service may be restored. 988 data excludes calls routed from 988 to the Veteran’s Crisis Line (VCL), which has received an additional 3 million calls since launch, because monthly breakouts and other details are not publicly available. They also exclude suicide hotline contacts from centers operating outside of the 988 network. As of 2024, fewer than half of all hotline call centers (about 200 of 573) participated in the 988 network.

Over 23 Million Calls, Texts, and Chats Received by 988 Crisis Service Since July 2022 Launch (Line chart)

Local 988 response has improved, with 26 states answering at least 90% of calls in-state, but uneven and uncertain funding may pose challenges for sustaining call center capacity. In May 2026, 26 states answered at least 90% of calls in-state, up from just 8 states before 988’s launch (Figure 2).  In-state answer rates ranged from 62% (District of Columbia) to 99% (Mississippi and Rhode Island). 988 is now facilitating more local response by routing callers to the call center nearest to their location, while protecting privacy. Calls not answered in-state are redirected to national backup centers, where counselors can respond to the crisis call but may be less familiar with local resources. Ongoing financing remains a challenge. Federal funding helped launch 988 and continues to support some local call centers, but ongoing center financing largely falls to states. As of 2026, 12 states have passed legislation to help sustainably fund 988 through telecom fees, similar to how 911 is financed, with many assessing flat monthly charges of less than 45 cents per line. Other states rely on mechanisms that may be less stable or vary from year to year. Limited or uncertain funding can affect staffing, quality, and operations. In a 2025 survey of call center leaders, about 3 in 4 call centers reported staffing shortages and 89% reported some level of difficulty acquiring resources to hire staff.  As states enter a period of tighter budgets, questions about the long-term funding to sustain local 988 crisis call centers are likely to persist.

26 States Now Answer at Least 90% of 988 Calls In State, Up From Fewer Than 10 Before 988’s Launch (Choropleth map)

988, along with other investments in the crisis continuum, may have helped to contribute to some recent improvement in suicide-related outcomes. Suicide deaths declined modestly in 2024, and remained relatively stable in provisional 2025 data. Most of the decline has been among non-firearm suicides, which have fallen each year since 2022, while firearm suicides have risen each year since 2019 (Figure 3). Other research also shows declines in suicides or related measures among certain populations. The share of emergency department (ED) visits for suspected suicide attempts decreased by about 7% in 2025 compared with 2021, and a separate study found that, in the years following 988’s launch, suicide deaths among people ages 15 to 34 were about 11% lower than expected if 988 had not launched. These trends have occurred as states continue to build out the broader crisis continuum, which also includes mobile crisis and crisis stabilization services.  According to a survey of state behavioral health agencies, mobile crisis volume increased by 40%, and crisis stabilization center volume more than doubled, relative to 2022. As of 2024, 34 states reported statewide availability of mobile crisis teams, and 25 states reported the same for crisis stabilization services. This expansion may face future financing challenges, as enhanced federal Medicaid funding that supported mobile crisis expansion in some communities expires in 2027, leaving states responsible for more of the cost. States are also making crisis-system data more public, with 21 states now displaying public-facing crisis contact data dashboards.  

Suicide Deaths Declined Modestly in 2024 and Were Mostly Stable in Provisional 2025 Data (Line chart)

If you or someone you know is considering suicide, call or text the 988 Suicide & Crisis Lifeline at 988

3 Things to Know About Substance Use and Suicide Mortality

Author: Nirmita Panchal
Published: Jul 14, 2026

In the past decade, nearly 1.8 million people in the United States lost their lives by suicide or alcohol and drug consumption. Collectively, these deaths are sometimes referred to as “deaths of despair”, a term that emphasizes economic and social deterioration as driving factors. However, additional and more complex factors may be linked to these deaths, such as health disparities, challenges with treatment access, reduced public services, and changes in drug supplies. Therefore, the term “substance use and suicide deaths” is used throughout this brief as a composite measure describing deaths due to alcohol, drugs, and/or suicide. These causes are examined together because they share many upstream risk factors and prevention strategies related to mental health and substance use.

This analysis explores trends in substance use and suicide mortality using data from CDC WONDER. Due to overlap in several ICD-10 codes for deaths involving drugs, alcohol and/or suicide, duplicate codes were removed. Therefore, total substance use and suicide deaths are not equivalent to the sum of alcohol-induced, suicide, and drug overdose deaths (see Methods for more information). Key takeaways include:

  1. In 2024, substance use and suicide deaths (47.7 per 100,000 population) were the third leading cause of death in the U.S., behind heart disease (157.6) and cancer (139.4).
  2. Deaths due to substance use and suicide increased over the past decade (34.6 in 2014) and peaked during the pandemic (59.6 in 2021).
  3. Older adults, men, and some communities of color were disproportionately impacted by substance use and suicide deaths compared to their peers.

Despite these high mortality rates, many individuals experience challenges obtaining mental health and substance use services. KFF analyses found that while health insurance is linked to increased utilization of mental health services, many insured individuals do not receive needed mental health treatment. This is associated with multiple factors, including narrow provider networks, coverage limitations, and cost and logistical barriers. A recent KFF survey found that 19% of adults with health insurance rated their insurance negatively based on the availability of mental health providers, and 43% of individuals with poor mental health said they did not receive needed services or medication in the previous year.

The passage and evolution of the Mental Health Parity and Addiction Equity Act (MHPAE) have sought to reduce some access burdens by requiring health insurance plans to provide benefits for mental health and substance use services in alignment with the benefits provided for medical and surgical care. However, enforcement of MHPAE policies is challenging and recent efforts to modify enforcement practices have been slowed under the second Trump administration. Other policy actions under the Trump administration are impacting access to mental health and substance use services. This includes the 2025 reconciliation law which will reduce Medicaid and ACA coverage,  narrowing the scope of federal leadership capacity in mental health and substance use services, and a departure from harm reduction services. Collectively, these changes may disrupt access to and continuity of care at a time when substance use and suicide deaths remain elevated.

1. Substance use and suicide deaths combined were the third leading cause of deaths in the United States in 2024.

In 2024, 170,449 people in the U.S. died from suicide and/or substance use. This translates to an age-adjusted death rate of 47.7 per 100,000 population. Compared to other leading causes of death in 2024, only heart disease and cancer rates (157.6 and 139.4, respectively) have higher age-adjusted rates than suicide and substance use (Figure 1).

Age-Adjusted Death Rates for the Leading Causes of Death in the United States, 2024 (Bar Chart)

2. Over the past decade, substance use and suicide mortality rates increased by nearly 40%.

From 2014 to 2024, substance use and suicide death rates increased from 34.6 per 100,000 population to 47.7 (Figure 2). During this period, death rates increased until 2017 and then held steady before sharply increasing alongside the pandemic (59.6 deaths per 100,000 in 2021). It is likely that the worsening opioid crisis, and specifically the presence of fentanyl in the drug supply, significantly contributed to the spike in substance use and suicide mortality rates during the pandemic. These death rates have declined since peaking in 2021 but remain above pre-pandemic levels (47.7 in 2024 vs. 44.6 in 2019).

Substance Use and Suicide Mortality Rates, 2014-2024 (Line chart)

3. Substance use and suicide mortality rates have disproportionately affected adults ages 45 to 64, men, and certain communities of color.

From 2014 to 2024, substance use and suicide mortality rates were highest among adults ages 45 to 64 (85.3 per 100,000) (Figure 3). These adults along with adults ages 26 to 44 experienced the sharpest increases in mortality rates during the pandemic. Although these rates have since decreased, they remain above pre-pandemic levels for both age groups. In comparison, young adults (ages 18 to 25) and elderly adults (ages 65 and above) experienced smaller increases in substance use and suicide mortality rates during the pandemic. By 2024, the mortality rate among young adults decreased to 27.2, similar to its rates a decade earlier. However, mortality rates among elderly adults have remained relatively steady since their slight increase during the pandemic.

Substance Use and Suicide Mortality by Age, Sex, and Race/Ethnicity, 2014-2024 (Line chart)

The rate of substance use and suicide mortality among males grew 40% from 2014 to 2024 and remained nearly three times higher than the rates among females (70.6 per 100,000 vs. 25.4 in 2024, respectively, Figure 3). Over the decade, the gap in these death rates has generally widened between males and females: from 50.3 per 100,000 for males and 19.7 for females in 2014 to 70.6 for males and 25.4 for females in 2024. While both groups experienced peak rates during the onset of the pandemic, the increase impacted males more than females (87.6 vs. 32.2 in 2021, respectively).

Over time, people of color have experienced a faster growth in substance use and suicide death rates compared to their White peers. From 2018 to 2024, death rates increased by 43% for Black people, 30% for Hispanic people, 28% for American Indian and Alaska Native (AIAN) people, 14% for Asian and Pacific Islanders, and 2% for White people (Figure 3). As a result, the gap in substance use and suicide mortality rates has largely narrowed between White and Black people and, to a lesser extent, between White and Hispanic people. Additionally, AIAN people consistently experience the highest rates of substance use and suicide mortality compared to all other racial and ethnic groups (130.1 per 100,000 vs. 53.7 among White people in 2024).

Methods

Understanding the Overlap in Substance Use and Suicide Mortality (Range Plot)

The Business of Health with Chip Kahn

The AI Arms Race in Administrative Health Care

July 14, 2026

Video

Audio

About this Episode


Episode 12, AI Series: Caroline Pearson, executive director of the Peterson Health Technology Institute (PHTI) and the Peterson Center on Healthcare, joins Chip to discuss who really benefits as AI moves into health care’s back office. A quiet arms race is underway — providers deploying AI to code, bill, and capture revenue and insurers deploying it right back to review, deny, and hold the line. The open question is whether any of this lowers what the country actually spends or just speeds up the fight over the dollar. Pearson brings a rare vantage: PHTI runs rigorous, independent evaluations of health technology — from a now-famous assessment that found digital diabetes tools didn’t lower the total cost of care, to its own examination of the administrative AI arms race in prior authorization and medical billing. She and Chip dig into whether AI can deliver better care and real savings, or simply more activity — and how incentives and policy decide which way it breaks.

Note: KFF partners with the Peterson Center on Healthcare on the Peterson-KFF Health System Tracker, which monitors how well the U.S. healthcare system performs in terms of quality and cost.

The Host


Headshot photo of Chip Kahn wearing a navy blue suit with a red tie, red pendant on lapel, and glasses.

Sr. Visiting Fellow

Charles N. Kahn III is a senior visiting fellow at KFF. He is also a visiting senior fellow at the American Enterprise Institute and a nonresident senior scholar at the University of Southern California’s Schaeffer Center for Health Policy & Economics. He serves as co-chair of the international Future of Health collaborative.

Guest


Executive Director, Peterson Health Technology Institute; Executive Director, Peterson Center on Health Care

Caroline Pearson is the Executive Director of the Peterson Health Technology Institute (PHTI), where she leads efforts to evaluate the clinical and economic impacts of digital health solutions. She is also Executive Director of the Peterson Center on Healthcare Leadership, where she leads initiatives and grantmaking to fulfill the Center’s mission to create a high performing health system that delivers better care at lower cost. 

Pearson was previously the Senior Vice President for Healthcare Strategy at NORC at the University of Chicago, a nonpartisan research organization. Prior to her work at NORC, Pearson was the Senior Vice President of Policy and Strategy at the consulting firm Avalere Health. Pearson is an elected member of the National Academy of Social Insurance. She is honored as a Crain’s New York Business Notable Leader in Health Care.

Pearson graduated Magna Cum Laude from Harvard University with a B.A. in Government.


SERIES

This weekly podcast features insightful conversations between host Chip Kahn and his guests, who discuss the business of health care, connecting the dots between the health care business, policy, and patients.

The podcast’s first series on AI in health care illuminates how AI is changing health care, and features guests who are deploying this technology, managing its consequences, and designing policy around it.

2026 Medical Loss Ratio Rebates

Authors: Matt McGough, Jared Ortaliza, and Cynthia Cox
Published: Jul 13, 2026

The Medical Loss Ratio (MLR) provision of the Affordable Care Act (ACA) limits the share of premium income that insurers can keep for administration, marketing, and profits. Insurers that fail to meet the applicable MLR threshold are required to pay back excess profits or margins in the form of rebates to individuals and employers that purchased coverage.

In the individual and small group markets, insurers must spend at least 80% of their premium income on health care claims and quality improvement efforts, leaving the remaining 20% for administration, marketing expenses, and profit. The MLR threshold is higher for large group insurers, which must spend at least 85% of their premium income on health care claims and quality improvement efforts. MLR rebates are based on a three-year average, meaning that rebates issued in 2026 will be calculated using insurers’ financial data in 2023, 2024 and 2025 and will go to people and businesses who bought health coverage in 2025.

This analysis, using preliminary data reported by insurers to state regulators and compiled by Mark Farrah Associates, finds that insurers estimate they will issue a total of just over $759 million in MLR rebates across all commercial markets in 2026. Since the ACA began requiring insurers to issue these rebates in 2012, a total of $14.4 billion in rebates has already been issued to individuals and employers, and this analysis suggests the 2012-2026 total will rise to about $15.1 billion when rebates are issued later this year.

Over  Billion in Rebates Will Have Been Issued Throughout 2026 (Stacked Bars)

Estimated total rebates across all commercial markets in 2026 ($759 million) are less than total rebates issued in 2024 ($958 million) and in 2025 ($1.6 billion). In 2025, rebates were issued to 5.1 million people with individual coverage and 3.5 million people with employer coverage. In the individual market, the 2025 average rebate per person was $233, while the average rebates per person for the small group market and the large group market were $190 and $91, respectively (though enrollees could receive only a portion of this as rebates may be shared between the employer and employee or be used to offset premiums for the following year).

The estimated $759 million in rebates falls far short of record-high rebate totals of $2.5 billion issued in 2020 and $2.1 billion issued in 2021, driven largely by high margins in the 2018 ACA Marketplace following steep premium increases in response to the elimination of cost-sharing reduction payments, inflating the three-year average on which rebate calculations are based, as well as lower than expected utilization in 2020 due to the pandemic. In the years following 2018, insurers largely held premiums flat or reduced them as claims cost rose and caught up to premium levels, compressing margins and bringing rebate totals down significantly from those peaks. The current rebate environment reflects this period of margin normalization rather than continued insurer profitability stemming from the earlier CSR-related premium increases.

Average Simple Loss Ratios, by Market, 2011-2025 (Line chart)

The chart above shows the average “simple loss ratio” in each market. Simple loss ratios differ from the ACA MLR used to calculate rebates because simple loss ratios do not include adjustments for quality improvement expenses or taxes. In 2025, the average simple loss ratio in the individual market was 93%, meaning these insurers spent an average of 93% of their premium income in the form of health claims in 2025. This is significantly higher than the previous year, suggesting that insurers were less profitable. However, rebates issued in 2026 are based not only on 2025 experience, but rather on a three-year average of insurers’ experience in 2023-2025. Consequently, even insurers with high loss ratios in 2025 may expect to owe rebates if they were highly profitable in the prior two years.

Going into 2026, ACA Marketplace premiums increased at the steepest rate (over 20%) since 2018, the last time policy uncertainty fueled premium increases. If it turns out insurers overpriced premiums compared to how much enrollees spend on claims in 2026 and fall short of MLR ratio targets, insurers would likely have to pay their enrollees rebates in the future. 

In the small and large group markets, 2025 average simple loss ratios were 87% and 91%, respectively. Only fully-insured group plans are subject to the ACA MLR rule; about two-thirds of people with insurance through their work are in self-funded plans, to which the MLR threshold does not apply.

Rebate Payment Logistics

The 2026 rebate amounts in this analysis are still preliminary. Rebates or rebate notices are mailed out by the end of September and the federal government will post a summary of the total amount owed by each issuer in each state later in the year.

Insurers in the individual market may either issue rebates in the form of a check or premium credit. For people with employer coverage, the rebate may be shared between the employer and the employee depending on the way in which the employer and employee share premium costs.

If the amount of the rebate is exceptionally small (less than $5 for individual rebates and less than $20 for group rebates), insurers are not required to process the rebate, as it may not warrant the administrative burden required to do so.

Methods

This analysis is based on insurer-reported financial data from Health Coverage Portal TM, a market database maintained by Mark Farrah Associates, which includes information from the National Association of Insurance Commissioners. The Supplemental Health Care Exhibit dataset analyzed in this report does not include data from California HMOs regulated by California’s Department of Managed Health Care. Individual, Small, and Large Group Comprehensive plans were used for this analysis. All individual market figures in this analysis are for major medical insurance plans sold both on and off exchange. Health premiums earned and total incurred claims were set as zero if reported as a negative value. Simple loss ratios are calculated as the ratio of the sum of total incurred claims to the sum of health premiums earned. Only plans with an estimated unpaid current rebate value greater than zero were used to calculate the estimated total 2026 rebates.

Rebates for 2026 are based on preliminary estimates from insurers. In some years, final rebates are higher than expected and in other years, final rebates are lower.

Tracking Key Mental Health and Substance Use Policy Actions Under the Trump Administration

Published: Jul 10, 2026

In 2024, over 61 million adults in the U.S. experienced a mental illness and deaths due to suicide, gun violence, and drug overdose remained high. Additionally, the COVID-19 pandemic and necessary public health responses exacerbated an already existing mental health and substance use crises. At the same time, many people experience difficulties affording mental health treatment or finding providers. Among insured adults who described their mental health as fair or poor, 43% reported at least one time in the past year when they needed mental health services or medication but did not receive them; some groups – including communities of color, youth and young adults – experience greater barriers.

Many policy actions were initiated in response to these rising mental health and substance use concerns. During the first Trump administration, the SUPPORT Act – legislation that expanded access to opioid treatment and overdose prevention – was passed along with legislation that created the 988 crisis hotline. During the following Biden administration, federal policies focused on expanding coverage, improving access to care, implementing evidence-based treatments, and strengthening support for federal agencies, such as the Substance Abuse and Mental Health Administration (SAMHSA). Recent data shows that some opioid and mental health related indicators have stabilized or improved.

The second Trump administration, beginning in 2025, marked a change in federal mental health and substance use policy. The administration moved toward a heavier law-and-order approach and simultaneously narrowed the scope of federal leadership capacity in mental health and substance use services, while also continuing some treatment-focused initiatives (such as the SUPPORT Act reauthorization). Many of these policy directions are consistent with themes highlighted in President Trump’s campaign materials and are aligned with proposals in Project 2025.

This tracker lists and briefly describes key actions during President Trump’s second term, organized into the following four broad categories: Opioids (for example, signing the HALT Act); Mental Health (e.g., canceling school-based mental health grants); Federal Infrastructure/Data/Guidance (e.g., proposals to reduce and reorganize SAMHSA under another agency); and Gun Violence (e.g., rescinding community violence intervention grants). It will be updated as new changes occur. This tracker is not meant to be exhaustive; other state and federal policy changes may also affect mental health and substance use but are not captured here.

The tracker can be viewed in the order that each mental health or substance use policy action was implemented. Alternatively, the tracker can be filtered by category (Mental Health; Opioids/Substance Use Disorder; Federal Infrastructure/ Data/Guidance; and Gun Violence).

Table