What Drives Health Spending in the U.S. Compared to Other Countries

Published: Aug 2, 2024

An updated issue brief looks at the drivers of health spending in the U.S. and key differences between the U.S. and other large, wealthy nations. The analysis finds that people in the U.S. spent $5,683 more per person on health care compared to those in similarly large and wealthy countries. Almost 80% of the difference in spending came from inpatient and outpatient care costs. Many retail prescription drugs also cost more in the U.S. In 2021, the U.S. spent $1,635 per capita on prescription drugs, including over-the counter drugs, while comparable countries spent $944 on average

The analysis is available on the Peterson-KFF Health System Tracker, an online information hub dedicated to monitoring and assessing the performance of the U.S. health system.


News Release

The Share of Young Adults Who Received Mental Health Treatment Jumped 45% from 2019 to 2022, the Largest Increase Among Any Age Group

Overall, Women Are Twice As Likely As Men To Report Receiving Mental Health Treatment Over the Past Year

Published: Aug 1, 2024

A new KFF analysis shows that the share of young adults (ages 18 to 26) receiving mental health treatment rose by 45% between 2019 and 2022 – a steeper increase than in any other age group.

More than 1 in 4 young adults (26%) received counseling and/or medication for mental health concerns in 2022, up from 18% three years earlier, according to the analysis of the most up-to-date National Health Interview Survey (NHIS) data available.  That was a higher share than among adults in any other age group in 2022.

While other age groups experienced an increase in the share receiving treatment over the period as well, the increase was smaller: 29% for adults ages 27-50, 13% for adults ages 51-64, and 1% for adults 65 and above.

The spike in utilization among young adults roughly coincided with the onset and most challenging years of the COVID-19 pandemic – when school and work were significantly disrupted – although utilization of mental health services had been increasing even before the pandemic. Even so, research shows that among young adults with mental health conditions, many still report not receiving treatment.

Overall, 23% of adults received mental health treatment in 2022, up from 19% in 2019, the analysis showed. Specifically, the share of all adults saying they received mental health counseling rose from 10% in 2019 to 13% in 2022. At the same time, the share of adults reporting they took prescription medication for mental health conditions increased from 16% to 19%.

The analysis shows that women were nearly twice as likely as men to report receiving mental health treatment in the past year (29% vs. 17% in 2022). Other research suggests that men may be less likely to seek mental health care than women, and they are more likely to be uninsured and less likely to report a usual source of health care.

Other key takeaways include:

  • Across racial and ethnic groups, the share of people who said they received mental health treatment in 2022 was highest among White adults (28%) and lowest among Asian adults (9%). That compared to 16% each among Hispanic adults and Black adults.
  • Adults with insurance coverage are more likely to report receiving mental health care in the past year than adults without insurance coverage (25% vs. 11% in 2022).

Exploring the Rise in Mental Health Care Use by Demographics and Insurance Status

Authors: Nirmita Panchal and Justin Lo
Published: Aug 1, 2024

Many people in the United States experience mental health conditions, which raises questions about mental health service utilization patterns and what barriers exist with connecting people to services. Prior research suggests that mental health service utilization increased over time. This analysis explores more recent data, from 2019 to 2022, to understand the latest trends in utilization of mental health services and how it differs by demographics and insured status. In this analysis, receipt of mental health care is measured as the share of people who say they received mental health counseling and/or prescription medication for mental health concerns in the last year. Estimates shown are KFF analyses of National Health Interview Survey (NHIS) data among adults in the U.S. from 2019 to 2022.

In 2022, 23% of adults received mental health treatment, up from 19% in 2019 (Figure 1). Specifically, the share of adults saying they received mental health counseling in the past year increased from 10% in 2019 to 13% in 2022. Similarly, the share of adults reporting they took prescription medication for mental health conditions increased from 16% to 19% during the same period. Receipt of prescription medication remained consistently higher than counseling (19% vs. 13%, respectively, in 2022).

More Adults Report Receiving Mental Health Treatment in Recent Years

Compared to older adults, young adults (ages 18-26) were more likely to receive mental health treatment and experienced the highest increase in receipt of treatment over time. In 2022, 26% of young adults reported receiving counseling and/or prescription medications for mental health conditions in the past year, representing a significantly higher share compared to all other adults (ages 27 and above) (Figure 2).

Young adults also experienced the largest percent increase in the share of adults receiving mental health treatment from 2019 to 2022 (45%), followed by adults ages 27-50 (29%), 51-64 (13%), and 65 and above (1%) (Figure 2). Although receipt of mental health services has increased among young adults in recent years, other KFF analyses found that leading up to the pandemic, many young adults with mental health conditions did not receive treatment. The lack of treatment among this population may be linked to costs, transitioning from pediatric to adult health care, and difficulties accessing mental health services in college settings.

Adults Ages 18-26 Experienced the Largest Increase in the Share Reporting Use of Mental Health Services from 2019 to 2022

Women are nearly twice as likely to report receiving mental health treatment in the past year compared to men. In 2022, 29% of women reported receiving mental health services, compared to 17% of men (Figure 3). Research suggests men may be less likely to seek mental health care than women. Men are also more likely to be uninsured and less likely to report a usual source of health care. Separately, women are more likely than men to report experiencing mental health disorders, including serious mental illness.

Women Are Nearly Twice as Likely to Report Receiving Mental Health Treatment Than Men

Across racial and ethnic groups, past year receipt of mental health treatment was highest among White adults and lowest among Asian adults. In 2022, 28% of White adults reported receiving counseling and/or prescription medication for mental health conditions in the past year, compared to 16% of Hispanic and Black adults and 9% of Asian adults. A recent KFF poll found that, compared to their White peers, Hispanic, Black, and Asian adults disproportionately report challenges with mental health care utilization, including finding a provider who can understand their background and experiences, lack of information, and stigma or embarrassment. Additionally, the lack of a diverse mental health care workforce, absence of culturally informed treatment options, and stereotypes and discrimination associated with poor mental health may also contribute to limited mental health treatment among Black and Asian adults. Specifically among Asian people, cultural attitudes towards mental health are a factor that may lead to both lower reporting of mental health concerns and lower service utilization.

Receipt of Mental Health Treatment Remains Highest Among White Adults and Lowest Among Asian Adults

Adults with insurance coverage are more likely to report past year receipt of mental health care than adults without insurance coverage (25% vs. 11% in 2022, Figure 5). Despite higher utilization of mental health care over time – driven by insured adults – challenges remain with accessing services. For instance, KFF’s 2023 Consumer Survey found that 43% of insured adults with mental health concerns said there was a time in the past year when they did not get the mental health treatment they thought they needed, and 45% gave their insurance a negative rating for the availability of mental health providers. Further, KFF’s 2023 Employer Health Benefits Survey found that among employers offering health benefits, a higher share reported having a sufficient number of primary care providers in their plan’s networks (91%) compared to those who reported having a sufficient number of behavioral health care providers (67%).

Uninsured Adults Are Less Likely to Report Receiving Mental Health Treatment Than Insured Adults

This work was supported in part by the Well Being Trust. KFF maintains full editorial control over all of its policy analysis, polling, and journalism activities.

What to Know About Medicare Part D Premiums

Published: Aug 1, 2024

The Inflation Reduction Act of 2022 includes several provisions to lower prescription drug costs for people with Medicare and reduce drug spending by the federal government, including several changes to the Part D benefit. These changes, including a new $2,000 cap on out-of-pocket drug spending, will help to lower out-of-pocket costs for Part D enrollees but could also make it harder for some Part D plan sponsors to offer low-priced coverage, particularly sponsors of stand-alone prescription drug plans (PDPs).

In anticipation of potential premium increases by Part D sponsors to cover higher costs associated with a more generous Part D drug benefit, the Inflation Reduction Act included a provision designed to help limit annual premium increases. Specifically, the law caps growth in the base beneficiary premium to no more than 6% above the prior year’s amount, though it is important to note that the base premium is not the same as the individual plan-level premiums charged by Part D sponsors and paid by Part D enrollees. In addition, the Centers for Medicare & Medicaid Services (CMS) made changes to the Part D payment methodology for 2025 to better reflect expected increases in plan liability for the redesigned Part D benefit, with the goal of enhancing market stability. CMS has also announced a new voluntary demonstration to provide additional premium stabilization and enhanced protection against the risk of losses to stand-alone PDPs (see details below).

These FAQs provide context for understanding Medicare Part D premiums in 2025 and changes in recent years. While the impact of the Part D benefit redesign changes on the 2025 Part D market is unknown at this time, premiums for individual Part D plans are likely to continue to vary and annual plan-level premium increases may be higher or lower than 6% for 2025, as they were for 2024. The fall open enrollment period will present all Part D enrollees with the opportunity to evaluate their coverage and determine whether there are lower-cost plan options that meet their needs.

Key Takeaways

  • Changes to the Part D benefit in the Inflation Reduction Act will mean lower out-of-pocket costs for Part D enrollees but higher costs for Part D plans overall, leading to concerns about possible premium increases.
  • CMS is taking steps to mitigate potential premium increases through a new demonstration program for stand-alone drug plans, as well as payment changes designed to bring greater stability to the Part D market in 2025.
  • The Inflation Reduction Act includes a provision to cap growth in the base beneficiary premium to 6%. For 2025, the base premium is $36.78, an increase of $2.08 or 6% over the 2024 base premium. Although this 6% cap doesn’t apply to the individual premiums that plans charge, it does help to limit premium increases.
  • Actual Part D plan premiums for 2025 are not yet known and will be announced in September, but premiums are expected to vary, with lower monthly premiums for Medicare Advantage drug plans than stand-alone drug plans, on average, as in 2024. The annual open enrollment period, which runs from October 15 to December 7, presents an opportunity for Part D enrollees to compare plans and shop for lower-priced coverage that meets their needs.

How is the Part D benefit changing for 2025?

The Inflation Reduction Act includes a number of changes to the Medicare Part D drug benefit, including a new $2,000 cap on out-of-pocket drug spending in 2025 for enrollees in Medicare Part D plans. It also requires Part D plans and drug manufacturers to pay a greater share of costs for Part D enrollees with drug costs in the catastrophic coverage phase (above the $2,000 spending cap) and reduces Medicare’s reinsurance liability. The law also eliminates the coverage gap phase as of 2025, where enrollees are currently responsible for paying 25% of their drug costs, drug manufacturers provide a 70% price discount on brand-name drugs, and plans pay 5% of costs.

As of 2025, once enrollees have met their deductible (if their plan includes one), they will enter the initial coverage phase, where they will face cost sharing of 25% under the standard benefit (as in 2024), manufacturers will provide a 10% price discount, and Part D plans will pay 65% (Figure 1). Once enrollees reach the out-of-pocket spending cap and enter the catastrophic coverage phase, plans will be required to pay 60% of drug costs, up from 20% in 2024, and drug manufacturers will be required to provide a 20% price discount on brand-name drugs. Medicare’s share of total costs in the catastrophic phase will decrease from 80% to 20% for brand-name drugs and from 80% to 40% for generic drugs.

Although Part D plans will be taking on additional liability for high drug costs in 2025, Medicare will continue to limit their liability for higher-than-expected drug costs through risk corridors, a risk sharing mechanism that has been in place since the Part D program started in 2006. In addition, CMS is launching a new voluntary demonstration to provide enhanced risk-corridor protection against overall losses for participating stand-alone PDPs to help stabilize the market (see details below).

The Inflation Reduction Act Made Changes to the Share of Medicare Part D Drug Costs Paid by Enrollees, Plans, Drug Manufacturers, and Medicare in 2024 and 2025

What is known about Part D premiums for 2025?

CMS announced the Part D base beneficiary premium for 2025 on July 29, 2024 (this announcement typically occurs at the end of July each year). For 2025, the base beneficiary premium is $36.78, an increase of $2.08, or 6%, over the 2024 base premium of $34.70. A provision in the Inflation Reduction Act capped annual growth in the base beneficiary premium to 6% over the prior year’s amount (see details below).

The base premium is calculated as a share of average plan bids for basic Part D benefits submitted by both stand-alone PDPs and Medicare Advantage drug plans (MA-PDs). All Part D plans submit a bid for basic benefits, while plans that offer enhanced benefits, such as a lower Part D deductible, also report the portion of their bid that is for basic versus enhanced benefits. (In 2024, most Part D enrollees were in enhanced plans: 72% of all Part D enrollees, including 79% of MA-PD enrollees and 62% of PDP enrollees). Each year, CMS averages standardized bids submitted by PDPs and MA-PDs to cover basic Part D benefits and calculates the National Average Monthly Bid Amount, or NAMBA. The calculation of the base beneficiary premium is based on the national average bid adjusted for individual reinsurance subsidies. Because the base premium is an average across both types of plans and reflects the cost of basic benefits only, this amount does not equal what a Part D enrollee will pay for coverage in any given Part D plan.

Actual premiums for Part D plans available in 2025 will be released in September, as they are every year, just prior to the October 1 start date of marketing for the coming plan year and the open enrollment period that runs from October 15 to December 7.

How will the new CMS demonstration help to stabilize the Part D market for 2025?

CMS has announced new premium stabilization measures for stand-alone PDPs as part of a voluntary Section 402 demonstration program that will be in effect for 2025 and two additional years (though the exact parameters may vary beyond 2025). Because CMS observed more variation in plan bids for 2025 among PDPs than MA-PDs, the new Part D Premium Stabilization Demonstration is targeted exclusively to PDPs. CMS’s rationale for this demonstration is to stabilize the PDP market in the initial transition years of the Inflation Reduction Act’s Part D benefit improvements, and to test whether the premium changes and revised risk corridors “increase the efficiency and economy” of services as the law’s Part D benefit changes are fully implemented. Similar Section 402 demonstrations were conducted under the George W. Bush Administration in the early years of Part D as the program was being rolled out.

The Part D Premium Stabilization Demonstration has three components for PDPs that choose to participate:

  • Lowers the base beneficiary premium by $15 (or less if a $15 reduction would result in a plan premium of less than $0).
  • Limits total Part D premium increases to $35 between 2024 and 2025 (applied after taking into account the $15 reduction in the base beneficiary premium).
  • Narrows the upper thresholds of the risk corridors to reduce the range of spending where PDPs bear full risk for actual costs higher than their bids and increases the government’s risk sharing for a portion of plan losses from 80% to 90% (Figure 2).

What is the Inflation Reduction Act’s Part D premium stabilization provision and what impact has it had to date?

Beginning in 2024, the premium stabilization provision of the Inflation Reduction Act caps annual growth in the Part D base beneficiary premium at 6%. For 2024, the first year the premium stabilization provision was in effect, the Part D base beneficiary premium was $34.70, a 6% increase over the 2023 amount of $32.74 (Figure 3). Without the premium stabilization provision, the 2024 base beneficiary premium would have been $39.35, an increase of 20%, reflecting a higher average monthly bid amount for basic Part D coverage in 2024 ($68.28) than in 2023 ($34.71).

For 2025, the Part D base beneficiary premium is $36.78, capped at a 6% increase over the 2024 amount. Without premium stabilization, the 2025 base premium would have been $55.98, 42% higher than the 2024 unadjusted base premium (61% higher than the base premium with the 6% cap in 2024). Between 2024 and 2025, the average monthly bid amount for basic benefits increased from $64.28 to $179.45. (See below for examples of how the 6% cap on the base premium helps to limit growth in premiums paid by enrollees for two hypothetical plans.)

The Medicare Part D Premium Stabilization Provision Limits the Annual Increase in the Base Premium to 6%, Which Helps to Limit Growth in Premiums That Medicare Beneficiaries Pay for Part D Coverage

What other changes has CMS adopted to help to limit Part D premium increases for 2025?

In addition to the premium stabilization measures described above, CMS has also made changes to its plan payment methodologies for the 2025 plan year. While technical in nature, these changes are designed to enhance market stability through an improved payment methodology that accounts for the substantial changes to the Part D benefit for 2025.

  • Updates to the Part D risk adjustment model: The Part D risk adjustment model predicts plan liability for prescription drugs. The model is used to determine the amount of “direct subsidy” prospective payments that Part D plans receive from the federal government, which are adjusted for the health status of a plan’s enrollees. Enrollees with higher risk scores (which vary above and below an average of 1.0) translate to higher expected plan costs and higher subsidy payments. For 2025, CMS took steps to improve the predictive ability of the Part D risk adjustment model, including by recalibrating the model based on more current diagnosis and spending data than used in previous years.
  • Using different normalization factors for MA-PDs and PDPs: For individual Part D enrollees, risk scores are calculated based on individual demographic and disease factors, and then adjustments are applied, including a “normalization factor.” New for 2025, CMS is applying different normalization factors for MA-PDs and PDPs, which will have the effect of increasing PDP risk scores relative to what they would have been otherwise. Historically, due to differences in coding and utilization patterns across both types of plans, the Part D risk adjustment model has underpredicted costs for PDP plans and overpredicted costs for MA-PD plans, which has had the effect of increasing standardized plan bids (and premiums) for PDPs relative to MA-PDs. Using separate normalization factors is expected to increase PDP risk scores, which would lead to higher direct subsidy payments, which could mitigate potential premium increases to help stabilize the PDP market. Because MA-PD sponsors can use rebate dollars from Medicare payments to lower or eliminate their Part D premiums, most MA-PD enrollees pay no premium for their Part D drug coverage (see details below).

What factors contributed to the increase in plan bids for basic benefits since 2023?

For 2025, the new $2,000 out-of-pocket spending cap and the increase in Part D plan liability for drug costs incurred by enrollees above the cap, combined with the reduction in Medicare reinsurance, as explained above, are factors in the higher national average monthly plan bid. CMS has emphasized that while the NAMBA increased substantially for 2025, this will be accompanied by substantially higher upfront payments from the government to plans in the form of direct subsidies for basic benefits covered by the plan – a shift from previous years when reinsurance payments accounted for a much larger share of Part D spending than direct subsidy payments. CMS estimates that the average direct subsidy payment will be $142.67, or 80% of the national average bid amount of $179.45.

For 2024, part of the explanation for the higher national average bid for basic benefits was the elimination of Part D enrollees’ 5% coinsurance requirement for drug costs in the catastrophic coverage phase and the increase in plans’ share of these costs from 15% to 20%. Another factor was a revision to the definition of Part D’s “negotiated price” that took effect in 2024 (not to be confused with the new drug price negotiation program established by the Inflation Reduction Act). The definition of negotiated price has been in place since the start of Part D, and it matters because this is the price upon which beneficiary cost sharing is based at the point of sale, which is particularly relevant when enrollees face a coinsurance requirement. Under the change, plans are now required to pass along all price concessions they receive from pharmacies, which help to lower the plan’s total costs, to enrollees at the point of sale. Enrollees will benefit from this change in the form of lower out-of-pocket drug costs, but plans were expected to face higher costs and lower revenues.

What do Part D premiums look like in 2024?

While the impact of the Part D benefit redesign changes on the 2025 Part D market is currently unknown, premiums for individual Part D plans are likely to continue to vary in 2025, as they do in 2024 – ranging from $0 to $100 per month or more. This is in part why Part D enrollees are encouraged to shop for plans during the annual open enrollment period in the fall.

For 2024, the average monthly premium for Part D coverage is $25, including premiums for both Medicare Advantage drug plans (MA-PDs) and PDPs. The average monthly premium for drug coverage in MA-PDs ($9) is substantially lower than in PDPs ($43). In 2024, 57% of all Part D enrollees are in MA-PDs in 2024 and 43% are in stand-alone prescription drug plans (PDPs).

The lower MA-PD average premium is heavily weighted by the predominance of zero-premium plans in the MA-PD market, because, as noted above, MA-PD sponsors can use rebate dollars from Medicare payments to lower or eliminate their Part D premiums. For 2024, all Medicare beneficiaries had access to zero-premium MA-PD plans – 27 on average – whereas only 1 PDP was available for zero premium for non-LIS enrollees in only 14 out of 34 PDP regions.

Even with changes to the Part D benefit between 2023 and 2024 that increased plan liability, the average monthly premium for Part D coverage across both plan types combined was the same in both years ($25) (Figure 4). The average MA-PD premium decreased by $1 (from $10 to $9), while the average PDP premium increased by $3 (from $40 to $43).

The $43 average PDP premium is based on enrollment in March 2024 after the end of open enrollment. This amount is lower than the estimated $48 premium for 2024, which was calculated in the fall of 2023 before open enrollment for 2024 and did not account for plan switching by current enrollees or plan choices by new enrollees during the open enrollment period. The fact that the actual average PDP premium for 2024 is lower than the estimated premium indicates that some PDP enrollees opted for lower-premium plans during open enrollment.

What share of Part D enrollees pay no premium for drug coverage?

Overall, nearly half of the 30.1 million Part D enrollees who are not receiving Part D low-income subsidies (LIS), or 14.3 million enrollees, pay no premium for their drug coverage in 2024 (Figure 5). The share of Part D enrollees paying no premium is heavily weighted by MA-PD enrollees. In 2024, three-quarters of MA-PD enrollees without LIS pay no premium for their drug coverage compared to 13% of PDP enrollees.

Nearly Half of Part D Enrollees Without Low-Income Subsidies Pay No Monthly Premium for Part D Coverage in 2024 - Predominantly MA-PD Enrollees

How does the Inflation Reduction Act premium stabilization provision help to limit growth in Part D premiums?

The premium for an individual plan is calculated as the base premium plus the difference between the plan’s bid and the national average bid (the NAMBA). Examples with two hypothetical plans illustrate how the 6% cap on growth in the base premium limits premium growth for an individual plan (Table 1).

For both plans, the 6% premium stabilization cap mitigates the increase in plan premiums between 2023 and 2024. For Plan A, with the 6% cap in effect, the premium increased by 10%, but without the 6% stabilization cap, the premium would have increased by 31%. Similarly, for Plan B, the 6% cap limits premium growth to 19%, compared to a 32% increase without the cap.

The Premium Stabilization Provision Helps to Limit Growth in Medicare Part D Premiums

This work was supported in part by Arnold Ventures. KFF maintains full editorial control over all of its policy analysis, polling, and journalism activities.

Poll Finding

Well-being of Children and Parents: Highlights from the KFF Survey on Racism, Discrimination, and Health

Published: Aug 1, 2024

Findings

In recent years, there have been growing concerns about children’s mental health and well-being, particularly since the COVID-19 pandemic and with a rise in awareness and exposure to racism and discrimination amid instances of racial injustice, including the killings of George Floyd and Breonna Taylor, and growth in anti-Asian sentiment. Previous reporting from KFF’s Racism, Discrimination, and Health Survey examined experiences with and impacts of unfair treatment and discrimination, access to and use of mental health care, and loneliness and social support networks among adults. Based on responses from parents, this analysis examines parents’ assessments of their children’s mental health and well-being, children’s use of mental health care, children’s experiences with unfair treatment, and parents’ worries about their children as well as their hopes for their future.

The analysis reveals some areas of shared challenges across parents, as well as several areas where experiences differ across race and ethnicity. For example, while similar shares of parents across racial and ethnic groups say their children’s mental health is fair or poor, a larger share of White parents (32%) compared to Black (20%), Hispanic (23%), and Asian (14%) parents report that their children have received mental health care services in the past three years. Moreover, while about half of parents of school-aged children overall say any of their children have ever been treated differently or unfairly in one of several ways, larger shares of Black (40%), Hispanic (23%), and Asian parents (26%) say such treatment occurred specifically because of their child’s race or ethnicity compared to White parents (16%). The survey further shows a strong association between these negative experiences, and parent’s reported mental health status of their children. More broadly, Black, Hispanic, and Asian parents are more worried about their children and families compared to White parents, including worries about violence and experiences with racism and discrimination. At the same time, they remain more confident that life will be better for the next generation.

The findings highlight the importance of efforts to address racial disparities in mental health care use among children, as well as the importance of addressing other factors that influence children’s health and well-being, including unfair treatment and underlying structural inequities in social and economic factors.

Who are Parents?

For purposes of this brief, parents are defined as adults who say they are the parent or guardian of a child under age 18 living in their home. Parents as a group are somewhat more racially and ethnically diverse than the overall U.S. adult population, in part a reflection of the aging White population. Among adults who have a child under age 18 living with them, more than one in five (22%) are Hispanic, 15% identify as Black, and 8% are Asian. 1  Parents face more financial challenges relative to those without a child in the home, including being more likely to say they are just able to afford their bills (37% vs. 30%) or have difficulty affording their bills each month (16% vs. 13%).

Parents’ Perceptions of Children’s Mental Health and Use of Mental Health Care

Black, Hispanic, and Asian parents are less likely than White parents to say their children received mental health services in the past three years. About nine in ten (88%) parents overall say their children’s mental health is excellent, very good, or good, while about one in ten (12%) report their children’s mental health as fair or poor, shares that do not differ significantly across racial and ethnic groups. White parents (32%) are more likely to say that any of their children have received mental health services in the past three years than are Hispanic (23%), Black (20%), and Asian parents (14%). Among parents overall, three-quarters (75%) of those who describe their children’s mental health as fair or poor say at least one of their children received mental health services compared to about one in five (21%) of those who say their children’s mental health is excellent, very good, or good.

One in Three White Parents Say Their Child Has Received Mental Health Care Services in the Past Three Years, Compared to Smaller Shares of Black, Hispanic, and Asian Parents

About one in seven parents (14%) say there was a time in the past three years when they thought their children might need mental health services or medication but did not receive them, a share that rises to more than four in ten (45%) among parents who say their children’s mental health is fair or poor. Similar shares of Hispanic, Black, Asian, and White parents say there was a time in the past three years when their children went without needed mental health services or medication. Among all parents who say their child went without needed care, seven in ten (70%) say they tried to find a provider for their children, while three in ten (30%) did not. Overall, adults identify scheduling delays, cost concerns, difficulty finding a provider who could understand their background and experiences, lack of information, and fear and embarrassment as challenges to getting mental health care for themselves or their children.2 

One in Seven Parents Say Their Children Went Without Needed Mental Health Services in the Past Three Years, Rising to Four in Ten Among Parents With a Child in Fair or Poor Mental Health

Children’s Experiences with Unfair and Negative Treatment

About half of parents of school-aged children3  say any of their children have ever been treated unfairly or negatively, with larger shares of Black, Hispanic, and Asian parents than White parents attributing this treatment to their child’s race or ethnicity. The types of treatment asked about in the survey include being called names or racial slurs (32%), being treated unfairly by a teacher or other adult (31%), being hurt, threatened, or harassed in person or online (30%), or having a teacher or other adult assume something bad about them (25%). Over half of White (57%) and Black (52%) parents and nearly four in ten Asian (39%) and Hispanic (36%) parents say their children have ever had at least one of these negative experiences. Notably, four in ten Black parents (40%) and about a quarter of Asian (26%) and Hispanic (23%) parents say their child had at least one of these negative experiences and that their race or ethnicity was a major or minor reason for this treatment, compared to a smaller share of White parents (16%).

Half of Parents With School- Aged Children Say Their Children Have Ever Had a Negative Experience

There is a strong association between reported negative experiences among children and parents’ perceptions of their children’s mental health and well-being. Parents who say their child had at least one of the negative experiences asked about in the survey are more likely to say their children’s mental health is fair or poor compared with those who say their child did not have one of these experiences (20% vs. 6%), a pattern that is consistent across racial and ethnic groups.

Parents Whose Children Have Had At Least One Negative Experience Are More Likely To Say Their Children Are in Fair or Poor Mental Health

Many (45%) parents of school-aged children who had a negative experience say their child received mental health care in the past three years, but among these parents, Black parents are less likely than White parents to say their child received care. Perhaps reflecting greater health care access, White parents whose children who had at least one negative experience are more likely to report that their children have received mental health care services in the past three years compared to their Black counterparts (50% vs. 32%). While about four in ten (45%) parents of children who had a negative experience say their child saw a mental health care provider in the past three years, some also report unmet mental health care needs among their children. One-quarter (25%) of these parents say there was a time in the past three years when they thought their child might need mental health services or medication but didn’t get them, a share that is similar across racial and ethnic groups.

Black Parents of Children Who Have Had at Least One Negative Experience Are Less Likely Than White Parents To Say Their Children Received Needed Mental Health Treatment

Parents’ Worries, Challenges, and Optimism

While one in five parents across racial and ethnic backgrounds say they worry about their children’s health and well-being daily or almost daily, Black and Hispanic parents are more likely than White parents to say they worry about a range of other issues affecting their families. Black (18%) and Hispanic (18%) parents are more likely to say they experience worry or stress “every day” or “almost every day” about their child being the victim of violence at their school compared to White parents (11%). Similarly, Black (16%) and Hispanic (11%) parents are more likely to say they frequently worry about the possibility of them or someone in their family being the victim of gun violence than are White (3%) parents. In addition, larger shares of Black (15%), Asian (12%), and Hispanic (7%) parents worry about experiences with racism and discrimination than do White parents (2%).

Beyond these worries, parents also express financial concerns. Overall, parents’ top worries are about work and employment (23% worry daily or almost daily), followed by providing for their family’s basic needs (21%). Likely reflecting lower household incomes, three in ten (30%) Black parents say they frequently worry about providing for their family’s basic needs, higher than the shares of Asian (20%), White (20%), and Hispanic (18%) parents who say the same.

Parents' Top Worries Include Work, Providing for Their Families, and Their Children's Well-Being

Many parents report financial challenges that can have implications for their children’s well-being, including higher shares of Black parents. Overall, at least one in five parents across racial and ethnic backgrounds say they have had problems paying for necessities, health care, and childcare in the past year. Reflecting lower incomes and an array of underlying structural inequities, Black parents are more likely than White parents to report these challenges. For example, larger shares of Black parents (61%) say they had problems paying for food, housing, transportation, or other necessities in the past year compared to White parents (36%). Paying for health care also is a concern among parents, with at least one in four parents across racial and ethnic groups saying this has been a problem in the past year for them and their families. Moreover, at least one in five parents say they had problems finding or affording childcare, including larger shares of Black (31%) and Asian parents (29%) relative to White (21%) parents, and about one in five parents say they have had problems getting or keeping a job, with higher shares of Black (36%) and Hispanic (27%) parents reporting this than White parents (18%).

Black Parents More Likely to Say they have Had Problems Paying for Basic Necessities in the Past 12 Months Than White Parents

Black, Hispanic, and Asian parents are more confident than White parents that life for the next generation will be better. Six in ten or more Asian (71%), Black (64%), and Hispanic (60%) parents say they are either “very confident” or “somewhat confident” that life overall for the next generation will be better than it has been for their generation, compared to about one in three (34%) White parents who say the same. The differences in the shares of parents who say they are “very” confident are especially stark, with only 6% of White parents saying this, compared to about one in five Black (27%), Asian (26%) and Hispanic (22%) parents.

Black, Hispanic, and Asian Parents Are More Optimistic About the Future Than White Parents

Methodology

The Survey on Racism, Discrimination, and Health was designed and analyzed by researchers at KFF. The survey was conducted June 6 – August 14, 2023, online and by telephone among a nationally representative sample of 6,292 U.S. adults in English (5,706), Spanish (520), Chinese (37), Korean (16), and Vietnamese (13).

The sample includes 5,073 adults who were reached through an address-based sample (ABS) and completed the survey online (4,529) or over the phone (544). An additional 1,219 adults were reached through a random digit dial telephone (RDD) sample of prepaid (pay-as-you-go) cell phone numbers. Marketing Systems Groups (MSG) provided both the ABS and RDD sample. All fieldwork was managed by SSRS of Glen Mills, PA; sampling design and weighting was done in collaboration with KFF.

Sampling strategy:The project was designed to reach a large sample of Black adults, Hispanic adults, and Asian adults. To accomplish this, the sampling strategy included increased efforts to reach geographic areas with larger shares of the population having less than a college education and larger shares of households with a Hispanic, Black, and/or Asian resident within the ABS sample, and geographic areas with larger shares of Hispanic and non-Hispanic Black adults within the RDD sample.

The ABS was divided into areas (strata) based on the share of households with a Hispanic, Black, and/or Asian resident, as well as the share of the population with a college degree within each Census block group. To increase the likelihood of reaching the populations of interest, strata with higher incidence of Hispanic, Black, and Asian households, and with lower educational attainment, were oversampled in the ABS design. The RDD sample of prepaid (pay-as-you-go) cell phone numbers was disproportionately stratified to reach Hispanic and non-Hispanic Black respondents based on incidence of these populations at the county level.

Incentives:Respondents received a $10 incentive for their participation, with interviews completed by phone receiving a mailed check and web respondents receiving a $10 electronic gift card incentive to their choice of six companies, a Visa gift card, or a CharityChoice donation.

Community and expert input:Input from organizations and individuals that directly serve or have expertise in issues facing historically underserved or marginalized populations helped shape the questionnaire and reporting. These community representatives were offered a modest honorarium for their time and effort to provide input, attend meetings, and offer their expertise on dissemination of findings.

Translation:After the content of the questionnaire was largely finalized, SSRS conducted a telephone pretest in English and adjustments were made to the questionnaire. Following the English pretest, Cetra Language Solutions translated the survey instrument from English into the four languages outlined above and checked the CATI and web programming to ensure translations were properly overlayed. Additionally, phone interviewing supervisors fluent in each language reviewed the final programmed survey to ensure all translations were accurate and reflected the same meaning as the English version of the survey.

Data quality check:A series of data quality checks were run on the final data. The online questionnaire included two questions designed to establish that respondents were paying attention and cases were monitored for data quality including item non-response, mean length, and straight lining. Cases were removed from the data if they failed two or more of these quality checks. Based on this criterion, 4 cases were removed.

Weighting:The combined cell phone and ABS samples were weighted to match the sample’s demographics to the national U.S. adult population using data from the Census Bureau’s 2021 Current Population Survey (CPS). The combined sample was divided into five groups based on race or ethnicity (White alone, non-Hispanic; Hispanic; Black alone, non-Hispanic; Asian alone, non-Hispanic; and other race or multi-racial, non-Hispanic) and each group was weighted separately. Within each group, the weighting parameters included sex, age, education, nativity, citizenship, census region, urbanicity, and household tenure. For the Hispanic and Asian groups, English language proficiency and country of origin were also included in the weighting adjustment. The general population weight combines the five groups and weights them proportionally to their population size.

A separate weight was created for the American Indian and Alaska Native (AIAN) sample using data from the Census Bureau’s 2022 American Community Survey (ACS). The weighting parameters for this group included sex, education, race and ethnicity, region, nativity, and citizenship. For more information on the AIAN sample including some limitations, adjustments made to make the sample more representative, and considerations for data interpretation, see Appendix 2.

All weights also take into account differences in the probability of selection for each sample type (ABS and prepaid cell phone). This includes adjustment for the sample design and geographic stratification of the samples, and within household probability of selection.

The margin of sampling error including the design effect for the full sample is plus or minus 2 percentage points. Numbers of respondents and margins of sampling error for key subgroups are shown in the table below. Appendix 1 provides more detail on how race and ethnicity was measured in this survey and the coding of the analysis groups. For results based on other subgroups, the margin of sampling error may be higher. All tests of statistical significance account for the design effect due to weighting. Dependent t-tests were used to test for statistical significance across the overlapping groups.

Sample sizes and margins of sampling error for other subgroups are available by request. Sampling error is only one of many potential sources of error and there may be other unmeasured error in this or any other public opinion poll. KFF public opinion and survey research is a charter member of the Transparency Initiative of the American Association for Public Opinion Research.

GroupN (unweighted)M.O.S.E.
Total6,292± 2 percentage points
Race/Ethnicity
White, non-Hispanic (alone)1,725± 3 percentage points
Black (alone or in combination)1,991± 3 percentage points
Hispanic1,775± 3 percentage points
Asian (alone or in combination)693± 5 percentage points
American Indian and Alaska Native (alone or in combination)267± 8 percentage points
Parents
Parent or guardian of a child under 181,919± 4 percentage points

Endnotes

  1. Many surveys and data analyses classify individuals into non-overlapping racial and ethnic categories using single-race and Hispanic ethnicity categories and grouping those who identify as more than one race into a “multiracial” or “other” category. To allow for better representation of experiences of the growing shares of people who identify as multiracial, this report uses an “alone or in combination” approach for classifying individuals so that they are represented within each racial and ethnic group with which they identify, resulting in overlapping racial and ethnic categories. For example, responses from someone who identifies as both Black and Asian are included in the results for both Black adults and Asian adults. The exception is reporting on White adults, who in this report are defined as those who identify as non-Hispanic and select White as their only race. ↩︎
  2. This question was asked among those who thought they or their child needed mental health care services but did not try to find a mental health care provider. See topline for full question wording. ↩︎
  3. Parents of school-aged children refers to adults who said they are the parent or guardian of any child under age 18 living with them and said that at least one of their children is between the ages of 5 and 17 and currently enrolled in school. See topline for full question wording. ↩︎

Addressing Youth Mental Health with Social and Emotional Learning in Schools

Author: Nirmita Panchal
Published: Jul 31, 2024

Approximately 1 in 5 teens in the United States experience symptoms of anxiety or depression and many youth experience bullying and violence, which can have adverse effects on their mental health. Schools can play a role in promoting mental health and connecting youth to treatment. One approach that many schools have implemented is social and emotional learning, which teaches skills such as emotional management, resilience, and relationship building. Social and emotional learning in schools has received more attention in recent years. For instance, the Surgeon General’s 2021 Youth Mental Health Advisory recommended the expansion of social and emotional programs. Meanwhile, critics argue that these programs should be banned from schools, suggesting that they take away from academic instruction time and incorporate critical race theory.

Social and emotional learning programs focus on developing intrapersonal and interpersonal skills; however, specific program content and integration strategies can vary widely across schools. Goals, benchmarks, and guidelines for social and emotional learning programs in schools are typically developed at the state level. Individual schools may then implement social and emotional learning in a number of ways, including through academic instruction (e.g. group projects to encourage collaboration, or complex problem-solving to encourage persistence); through separate, dedicated time for social and emotional learning instruction; or through schoolwide measures (e.g. disciplinary methods that incorporate social and emotional learning competencies). Regardless of how social and emotional learning is integrated, the content typically focuses on intrapersonal and interpersonal skill building, including self-awareness, self-management, responsible decision making, social awareness, and relationship skills.

Sixty-three percent of public schools in the U.S. had a formal curriculum to support their students’ social and emotional skill development in the 2023-2024 school year (Figure 1). These curricula are more common in elementary schools (74%) compared to middle (58%) and high schools (43%). Additionally, among schools with a formal curriculum, 81% of teachers and 51% of non-teaching staff received training or professional development to implement their school’s curriculum.

Three out of Four Public Elementary Schools Have a Formal Curriculum to Support Students' Social and Emotional Skill Development

Among schools with a social and emotional learning curriculum in the 2023-2024 school year, 72% found that the curriculum was moderately, very, or extremely effective in improving student outcomes. Social and emotional learning has been linked to positive outcomes for students, including fostering emotional intelligence, reducing emotional distress, fostering empathy, developing and maintaining peer relationships, and academic improvement. However, measuring outcomes of social and emotional learning programs can be difficult as implementation strategies and content may vary between programs.

Common barriers to implementing social and emotional learning curricula in schools include lack of funding and materials. Thirty-seven percent of public schools reported not having a formal curriculum for social and emotional skill development in the 2023-24 school year. Among these schools, a lack of time (46%), funding (37%), and materials and resources (34%) were the main reasons for not having a formal curriculum (Figure 2). Several funding opportunities to support social and emotional learning have opened in the last decade, including the Every Student Succeeds Act in 2015, and more recently, the American Rescue Plan Act (ARPA) in 2021, which required school districts to use a portion of funds to support students’ mental health needs. Analyses of how school districts planned to spend ARPA funds found that student social-emotional development was a priority, with many districts allocating some funds to social and emotional instruction materials and training. However, schools often have many competing budget priorities, such as providing funds to address staffing shortages and academic recovery in light of the pandemic, which may limit the amount of funds they have available for social and emotional learning.

Top Reasons for Public Schools Not Having Formal Curricula for Social and Emotional Skills Development

As support for social and emotional learning in schools has grown in recent years, so has opposition. Opponents argue that social and emotional learning in schools can take away from academic instruction time; and, more recently, that it incorporates critical race theory and gender identity lessons. This has led to the introduction of several state bills – including Indiana, Iowa, Montana, North Dakota, Oklahoma, Maine, and New Hampshire – banning or limiting social and emotional learning in schools. Supporters, however, argue that social and emotional learning is an evidence-based approach that allows schools to focus on the “whole child”, leading to a wide array of positive outcomes, such as academic achievements, emotional intelligence, and growth opportunities for all students regardless of their backgrounds. This support was recently reflected in a bipartisan resolution designating a “National Social and Emotional Learning Week” which also received recognition from President Biden.

This work was supported in part by the Well Being Trust. KFF maintains full editorial control over all of its policy analysis, polling, and journalism activities.

988 Suicide & Crisis Lifeline: Two Years After Launch

Published: Jul 29, 2024

On July 16, 2022, the federally mandated crisis number, 988, became available to all landline and cell phone users at no charge. This three-digit number connects users–via phone, text, or chat–to a network of over 200 local and state-funded crisis call centers, providing access to the 988 Suicide & Crisis Lifeline for crisis counseling, resources, and referrals. Federal investments supported the launch and implementation of 988, but ongoing funding of local call centers, as well as the development of other core components of the behavioral health crisis continuum, largely falls to state and local governments.

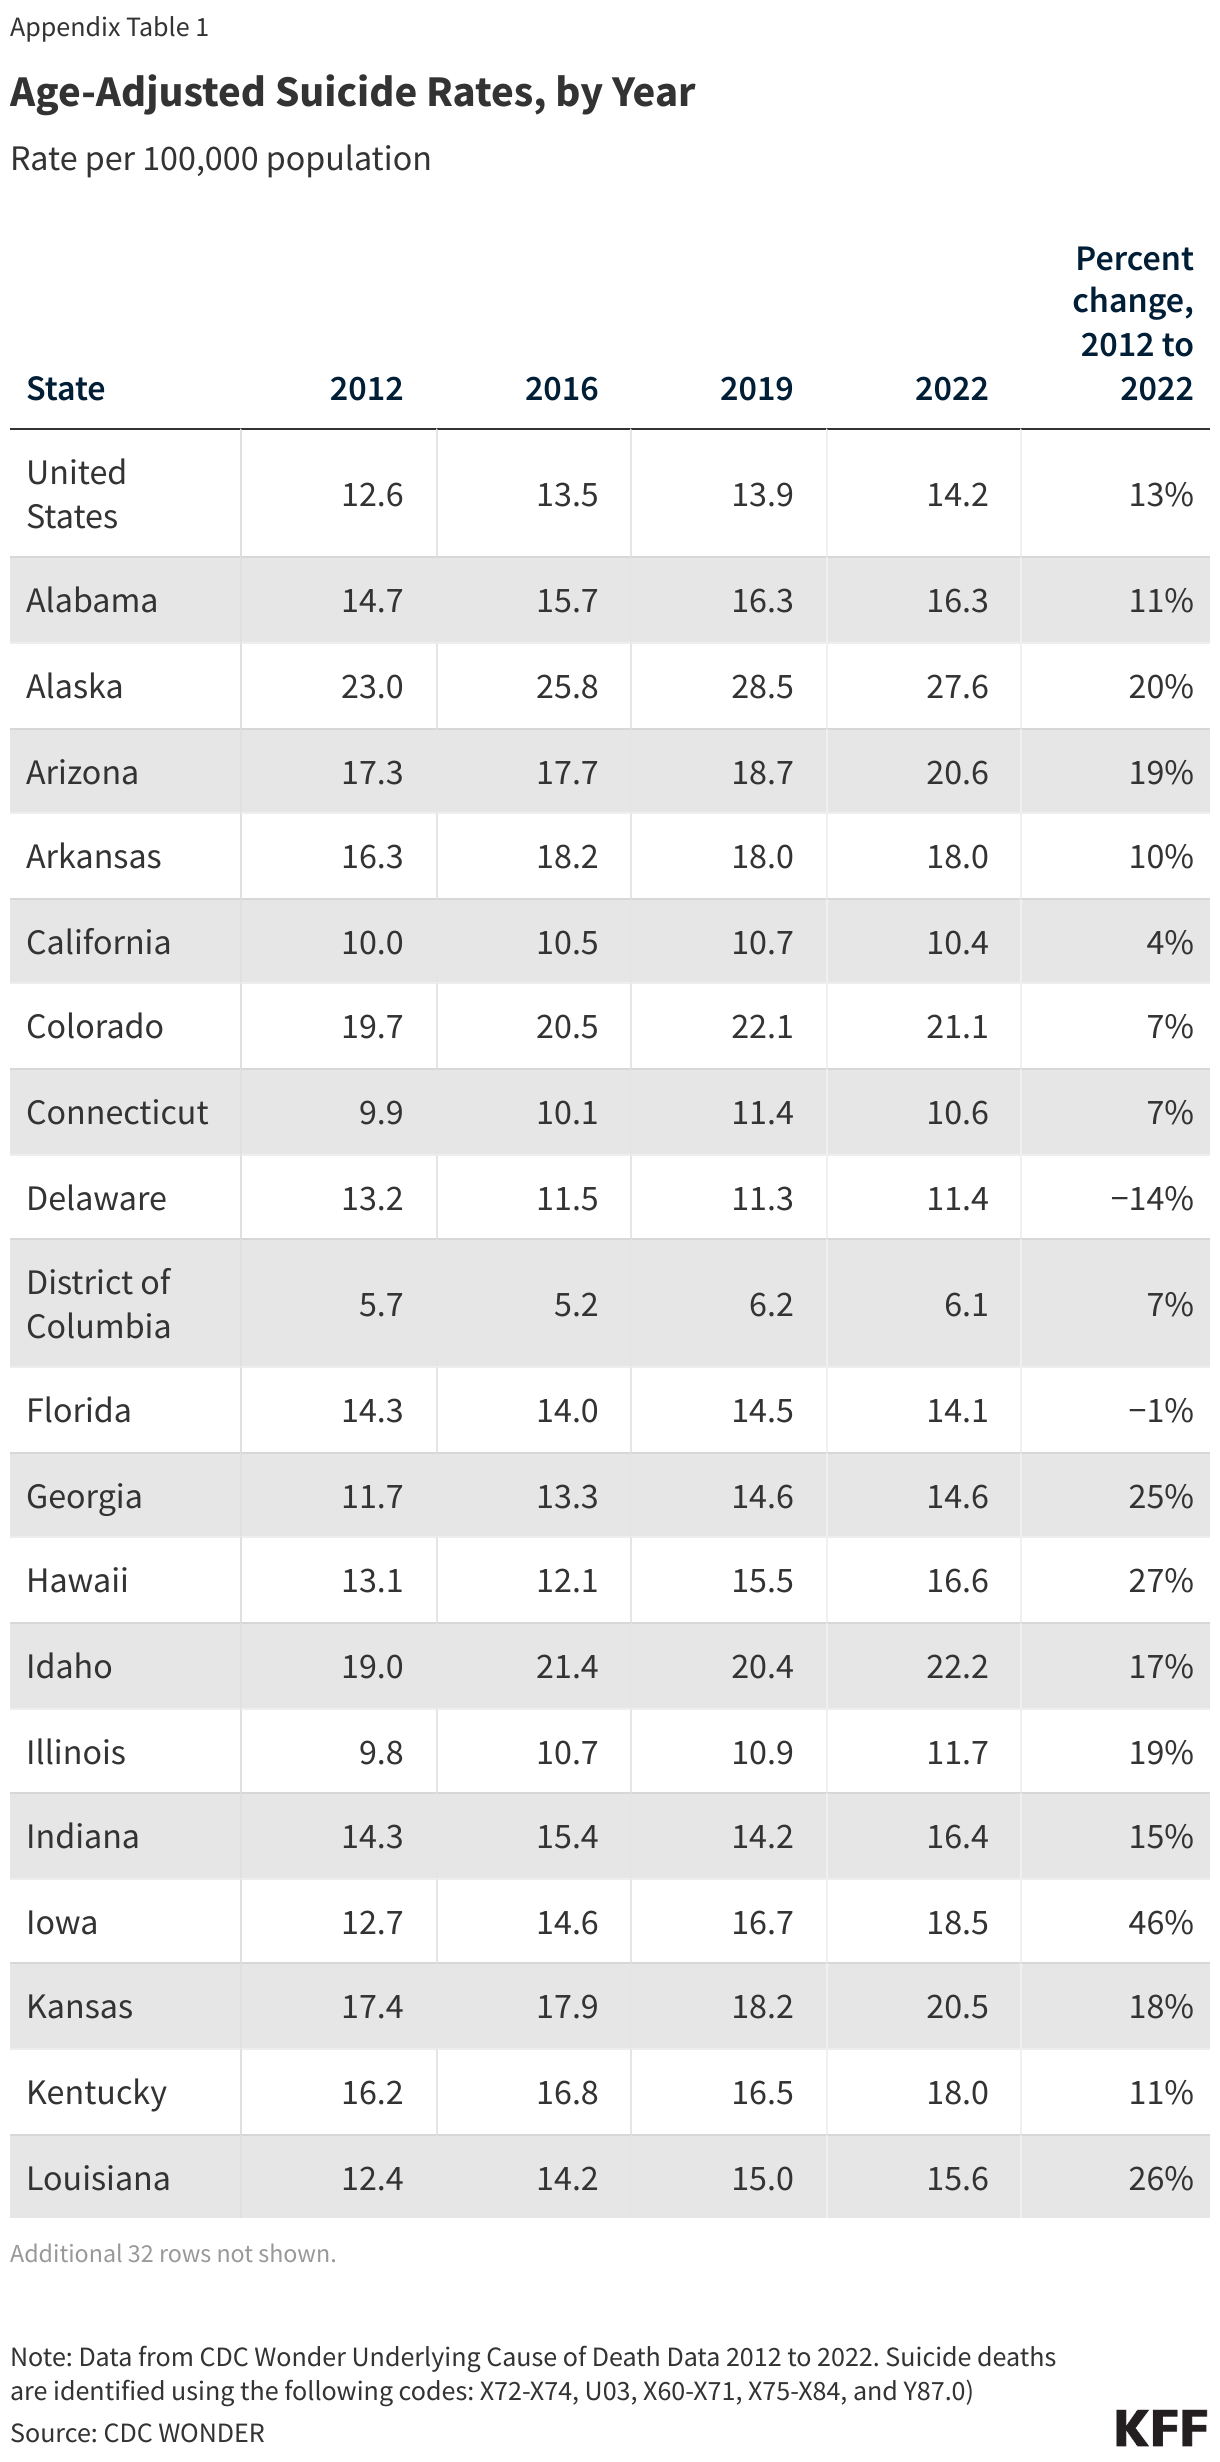
Over half a million lives (500,399) were lost to suicide between 2012 to 2022, with suicide rates rising nationally and in most states over this period (Appendix Table 1). Reflecting rising suicide rates, 9 in 10 adults believe the United States is amid a mental health crisis. Firearms are the predominant suicide method, involved in over half of all suicides, and increases in firearm suicides drove the total suicides to a record high in 2022.

This brief examines 988 two years after implementation using the most recent data available through May 2024 from Lifeline, including: 988 performance metrics nationally and by state, state efforts to fund local 988 call centers, emerging policies and initiatives that may indicate future trends, and a look at data that may be helpful in ongoing monitoring and development of 988.

Key takeaways from this KFF analysis of Lifeline data include the following:

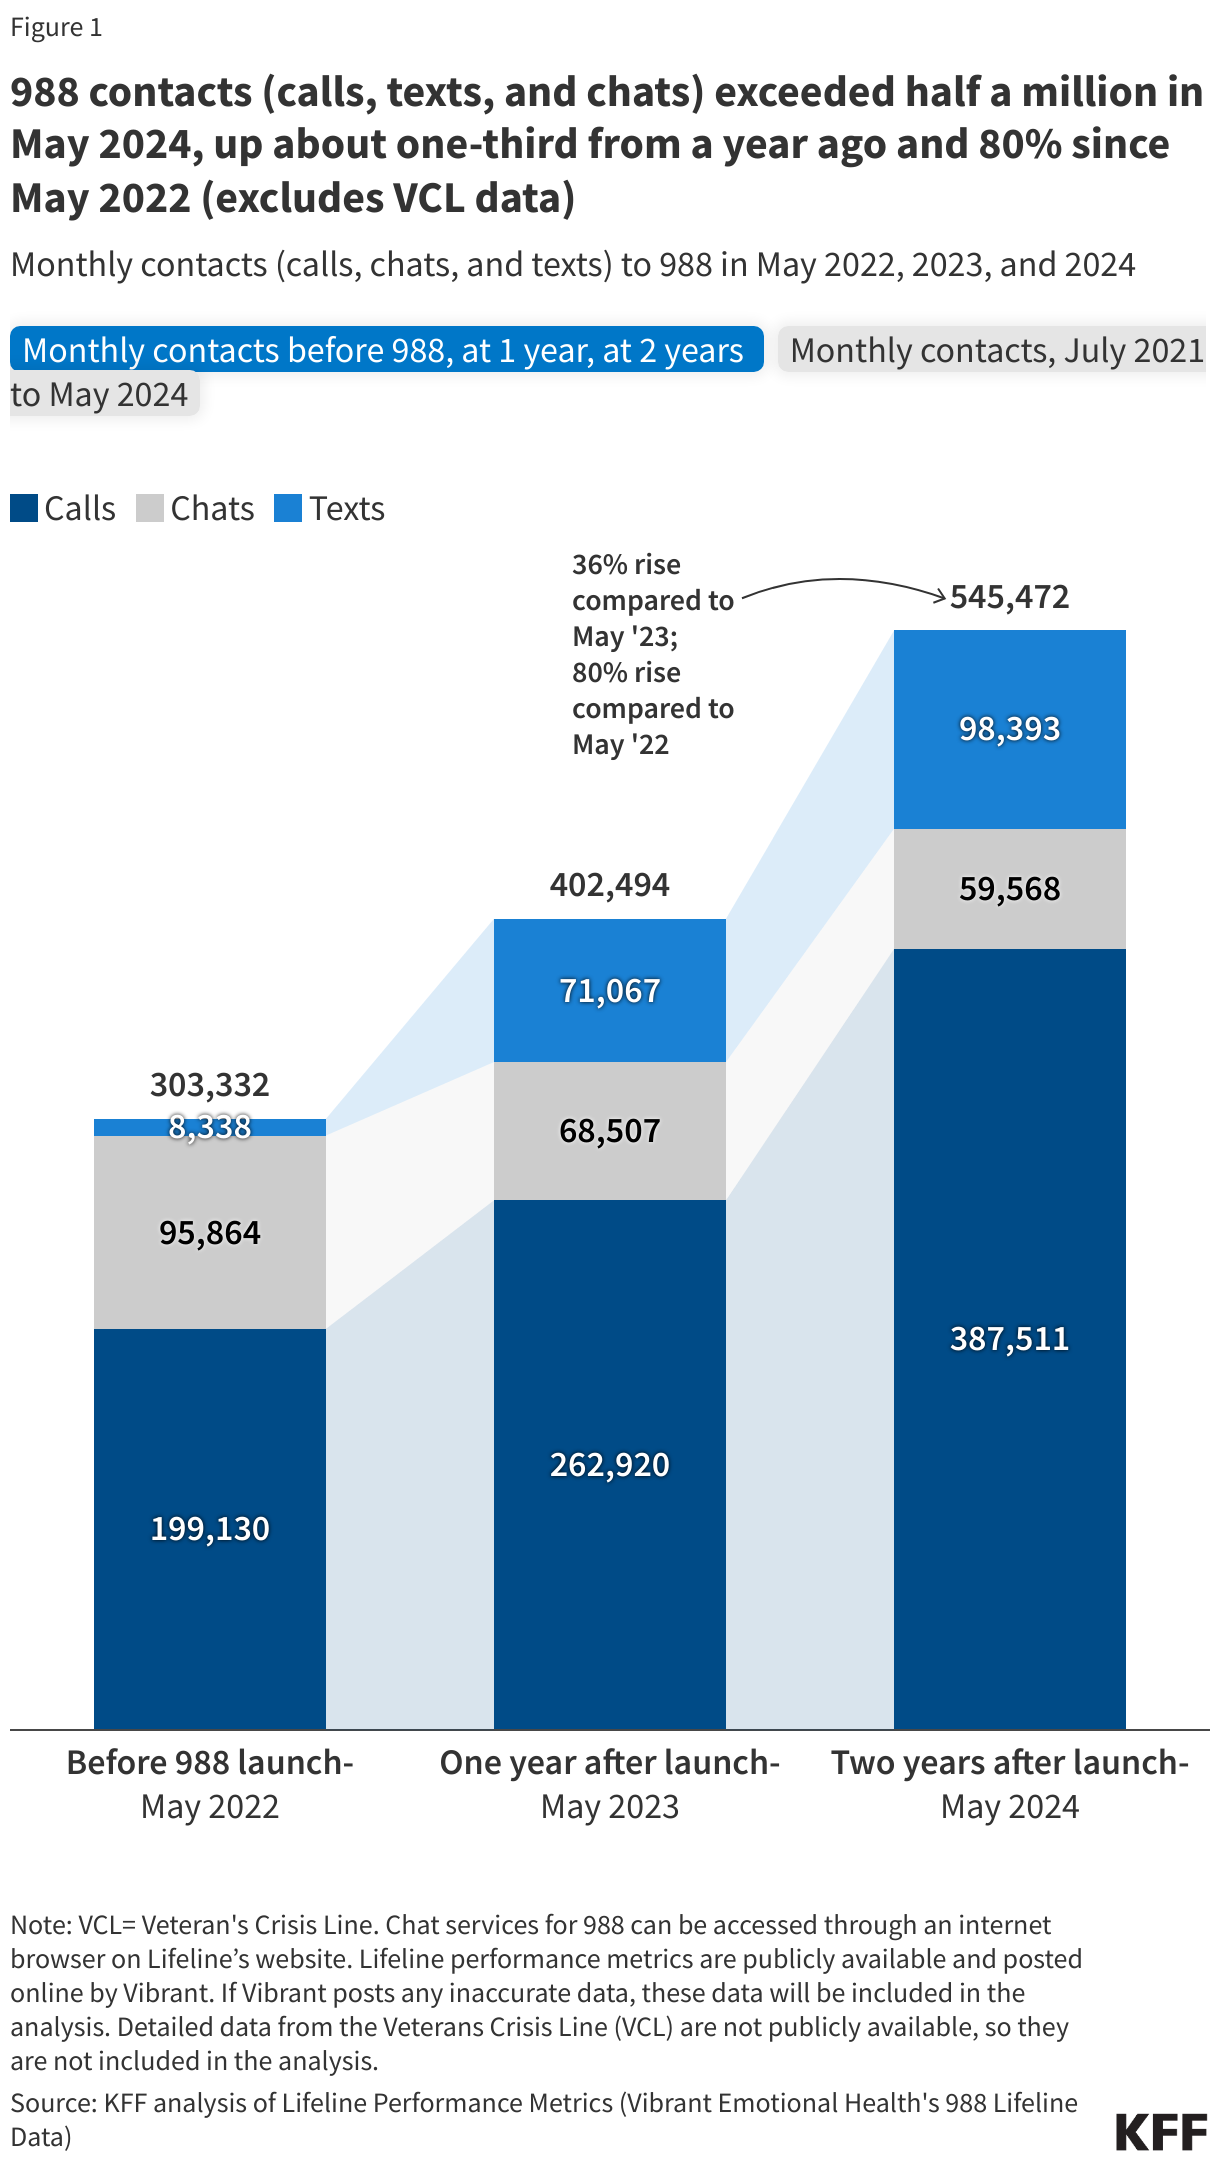
  • Since launch in July 2022, 988 has received 10.8 million calls, texts, and chats. In May 2024, monthly contacts exceeded half a million, up about one-third from a year ago and 80% since May 2022. Despite increased demand for 988 services, national answer rates improved and wait times decreased, though some gains slipped in the second year.
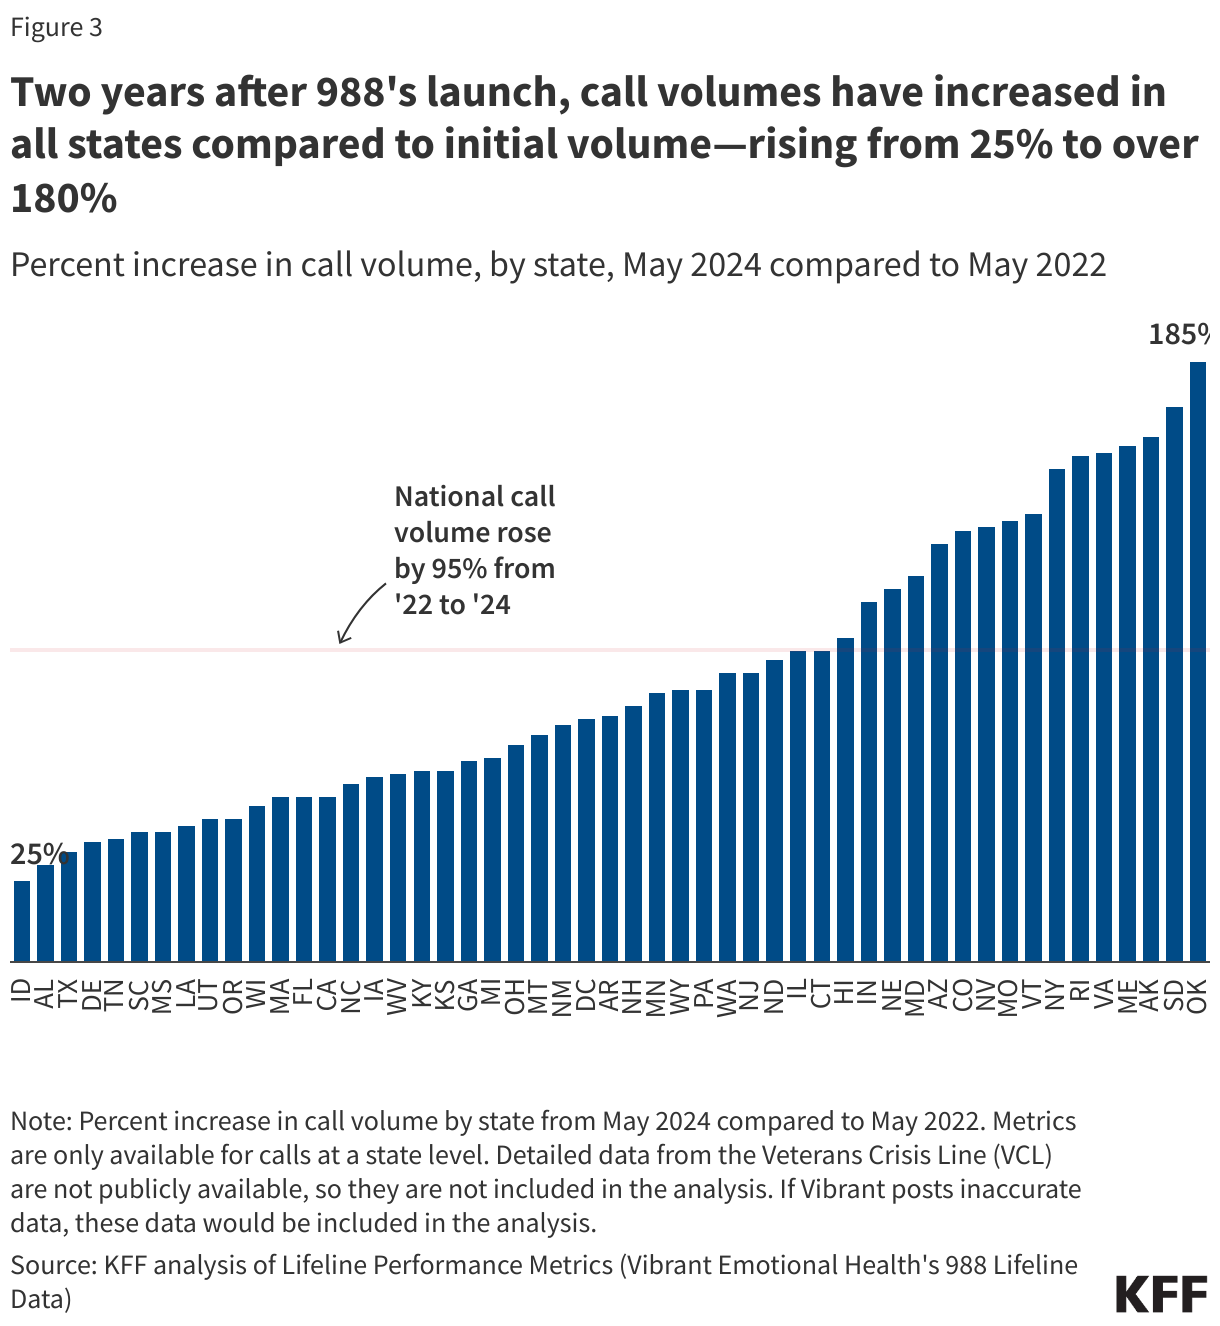
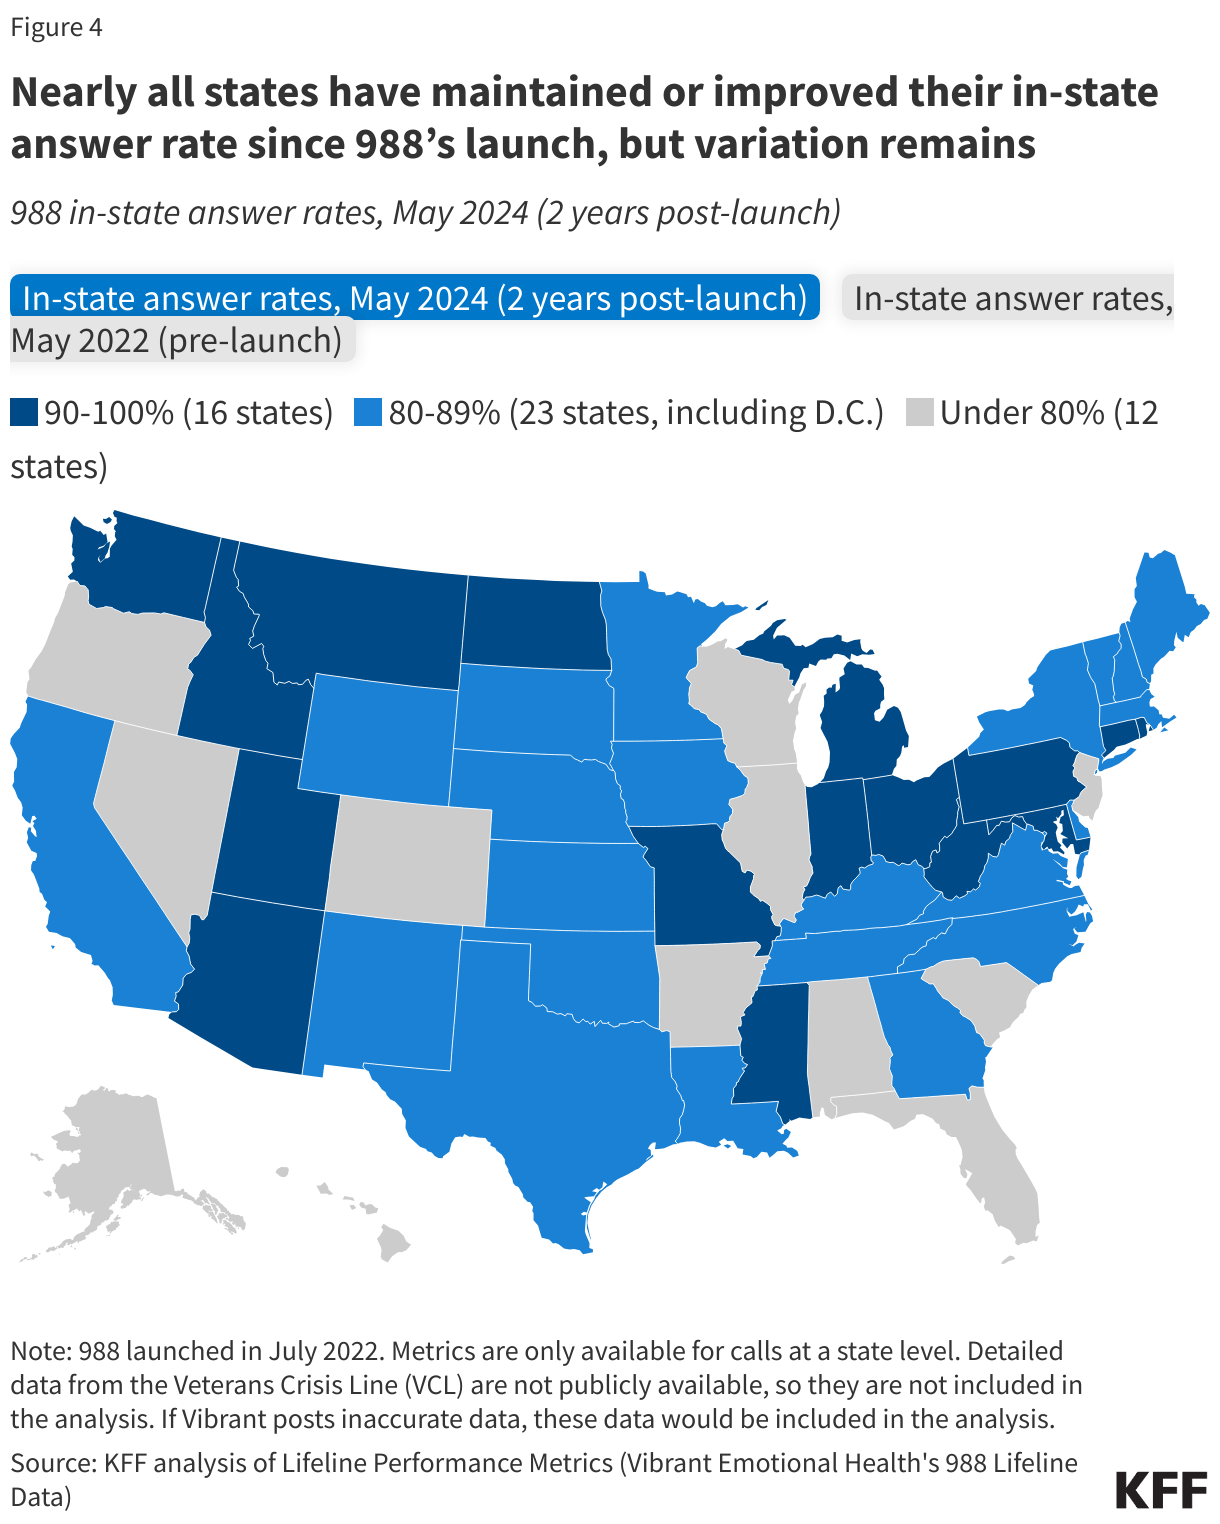
  • State-level call volume and in-state answer rates vary widely across states. Monthly call volume increased in all states—ranging from 25% to 185% since launch — and the most recent in-state answer rates range from 64% to 97% in May 2024.
  • Ten states have added telecom fees to provide more sustainable funding for local 988 crisis call centers, which may help centers keep up with the rising call volumes.
  • Developments in 988 policy and crisis service policy include potential changes in 988 routing (georouting), continued expansion of mobile crisis and short-term crisis stabilization facilities, enhanced technology and infrastructure to connect 988 with other crisis and emergency services, and growth of specialized services for certain populations.
  • 988 metrics are available online through Lifeline, though these data tend to be somewhat limited. Some states are using dashboards to provide additional data that may help to inform efforts to address suicide rates in their state.

What do we know about 988 utilization and awareness?

Since launch in July 2022, 988 received nearly 10.8 million contacts, including 1.4 million to the Veteran’s Crisis Line (VCL), with the remaining contacts consisting of 6.4 million calls, 1.4 million chats, and 1.6 million texts. SAMHSA reports that over 10 million calls, texts and chats have been answered by crisis counselors since launch, including those to the VCL. Detailed data for the VCL is not publicly available, so the remainder of the brief will not include that data. Calls are the most common mode of 988 contact, accounting for about two-thirds (68%) of total contacts to 988. Text messages and chats make up the remaining one-third of total contacts, accounting for 17% and 15%, respectively. Lifeline metrics provide only a partial picture of total crisis hotline contacts, as fewer than half of all crisis call centers (about 200 of 544) participate in the Lifeline network.

988 contacts (calls, texts, and chats) exceeded half a million in May 2024, up about one-third from a year ago and 80% since May 2022. Text message volume saw the highest relative increase, growing more than 11-fold since launch, compared to nearly 2-fold for calls. In contrast, chat volume decreased, possibly because text communication via cell phone is preferred over browser-based chat (Figure 1).

988 contacts (calls, texts, and chats) exceeded half a million in May 2024, up about one-third from a year ago and 80% since May 2022 (excludes VCL data)

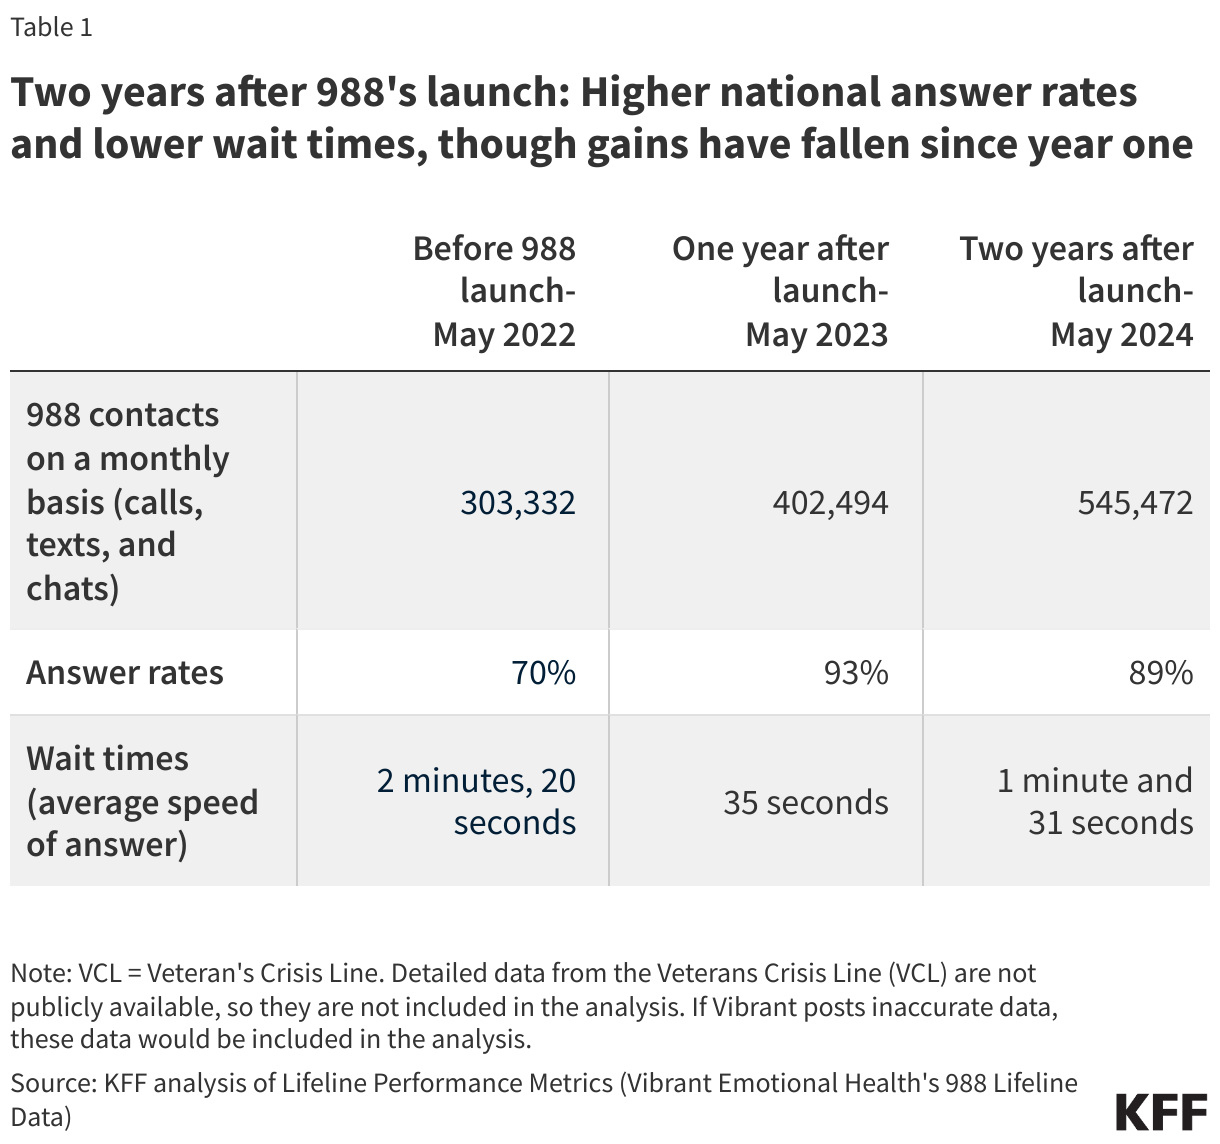
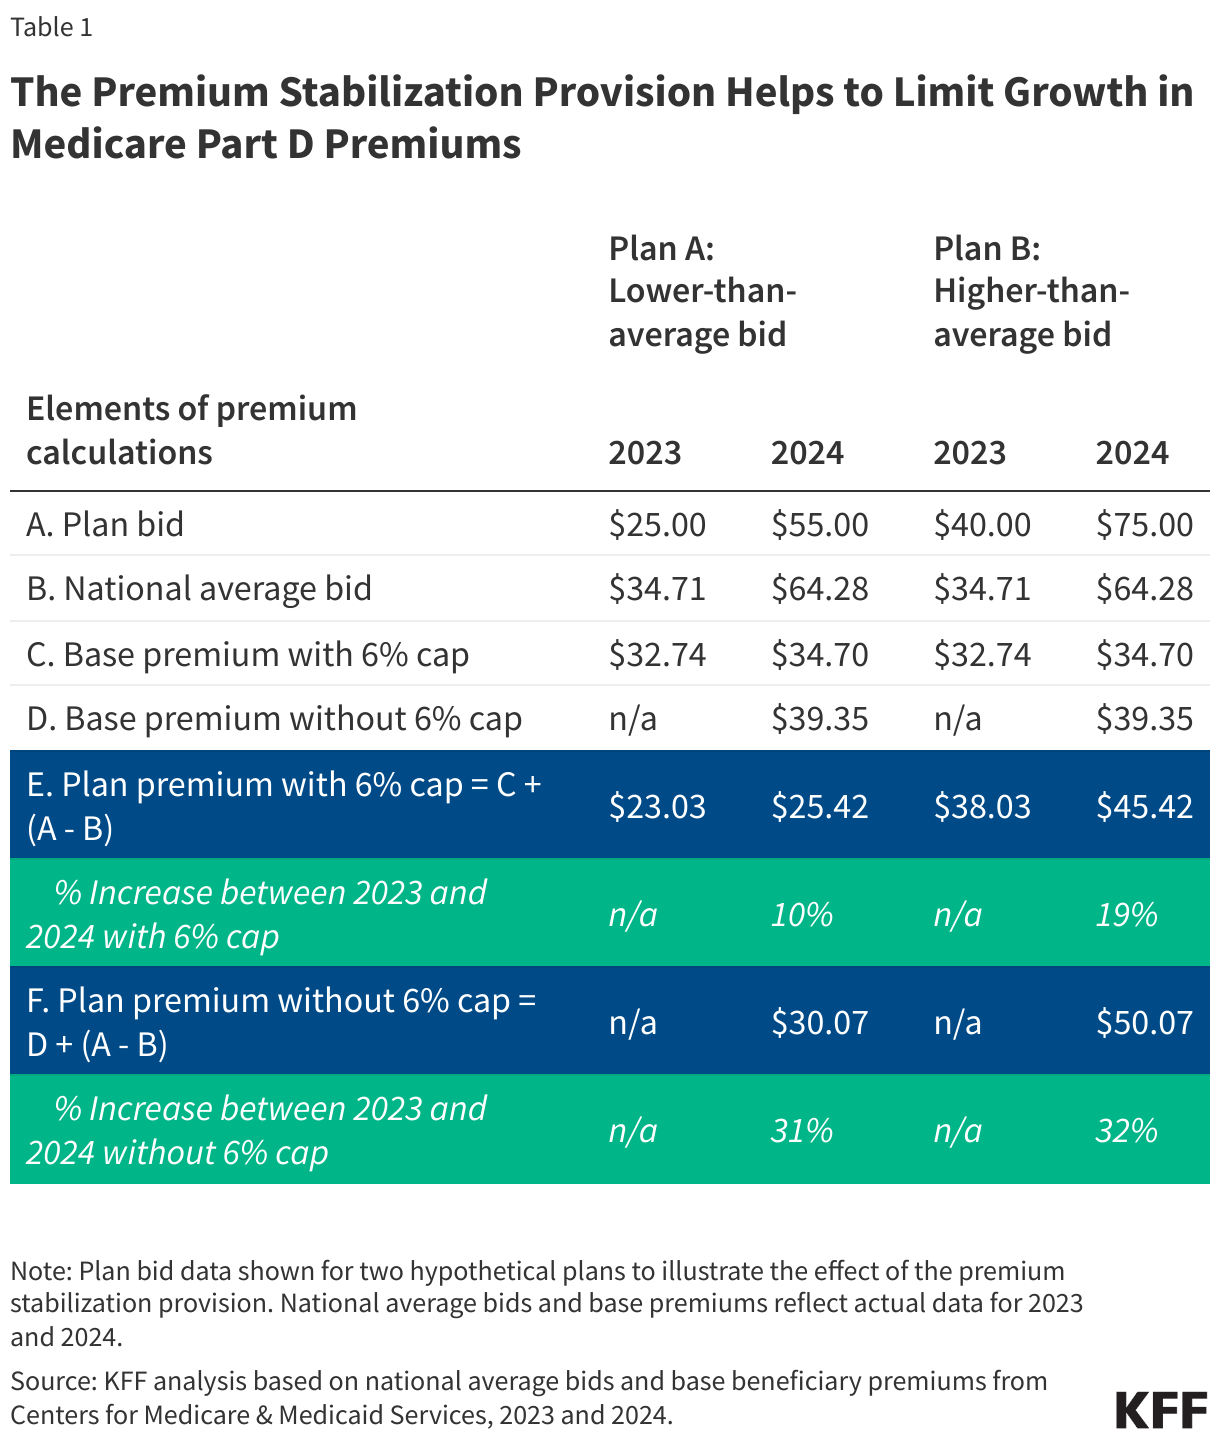
Since launch, national answer rates improved and wait times fell, even with substantial rises in contact volume—though some gains slipped in year 2. Overall answer rates rose from 70% in May 2022 (before launch) to 89% two years later, and wait times fell from 2 minutes and 20 seconds to 1 minute and 31 seconds. While these do represent improvements since launch, they are somewhat lower than they stood at one year after 988’s launch—where answer rates were higher, at 93% and wait times were lower, at 35 seconds. The decline in some performance metrics in year 2 may be due to continued rise in 988 contacts (Table 1).

Two years after 988's launch: Higher national answer rates and lower wait times, though gains have fallen since year one

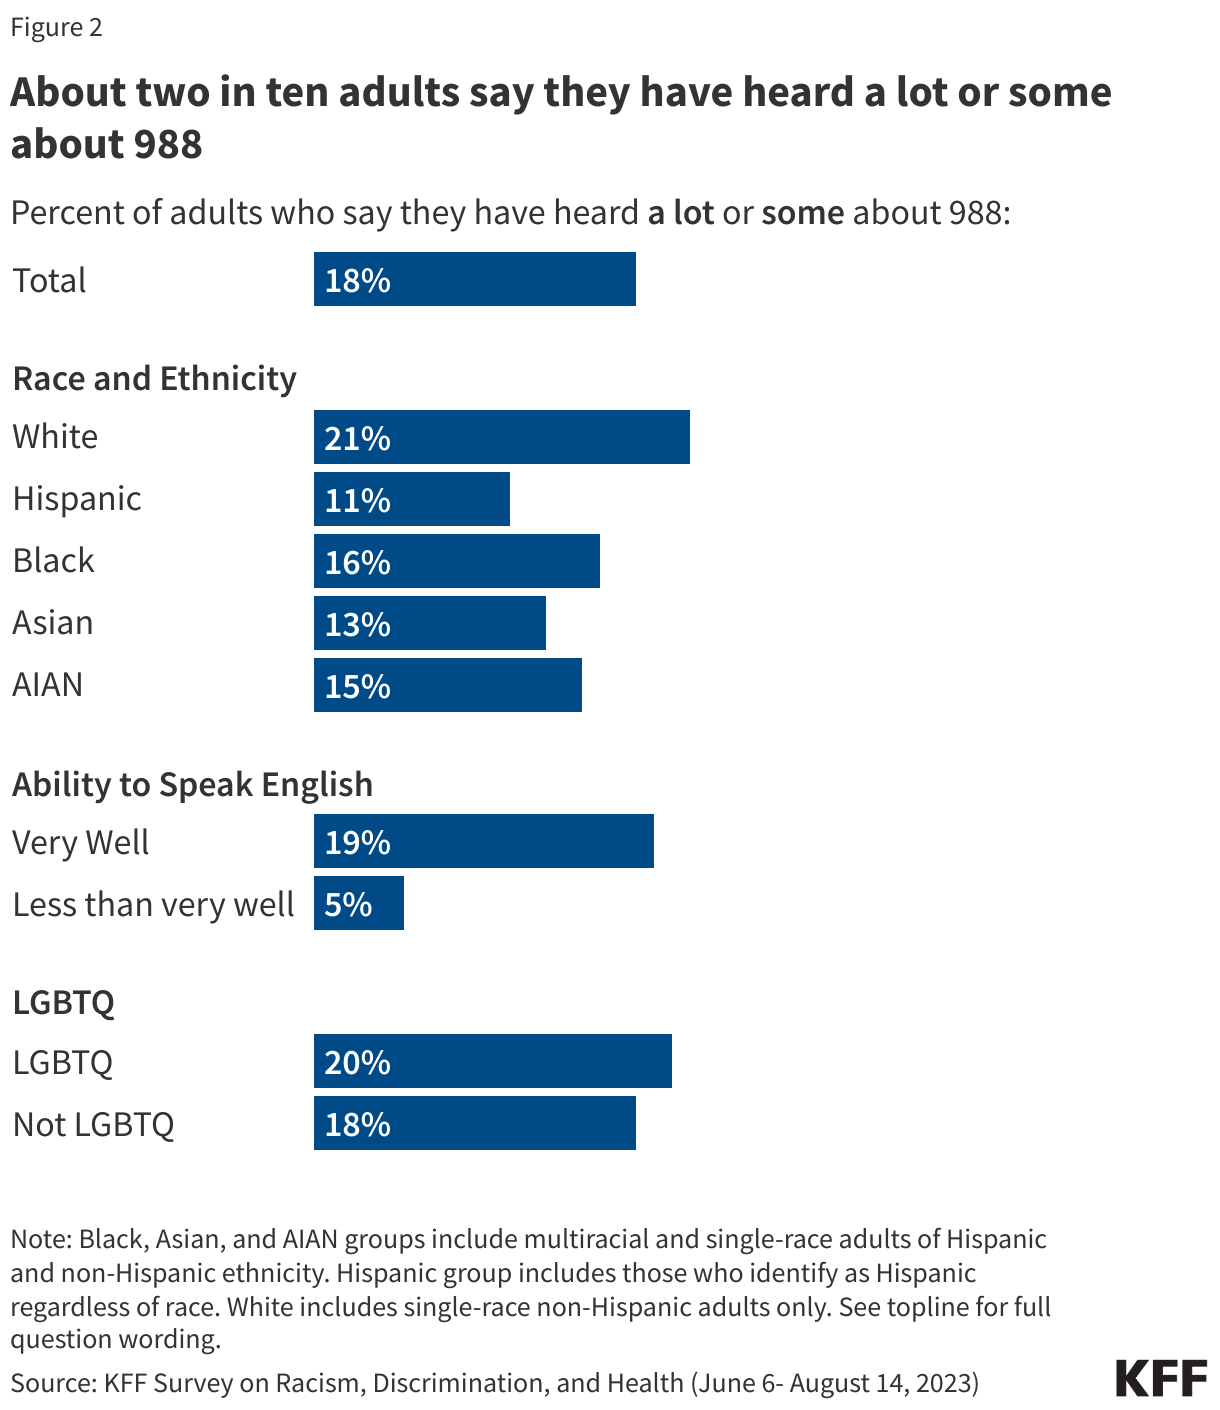
KFF polling indicates that public awareness of 988 is generally low, with 18% of adults reporting they have heard a lot or some about it. As of mid-2023, fewer than 2 in 10 adults reported familiarity with 988 and its services, though awareness may have increased since then. Despite generally low awareness, those with high psychological distress, adults who speak English very well, and White adults are more likely to report familiarity with 988. In contrast, awareness is lower among Black, Hispanic, and Asian adults and among those who do not speak English very well (Figure 2). Federal awareness campaigns set to launch in mid to late 2024, along with proposed legislation introduced to Congress late last year, aim to boost public awareness of 988 and its services. As knowledge of 988 rises, so could the demand for its services.

About one in six adults say they have heard a lot or some about 988

How does implementation vary by state?

Call volume increased in all states, with increases up to 185%. State-level data is available through Lifeline for calls to 988, but not for text or chat. Nationally, call volume rose by 95% from pre-launch to two years later, but this varied widely across states, from a low of 24% in Idaho to a high of 185% in Oklahoma. The variation in growth rates across states may be influenced by the development of 988 infrastructure and public awareness campaigns

Two years after 988's launch, call volumes have increased in all states compared to initial volume—rising from 25% to over 180%

Although nearly all states have maintained or improved their in-state answer rate since 988’s launch, answer rates continue to vary across states and range from 64 to 97% as of May 2024. 988 routes calls based on the caller’s area code to the nearest crisis center. An “in-state answer rate” measures the percentage of calls answered in the state that aligns with the caller’s area code. In May 2024, in-state answer rates ranged from a low of 64% in Nevada up to 97% in Mississippi, Montana, and Rhode Island. Calls not answered in-state are either transferred to one of Lifeline’s national backup centers or abandoned by their caller. Long wait times or local crisis center unavailability can lead to a call being redirected to national backup centers, where counselors will answer the crisis call, but may be less familiar with local resources. These calls count toward the national answer rate but not toward the answer rate of the state where the Lifeline backup center is located. Nationally, about 6% of state calls are transferred to a federal overflow facility and 10% are abandoned in-state, though these rates also vary by state. Per SAMHSA, calls may be abandoned by their user due to a technical reason (e.g. internet or mobile connection strength or service interruptions, etc.) or because the person seeking assistance ends the contact before a counselor answers, which could also happen for a range of reasons, such as they had to wait too long or decided they were not comfortable discussing their experience.

Nearly all states have maintained or improved their in-state answer rate since 988’s launch, but variation remains

Ten states have added telecom fees to provide more sustainable funding for local 988 crisis call centers, which may help local crisis centers keep up with rising demand for the service. Although federal investments support 988 nationally and help to support state implementation, states are largely responsible for long-term funding of the local 988 crisis call centers, which have historically received minimal funding from the federal government. Under the National Suicide Hotline Designation Act of 2020, states can collect cell phone fees to help sustainably fund their local 988 call centers (similar to how 911 is funded). So far, ten states have enacted legislation to fund crisis services through telecom fees, including Virginia, Colorado, Washington, Nevada, Minnesota, California, Oregon, Delaware, Maryland, and most recently Vermont. Additionally, four other states have pending telecommunications fee legislation. Early adopters of telecom fees, such as Virginia and Washington, collected between $10.9 to $30.4 million in 988 telecom fees during FY 2022, according to an FCC report. Other sources of 988 funding include trust funds and general fund appropriations, and 5% crisis services set aside from mental health block grant funds. Insurer payments can help financially sustain 988 and other crisis services, with some states billing Medicaid or other payers and several states also passing laws requiring insurers to cover crisis care services.

Proposals to improve 988 routing aim to mirror certain 911 standards, including georouting and requirements for cell phone carriers to route 988 calls during service interruptions. Currently, 988 routes calls based on the caller’s area code, which can be problematic for people with area codes not reflective of their current location, resulting in connections to distant crisis centers with counselors unfamiliar with the local resources near the caller. Unlike 911, which uses precise geolocation data, the proposed 988 georouting would direct calls to the nearest crisis center without disclosing the caller’s exact location, helping to address technical, privacy, and legal concerns. In April of this year, the Federal Communications Commission (FCC) issued a notice proposing rulemaking for wireless carriers to adopt 988 georouting and requested comments on extending this to text messages and specialized services like LGBTQ+ and Spanish services, which are not available at all local crisis center locations. Separate legislation proposed late last year aims to improve 988 access by requiring carriers to allow 988 calls during service disruptions and ensuring multi-line systems, such as those in hotels, recognize 988 calls directly without additional steps like dialing 9 first.

Similar to 988, mobile crisis units and short-term crisis stabilization facilities are core components of the behavioral health crisis continuum, though their development and availability varies across states. Mental health professionals staff these services and provide alternatives to emergency departments and law enforcement during mental health emergencies. States are at different stages of establishing mobile crisis and short-term crisis stabilization services, and some states have leveraged Medicaid and Medicaid-focused provisions in the American Rescue Plan Act to support mobile crisis development. Most states have some form of mobile crisis, but short-term crisis stabilization facilities are less common. Even among states that have mobile crisis units, these units are often not available 24/7 or statewide. Compared to 988, other components of the crisis response system have little federal coordination, which may result in more variation in their development and structure across states.

States are investing in technology to improve infrastructure and coordination across crisis services and other emergency and health services. For example, some states are developing infrastructure to enable coordination and call diversion for mental health calls from 911 to 988. However, technical and logistics challenges, such as the presence of multiple local 911 call centers per area code and the need to develop operational rules and agreements for each, have slowed progress. Other technological developments include service registries to track bed availability, facility capacity, and appointment scheduling. GPS-enabled mobile crisis dispatch systems and tools for crisis staff to view and schedule mental health appointments are also being developed. Recent CMS guidance clarifies how Medicaid may help support some of these efforts. Additionally, the federal government’s action plan, part of the HHS’s 2024 National Strategy for Suicide Prevention, proposes funding a mobile crisis locator for use by 988 crisis centers.

Specialized services to meet the unique needs of various populations, including LGBTQ people, Spanish speakers, American Indian and Alaska Native (AIAN) people, older adults, and others, are being developed at both federal and state levels. In March 2023, Lifeline expanded its LGBTQ+ services, providing 24/7 text and phone access to affirming counseling for those under age 25. This line accounted for nearly 10% of all 988 contacts over a four-month period, but had higher abandonment rates and longer wait times than the general 988 line. Additionally, 988 offers options to route Veterans, people who speak Spanish, and people who have difficulty hearing to specialized services. Certain states are building targeted services for older adults (staffed with older adult peer supports) and launching youth-specific initiatives, including mobile crisis services for youth. Efforts are being made to provide culturally competent services for AIAN populations and other racial and ethnic groups, to address the unique needs of rural and remote areas, and to support individuals with co-occurring mental health and substance use needs.

What data beyond Lifeline could help inform implementation and improvement efforts?

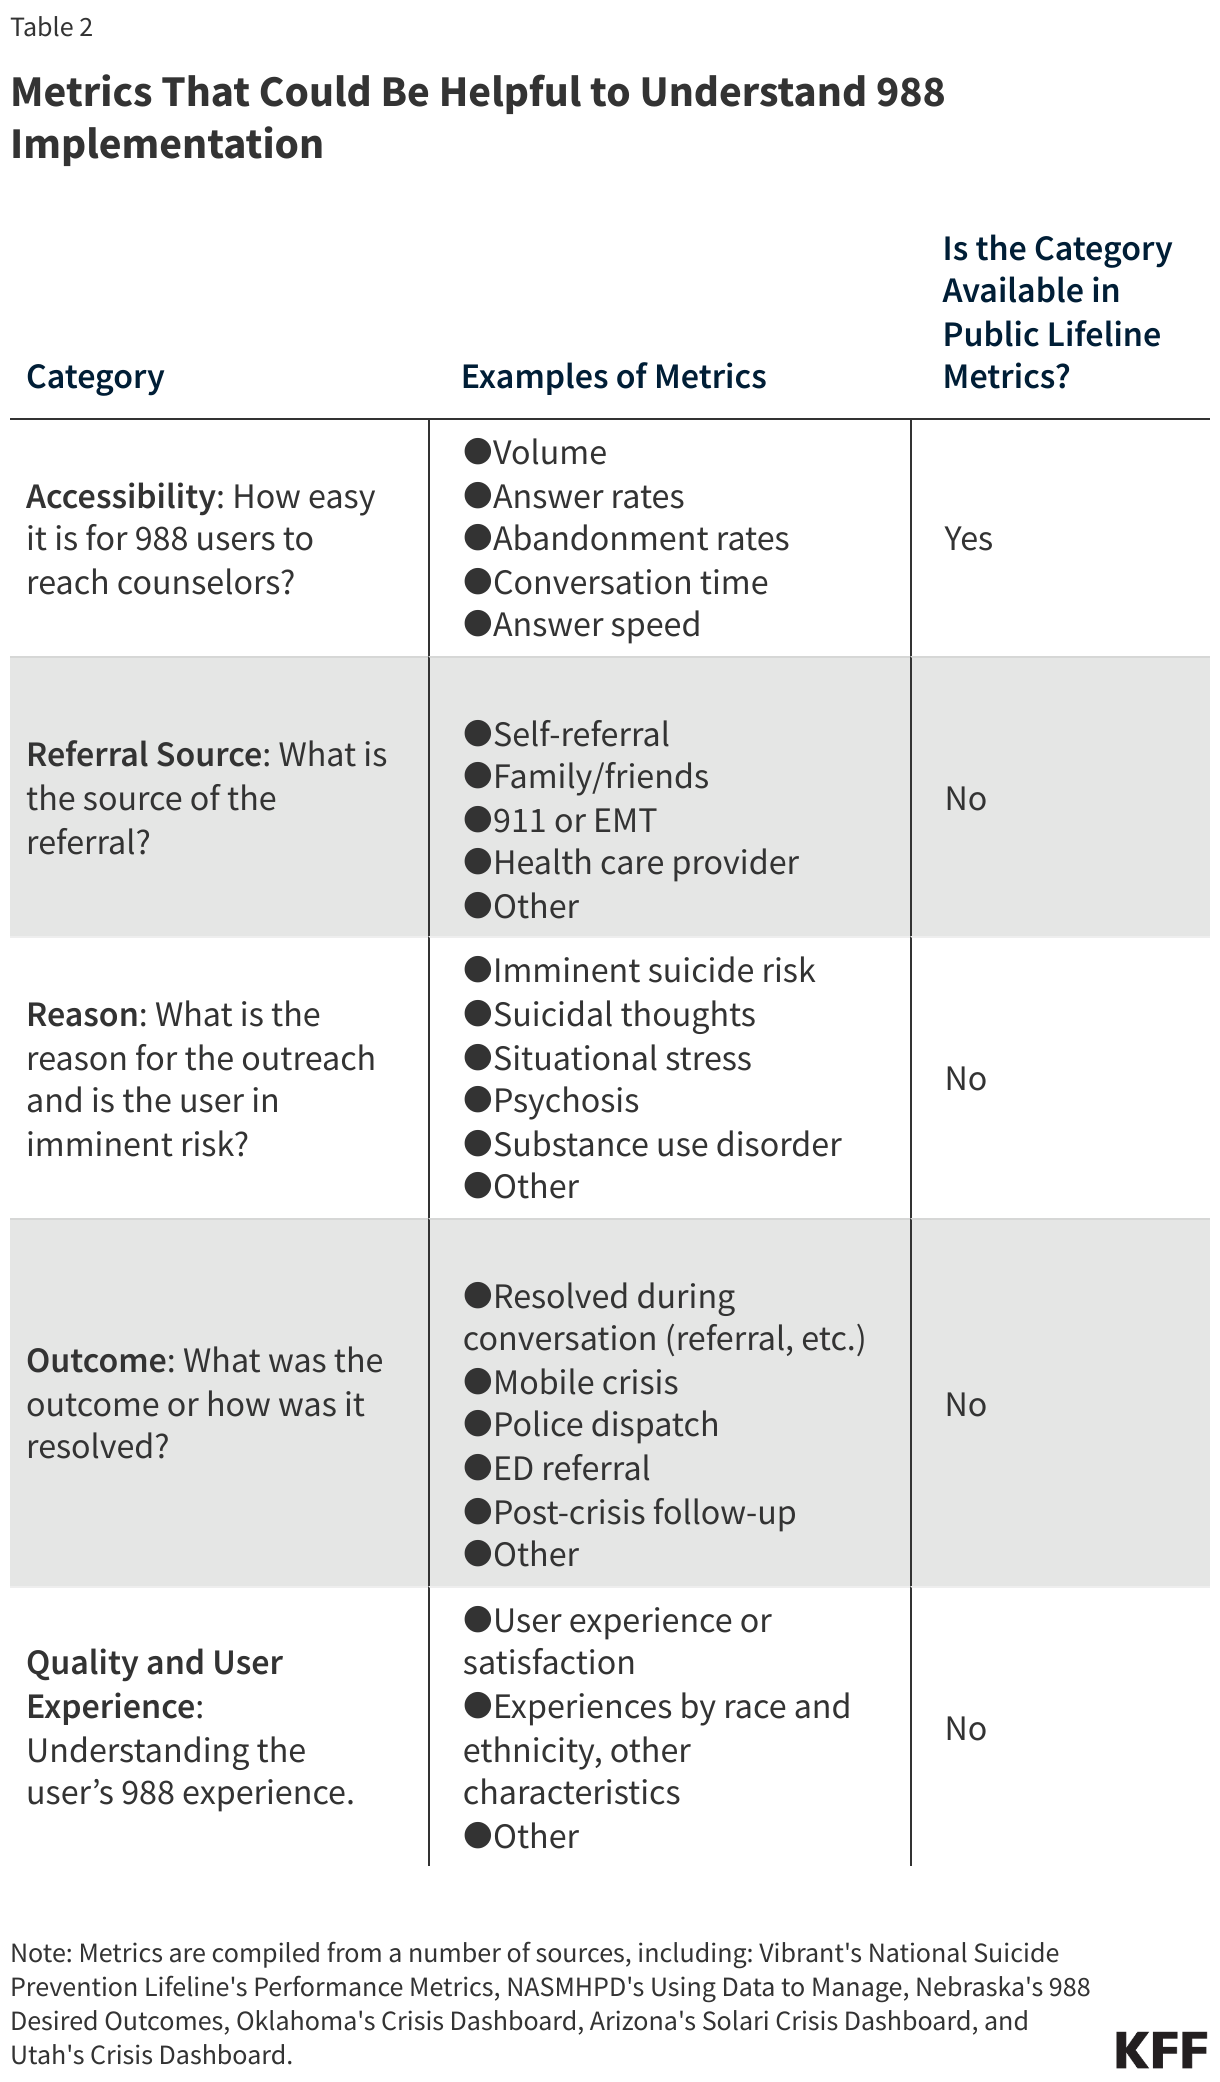
Additional state and national crisis center metrics may help inform the 988 implementation and future program improvements. Call volume, wait times, and other metrics from Lifeline provide some insights into accessibility and demand for 988, but they don’t tell the whole story. For example, without additional data, it’s not possible to answer questions about the conditions or circumstances that prompted the 988 calls, the resolution of these calls and whether they connected to additional crisis or outpatient services, and user experience across different demographics and geographies. Comprehensive metrics can help policymakers and researchers evaluate 988’s effectiveness, identify gaps, and develop targeted interventions. Table 2 lists metrics that could be helpful for understanding 988’s implementation.

Metrics That Could Be Helpful to Understand 988 Implementation

Some states or crisis call centers already track and display detailed crisis metrics through regularly updated dashboards. These online dashboards display key metrics of crisis call data, refreshed at regular intervals. In Arizona, the Solari Crisis Response Network displays aggregate data for crisis call centers in two regions. Similarly, the University of Utah summarizes Utah’s crisis data in a dashboard and in crisis services annual reports (2021 and 2020). South Dakota’s only crisis line displays detailed aggregate data on a publicly accessible dashboard, including historical data and breakouts by age, race, and gender. Data presented on these dashboards are more detailed than Lifeline data, containing metrics on accessibility, referral source, reason for the call, and some outcomes, but many do not contain historical summaries. Wisconsin’s dashboard is an exception, as it provides monthly snapshots and downloadable historical summary data.

If you or someone you know is considering suicide, call or text the 988 Suicide & Crisis Lifeline at 988

Age-Adjusted Suicide Rates, by Year

The Role of Public Opinion Polls in Health Policy

Table of Contents

Introduction

Copy link to Introduction

Polls and surveys are useful tools for understanding health policy issues. However, it takes time and training to understand how to interpret survey results and to decide which polls are useful and which might be misleading. The aim of this chapter is to help you learn how to be a good consumer of polls so they can be a valuable part of your toolkit for understanding the health policy environment. It begins by discussing why polls are an important tool in policy analysis and the caveats to keep in mind when interpreting them. It then discusses polling methodology and the questions you should ask to assess the quality and usefulness of a poll. The chapter ends with some real-world examples in which polling helped inform policy debates.

People sometimes ask if there is a difference between a “poll” and a “survey.” The quick answer is that every poll is a survey, but not every survey is a poll (for example, large federal surveys like the Census or surveys of hospitals or other institutions would not be called polls). For purposes of this chapter, we use the terms interchangeably.

Why Should You Pay Attention to Polls at all?

Copy link to Why Should You Pay Attention to Polls at all?

Polls have gotten a bad rap over the past few years, particularly around election times when they don’t do a perfect job predicting who the winner of a given election will be. Given this, you may wonder why you should pay attention to polls when trying to understand health policy. There are six basic reasons why it’s important for health policy scholars to understand public opinion:

  • People vote and elections can have important consequences for health policy at the local, state, and national levels. While polls may not always be perfect predictors of election outcomes, they are one of the best ways to understand the dynamics of how voters are thinking and feeling when weighing their vote choices, not only for high-profile offices like President and Congress, but for state and local races and ballot initiatives as well.
  • Public opinion can influence policy choices, particularly for highly salient issues, like health care, that touch pretty much everyone’s lives in some way. While the average member of the public may not be equipped to understand the details of most health policy legislation, their preferences and views can put constraints on lawmakers by identifying actions that would be deemed unacceptable by large majorities of the public or their constituents.
  • Polls can also provide information about the broader environment in which health policy issues or changes are being debated. They can help you understand the salience of a given issue (i.e., how much do people care about prescription drug prices and how closely are they paying attention to debates over how to lower them?) and identify other factors that might affect the likely success of a given policy (i.e., if the country’s attention is focused on a foreign policy crisis, how will that affect the public’s reaction to a major new proposal to overhaul Medicaid?).
  • Beyond measuring opinion, surveys can also be useful for understanding how health policy is affecting people. Survey questions about people’s experiences can offer context by providing information like the share of people who are struggling to afford their health insurance. Looking at questions like these at multiple points in time can also help you understand how experiences change in the months and years following enactment of major health legislation.
  • Surveys can help amplify the voices of real people in policy debates, particularly those that are often ignored or drowned out by special interests.Polling that includes adequate sample sizes to represent the voices of marginalized and underrepresented populations, such as members of racial and ethnic minority groups, immigrants, LGBTQ individuals, people living in rural areas, and those with lower incomes, may be especially useful for understanding the impact of health policy on people.
  • In this way, methodologically sound, non-partisan, transparent surveys can serve as a counterweight to polls sponsored by special interests that are conducted in private and used to craft public messages, design campaigns, or sell products.

Caveats to Polling

Copy link to Caveats to Polling

Polls do not tell the whole story. Public opinion is just one part of the political and policymaking process. Public support for a given policy may seem clear based on a single survey question, but it can be quite malleable in the course of a public debate, and not all surveys measure this malleability. Small changes in survey question wording can sometimes lead to big changes in public support, so it’s important never to rely on a single question from a single poll to make a conclusion about what the public thinks or knows. When possible, look for multiple questions on the same topics from multiple polls conducted at various times. If the answers are consistent, you can be more confident that the conclusion is correct. Sometimes a poll finding conflicts with your best sense of political reality when all available information is considered. In those instances, there’s a good chance your “gut” is a better guide than what a given poll tells you.

There are limits to polling on complex topics like health care. When the public says they support a specific proposal for lowering health care costs, it doesn’t mean they have fully thought through the details of that proposal and its implications. Rather, it may signal how important they think it is for policymakers to address the high cost of health care. And while some polls test this by asking follow-up questions that probe the public about trade-offs to any given policy approach, some health policy topics are just too complicated to reasonably ask the average American to weigh in on in a short survey.

Public opinion can’t give you the “right” answer. While public opinion can tell you where the public stands on an issue, it cannot tell you what the right policy solution is in any given situation. For example, pollsters often ask people to rank the priority they give to different health issues before Congress. They may ask the public to rank the issues of prescription drug costs, the future of the Affordable Care Act, Medicaid expansion, the financial sustainability of Medicare, and so forth. But it turns out that real people aren’t organized like congressional committees and don’t put the issues neatly into policy buckets like pollsters do. What they are concerned about is the cost and affordability of health care, a concern that cuts across these issues. These ranking questions provide some information about what resonates most with the public, but that doesn’t mean they should be treated as a rank-ordered list for policymakers to address starting from the top down. In addition, beyond telling you what the public thinks, polls can be just as useful for pointing out what the public doesn’t understand about a given policy issue, allowing you to direct outreach and education efforts or figure out messaging that will resonate with the public if you are advocating for a policy change.

Understanding the Methods: Questions to Ask about Polls

Copy link to Understanding the Methods: Questions to Ask about Polls

The science of survey research is complicated, but there are a few simple terms you can learn and questions you can ask when you encounter polls in your schooling and daily life. These include:

Population. Who is the population that the survey is claiming to represent? Polls can be conducted with many different populations, so it is important to know how researchers define the population under study. For example, a survey of voters may be useful for your understanding of a particular health care issue’s importance in the election, but it might not be as useful for estimating how many people have had problems paying medical bills, since lower-income people (who may be the most likely to experience bill problems) are less likely to be voters and may be left out of the study entirely.

Sampling. How did researchers reach the participants for their poll, and was it a probability or non-probability sample? In a probability-based sample, all individuals in the population under study have a known chance of being included in the survey. Such samples allow researchers to provide population estimates (within a margin of sampling error) based on a small sample of responses from that population. Examples of probability-based sampling techniques include random digit dialing (RDD), address-based sampling (ABS), registration-based sampling (RBS), and probability-based online panels. Non-probability sampling, sometimes called convenience or opt-in sampling, has become increasingly common in recent years. While non-probability surveys have some advantages for some types of studies (particularly their much lower cost), research has shown that results obtained from non-probability samples generally have greater error than those obtained from probability-based methods, particularly for certain populations.

Data collection (survey mode). While there are many ways to design a survey sample, there are also many ways to collect the data, known as the survey mode. For many years, telephone surveys were considered the gold standard because they combined a probability-based sampling design with a live interviewer. Survey methodology is more complicated now, but it is still important to know whether the data was collected via telephone, online, on paper, or some other way. If phones were used, were responses collected by human interviewers or by an automatic system, sometimes known as interactive voice response (IVR) or a “robocall”? Or were responses collected via text message? Depending on the population represented, different approaches might make the most sense. For example, about 5% of adults in the U.S. are not online, and many others are less comfortable responding to survey questions on a computer or internet-connected device. While young adults may be comfortable responding to a survey via text message, many older adults still prefer to take surveys over the phone with a live interviewer. Some populations feel a greater sense of privacy when taking surveys on paper, while literacy challenges may make a phone survey more appropriate for other populations. Many researchers now combine multiple data collection modes in a single survey to make sure these different segments of the population can be represented.

Language. Was the survey conducted only in English, or were other languages offered? If the survey is attempting to represent a population with lower levels of English language proficiency, this may affect your confidence in the results.

Survey sponsor. Who conducted the survey and who paid for it? Understanding whether there is a political agenda, special interest, or business behind the poll could help you better determine the poll’s purpose as well as its credibility.

Timing. When was the survey conducted? If key events related to the survey topic occurred while the survey was in the field (e.g., an election or a major Supreme Court decision), that might have implications for your interpretation of the results.

Data quality checks. During and after data collection, what data quality checks were implemented to ensure the quality of the results? Most online surveys include special “attention check” questions designed to identify respondents who may have fabricated responses or rushed through the survey without paying attention to the questions being asked. Inclusion of these questions is a good sign that the researchers were following best practices for data collection.

Weighting. Were the results weighted to known population parameters such as age, race and ethnicity, education, and gender? Despite best efforts to draw a representative sample, all surveys are subject to what is known as “non-response bias” which results from the fact that some types of people are more likely to respond to surveys than others. Even the best sampling approaches usually fall short of reaching a representative sample, so researchers apply weighting adjustments to correct for these types of biases in the sample. When reading a survey methodology statement, it should be clear whether the data was weighted, and what source was used for the weighting targets (usually a survey from the Census or another high-quality, representative survey).

Sample size and margin of sampling error. The sample size of a survey (sometimes referred to as the N) is the number of respondents who were interviewed, and the margin of sampling error (MOSE) is a measure of uncertainty around the survey’s results, usually expressed in terms of percentage points. For example, if the survey finds 25% of respondents give a certain answer and the MOSE is plus or minus 3 percentage points, this means that if the survey was repeated 100 times with different samples, the result could be expected to be between 22%-28% in 95 of those samples. In general, a sample size of 1,000 respondents yields a MOSE of about 3 percentage points, while smaller sample sizes result in larger MOSEs and vice versa. Weighting can also affect the MOSE. When reading poll results, it is helpful to look at the N and MOSE not only for the total population surveyed, but for any key subgroups reported. This can help you better understand the level of uncertainty around a given survey estimate. The non-random nature of non-probability surveys makes it inappropriate to calculate a MOSE for these types of polls. Some researchers publish confidence estimates, sometimes called “credibility intervals,” to mimic MOSE as a measure of uncertainty, but they are not the same as a margin of sampling error. It’s also important to note that sampling error is only one source of error in any poll.

Questionnaire. Responses to survey questions can differ greatly based on how the question was phrased and what answer choices were offered, so paying attention to these details is important when evaluating a survey result. Read the question wording and ask yourself – do the answer options seem balanced? Does the question seem to be leading respondents toward a particular answer choice? If the question is on a topic that is less familiar to people, did the question explicitly offer respondents the chance to say they don’t know or are unsure how to answer? If the full questionnaire is available, it can be helpful to look at the questions that came before the question of interest, as information provided in these questions might “prime” respondents to answer in a certain way.

Transparency. There is no “gold seal” of approval for high-quality survey methods. However, in recent years, there has been an increasing focus on how transparent survey organizations are about their methods. The most transparent researchers will release a detailed methodology statement with each poll that answers the questions above, as well as the full questionnaire showing each question in the survey in the order they were asked. If you see a poll released with a one or two-sentence methodology statement and can’t find any additional information, that may indicate that the survey organization is not being transparent with its methods. The American Association for Public Opinion Research has a Transparency Initiative whose members agree to release a standard set of information about all of their surveys. For political polling, 538 recently added transparency as an element of their pollster ratings. Some news organizations also “vet” polls for transparency before reporting results, but many do not. This means that just because a poll or survey is reported in the news doesn’t necessarily mean it’s reliable. It’s always a good idea to hunt down the original survey report and see if you can find answers to at least some of the questions above before making judgments about the credibility of a poll.

Election polling vs. issue polling. Election polls – those designed at least in part to help predict the outcome of an election – are covered frequently in the media, and election outcomes are often used by journalists and pundits to comment on the accuracy of polling. Issue polls – those designed to understand the public’s views, experiences, and knowledge on different issues – differ from election polls in several important ways. Perhaps the most important difference is that, in addition to the methodological challenges noted above, election polls face the added challenge of predicting who will turn out to vote on election day. Most election polls include questions designed to help with this prediction, and several questions may be combined to create a “likely voter” model, but events or other factors may affect individual voter turnout in ways pollsters can’t anticipate. Election polls conducted months, weeks, or even days before the election also face the risk that voters will change their mind about how to vote between the time they answer the survey and when they fill out their actual ballot. Issue polls do not generally face these challenges, so it’s important to keep in mind that criticisms about the accuracy of election polls may not always apply to other types of polls.

Examples of the Usefulness of Polls in Understanding Health Policy

Copy link to Examples of the Usefulness of Polls in Understanding Health Policy

Example #1: Tracking the evolution of public opinion and experience through debate, passage, and implementation of the Affordable Care Act

The Affordable Care Act (ACA) is the largest health legislation enacted in the 21st century. From the time the legislation was being debated in Congress through its passage, implementation, and efforts to repeal it, the ACA has been the subject of media coverage, political debate, campaign rhetoric, and advertising. In each of those stages, polls and surveys have provided important information for understanding what was happening with the law.

Prior to passage, polls showed the public’s desire for change in health care, particularly when it came to decreasing the uninsured rate and making health care and insurance more affordable. Despite this apparent consensus on the need for change, polls also helped shed light on some of the barriers to passing legislation. For example, survey trends demonstrated how the share of the public who expected health reform legislation to leave their families worse off increased over the course of an increasingly public debate in which opponents tapped into fears about how the proposed law might change the status quo.

After the law was passed, public opinion on the ACA was sharply divided along partisan lines, with majorities of Democrats viewing the law favorably and majorities of Republicans having an unfavorable view. However, surveys also painted a more nuanced picture beyond the overall partisanship, showing that majorities of U.S. adults across partisan lines favored many of the things the ACA did, including allowing young adults to stay on their parents’ insurance until age 26, preventing health plans from charging sick people more than healthy people, and providing financial subsidies to help lower- and moderate-income adults purchase coverage. At the same time, polls showed that many adults were not aware that these provisions were part of the ACA, and that many others incorrectly believed the law did things it did not, such as creating a government-run insurance plan and allowing undocumented immigrants to receive government financial help to purchase coverage.

This combination of “the parts more popular than the whole” and incomplete public knowledge of the law provided some insight into why efforts to repeal the law were ultimately unsuccessful despite the relative unpopularity and deep partisan divisions on the law overall. When faced with the very real prospect of the popular parts of the law going away – particularly the protections for people with pre-existing health conditions – the public (and particularly Democrats and independents who had previously expressed lukewarm support) rallied to protect it. In fact, following concerted Republican efforts to repeal the law in 2017, the ACA has remained more popular than ever, with more adults expressing a favorable than an unfavorable opinion.

In addition to providing information about the public’s evolving opinion and awareness of the law, surveys also helped provide information about people’s experiences under the law. For example, a 2014 survey of people who purchase their own insurance found that 6 in 10 people enrolled in insurance through the new marketplaces were previously uninsured, and that most of this group said they decided to purchase insurance because of the ACA. Subsequent surveys showed that most marketplace enrollees were satisfied with their plans, but many reported challenges related to the affordability of coverage and care.

These are just a few examples of the ways surveys helped provide insights into the dynamics of a complex health policy at different points in time.

Example #2: Understand the limits of public support of Medicare-for-All proposals

Another health policy issue where polls have provided useful information is the debate over a national, single-payer health plan. While the idea has been discussed for decades, public discussion was prominent most recently during the 2016 and 2020 Democratic presidential primaries, when Senator Bernie Sanders made “Medicare-for-all” a centerpiece of his campaign. Since 2017, a majority of U.S. adults have supported the idea of a national Medicare-for-all plan, but once again, polls also indicated why such a proposal had never become a political reality. For example, the public’s reaction to the idea varies considerably based on the language used to describe it; while majorities view the terms “universal coverage” and “Medicare-for-all” positively, most have a negative reaction to “socialized medicine,” and many are unsure how they feel about the term “single-payer health insurance.” Surveys also demonstrate that while support starts out high, many people say they would oppose a Medicare-for-all plan if they heard common arguments made by opponents, such as that it would lead to delays in treatments, threaten the current Medicare program, or increase taxes. Polls like these and others that test different messages can help shed light on the public’s likely reaction to real-world debates over policies, helping us understand some of the reasons why certain policies that seem to attract majority support in the abstract face an uphill battle once public debate and discussion about them begin.

Example #3: Understanding the impact of the Supreme Court’s overturning of Roe v. Wade

Polls can also help shed light when sudden events create policy changes that immediately affect individuals’ access to health care in different scenarios. A recent example is the Supreme Court 2022 decision in Dobbs v. Jackson that overturned Roe v. Wade and eliminated the nationwide right to abortion that had been in place since 1973. The Dobbs decision opened the door for states to pass their own abortion regulations, and many states had previously established “trigger laws” that made abortion illegal as soon as Roe was overturned.

Polls before and after the 2022 midterm election indicated how the overturn of Roe affected voter motivation, turnout, and vote choice. For example, polling in October 2022 showed abortion increasing as a motivating issue for voters, particularly among Democrats and those living in states where abortion was newly illegal. And election polling of voters showed how the Supreme Court decision played a key role in motivating turnout among key voting blocs that likely contributed to the Democratic party’s stronger-than-expected performance in the midterms.

Understanding the impact of Dobbs is an area where polling of specific populations (including grouping individuals by the abortion laws in their state) is more useful than looking at the U.S. population as a whole. For example, in addition to shedding light on the dynamics of abortion as an election issue, polling in 2023 indicated widespread confusion about the legality of medication abortion, particularly among people living in states that had banned or severely limited the procedure. Surveys also shed light on the experiences of people living in different states; for example, a 2024 survey found that 1 in 5 women of reproductive age (18-49) living in states with abortion bans said either they or someone they know had difficulty accessing an abortion since the Supreme Court overturned Roe v. Wade due to restrictions in their state.

Example #4: Amplifying the voices and experiences of marginalized populations

Well-designed surveys of under-represented groups can provide important information about health policy by amplifying the opinions and experiences of those whose voices are often left out of policy debates. Examples include:

  • A survey of 2023 Medicaid enrollees documented the coverage status of people who were disenrolled during the Medicaid “unwinding” process. Beginning in March 2020, states kept people enrolled in Medicaid without the need to renew or re-determine eligibility under a law passed in response to the COVID-19 pandemic. When the law expired in March 2023, it was uncertain how individuals and families would be affected. Surveys like this helped document the impact of the policy change on people’s coverage status and access to care.
  • A survey of U.S. immigrants shed light on the health and health care experiences of a group that makes up one-sixth of the adult population. Among other findings, this survey showed that half of all likely undocumented immigrants in the U.S. lacked health insurance coverage, information not previously available from other data sources. It also illustrated the importance of state policies in determining coverage rates for immigrant adults, documenting the much higher uninsured rate among immigrants living in states with less expansive coverage policies (like Texas) compared to those in states with more expansive policies (like California).
  • A survey of trans adults documented this population’s struggles accessing appropriate health care. Among other findings, this survey found that almost 4 in 10 trans adults said it was difficult to find a health care provider who treats them with dignity and respect, 3 in 10 said they had to teach a provider about trans people in order to get appropriate care, and 1 in 5 had health insurance that would not cover gender-affirming treatment. Importantly, these survey findings help increase understanding of the health care experiences of a group that is often marginalized in U.S. society, and one that also faces other barriers, including economic challenges, higher rates of mental health challenges and unmet needs for mental health care.
  • A survey focused on racism, discrimination, and health showed the extent of discrimination and unfair treatment in health care settings. This survey found that large shares of Black, Hispanic, Asian, and American Indian and Alaska Native adults reported preparing for possible insults or being very careful about their appearance in order to be treated fairly during health care encounters. It also showed how individuals who have more visits with providers who share their racial and ethnic background report more positive health care experiences. These findings provide insights into possible policy solutions to improve care, highlighting the importance of a diverse health care workforce that is trained in culturally appropriate care.
  • Surveys of areas impacted by natural disasters also help provide information to guide recovery efforts in these areas. For example, a survey of Hurricane Katrina evacuees living in Houston-area shelters documented the physical and emotional toll of the storm and the disproportionate impact on lower-income, African American, and uninsured residents. A series of surveys of New Orleans residents in the years following Katrina showed steady progress in many areas of recovery, but highlighted how the gap between the experiences of the city’s Black and White residents grew over time in many ways. Surveys of Puerto Rico residents following Hurricane Maria and Texas Gulf Coast residents following Hurricane Harvey provided similar insights to shine a lens on disparities and highlight the needs of the local populations in those areas.

Resources

Copy link to Resources

Citation

Copy link to Citation

Brodie, M., Hamel, L., & Kirzinger, A., The Role of Public Opinion Polls in Health Policy. In Altman, Drew (Editor), Health Policy 101, (KFF, July 2024) https://www.kff.org/health-policy-101-the-role-of-public-opinion-polls-in-health-policy (date accessed).

What are the Consequences of Health Care Debt Among Older Adults?

Published: Jul 26, 2024

Health care debt is a widespread problem in the United States, garnering the attention of some policymakers and emerging as a potential campaign issue. A 2022 KFF survey found that 2 in 5 US adults (41%) of all ages report some form of debt due to medical or dental bills for their own or someone else’s care. Nearly three-quarters of adults say they are worried about affording unexpected medical bills or the cost of health care services, higher than the shares who report worrying about affording other household expenses. The Medicare program, which provides health insurance coverage to 66 million people, most of whom are older adults ages 65 or older, helps to cover the cost of medical care for those who qualify, yet health care cost-related problems among Medicare-age adults are not uncommon and leave many exposed to debt, with potentially serious and long-lasting health and financial consequences.

Medicare offers coverage for a range of health care services, including hospitalizations, physician visits, prescription drugs, and post-acute care, but Medicare beneficiaries generally pay out-of-pocket for their monthly premiums and deductibles, cost-sharing for Medicare-covered services, and the cost of services not covered by Medicare, such as dental, vision, and hearing care and long-term services and supports. Medicare households also spend more on health care than other households and devote a larger share of their household budgets to medical costs and premiums. Health costs are a particular challenge for the millions of Medicare beneficiaries with limited income and savings to absorb unexpected health or other expenses. Finally, older adults are more likely than younger populations to have cognitive impairments such as Alzheimer’s Disease, which have been shown to contribute to a decline in credit scores and financial instability years before the condition is diagnosed.

This data note examines findings from the KFF Health Care Debt Survey to assess the prevalence, sources and consequences of health care debt among Medicare-age adults.

Key Takeaways

  • More than one in five US adults ages 65 and older (22%) reported having some form of debt in 2022 as a result of medical or dental bills for their own or someone else’s care, which is half the share reported among adults ages 50-64 (44%).
  • Among Medicare-age adults with health care debt, large shares say that some of the bills that caused their debt were due to routine health care services such as lab fees and diagnostic tests (49%), dental care (48%), and visits to the doctor (41%).
  • Nearly three in ten Medicare-age adults with health care debt (29%) say their household has been contacted by a collection agency in the past five years as a result of medical or dental bills, while one in four (23%) say that health care debt has negatively affected their credit score.
  • Three in five Medicare-age adults with health care debt (62%) say that they, or another member of their household, have delayed, skipped, or sought alternatives to needed health care or prescription medications due to costs in the past year.
While the Prevalence of Health Care Debt Declines With Age, One in Five Adults Ages 65 and Older Report Experiencing Debt Due to Medical or Dental Bills

In 2022, more than one in five US adults ages 65 and older (22%) had some form of debt as a result of medical or dental bills (Figure 1). This is roughly half the share found among adults ages 50 to 64 (44%), who are not yet eligible for Medicare based on age. Lower rates of health care debt among older adults are likely due, in part, to nearly universal Medicare coverage among people ages 65 and older. Additionally, most Medicare beneficiaries have some form of coverage that limits their cost-sharing expenses, such as Medicare Advantage, or supplemental coverage, such as Medicaid, retiree health benefits, or Medigap.

The rate of health care debt among people ages 65 and older is higher than reported by some others,  principally because of methodological differences in the way health care debt is defined. Surveys of health care debt in the US have commonly focused on unpaid medical bills, or bills which have been sent to collections, which may overlook the share of adults who pay off their health care bills by accumulating credit card debt, taking out loans, or borrowing from family and friends. For this reason, the KFF Health Care Debt Survey provides a broad measure of health care debt, which includes other types of debt incurred as a result of medical or dental bills, as well as debts owed for the care of someone else, such as a child, spouse, or parent.

Health Care Debt Among Older Adults Takes Many Forms, Including Debt Owed to Providers, Credit Card Companies, Collection Agencies, and Family or Friends

Many older adults pay off their health care bills by accumulating credit card debt or debt from other sources (Figure 2). Roughly one in ten Medicare-age adults report having medical or dental bills that they are paying off over time directly to a provider (12%), put on a credit card and are paying off over time (11%), are past due or unable to be paid (8%), or have debts owed to a bank, collection agency or other lender as a result of loans used to pay off medical or dental bills (7%). A smaller share report debts owed to family and friends for money borrowed to pay off medical or dental bills (3%).

Roughly two in five Medicare-age adults with health care debt (39%) owe less than $1,000, including one in five (19%) who owe less than $500, but one in ten Medicare-age adults with health care debt (11%) owe $10,000 or more (data not shown). Even relatively small amounts of debt can contribute to a drop in credit ratings.

Lab Fees, Doctor Visits, and Dental Care are Among the Largest Contributors to Health Care Debt for Older Adults

Sources of health care debt among older adults are varied, and include many routine health care needs (Figure 3). Nearly half of Medicare-age adults with health care debt say that some of the bills that caused their debt were due to lab fees and diagnostic tests (49%), dental care (48%), and visits to the doctor (41%). One in three (31%) attribute a portion of their debt to emergency care, and one in four (24%) to prescription drugs. Dental care is one of the leading causes of health care debt among Medicare-age adults, likely due to the fact that traditional Medicare does not offer coverage for dental care services. (Most Medicare Advantage plans include some dental care coverage, but the scope of coverage varies widely, and enrollees may still incur substantial out-of-pocket costs for these services.)

Just 6% of Medicare-age adults attribute a portion of their debt to bills for long-term care services and supports, such as the cost of nursing home care, assisted living or full or near full-time home health aides. These services are used extensively by a relatively small segment of the Medicare population but can be quite costly. For example, in 2023, the median annual cost of a private room in a nursing home was $116,800 and $288,288 for round-the-clock home health aide services. These costs far exceed the median income ($36,000 per person) and savings ($103,800 per person) of the average Medicare beneficiary in 2023. Medicare does not generally cover these services, placing them out of reach for many older adults and leaving some with substantial debt. (Survey findings may underrepresent the costs and associated debt incurred by people living in nursing homes, assisted living facilities and other institutional settings, though the survey does include debt associated with long-term services and supports if incurred by other family members.)

Three in Ten Older Adults with Health Care Debt Say Their Household Has Been Contacted by a Collection Agency and One in Four Have Seen Harm to Their Credit Score

The financial consequences of health care debt may be lasting. Nearly three in ten Medicare-age adults with health care debt (29%) say their household has been contacted by a collection agency as a result of medical or dental bills, while one in four (23%) say that health care debt has negatively affected their credit score (Figure 4). For retirees with health care debt, these consequences may be difficult to reverse, and can make it more challenging to secure affordable credit in the future. The Consumer Financial Protection Bureau recently proposed a rule that would remove health care bills from most credit reports and prohibit lenders from making loan decisions based on medical information, with the goal of reducing the burden of health care debt for US adults and safeguarding against coercive credit reporting practices.

Two in Five Older Adults with Health Care Debt Say Their Household Has Cut Back Spending on Basic Necessities or Drained Their Savings

Two in five Medicare-age adults with health care debt report that they, or another member of their household, have cut back spending on household necessities (42%) or used up a large portion of their savings (39%) in the past five years as a result of their health care debt (Figure 5). One in three have taken money out of long-term savings accounts, such as a retirement account (34%) or increased their credit card debt for non-medical purchases (31%), and one in five have taken out a loan (21%) or skipped or delayed payment of other bills (18%). Sacrifices such as these can have serious consequences for financial stability and general wellbeing and may perpetuate the cycle of health care debt by leaving older adults with fewer resources for other needed health expenses.

Three in Five Older Adults with Health Care Debt Say Members of Their Household Have Delayed, Skipped, or Sought Alternatives to Needed Health Care or Prescription Medications

Three in five Medicare-age adults with health care debt (62%) say that they, or another member of their household, have delayed, skipped, or sought alternatives to needed health care or prescription medications due to costs (Figure 6). Nearly half (48%) of Medicare-age adults with health care debt postponed getting health care they needed in the past year, while two in five (43%) relied on home remedies or over the counter drugs instead of going to the doctor, and one in three did not get a medical test or treatment recommended by a doctor (31%) or took less than the prescribed dose of a medication by skipping doses, cutting pills in half, or leaving the prescription unfilled (28%).

U.S. International Family Planning & Reproductive Health: Requirements in Law and Policy

Published: Jul 26, 2024

This fact sheet summarizes the major statutory requirements and policies pertaining to U.S. global family planning/reproductive health (FP/RH) efforts over time and identifies those currently in effect.  These laws and policies collectively serve to direct how U.S. funds are spent, to where and which organizations funds are provided, and generally shape the implementation and define the scope of U.S. global FP/RH activities. It includes U.S. laws and annual requirements enacted by Congress through appropriations bills (statutory provisions) as well as executive branch policies and guidance specific to FP/RH (policy provisions). Each category lists provisions in chronological order.

Table 1
Statutory Requirements and Policies for U.S. Global FP/RH Efforts (as of FY 2024)
Provision (Year First Instituted)Issue(s)Applies toStatus
STATUTORY
Helms Amendment (1973)Prohibits the use of foreign assistance to pay for the performance of abortion as a method of family planning or to motivate or coerce any person to practice abortion. Note: meaning of “motivate” clarified by Leahy Amendment (1994); see below.AbortionAll foreign assistance authorized under the Foreign Assistance Act of 1961(FAA); all funds under State-Foreign Operations Appropriations (State-Foreign Ops.)Yes, in effect.Permanent law, amendment to the FAA.Also included in annual State-Foreign Ops.
Involuntary Sterilization Amendment (1978)Prohibits the use of funds to pay for involuntary sterilizations as a method of family planning or to coerce or provide a financial incentive to anyone to undergo sterilization.Voluntarism/Informed Choice & Consent; Incentives; Involuntary SterilizationAll foreign assistance authorized by the FAA of 1961; all foreign assistance funds under State-Foreign Ops.Yes, in effect.Permanent law, amendment to the FAA.Also included in annual State-Foreign Ops.
Peace Corps Provision (1978)Prohibits Peace Corps funding from paying for an abortion for a Peace Corps volunteer or trainee; beginning in FY 2015, allows for payment in cases where the life of the woman is endangered by pregnancy or in cases of rape or incest.1 AbortionAll Peace Corps fundingYes, in effect.Included under the “Peace Corps” heading of the State-Foreign Ops.
Biden Amendment (1981)States that funds may not be used for biomedical research related to methods of or the performance of abortion or involuntary sterilization as a means of family planning.Abortion; Involuntary SterilizationAll foreign assistance authorized by the FAA of 1961; all foreign assistance funds under State-Foreign Ops.Yes, in effect.Permanent law, amendment to the FAA.Also included in annual State-Foreign Ops.
Siljander Amendment (1981)Prohibits the use of funds to lobby for or against abortion. When initially introduced, the amendment prohibited only lobbying for abortion, but in subsequent years Congress modified the language to include lobbying against abortion as well.AbortionAll funds under State-Foreign Ops.Yes, in effect.Included in annual State-Foreign Ops.
DeConcini Amendment (1985)Requires that U.S. funds be provided to organizations that offer, either directly or through referral to, information about access to a broad range of family planning methods and services. See Livingston-Obey Amendment (1986) below.Voluntarism/Informed ChoiceAll FP funds under State-Foreign Ops.Yes, in effect.Included in annual State-Foreign Ops.
Kemp-Kasten Amendment (1985)Prohibits funding any organization or program, as determined by the President, that supports or participates in the management of a program of coercive abortion or involuntary sterilization.UNFPA Funding; Abortion; Voluntarism/Informed Choice & Consent; Involuntary SterilizationAll funds under State-Foreign Ops. as well as unobligated balances from prior appropriations actsYes, in effect.Included in annual State-Foreign Ops.2  each year; Presidents determined that it applied to UNFPA in FY85-FY92, FY02-FY08, FY17-FY20.
Involuntary Sterilization and Abortion Provision (1985)Specifies that U.S. foreign assistance funding could be withheld from a country or organization if the president certifies that the use of such funds would violate key provisions of the FAA of 1961 related to abortion or involuntary sterilization (namely the Helms, Biden, and Involuntary Sterilization Amendments).Voluntarism/Informed Choice & Consent; Incentives; Abortion; Involuntary SterilizationAll foreign assistance funds under State-Foreign Ops.Yes, in effect.Included in annual State-Foreign Ops.
Livingston-Obey Amendment (1986)Prohibits discrimination by the U.S. government against organizations that offer only “natural family planning” for religious or conscientious reasons when the U.S. government is awarding related grants. All such applicants must comply with the requirements of the DeConcini Amendment (1985).Voluntarism/Informed ChoiceAll FP funds under State-Foreign Ops.Yes, in effect.Included in annual State-Foreign Ops.
Leahy Amendment (1994)Clarifies Helms Amendment (1973) language that uses the term “motivate” by stating that “motivate” shall not be construed to prohibit, where legal, the provision of information or counseling about all pregnancy options.Abortion; Voluntarism/Informed ChoiceAll authorizing and appropriating legislation related to the State Dept., foreign operations, and related programsYes, in effect.Included in annual State-Foreign Ops.
Timing of Release of UNFPA Contribution Funds (1994)Not more than half of funding designated for the U.S. contribution to UNFPA is to be released before a particular date (varies by fiscal year).UNFPA FundingFunds made available to UNFPANo, not in effect.Sometimes included in annual State-Foreign Ops.
Conditions on Availability of UNFPA Funds (UNFPA Segregated U.S. Contribution Account; UNFPA Does Not Fund Abortions; Prohibition on the Use of U.S. Funds in China by UNFPA) (1994)States that funds may not be made available to UNFPA unless:
  • UNFPA keeps the U.S. contribution to the agency in a separate account, not to be commingled with other funds, and
  • UNFPA does not fund abortions (note: language used beginning in FY00).It also prohibits UNFPA from using any funds from the U.S. contribution in their programming in China.
UNFPA Funding; AbortionFunds made available to UNFPAYes, in effect.Included in annual State-Foreign Ops.
UNFPA Dollar-for-Dollar Withholding of Amount UNFPA Plans to Spend in China During Fiscal Year (1994)Reduces the U.S. contribution to UNFPA by one dollar for every dollar that UNFPA spends on its programming in China.UNFPA FundingFunds made available to UNFPAYes, in effect.Typically included in annual State-Foreign Ops.
Tiahrt Amendment (1998)Prohibits the use of targets/quotas and financial incentives3  in family planning projects and requires projects to provide comprehensible information on family planning methods. Protects people who choose not to use family planning from being denied rights or benefits and requires experimental family planning methods be provided only in the context of a scientific study. Intended to “promote voluntarism and prevent coercion in family planning programs,” it specifically prohibits three types of targets: total number of births, number of family planning acceptors, and acceptors of a particular method of family planning.4 Voluntarism/Informed Choice & Consent; Incentives and DisincentivesAll FP funds under State-Foreign Ops.Yes, in effect.Included in annual State-Foreign Ops.
Reallocation of Funds Not Made Available to UNFPA (2004)Provides for funds not made available to UNFPA to be reallocated to USAID’s family planning, maternal, and reproductive health activities/services (and, in some years, assistance to vulnerable children and victims of trafficking in persons).5 UNFPA FundingFunds appropriated for UNFPAYes, in effect.Typically included in annual State-Foreign Ops.
Medically Accurate Information on Condoms (2005)Ensures that information provided by U.S.-supported programs about the use of condoms is medically accurate information and includes the public health benefits and failure rates of such use.CondomsAll funds under State-Foreign Ops.Yes, in effect.Typically included in annual State-Foreign Ops.
POLICY
USAID Policy Paper on Population Assistance (1982)Outlines the longstanding USAID guidelines surrounding its fundamental programmatic principles of voluntarism and informed choice and consent.6 Voluntarism/Informed Choice & ConsentAll FP/RH assistance provided by USAIDYes, in effect.
Policy Determination 3 (PD-3): USAID Policy Guidelines on Voluntary Sterilization (1982)Describes guidelines for informed consent and voluntarism specifically for voluntary sterilization services, including provisions to ensure ready access to other contraceptive methods and prohibiting incentive payments that might induce a person to select voluntary sterilization over another method.Voluntarism/Informed Choice & Consent; Voluntary SterilizationAll FP/RH assistance provided by USAIDYes, in effect.
Mexico City Policy (“Global Gag Rule”, 1984)7 As a condition for receiving U.S. family planning assistance and, now, also other global health assistance (see “Applies to”), requires foreign NGOs to certify that they will not perform or promote abortion as a method of family planning using funds from any source.Under the Trump administration, it was called “Protecting Life in Global Health Assistance” policy.Abortion1984- 2003: when in effect, was applied to FP assistance at USAID only. In 2003, expanded to include all FP assistance at USAID and the State Dept., exempting multilateral organizations and HIV/AIDS funding under PEPFAR. 2009-17: Not in effect. 2017-2021: applied to all global health assistance. 2021-present: Not in effect.No, not in effect.Not currently in force.8 
USAID Post-Abortion Care Policy (2001)Clarifies that post-abortion care – the treatment of injuries or illnesses caused by legal or illegal abortion – is permitted under the Helms Amendment and that any restrictions under the Mexico City Policy, when in force, do not limit organizations from treating injuries or illnesses caused by legal or illegal abortions (i.e., providing post-abortion care). Notes USAID does not finance manual vacuum aspiration equipment purchase/distribution for any purpose.Post-Abortion CareAll FP/RH assistance provided by USAIDYes, in effect.
Guidance on the Definition and Use of the Global Health Programs Account: Section on Allowable Uses of Funds for Family Planning/Reproductive Health (2014)Outlines allowable uses of funds for FP/RH by providing a description of activities allowed and examples of activities not allowed, addressing not only FP/RH activities but also family planning activities’ integration with other global health and multisectoral activities.FP/RH Activities; FP/RH System Strengthening Activities; Integrated FP ActivitiesAll FP/RH assistance provided by USAIDYes, in effect.Updated periodically.
PEPFAR 2023 Country and Regional Operational Plan GuidanceOutlines certain FP/RH activities that may be reported under specific PEPFAR budget categories, such as youth-friendly sexual and RH services that are part of prevention for adolescent girls and young women.HIV/AIDS Program Linkages with FP/RH Activities; Abortion“Wraparound” PEPFAR activities related to FP/RHYes, in effect.Updated annually; moving to biennial.
Standard Provisions for Nongovernmental Organizations (U.S. and Non-U.S.)Outline requirements that must be attached to assistance agreements, including language implementing FP/RH legal and policy requirements described above (e.g., the Helms and Leahy Amendments.)9  Voluntarism/Informed Choice & Consent; Incentives; Abortion; Involuntary Sterilization; Condoms; FP/RH ActivitiesUSAID assistance agreementsYes, in effect.Updated periodically.
Notes: PEPFAR= U.S. President’s Emergency Plan for AIDS Relief; UNFPA= United Nations Population Fund; USAID= U.S. Agency for International Development.
  1. As noted in CRS, Abortion and Family Planning-Related Provisions in U.S. Foreign Assistance Legislation and Policy, July 2022: “No restrictions exist on funding for the medical evacuation of Peace Corps volunteers who decide to have an abortion. Under existing policy, the Peace Corps covers the cost of evacuation to a location where ‘medically adequate facilities’ for obtaining an abortion are available and where abortions are legally permissible.” ↩︎
  2. In most recent years, a provision is included requiring that any Kemp-Kasten determination that is made must be accompanied by the evidence and criteria used to make the determination. ↩︎
  3. USAID defines a target/quota as “a predetermined figure that a service provider or referral agent is assigned or required to affect or achieve” for the purposes of the Tiahrt Amendment. It states that “the key to interpreting ‘incentives’ is to see whether they are provided in exchange for accepting a method (in the case of a client) or linked to achievement of a predetermined target or quota (in the case of program personnel).” USAID Global Health eLearning Center, “FP Legislative & Policy Requirements (Updated),” online course, February 2009, authored by Debbie Gueye, MSI. ↩︎
  4. USAID Global Health eLearning Center, “FP Legislative & Policy Requirements (Updated),” online course, Feb. 2009, authored by Debbie Gueye, MSI. ↩︎
  5. Although such reallocation began in practice in FY 2002, it was first authorized by Congress in legislation beginning in FY 2004 with reference to FY 2002 and FY 2003 funds. ↩︎
  6. Informed Choice: Effective access to information on family planning choices and to the counseling, services, and supplies needed to help individuals choose to obtain or decline services; to seek, obtain, and follow up on a referral; or simply to consider the matter further. Voluntarism: Decision to use a specific method of family planning or to use any method of family planning is based upon the exercise of free choice and is not obtained by any special inducements or any element of force, fraud, deceit, duress or other forms of coercion or misrepresentation. USAID Global Health eLearning Center, “FP Legislative & Policy Requirements (Updated),” online course, Feb. 2009, authored by Debbie Gueye, MSI. ↩︎
  7. This policy was first instituted via presidential memorandum in 1984 by President Reagan. In 1993, it was rescinded by President Clinton, although it was briefly applied legislatively in 1999 (see “Status” column). In 2001, it was reinstated by President Bush, who expanded its applicability in 2003 to include family planning funds at the State Department (see “Applies to” column) with some exemptions. In 2009, it was rescinded by President Obama. In 2017, it was reinstated by President Trump, who expanded its applicability to include the vast majority of global health assistance furnished by all departments and agencies. In 2021, it was rescinded by President Biden.. ↩︎
  8. Note that, with one exception, has been applied via Executive action. The exception was in FY 2000, when President Clinton agreed to a one-year legislative codification with a partial waiver of restrictions as part of a broader arrangement to pay the U.S. debt to the United Nations. See P.L. 106-113, Sec. 599D, and PAI, Global Gag Rule Timeline, July 12, 2011. ↩︎
  9. For example, one provision related to abortion included in the Standard Provisions is: “M16. VOLUNTARY POPULATION PLANNING ACTIVITIES – MANDATORY REQUIREMENTS (MAY 2006) … b. Prohibition on Abortion-Related Activities: (1)           No funds made available under this award will be used to finance, support, or be attributed to the following activities: (i) procurement or distribution of equipment intended to be used for the purpose of inducing abortions as a method of family planning; (ii) special fees or incentives to any person to coerce or motivate them to have abortions; (iii) payments to persons to perform abortions or to solicit persons to undergo abortions; (iv) information, education, training, or communication programs that seek to promote abortion as a method of family planning; and (v) lobbying for or against abortion. The term “motivate,” as it relates to family planning assistance, must not be construed to prohibit the provision, consistent with local law, of information or counseling about all pregnancy options. (2)           No funds made available under this award will be used to pay for any biomedical research which relates, in whole or in part, to methods of, or the performance of, abortions or involuntary sterilizations as a means of family planning. Epidemiologic or descriptive research to assess the incidence, extent, or consequences of abortions is not precluded.”   ↩︎