Federal Vaccine Injury Compensation Programs: Overview and Current Issues
Introduction
For decades, the federal government has overseen two key vaccine injury compensation programs: the National Vaccine Injury Compensation Program (VICP) and the Countermeasures Injury Compensation Program (CICP). The VICP and CICP are designed to help maintain vaccine access while also recognizing that vaccine injuries can occur and those affected by such injuries should be compensated. However, over time, the demands on, and challenges faced by, these programs have grown. Recently, they have become targets of criticism from members of the Trump administration, including the Secretary of Health and Human Services (HHS) Robert F. Kennedy Jr. ,who said (without evidence) in 2025 that VICP had “devolved into a morass of inefficiency, favoritism, and outright corruption” and that he would lead an effort to overhaul it. Some lawmakers and external groups have called to replace or end these programs while others have suggested keeping them intact but adopting policy changes that could help modernize them and make them more effective. Some have raised concerns that making drastic changes to vaccine injury compensation programs could undermine the U.S. vaccine market and, more generally, confidence in vaccines.
To provide background and context on this topic, this brief summarizes the history and rationale for these programs and their key elements, analyzes publicly available information on claims and compensation under the programs, and discusses key policy issues they currently face. The programs, while both having been created as alternatives to civil courts, vary significantly in their structures, processed, vaccines covered, and compensation rates and amounts, among other factors.
Origins and Rationales for VICP and CICP
VICP and CICP were both created as alternative pathways to civil courts to allow individuals to seek compensation for vaccine-related injuries and address vaccine safety while also addressing concerns about vaccine supply in the U.S. Prior to the existence of these programs, there were times when vaccine manufacturers faced a large volume of lawsuits linked to rising public concerns about vaccine safety, which threatened to drive vaccine makers from the market and led them to raise their prices, affecting access to vaccines.
- VICP, created by Congress in 1986, was designed as a legal pathway separate from traditional civil courts through which individuals can seek compensation for potential vaccine injuries directly from the federal government. VICP was created by Congress following a wave of public concern regarding vaccine safety in the late 1970s and 1980s that was fueled, in part, by sensationalized television programs on the topic of vaccine injuries in children. There had been a surge in lawsuits in the civil court system filed against health care practitioners and vaccine makers. Facing rising legal costs, some vaccine manufacturers chose to exit the vaccine market and those that remained raised their prices, which threatened the market for childhood vaccines in the U.S. In response, Congress passed the 1986 National Childhood Vaccine Injury Act (NCVIA) that, among other things, established the VICP. It was intended to help stabilize the vaccine market, preserve public confidence in immunization, while also providing a less adversarial and more streamlined pathway for families to submit claims and receive compensation payments for vaccine injuries compared to civil litigation. The act created the process by which vaccines could be added to VICP coverage and created the VICP trust fund, which funded the program using excise taxes placed by Congress on each of the vaccines covered under VICP. Congress has made several statutory changes and additions to VICP since 1988, including the 1993 Omnibus Budget Reconciliation Act that allowed for rapid inclusion of new U.S. Centers for Disease Control and Prevention or CDC-recommended vaccines into VICP once Congress enacted the excise tax on that vaccine, and the 21st Century Cures Act from 2016 that added vaccines recommended for pregnant women to VICP and explicitly included injuries to children in utero as eligible for VICP compensation.
- CICP was created by Congress in 2005 to allow individuals to seek compensation for injuries that may have occurred from use of medical countermeasures (such as vaccines) during a public health emergency (as distinct from routine use addressed under VICP). It was established as part of the Public Readiness and Emergency Preparedness (PREP) Act, at a time of heightened national security concerns following the September 11, 2001 attacks, anthrax mailings, and the threat of an influenza pandemic. The PREP Act was meant to address concerns that in a public health emergency, such as a bioterrorist attack or a naturally occurring outbreak, private companies might be reluctant to develop and manufacture vaccines, drugs, and other medical countermeasures because of liability risks they could face from use of those products during an emergency. As part of a broader strategy incentivizing rapid development and deployment of countermeasures, the PREP Act offered immunity from liability to manufacturers and distributors of these products, and created the CICP as the federal compensation mechanism for injuries that may occur through use of these products.
Vaccines and Injuries Covered, and Processes for Review and Compensation
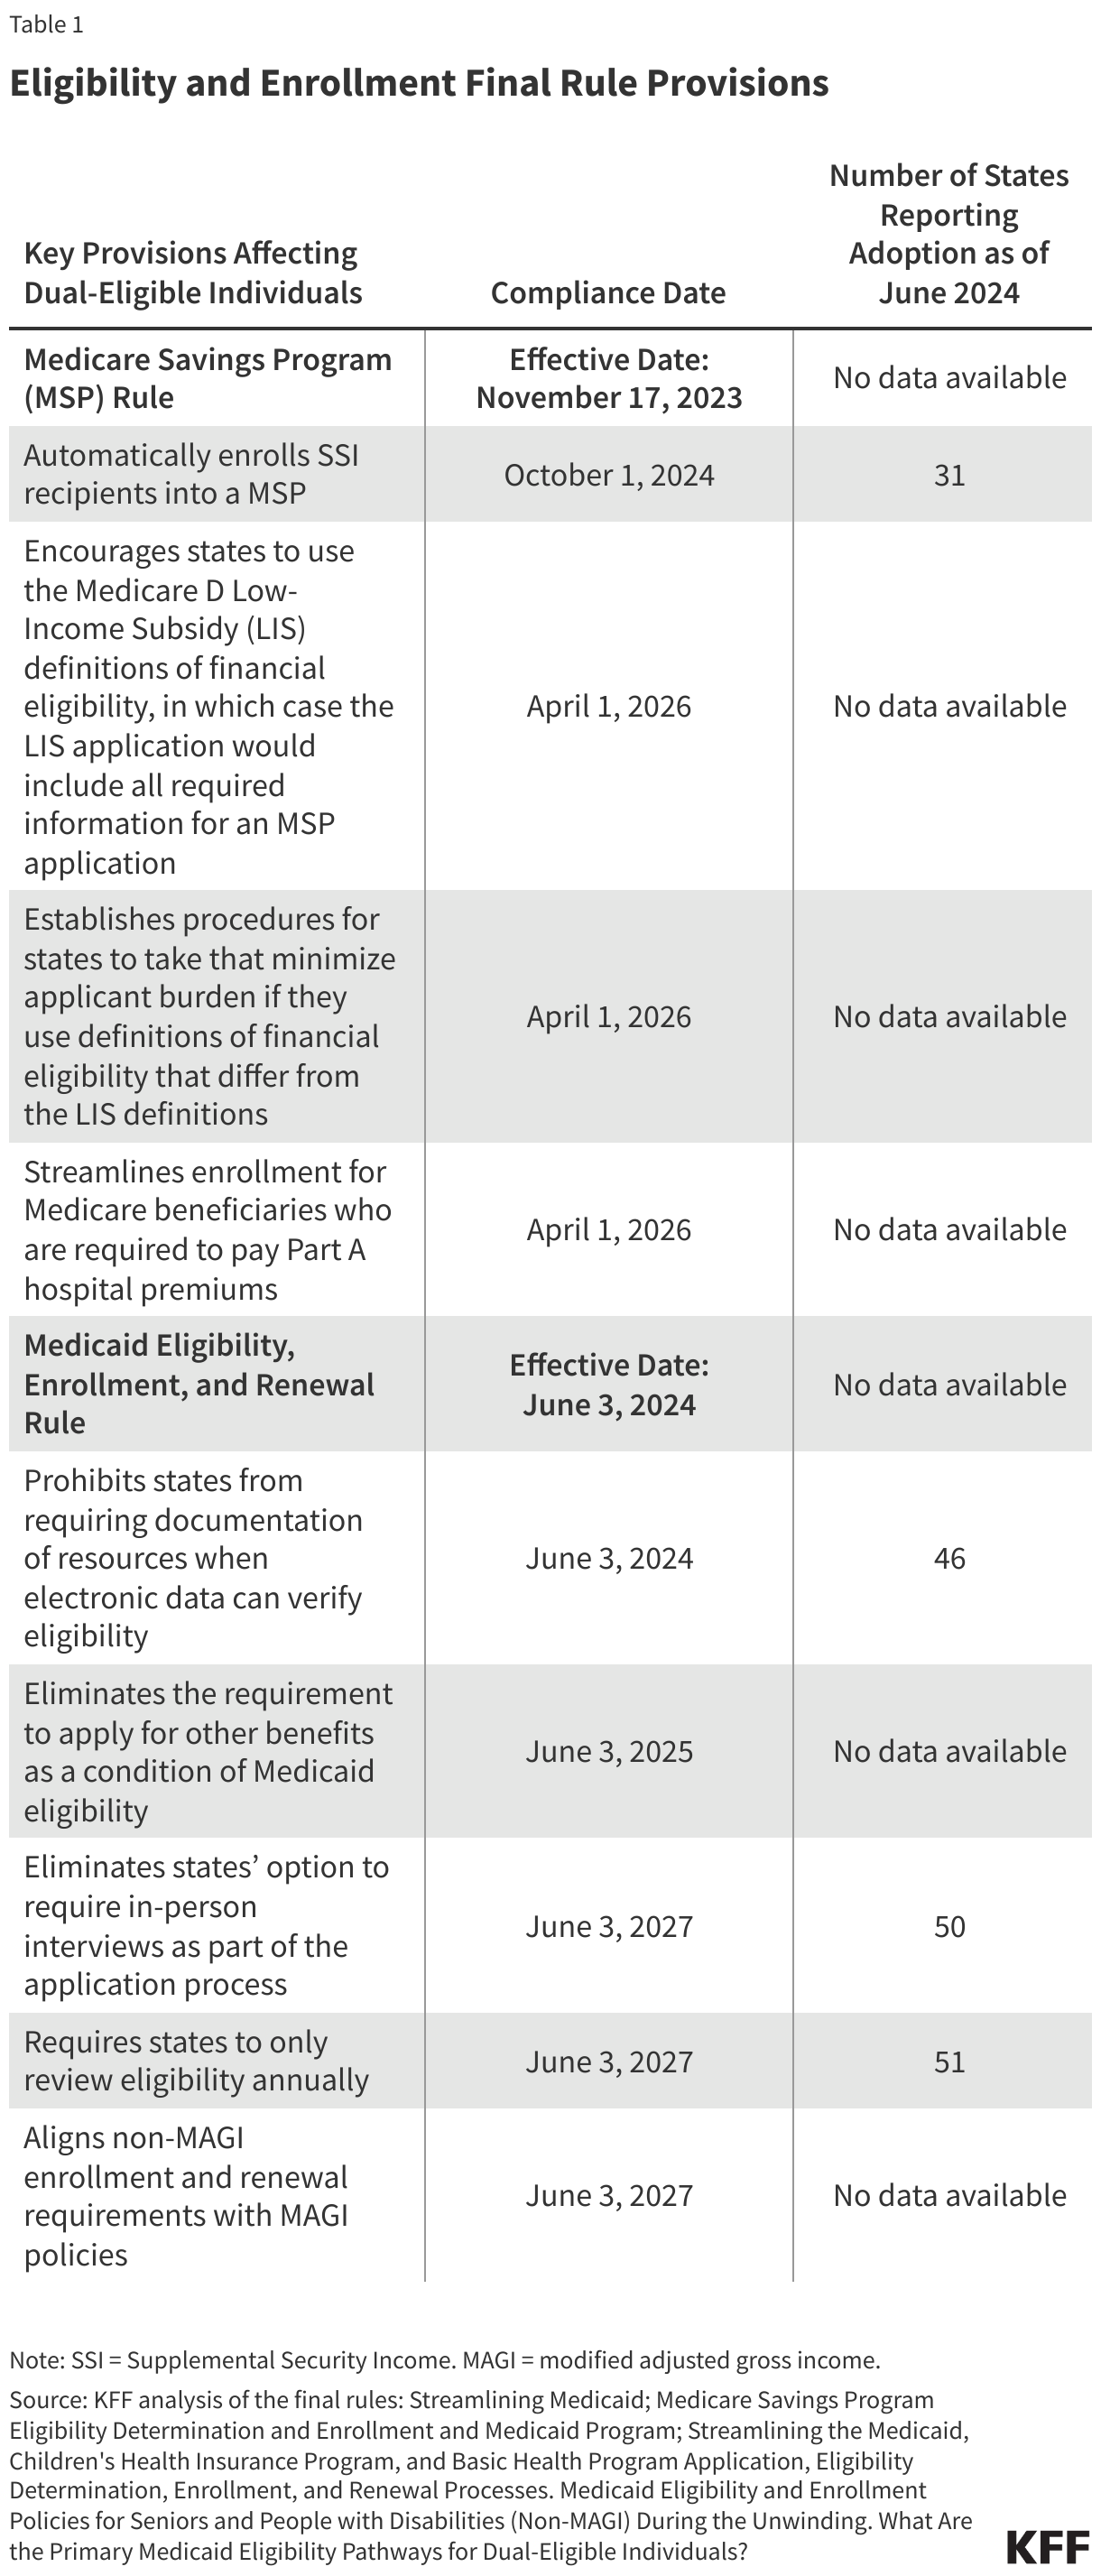
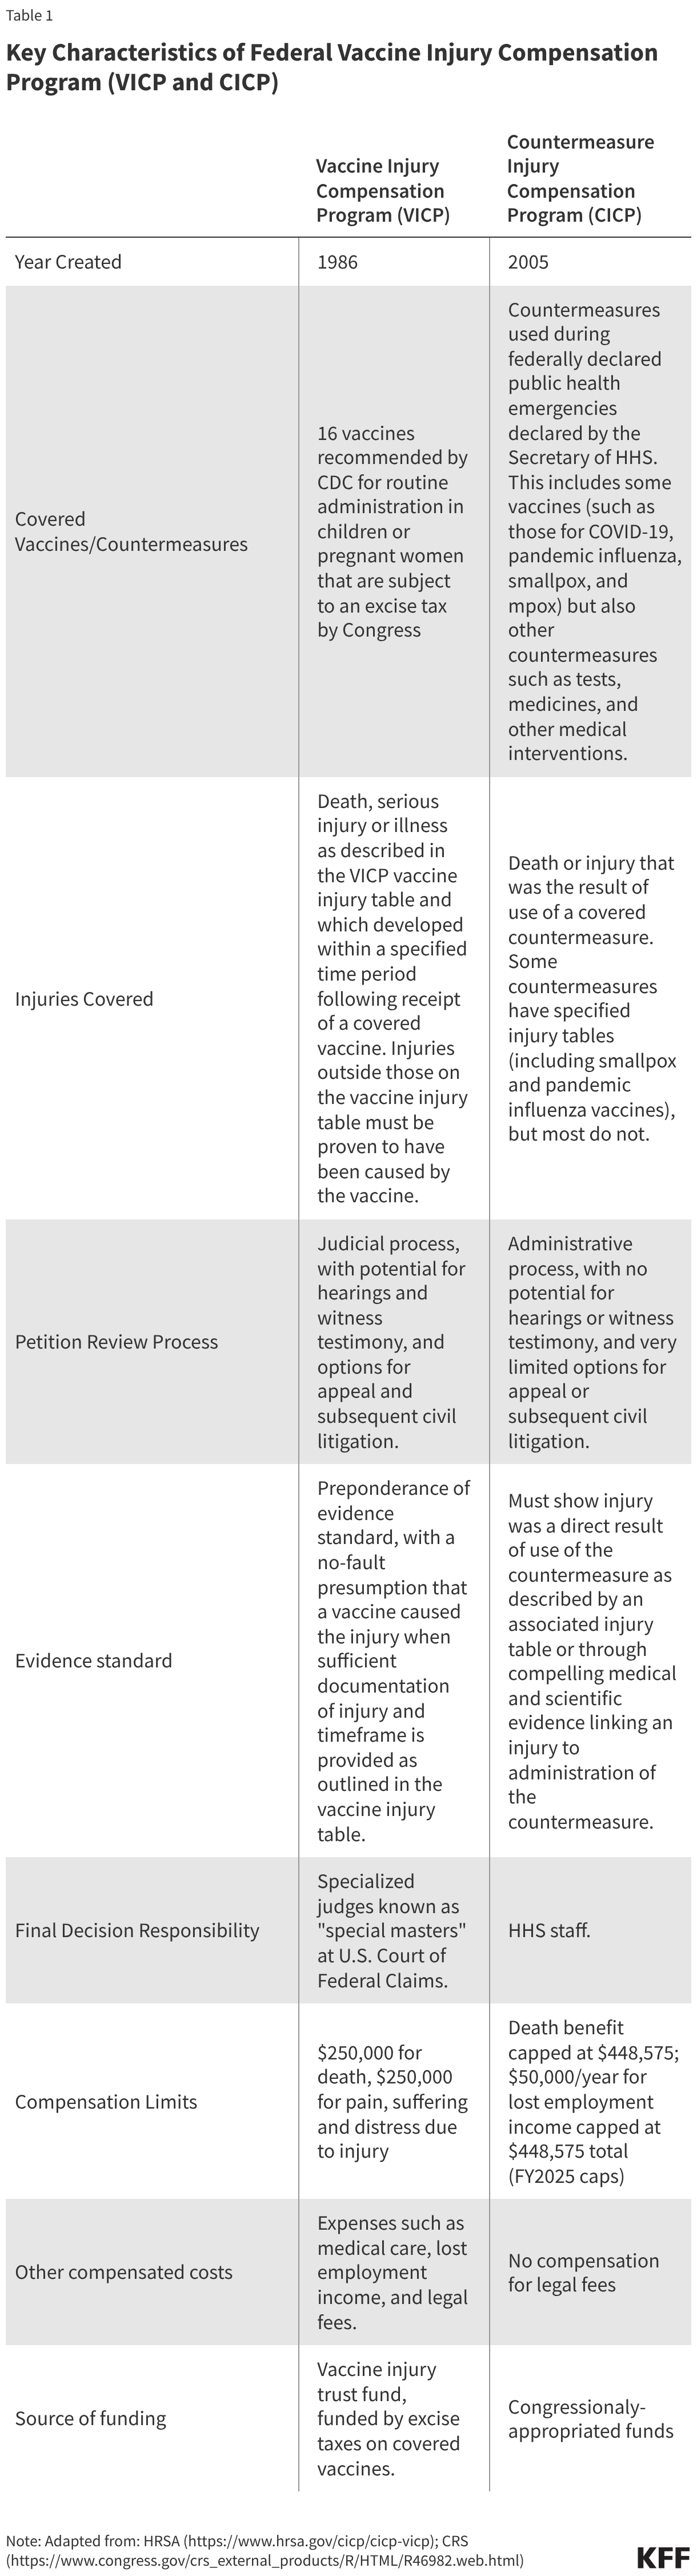
While both VICP and CICP are designed to be more efficient and streamlined mechanisms compared to civil courts for vaccine injury compensation cases, they are distinct in terms of which vaccines are covered and how claims are submitted, reviewed, and adjudicated (see Table 1 for a comparison of key characteristics of these programs).
VICP
- There are currently 16 vaccine types covered under the VICP program. By statute, VICP covers FDA approved vaccines used in the U.S. that are 1) recommended by the CDC for “routine administration” to children or pregnant women, 2) subject by Congress to the VICP excise tax, and, 3) added to the official VICP vaccine injury table by the Secretary of HHS. When first passed in 1986, VICP covered 6 vaccines, a number that has grown to 16 existing vaccines, including the components of common childhood vaccines such as DPT, MMR, and polio as well as child and adult vaccines such as seasonal influenza. The VICP also covers “any new vaccine” recommended by CDC, subject to an excise tax and issued a notice of coverage by the Secretary of HHS.
- The vaccine injury table is a key VICP document listing vaccine types and injuries compensable by VICP. The table lists and explains injuries presumed to be caused by vaccines and the time periods in which the first symptom of these injuries must occur after receiving the vaccine. The current table lists 14 compensable injuries across the 16 vaccine types, with most injuries associated with one or a few vaccine types only. For example, “chronic arthritis” is listed as a potential injury associated only with rubella-containing vaccines, and “vaccine-strain polio infection” is only associated with oral polio vaccine. Others are associated with multiple vaccine types, such as “shoulder injury” and “vasovagal syncope” (i.e. a drop in blood pressure and heart rate), which are each listed for 15 vaccine types.
- VICP claims are submitted to HHS and the U.S. Court of Federal Claims and reviewed through a judicial process overseen by the Office of Special Masters. An individual (or legal representative) must first file a petition with the U.S. Court of Federal Claims “Office of Special Masters” which handles VICP cases. “Special Masters” are specialized officers of the court who function similarly to a judge. Upon receipt, each claim is assigned to one of eight Special Masters and initially reviewed by specialized HHS staff for compliance with VICP submission requirements. Documentation to support an injury claim must be provided, and typically only injuries listed on the vaccine injury table are eligible for compensation. For injuries not on the table, a petitioner must prove, through medical documentation and/or expert opinion, that the vaccine in fact caused the alleged injury. VICP typically pays petitioners’ legal fees, even if the claim is eventually unsuccessful.
- Special Masters issue a ruling on compensation based on a “preponderance of evidence” standard. VICP is designed as a no-fault system, meaning petitioners do not need to prove negligence on the part of vaccine makers or health care practitioners. With sufficient documentation of an injury matching a condition and fitting the timetable listed on the vaccine injury table, it is usually presumed that the vaccine caused the injury. In some cases, additional information is needed such as expert testimony or medical research findings to support injury claims, and evaluating evidence may require hearings with witnesses.
- Petitioners can accept or reject a compensation decision, with the option for appeal. If a ruling is made in favor of a petitioner, the Special Master determines the level of compensation, which a petitioner can accept or reject. If the claim is denied, the petitioner can seek review by a judge of the Court of Federal Claims and potentially appeal further to the U.S. Court of Appeals. If the claimant moves through all appeals and is still denied compensation, then they may have the right to subsequently file a suit in civil court (with some limitations).
- The Secretary of HHS can modify the VICP vaccine injury table, though changes must abide by a statutory process including external expert review and a public comment period. The Secretary of HHS has the explicit authority to modify the vaccine table, though any changes are subject to a process outlined in statute (42 U.S.C. § 300aa-14) and federal regulations (Code of Federal Regulations (CFR) Part 100), including referred to an external expert advisory body known as the Advisory Commission on Childhood Vaccines (ACCV), which has at least 90 days to review suggested changes. In addition, HHS must follow Administrative Procedures Act (APA) guidelines, including publishing a Notice of Proposed Rulemaking (NPRM) in the Federal Register and a 180-day public comment period. Adding a new vaccine to the vaccine injury table requires that new vaccine to be recommended for routine use by CDC, and for Congress to apply an excise tax on that vaccine, before HHS can publish a notice of coverage and submit related changes to the vaccine injury table.
- The VICP vaccine injury table has rarely been updated; its last major revision was in 2017. At that time, “Shoulder Injury Related to Vaccine Administration, or SIRVA was added. HHS proposed adding this to the Table, submitted it to ACCV for input, and in 2015 published the related NPRM. In 2017 HHS issued the final ruling after reviewing and responding to public comments, as required under APA.
CICP
- CICP covers countermeasures used in federally declared public health emergencies, which has included COVID-19 vaccines, as well as vaccines for pandemic influenza, smallpox, and mpox. By statute, covered countermeasures are those that the Secretary of HHS specifically lists in the declarations issued under the PREP Act for each health emergency. Currently, there are 10 such declarations in effect covering countermeasures against health emergencies, including Anthrax, Ebola, Marburg, pandemic influenza, mpox, and COVID-19.
- CICP claims are reviewed through an administrative process by HHS staff, rather than a judicial process. Individuals submit a request to the Health Resources and Services Administration (HRSA) within HHS, which administers CICP. Filings must include sufficient medical records and other documentation linking the countermeasure and the individual’s claimed injury. In contrast to VICP, there no judges or hearings under CICP. Instead, claims are reviewed internally by HHS medical and legal staff. CICP does not pay petitioners’ legal fees.
- CICP does not have a single “injury table” reference for covered countermeasures, with claims typically requiring individualized, case-by case review. Some declared health emergencies – including smallpox and pandemic influenza – have a specified countermeasure injury table, but most do not (COVID-19 countermeasures, for example, do not have an injury table). Therefore, most claims require individualized scientific review and case-by-case considerations. To receive compensation, a petitioner must show “serious physical injury was sustained as the result of the use of a covered countermeasure,” which is a higher evidentiary standard compared to VICP.
- CICP decisions leave little room for appeal. HRSA issues a written determination on whether the injury is eligible for compensation under CICP and, if found eligible, how much compensation is awarded. If found ineligible, a petitioner can request reconsideration, but further review is still handled internally, with no process for formal legal appeal. In most cases, individuals who have pursued compensation through CICP cannot go on to pursue lawsuits in civil court against manufacturers or providers for covered countermeasures.
- The HHS Secretary has broad authority to make changes to countermeasures and injuries covered under CICP. The PREP Act provides the HHS Secretary more discretion and imposes fewer regulatory requirements on the process to make changes to injuries covered by CICP, compared to VICP. The Secretary can determine which countermeasures are covered and which injuries are presumed to be compensable under the CICP, and there is no statutory requirements for advisory committees or public comment periods for changes to these policies.
Historical Data on Petitions and Compensation Decisions
The number of petitions submitted to VICP and CICP has varied over time, and both programs have seen large increases in petitions in certain years driven by different factors, such as a surge in CICP claims related to COVID-9 vaccines starting in 2021 (COVID-19 claims comprise most CICP petitions at this point). Overall, VICP provides compensation for a much greater share of its petitions compared to CICP (48% compared to less than 1% for COVID-19 vaccine petitions), largely reflecting the differences between the programs. Still, given the large number of vaccines administered in the U.S., very few petitions or claims in either program are found to be compensable relative to vaccines received (1.89 VICP compensable petitions per million vaccine doses and 0.14 compensable CICP claims per million COVID-19 vaccine doses).
VICP
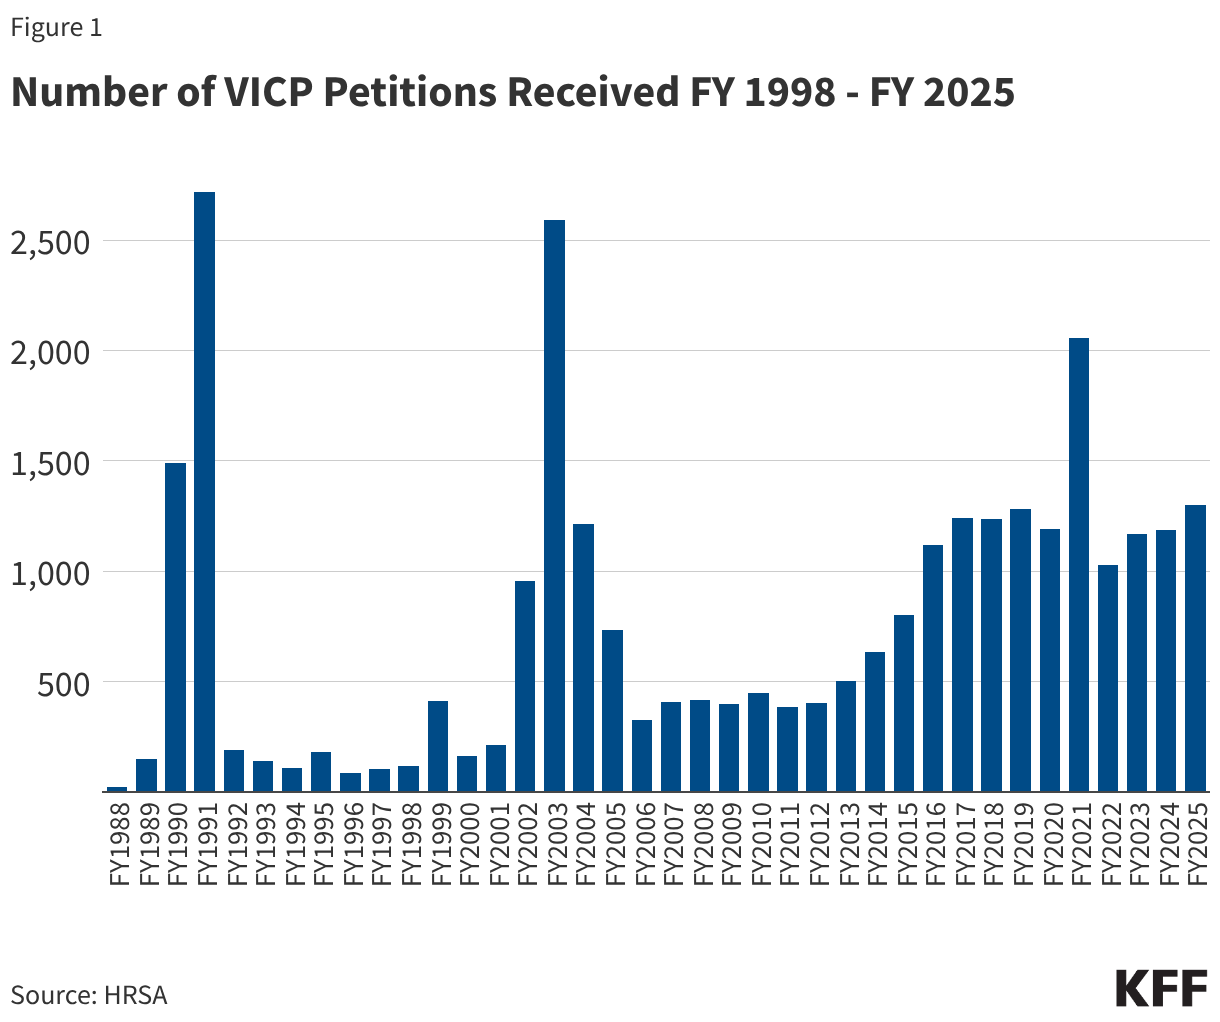
- From FY 1988 through FY 2025, VICP received a total of 28,673 petitions. The annual number of petitions has varied over time, including notable surges in some years (see Figure 1). Surges occurred in FY 1990 and FY 1991 (1,492 and 2,718 VICP petitions were filed, respectively) due to a large increase in claims stemming from parental concerns about injuries caused by DPT vaccines. There was also a surge a decade later, primarily reflecting a wave of public concern about MMR vaccine after reports (later found to be false) that the vaccine could be linked to autism.1 Since FY 2014, there has been a general increase in the number of petitions filed, with the average number growing from 466/year during the FY 2005-FY 2014 period to 1,238/year during FY 2015-FY 2025. This increase may be linked to policy changes that expanded the scope of the vaccine injury table, such as the inclusion of “Shoulder Injury Related to Vaccine Injury (SIRVA),” which was formally added in 2017.
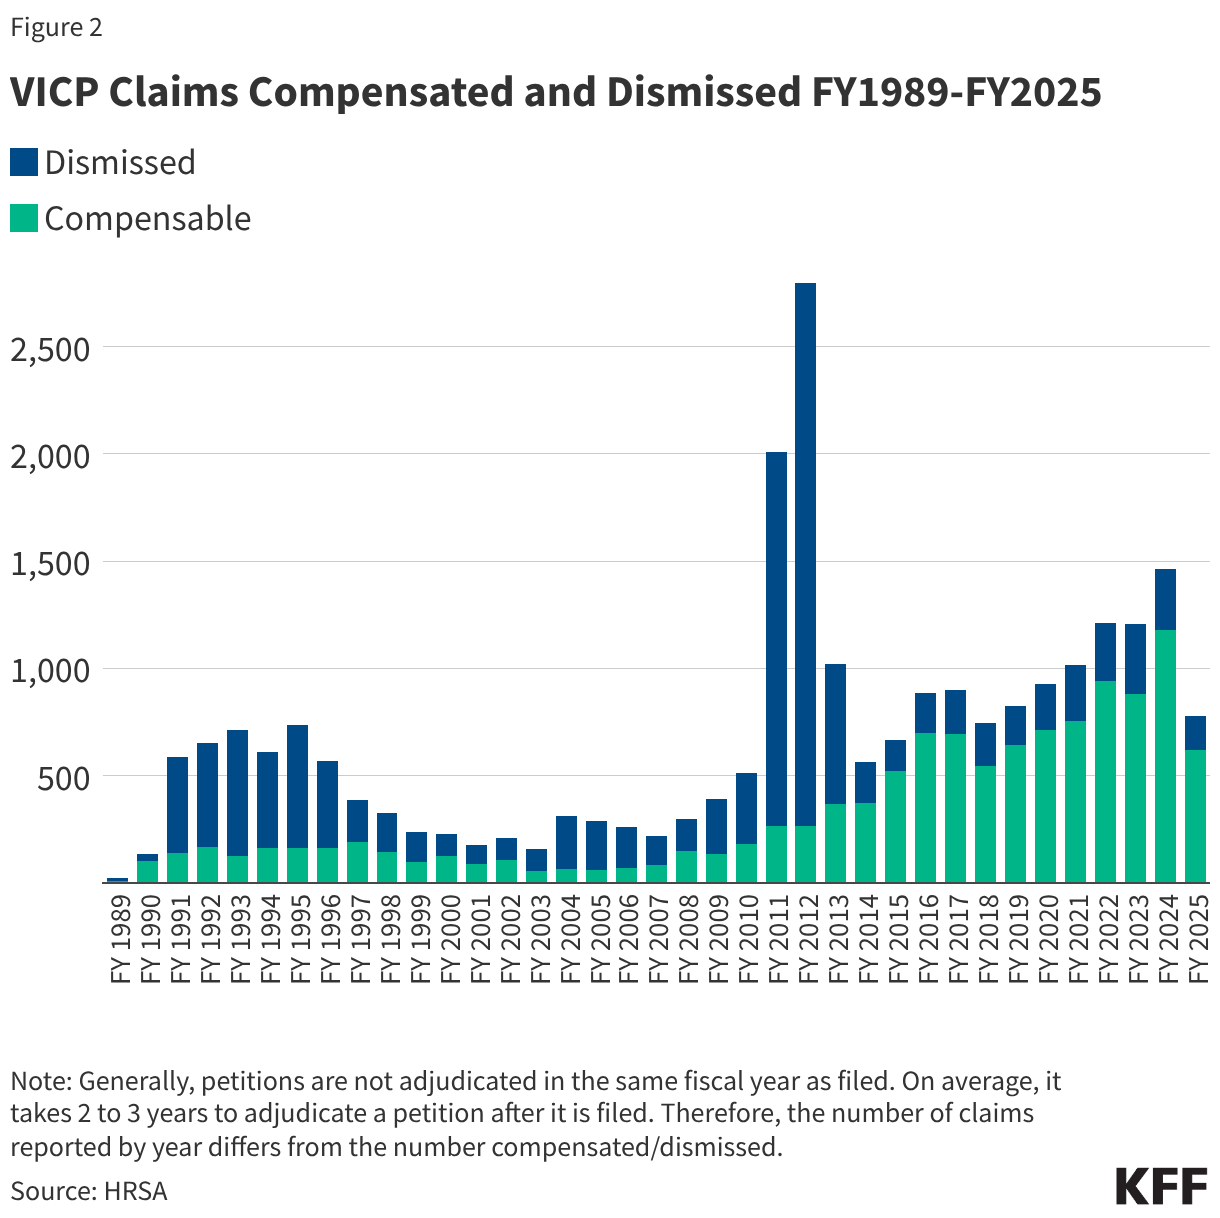
- 25,026 VICP petitions (87% of all 28,673 petitions received) have been adjudicated through FY2025, with 12,019 (48%) found to be compensable and 13,007 (52%) dismissed. As shown in Figure 2, the share of compensable injuries has generally increased in recent years compared to earlier periods of the program, with 77% of petitions found compensable between FY 2016-FY 2025 compared to 28% of petitions in the prior 10-year period (FY2006-FY2015). This again may be partially attributed to increasing scope of the vaccine injury table. The notable spike in claims dismissed in FY 2011-FY 2012 was a result of the resolution of the Omnibus Autism Proceedings allowing a backlog of claims related to autism as a vaccine injury to be processed and dismissed when the program found no credible evidence that vaccines were the cause of autism.2
- The number of VICP claims and compensation adjudications represents a tiny fraction of the number of vaccines distributed in the U.S. According to HRSA and CDC data, from January 1, 2006 to December 31, 2024 there were 5.65 billion doses of VICP-covered vaccines distributed in the U.S.. During this same period, there were 14,409 VICP petitions filed, or 2.6 VICP petitions per million doses distributed. Of these, 10,633, or 1.89 petitions per million doses, were found to be compensable.
CICP
- Between FY 2010 and FY 2026 (through March 1, 2026) CICP received a total of 14,733 claims for covered countermeasures. CICP reports it has reached a decision on 7,423 (50%) of those claims, finding 135 (1.8%) were eligible for compensation. The remainder are still being processed.
- The majority of CICP petitions received were related to COVID-19 vaccines (10,981 or 75% of all petitions filed). CICP has reached a decision on 6,827 (62%) of these. Overall, 95 (0.9%) of COVID-19 vaccine claims been found eligible for compensation through CICP. With over 670 million doses COVID-19 vaccines administered in the U.S. between December 2020 and May 2023, that translates into approximately 16 petitions filed per million doses administered, and 0.14 compensation-eligible claims per million doses.
- Relatively few non-COVID-19 vaccine countermeasure claims have been filed through CICP. For example, CICP reports 29 compensation payments were made related to the 2009 H1N1 vaccine (after approximately 90 million doses were administered in the U.S., translating to about 0.3 compensation payments per million doses administered). One CICP compensation payment was reported related to the smallpox vaccine, though CICP reports that 8 petitions related to the mpox vaccine and 2 additional claims related to the smallpox vaccine have been filed and are still being processed.
- Publicly available information about CICP claims and compensation is limited compared to VICP. In contrast to VICP, CICP does not report petitions received or claims processed by year and does not publicly release details on the rationale for compensation decisions.
Funding and Expenditures
These two programs have different funding sources, with VICP funded through a trust fund holding revenues collected from the excise taxes and CICP funded through the annually-appropriated funds provided to HHS/HRSA. Compensation award amounts through VICP, while variable, have averaged between $500,000 and $1 million for most of the program with some recent declines.. In contrast, most awards (75%) through CICP are for amounts under $10,000, though there have been a few very large individual payments exceeding $1 million.
VICP
- VICP is funded through revenues collected from an excise tax placed by Congress on every dose of each vaccine covered under VICP produced in the U.S.. The excise tax is paid into a Vaccine Injury Compensation Trust Fund overseen by the U.S. Treasury. The Trust Fund also generates revenue from investing its assets. Treasury uses Trust Fund resources to make payments and transfers to government agencies responsible for administering VICP including the Department of Justice, the U.S. Court of Appeals, and HHS/HRSA.
- Over time, the VICP trust fund has grown as its annual revenues typically exceed expenses. The U.S. Treasury reports that as of September 30, 2025 the VICP trust fund held $4.66 billion. In FY 2025, $363 million was added to the trust fund (including $131 million from excise taxes, $169 million from interest on investments, and $63 million in refunds from current and prior year authority). VICP expenses totaled $314 million in FY 2025, which were primarily for compensation payments but also administrative and other costs.
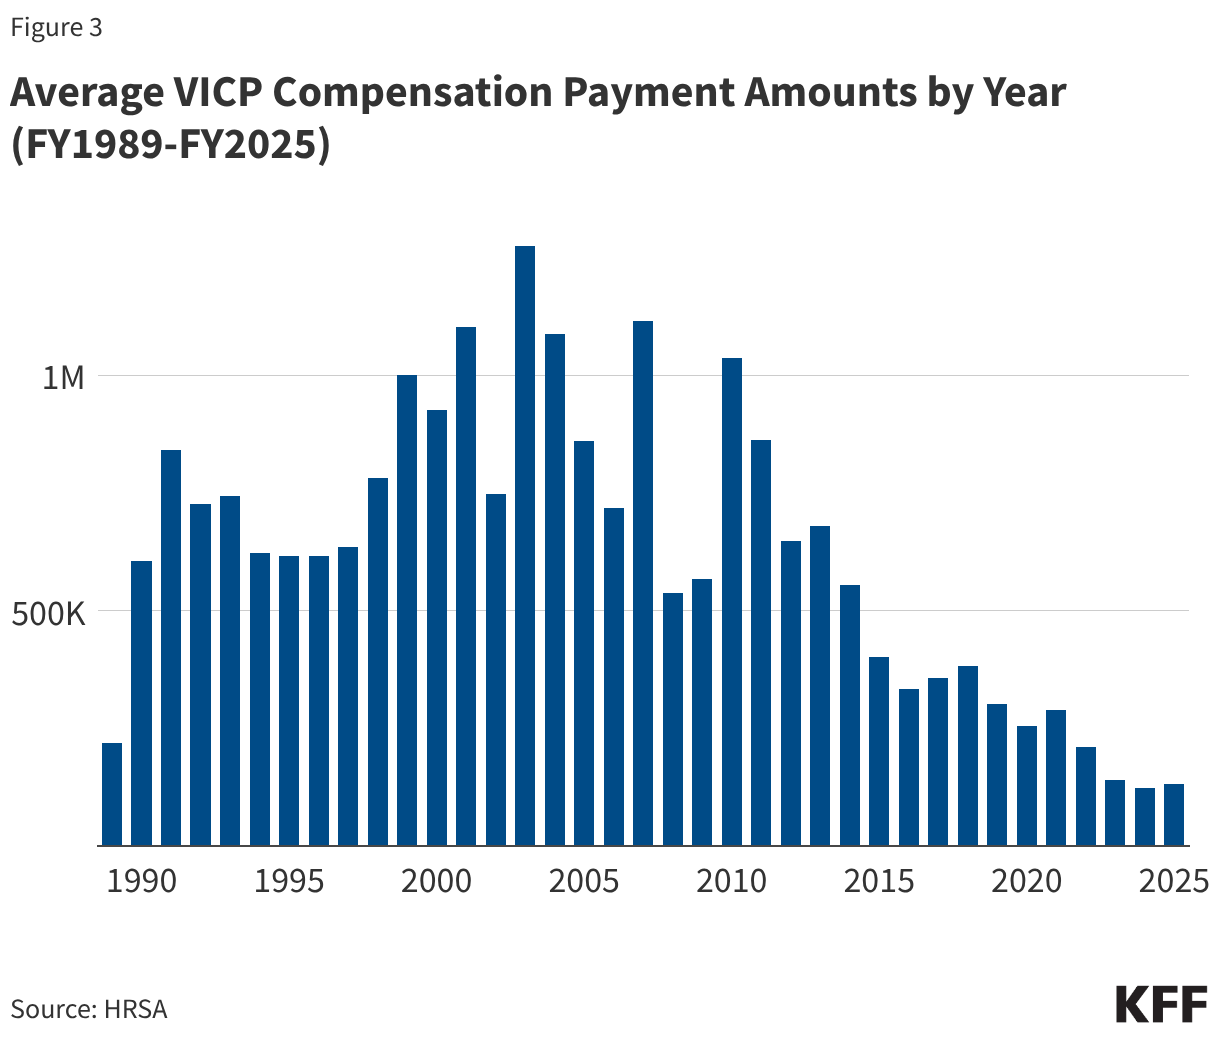
- 12,409 VICP compensation payments have been awarded between FY1989 and FY2025 totaling $4.89 billion (see Figure 3). Since the early 2010s, the average amount of compensation has generally declined, and has remained below $500,000 since FY 2015, likely a reflection of the expansion of the vaccine injury table to include milder injuries such as SIRVA (which entail comparatively lower payments relaive to other injuries).
CICP
- There is no specific tax or dedicated funding source for CICP compensation payments, as there is for VICP. CICP funding comes from annual Congressional appropriations to HRSA rather than an excise tax. Through the PREP Act Congress created a “Covered Countermeasures Process Fund (CCPF)” to be administered by HRSA for CICP purposes, though little information is available on how much funding – if any – is currently held in the CCPF. At times Congress has provided emergency appropriations (such as the CARES Act during the COVID-19 response) that allowed, but did not require, HHS to direct funds to the CCPF.
- Several large single payments comprise the majority of all compensation provided by CICP since 2010. There is only limited information about CICP expenditures, which includes the number and amounts of CICP compensation payments that have been made since FY2010. According to this data, CICP has paid compensation for 81 claims totaling more than $13 million. Most of the this total comes from a few very large single compensation payment amounts – for example there are reported payments of $5.9 million (related to thrombotic thrombocytopenia syndrome injury linked to COVID-19 vaccination), $2.3 million, and $1.8 million (the latter two related to Guillain-Barre Syndrome injury linked to 2009 H1N1 pandemic influenza vaccines). Of the 81 claims that received compensation, 11 (14%) were for amounts over $100,000, 10 (12%) were for amounts between $10,000 and $100,000, and 60 (74%) were for amounts under $10,000.
- There are significant caseload, backlog, and capacity constraints in both programs. As noted above, there has been a growing number of petitions filed for each these programs over the last few years. However, the staffing and resources allocated to the programs have not matched this growth. For example, the VICP is limited by statute to eight special masters, with each now facing a larger caseload. The CICP has faced a surge of claims related to COVID-19 vaccines since 2021. The growing burden of claims and limited set of resources has contributed to long case review times and delays in issuing decisions and settlements.
- The question of how best to address COVID-19 vaccine injuries has been an ongoing issue, particularly now that the COVID-19 public health emergency has ended. Under current law, COVID-19 vaccines are still covered under the CICP through the end of 2029. However, because CICP was created to address smaller scale deployments of medical countermeasures during a health emergency, rather than national-level responses to pandemics that extend over years, it has faced limitations in taking on COVID-19 vaccine injuries. Available compensation is generally lower compared to VICP, and the standard of proof for non-table injuries is higher. Even though the deployment of COVID-19 vaccines began as an emergency countermeasure during a national health emergency, these vaccines have become integrated into routine vaccinations and are recommended by CDC for broad segments of the U.S. population. For that reason, some health policy experts, lawyers, and politicians have advocated for including COVID-19 vaccines under VICP rather than CICP.
- Politicization of vaccines and strains on scientific credibility threaten confidence in and stability of these programs. As views about vaccines have become more politicized, vaccine injury compensation programs have become a frequent target of partisan criticism. There is a striking partisan divide on the benefits and risks of COVID-19 vaccines, for example, with Republicans seeing those vaccines as causing more harm and arguing for more injury compensation as a result, compared to Democrats. This has also played out in actions taken by the Trump administration, such as seeking to narrow recommendations for several childhood vaccines and calling into question vaccine safety. On VICP, the Secretary of HHS Kennedy has argued that the program is too restrictive and the number and scope of vaccine injuries covered should be expanded to include conditions such as autism, though there is no credible evidence that vaccination causes autism, and the VICP itself reviewed available evidence on autism and vaccines during the Omnibus Autism Proceedings in the early 2000s and found no scientific evidence to support the link. Secretary Kennedy has also said that VICP has become a “morass of inefficiency, favoritism, and outright corruption.” Advocates linked to Secretary Kennedy have argued for expanding the VICP injury table to cover as many as 300 additional conditions they claim are injuries linked to vaccines. Others have raised concerns that adding injuries without sufficient scientific evidence to do so threatens the credibility of these programs and could even lead to insolvency if the scope of covered “injuries” expands to highly prevalent conditions like autism.
- Updating legislation and regulations on compensation payment rules and related policies is politically challenging. A frequent criticism of these programs is that compensation payments were set when the programs were first created and have not been updated over time to reflect new developments and are not indexed to inflation. VICP, for example, has the same $250,000 cap on compensation for injuries or death that was in place when the program was established in 1988. However, making changes to these rules would require that Congress amend the underlying legislation, and doing so has proven politically challenging (changes were last made in 2016 through the “21st Century Cures Act”). There have been multiple legislative proposals introduced to update and modernize the vaccine injury compensation systems legislation but none has advanced. For example, the Vaccine Injury Compensation Modernization Act (H.R. 5142), which was last introduced in 2022-2023, proposed changes such as: increasing the number and tenure of special masters, requiring a formal plan to eliminate backlog, moving COVID-19 vaccines from CICP to VICP, increasing compensation caps and indexing payments to inflation, and increasing transparency and reporting requirements. Another proposal, recognizing that CICP has been inundated with claims for COVID-19 vaccines even though the program was designed with a smaller scale in mind, would replace that program with a “pandemic injury compensation system” that would be pre-funded, scalable, and automatically activated during a public health emergency. However, these bills have not advanced.
Endnotes
- Due to the increased public concern about a potential vaccination-autism link and the large number of related claims filed, VICP established a special program in 2002 called the Omnibus Autism Proceeding, which evaluated several hypotheses for vaccine-autism links, ultimately finding that there was no causal relationship. No scientific evidence has shown autism to be linked to childhood vaccines, therefore autism is not included as an injury in the VICP vaccine injury table. ↩︎
- Due to the increased public concern about a potential vaccination-autism link and the large number of related claims filed, VICP established a special program in 2002 called the Omnibus Autism Proceeding, which evaluated several hypotheses for vaccine-autism links, ultimately finding that there was no causal relationship. No scientific evidence has shown autism to be linked to childhood vaccines, therefore autism is not included as an injury in the VICP vaccine injury table. ↩︎