News Release

Poll: Trust and Confidence in the CDC Remain at Low Point After Changes to Recommended Childhood Vaccines; More Say the Changes Will Hurt than Help Children’s Health

New KFF Data Interactive Tracks Polling on Health Information and Trust

Published: Feb 6, 2026

In the weeks after the Trump administration reduced the number of recommended childhood vaccines for routine use, the public’s trust in the Centers for Disease Control and Prevention (CDC) remains at its lowest point, a new KFF Poll on Health Information and Trust finds.

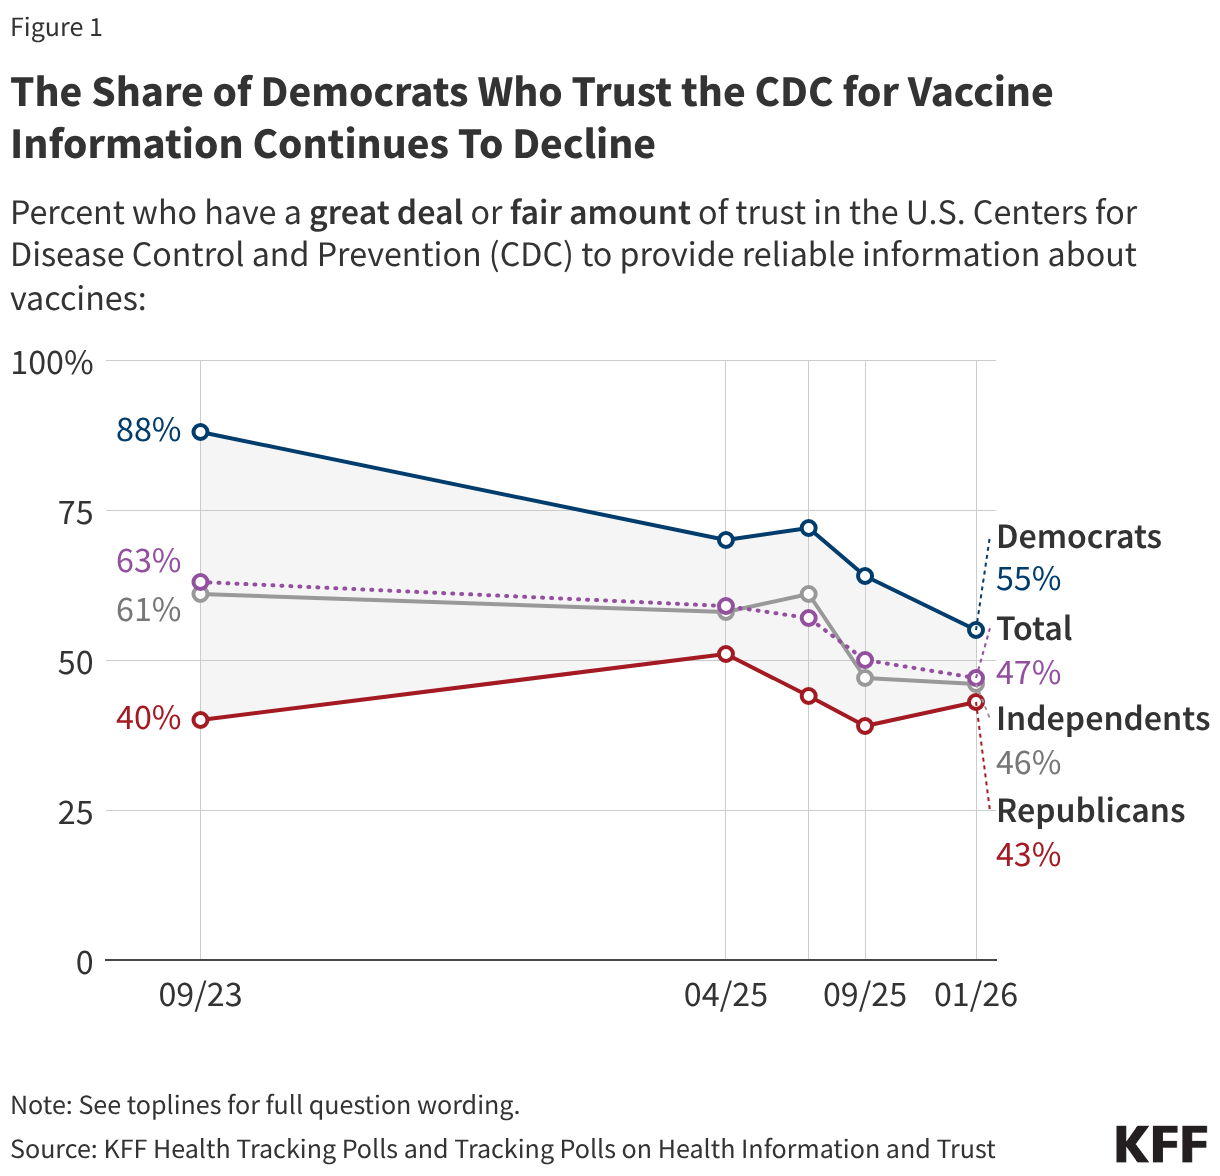
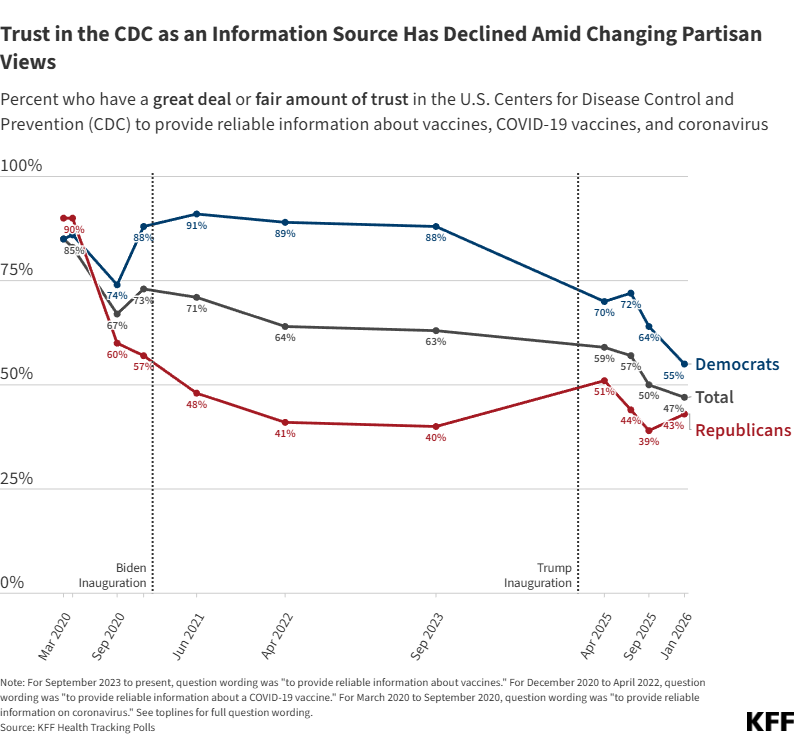
Fewer than half (47%) now say that they trust the agency at least “a fair amount” to provide reliable vaccine information, similar to the share who said the same in September, but down more than 10 percentage points since the beginning of the second Trump administration, and continuing a downward trend first measured during the COVID-19 pandemic.

The recent decline reflects falling confidence among Democrats. Slightly more than half (55%) of Democrats now say they trust the CDC on vaccines, down from 64% September. About 4 in 10 Republicans say they trust the CDC for vaccine information, similar to the share who said the same a few months ago and in 2023, but fewer than half as many as said they trusted the CDC on the coronavirus back in 2020.

“Six years ago, 85% of Americans, and 90% of Republicans, trusted the CDC. Now less than half trust the CDC on vaccines,” KFF President and CEO Drew Altman said. “The wars over COVID, science, and vaccines have left the country without a trusted national voice on vaccines, and that trust will take time to restore.”

Line chart showing that trust in the CDC as an information source has declined from 2000 to 2026 amid changing partisan views.

Findings from the latest KFF Tracking Poll on Health Information and Trust, and more than a dozen previous polls, are now available on a new interactive dashboard tracking the public’s trusted sources for health information, attitudes toward vaccines, and use of news, social media, and AI for health-related information.

The dashboard provides visual representations of the key trends in the public’s trust in health information and tracks exposure to and belief in false and unproven health claims. The downloadable data and charts allow researchers, policymakers, journalists, and others to explore partisan and demographic differences on key health information issues. The dashboard will be updated regularly.

Awareness of and Views toward Changes in Recommended Childhood Vaccines

The latest poll finds that among those who have heard about the recent changes to the recommended childhood vaccine schedule, more say they expect the changes to have a negative impact than a positive one on children’s health.

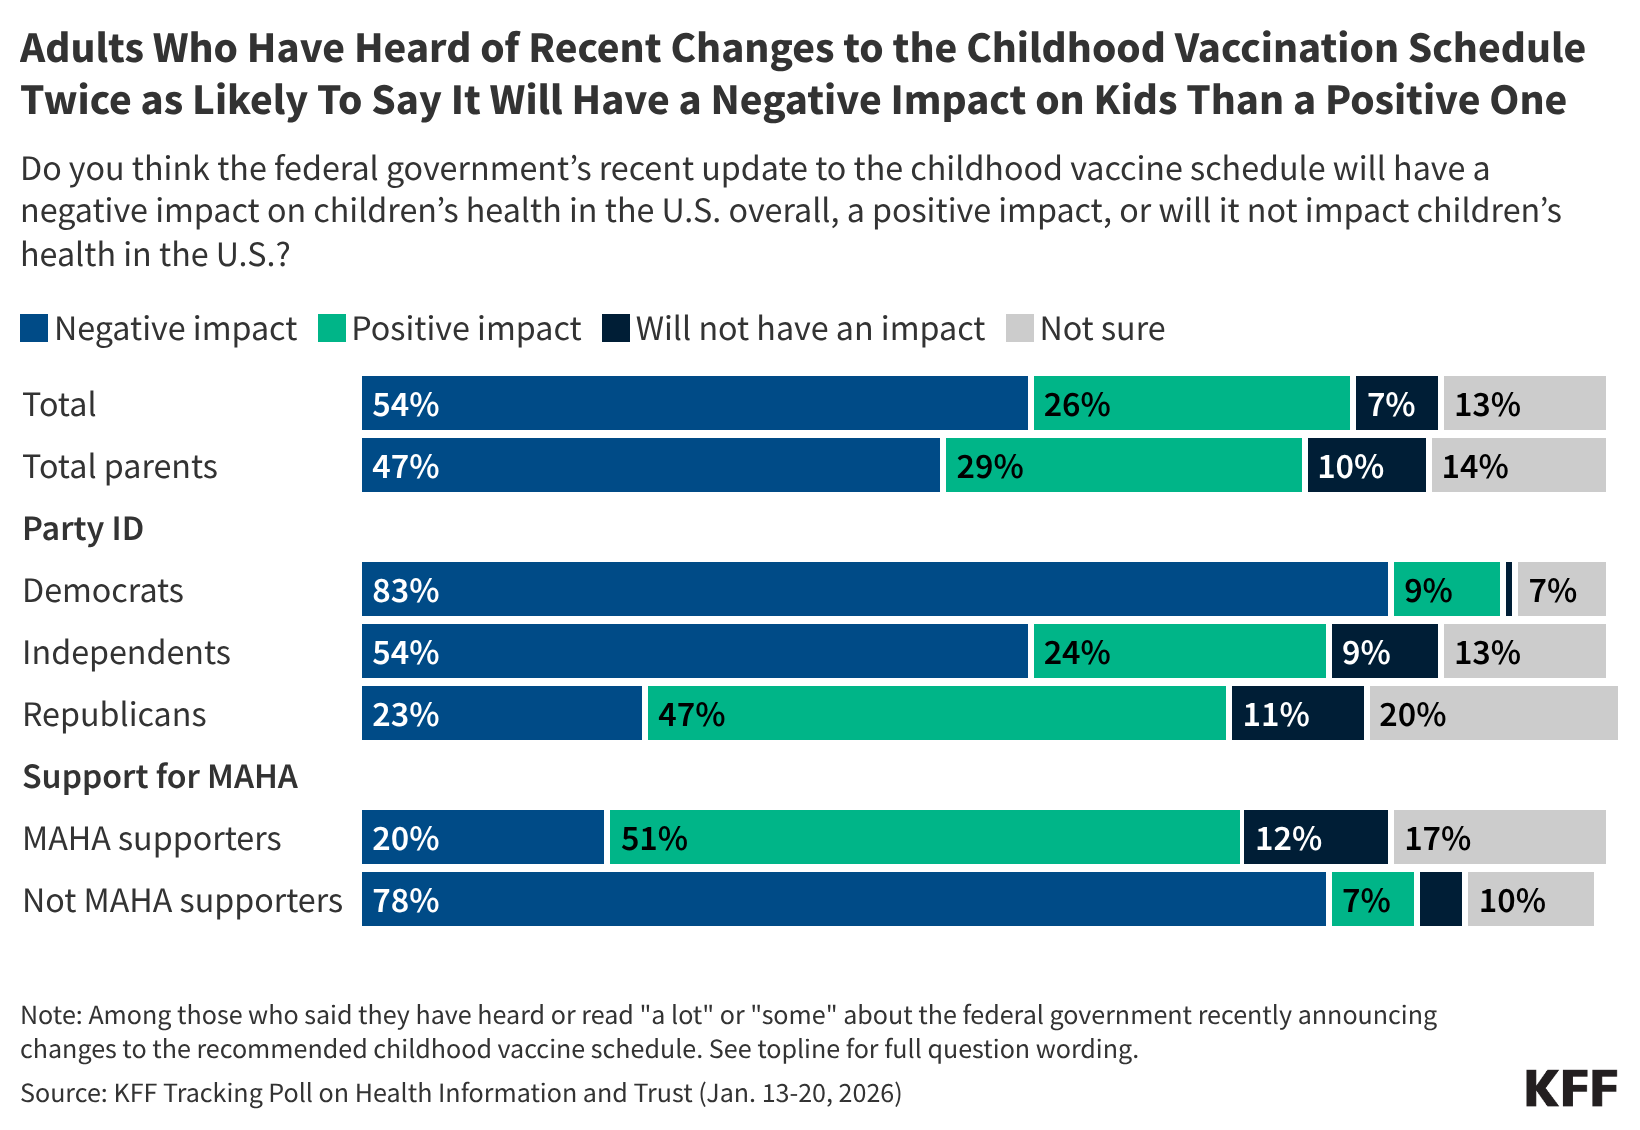
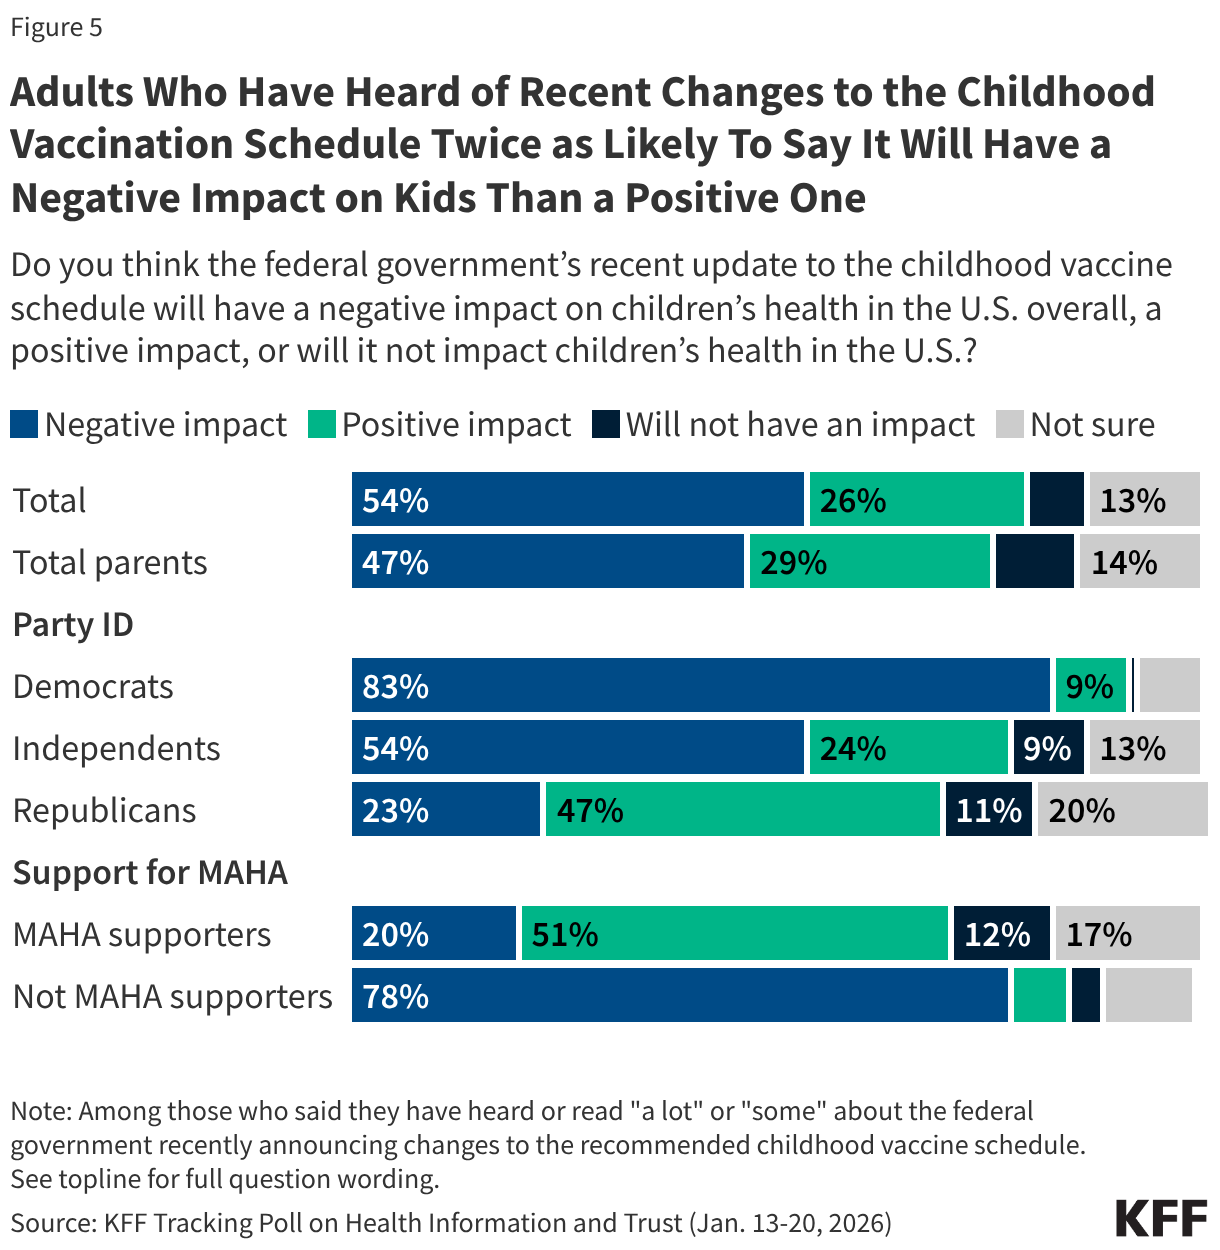
About half of the public (51%), and a similar share of parents (52%), say they’ve heard at least some about the federal government’s recent changes to the recommended childhood vaccine schedule. This group, by a 2-1 margin, say the changes will have a negative impact on children’s health (54%) rather than a positive one (26%). The same is true among parents who heard about the changes, with a larger share saying the changes will negatively impact children’s health (47%) than have a positive impact (29%).

Democrats and independents largely expect the changes to hurt children’s health, while Republicans and supporters of the “Make America Healthy Again” (MAHA) movement largely expect it to improve children’s health.

Amid recent changes, confidence remains high across the public and parents in the safety of the MMR and polio vaccines, two longstanding childhood vaccines that continue to be recommended for routine use. This includes at least 3 in 4 Democrats, independents, Republicans, parents, and MAHA supporters.

But fewer are confident in the safety of the vaccines that are no longer universally recommended, and there are larger partisan differences.

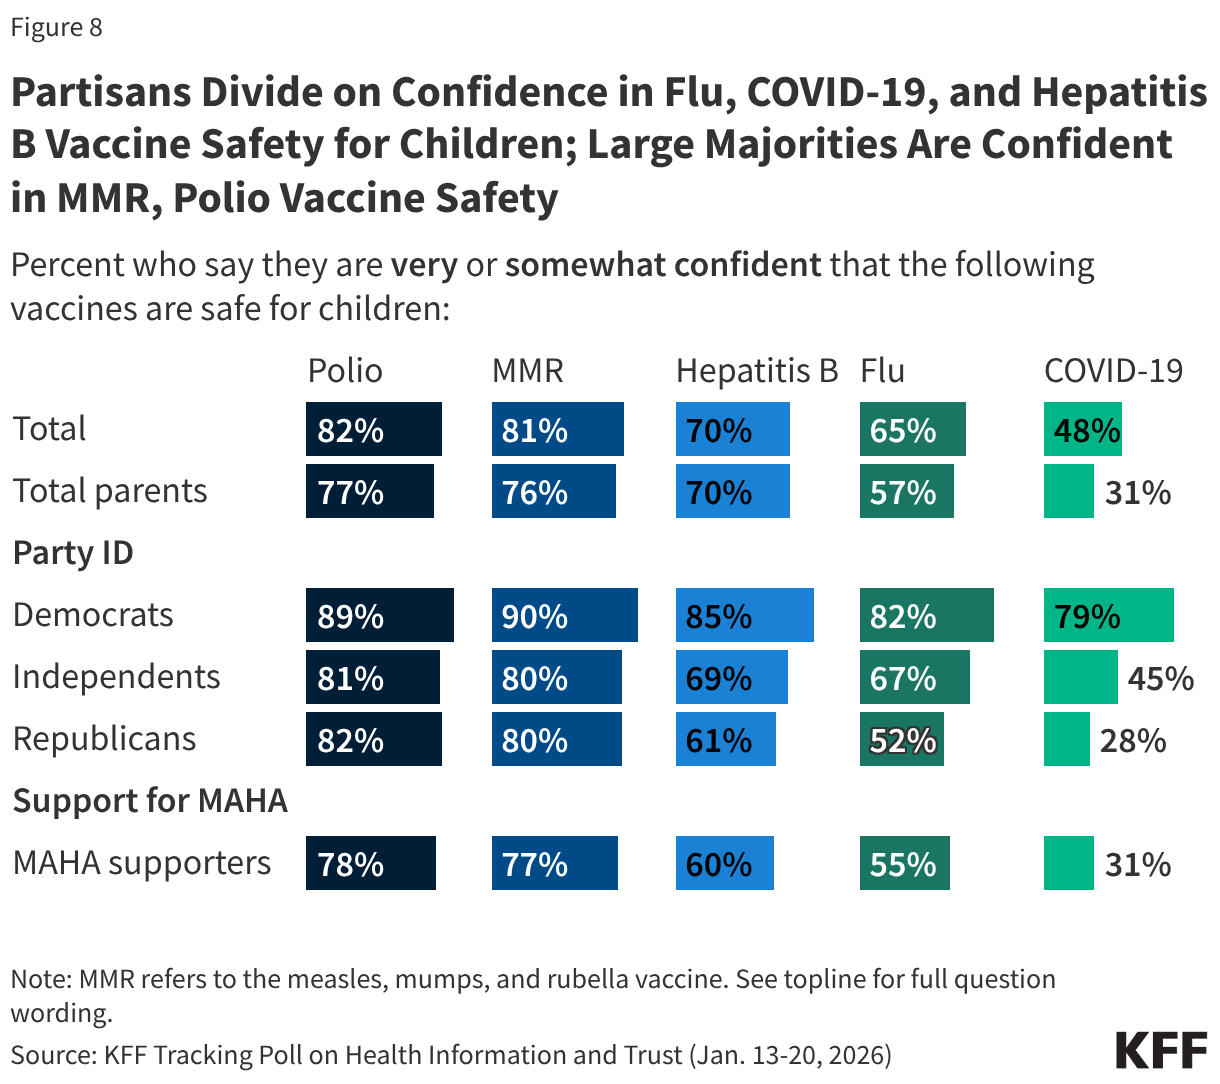
  • Majorities of the public are also confident in the safety of the hepatitis B (70%) and flu (65%) vaccines for children, and just under half (48%) are confident in the safety of the COVID-19 vaccine. The recent changes removed these three vaccines from the routine recommended childhood vaccine schedule.
  • Partisans are divided on their views of the three vaccines removed from the federal recommended vaccine schedule, with Democrats being more likely than Republicans to express confidence in their safety. The partisan gap is widest for the COVID-19 vaccine, with about eight in ten Democrats confident in their safety, nearly three times the share of Republicans who say the same (79% vs. 28%). Democrats are also more likely than Republicans to be confident in the safety of flu (82% vs. 52%) and hepatitis B vaccines (85% vs. 61%).

Designed and analyzed by public opinion researchers at KFF, this survey was conducted January 13-20, 2026, online and by telephone among a nationally representative sample of 1,426 U.S. adults in English and in Spanish. The margin of sampling error is plus or minus 3 percentage points for the full sample. For results based on other subgroups, the margin of sampling error may be higher.

Poll Finding

KFF Tracking Poll on Health Information and Trust: Trust in the CDC and Views of Federal Childhood Vaccine Schedule Changes

Published: Feb 6, 2026

Key Takeaways

  • In the weeks following the Trump administration’s announcement of changes to the recommended childhood vaccine schedule, the public’s trust in the CDC remains at its lowest point since the COVID-19 pandemic, including a 9-percentage point drop among Democrats in recent months saying they trust the CDC for reliable vaccine information. Just over half (55%) of Democrats and fewer Republicans (43%) and independents (46%) now say they trust the agency for vaccine information. In addition, fewer than half of adults (44%) express confidence in U.S. federal health agencies to make recommendations about the childhood vaccine schedule.
  • Among the half of U.S. adults who report hearing about the recent changes to the childhood vaccine schedule, more say the changes will have a negative impact (54%) on children’s health than a positive one (26%). Partisans are split, with most Democrats who are aware of the change saying it will have a negative impact on children (83%, or 63% of all Democrats), while Republicans are more likely to say it will have a positive impact (47% of Republicans who are aware of the change, or 34% of all Republicans). About one in five Republicans who are aware of the changes say they will negatively impact children’s health and an additional one in five say they are not sure.
  • At least eight in ten U.S. adults across partisans and parents are confident – including about half who of adults who are “very confident” – in the safety of measles, mumps, and rubella (MMR) and polio vaccines, two longstanding childhood vaccines that continue to be recommended as routine. Majorities of adults are also confident in the safety of two of the vaccines that are no longer universally recommended for children following recent changes, hepatitis B (70%) and flu (65%), though fewer are “very confident,” and views are somewhat divided along partisan lines. Fewer (48%) adults are confident in the safety of COVID-19 vaccines for children, including just one in four who are “very confident.” Partisan divisions are sharpest when it comes COVID-19 vaccines, with just three in ten Republicans compared to eight in ten Democrats expressing confidence that they are safe for children.

Confidence and Trust in Federal Health Agencies

In January, the U.S. Centers for Disease Control and Prevention (CDC) announced the Trump administration’s major changes to the federally recommended vaccination schedule for children. This change – along with changes that started in October 2025 – reduces the number of diseases targeted for routine vaccination from 17 to 11, positioning the U.S. as an outlier among peer nations.1 In the weeks following this change, the latest KFF Tracking Poll on Health Information and Trust finds that the public’s trust in the CDC remains at its lowest level since the beginning of the COVID-19 pandemic. Fewer than half (47%) of the public says they have a “great deal” or “fair amount” of trust in the CDC to provide reliable information about vaccines.

Trust among Democrats has declined by nine percentage points since September 2025 (from 64% to 55%) and is down sharply from 88% in September 2023. About four in ten Republicans (43%) and half of independents (46%) say they trust the CDC for reliable information about vaccines, similar to the shares who said the same in September of last year.

Line chart showing rates of U.S. adult trust in the CDC for information on vaccines spanning from September 2023 to January 2026.

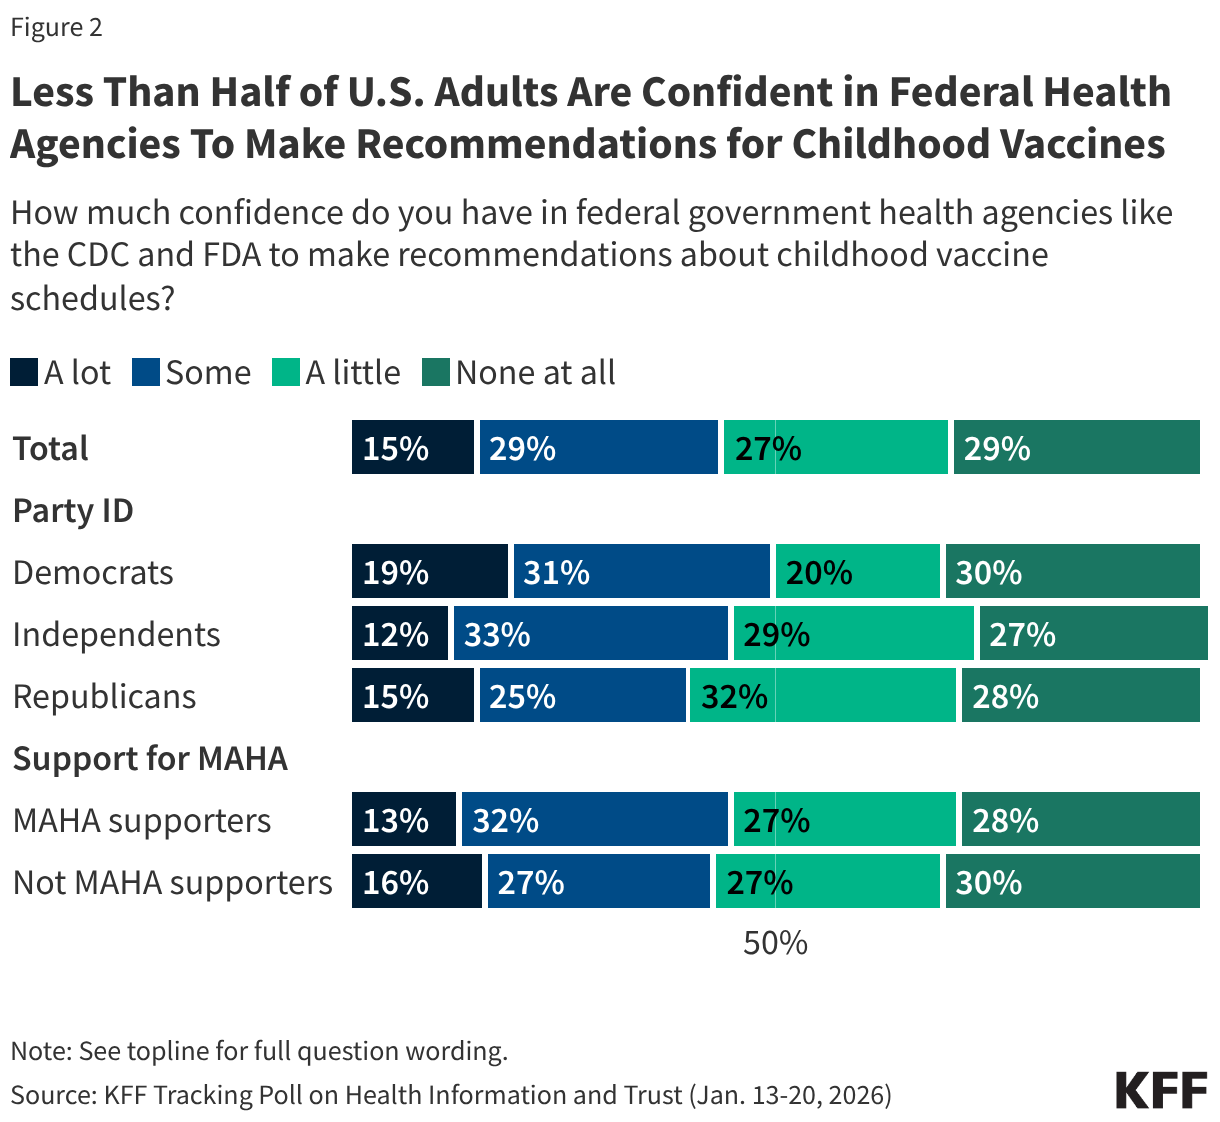
One year into President Trump’s second term, fewer than half of adults are confident in federal health agencies like the CDC and the U.S. Food and Drug Administration (FDA) to carry out some of their responsibilities, including making recommendations for children’s vaccines. Most adults (56%) say they have “little” to “no confidence” in federal health agencies to make recommendations about childhood vaccine schedules, including three in ten (29%) who have no confidence “at all.” Just over four in ten have “a lot” (15%) or “some” (29%) confidence in the agencies’ ability to do this.

About half of Democrats (51%) say they have at least “some” confidence in government health agencies to make recommendations about childhood vaccine schedules, compared to fewer Republicans (40%). Forty-five percent of independents say they are confident in government health agencies to make these recommendations, while 55% say they have “a little” confidence or “none at all.”

Mirroring Republicans, fewer than half of supporters of the Make America Healthy Again (MAHA) movement say they trust U.S. federal health agencies to make recommendations about vaccine schedules (45%). Overall, 45% of U.S adults say they are supporters of the MAHA movement, and this group is largely made up of Republicans and Republican leaners (65%) and Make America Great Again (MAGA) supporters (53%).

Stacked bar chart showing percent who say they have a lot, some, a little, or no confidence at all in the federal government health agencies to make recommendations about childhood vaccine schedules. Results shown by total adults, party ID, and support for the Make America Healthy Again movement.

This limited confidence extends beyond childhood vaccine recommendations to other core responsibilities of federal health agencies. Fewer than half of the public have at least “some” confidence in the agencies to ensure safety and effectiveness of vaccines approved for use in the U.S. (46%), make decisions based on science rather than the personal views of agency officials (38%), or act independently, without interference from outside interests (34%).

Democrats have more confidence than Republicans in these agencies to ensure vaccine safety and effectiveness (55% of Democrats vs. 45% of Republicans) and act independently, without outside interference (41% of Democrats vs. 33% of Republicans). Similar minorities of Democrats (44%) and Republicans (40%) express confidence in federal health agencies to make decisions based on science rather than personal views of agency officials.
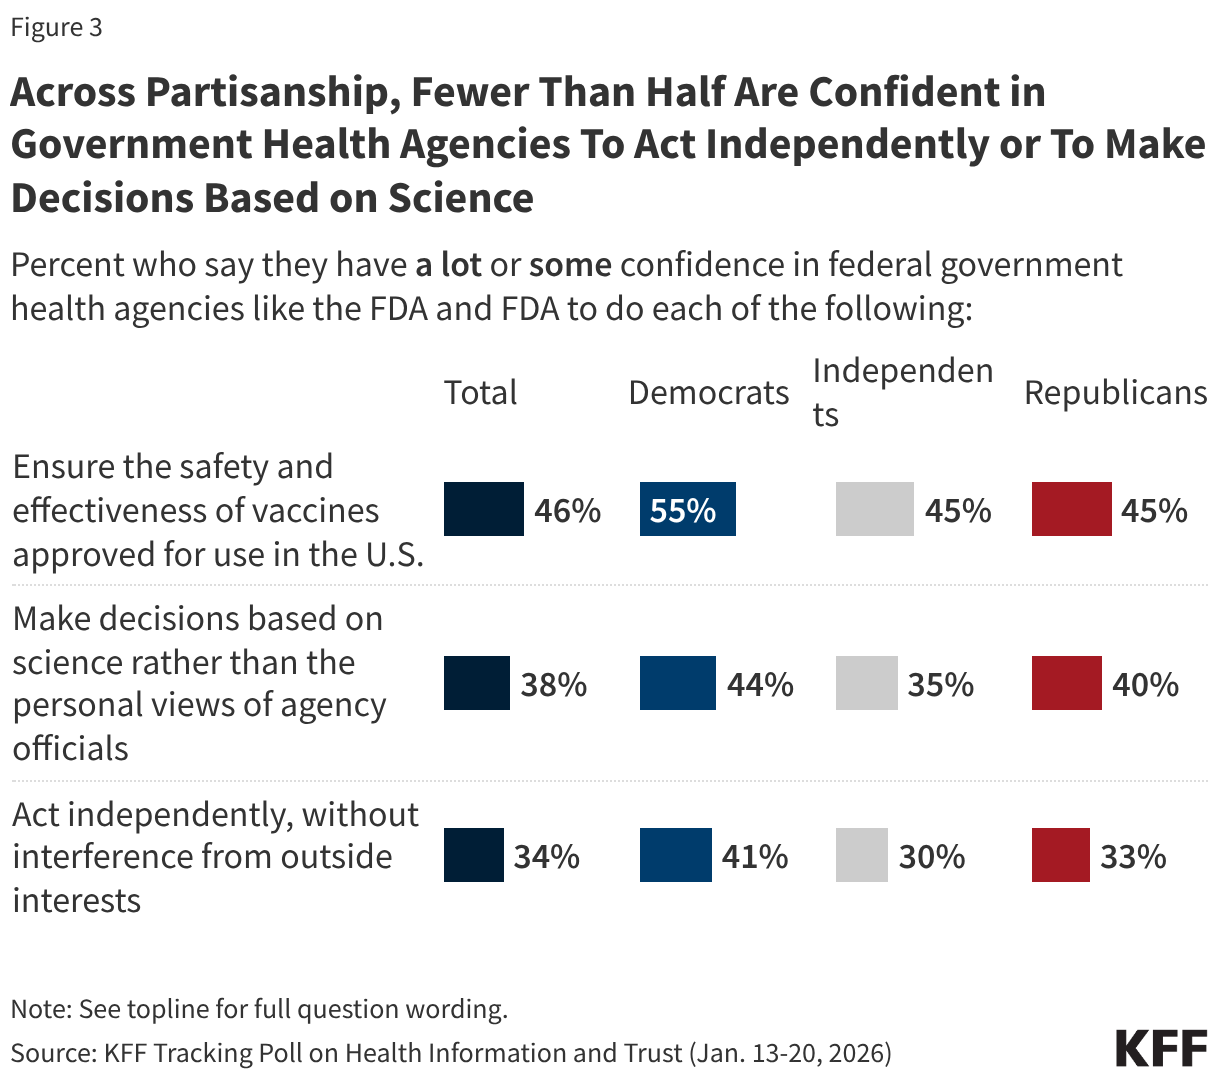
Split bar chart showing percent who say they have a lot or some confidence in federal government health agencies to ensure the safety and effectiveness of vaccines, make decisions based on science, and act independently. Results shown by total adults and party identification.

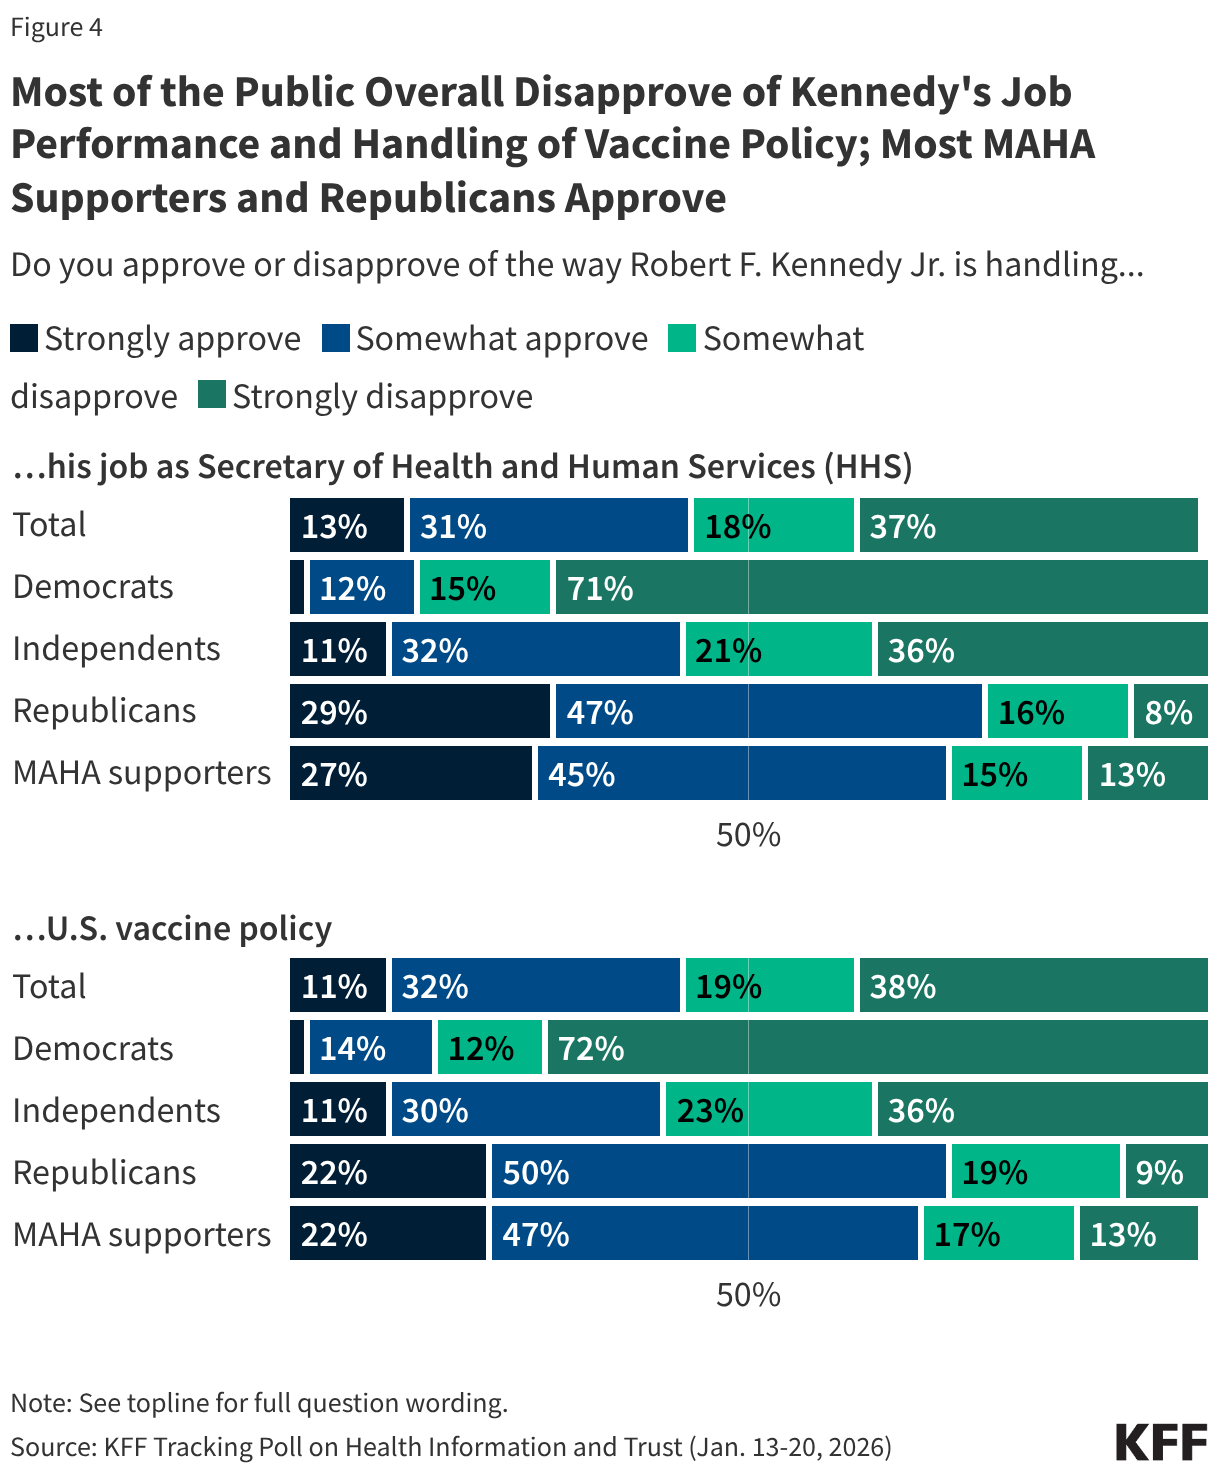
KFF’s latest Tracking Poll on Health Information and Trust finds that a majority of the public continue to disapprove of Robert F. Kennedy Jr.’s job performance as Health and Human Services (HHS) Secretary and his handling of U.S. vaccine policy. About four in ten (44%) say they approve of his handling of his job as HHS Secretary, compared to over half who say they disapprove (55%). Similarly, about four in ten (43%) approve of Kennedy’s handling of U.S. vaccine policy while nearly six in ten (57%) disapprove. This is a slight change from September when 37% approved of his handling of vaccine policy, but views remain sharply divided along partisan lines, with large shares of Democrats disapproving and large shares of Republicans approving. Among supporters of the MAHA movement, about seven in ten approve of Kennedy’s job performance overall (72%) and his handling of vaccine policy (69%).

Stacked bar chart showing percent who say they strongly approve, somewhat approve, somewhat disapprove, or strongly disapprove of the way Robert F Kennedy Jr is handling his job and U.S. vaccine policy. Results shown by tota adults, party identification, and support for the Make America Healthy Again movement.

About half of the public, and a similar share of parents, say they have heard “a lot” (14%) or “some” (38%) about the federal government’s recent changes to the recommended childhood vaccine schedule. The other half report limited awareness, including three in ten who have not heard much (28%) and one in five who have heard “nothing at all” (21%).

Among those who have heard at least “some” about the changes, reactions tilt negative but are more positive among Republicans and MAHA supporters. For example, among the half of the public who have heard about the recent changes to the childhood vaccine recommendations, twice as many say the change will have a negative impact on children’s health (54%) as say it will have a positive impact (26%). Views of how the change will impact children is divided among partisans, with about eight in ten Democrats who are aware of the change saying it will negatively impact children’s health (83%, or 63% of total Democrats). Nearly half of Republicans who are aware of the change say it will have a positive impact (47%, or 34% of total Republicans). About one in five Republicans who have heard about the change say it will either have a negative impact (23%) or aren’t sure of the impact it will have (20%).

Again, mirroring views of Republicans overall, about half of MAHA supporters who are aware of the changes say they will positively impact children’s health (51%, 33% of total MAHA supporters), compared to one in five who say it will have a negative impact on children’s health.

Stacked bar chart showing percent who say the federal government's updates to the childhood vaccine schedule will have a negative impact, a positive impact, or no impact on children's health in the U.S. Results shown by total adults, total parents, party identification, and support for the Make America Healthy Again movement.

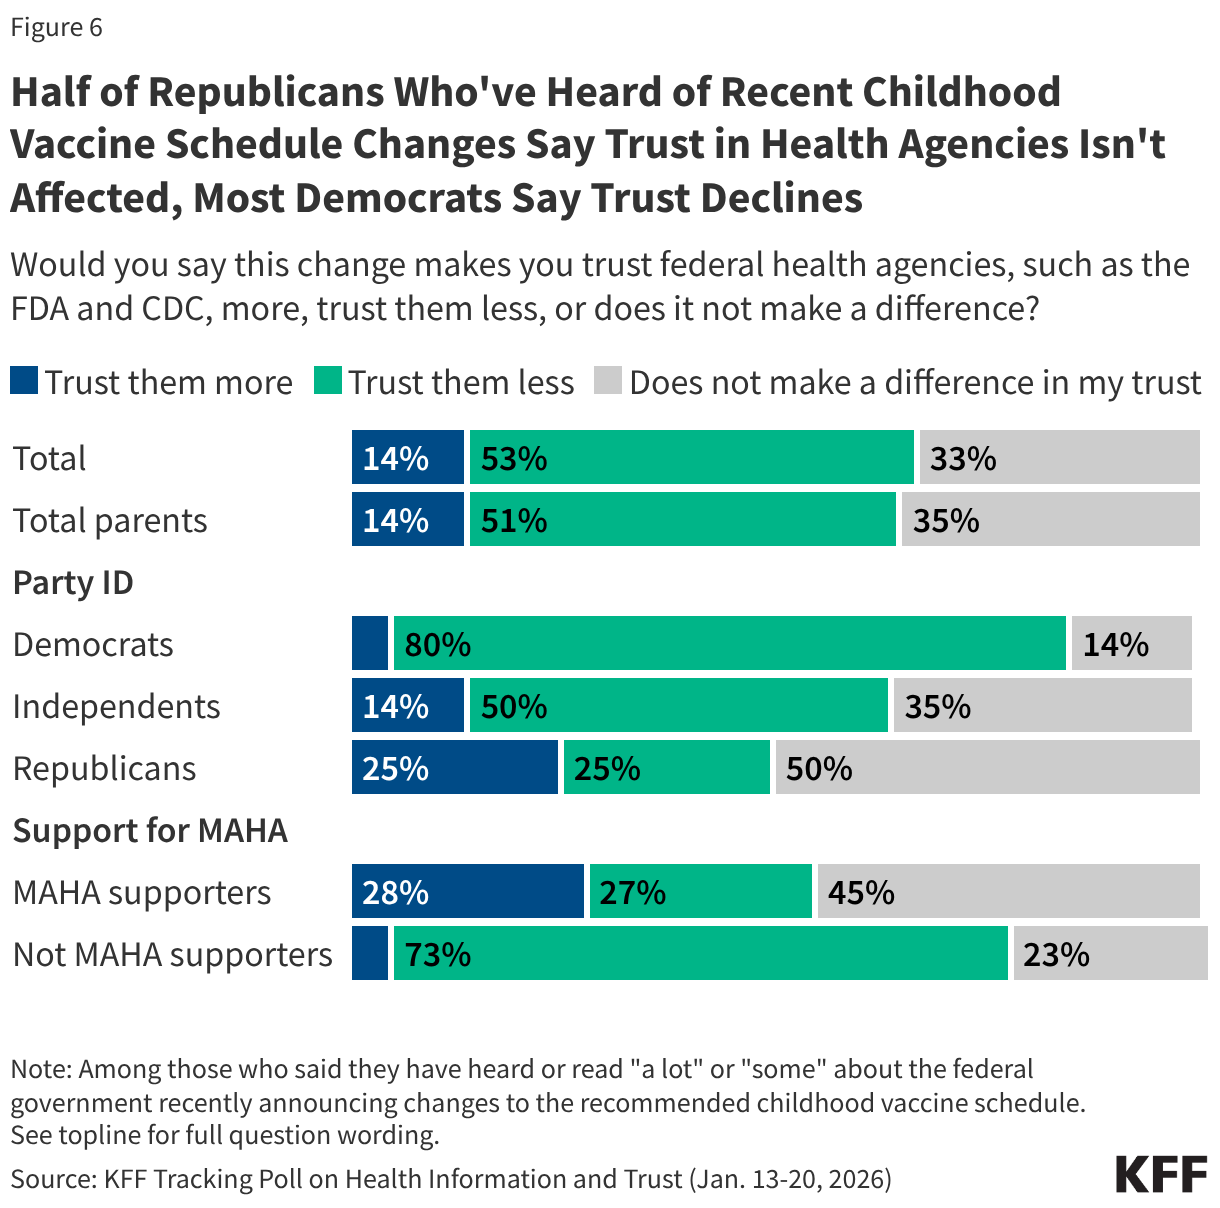
In a statement made about the change, Health Secretary Kennedy predicted it would “rebuild trust in public health.” However, those who are aware of recent changes to the federal vaccine recommendations are also nearly four times as likely to say that the change makes them less trusting of federal health agencies such as the FDA and CDC (53%) rather than more trusting (14%), while one-third of this group (33%) say the change does not make a difference in their trust.

Supporters of the MAHA movement have mixed reactions. Similar shares of MAHA supporters who are aware of the change say it makes them trust federal agencies more (28%) or less (27%), while at least four in ten (45%) say this does not affect their level of trust. Partisans are divided, with most Democrats who are aware of the change saying it makes them less trusting of federal health agencies (80%) while about half of Republicans saying it does not impact their trust.

Stacked bar chart showing percent who say changes to the recent childhood vaccine schedule makes them trust federal health agencies more, less, or it does not make a difference. Results shown by total adults, total parents, party identification, and support for the Make America Healthy Again movement.

Confidence in Safety of Vaccines for Children

While large majorities of adults are confident in the safety of several vaccines for children, including both the polio vaccine and the measles, mumps, and rubella (MMR) vaccine, public confidence in vaccine safety is somewhat lower for vaccines the federal government has recently shifted from routine recommendations to shared clinical decision-making for children.

Large majorities of adults say they are confident that polio vaccines (82%) and MMR vaccines (81%) are safe for children, including about half who say they are “very confident” (50% and 48% respectively). Both the MMR and polio vaccines continue to be recommended for routine immunization for all children.

While most adults are at least “somewhat confident” in the safety of hepatitis B (70%) and flu vaccines (65%) for children, smaller shares report being “very confident” (37% and 33% respectively). Confidence is lowest for the COVID-19 vaccine, with fewer than half of adults (48%) saying they are confident the COVID-19 vaccine is safe for children, including just one in four who are very confident. Three in ten adults say they are “not at all confident” in the safety of the COVID-19 vaccine for children, more than twice the share for any of the other vaccine asked about in this poll. These three vaccines were moved off the routine recommendation list to shared clinical decision-making, meaning vaccination is now determined through provider-patient discussions rather than recommended for all children.
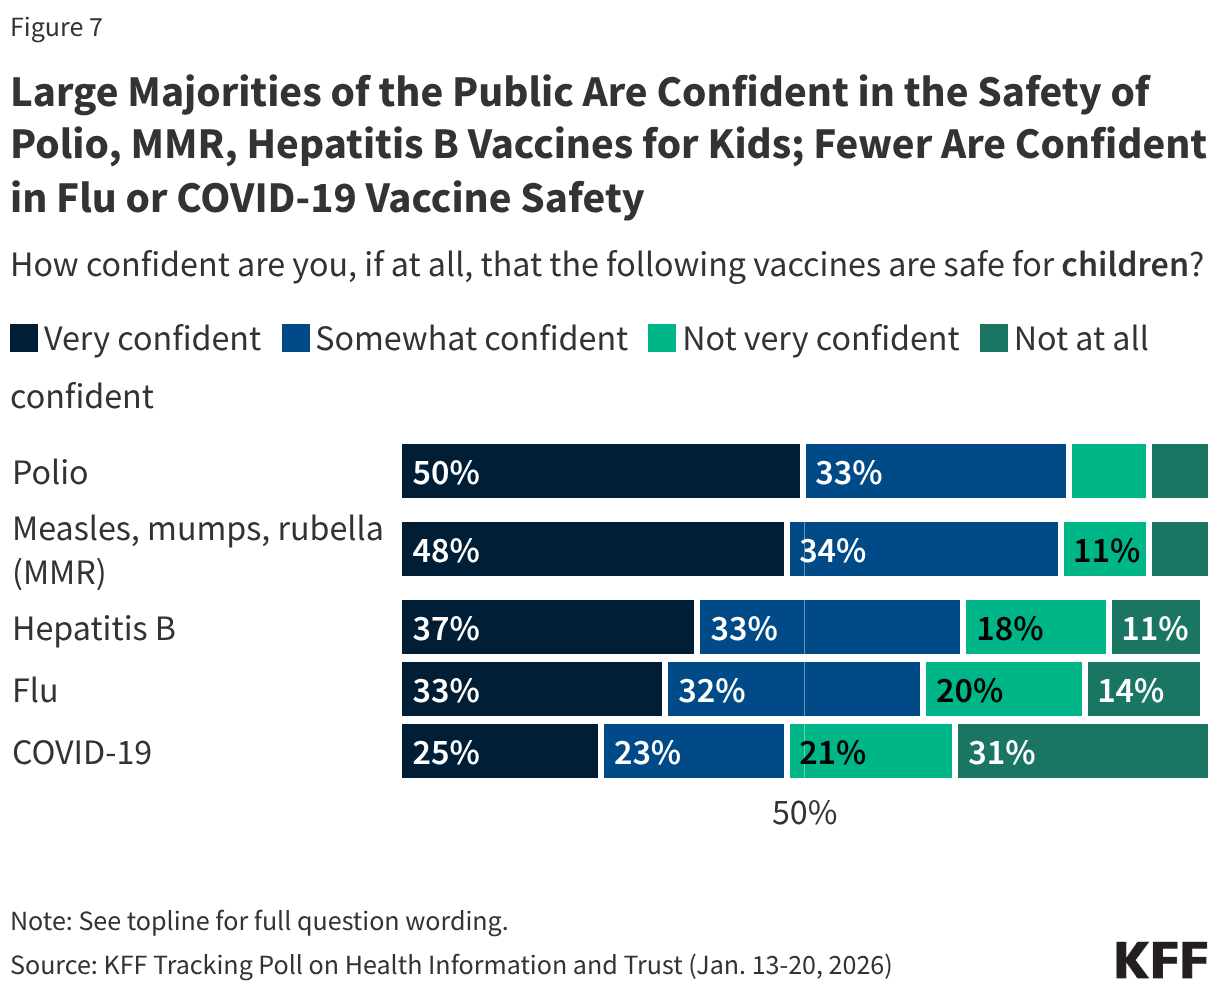
Stacked bar chart showing percent who say they are very confident, somewhat confident, not very confident, or not at all confident that specific vaccines are safe for children.

Confidence in long-standing childhood vaccines like MMR and polio is bipartisan, with at least eight in ten across parties saying they are confident these vaccines are safe for children. While at least half across partisans express confidence in the safety of hepatitis B and flu vaccines for children, views are more partisan for these two vaccines that have recently been the subject of changing recommendations from federal health authorities. More than eight in ten (85%) Democrats say they are confident that the hepatitis B vaccine is safe for children, compared with smaller shares of independents (69%) and Republicans (61%). The poll finds a similar pattern for flu vaccines, with about eight in ten Democrats expressing confidence, larger than the share of independents (67%) or Republicans (52%) who say the same.

The partisan divide is widest for the COVID-19 vaccine. About eight in ten Democrats say they are confident in the safety of COVID-19 vaccines for children, nearly three times the share of Republicans who say the same (79% vs. 28%). About four in ten (45%) independents say they are confident in the safety of this vaccine for children. Partisanship has played a significant role in views of the COVID-19 vaccine since it was first available to the U.S. public in 2021.

MAHA supporters are among the groups least confident in the safety of the COVID-19 vaccine for children (31%). However, a majority of MAHA supporters are confident in the safety of the polio vaccines (78%) and MMR vaccines (77%), and to a lesser extent heptatitis B (60%) and the flu vaccine (55%).

Like the public overall, larger shares of parents express confidence in the safety of polio (77%) vaccines, MMR (76%), and to a lesser extent hepatitis B (70%) vaccines for children, compared to the flu (57%) or COVID-19 (31%) vaccines. This is consistent with poll findings from a KFF/Washington Post Survey of Parents, conducted last summer, which showed that trust in the flu and COVID-19 vaccines’ safety for children was divided along partisan lines, while at least eight in ten parents across partisanship were confident in the safety of polio and MMR vaccines.
Split bar chart showing percent who say they are very or somewhat confident that specific vaccines are safe for children. Results shown by total adults, total parents, party identification, and support for the Make America Healthy Again movement.


  1. With the changes to the vaccine schedule, the measles, mumps, rubella (MMR) vaccine and the polio vaccine remain routinely recommended for all children, while the flu and COVID-19 vaccines have been moved to shared clinical decision-making (SCDM). The hepatitis B vaccine is also no longer being recommended as routine, and instead only for certain high-risk groups and SCDM for others. See the new federally recommended childhood immunization schedule here: https://www.hhs.gov/childhood-immunization-schedule/index.html and KFF analysis of the changes here: https://www.kff.org/other-health/the-new-federal-vaccine-schedule-what-changed/ ↩︎

This KFF Tracking Poll on Health Information and Trust was designed and analyzed by public opinion researchers at KFF. The survey was conducted January 13-20, 2026, online and by telephone among a nationally representative sample of 1,426 U.S. adults in English (n=1,355) and in Spanish (n=71). The sample includes 1,028 adults (n=60 in Spanish) reached through the SSRS Opinion Panel either online (n= 1,003) or over the phone (n=25). The SSRS Opinion Panel is a nationally representative probability-based panel where panel members are recruited randomly in one of two ways: (a) Through invitations mailed to respondents randomly sampled from an Address-Based Sample (ABS) provided by Marketing Systems Groups (MSG) through the U.S. Postal Service’s Computerized Delivery Sequence (CDS); (b) from a dual-frame random digit dial (RDD) sample provided by MSG. For the online panel component, invitations were sent to panel members by email followed by up to three reminder emails. 

Another 398 (n=11 in Spanish) adults were reached through random digit dial telephone sample of prepaid cell phone numbers obtained through MSG. Phone numbers used for the prepaid cell phone component were randomly generated from a cell phone sampling frame with disproportionate stratification aimed at reaching Hispanic and non-Hispanic Black respondents. Stratification was based on incidence of the race/ethnicity groups within each frame. Among this prepaid cell phone component, 149 were interviewed by phone and 249 were invited to the web survey via short message service (SMS). 

Respondents in the prepaid cell phone sample who were interviewed by phone received a $15 incentive via a check received by mail or an electronic gift card incentive. Respondents in the prepaid cell phone sample reached via SMS received a $10 electronic gift card incentive. SSRS Opinion Panel respondents received a $5 electronic gift card incentive (some harder-to-reach groups received a $10 electronic gift card). In order to ensure data quality, cases were removed if they failed two or more quality checks: (1) attention check questions in the online version of the questionnaire, (2) had over 30% item non-response, or (3) had a length less than one quarter of the mean length by mode. Based on this criterion, 2 cases were removed. 

The combined cell phone and panel samples were weighted to match the sample’s demographics to the national U.S. adult population using data from the Census Bureau’s 2025 Current Population Survey (CPS), September 2023 Volunteering and Civic Life Supplement data from the CPS, and the 2025 KFF Benchmarking Survey with ABS and prepaid cell phone samples. The demographic variables included in weighting for the general population sample are gender, age, education, race/ethnicity, region, civic engagement, frequency of internet use and political party identification. The weights account for differences in the probability of selection for each sample type (prepaid cell phone and panel). This includes adjustment for the sample design and geographic stratification of the cell phone sample, within household probability of selection, and the design of the panel-recruitment procedure. 

The margin of sampling error including the design effect for the full sample is plus or minus 3 percentage points. Numbers of respondents and margins of sampling error for key subgroups are shown in the table below. For results based on other subgroups, the margin of sampling error may be higher. Sample sizes and margins of sampling error for other subgroups are available on request. Sampling error is only one of many potential sources of error and there may be other unmeasured error in this or any other public opinion poll. KFF public opinion and survey research is a charter member of the Transparency Initiative of the American Association for Public Opinion Research. 

GroupN (unweighted)M.O.S.E.
Total1,426± 3 percentage points
   
Party ID  
Democrats473± 6 percentage points
Independents483± 6 percentage points
Republicans367± 6 percentage points
MAGA Republicans/Republican-leaning independents352± 6 percentage points
   
MAHA supporters618± 5 percentage points
Parents or guardians of children under 18 living in their household436± 6 percentage points

Potential Impacts of Trump Administration H-1B Visa Policies on the Health Care and Social Assistance Industries

Published: Feb 5, 2026

Introduction

Immigrants, including those on H-1B visas, make significant contributions to the U.S. health care workforce and help to increase its capacity. H-1B workers are foreign workers with temporary approval to work in the U.S. in jobs that require specialized skills or knowledge. The Trump administration has implemented policies that will likely reduce the supply of H-1B workers, including a $100,000 entry fee for new H-1B visas as well as enhanced vetting and “online presence” reviews for all H-1B and H-4 (dependent) visa applications that have led to significant delays in visa processing.

This issue brief provides an overview of the H-1B visa program, analyzes trends in H-1B visa approvals for the health care and social assistance industries using data from the U.S. Citizenship and Immigration Services (USCIS) H-1B Employer Data Hub for fiscal years (FY) 2022-2025, and discusses potential implications of recent policies impacting the H-1B program on the U.S. health care workforce.

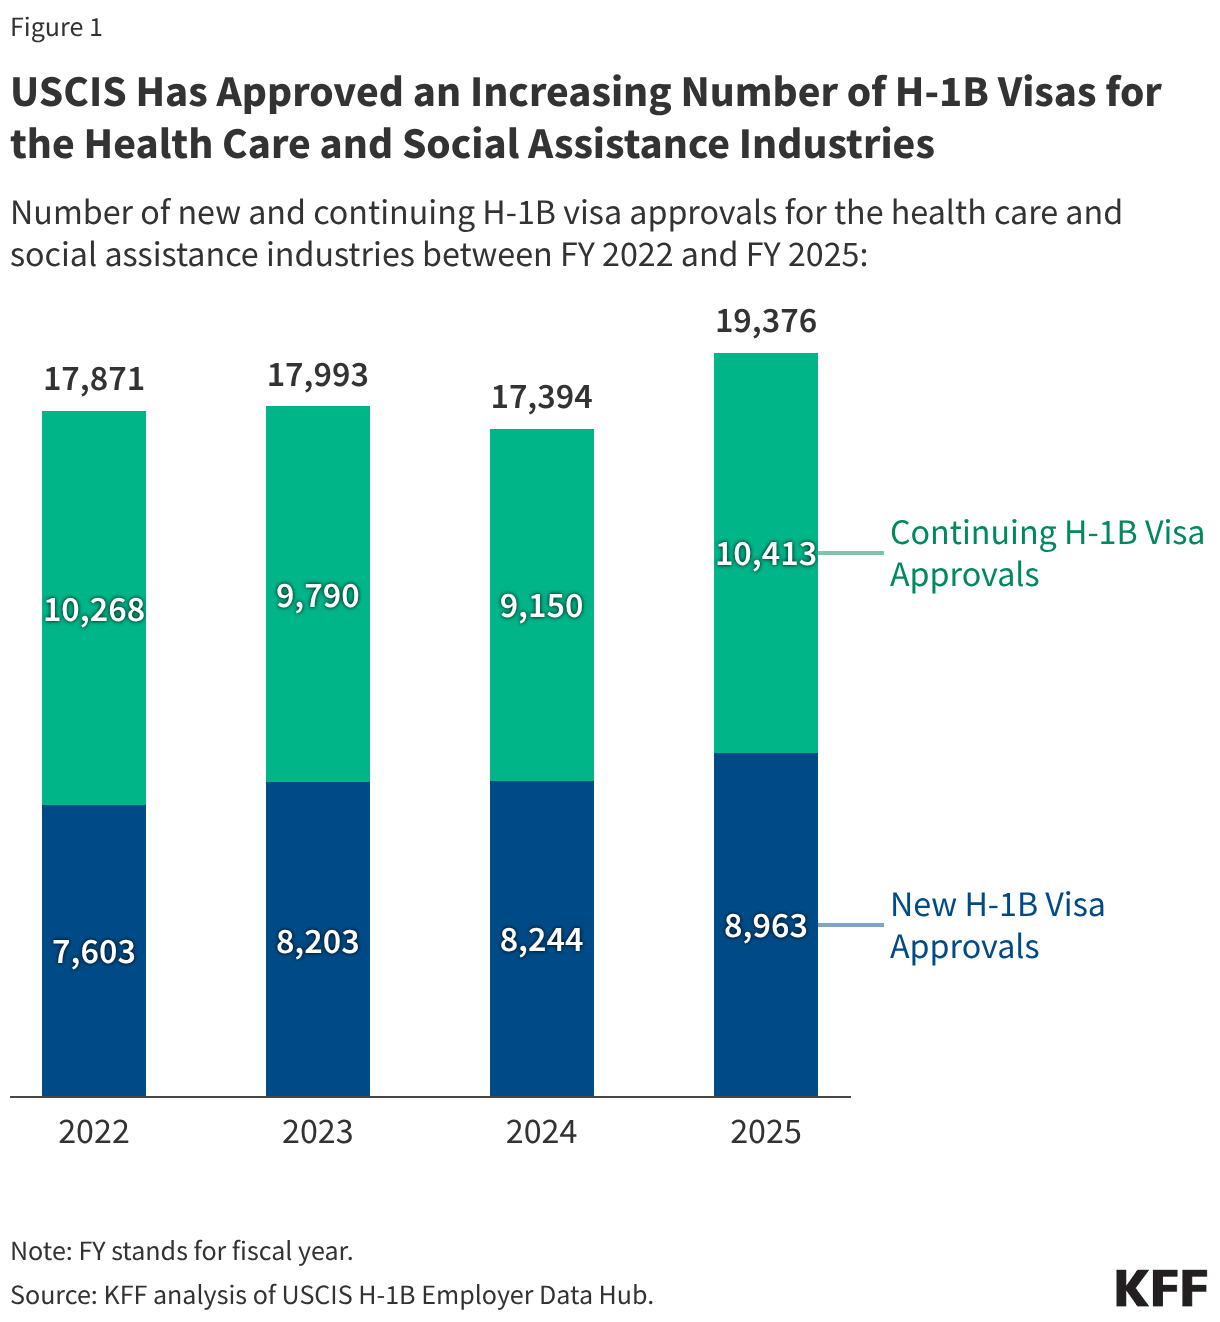
The analysis shows that H-1B workers have comprised an increasing role in the health care and social assistance industries in recent years with new and continuing H-1B visa approvals for the health care and social assistance industries rising by 8% between FY 2022 and 2025. As such, reductions in the H-1B workforce would likely lead to gaps in the industries and exacerbate existing health care worker shortages, including in the rural physician workforce.

Background

The H-1B visa program helps supply high-skilled workers to the U.S. workforce, including the U.S. physician workforce, particularly in lower income areas as well as within research universities and university-affiliated medical centers. The H-1B program allows U.S. employers to temporarily employ foreign workers for jobs that require specialized skills or knowledge. According to the American Hospital Association, physicians account for almost half of approved H-1B visas for medical and health occupations. Research further finds counties with the highest poverty levels had a higher percentage of H-1B-sponsored physicians and other health care workers compared to those with the lowest poverty levels (2.0% vs. 0.5%) and that rural counties similarly had a higher share of H-1B physicians and other health care workers than urban counties (1.6% vs. 1.0%). Research universities and university-affiliated medical centers are some of the largest employers of H-1B health care and social assistance workers. In FY 2025, the top three employers of workers with H-1B health care and social assistance visa approvals included Cleveland Clinic in Ohio, St. Jude Children’s Research Hospital in Tennessee, and Memorial Sloan Kettering Cancer Center in New York.

The number of new H-1B visas is capped at 65,000 each year with an additional 20,000 visas for those with a U.S. master’s degree or higher, although the cap is typically exceeded via exemptions. The H-1B visa cap of 65,000 was first established in 1990 under the Immigration Act of 1990, although it was temporarily increased from FY 1990-2000 as well as FY 2001-2003 by Congress. In FY 2004, the cap reverted to 65,000, with an additional 20,000 new visas reserved for those with a U.S. master’s degree or higher and has stayed the same since. However, the number of new H-1B visas granted each year generally exceeds the annual cap of 85,000 because of cap exemptions. For example, institutions of higher education, government research organizations, and certain nonprofits are exempt from the annual cap.

The Trump administration has implemented changes that are expected to reduce the number of H-1B workers in the U.S. These changes include a Proclamation issued on September 19, 2025, under which new H-1B visa petitions by employers must be accompanied by a $100,000 entry fee, a move that is being legally challenged by 20 states on the basis that it violates the Administrative Procedure Act. The Department of Labor launched Project Firewall in September 2025, which has led to an increase in random site visits and stricter scrutiny of third-party worksites in an effort to root out H-1B “fraud and abuse.” Additionally, the U.S. Department of State began enhanced vetting and “online presence” reviews of all H-1B and H-4 (dependent) visa applications starting December 15, 2025, which has led to significant delays and cancellations of visa interviews, leading to many H-1B workers getting stuck abroad.

Based on KFF analysis of data from USCIS, new and continuing H-1B visas for the health care and social assistance industries increased by over 8% from just under 18,000 in FY 2022 to over 19,000 in FY 2025 (Figure 1). The Bureau of Labor Statistics defines the health care and social assistance industries as establishments that provide health and medical care, as well as those that provide social assistance. Examples of such establishments include but are not limited to hospitals, clinics, nursing homes, medical laboratories, home health agencies, and social service centers. In contrast, the total number of new and continuing H-1B visas across other industries fell by 9% from over 420,000 in FY 2022 to about 390,000 in FY 2025.

USCIS Has Approved an Increasing Number of H-1B Visas for the Health Care and Social Assistance Industries (Stacked column chart)

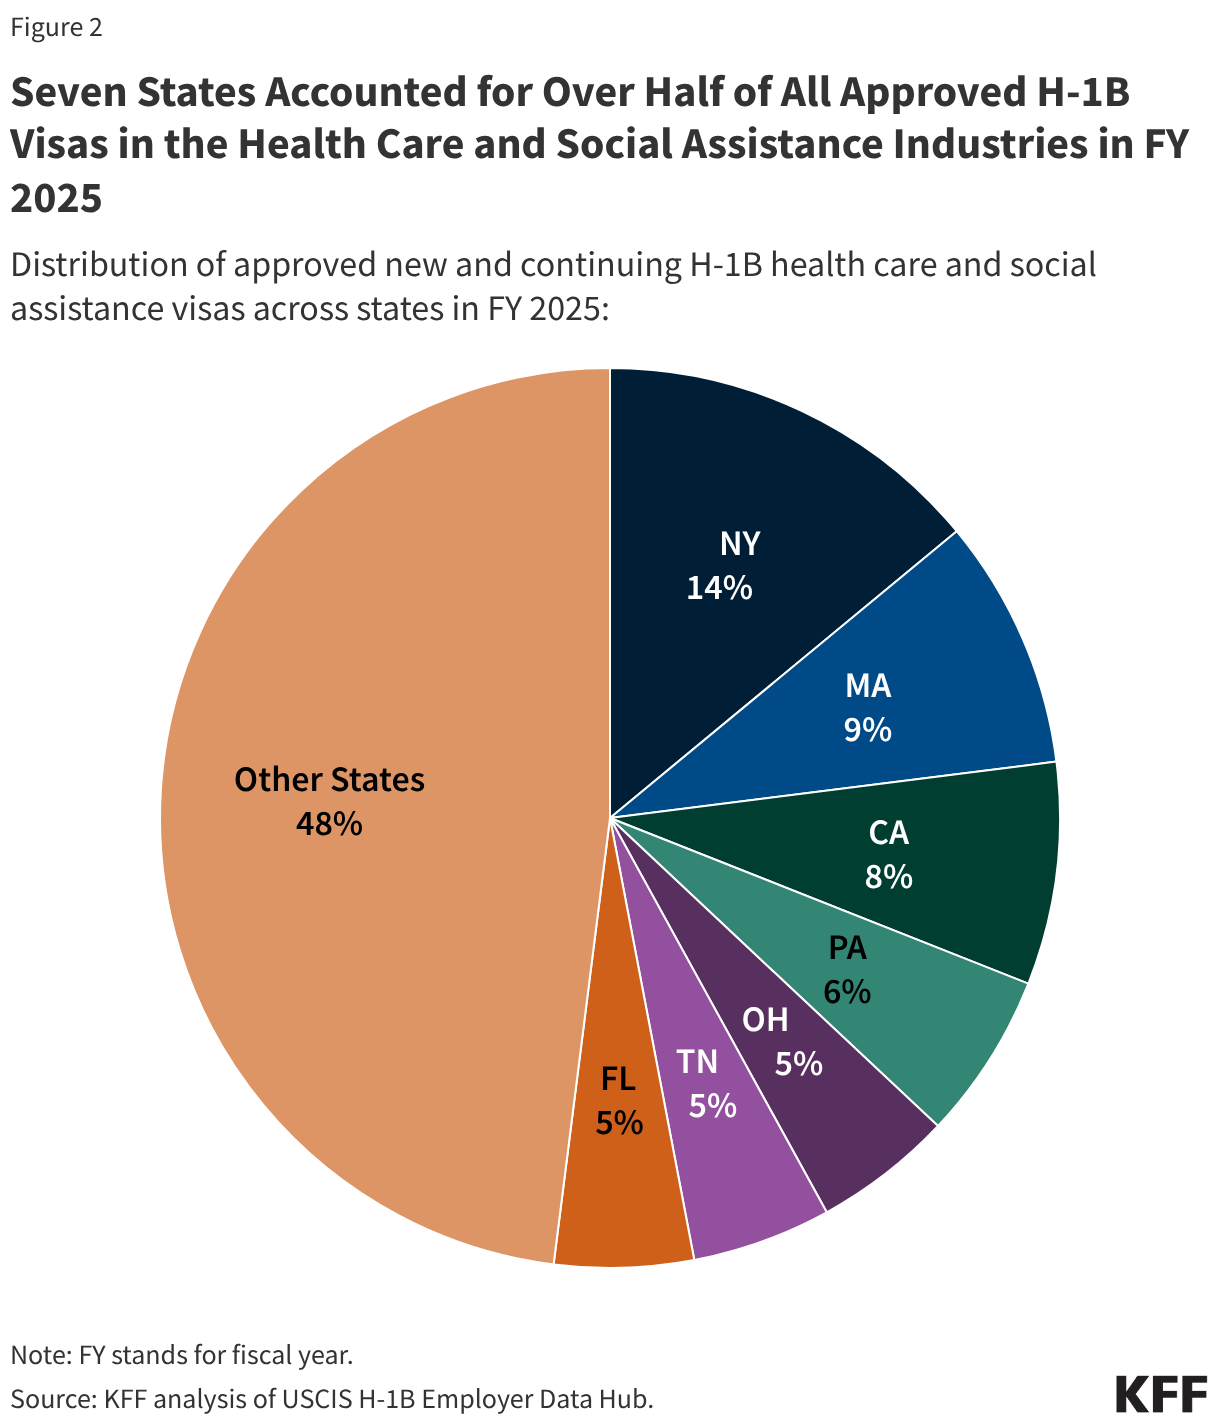
H-1B workers play a particularly significant role in the health care and social assistance industries in certain states. NY (14%), MA (9%), CA (8%), PA (6%), and OH, TN, and FL (5% each) accounted for over half (52%) of new and continuing H1-B visas for the health care and social assistance industries approved in FY 2025 (Figure 2). These states are home to large research universities and medical centers, which, as noted, are some of the biggest employers of H-1B workers in the health care and social assistance industries.

Seven States Accounted for Over Half of All Approved H-1B Visas in the Health Care and Social Assistance Industries in FY 2025 (Pie Chart)

Implications

These data suggest that H-1B workers have played an increasingly large role in the health care and social assistance industries in recent years, suggesting that reductions in the supply of H-1B workers could leave gaps that exacerbate health care worker shortages. Recent actions by the Trump administration are anticipated to reduce the number of H-1B workers in the U.S., including the new $100,000 entry fee as well as “online presence” reviews for H-1B visa applications. A decline in the supply of H-1B workers in the health care and social assistance industries could disproportionately impact states that employ the largest numbers of H-1B workers, lower income and rural areas where H-1B health care workers often are employed, and smaller employers who would face greater challenges paying the new $100,000 fee. Research universities and university-affiliated medical centers, which are some of the largest employers of H-1B health care workers, also are likely to be disproportionately impacted at a time when they are already facing broader funding cuts. The resulting shortages in the health care workforce are likely to increase barriers to accessing health care, potentially affecting the health and well-being of the population over the long term.

These actions to reduce the number of H-1B workers come against a backdrop of increased immigration enforcement as well as other restrictions on lawful immigration into the U.S. These efforts have reduced the flow of immigrants into the country and have increased fears among immigrants already here. Researchers project that restrictive policies undertaken by the Trump administration could reduce legal immigration into the U.S. by 33% to 50% over four years as compared to FY 2023 levels. Broad reductions in immigrants could particularly affect the health care workforce given the significant role they play as hospital physicians, nurses, as well as direct long-term care workers. These reductions may be compounded by a projected decline in the U.S.-born labor force over the next few decades due to an increase in the share of the U.S.-born population that is over 65 years of age and therefore less likely to participate in the workforce.

ACA Marketplace Enrollment is Down in 2026—But All of the Data Isn’t in Yet

Authors: Justin Lo, Jared Ortaliza, Emma Wager, Matt McGough, and Cynthia Cox
Published: Feb 5, 2026

2026 marks the first year since 2020 that enrollees in the Affordable Care Act Marketplaces do not have access to enhanced premium tax credits. The effect of the expiration on how many people will use ACA Marketplace coverage remains unclear.

New data released by CMS on plan selections show that ACA sign-ups for 2026 are down by over 1 million people compared to the same time last year, marking the first year since 2020 that sign-ups appear to have declined. A more detailed Health Insurance Exchanges Open Enrollment Report is expected in March or April that will detail demographics, income, and metal levels for people who select or are automatically renewed into a plan. Plan selection data is unable to fully capture the effects of the enhanced tax credits expiring on the number of people with coverage. As some people end up not making their premium payments, actual enrollment—known as “effectuated” enrollment—will inevitably decline. With the expiration of enhanced premium tax credits, premium payments are estimated to have increased 114%, on average, for subsidized enrollees who stay in the same plan. With such steep increases, it is not yet clear how many people who have selected a plan during Open Enrollment will make a payment. 

This brief explains the limitations of early data in understanding the impact of the expiration of enhanced premiums tax credit on ACA enrollment. It also provides a timeline of when more complete data will become available. The bottom line is that it will be quite a while before we get a complete picture of how much enrollment has dropped following expiration of the enhanced premium tax credits.

What are the limitations of plan selection data?

Plan selection (or “sign-up”) data does not accurately reflect the number of people who ultimately have ACA Marketplace coverage because it does not account for premium payments. In other words, it shows how many people have selected a plan or been automatically renewed into ACA coverage, but it does not show how many people actually gain or maintain coverage.

New enrollees are generally required to submit their first premium payment (“binder” payment) within 30 days of the coverage effective date, thus “effectuating,” or beginning, their coverage. Returning subsidized customers, however, are generally given a 3-month grace period for nonpayment of premiums. This means that these returning consumers would then have until March 31, 2026, to catch up on premium payments before their coverage is retroactively terminated. The impact of enhanced subsidies expiring will therefore not be evident (even to insurers) until all applicable grace periods have been exhausted.

For 2026, nearly 20 million of the plan selections are returning customers. Plan selection data from 2025 shows that more than four in ten people in the ACA Marketplaces were automatically renewed into their coverage that year, meaning they did not actively sign up for their plan. As consumers automatically renewed for 2026 received their first premium bills for January, some may have disenrolled or stopped making a payment. Depending on what action they take and the timing, many people could be counted in preliminary plan selection data (in the “Final Snapshot” just released and the “Open Enrollment Report” in the spring) even though they may not truly have coverage.

When will we know more about ACA enrollment?

Below is a timeline of key ACA Marketplace deadlines and data releases. The data timing listed below is based on recent years’ release dates and there could be different dates in 2026. The section following the timeline explains each of these data sources in detail.

TimingDeadline or Data Release
January 15, 2026End of Open Enrollment in most states
January 28, 2026Final Marketplace Open Enrollment Period Report: National Snapshot (plan selections) in most states; preliminary data are included for states with later open enrollment periods
January 30, 2026Last possible payment due date for January 1 enrollments in new plans
January 31, 2026End of Open Enrollment in all states
March 2, 2026Last possible payment due date for February 1 enrollments
March 31, 2026Payment grace period ends for automatic renewals processed December 15
March/April 2026*CMS Health Insurance Exchange Open Enrollment Report and Public Use Files (plan selections)
April/May 2026Public insurer first quarter earnings reports
May/June 2026Earliest 2027 insurer rate filings to state regulators become public
July 2026*Effectuated Enrollment: Early 2026 Snapshot
January 2027*Biannual National Health Interview Survey (NHIS) Early Release Data
July 2027*Effectuated Enrollment: Full Year 2026—accounts for grace period retroactive terminations
July 2027*Finalized HHS Risk Adjustment Program State-Specific Data; additional rate filings
July 2027*Issuer Level Enrollment Public Use File
2028*Enrollee-Level External Data Gathering Environment (EDGE) data

*Note: Timing is based on recent years and may change for plan year 2026.

Effectuated Enrollment

The effectuation rate is the share of people who have a plan selection during Open Enrollment who effectuate (or start) their coverage. While it is possible that some states or insurers may provide information about effectuation rates earlier, the first national data on ACA enrollments will likely come out in July 2026 with the Effectuated Enrollment Report, if the timing of past years is followed.

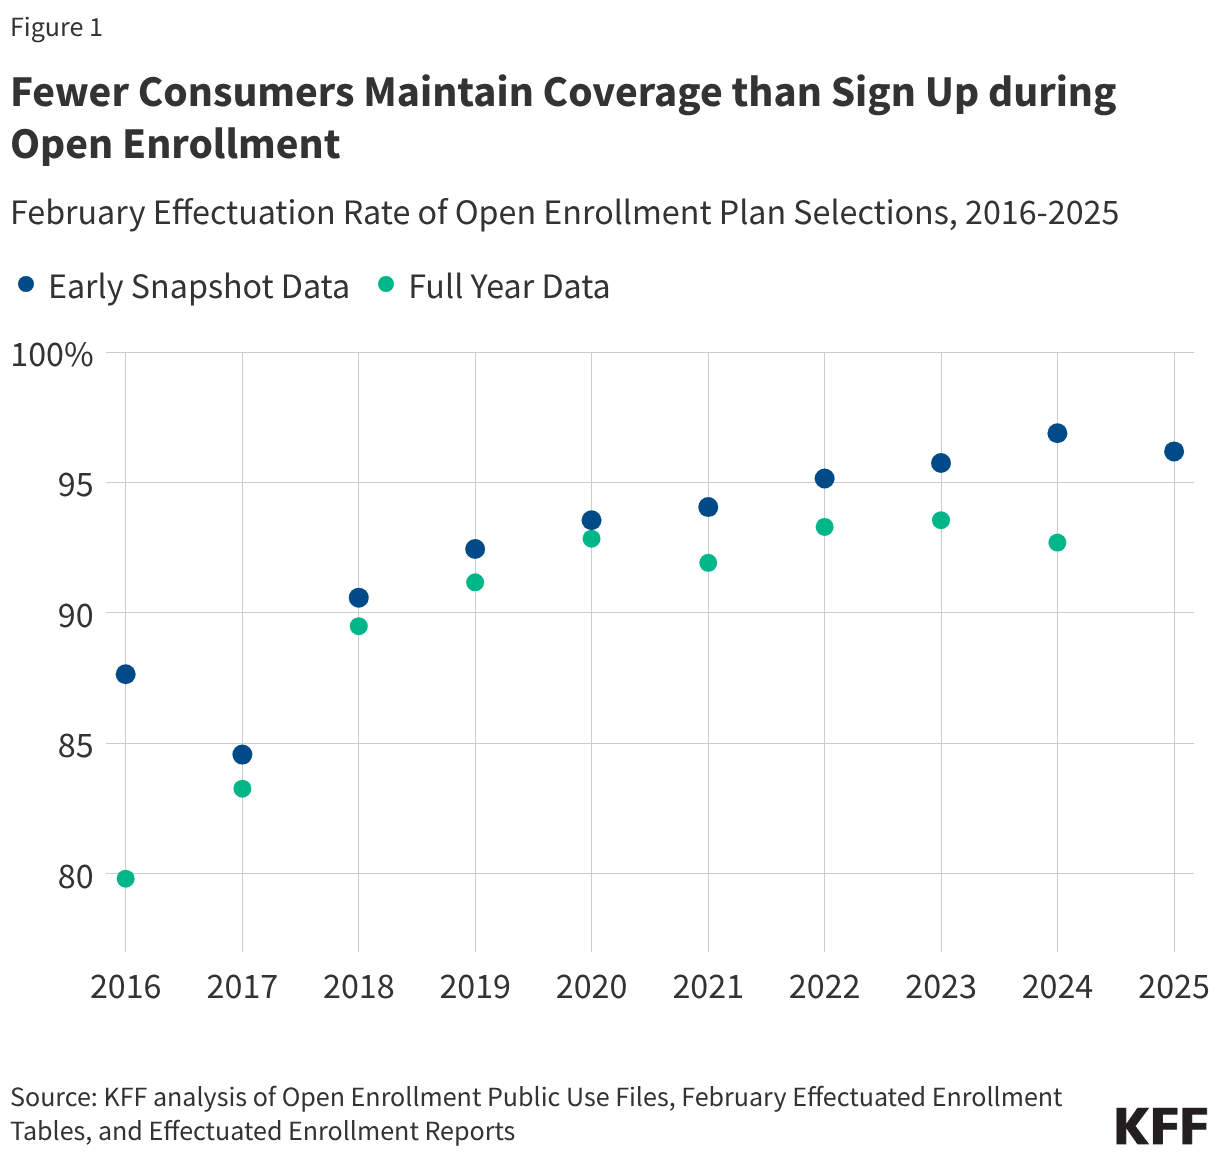
As shown in the chart below, the effectuation (or premium payment) rate has been quite high since 2022, meaning the vast majority of consumers who selected a plan ended up with coverage. For that reason, in recent years, plan selections and effectuated enrollment have often been discussed synonymously. However, the expiration of enhanced premium tax credits in 2026 will mark the first time that most ACA Marketplace enrollees experience a significant increase in their premium payments, making past years’ effectuation rates unreliable indicators of this year’s rate.

CMS typically releases an Effectuated Enrollment: Early Snapshot each summer. This data will provide a better picture of the impact of the expiration of enhanced tax credits on enrollment than plan selection data alone.

Based on past years, the Effectuated Enrollment: Early Snapshot report will likely be released in July 2026, and will report February 2026 effectuated enrollment, as measured on March 15, 2026. In other words, the July data release will likely show how many people had effectuated enrollment in February, based on what insurers know about premium payments by mid-March. However, as mentioned above, returning customers have until the end of March to make premium payments under the grace period. So even the data released in July of 2026 may still overstate the number of enrollees.

The effectuated enrollment data released in July of 2026 will likely not count new consumers who missed their binder payment for January or February, nor would it count consumers who were automatically renewed in December but then actively disenrolled in January. However, it wouldstill count people who were automatically renewed for January coverage and did not make a payment during the grace period—even if they eventually had their coverage retroactively terminated as of January 31.

The Effectuated Enrollment: Full Year 2026 data, likely to be released in the summer of 2027, would show the number of effectuated enrollees after all grace periods have elapsed. As a share of plan selections made during Open Enrollment, the chart below shows the final February effectuation rate from the Full Year (green) data has historically been a few percentage points lower than the Early Snapshot (blue).

Fewer Consumers Maintain Coverage than Sign Up during Open Enrollment (Line chart)

Another reason the Effectuated Enrollment: Early Snapshot (expected to be released in July 2026) may not give a complete picture of the effect of expiring enhanced tax credits is that there could still be additional coverage loss later in the year. If an enrollee makes an initial premium payment but then decides their premium is unaffordable and drops their coverage mid-year, they may still be counted in the Effectuated Enrollment: Early Snapshot data even though they will not have coverage after their termination.

CMS may release additional effectuated enrollment counts before the Effectuated Enrollment: Full Year report; since this additional reporting may be after the run-out of grace periods, they would reflect finalized enrollment. In 2025, effectuated enrollment counts for the first five and seven months were released. Additionally, these releases may include information on the contribution of premium tax credits to the gross premium.

While effectuated enrollment data will tell us the number of people who are covered by ACA plans, it will not provide information about who paid their premium. The Open Enrollment Report and concurrent public use files, based on plan selections, will be the earliest source of information about income and other demographics of ACA enrollees. It is likely that the demographics and income distribution of ACA enrollees could shift from between the measurement of plan selections and effectuated enrollment. Additionally, the effectuated enrollment data from the Full Year report does not typically include metal level selection. There could be differences in payment rates for people who stay in their previous plan and face large premium increases and those who switch to lower-cost plans.

Quarterly Earnings Reports: April and May 2026

Prior to the publication of the effectuated enrollment data, some data on enrollment trends may be available from the insurers that enroll large shares of the individual market, during investor earnings calls. Insurers will host their fourth-quarter and year-end 2025 earnings calls in late January or February of 2026: Centene and Oscar will host their Q4 earnings calls on February 6 and February 10, respectively.

Insurers may start releasing membership counts for 2026 during their first-quarter 2026 earnings calls, expected to happen in April or May. Centene has announced their first-quarter earnings call for April 28. Elevance and UnitedHealthcare typically have first-quarter calls in April, while Oscar and Cigna typically report earnings in May. First-quarter calls that include enrollment information may not be fully adjusted for retroactive terminations due to nonpayment grace periods.

Insurer Rate Filings: Summer 2026

Every spring and summer, individual market insurers, including those offering ACA Marketplace plans, publicly file proposed premium rate changes to state regulators. These filings offer insight into what insurers believe is driving health cost growth and changes in enrollment. These rate filings will show insight into what insurers are planning in 2027 and may provide early counts of 2026 enrollment.

National Health Interview Survey Quarterly Releases: Likely January 2027

The National Health Interview Survey (NHIS) early release data will provide early indications of changes in the uninsured rate without the enhanced tax credits. From 2021-2024, first-quarter data came out in the summer of the same year, and data for the second quarter of the year came out closer to the end of the year. The Centers for Disease Control and Prevention has transitioned to biannual releases of data and released data for the first half of 2025 at the end of January 2026. If this release schedule remains consistent, data for the first half of 2026 may become available in early 2027.

Risk Adjustment Data: July 2027

Based on past years, the CMS Risk Adjustment Program State-Specific Data for 2026 is expected to come out in July 2027. The risk adjustment data will provide a state-by-state look at how many billable member months were reported for the ACA-compliant individual market. Because it will include on- and off-Marketplace enrollment, it will capture all people in ACA compliant coverage, even if they chose to purchase it off-exchange.

Issuer Level Enrollment Data: July 2027

The issuer-level enrollment data is split between HealthCare.gov and state-based exchanges. Data for HealthCare.gov states includes more information, including average monthly effectuated enrollment and average months of enrollment for those who have disenrolled. Additionally, issuer-level enrollment across all states will be made available through the Medical Loss Ratio Data and System Resources Public Use File, released late in the following year.

Enrollee-Level External Data Gathering Environment (EDGE): 2028

Enrollment by metal tier can be determined using the Enrollee-Level External Data Gathering Environment (EDGE) dataset, but this is subject to its own limitations: sparse enrollee demographic information, incomplete longitudinal data, and no information on terminated/non-effectuated coverage prevent fine-grained analysis on how the expiration of enhanced premium tax credits affected enrollee decisions. EDGE data for 2026 will likely not be available until 2028.

FY 2026 National Security, Department of State and Related Programs (NSRP) Global Health Funding in the Consolidated Appropriations Act

Published: Feb 4, 2026

Update: On February 3, 2026, the President signed the “Consolidated Appropriations Act, 2026” which includes funding provided in the FY 2026 National Security, Department of State and Related Programs (NSRP) appropriations bill and accompanying explanatory statement detailed below. This resource was originally published on January 14, 2026.

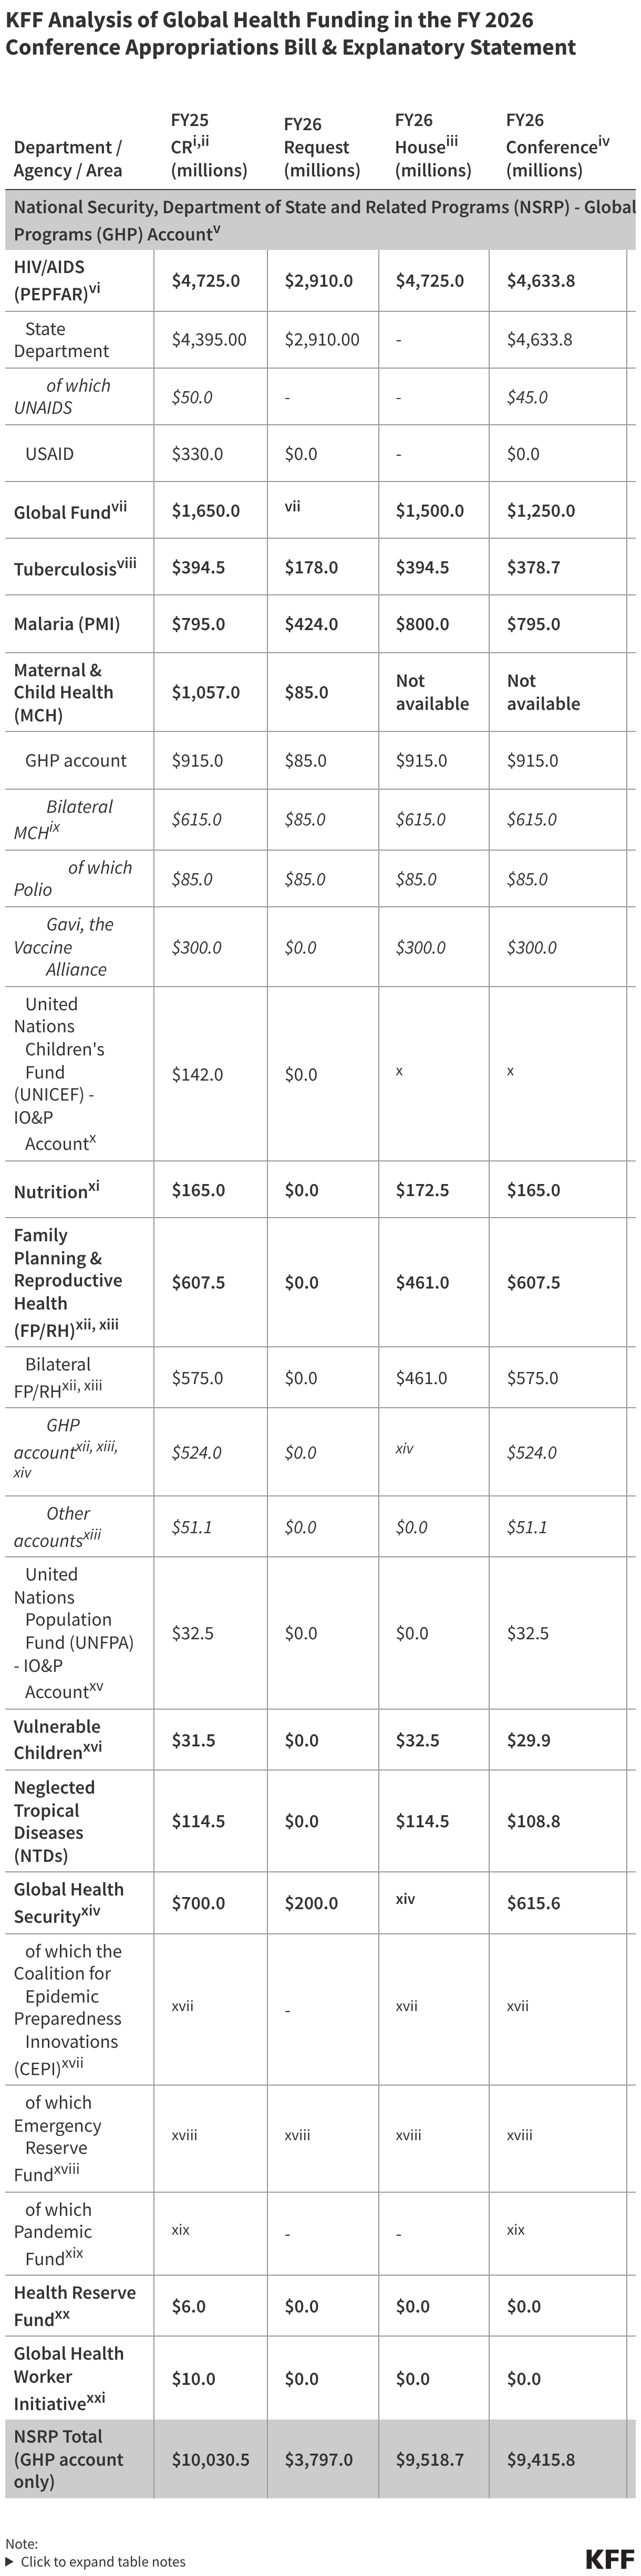
On January 11, 2026, the Appropriations Committee released the FY 2026 National Security, Department of State and Related Programs (NSRP) (formerly State, Foreign Operations, and Related Programs [SFOPs]) appropriations bill and accompanying explanatory statement. The bill and explanatory statement include funding for U.S. global health programs at the State Department. Funding for global health programs at the State Department through the Global Health Programs (GHP) account, which represents the bulk of global health assistance, totals $9.4 billion, which is a decrease of $615 million (-6%) compared to the FY25 level ($10 billion). All program areas either decreased or remained flat as follows:

  • Decreased: Funding for the Global Fund to Fight AIDS, Tuberculosis and Malaria (Global Fund), bilateral HIV, tuberculosis (TB), global health security, neglected tropical diseases (NTDs), and vulnerable children declined; while the Global Fund accounted for the largest decrease (-$400 million or -24%), this funding supports the administration’s pledge of $4.6 billion for the eighth replenishment and serves as the first installment of that pledge. In addition, the explanatory statement accompanying the bill states that there are also “sufficient unobligated balances” from prior Acts “to fulfill the United States pledge for the seventh replenishment.”
  • Remained Flat: Funding for malaria, maternal and child health (MCH), nutrition, and family planning and reproductive health (FP/RH) remained flat.

In addition, the bill included provisions that either impact or provide direction on global health funding including:

  • Program Area Amounts: Funding for many of the global health program areas is specified in the explanatory statement (rather than the bill). Unlike prior years, this bill specifically states that funding “shall be made available at not less than the amounts specifically designated in the respective tables included in the explanatory statement” ensuring that the administration is required to provide the amounts for the areas specified. The bill also prohibits the administration from deviating from the global health amounts in the bill and explanatory statement.
  • Funding Availability Timeframe: PEPFAR funding (bilateral HIV and the contribution to the Global Fund) is available for five years. Funding for most other program areas is provided for two years, with the exception of funding for Gavi, the Vaccine Alliance and the Coalition for Epidemic Preparedness Innovations (CEPI), which is provided for one year.
  • Reports/Briefings: The bill requires the administration to provide updates (via reports or briefings) on numerous global health areas including (but not limited to) the PEPFAR Transition Strategy, Market Access Strategy, bilateral health agreements, multilateral health engagement, the development of an Innovation Fund, and the status of available funding (i.e. apportionment, allocations, obligations, and disbursements).
  • Additional Requirements: The bill requires coordination with the Centers for Disease Control and Prevention (CDC) on global health activities and establishes the Prevention, Treatment, and Response Initiative, which supports “research, development, and delivery of vaccines and other prevention technologies”.

See the table below for additional detail on global health funding. See other budget summaries (including the summary on FY 2026 Labor, Health and Human Services, Education, and Related Agencies (Labor HHS) global health funding) and the KFF budget tracker for details on historical annual appropriations for global health programs.

KFF Analysis of Global Health Funding in the FY 2026 Conference Appropriations Bill & Explanatory Statement (Table)

FY 2026 Labor, Health and Human Services, Education, and Related Agencies (Labor HHS) Global Health Funding in the Consolidated Appropriations Act

Published: Feb 4, 2026

Update: On February 3, 2026, the President signed the “Consolidated Appropriations Act, 2026” which includes funding provided in the FY 2026 Labor, Health and Human Services, Education, and Related Agencies (Labor HHS) conference bill and accompanying report detailed below. This resource was originally published on January 22, 2026.

The Committee on Appropriations released its FY 2026 Labor, Health and Human Services, Education, and Related Agencies (Labor HHS) conference bill and accompanying report on January 20, 2026.

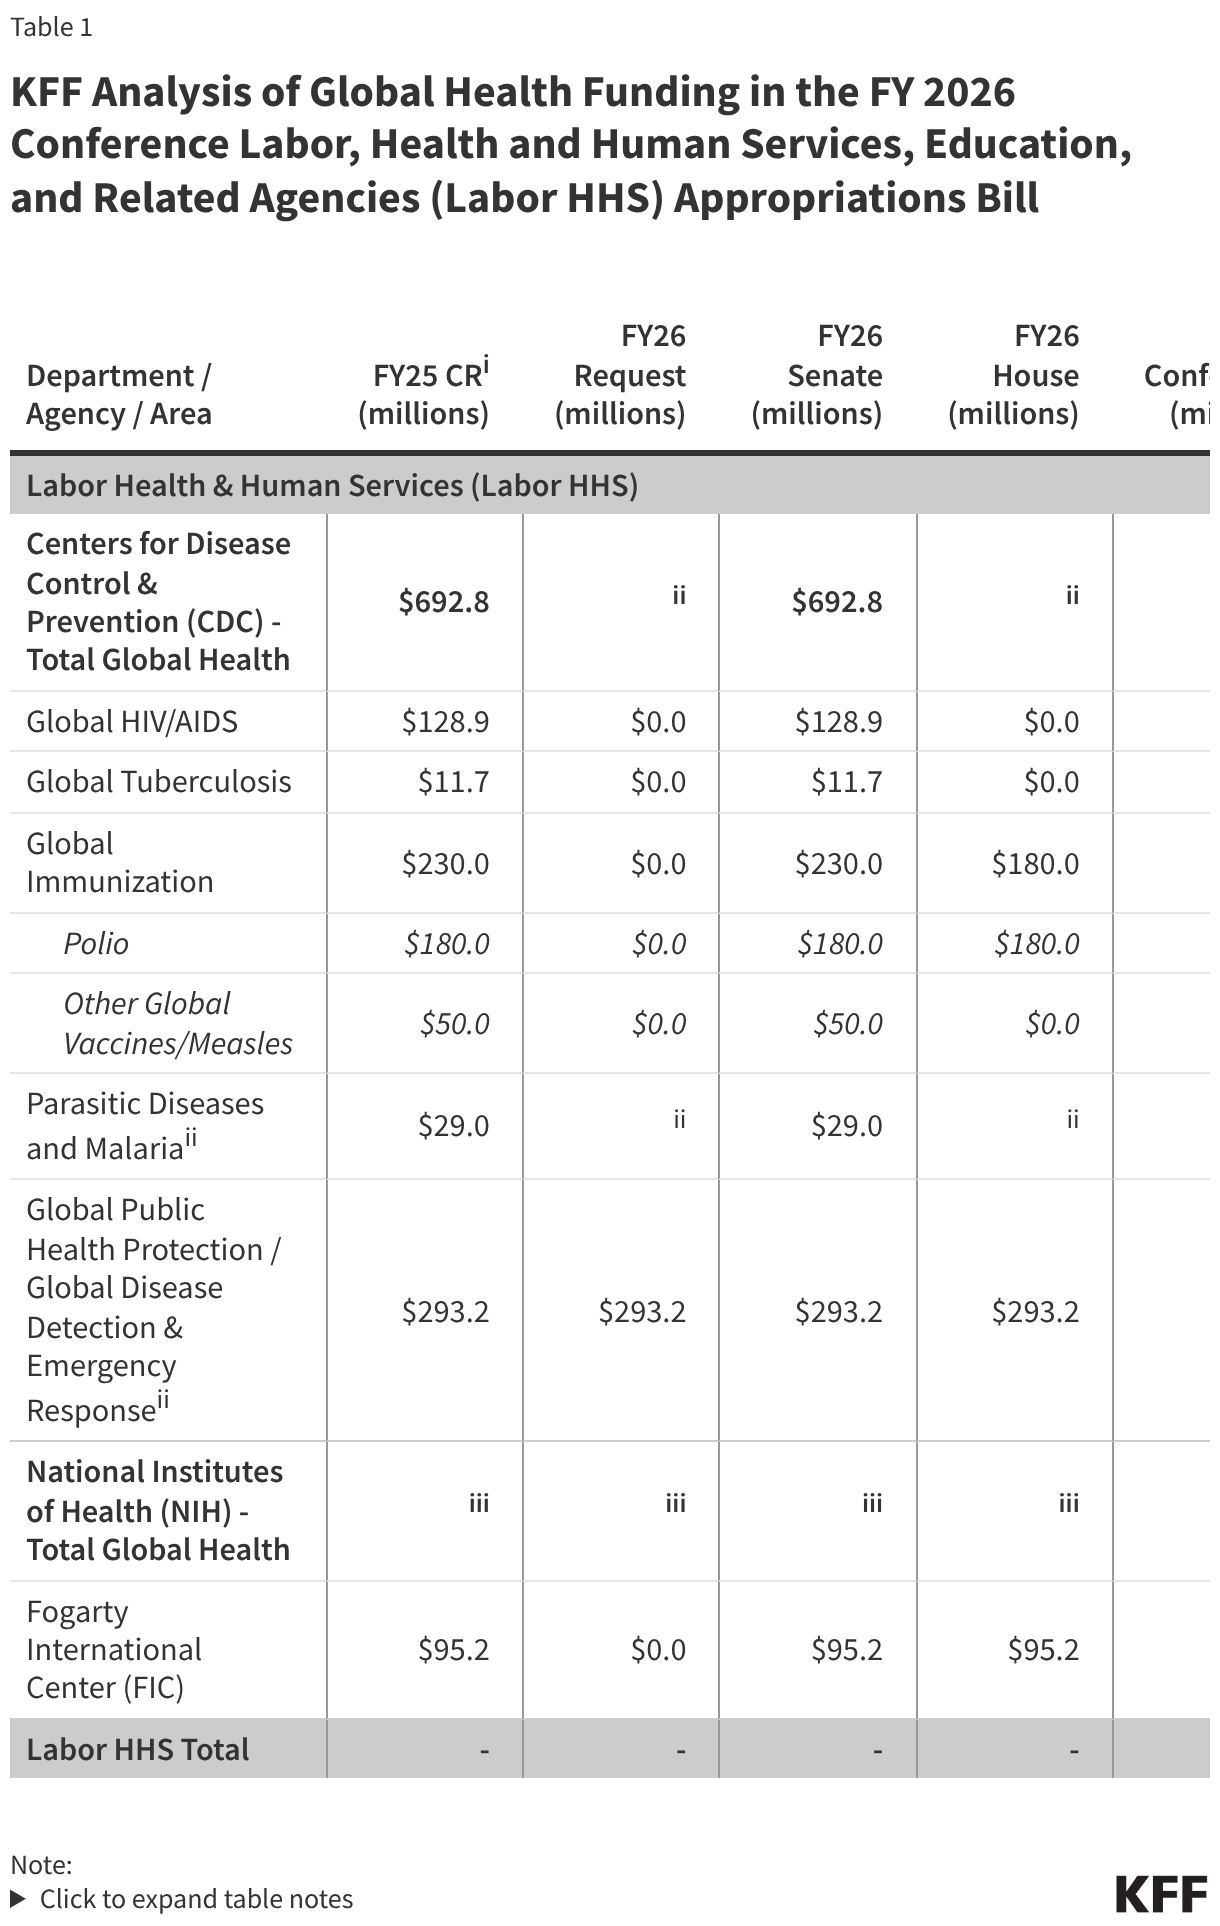
While most U.S. global health funding is provided to the State Department through a separate appropriations bill (see the KFF budget summary on this funding here), the Labor HHS appropriations bill includes funding for global health programs at the Centers for Disease Control and Prevention (CDC) as well as funding for global health research activities at the National Institutes of Health (NIH). Total global health funding at CDC and NIH through the Labor HHS bill is not yet known, as funding for some programs (i.e. global HIV/AIDS and malaria research) at NIH is determined at the agency level rather than specified by Congress in annual appropriations bills. Funding for global health in the Labor HHS bill remained flat compared to the FY 20251 level as follows:

  • CDC: Funding for global health programs at CDC totals $693 million, the same level as the FY 2025 enacted amount.2 Within CDC, funding for each specific global health program area was also maintained at the FY 2025 level.
  • NIH: Funding for global health research activities at the Fogarty International Center (FIC) at NIH totals $95 million, the same level as the FY 2025 enacted amount.

In addition, Section 236 under the Labor HHS section of the bill specifically states that funding “shall be for the budget activities, and in the amounts specified in the table under each such heading in the explanatory statement” instructing the administration to provide the amounts for the areas specified.

See the table below for additional details on global health funding. See other budget summaries and the KFF budget tracker for details on historical annual appropriations for global health programs.

KFF Analysis of Global Health Funding in the FY 2026 Conference Labor, Health and Human Services, Education, and Related Agencies (Labor HHS) Appropriations Bill (Table)

  1. Funding for FY25 was provided in a full-year Continuing Resolution (CR), which maintained FY24 levels. All FY25 amounts and associated notes are based on those specified in relevant FY24 appropriations bills. ↩︎
  2. The FY26 Request eliminates CDC's Global Health Center and most of its bilateral programs, except funding for "Global Disease Detection & Emergency Response", which is transferred to "Crosscutting Activities and Program Support", and "Parasitic Diseases and Malaria", which is transferred to "Emerging and Zoonotic Infectious Diseases". ↩︎
News Release

Poll: People View Prior Authorization as Greatest Burden in Navigating the Health System

Many Report Impact on their Care, Finances and Well-being

Published: Feb 2, 2026

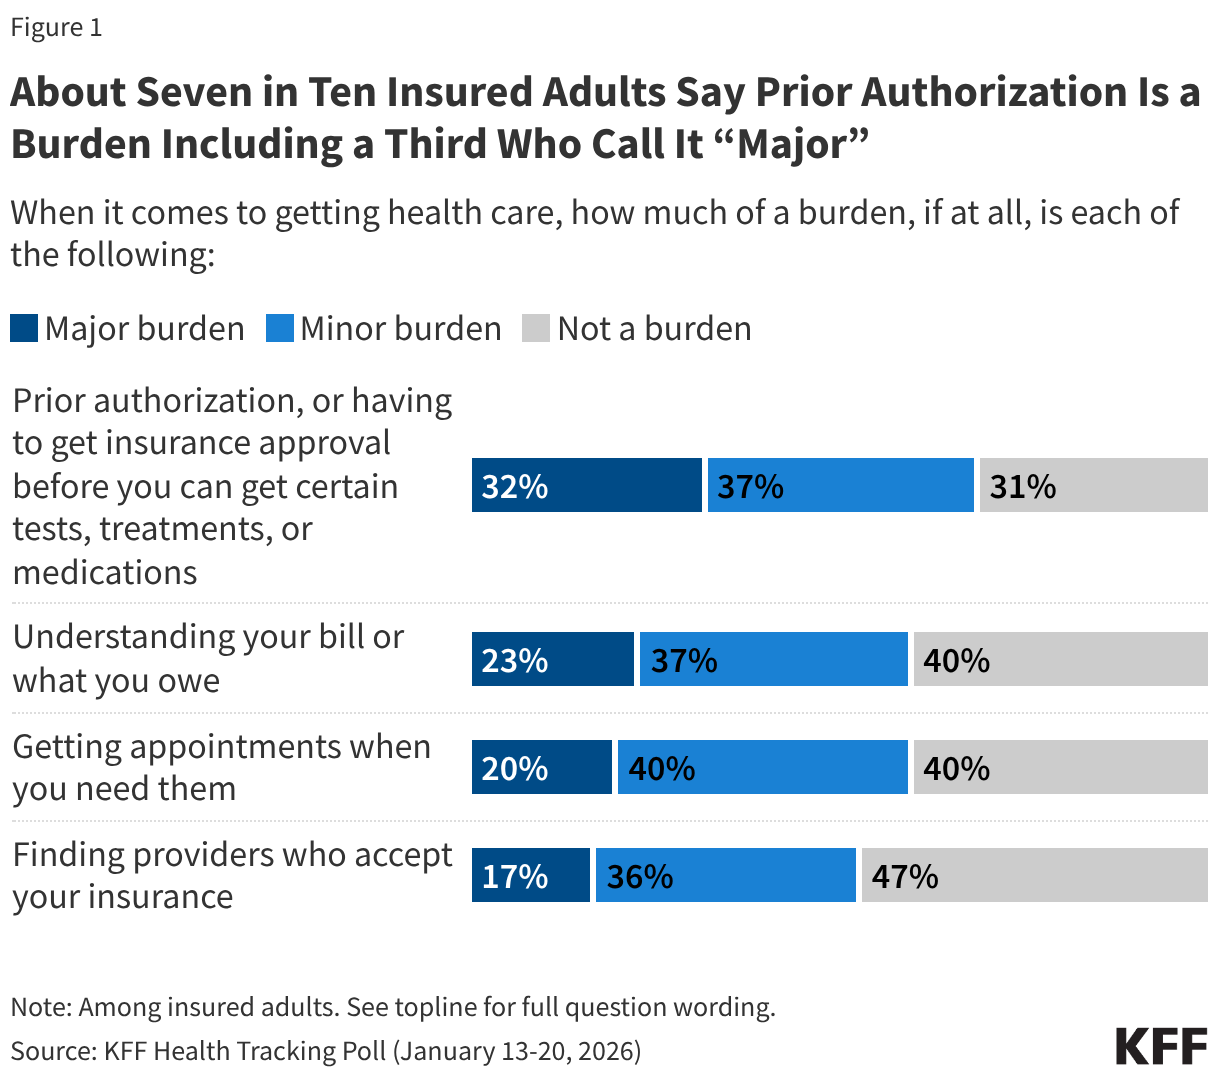
New KFF polling explores the challenges beyond costs that people with insurance face in navigating the health care system. People cite prior authorization review as their top problem by a wide margin, with a third (32%) saying prior authorization requirements are a “major burden.”

That’s more than say the same about understanding their bill or what they owe (23% say it is a major burden), getting appointments when they need them (20%), or finding providers who accept their insurance (17%).

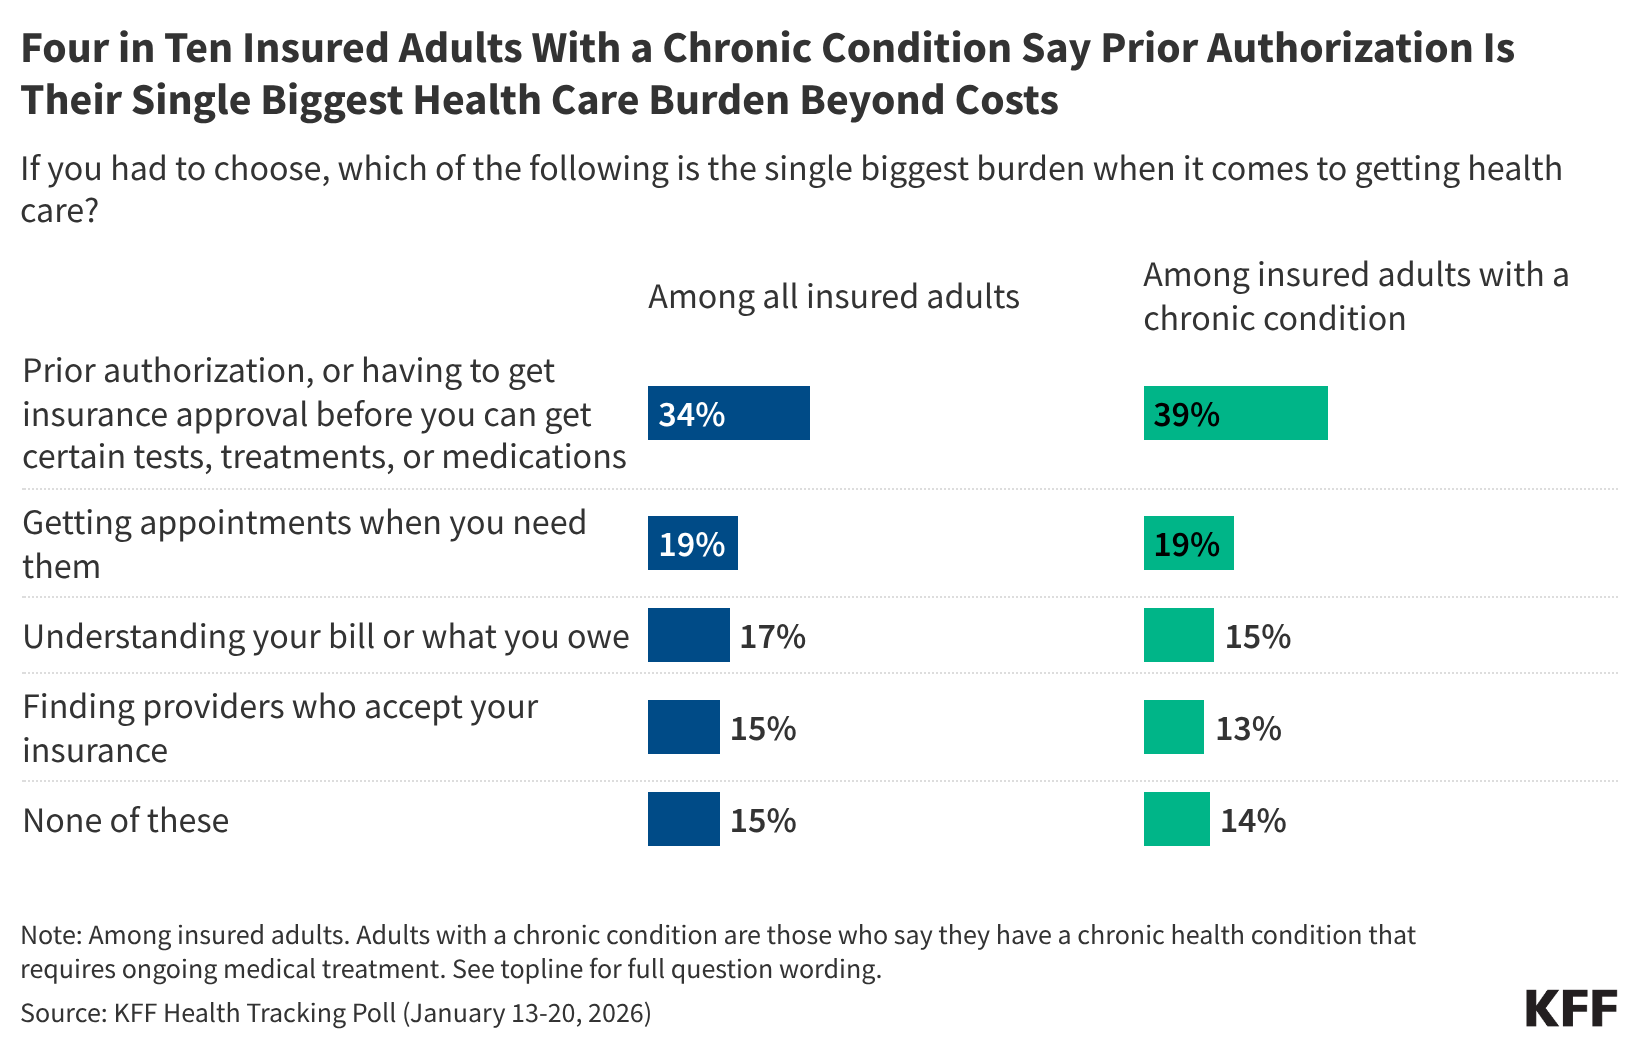
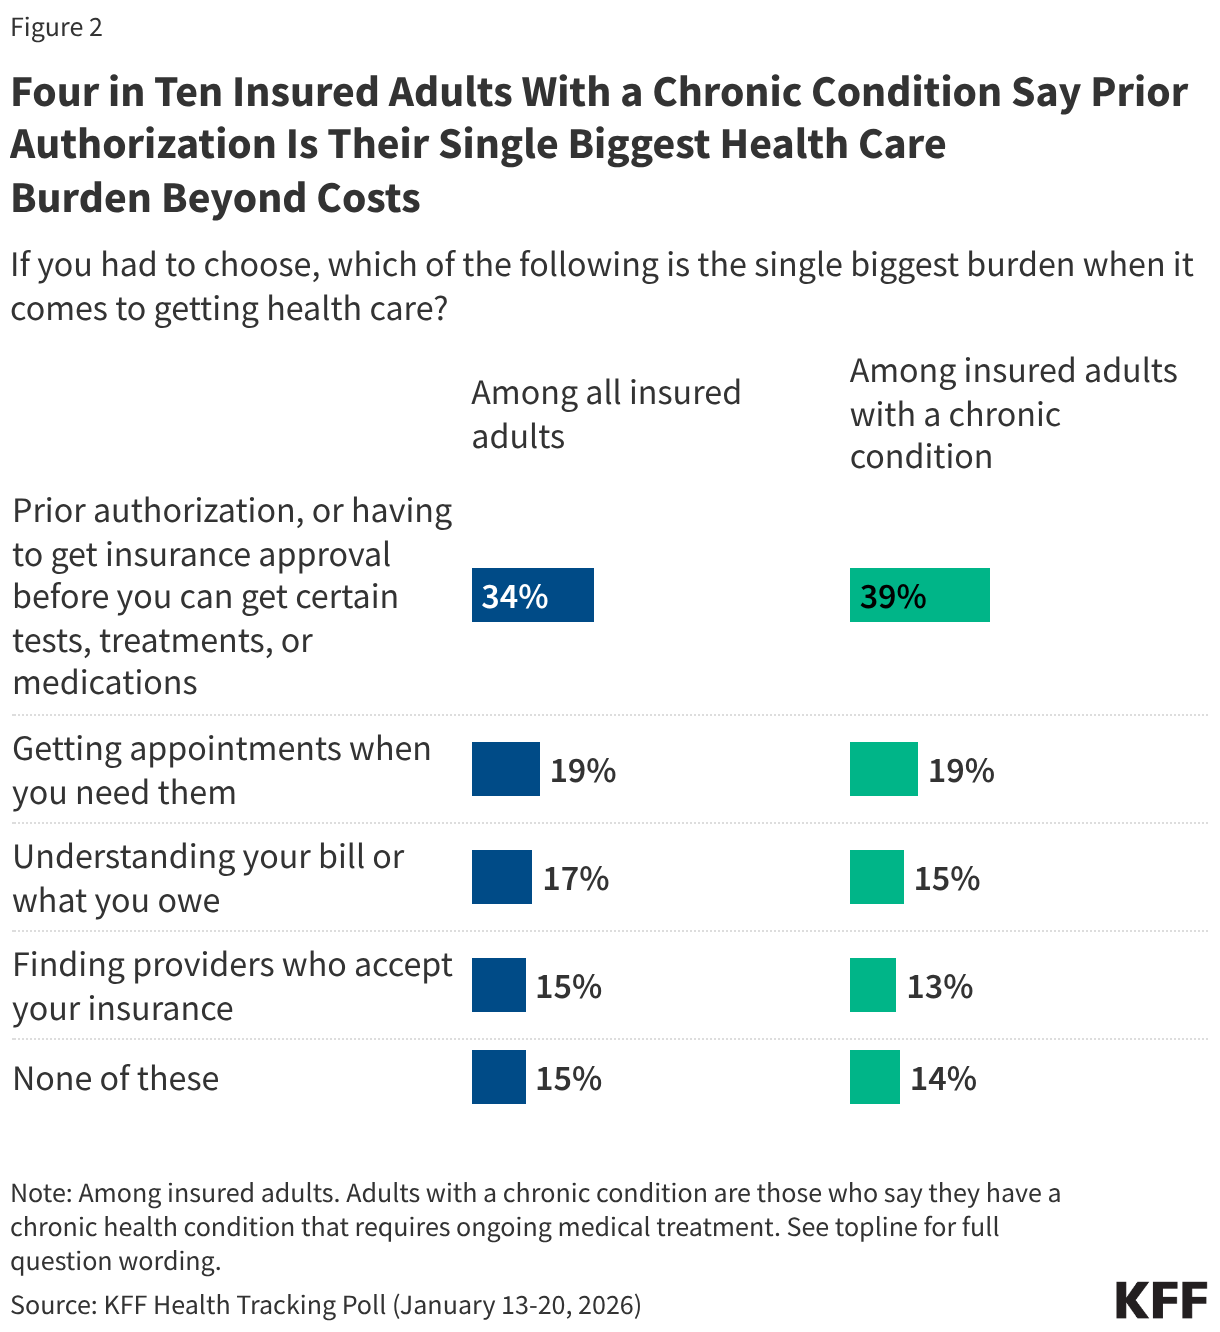
When asked to choose which of those four factors is “the single biggest burden,” prior authorization before accessing certain tests, treatments, or medication ranks at the top (34%). Among people with a chronic condition that requires ongoing medical treatment (about half of all insured adults), 4 in 10 (39%) say prior authorization is the single biggest burden when it comes to getting care, more than twice the share who say the same about other obstacles.

“The complexity of the health system drives patients crazy, can have real consequences, and disproportionately affects people who are sick,” KFF President and CEO Drew Altman said. “Prior authorization review is the poster child for that complexity.”

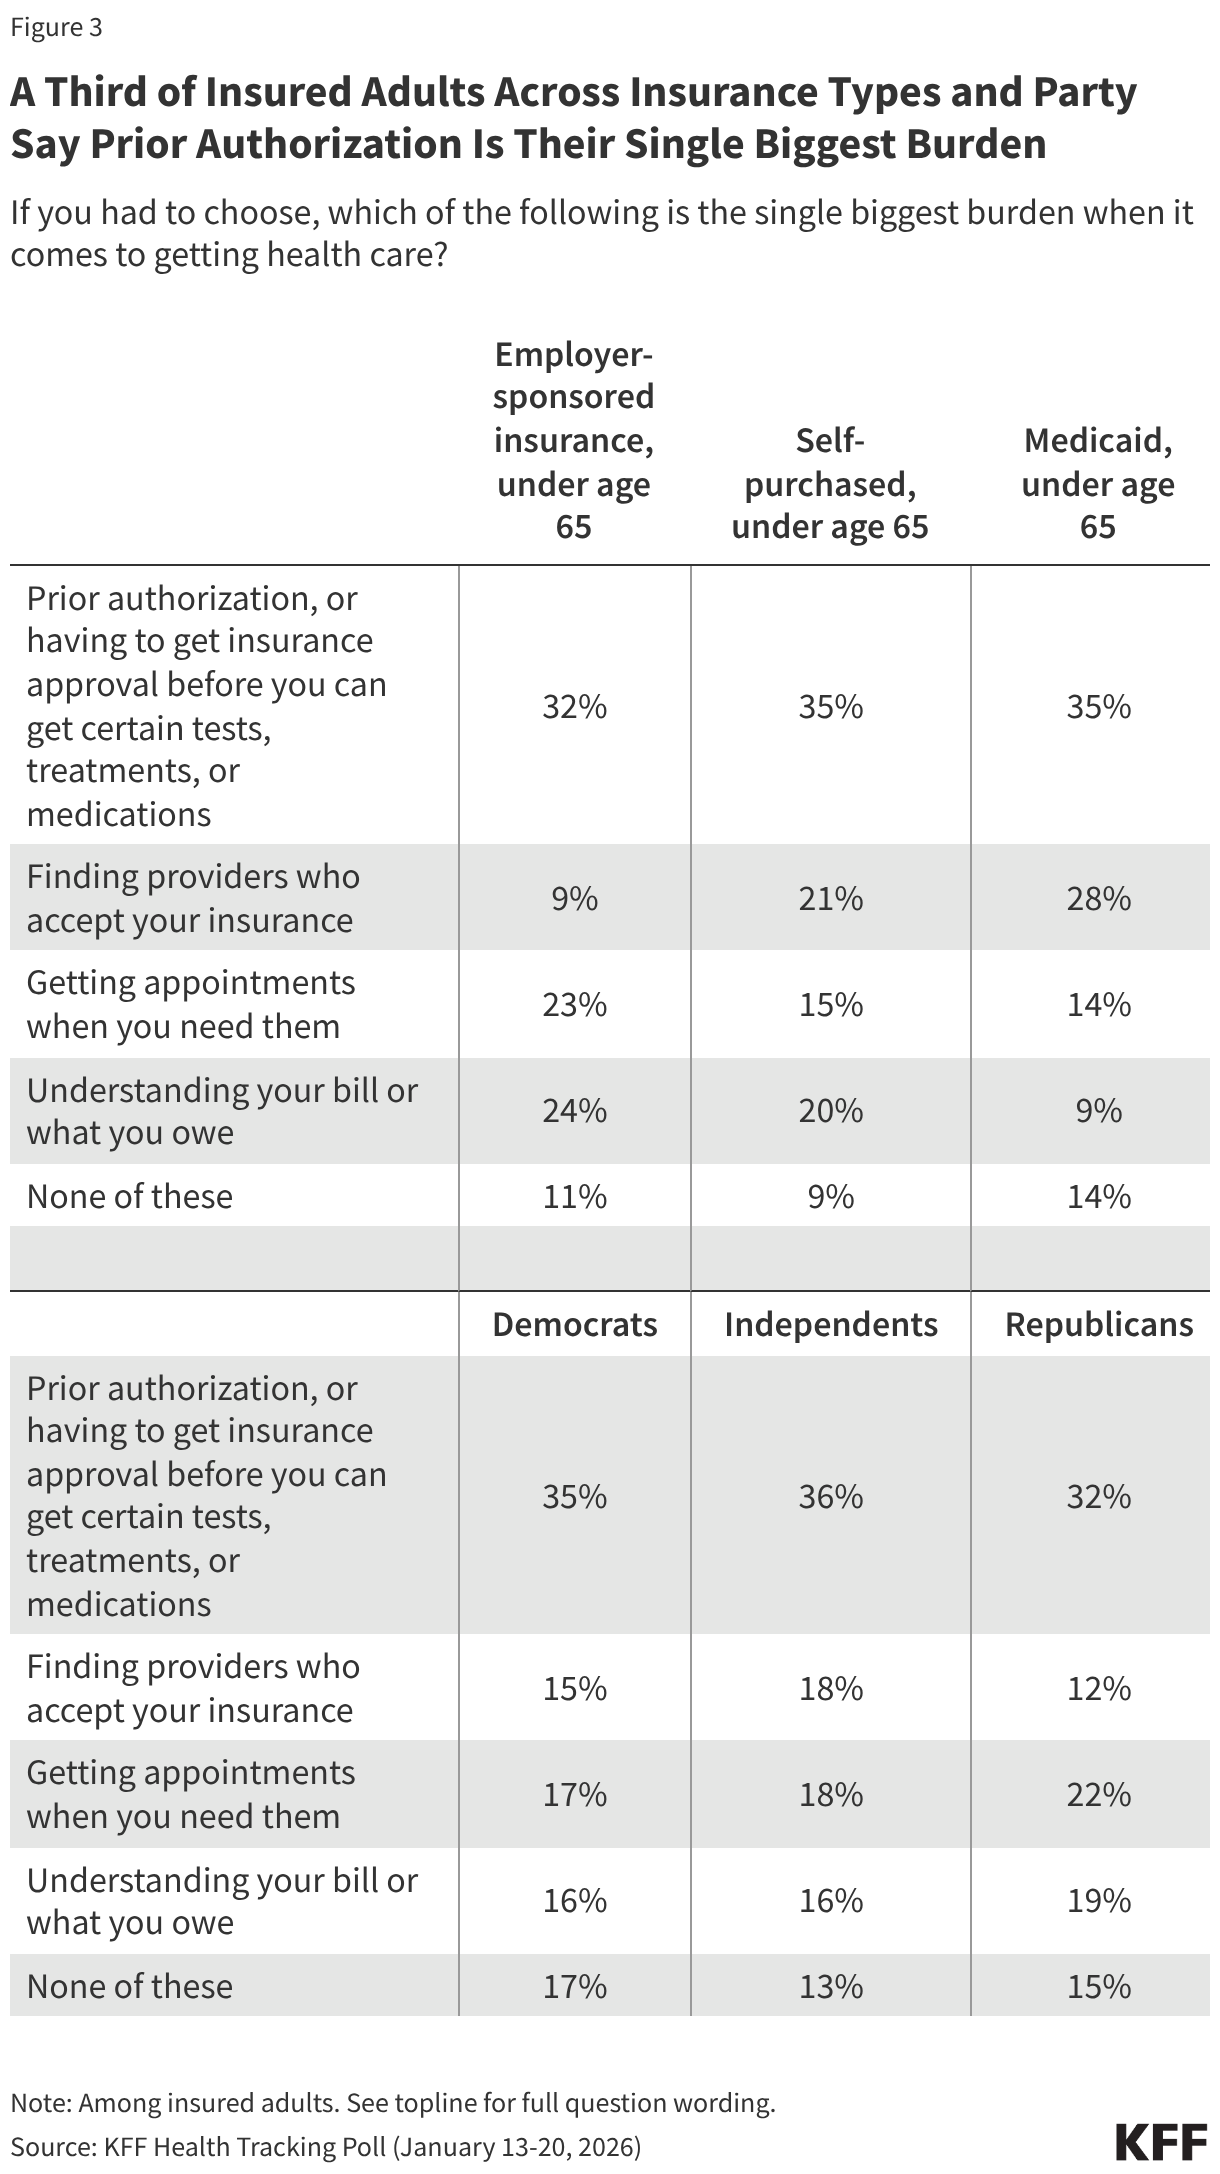
Prior authorization ranks as the single biggest burden for people with employer coverage and Medicaid, as well as those who buy their own coverage (largely through the Affordable Care Act’s Marketplaces).

During the prior authorization process, some treatments or medications recommended by a provider may be delayed and, in some instances, an insurance company may end up denying medication or treatment.

About half (47%) of insured adults – and a larger share (57%) of those with chronic conditions – say their access to a certain health care service, treatment, or medication has been denied, delayed, or altered in the past two years by their health insurer.

Among those who report such denials, delays, or alterations, about a third say it had a “major negative impact” on their mental health and emotional well-being (34%) and finances (33%), and a quarter say it had a “major negative impact” on their physical health (26%). This translates to about 1 in 5 of all adults with insurance saying that their mental or physical health, or finances, have been majorly impacted.

Designed and analyzed by public opinion researchers at KFF, this survey was conducted January 13-20, 2026, online and by telephone among a nationally representative sample of 1,426 U.S. adults in English and in Spanish. The margin of sampling error is plus or minus 3 percentage points for the full sample. For results based on other subgroups, the margin of sampling error may be higher.

Poll Finding

KFF Health Tracking Poll: Prior Authorizations Rank as Public’s Biggest Burden When Getting Health Care

Published: Feb 2, 2026

As the latest KFF Health Tracking Poll shows, affordability is the public’s biggest concern, with the cost of health care ranking as their top economic worry. However, KFF polls have demonstrated that beyond costs, insured people report a whole host of issues navigating the health care system. This report looks at which aspects of accessing care and health insurance are the biggest problem for insured adults and finds that prior authorizations – or the process of having to get insurance approval before accessing certain tests, treatments, or medications – are having an outsized impact on insured adults.

One in three insured adults in the U.S. say they find prior authorizations a “major burden” to getting health care. An additional four in ten (37%) say the process is a “minor burden,” bringing the total share of insured adults who find the process burdensome to about seven in ten (69%). This is larger than the share who say other aspects are burdensome such as understanding bills or what is owed (60%), getting needed appointments (60%), or finding providers who accept their insurance (53%).

Stacked bar chart showing how much of a burden insured adults believe certain aspects of getting health care are.

When asked to choose which aspect of getting health care, beyond costs, is the single biggest burden, one in three insured adults (34%) choose prior authorizations, followed by getting needed appointments (19%), understanding their bill (17%), or finding providers who accept their insurance (15%). The choice of prior authorizations as the single biggest burden is even more stark among adults with a chronic condition that requires ongoing medical treatment (about half of all adults). These individuals often require more treatments and medications, resulting in more interactions with health insurance companies and health care providers. Four in ten (39%) insured adults with a chronic condition say prior authorizations are the single biggest burden when it comes to getting health care, at least twice the share who say the same about the other aspects of health care asked about.

Split bar chart showing how much of a burden insured adults and insured adults with a chronic condition believe certain aspects of getting health care are.

Prior authorizations are also identified as the single biggest burden for insured adults across partisans, as well as among individuals across insurance types that typically require prior authorizations such as individuals with Medicaid, people who buy their own health insurance, and people who get health insurance through an employer. Notably, about three in ten (28%) Medicaid enrollees identify finding providers who accept their insurance as the biggest burden, but small shares identify other issues as their biggest burden.1

A table showing the single biggest health care burden named by insured adults, broken out by insurance type and by party identification.

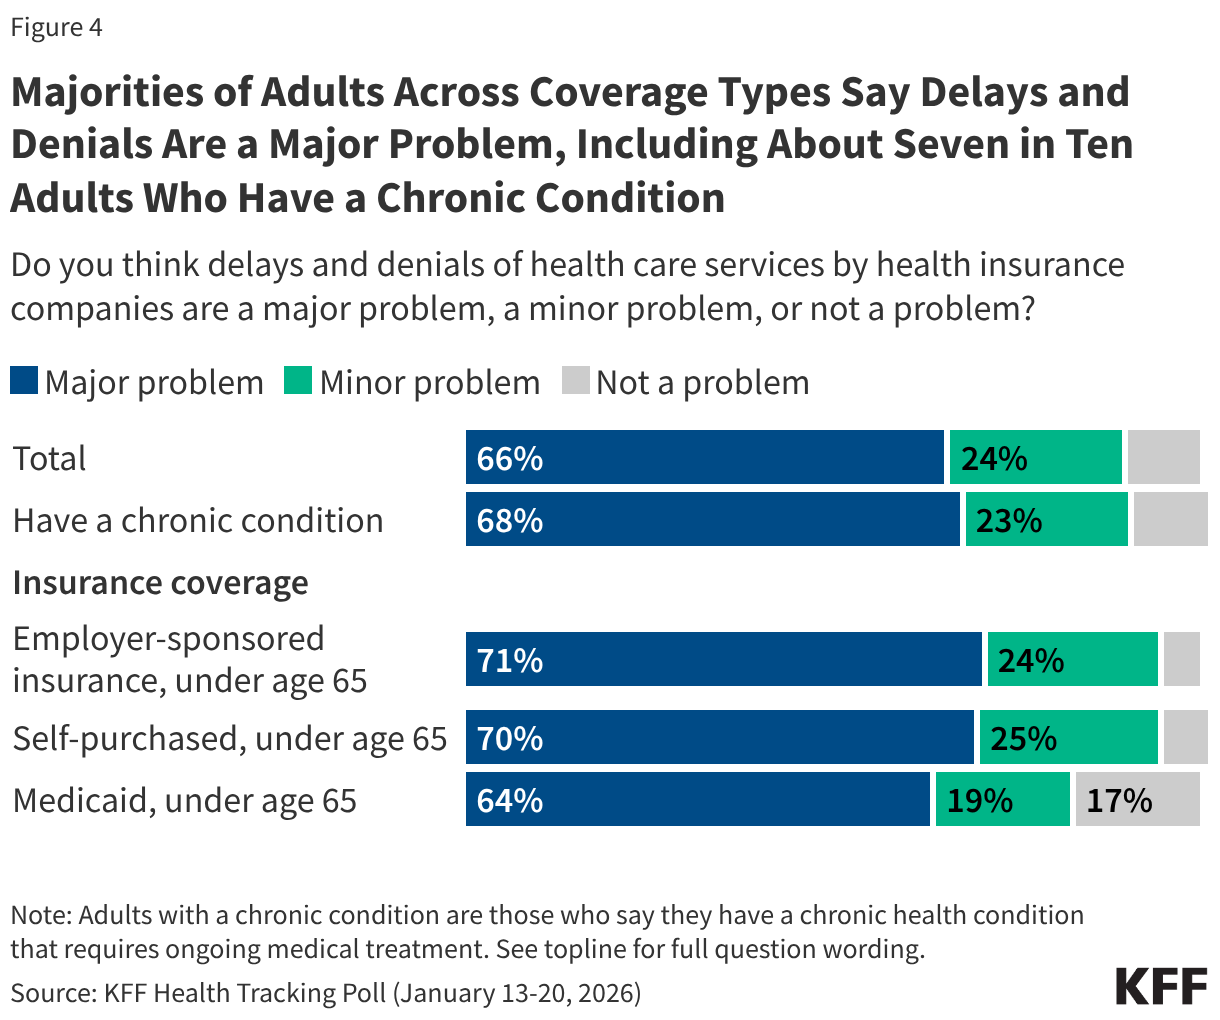
During the prior authorization process, some treatments or medications recommended by a provider may be delayed and, in some instances, an insurance company may end up denying medication or treatment. Overall, about two-thirds of adults say delays and denials of health care services by health insurance companies are a “major problem” with an additional one in four (24%) who say they are a “minor problem.” Just one in ten adults say delays and denials of services by insurance companies are not a problem in our current health care system.  More than six in ten across Medicaid enrollees, self-purchasers, and those with employer coverage say the delays and denials of care by insurance companies are a “major problem.”

A stacked bar chart showing how much of a problem adults view delays and denials of health care services by insurance companies.

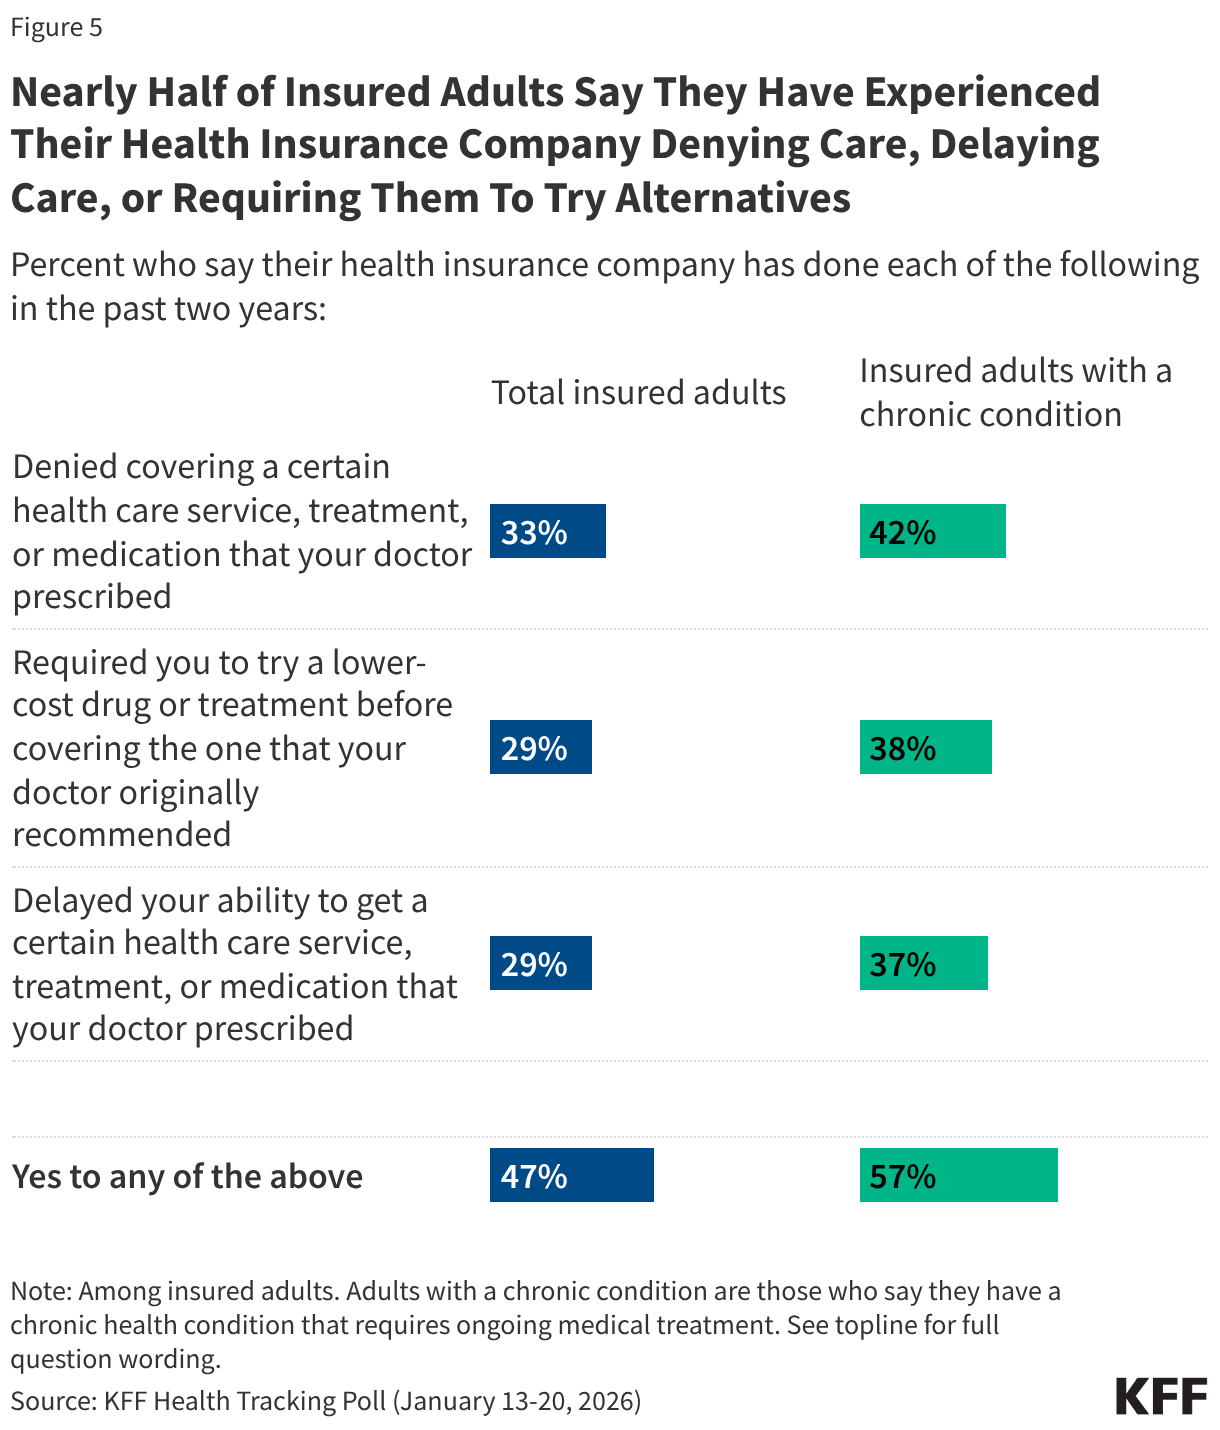
About one in three insured adults (33%) say they have had a health insurance company deny coverage for a certain health care service treatment, or medication prescribed by their doctor in the past two years. Three in ten insured adults say that a health insurance company has delayed their ability to get such services, treatments, or medications (29%) or required them to try a lower-cost drug or treatment before covering the one that was originally recommended by their provider (29%). These issues are even more common among insured adults with a chronic condition with about four in ten reporting that an insurance company has required them to try a lower-cost drug or treatment (38%), deny coverage for a certain service or medication (42%), or delayed their ability to get prescribed care (37%). Overall, nearly half (47%) of insured adults say they have had a certain service, treatment, or medication either denied or delayed in the past two years, rising to nearly six in ten (57%) among those with a chronic condition.

Split bar chart showing the share of insured adults and insured adults with a chronic condition who say they've experienced issues with their health insurance company.

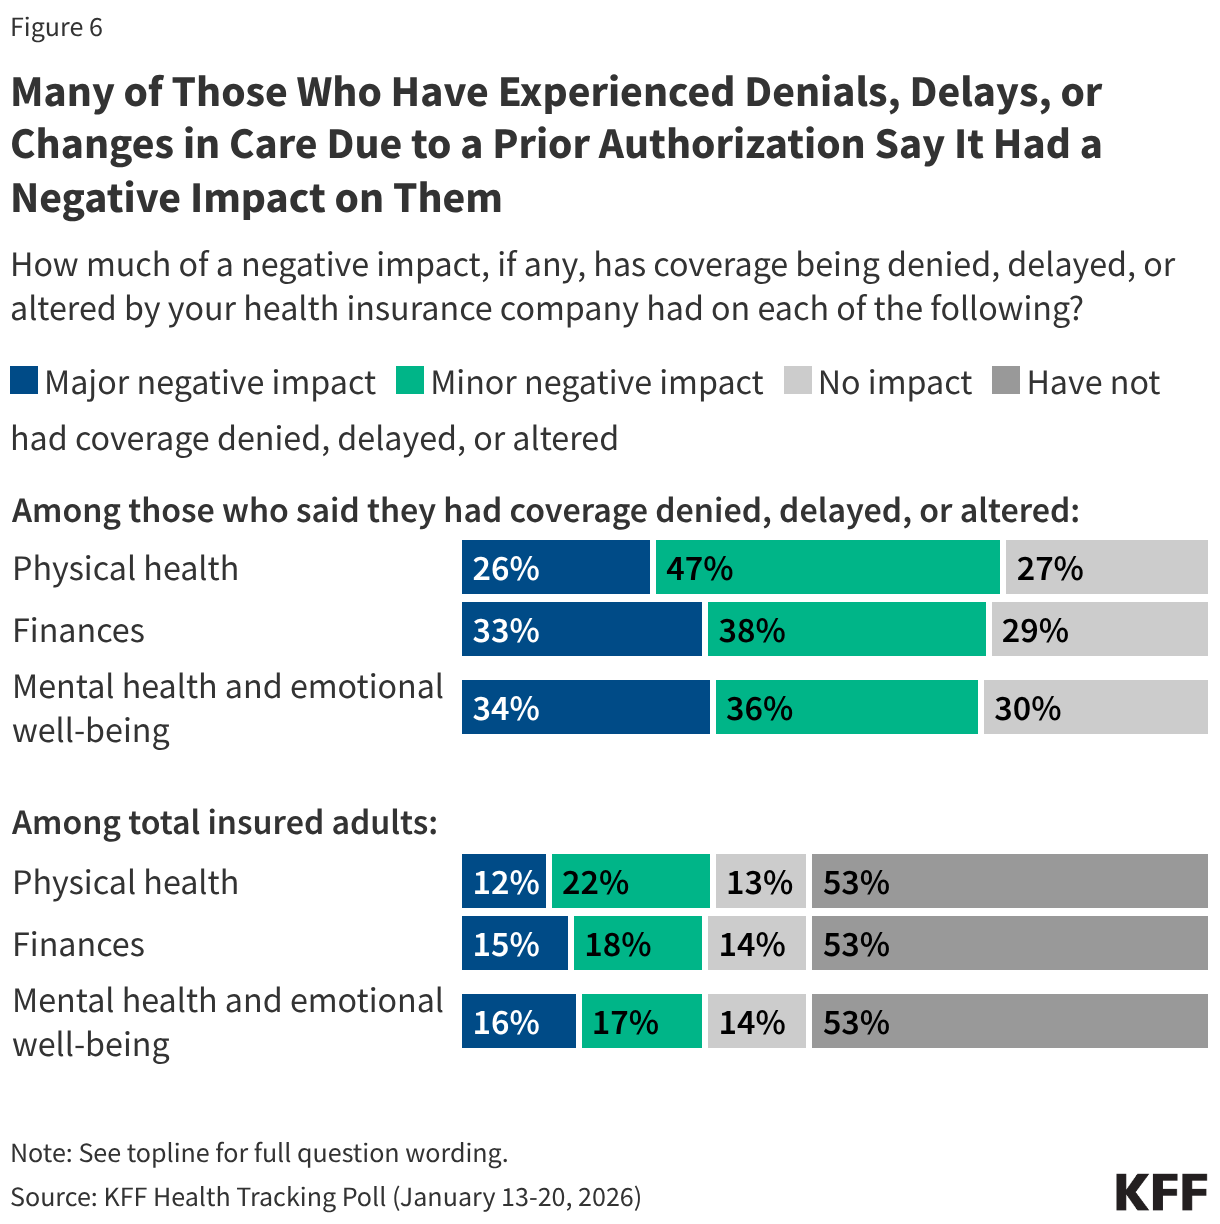
Denial and delays by health insurance companies can lead to negative consequences for people’s physical, mental, and financial health. One in three of those who experienced a denial or delay say the actions required by their health insurance company had a “major negative impact” on their mental health and emotional well-being as well as on their finances (about one in six of all insured adults).  One in four (one in eight of all insured adults) say the delays or denials has a “major negative impact” on their physical health.

A stacked bar chart showing how much of an impact issues with prior authorizations have had on insured adults, broken out by those who said they had previous experience with this and among total insured adults.


  1. Prior authorization is more common in Medicare Advantage than Traditional Medicare. Because this analysis is unable to break out individuals with traditional Medicare versus Medicare Advantage, we do not include Medicare as a subgroup in our analysis. These individuals are included in both the total group and the group with chronic conditions.  To learn more about prior authorizations for Medicare, more available at https://www.kff.org/medicare/medicare-advantage-insurers-made-nearly-53-million-prior-authorization-determinations-in-2024/. ↩︎

This KFF Health Tracking Poll/KFF Tracking Poll on Health Information and Trust was designed and analyzed by public opinion researchers at KFF. The survey was conducted January 13-20, 2026, online and by telephone among a nationally representative sample of 1,426 U.S. adults in English (n=1,355) and in Spanish (n=71). The sample includes 1,028 adults (n=60 in Spanish) reached through the SSRS Opinion Panel either online (n= 1,003) or over the phone (n=25). The SSRS Opinion Panel is a nationally representative probability-based panel where panel members are recruited randomly in one of two ways: (a) Through invitations mailed to respondents randomly sampled from an Address-Based Sample (ABS) provided by Marketing Systems Groups (MSG) through the U.S. Postal Service’s Computerized Delivery Sequence (CDS); (b) from a dual-frame random digit dial (RDD) sample provided by MSG. For the online panel component, invitations were sent to panel members by email followed by up to three reminder emails. 

Another 398 (n=11 in Spanish) adults were reached through random digit dial telephone sample of prepaid cell phone numbers obtained through MSG. Phone numbers used for the prepaid cell phone component were randomly generated from a cell phone sampling frame with disproportionate stratification aimed at reaching Hispanic and non-Hispanic Black respondents. Stratification was based on incidence of the race/ethnicity groups within each frame. Among this prepaid cell phone component, 149 were interviewed by phone and 249 were invited to the web survey via short message service (SMS). 

Respondents in the prepaid cell phone sample who were interviewed by phone received a $15 incentive via a check received by mail or an electronic gift card incentive. Respondents in the prepaid cell phone sample reached via SMS received a $10 electronic gift card incentive. SSRS Opinion Panel respondents received a $5 electronic gift card incentive (some harder-to-reach groups received a $10 electronic gift card). In order to ensure data quality, cases were removed if they failed two or more quality checks: (1) attention check questions in the online version of the questionnaire, (2) had over 30% item non-response, or (3) had a length less than one quarter of the mean length by mode. Based on this criterion, 2 cases was removed. 

The combined cell phone and panel samples were weighted to match the sample’s demographics to the national U.S. adult population using data from the Census Bureau’s 2025 Current Population Survey (CPS), September 2023 Volunteering and Civic Life Supplement data from the CPS, and the 2025 KFF Benchmarking Survey with ABS and prepaid cell phone samples. The demographic variables included in weighting for the general population sample are gender, age, education, race/ethnicity, region, civic engagement, frequency of internet use and political party identification. The weights account for differences in the probability of selection for each sample type (prepaid cell phone and panel). This includes adjustment for the sample design and geographic stratification of the cell phone sample, within household probability of selection, and the design of the panel-recruitment procedure. 

The margin of sampling error including the design effect for the full sample is plus or minus 3 percentage points. Numbers of respondents and margins of sampling error for key subgroups are shown in the table below. For results based on other subgroups, the margin of sampling error may be higher. Sample sizes and margins of sampling error for other subgroups are available on request. Sampling error is only one of many potential sources of error and there may be other unmeasured error in this or any other public opinion poll. KFF public opinion and survey research is a charter member of the Transparency Initiative of the American Association for Public Opinion Research. 

GroupN (unweighted)M.O.S.E.
Total1,426± 3 percentage points
 
Party ID
Democrats473± 6 percentage points
Independents483± 6 percentage points
Republicans367± 6 percentage points
  
MAGA Republicans/Rep leaners352± 6 percentage points
MAHA supporters618± 5 percentage points
Parents or guardians of children under 18 living in their household436± 6 percentage points
Poll Finding

5 Charts About Public Opinion on the Affordable Care Act

Published: Jan 30, 2026

Note: This resource was originally posted on February 22, 2024, and was most recently updated January 30, 2026, to include newer polling data on the public’s views of the ACA.

#1: Attitudes Toward the ACA Continue to Be More Favorable than Unfavorable, Divided Among Partisans

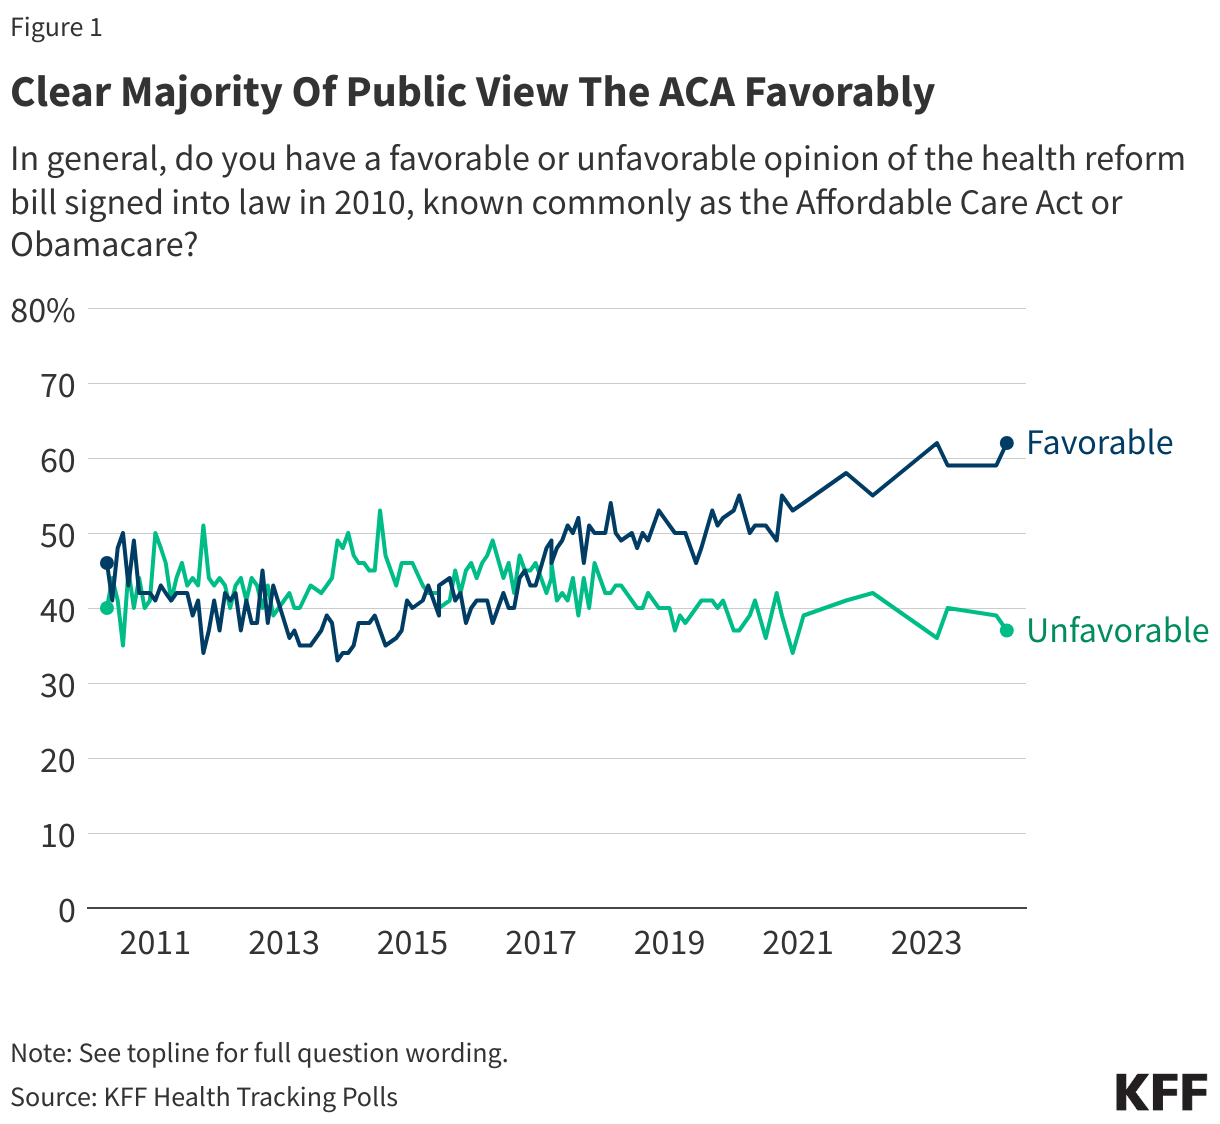
Public opinion of the Affordable Care Act (ACA) has been largely divided along partisan lines since the law was passed in 2010. Following Republican efforts to repeal the ACA in the summer of 2017, KFF Health Tracking Polls show an uptick in overall favorability towards the law, and since then, a larger share has held a favorable than an unfavorable view. In early 2026, about six in ten adults (58%) say they hold a favorable opinion of the ACA while about four in ten (41%) hold a negative opinion of the law. Views of the ACA are still largely driven by partisanship; about nine in ten Democrats (91%) along with six in ten independents (62%) view the law favorably, while about three-fourths of Republicans (77%) hold unfavorable views. Explore more demographic breakdowns using KFF’s interactive: The Public’s Views on the ACA.

Line chart showing percent of adults over time who say they have a favorable or an unfavorable opinion of the Affordable Care Act. Results shown from April 2010 to February 2024.

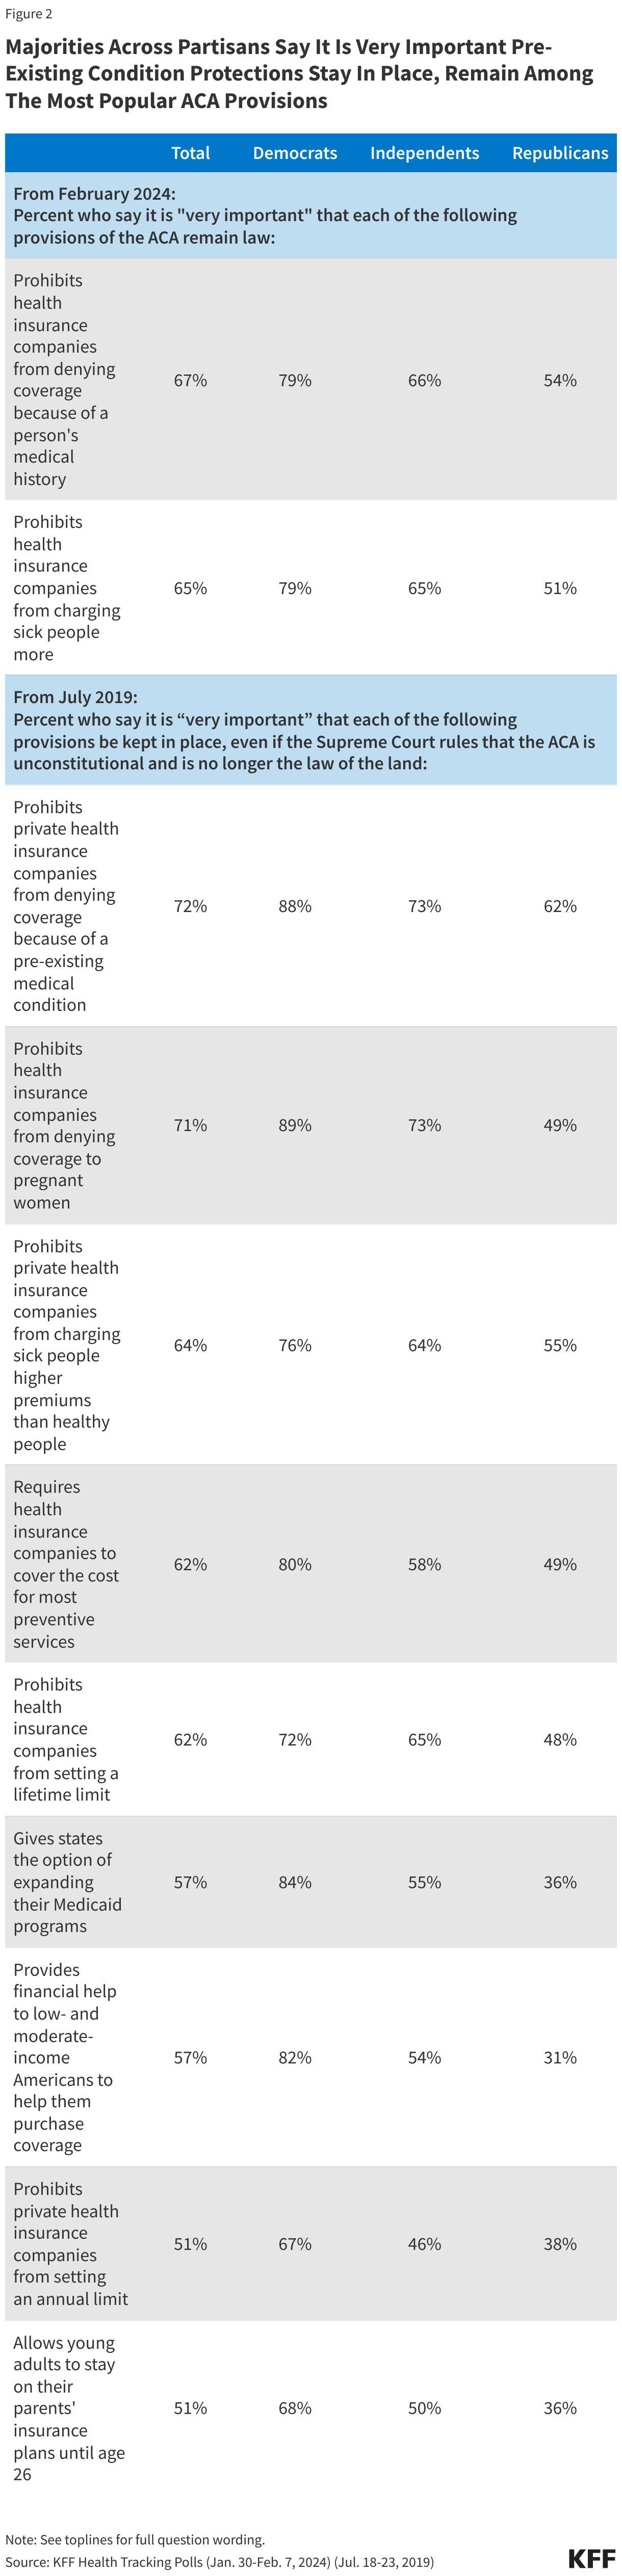
The ACA has been the subject of both legal challenges and Congressional actions aimed at overturning the 2010 health care law. However, many of the specific provisions included in the law are popular and the public would like them to remain.

For example, the 2020 California v. Texas case challenged the legality of the individual mandate and brought special attention to the law’s protections for people with pre-existing medical conditions. These provisions prohibit insurance companies from denying coverage based on a person’s medical history (known as guaranteed issue) and prohibit insurance companies from charging those with pre-existing conditions more for coverage (known as community rating). As of February 2024, two-thirds of the public say it is “very important” for the guaranteed issue (67%) and community rating (65%) provisions to remain law, including majorities of Democrats and independents. About half of Republicans say each of these protections for people with pre-existing conditions are “very important.” Historically, majorities also say it is very important for many of the other ACA provisions to be kept in place, even if the Supreme Court ruled the ACA unconstitutional and no longer the law of the land.

Though majorities say it is very important for guaranteed issue to remain law, knowledge that this provision is part of the ACA has dropped over the past 14 years. As of February 2024, about four in ten (39%) adults are aware that the ACA prohibits insurance companies from denying coverage based on a person's medical history, compared to seven in ten adults in June 2010, shortly after the ACA’s inception.

Table showing percent of adults who say it is "very important" that specific Affordable Care Act provisions remain in place. Results shown by total adults and party identification.

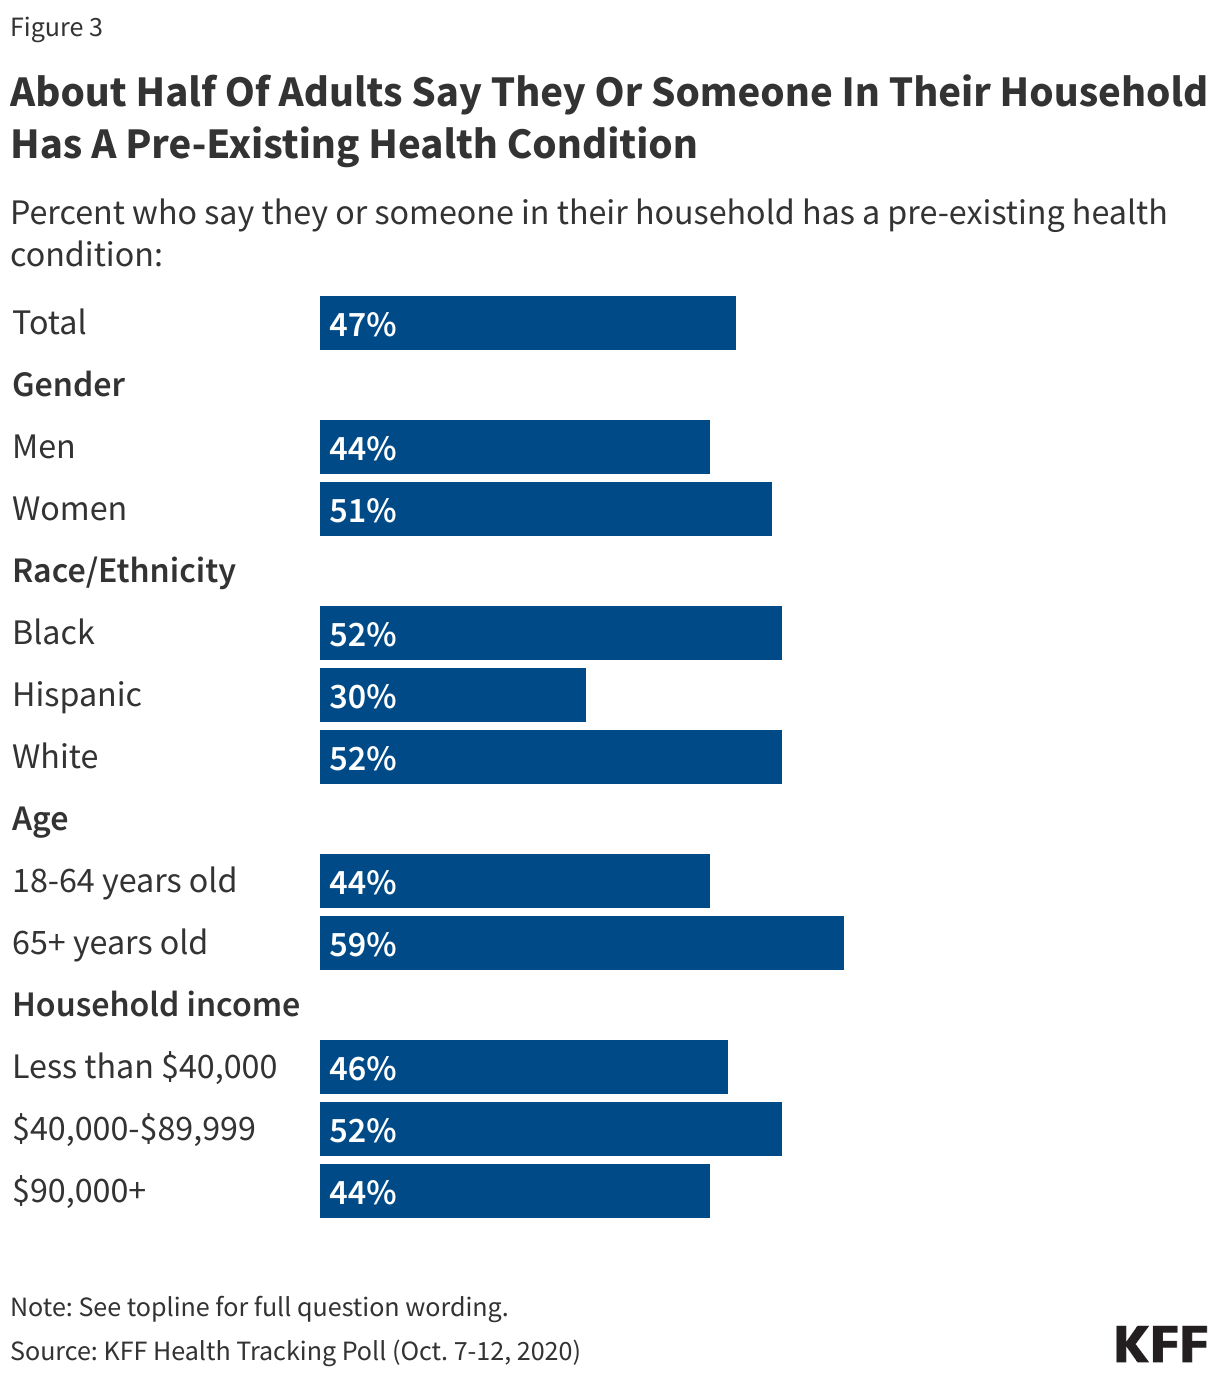
#3: Pre-Existing Condition Protections Affect Large Shares of the Public

One reason why majorities across partisans may support the ACA’s protections for people with pre-existing medical conditions is that large shares of the public, regardless of age, gender, racial or ethnic identity, and income report having someone with a pre-existing condition in their household. A KFF analysis estimates that 27% of adults ages 18-64 have a pre-existing condition that would have led to a denial of insurance in the individual market prior to the implementation of the ACA. An even larger share of the public believes they or someone in their family may belong in this category. According to the KFF polling data from 2020, about half of the public say they or someone in their household suffers from a pre-existing medical condition, such as asthma, diabetes, or high blood pressure.1 

Bar chart showing percent of adults who say they or someone in their household has a pre-existing health condition. Results shown by total adults, gender, race and ethnicity, age, and household income.

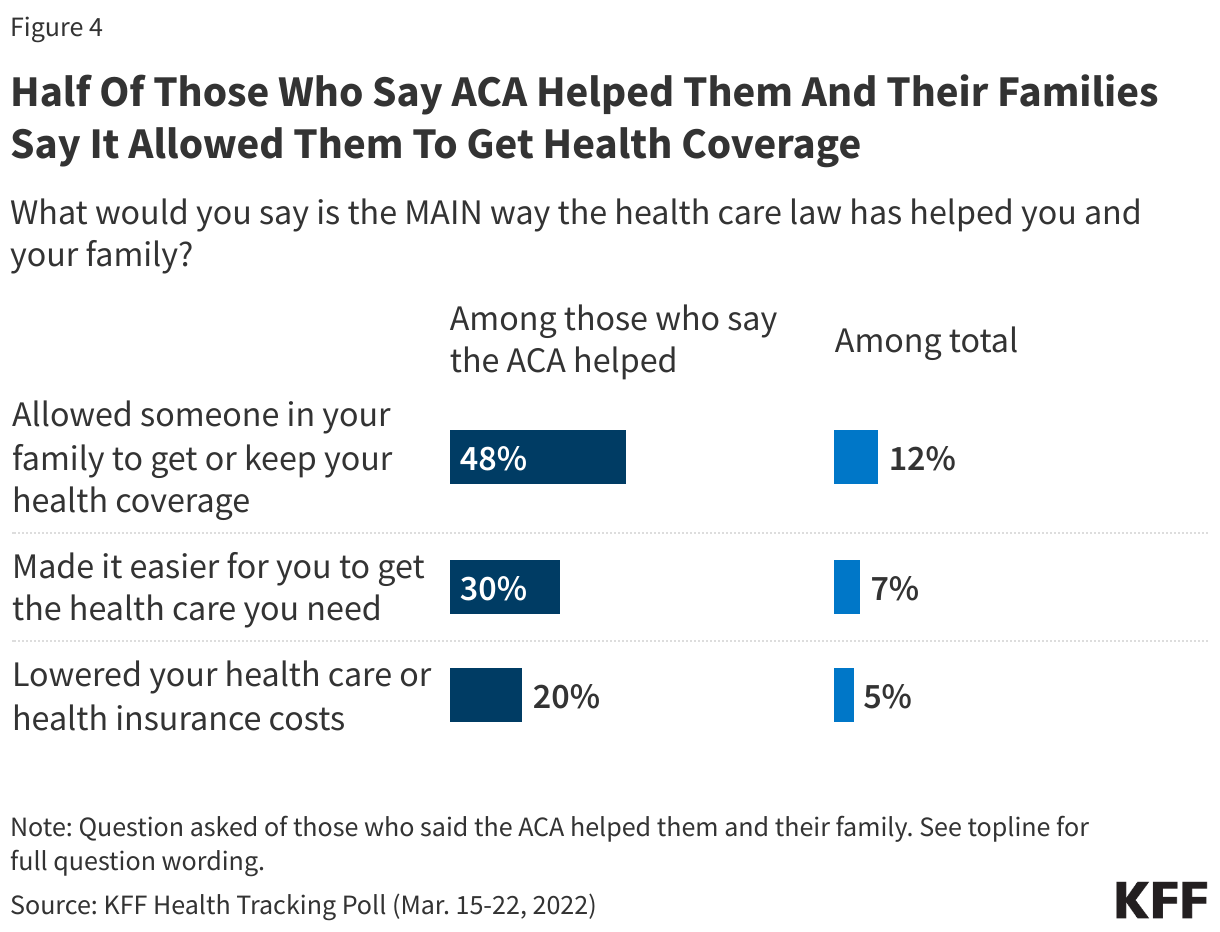
#4: Those Who Say the ACA Has Helped Them Cite Increasing Access

KFF polling from March 2022 shows about a quarter of the public says the ACA has helped them and their family in some way, while one in five say the law has hurt them. About half of those who say the ACA helped them say allowing someone in their family to get or keep their health coverage has been the main way the health care law has helped them (48%, or 12% of total adults). Three in ten say the law has made it easier for them to get the health care they need (7% of total) and one in five say it has lowered the cost of their health care or health insurance (5% of total).

Split bar chart showing percent of adults who say specific items were the main way the Affordable Care Act helped them and their family. Results shown among those who say the ACA helped them and among total adults.

The February 2024 Health Tracking Poll also reveals four in ten (39%) adults say the ACA has made it easier for people like them to get health insurance, while about one in four (23%) say it has made it more difficult. However this perception varies by partisanship, as Democrats are almost three times as likely as Republicans (60% v. 22%) to say the ACA has helped them in this way.

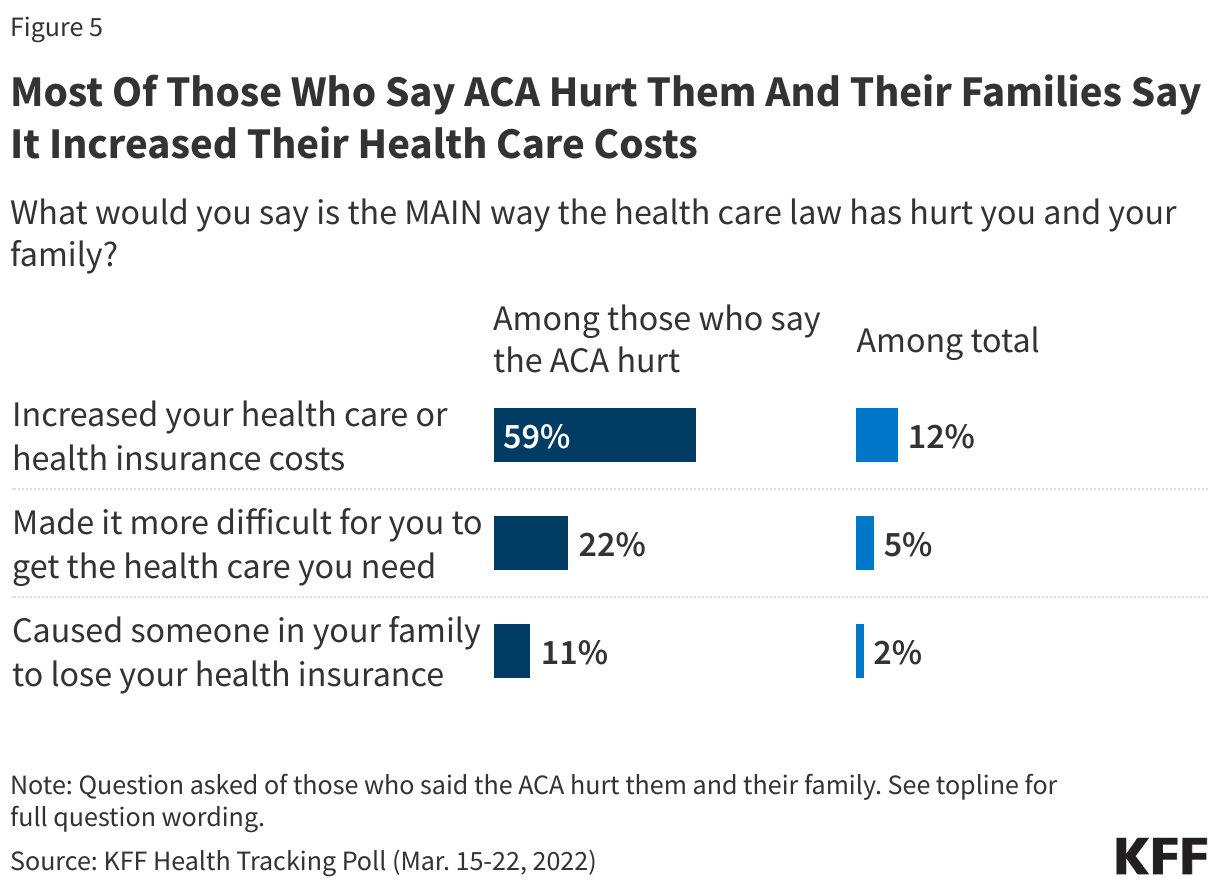
#5: Those Who Say the ACA Has Hurt Them Cite Costs

Among the one in five U.S. adults who say the ACA has hurt them and their families, most say the law has increased costs of health care or health insurance (59%, 12% of total). Smaller shares say it has made it more difficult to access care (22%, 5% of total), or caused someone in their family to lose coverage (11%, 2% of total). The high costs of health care in this country continue to be a major burden for many families.

Split bar chart showing percent of adults who say specific items were the main way the Affordable Care Act hurt them and their family. Results shown among those who say the ACA hurt them and among total adults.
  1. This estimate is a household measure of all groups and does not classify pre-existing conditions by whether they are or not a “deniable” condition. See the KFF Health Tracking Poll October 2020 topline for full question wording and details. ↩︎

Recent Trends in GLP-1 Use and Spending in Medicare

Published: Jan 30, 2026

Ahead of the Trump administration’s planned expansion of Medicare coverage for GLP-1s to treat obesity through temporary models and the availability of Medicare’s negotiated price for certain GLP-1 products beginning in 2027, new data from the Centers for Medicare & Medicaid Services (CMS) shows that use and spending for these drugs under Medicare has grown substantially in recent years, reflecting their demonstrated effectiveness at treating type 2 diabetes and other conditions. Medicare currently covers GLP-1s for type 2 diabetes, cardiovascular disease, and sleep apnea, but coverage for weight loss drugs is prohibited by law, even as GLP-1s have proved to be highly effective for this purpose (and even cost-effective, according to a recent analysis).

To address this gap in coverage for GLP-1s to treat obesity, CMS is launching a model called BALANCE (Better Approaches to Lifestyle and Nutrition for Comprehensive hEalth) under which CMS will negotiate pricing and coverage rules for GLP-1s, with the aim of expanding access to these medications and lifestyle interventions to support weight loss. The model, beginning in 2026 for Medicaid and 2027 for Medicare, is voluntary for drug manufacturers, state Medicaid programs, and Medicare Part D plans.

This analysis examines CMS’s Medicare Part D claims data from 2019 to 2024 to document the increase in the number of beneficiaries being treated with GLP-1 drugs and the growth in Medicare spending and claims for GLP-1s. Expansion of coverage under Medicare of GLP-1s to treat obesity under the BALANCE model is likely to increase utilization above current levels, as Medicare begins to meet the demand for obesity drugs among beneficiaries who have been unable to access or afford these medications to date. At the same time, the availability of Medicare’s lower negotiated price for certain GLP-1 products under the Medicare Drug Price Negotiation Program (semaglutide beginning in 2027 and dulaglutide beginning in 2028) could mitigate the increase in Medicare spending that could come about from ongoing and expanded use of these medications.

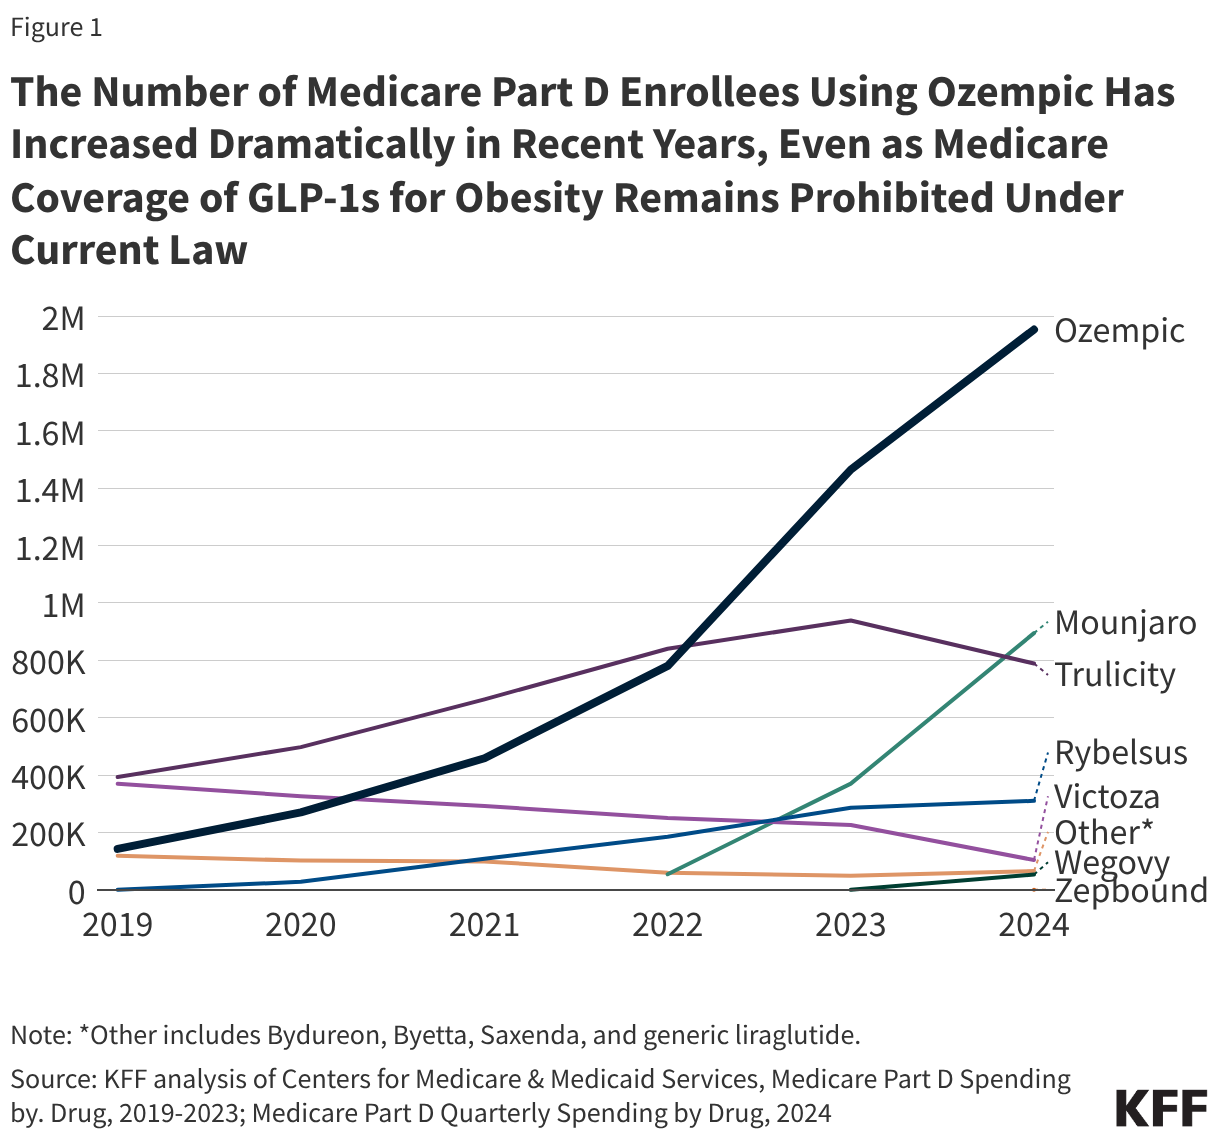
Ozempic Was Used by Two Million Medicare Part D Enrollees in 2024, Up from Fewer Than 150,000 in 2019

Semaglutide, the GLP-1 drug branded as Ozempic, Rybelsus, and Wegovy, was the most used GLP-1 in 2024. Two million Part D enrollees took Ozempic, which was approved by the FDA in 2017 to treat type 2 diabetes, up from fewer than 150,000 in 2019 (Figure 1). Nearly 1 million Part D enrollees took Mounjaro, approved in 2022 for type 2 diabetes, up from 54,000 in 2022. This increase reflects a pattern of growing use of newer GLP-1s, such as Ozempic and Mounjaro, while use of older products, such as Byetta (approved in 2005), Victoza (approved in 2010), and Trulicity (approved in 2014), has declined. While most GLP-1 drugs are currently available as injections, the introduction of new oral formulations, which could be easier for patients to take, could result in additional shifts in utilization among GLP-1s.

The Number of Medicare Part D Enrollees Using Ozempic Has Increased Dramatically in Recent Years, Even as Medicare Coverage of GLP-1s for Obesity Remains Prohibited Under Current Law (Line chart)

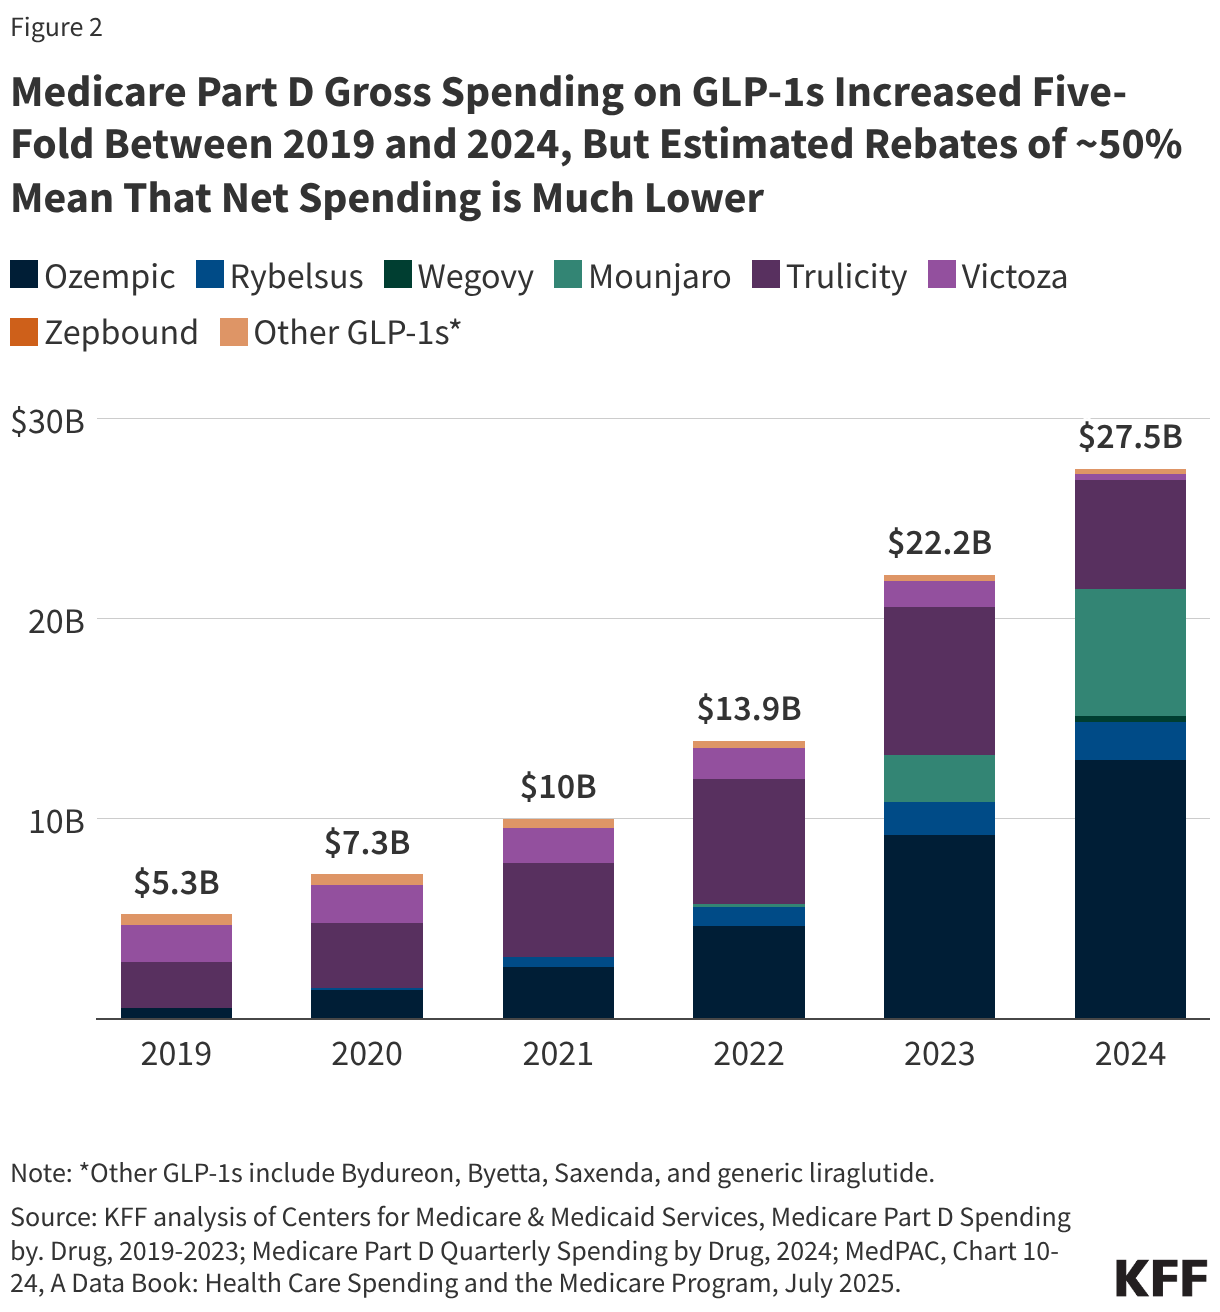
Medicare Part D Gross Spending on GLP-1s Increased Five-Fold Between 2019 and 2024, But Estimated Rebates of Around 50% Mean That Net Spending is Much Lower

Gross Medicare Part D spending on GLP-1s in 2024 (not accounting for rebates) totaled $27.5 billion, a five-fold increase from 2019, reflecting an expansion in use of GLP-1s with more recent FDA approvals for type 2 diabetes. (FDA approvals of Wegovy for cardiovascular disease and Zepbound for sleep apnea occurred in 2024 and therefore these uses are likely not reflected in Part D data through 2024.) More than half of gross spending in 2024 was on semaglutide products (Ozempic, 47%; Rybelsus, 7%; Wegovy, 1%) and nearly one fourth (23%) was for Mounjaro. Gross spending overstates the true cost of these products to the Medicare program, however. According to estimates from MedPAC, negotiated rebates for diabetic therapy were equal to or greater than 50% in 2023. Assuming rebates of 50% across all GLP-1 products in 2024 would mean net spending of around $14 billion in 2024.

Medicare Part D Gross Spending on GLP-1s Increased Five-Fold Between 2019 and 2024, But Estimated Rebates of ~50% Mean That Net Spending is Much Lower (Stacked column chart)

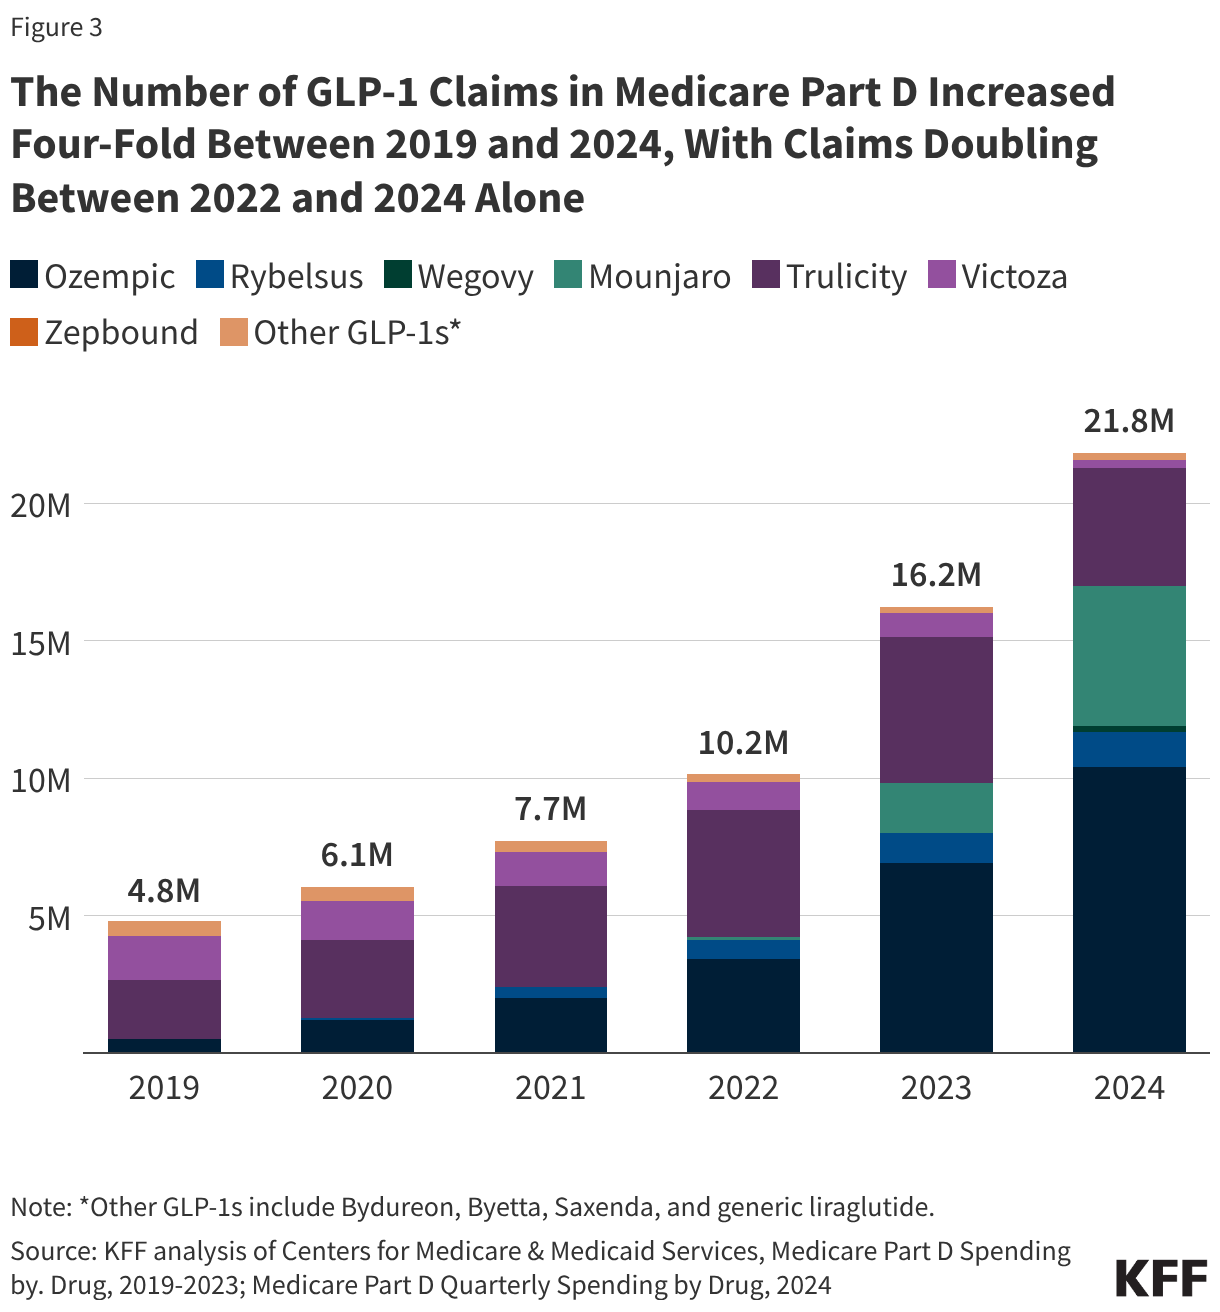
Claims for GLP-1s Increased Four-Fold Between 2019 and 2024

In accordance with an increase in both the number of Medicare Part D enrollees using GLP-1s and spending on these products, the number of claims for GLP-1s increased four-fold between 2019 and 2024, from 4.8 million to 21.8 million, with claims doubling between 2022 and 2024 alone. More than 10 million claims for Ozempic were submitted in 2024, up from 524,000 in 2019 (an 82% average annual growth rate) and another 5.1 million for Mounjaro, up from 122,000 in 2022 (average annual growth of 549%).

The Number of GLP-1 Claims in Medicare Part D Increased Four-Fold Between 2019 and 2024, With Claims Doubling Between 2022 and 2024 Alone (Stacked column chart)

This work was supported in part by Arnold Ventures. KFF maintains full editorial control over all of its policy analysis, polling, and journalism activities.