How Does Health Spending in the U.S. Compare to Other Countries?

Published: Apr 10, 2025

Relative to the size of its economy, the U.S. spends a greater amount on health care than other high-income nations. And while the U.S. has long had higher than average health spending, recent years have seen higher spending growth in peer nations. This chart collection compares health care spending in the U.S. and other OECD countries that are similarly large and wealthy, using data from the OECD Health Statistics database.

The slideshow is available through the Peterson-KFF Health System Tracker, an online information hub dedicated to monitoring and assessing the performance of the U.S. health system.

Health Spending Issues to Watch This Year

Authors: Emma Wager, Lynne Cotter, Cynthia Cox, Sarah Berk, Mairin Mancino, and Julia Harris
Published: Apr 10, 2025

The cost of health care in the United States has continued to grow in recent years. Between 2022 and 2023, overall health spending rose 7.5%, and it is projected to rise another 4.2% in 2025.

A new issue brief authored by KFF and the Peterson Center on Healthcare examines market trends contributing to rising health costs and identifies several potential federal and state policy issues to watch throughout 2025, including high-cost drugs, federal funding cuts, and workforce shortages.

This brief is available through the Peterson-KFF Health System Tracker, an online information hub dedicated to monitoring and assessing the performance of the U.S. health system.

VOLUME 20

Fluoride Bans and Food Safety Doubts


Summary

This Monitor covers how fears about fluoride as a neurotoxin are impacting public health and how trust in food safety is eroding following the USDA’s disbandment of two food safety panels. It also discusses approaches to addressing false information and the accuracy of AI chatbots, like ChatGPT, in answering health questions compared to traditional search engines.


Recent Developments

CDC and EPA Will Re-Evaluate Water Fluoridation Recommendations as Communities Push to Ban Fluoride

Source: KFF Health News

On April 7, Health and Human Services (HHS) Secretary Robert Kennedy Jr., a fluoridation skeptic, announced that he is assembling a task force of health experts to study fluoride and will ask the Centers for Disease Control (CDC) to change its water fluoridation recommendation. At the same time, the Environmental Protection Agency (EPA), which regulates fluoride levels in public water systems, said it will review new evidence on the health effects of water fluoridation. Fluoride, a naturally occurring mineral, was first added to public water in Grand Rapids in 1945 to prevent tooth decay and has since spread to around 70% of the U.S. population. The CDC, American Dental Association, and the American Academy of Pediatrics support adding fluoride to drinking water to prevent cavities, and multiple studies have shown that water fluoridation reduces tooth decay by about 25% in children and adults.

Opponents of water fluoridation have linked the practice to illnesses without scientific backing for decades, including bone cancer and AIDS. Public debate over fluoride was reignited last September when a federal judge in California ordered the Environmental Protection Agency (EPA) to regulate fluoride in drinking water over concerns of cognitive effects on children. More recently, a January review published in JAMA Pediatrics found that as fluoride exposure increased, children’s IQ tended to decrease. The authors note that most of the studies they reviewed were from countries where the fluoridation level far exceeded the United States’ recommended level of 0.7 milligrams per liter, and, according to the review, no studies of fluoride exposure and children’s IQ have been performed in the United States.

Fears that fluoride is a neurotoxin are contributing to efforts to ban it. In March, Utah became the first state to ban fluoride in public drinking water under a new law that will take effect on May 7, and dozens of other cities and local governments are considering similar actions. However, dentists and researchers warn that ending community fluoridation, especially in rural communities where dental care access is more limited, could risk exacerbating this lack of access. More than 150 towns and counties have voted to end fluoridation since 2010, and 14 states this year have considered or are considering ending fluoride mandates or banning fluoridation. According to a KFF Health News analysis, at least 230 counties face dentist shortages and mostly or completely unfluoridated drinking water.

Polling Insights:

A January KFF tracking poll found that about four in ten adults say they have a great deal or a fair amount of trust in Secretary Robert F. Kennedy Jr. (43%). However, there are large partisan differences in trust. Few Democrats express trust in health recommendations from Secretary Kennedy (7%), whereas among Republicans, about eight in ten say they trust Secretary Kennedy (81%). Notably, Republicans are as likely to say they trust Secretary Kennedy as they are to trust their own doctors (84%) to make the right recommendations on health issues.

About Four in Ten Adults, Including Eight in Ten Republicans Trust Secretary Kennedy to Make the Recommendations on Health Issues

Shifts in Public Confidence in Food Safety after USDA Disbands Two Safety Panels

Nitat Termmee / Getty Images

The USDA’s decision to disband two advisory panels on food safety in March prompted a sharp uptick in online discussion, reflecting both genuine concern and emerging misinformation. Between March 5 and March 11, there were approximately 9,000 news articles, social media posts, and comments mentioning the committees. Most of these posts expressed concern that the elimination of these committees would lead to more foodborne illnesses. However, some posts and comments, primarily on Instagram, responded to these fears by misleadingly claiming that a plant-based diet prevents foodborne illness entirely. While animal products are more likely to be contaminated with bacteria and viruses that can cause foodborne illness, plant products can also be contaminated. A CDC study looking at the origins of foodborne illness outbreaks in the U.S. found that produce contributed to 46 percent of cases. This nuance is often lost in posts promoting plant-based diets as completely risk-free.

The response to the USDA’s decision reflects a broader decline in trust in the government’s ability to ensure food safety. In recent years, public concern about food additives and ingredients such as seed oils and artificial coloring has grown, sometimes fueled by false or overstated claims that misrepresent their risks.

Training to Identify False Health Information Builds Resilience, but Follow-Up Reminders Are Needed for Long-Term Impact

champpixs / Getty Images

The rapid spread of false or misleading claims on social media makes it difficult for fact-checkers to keep up as new versions of persistent narratives quickly resurface during high-profile health policy and news events. Many health communicators work with limited time and resources, and reactive debunking alone may not keep up with the scale and speed of misinformation. Instead, building resilience to false or misleading information by training people on how to recognize and reject false information before they encounter it may offer a more sustainable approach. However, resilience requires reinforcement, as people forget what they’ve learned, and repeated exposure to falsehoods makes them seem more believable over time – a phenomenon known as the “illusory truth effect.” A study published in Nature Communications finds that using “booster” messages – follow-up reminders that repeat key lessons – can strengthen people’s ability to recognize false or misleading information after their initial training. The researchers used either an article, a video, or a game to train people to recognize and reject false information. They found that the article and video had the longest-lasting effects, but resilience lasted longer when participants received a refresher. These findings suggest that, without reinforcement, communicators and educators risk losing the impact of their initial intervention. Even with limited resources, adding brief follow-up messages can help sustain the impact of health literacy interventions over time in a complicated information environment.

Efforts to fact-check health information are further complicated by a lack of agreement about what counts as false health information. For example, KFF’s 2023 Health Misinformation Pilot Poll asked adults to cite COVID-19 misinformation they had encountered and found that many examples directly contradicted each other – what one person considered misinformation, another considered accurate. Instead of combatting misinformation directly, it may be more effective to focus on common goals that can bring people together and improve the way trusted messengers communicate. One study in the HKS Misinformation Review suggests that rather than simply labeling claims as “misinformation,” health communicators and educators should consider why people disagree in the first place. The authors explain that false information often spreads because of deeper differences in values, identities, or ways of understanding the world, not just gaps in knowledge. Health communicators and educators can address these deeper differences by creating respectful conversations that explore the emotional, cultural, and social context that underlie people’s beliefs. This might involve focusing on shared concerns, like protecting loved ones or keeping communities healthy, rather than simply pointing out what’s true or false. While this approach may be more complex and slower than fact-checking alone, the study from HKS Misinformation Review suggests that it is likely to build more trust and lead to longer-term changes in how people engage with health information.


AI & Emerging Technology

Half of Adults Trust AI Chatbots to Provide Reliable Information About Practical Tasks, Technology; Fewer Trust Their Reliability for Health  and Political Information

A 2024 KFF poll found that while most adults reported regularly using search engines for health information and advice on a weekly basis, few (13%) said they regularly used AI chatbots for this purpose. Additionally, 70% of adults say they trust AI chatbots “not too much” or “not at all” to provide them with reliable health information. A recent study published in Nature Digital Medicine, however, suggests that LLMs may provide more accurate results than traditional search engines. Search engines, like Google or Bing, work by indexing large amounts of web content and ranking results based on keywords and popularity, often directing users to existing websites. LLMs, on the other hand, are trained on large datasets and generate original responses based on patterns in the data, rather than retrieving exact matches from the web. Unlike search engines, which display a list of sources, LLMs typically present a single answer, which can feel more direct but may also hide the reasoning or sources behind it. The study found that search engines share correct answers 50-70% of the time, with 10-15% of top-ranked results containing harmful advice. In contrast, LLMs generally outperformed the search engines, although they still provided incorrect answers, particularly with poorly framed prompts.

As AI continues to shape the health information landscape, traditional search engines are integrating more AI capabilities. For example, Google’s AI Overviews provide AI-generated summaries at the top of search queries, although their accuracy can vary. These summaries are powered by LLM-like technology, blending the retrieval functions of a search engine with the generative abilities of a chatbot. More recently, Google introduced the “What People Suggest” feature, which uses AI to collect and present comments from patients with similar health conditions to help users understand how others have described their experiences. However, relying on the experiences of others may impact the quality of the information provided, as it introduces subjective perspectives that may not always align with medical evidence or expert advice.

About The Health Information and Trust Initiative: the Health Information and Trust Initiative is a KFF program aimed at tracking health misinformation in the U.S., analyzing its impact on the American people, and mobilizing media to address the problem. Our goal is to be of service to everyone working on health misinformation, strengthen efforts to counter misinformation, and build trust. 


View all KFF Monitors

The Monitor is a report from KFF’s Health Information and Trust initiative that focuses on recent developments in health information. It’s free and published twice a month.

Sign up to receive KFF Monitor
email updates


Support for the Health Information and Trust initiative is provided by the Robert Wood Johnson Foundation (RWJF). The views expressed do not necessarily reflect the views of RWJF and KFF maintains full editorial control over all of its policy analysis, polling, and journalism activities. The Public Good Projects (PGP) provides media monitoring data KFF uses in producing the Monitor.

Ending the HIV Epidemic (EHE) Funding Tracker

Authors: Lindsey Dawson, Tenzin Dhondup, and Jennifer Kates
Published: Apr 8, 2025

The “Ending the HIV Epidemic Initiative” (EHE), is a federal effort to reduce new HIV infections in the United States, launched by the first Trump administration in 2019, with the goal of a 75% reduction in five years and 90% reduction in ten years. The EHE built on earlier efforts made by the Obama administration and was continued throughout the Biden administration.

The initiative has focused on a subset of “Priority Jurisdictions”, comprised of the 48 counties in the U.S. that had the largest number of HIV diagnoses (in 2018), as well as San Juan, Puerto Rico, Washington D.C., and 7 states with a substantial share of rural HIV cases (see Figure 1). It also has been accompanied by additional federal funding, including reprogrammed funding in FY 2019 and new Congressional appropriations in FY 2020 through FY 2025. Still, this additional funding accounts for a relatively small share of overall federal HIV funding provided to state and local jurisdictions.

While the second Trump administration has not explicitly stated its plans for EHE, a leaked document suggests the administration may not support EHE moving forward. Additionally, reports emerged in March 2025 that the administration was exploring cutting HIV prevention funding at the Centers for Disease Control and Prevention (CDC), which could include EHE funding. More recently, the CDC’s HIV Prevention branch and the Office at Health and Human Services (HHS) tasked with coordinating the EHE were eliminated as were key HIV officials at NIH as was the Office of Infectious Disease Policy at HHS, which coordinated EHE. As such, with threats to funding and staff eliminations, EHE’s future is uncertain.

Ending the HIV Epidemic (EHE) Priority Jurisdictions –  Local Jurisdictions

This tracker provides up-to-date data on federal EHE funding, including an overview of funding mechanisms by year, agency, grant mechanism, and jurisdiction. It will be updated over time.

Funding by Year, Agency, and Grant Mechanism

While FY 2020 is considered the first year of EHE funding, in FY 2019, some funds were reprogrammed from existing accounts to help start the initiative. From FY 2019-2024, funding totaled $2.33 billion. Funding for the EHE increased each year from FY 2020-2023 and was flat in FY 2024. It is not yet clear what FY25 funding will look like for EHE other than $165 million allocated to the Ryan White HIV/AIDS Program in the FY24 budget. (See Table 1.)

Ending the Epidemic Funding, FY 2019 – FY 2025 (in Millions)

Prior to the Congressional appropriations process, the administration makes a presidential budget request for Congress to consider. A budget request lays out presidential priorities both in terms of the policy issues identified and the level of funding requested. Table 2 provides the history of EHE presidential budget requests showing that EHE funding requests increased each year from FY 2020 to FY 2023. In FY 2024 the request was flat compared to the prior year. The FY 2025 budget request represents a $256.75 million decrease compared to the FY 2024 request. However, the funding request for FY 2025 is double that of FY 2020 request and each year the request has surpassed the appropriated amount (seen in Table 1).

Ending the HIV Epidemic Budget Requests FY2020 - FY2025 (in Millions)

Table 3 provides detail on each federal EHE grant mechanism by agency. Most EHE funding is allocated directly to EHE jurisdictions to assist with local efforts. A subset of EHE funding is provided to other grantees to carry out related efforts, such as to support capacity building and technical assistance and for science implementation hubs through NIH-funded Centers for AIDS Research (CFAR) and the NIMH AIDS Research Centers (ARC) programs.

FY2019 EHE Funding – Federal Funding Streams and Grants Awarded

Funding by Year and Jurisdictions

Tables 4 and 5 detail funding from FY 2019 to FY 2024 directed to EHE priority jurisdictions (data for FY 2025 are not yet available). Table 4 includes funding directed to EHE Counties and other local jurisdictions. Table 5 includes funding directed to the seven EHE states. See notes in these tables for details on how funding was allocated in this analysis.

Ending the HIV Epidemic Initiative: FY2019 Funding for Counties, D.C., and San Juan, Puerto Rico
Ending the HIV Epidemic Initiative: FY2019 Funding for States

What Do Federal Staffing Cuts and HHS Restructuring Mean for the Nation’s HIV Response?

Published: Apr 8, 2025

On March 27th, the Trump administration announced that the U.S. Department of Health and Human Services (HHS) would implement “a dramatic restructuring” in accordance with President Trump’s Executive Order, “Implementing the President’s ‘Department of Government Efficiency’ Workforce Optimization Initiative.” This included plans to reduce the Department’s workforce by 10,000 employees. As a result, thousands of federal HHS employees were given “reduction in force” announcements (or RIFs) or otherwise learned that their roles had been eliminated when they were denied access to their offices. Others were offered reassignments. In addition, several HHS offices and functions have reportedly been reduced or ended. These actions seem to be particularly focused on the federal government’s work on HIV and have the potential to negatively affect the nation’s HIV response. While there continues to be some uncertainty about the full extent of these actions, and there are some reports that certain personnel may be reinstated, here is what is known thus far about the implications of these actions on HIV efforts:

  • Centers for Disease Control and Prevention (CDC): A near 20% cut to CDC staff and elimination of divisions and offices:
    • This includes cuts within the National Center for HIV, Viral Hepatitis, STD, and Tuberculosis Prevention (NCHHSTP), the division that handles most federal HIV prevention efforts, with several branches being effectively eliminated, and it’s director, Jonothan Mermin, reassigned. For HIV, these include the elimination of the following divisions:
      • Prevention Communication Branch
      • Division of Behavioral & Clinical Surveillance Branch
      • Capacity Development Branch
      • Quantitative Sciences Branch
      • HIV Research Branch
    • These divisions within the CDC have provided leadership, subject matter expertise, tools and campaigns for communication with the public (important for a providing evidence-based information on a communicable and often stigmatizing disease), generated and analyzed data, helped develop capacity among grantees, supported outbreak investigation, and conducted research across a range of areas to improve HIV prevention, care engagement, and response efforts.
    • Beyond these HIV specific divisions, cuts also occurred within branches or divisions related to public health concerns that have a disproportionate impact on people with HIV or relate to conditions that increase vulnerability to HIV, including those focused on addressing tuberculosis, viral hepatitis, and sexually transmitted diseases (STD). For example, the disease intervention and response branch within the STD division faced eliminations, an office whose role it is to identify STD case and outbreaks and mitigate spread through linkage to care and provision of technical assistance.
  • HHS: Elimination of the Office of Infectious Disease Policy (OIDP) within the Office of the Secretary at HHS:
    • The OIDP office was eliminated and most staff were terminated or reassigned. This includes staff who supported coordination of the Ending the HIV Epidemic Initiative (EHE) which spans multiple HHS agencies and the Executive Director of the President’s Advisory Council on HIV/AIDS (PACHA), who was an employee within the office.
    • OIDP provides infectious disease leadership, expertise, and coordination across the federal government, with HIV being a special focus of the office. This includes coordinating multiple national strategies aimed at addressing infectious diseases including, the National HIV/AIDS Strategy (NHAS), Vaccines National Strategic Plan (Vaccine Plan), Viral Hepatitis National Strategic Plan (Viral Hepatitis Plan), and the STI National Strategic Plan (STI Plan), in addition to providing EHE leadership.
  • National Institutes of Health (NIH): Key officials in NIH leadership were placed on administrative leave and some offices were eliminated:
    • Specific to HIV, Jeanne Marrazzo, the director of the National Institute of Allergy and Infectious Diseases (NIAID) was reportedly placed on administrative leave. The role was previously held by Anthony Fauci.
    • Additionally, there have been reports that the Workforce Operations, Communications, and Reporting Branch (WOCRB) at the Division of AIDS (DAIDS) within NAID has been eliminated. WOCRB’s role is to coordinate division-wide operational activities.
    • NIAID conducts and supports research related to infectious, immunologic, and allergic diseases, including HIV. Specifically related to HIV, NIAID has worked to “better understand HIV and how it causes disease, find new tools to prevent HIV infection, develop new and more effective treatments for HIV-infected people, and find a cure.” NAID’s HIV research has focused on HIV treatment, prevention, cure and vaccine.
  • Beyond those offices dedicated to HIV, several others that have reportedly faced staff or complete elimination conduct activities relevant to addressing the needs of people with and at risk for HIV. These offices address communities disproportionately represented among people with HIV, including those focused on the needs of people of color, LGBTQ people, those with lower incomes, those with comorbidities, including mental health substance use problems, and those that address aging issues.
    • Examples of where such cuts/elimination have reportedly occurred include following offices/agencies: the Centers for Medicare & Medicaid Services (CMS)’s Office of Minority Health, the Substance Abuse and Mental Health Services Administration (SAMHSA) (including multiple offices such as the National Mental Health and Substance Use Policy Laboratory and the Office of Minority Health), and the Administration for Community Living (including the Center for Policy and Evaluation). In addition to NIAID at NIH described above, the National Institute on Drug Abuse with NIH was also reportedly The Office of Minority Health at HHS has also reportedly been told to prepare for elimination.

There are also plans for a new agency, the Administration for a Healthy America (AHA) to be created, consolidating activities from the Office of the Assistant Secretary for Health (OASH), the Health Resources Services Administration (HRSA) (home to the health center and Ryan White HIV/AIDS programs), SAMHSA, and others. AHA will consist of multiple divisions, including one on HIV/AIDS. It is not known whether AHA will seek to reinstitute some of the terminated positions or eliminate additional roles from within the agencies it consolidates.

Regardless of what happens with AHA, the elimination of directors, staff, and departments across HHS to date, represents a significant loss to HIV research, prevention efforts, leadership, expertise, and coordination of the HIV response across the federal government. In addition to cuts described above, it has also been reported that there may be cuts to CDC’s HIV prevention budget, that funding for NIAID’s HIV Prevention Trials Network and HIV Vaccine Trials Network (HVTN) has been suspended, and that some NIH grants focused on HIV have been rescinded. Taken together these actions could all hamper the nation’s ability to address HIV in the immediate term, jeopardize innovation, and lead to increased HIV incidence. In addition, expertise built by these officials and offices has been utilized in public health arenas outside of HIV, as was the case with the development of the COVID-19 vaccine which was built on HIV vaccine research. Given this, erosion of HIV expertise, research, and infrastructure could have ramifications for public health more broadly.

How Does Cost Affect Access to Care?

Published: Apr 7, 2025

This slideshow explores trends in how costs affect access to health care in the U.S., including decisions to forgo or delay needed care and access to a usual source of care. Based on data from the 2023 National Health Interview Survey, more than 1 in 4 adults (28%) reported delaying or not getting health care due to cost.

The analysis also notes that Hispanic adults, non-elderly adults, adults in worse health (reported as fair or poor health status,) and uninsured adults are more likely to delay or forgo care due to cost. The slideshow also explores variations based on income and race.

The slideshow is available through the Peterson-KFF Health System Tracker, an online information hub dedicated to monitoring and assessing the performance of the U.S. health system.

50-State Survey Archives: Medicaid HCBS and Eligibility Based on Disability or Age 65+

Published: Apr 7, 2025

Since 2001, KFF’s Program on Medicaid and the Uninsured has administered regular surveys of states about their home- and community-based services (HCBS) programs and their eligibility policies for people who are eligible for Medicaid on the basis of having a disability or being ages 65 and older (e.g., the “non-MAGI” eligibility pathways). Those reports are compiled here.

Use these links to navigate to the surveys and resources on this page.

Medicaid HCBS Surveys

Survey of Medicaid Eligibility Based on Disability or Age 65+ (non-MAGI eligibility)

Related Resources

Medicaid HCBS Surveys

The Medicaid HCBS survey is sent to officials administering Medicaid HCBS programs in all 50 states and the District of Columbia. The survey is sent to each state official responsible for overseeing the administration of HCBS programs (including home health, personal care, and waiver services). Before 2015, KFF and researchers at University of California San Francisco conducted the survey. Starting in 2016, KFF and Watts Health Policy Consulting have conducted the annual survey. Not all years’ surveys are available because the survey was not administered in some years and in other years, KFF replaced earlier reports with the most recent data.

Surveys are organized by the year in which they were administered, which may not match the date of publication or the year of data reported. Some reports include data from more than one year.

Report links for some prior years are no longer on our website, but may be requested via KFF’s Contact Us form.

2024 Survey

A Look at Waiting Lists for Medicaid Home- and Community-Based Services from 2016 to 2024 (October 2024)

How do Medicaid Home Care Programs Support Family Caregivers? (January 2025)

What is Medicaid Home Care (HCBS)? (February 2025)

Payment Rates for Medicaid Home Care: States’ Responses to Workforce Challenges (February 2025)

What Services Does Medicaid Cover in Assisted Living Facilities? (March 2025)

2023 Survey

Pandemic-Era Changes to Medicaid Home- and Community-Based Services (HCBS): A Closer Look at Family Caregiver Policies (September 2023)

Payment Rates for Medicaid Home- and Community-Based Services: States’ Responses to Workforce Challenges (October 2023)

A Look at Waiting Lists for Medicaid Home and Community-Based Services from 2016 to 2023 (November 2023)

How are States Implementing New Requirements for Medicaid Home- and Community-Based Services? (December 2023)

2022 Survey

Ongoing Impacts of the Pandemic on Medicaid Home & Community-Based Services (HCBS) Programs: Findings from a 50-State Survey (November 2022)

Ending the Public Health Emergency for Medicaid Home- and Community-Based Services (April 2023)

2021 Survey

Medicaid Home & Community-Based Services: People Served and Spending During COVID-19 (March 2022)

State Policy Choices About Medicaid Home and Community-Based Services Amid the Pandemic (March 2022)

2019 Survey

Medicaid Home and Community-Based Services Enrollment and Spending (February 2020)

Key State Policy Choices About Medicaid Home and Community-Based Services (February 2020)

Medicaid’s Money Follows the Person Program: State Progress and Uncertainty Pending Federal Funding Reauthorization (November 2019)

2014 Survey

Medicaid Home and Community-Based Services Programs: 2012 Data Update (November 2015)

2004 Survey

Medicaid 1915(c) Home and Community-Based Service Programs: Data Update (July 2005)

# #

Survey of Medicaid Eligibility Based on Disability or Age 65+ (non-MAGI eligibility)

Medicaid is an important source of health and long-term care coverage for people with disabilities and those who are ages 65 and older. The Medicaid pathways in which eligibility is based on old age or disability are known as “non-MAGI” pathways because they do not use the Modified Adjusted Gross Income (MAGI) financial methodology that applies to pathways for pregnant people, parents, and children with low incomes. In addition to considering old age/disability status and income, many non-MAGI pathways also have asset limits. Since 2015, this survey has been conducted by KFF and Watts Health Policy Consulting. Not all years’ surveys are available because the survey was not administered in some years and in other years, KFF replaced earlier reports with the most recent data.

Surveys are organized by the year in which they were administered, which may not match the date of publication or the year of data reported. Some reports include data from more than one year.

2025 Survey

Medicaid Eligibility Levels for Older Adults and People with Disabilities (Non-MAGI) in 2025 (April 2025)

2024 Survey

Medicaid Eligibility and Enrollment Policies for Seniors and People with Disabilities (Non-MAGI) During the Unwinding (June 2024)

What is Medicaid Estate Recovery? (September 2024)

What Are the Primary Medicaid Eligibility Pathways for Dual-Eligible Individuals? (October 2024)

2022 Survey

Medicaid Financial Eligibility in Pathways Based on Old Age or Disability in 2022: Findings from a 50-State Survey (July 2022)

Medicaid Public Health Emergency Unwinding Policies Affecting Seniors & People with Disabilities: Findings from a 50-State Survey (July 2022)

2018 Survey

Medicaid Financial Eligibility for Seniors and People with Disabilities: Findings from a 50-State Survey (June 2019)

Key State Policy Choices About Medical Frailty Determinations for Medicaid Expansion Adults (June 2019)

Implications of the Expiration of Medicaid Long-Term Care Spousal Impoverishment Rules for Community Integration (November 2019)

2015 Survey

Medicaid Financial Eligibility for Seniors and People with Disabilities in 2015 (March 2016)

2009 Survey

Medicaid Financial Eligibility: Primary Pathways for the Elderly and People with Disabilities (February 2010)

# #

KFF’s ongoing work related to LTSS and people with disabilities provides context and nuance to the data and information presented in the state surveys.

Long-Term Services and Supports

  • 10 Things About Long-Term Services and Supports (July 2024)
  • Who Uses Medicaid Long-Term Services and Supports (December 2023)
  • How Many People Use Medicaid Long-Term Services and Supports and How Much Does Medicaid Spend on Those People? (August 2023)

Nursing Facilities

  • A Closer Look at the Final Nursing Facility Rule and Which Facilities Might Meet New Staffing Requirements (May 2024)
  • A Look at Nursing Facility Characteristics Between 2015 and 2023 (January 2024)

People with Disabilities

  • 5 Key Facts about Medicaid Coverage for People with Disabilities  (February 2025)
  • 5 Key Facts about Medicaid Eligibility for Seniors and People with Disabilities (February 2025)
  • The Connection Between Social Security Disability Benefits and Health Coverage Through Medicaid and Medicare (September 2024)
  • As Recommendations for Isolation End, How Common is Long COVID? (April 2024)
  • Working Age Adults with Disabilities Living in the Community (January 2024)
  • Supplemental Security Income for People with Disabilities: Implications for Medicaid (June 2021)

Medicaid Eligibility Rule, 2023-2024

  • What Does the Medicaid Eligibility Rule Mean for Low-Income Medicare Beneficiaries and the Medicare Savings Programs (MSPs)? (November 2023)
  • Potential Effects of the Proposed Medicaid Eligibility Rule for Newly Enrolled Medicare-Medicaid Enrollees(November 2022)
  • 5 Things to Know: A Look at the Proposed Medicaid Eligibility & Enrollment Rule (September 2022)

Medicaid Eligibility Levels for Older Adults and People with Disabilities (Non-MAGI) in 2025

Authors: Alice Burns, Maiss Mohamed, and Molly O’Malley Watts
Published: Apr 7, 2025

Issue Brief

To achieve the federal savings required by the House budget resolution, Congress would need to cut federal Medicaid spending by hundreds of billions of dollars, leaving states with significant budget shortfalls. Such policies could have major implications for older adults and people with disabilities who comprise 1 in 4 Medicaid enrollees but over half of Medicaid spending on account of higher per-person costs. Within this group, there are multiple eligibility pathways, most of which are optional for states to cover, and all of which have more complex eligibility requirements than coverage for other enrollees. Proposals to limit federal spending on Medicaid may pressure states to restrict Medicaid eligibility pathways, cover fewer optional benefits, and reduce provider payment rates. Coverage for people eligible through optional pathways, which are offered by all states, may be particularly at risk because of the high per-person costs of people enrolled through those pathways.

KFF’s Survey of Medicaid Financial Eligibility for Older Adults & People with Disabilities conducted in March 2025 by KFF and Watts Health Policy Consulting, provides a baseline of Medicaid eligibility as states return to normal operations after the end of the COVID-19 pandemic and ahead of potential changes to the Medicaid program. (These eligibility pathways are known as “non-MAGI” pathways because they do not determine eligibility based on Modified Adjusted Gross Income, as is the case for people covered under the Affordable Care Act Medicaid expansion and other groups.) Overall, 50 states including the District of Columbia (hereafter referred to as a state) responded to the survey, though response rates to specific questions varied. Florida was the only state that did not respond. Responses were supplemented with publicly available data and information from KFF’s past surveys when available, and state-level data are included in the Appendix Tables. Key takeaways include:

  • States are generally required to provide Medicaid to people who receive Supplemental Security Income (SSI) and Medicare beneficiaries with limited income and savings. Eighteen states have increased the income or savings limits for Medicare beneficiaries beyond the federal minimums.
  • Any optional pathway: All states also offer coverage through one or more optional eligibility pathways to people who have disabilities or are ages 65 and older who have limited financial resources.
  • Optional income-related pathway: All states except Alabama extend eligibility to low-income adults with disabilities or people ages 65 and older who have income above the SSI limits (Figure 1).
  • The most common income-based optional eligibility group is the Medicaid Buy-In for adults with disabilities who want to work, which is offered by 47 states.
  • Optional LTC-related pathway: All states except for Montana offer optional coverage to people who use long-term care, people who tend to have much higher average spending than other Medicaid enrollees.
  • Between 2024 and 2025, there were few changes in states’ eligibility requirements for older adults and people with disabilities, although 12 states increased the personal needs allowance for people using institutional care in 2025, with South Dakota reporting the largest increase (from $60 to $100).

All States Have Optional Pathways for Medicaid Eligibility as of March 2025

What are the two required eligibility pathways for older adults and people with disabilities?

States are only required to cover two eligibility groups for older adults and people with disabilities in Medicaid, both of which require people to demonstrate having limited income and savings. Federal statutes generally require states to enroll people who receive Supplemental Security Income (SSI) in Medicaid and to enroll eligible Medicare beneficiaries in the Medicare Savings Programs:

  • SSI is a disability program that provides monthly income to people who are unable to work on account of a disability and who have limited income ($967 per month in 2025 for an individual) and financial resources below federal limits ($2,000 for an individual).
  • The Medicare Savings Programs provide Medicaid coverage of Medicare premiums and in most cases, cost sharing to Medicare beneficiaries who have limited income ($1,781 per month in 2025 for an individual) and financial resources below federal limits ($9,660 for an individual in 2025). People who are eligible for the Medicare Savings Programs, but not full Medicaid, receive help only with Medicare costs, and not full Medicaid benefits.

States may choose to expand eligibility for the Medicare Savings Programs beyond federally-required minimum levels. As was the case in 2024, 33 states use federal eligibility criteria for the Medicare Savings Programs, and the remaining 18 states expanded eligibility beyond those limits (Appendix Table 2).

Which states offer optional Medicaid eligibility for low-income older adults and people with disabilities?

All states except for Montana offer optional Medicaid eligibility for low-income older adults and people with disabilities. There are four types of optional Medicaid eligibility pathways based on income for people with disabilities which include:

  • Medicaid buy-in programs for working adults are available in 47 states in 2025, allowing working people with disabilities to “buy into” Medicaid by paying a premium when their earned income exceeds eligibility limits but falls below a percentage of the federal poverty level (FPL).
  • In 2025, the median income limit was 250% of FPL ($3,261 per month in 2025) and median asset limit was $10,000 for an individual and $14,470 for a couple (Appendix Table 3).
  • Over half of states (27 of 45 responding) have an age limit for these buy-in programs, typically ages 16-64.
  • Most states (33 of 47 responding) reported premiums for buy-in enrollees, with the median premium being $25 in 2025.
  • Medically needy coverage is available in 34 states in 2025, allowing people to qualify for Medicaid if their income or assets are higher than permitted under another pathway but below the medically needy limit after accounting for their health care expenses.
  • Most income limits are low—usually below 50% of FPL and many states limit enrollees’ assets to $2,000 (Appendix Table 4).
  • Unlike income limits for other eligibility pathways, medically needy limits are generally established as a dollar amount. The median income limit increased from $504 in 2024 to $511 in 2025.
  • Poverty level coverage is available in 28 states, allowing low-income older adults and people with disabilities to qualify for Medicaid when their income exceeds the SSI limits. States with this type of coverage generally establish income eligibility as a percentage of the SSI benefit rate or federal poverty level ($1,305 per month for an individual in 2025). Among the states that have expanded eligibility above SSI levels:
  • 11 states have eligibility above SSI but below FPL,
  • 15 states have eligibility at FPL, and
  • 2 states have eligibility above FPL (Appendix Table 5).
  • Coverage through the Family Opportunity Act, available in 9 states, allows families with incomes up to 300% of FPL to purchase Medicaid for their children under age 19 (Appendix Table 3). Parents who are eligible for coverage through an employer are required to pay premiums for private coverage too as a condition of Medicaid eligibility. In such cases, Medicaid covers the services children with disabilities need which are often not covered by private coverage.
  • In 2025, the median income limit was about 265% of FPL ($3,452 per month) and 7 states had no limit on assets.
  • Family Opportunity Act coverage is another type of “buy in,” with 5 states charging premiums in 2025. Premiums vary with family income and the median premium started at $12 per month for families with an income of 150% FPL.

What states offer optional Medicaid eligibility for people who use long-term care?

All states except for Montana offer optional Medicaid eligibility for people who use long-term care. Recognizing the high costs of long-term care, eligibility for people who use long-term care is almost always 300% of the SSI limit ($2,901 per month per individual in 2025), and most states limit enrollees’ assets to $2,000 per person (Appendix Table 6). The pathways include:

  • Katie Beckett coverage is available in 43 states, allowing children under 20 with significant disabilities who require an institutional level of care to receive Medicaid while living at home. Only the child’s income and assets are considered for eligibility purposes, which allows some children of higher-income families to qualify. Like Family Opportunity Act coverage, children with Katie Beckett coverage may also have private health insurance, and 7 states charge families premiums for Medicaid.
  • The special income rule allows states to extend Medicaid eligibility to people who require an institutional level of care and live in institutions or in home and community settings. Each pathway is available in 41 states, although Massachusetts offers coverage only for people using home care and New Hampshire offers coverage only for people using institutional care.

Most Medicaid enrollees who qualify because of long-term care are subject to limits on their home equity and must contribute to the cost of their care each month. In 2025, federal rules specified that limits on home equity must be between $730,00 and $1,097,000; and most states set the 2025 limit at $730,000 (Appendix Table 7). In all states, there are circumstances in which the home is exempt from limits, and other circumstances in which the home is counted as an asset when determining eligibility. California is the only state that does not have a home equity limit. Once eligible for Medicaid, enrollees who use long-term care must generally contribute nearly all monthly income to the cost of their care except for a small “personal needs allowance.” In 2025, the median personal needs allowance is $62 for institutional care and $2,901 for home care. Those limits were similar to the limits in 2024, although 12 states increased the personal needs allowance for institutional care in 2025, with South Dakota reporting the largest increase (from $60 to $100).

This work was supported in part by Arnold Ventures. KFF maintains full editorial control over all of its policy analysis, polling, and journalism activities.

Appendix

State Adoption of Key Medicaid Eligibility Pathways Based on Old Age or Disability as of March 2025

Eligibility for Medicare Savings Programs as of March 2025

Medicaid Eligibility for Buy-In Programs for Working People with Disabilities and the Family Opportunity Act as of March 2025

Medicaid Eligibility for Medically Needy Populations as of March 2025

Medicaid Eligibility for SSI Enrollees and Optional Older Adults & People with Disabilities Up To 100% FPL as of March 2025

Medicaid Eligibility for Katie Beckett Children with Significant Disabilities and Special Income Rule as of March 2025

State Home Equity Disregards for LTC Eligibility and Personal Needs Allowances as of March 2025

CDC’s Funding for State and Local Public Health: How Much and Where Does it Go?

Published: Apr 7, 2025

Summary

Federal funding has long been a major source of support for public health efforts across the United States, estimated to account for more than half of state and local health department budgets. The Centers for Disease Control and Prevention (CDC), the primary public health agency of the federal government, provides much of this funding, helping to support public health systems and activities across the country. However, CDC and other federal health agencies are being targeted by the Trump administration for downsizing and budget cuts, reductions that could impact the amount of funding available for public health. To better understand how much CDC funding is provided to state and local jurisdictions, we analyzed FY 2023 funding obligation data (see Methods and Appendix 1). Among the key findings:

  • In FY 2023, CDC obligated almost $15 billion to state and local jurisdictions. While most (62% or $9.2 billion) was from CDC’s regular budget, a significant share (38% or $5.7 billion) was from time-limited, supplemental funding for COVID-19 and public health infrastructure rebuilding.
  • Of the $9.2 billion in regular budget obligations, half ($4.7 billion or 51%) was for the Vaccines for Children program, a mandatory program that provides vaccines at no cost for children who are uninsured or underinsured and other eligible children (4% was for additional mandatory programs). The remaining $4.1 billion (45%) was discretionary funding supporting a range of programs including HIV/AIDS, Viral Hepatitis, STI and TB Prevention, Chronic Disease Prevention and Health Promotion, Public Health Preparedness and Response, and Injury Prevention and Control.
  • Both red and blue states benefit from CDC funding, with states that voted for President Trump in 2024 receiving the majority of funding (56%), compared to states that voted for Kamala Harris (44%); on a per capita basis, states voting for Harris received slightly more compared to those that voted for Trump ($46 vs $43 per capita).
  • The top five state recipients also represent a mix of red and blue states (California, Texas, New York, Florida, and Georgia), as do the top five states by funding per capita (District of Columbia, Alaska, Maryland, Vermont, and Wyoming).
  • By region, Southern states received the largest share of funding (43%) followed by the West (22%), Midwest (19%), and Northeast (17%); the South also ranked first in funding per capita.

Funding cuts, therefore, could have a significant impact on the amount of funding available to states and local jurisdictions for public health activities. Such cuts, coupled with the expected end in supplemental funding for COVID-19 and public health infrastructure support, could also represent a double whammy, affecting both red and blue states, and especially states in the South. While state and local governments could potentially fill some of the gap left by federal dollars, they may also be facing their own budget constraints and other cuts in federal funding, leaving the future of the nation’s public health infrastructure capacity uncertain.

Findings

  • In FY 2023, CDC obligated $14.9 billion to state and local jurisdictions. This included $9.2 billion (62%) as part of its regular budget and $5.7 billion (38%) in supplemental funding (see Figure 1). These amounts were distributed to jurisdiction across a number of categories (see Figure 2).
CDC Public Health Funding, Share by Funding Type, FY 2023
CDC Public Health Funding by Category, FY 2023
  • Of the $9.2 billion in regular budget obligations, $5.1 billion (56%) was mandatory funding, required by law, and $4.1 billion (44%) was discretionary and dependent on annual appropriations from Congress. The share of mandatory vs discretionary funding provided varied by state (see Appendix Table 2).
    • Most mandatory funding (92%) was for the Vaccines for Children program. The remainder was for Chronic Disease Prevention and Health Promotion, Cross-Cutting Activities and Program Support, and several other smaller mandatory programs.
    • Discretionary funding was spread across a wide range of public health areas, with the largest share (22%) directed to HIV/AIDS, Viral Hepatitis, STI and TB Prevention efforts. Chronic Disease Prevention and Health Promotion received the next largest share (17%), followed by Public Health Preparedness and Response (16%), and Injury Prevention and Control (15%). A variety of other programs comprised the remainder (see Figure 3).
  • Of the $5.7 billion in supplemental funding, most ($4.9 billion or 87%) was from the Public Health and Social Services Emergency Fund (PHSSEF), transferred to CDC by HHS to support COVID-19 response activities as well as public health infrastructure and workforce. The remainder was for Cross-Cutting Activities and Program Support, which included COVID response activities and hurricane supplemental funding.
CDC Discretionary Public Health Funding, by Category, FY 2023
  • There was significant variation in the amount of CDC funding provided to the 50 states and Washington D.C., ranging from $45.9 million to $1.4 billion; when standardized by population size, funding ranged from $35 to $314 per capita (see Figure 4 and Appendix Table 3).
    • Funding was concentrated in a subset of states, with the top 10 state recipients accounting for 51% of all funding, and the top five states accounting for a third (34%). The top five state recipients were California, Texas, New York, Florida, and Georgia. Per capita, the top five state recipients were the District of Columbia, Alaska, Maryland, Vermont, and Wyoming (see Figure 5).
    • If supplemental funding is removed, CDC’s funding by state ranged from $25.7 million to $906 million, or $21 to $235 per capita; the top five state recipients, representing over a third (36%) of non-supplemental funding, remain the same (California, Texas, New York, Florida, and Georgia), with some variation in the rank by per capita funding (District of Columbia, Alaska, Vermont, Rhode Island, and Wyoming).
CDC Public Health Funding by State, FY 2023
Top 10 States Receiving CDC Public Health Funding, Per Capita, FY 2023
  • By region, the South received the largest share of funding overall (43%) followed by the West (22%), Midwest (19%), and Northeast (17%). In per capita terms, the South remained the top funded region followed by the Northeast, West, and Midwest. With supplemental funding removed, the funding distribution is largely the same as is the per capita rank by region (see Figure 6).
  • States that voted for President Trump in the 2024 election received the majority of CDC funding, although there was a more even distribution when standardized by population size. The 31 states that voted for President Trump received 56% of overall CDC funding, compared to 44% for the 20 states that voted for Kamala Harris. On a per capita basis, states voting for Harris received slightly more ($46 per capita) compared to those voting for Trump ($43 per capita). With supplemental funding removed, the distribution of funding remains almost the same (57% for Trump states and 43% for Harris states) while funding per capita was almost even ($27 per capita for Trump states vs $28 per capita for Harris states) (see Figure 7).
CDC Public Health Funding by Region, FY 2023
CDC Public Health Funding by State 2024 Presidential Election Voting Result, FY 2023

Methods

Data for this analysis were obtained from the CDC’s Grant Funding Profiles database which contains data on funding obligations provided by the agency to U.S. states, including the District of Columbia, territories, and freely associated states by fiscal year and grantee name. The focus of this analysis was on funding obligations provided in FY 2023 to state and local jurisdictions only (funding provided to U.S. territories and freely associated states was excluded). For the purposes of this analysis, funding provided directly to local recipients (e.g., local health departments) is included in the state totals. CDC’s database only includes grants and cooperative agreements, and not other CDC expenditures (e.g., funding for international activities, research and development agreements, user fees), and therefore do not represent total CDC obligations. Most funding represents actual obligations, however, funding for the Vaccines for Children program represents the value of vaccines purchased and provided. Grantee names were manually reviewed by KFF researchers and re-coded to the following grantee types: state or local government (including state and local governments and agencies, public school districts, public universities, and tribal governments), non-profit, or private sector. It is important to note that the grantee’s address often represents the geographical location of the grantee’s primary headquarters and may not reflect the actual geographic scope of the grantee’s work, including national associations that carry out public health programs across the country. Classification of mandatory, discretionary, and supplemental funding was determined by KFF based on congressional appropriations bill language. Supplemental funding represents funding appropriated or transferred from emergency supplemental bills. Population data, for calculating per capita funding amounts, was obtained from the U.S. Census Bureau using the 2023 state population tables, and state regional classifications were obtained from the U.S. Census Bureau’s States and Regions Divisions. State 2024 presidential election voting results were obtained from the National Archive’s 2024 Electoral College Results. While most states delegate all of their electoral college votes to one presidential candidate, two states (Maine and Nebraska) allow for split electoral college votes. For the purposes of this analysis, Maine has been designated as “blue” since most of its votes went to former Vice President Kamala Harris and Nebraska has been designated as “red” since most of its votes went to President Donald Trump in the 2024 election.

Appendix 1: What Does the CDC Budget Include?

CDC’s budget is comprised of three major categories:

  • A discretionary budget determined and appropriated annually by Congress;
  • A mandatory budget determined by a specific set of congressionally-mandated program authorizations, such as the Vaccines for Children program;
  • In some years, supplemental funding is also provided to CDC outside of the regular annual appropriations process, typically to help with response to disease outbreaks or other health emergencies. Starting in 2020, CDC funding has included supplemental funds supporting COVID-19 response.

In FY 2023, the CDC discretionary budget was $8.28 billion, while mandatory budget totaled $6.97 billion. The exact amount of supplemental funding in CDC’s FY2023 budget is not clear. Since 2020, Congress provided CDC with additional funding via five different COVID-19 relief laws, with much of these supplemental appropriations made available to be spent over several years. In addition, other supplemental funds have been provided to CDC via transfers from other agencies. Further, in later legislation Congress rescinded some of the previously appropriated COVID-19 relief funding for CDC. CDC does not publicly report how much supplemental funding it has available in its budget, so developing a full picture of CDC’s available funding is a challenge.

However, CDC does report the amount of funds that it directs to state and local entities, which amounted to $14.9 billion in FY2023. CDC reports this funding by category and sub-category (program areas and activities) In addition, KFF designated these by funding type (discretionary, mandatory, and supplemental), as determined by appropriation bill language; Appendix Table 1 shows these categories and corresponding funding types.

Mandatory, Discretionary, and Supplemental Funding Categories and Sub-Categories in CDC's FY 2023 Budget


Appendix 2: Additional Charts

CDC Public Health Funding, Share by State and Funding Type, FY 2023

CDC Public Health Funding by Geographic Area, FY 2023

Out-of-Pocket Costs for Abortion Care Among Individuals Enrolled in Employer Sponsored Insurance Plans

Published: Apr 3, 2025

Key Takeaways

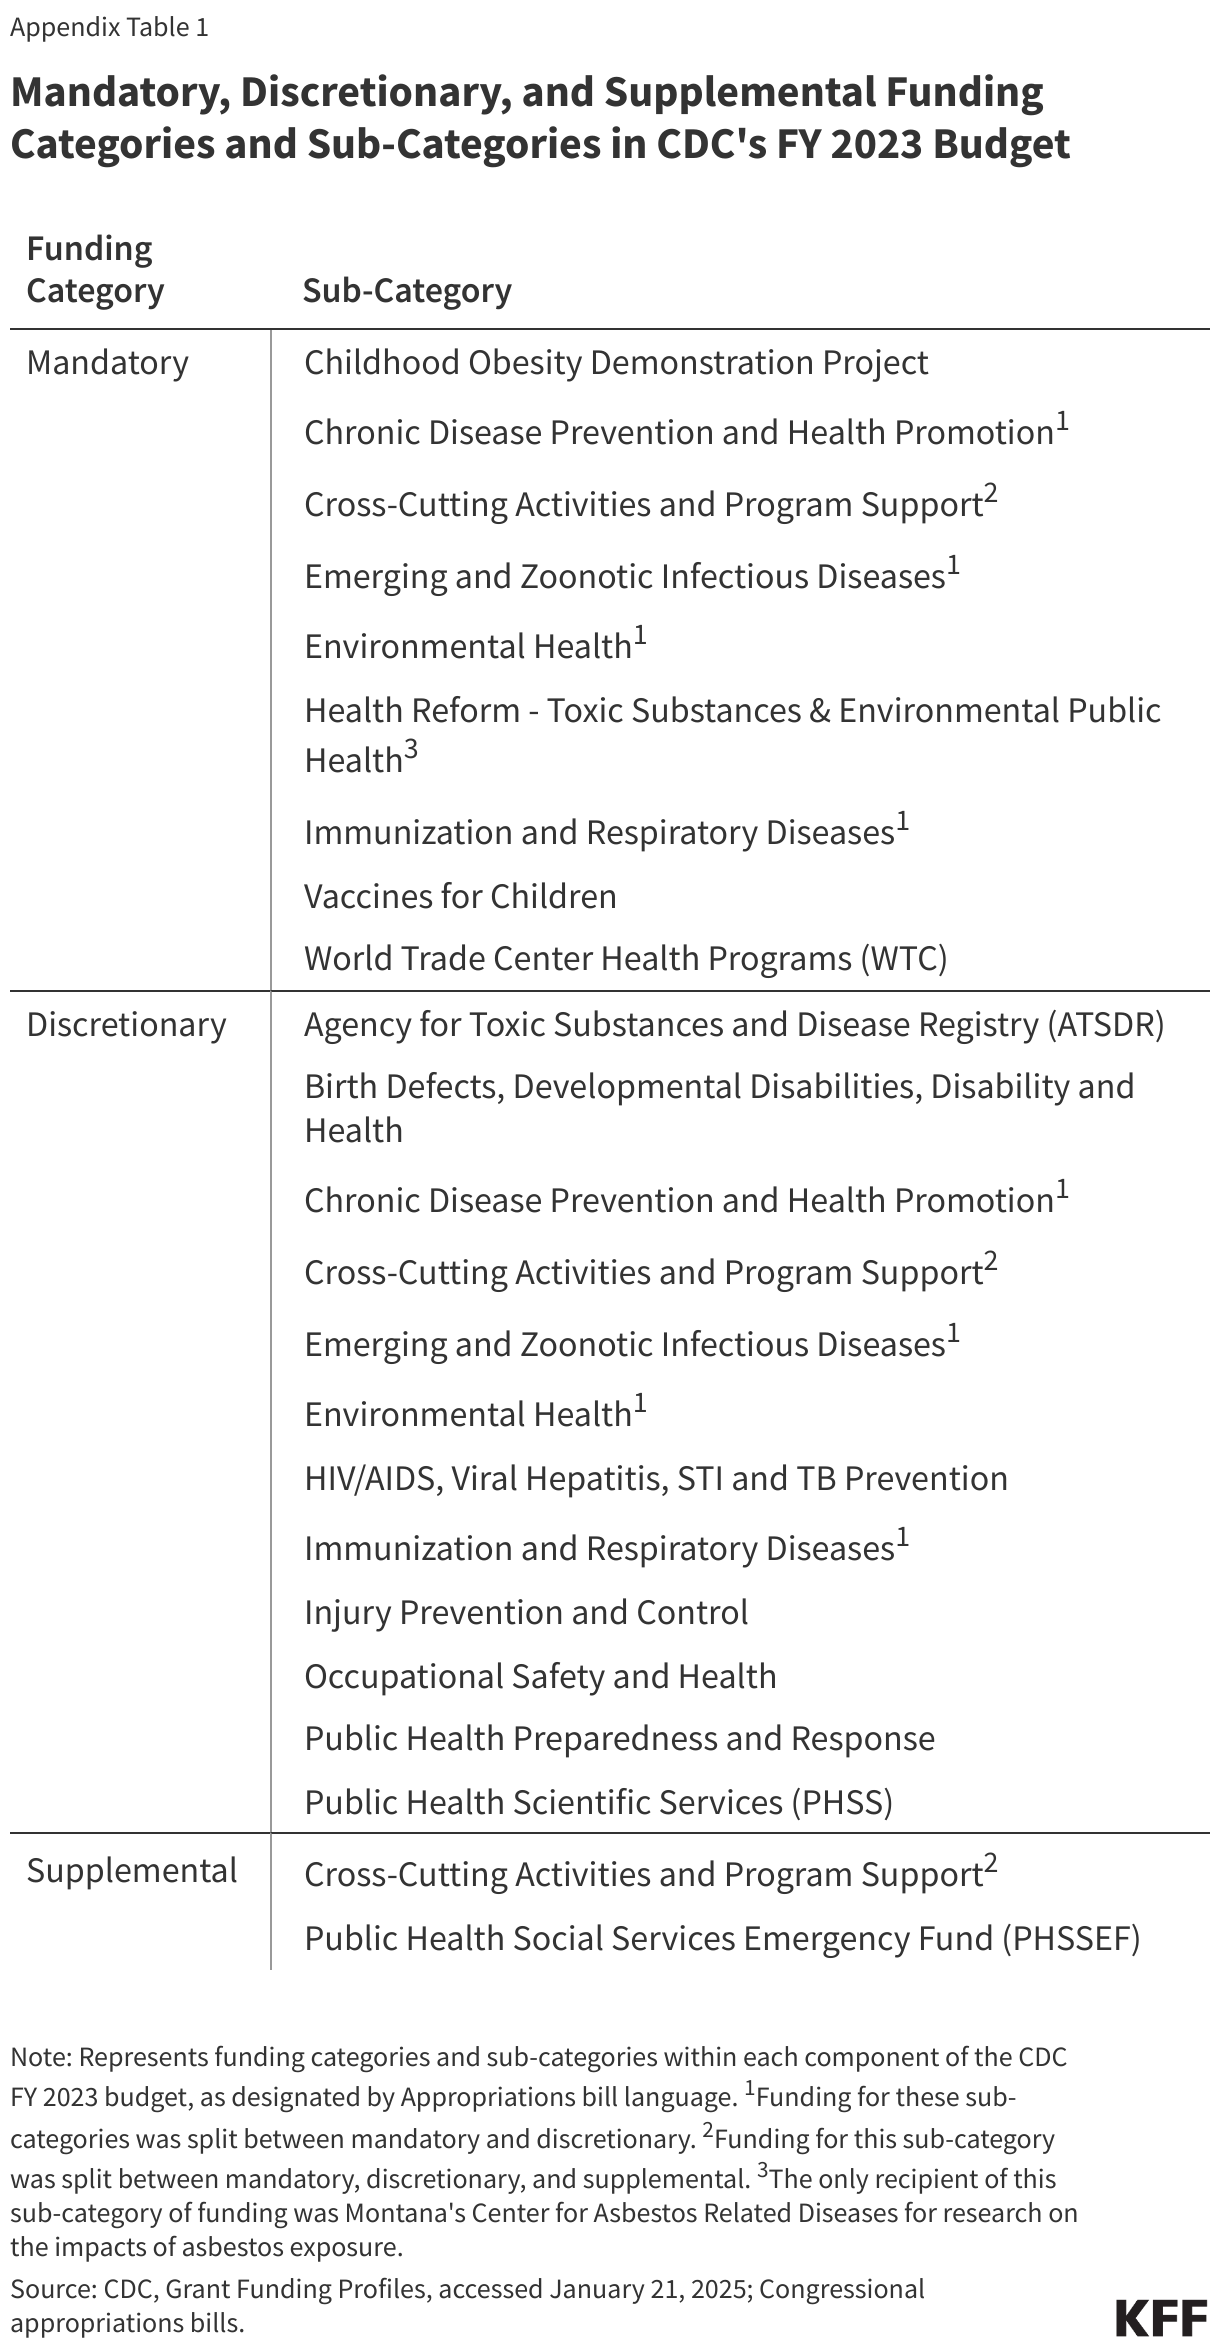
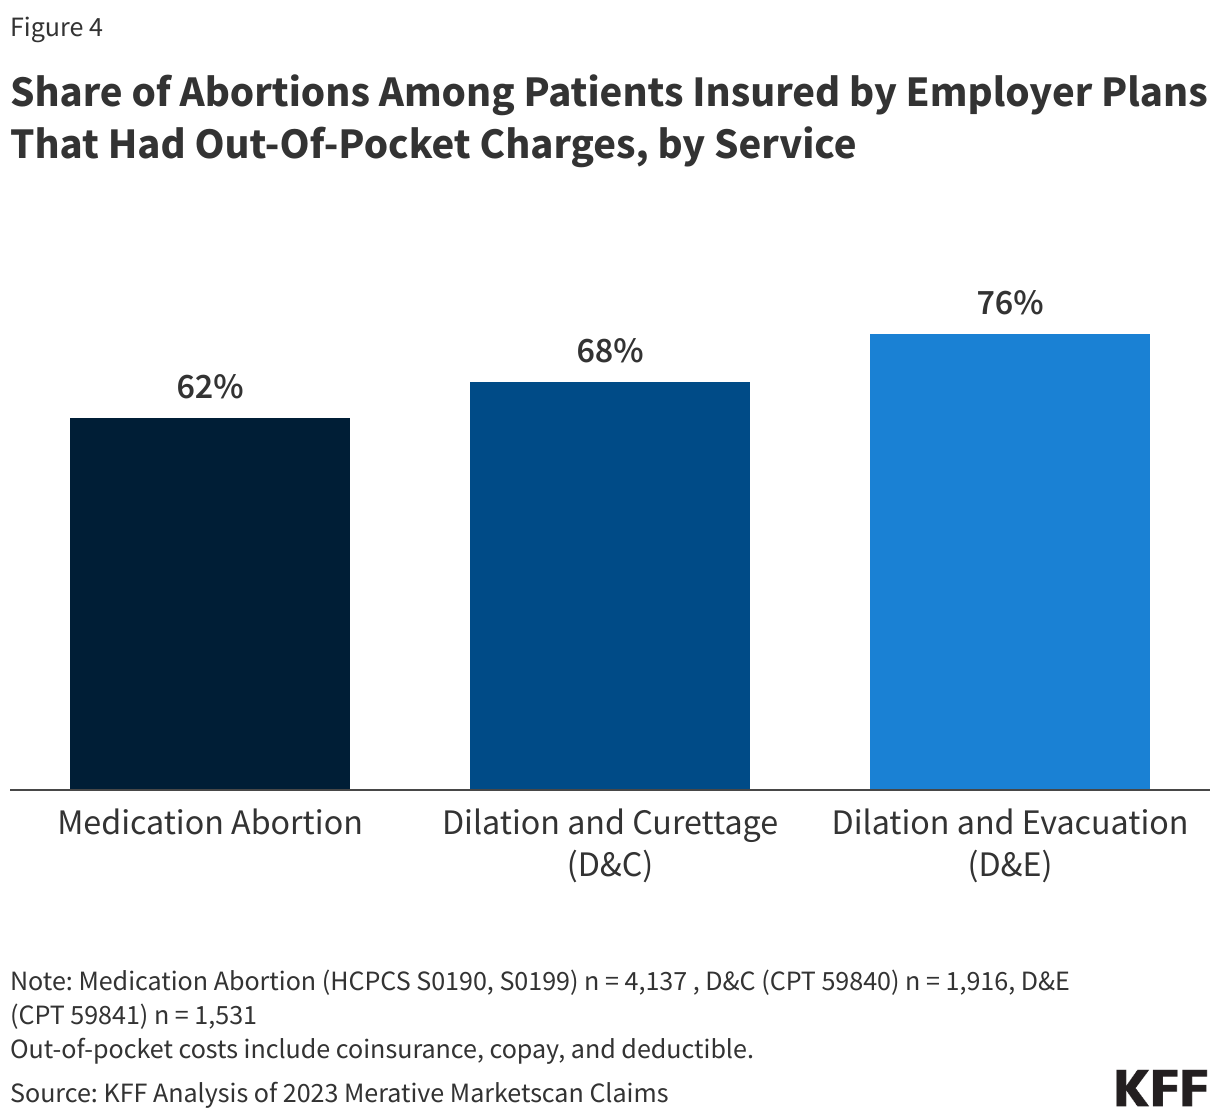
  • Most females who used their private insurance to pay for their abortion had out-of-pocket costs for their services, including 62% of those who accessed medication abortion, 68% of those who obtained a D&C procedure, and 76% of those who received a D&E procedure.
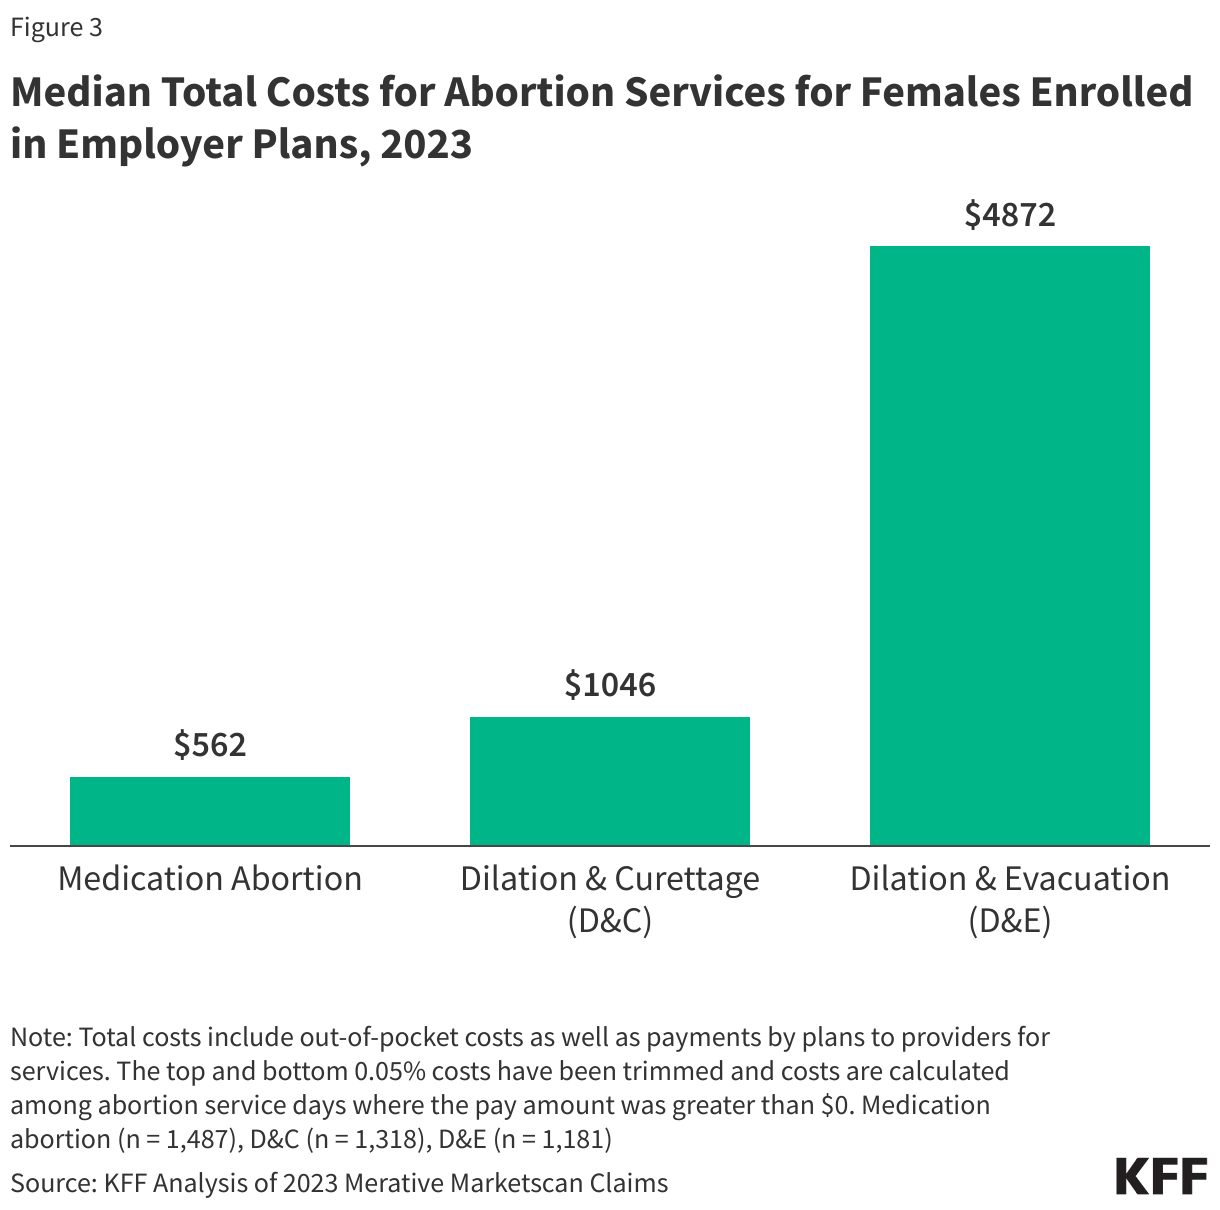
  • Median private insurance reimbursement rates for abortion and ancillary services ranged from $562 for medication abortion to $1,046 for D&C, and $4,872 for D&E procedures.
  • For those with coverage through employer sponsored insurance plans, median out-of-pocket costs were less than $100 for medication abortion and D&C procedures but rose to over $200 for D&E procedures, typically done later in pregnancy. However, a quarter of females with private insurance paid more than $100 for medication abortion and D&C procedures, and close to $1,000 for D&E procedures.
  • Out-of-pocket costs were substantially higher for D&C and D&E procedures provided in ambulatory/outpatient hospital settings than office-based settings.
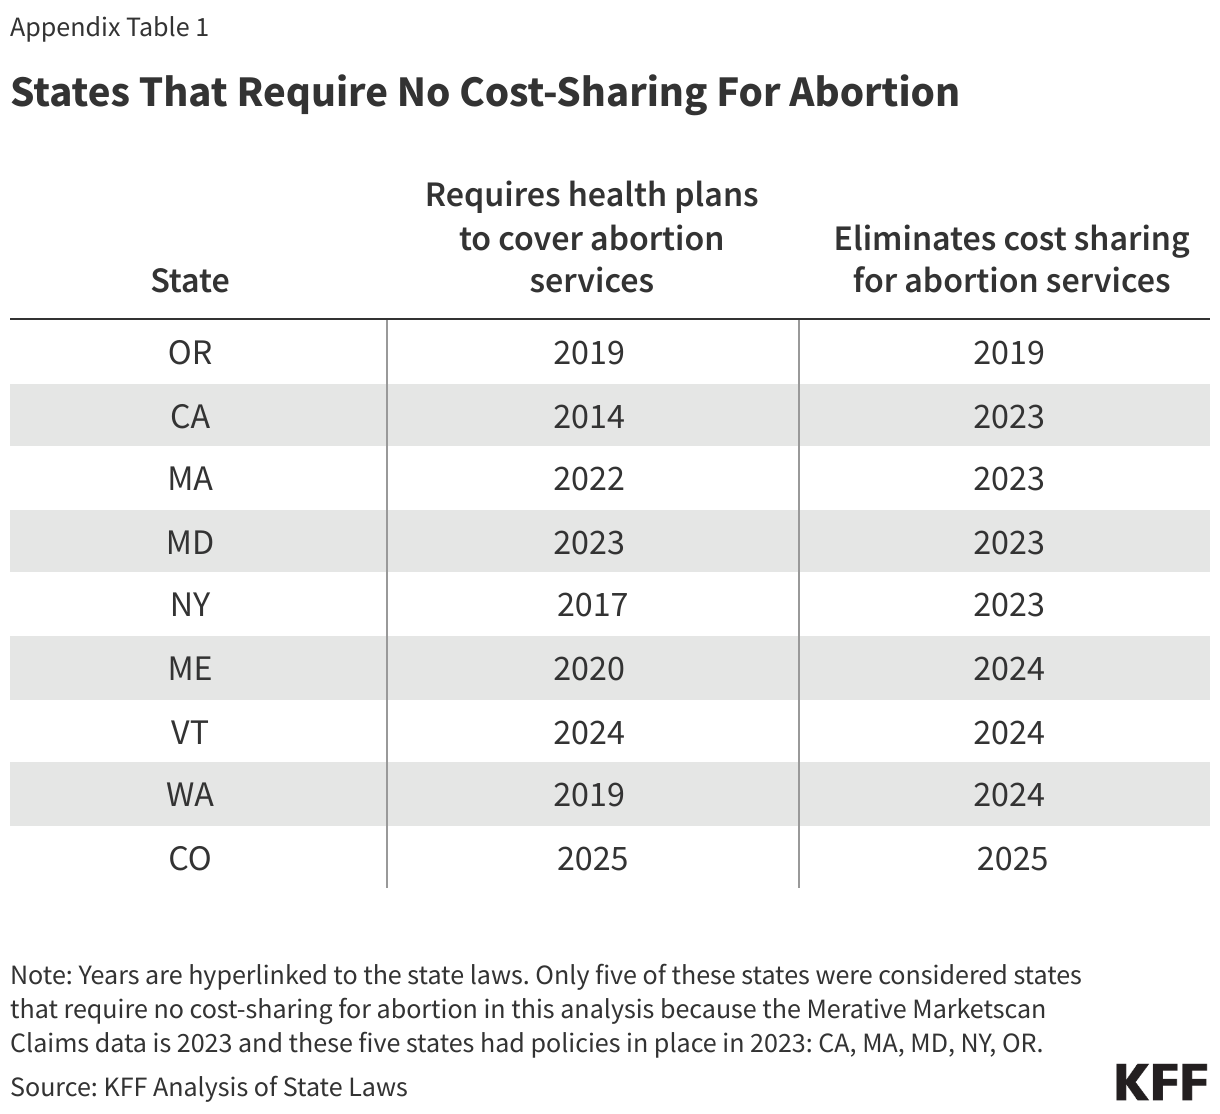
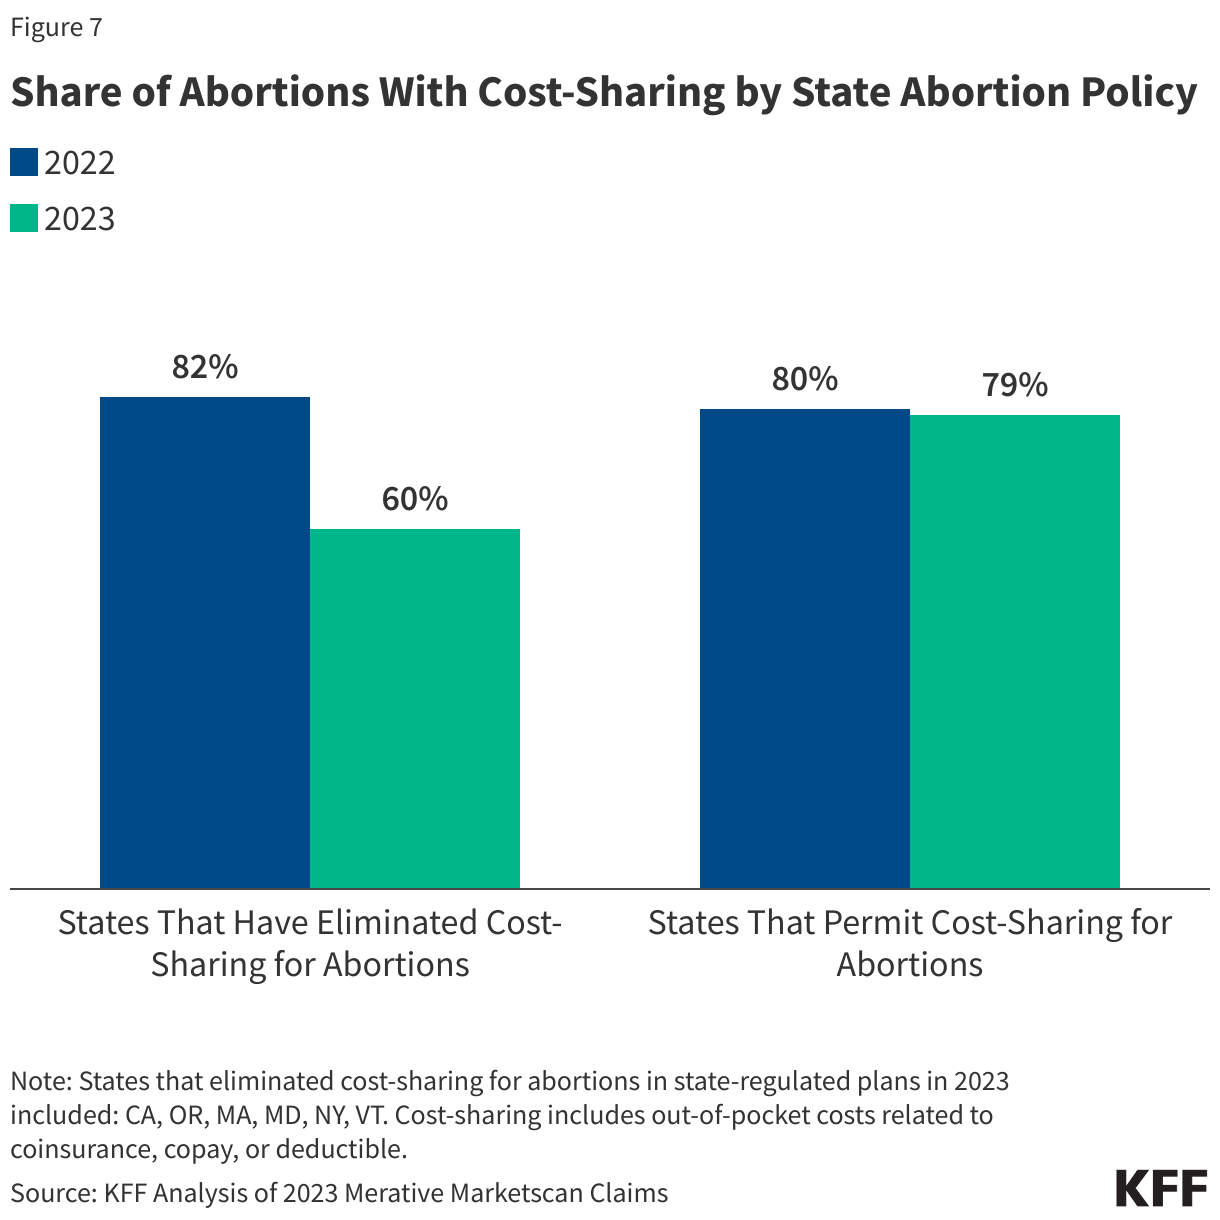
  • In the five states that had policies eliminating cost-sharing for abortion services in place in 2023, the share of women with cost-sharing for an abortion decreased substantially from 82% in 2022 to 60% in 2023, while it was unchanged in states that permit cost-sharing for abortion (80% in 2022 and 79% in 2023).

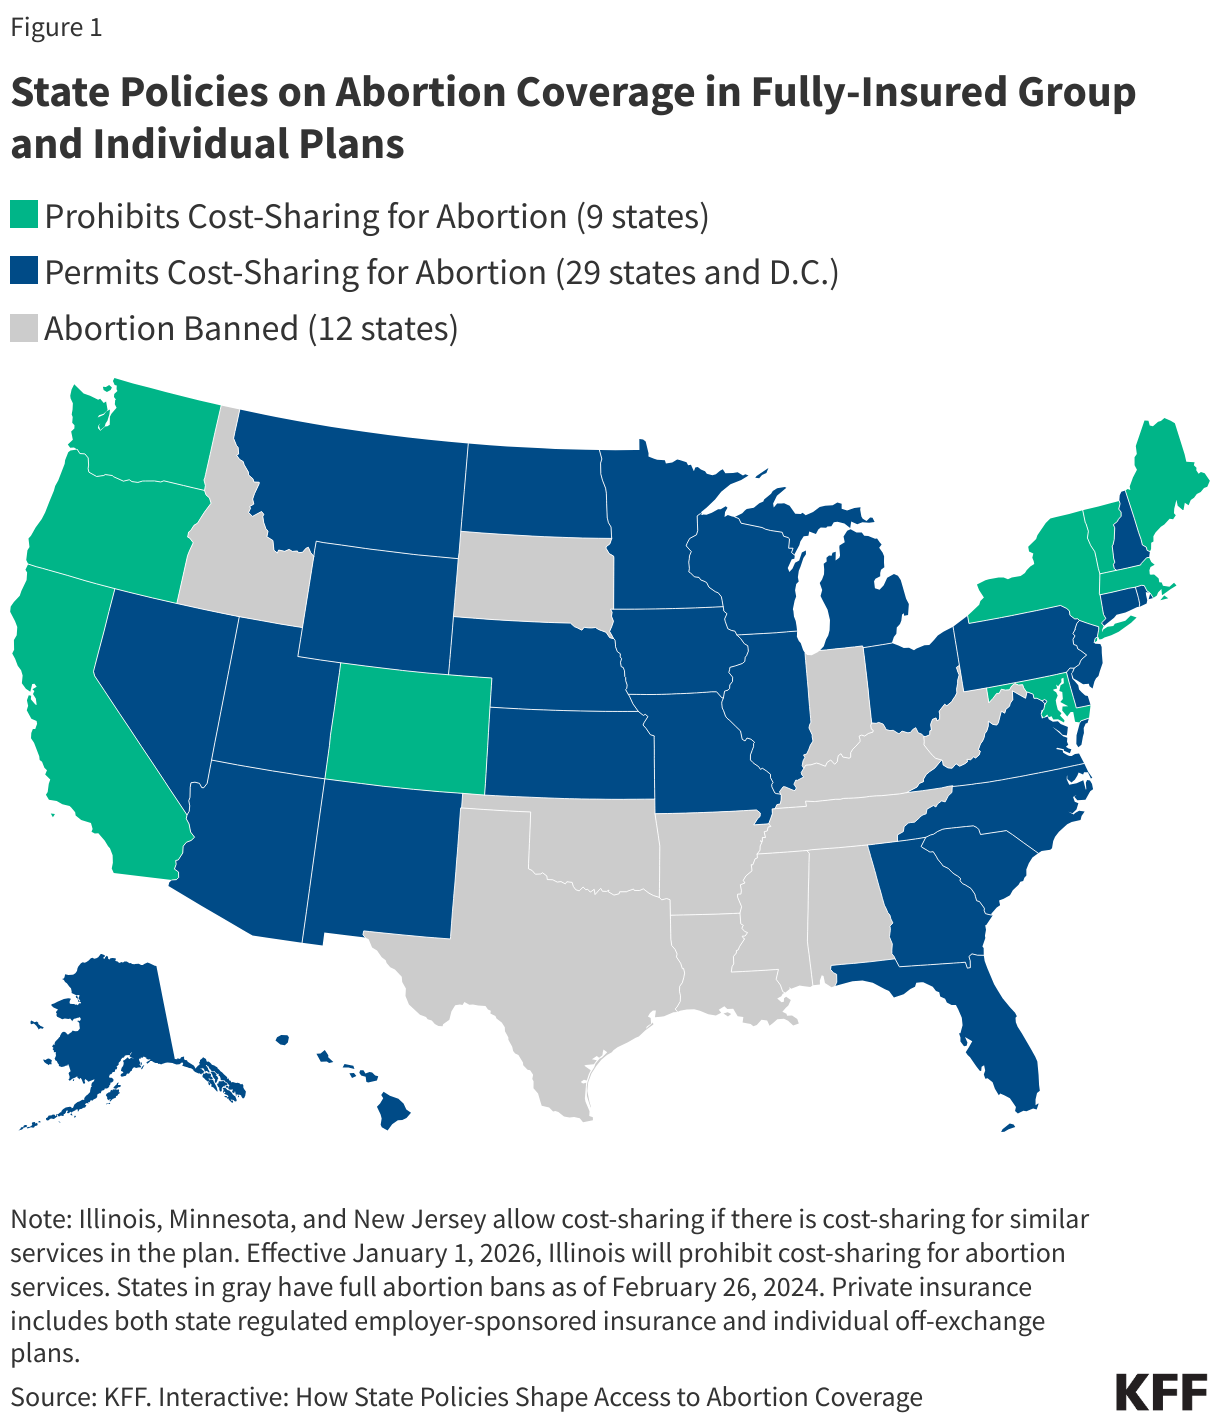
In recent years, insurance coverage of abortion has been the focus of state lawmakers in their efforts to either restrict or expand access to abortion services. Since the passage of the ACA in 2010, many of the states that now have moved to ban or restrict abortion have banned state regulated plans sold through their state exchanges from covering abortion.  However, since 2022 when Roe v Wade as overturned, many states that support abortion rights enacted laws requiring coverage, typically free of cost-sharing, to support access to services (Figure 1).

State Policies on Abortion Coverage in Fully-Insured Group and Individual Plans

Even before these state actions, many women did not use their insurance to pay for abortions, even when it was covered, because of the highly confidential and stigmatized nature of abortion care.  As a result, most people with private insurance end up paying the full costs of abortion that can range from $563 for medication abortion to upwards of $895 for second-trimester abortion. The result has been that those full costs have been borne by women even when they are insured, and insurance has not had to pay for a service that is often covered.

In their efforts to shore up and protect access to abortion and reproductive rights after the Dobbs decision, a handful of states have enacted policies, requiring first dollar coverage for abortion services for people enrolled in state regulated plans. The intent of these policies is to reduce financial barriers to abortion by making the services more affordable.  To get a better understanding of how much private plans are reimbursing health care providers for abortion and related services (see Medicaid reimbursement analysis) and document the out-of-pocket spending that people incur when they use their insurance, we conducted an analysis of the 2023 Merative Marketscan claims database, a large national sample of healthcare claims for people enrolled in employer sponsored insurance plans in both the state-regulated and self-insured markets.

Costs for Ancillary Abortion Services

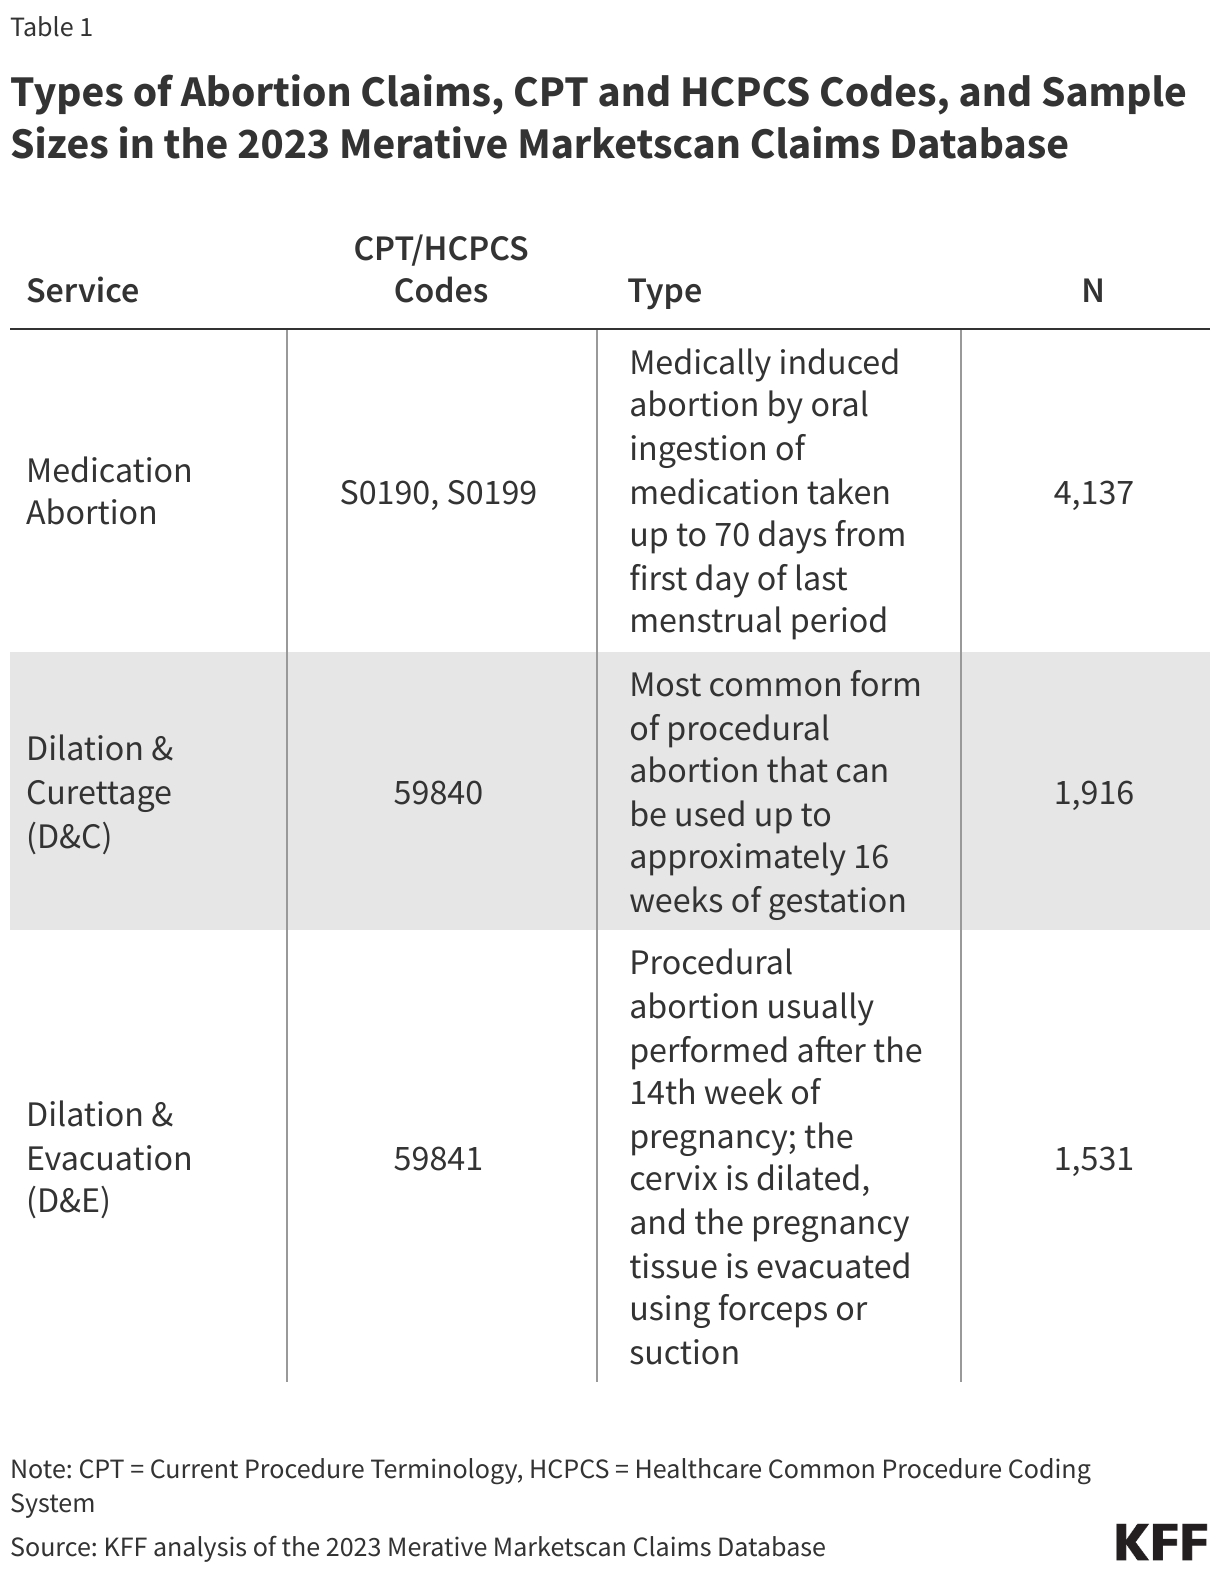
For medication abortion, there are typically two different approaches to billing for services provided: (1) billing the medications plus any ancillary services; or (2) billing the medications plus the global medication abortion code (S0199), a bundled code that includes all associated services and supplies. For abortion procedures (such as D&Cs and D&Es), most providers bill for the procedure plus any associated services and supplies (Table 1). However, some states have implemented a bundled reimbursement that includes the procedure and associated services and supplies.

Types of Abortion Claims, CPT and HCPCS Codes, and Sample Sizes in the 2023 Merative Marketscan Claims Database

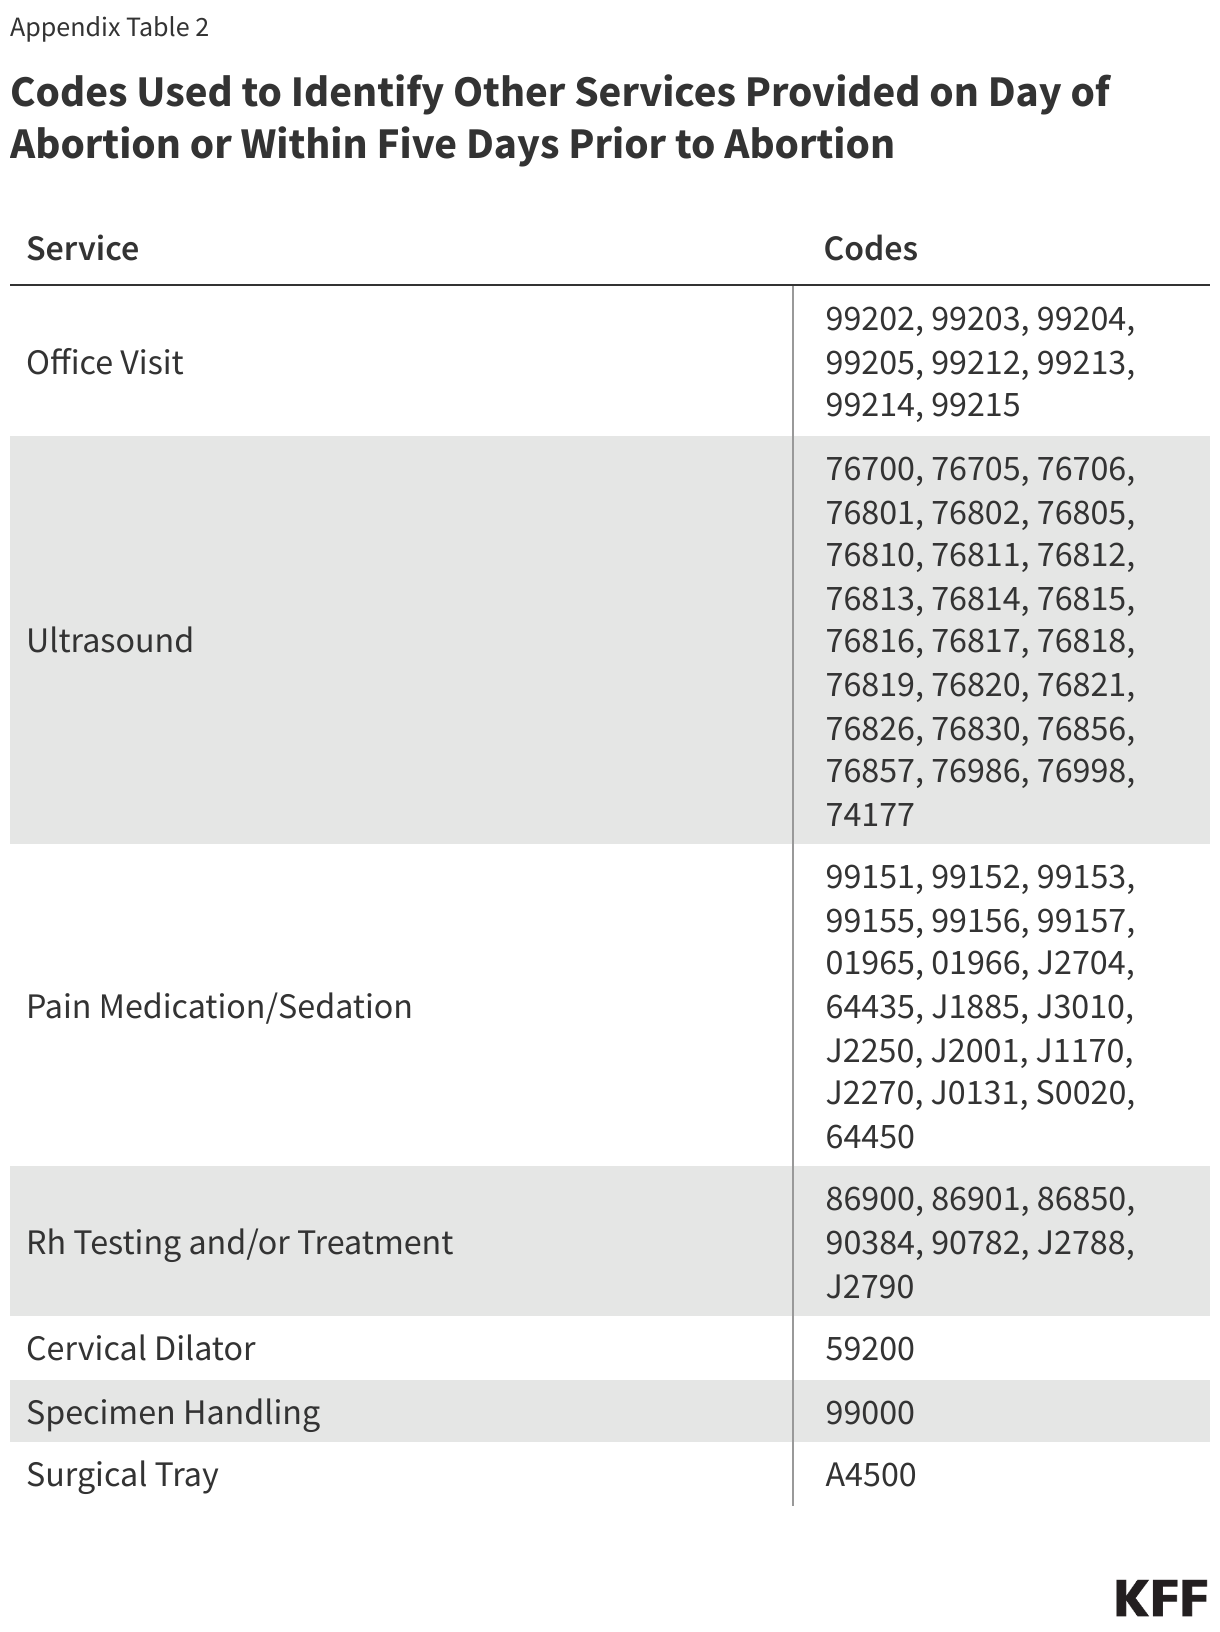
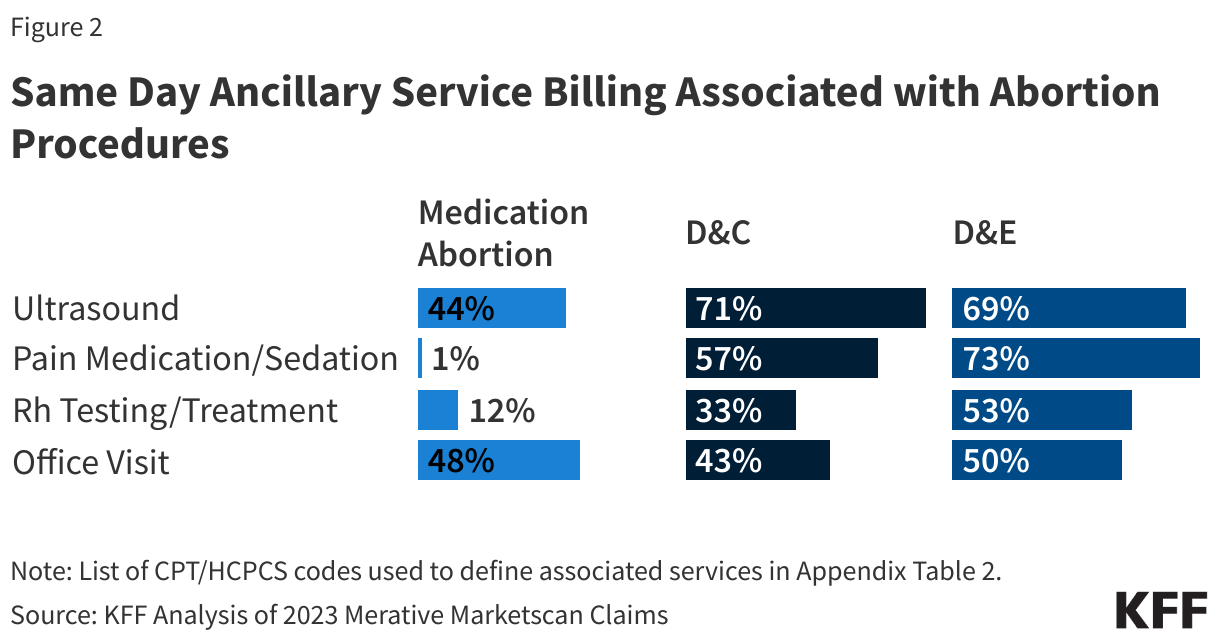
For non-bundled scenarios, other services commonly billed as part of the abortion service include ultrasounds, pain medication/sedation, Rh testing and/or treatment, the office visit, cervical dilator, specimen handling, and the surgical tray (Figure 2).

Ultrasound: Ultrasounds were commonly billed with a D&C procedure (71%) and D&E procedure (69%); 44% of medication abortions also include a separate ultrasound claim. This is likely an undercount of ultrasound provision because ultrasounds could be bundled into the abortion codes, especially for the global medication abortion code. Ultrasound is not a medical requirement for first-trimester abortion care but is required by some state laws. Medication abortion without ultrasonography has been shown to be as effective and safe as medication abortion with ultrasonography.

Pain Medication and/or Sedation: A claim for pain medication and/or sedation was billed with many D&E procedures (73%) and over half of D&C procedures (57%). Other medications may be provided that are bundled as part of the procedure and not separately billed.

Rh testing and/or treatment: One third of D&C procedures (33%) and over half of D&E procedures (53%) included a claim for Rh testing and/or treatment (53%). Only 12% of medication abortions included a claim for Rh testing and/or treatment.  have shown that induced first-trimester abortion is not a risk factor for Rh sensitization, indicating that Rh testing and treatment are unnecessary before 12 weeks’ gestation.

Office Visit: Comprehensive office visits are often considered part of the abortion procedure and may not be separately reimbursable. However, half of D&E procedures (50%), four in ten (43%) D&C procedures, and nearly half 48%) of medication abortions included a separate office visit claim within 5 days of the abortion.

Surgical Tray, Specimen Handling, and Cervical Dilator: Other services that providers bill for with an abortion include the surgical tray used during the surgical procedure, specimen handling, and a cervical dilator. These may appear less commonly in claims because they may be bundled with the procedure code for the abortion. Cervical dilators are sometimes inserted a day or two before a procedure.

Same Day Ancillary Service Billing Associated with Abortion Procedures

Total Costs of Abortion Care

The median total costs of abortion services and all ancillary services billed for on the day of the abortion including the insurance payment plus any out-of-pocket expenses paid by the consumer including coinsurance, deductible, and copay were $562 for medication abortion, $1,046 for D&C, and $4,872 for D&E procedures, which usually occur later in pregnancy (Figure 3). Higher costs may also be associated with abortions taking place in emergency situations. We found 3% of abortions included an evaluation management code for an emergency room visit or an ambulance ride on the day of the abortion or within the five days prior to the abortion.

Median Total Costs for Abortion Services for Females Enrolled in Employer Plans, 2023

Most incurred out-of-pocket costs for their abortion services including 62% of those obtaining a medication abortion, 68% of those obtaining a D&C procedure, and 76% of those obtaining a D&E procedure (Figure 4). This can include copays, coinsurance, or deductible amounts. Among those with some out-of-pocket costs, 62% had a copay, 29% paid something towards their deductible, and 40% had some coinsurance payment.

Share of Abortions Among Patients Insured by Employer Plans That Had Out-Of-Pocket Charges, by Service

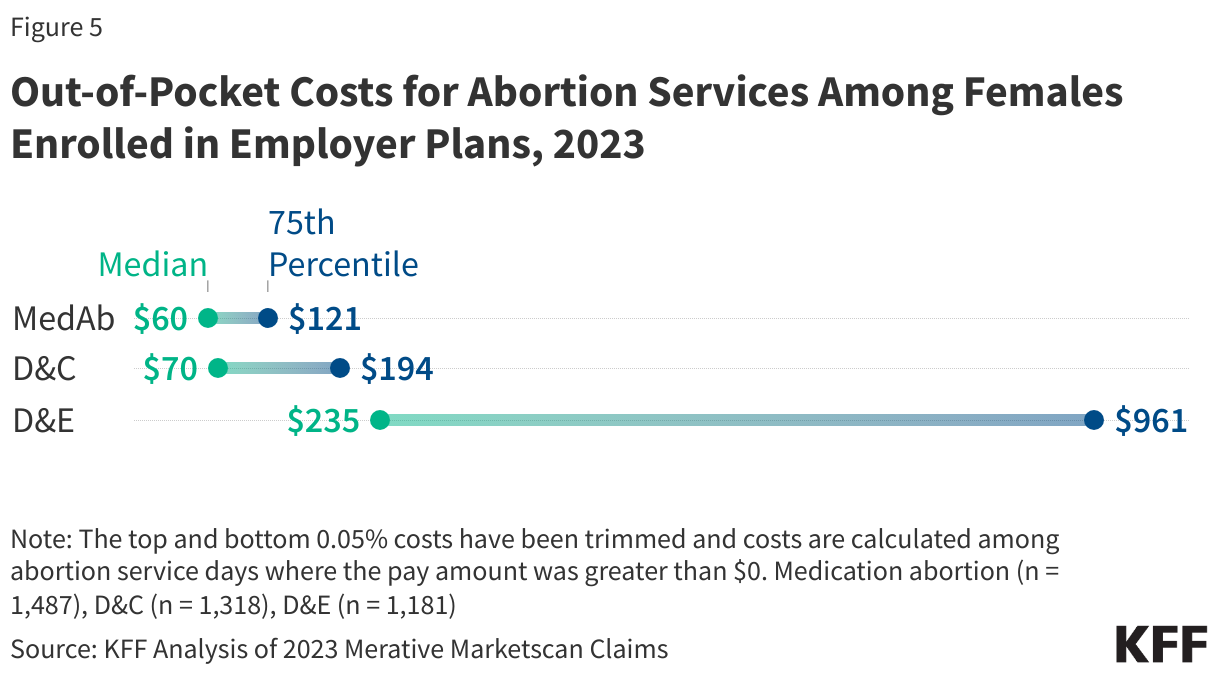
Among those with out-of-pocket costs, half with a medication abortion or D&C procedure paid less than $70. However, a quarter paid more than $121 for a medication abortion and more than $194 for a D&C. Median out-of-pocket amounts on the day of a D&E procedure were $235, but those in the upper quartile paid close to $1,000 out-of-pocket (Figure 5).

Out-of-Pocket Costs for Abortion Services Among Females Enrolled in Employer Plans, 2023

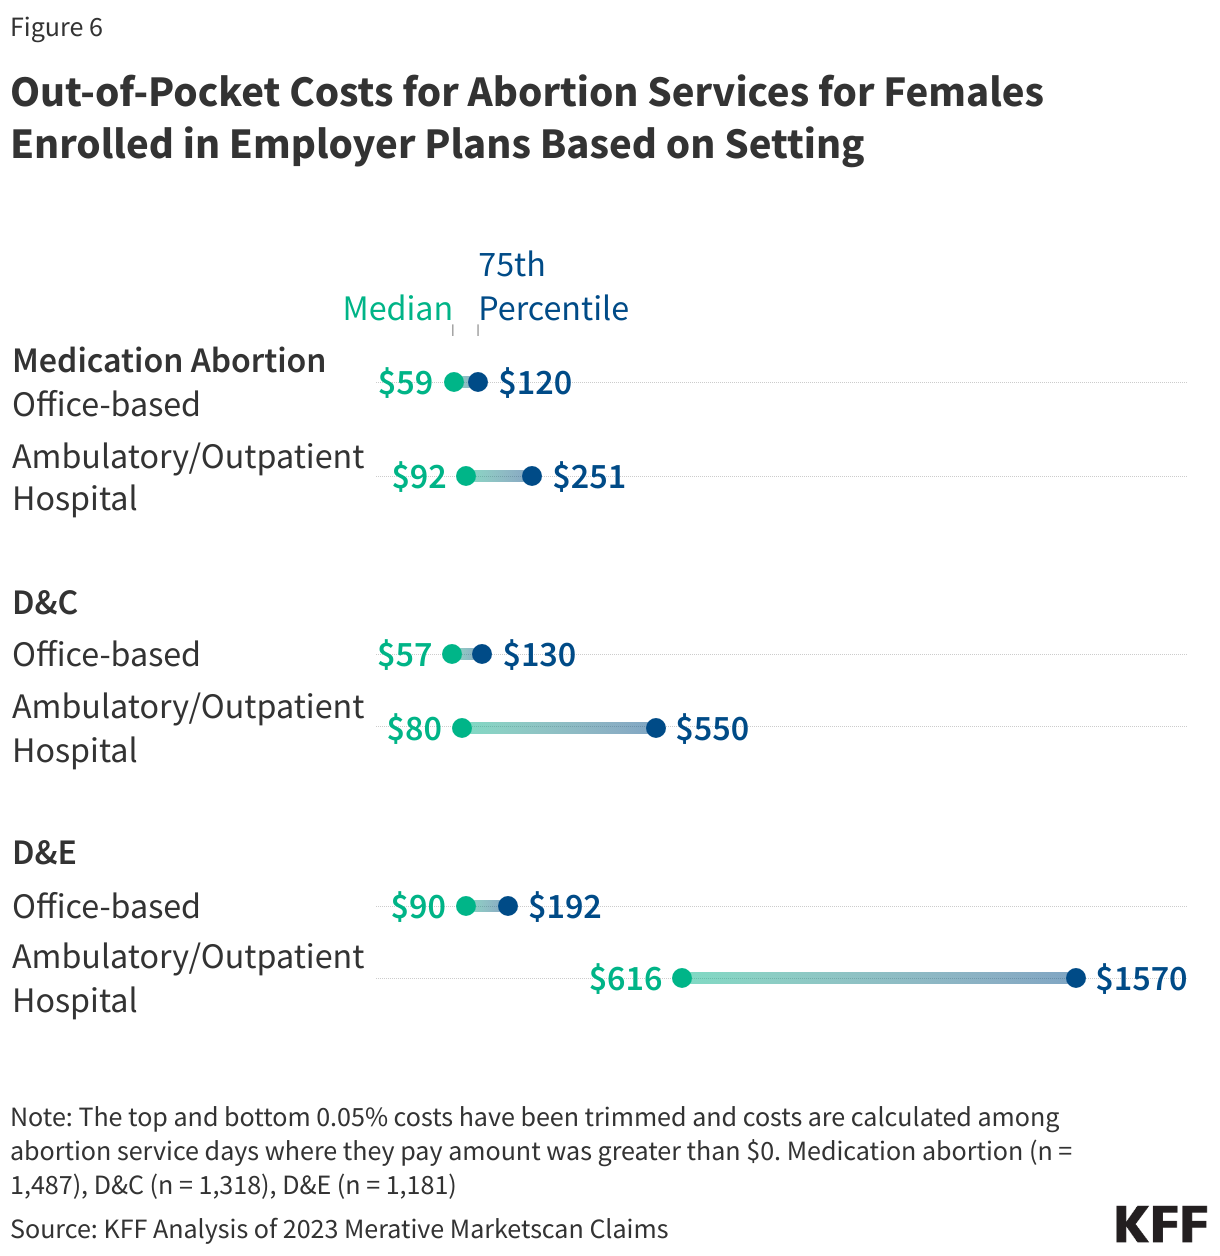
The site of abortion services can have a substantial impact on the amount of out-of-pocket costs incurred by the patient. While out-of-pocket costs for medication abortion are similar in office-based and ambulatory/outpatient hospital settings, procedural abortions in ambulatory/outpatient hospital settings result in higher out-of-pocket costs for patients compared to those in office-based settings. The differences are largest for D&E procedures where the median out-of-pocket costs for a D&E procedure in an office-based setting is $90 compared to $616 in an ambulatory/outpatient hospital setting. Those in the upper quartile paid around $200 and more out-of-pocket for an office-based D&E procedure, while those in an ambulatory/outpatient hospital setting paid more than $1500 out-of-pocket (Figure 6). Higher out-of-pocket costs in ambulatory/outpatient hospital settings compared to office-based setting is not unique to abortion services.

Out-of-Pocket Costs for Abortion Services for Females Enrolled in Employer Plans Based on Setting

Of the nine states that have passed policies eliminating cost-sharing for abortion in state-regulated plans, five were in effect in 2023, which is the most recent year of the Merative Marketscan Claims data: OR, CA, MA, MD, and NY. On average, in these five states, the share of women with cost-sharing for an abortion decreased substantially from 82% in 2022 to 60% in 2023 (Figure 7). In states that permit cost-sharing for abortions in their state-regulated plans, there was essentially no change in the share of women with cost-sharing for abortions from 2022 (80%) to 2023 (79%).

Share of Abortions With Cost-Sharing by State Abortion Policy

The reduction in the share of women with cost-sharing for abortion seems to be largely driven by a large reduction in California, which is also the state with the largest number of abortions in the Merative Marketscan Claims. However, Maryland, New York, and Oregon also saw reductions in the share of women with cost-sharing for abortion from 2022 to 2023. The Merative Marketscan Claims data include both state-regulated and self-funded plans that are generally not subject to state requirements for insured plans and it is not possible to determine which plans in the claims data are state-regulated or self-funded. Therefore, the reduction in cost-sharing in states that have eliminated cost-sharing for abortions could represent women enrolled in state-regulated plans or it could demonstrate a spillover effect into self-funded plans following state requirements or both.

On the Horizon

Policies that eliminate cost-sharing for abortion services could encourage individuals to use their insurance to pay for their abortion service rather than pay directly for the services. For many this will be a substantial reduction in out-of-pocket costs, potentially making abortion services more accessible and affordable for those with coverage.  Women with low incomes are disproportionately affected as they are less likely to be able to afford the out-of-pocket costs for an abortion without relying on assistance or forgoing the service.

While eliminating out-of-pocket costs for abortion care could increase plan premiums, the University of California found these increases if implemented in the state would be less than 0.01% of premium costs, a minor increase. Plans pay significantly more for pregnancy care and labor and delivery than abortion services. Abortion care also tends to be more isolated episodes without requiring substantial ongoing care and therefore has lower impact on premiums.

It should be noted that even if out-of-pocket costs for abortion services are eliminated, the many costs outside of the actual service, such as travel, lodging, unpaid time off, can still place a financial burden on individuals seeking abortion services, particularly for those living in states where abortion is banned or restricted and must travel for their care.

Methods

The 2023 Merative Marketscan claims database was used to examine the amounts paid by insurance for abortion and related services, the share of females ages 18 to 49 who had out-of-pocket charges for their abortion, and the amount of out-of-pocket costs paid for the abortion and associated services on the day of the abortion and within five days prior to the abortion. Out-of-pocket costs were calculated by summing the coinsurance, copay, and deductible costs among those with any out-of-pocket costs (i.e. greater than $0). Claims representing 7,685 unique abortions: 4,137 medication abortion claims, 1,916 dilation and curettage (D&C) claims, and 1,531 dilation and evacuation (D&E) claims were identified (Table 1). All spending on the day of the abortion, as well as other associated services provided within the 5 days prior to the abortion, including ultrasounds, office visits, pain medication/sedation, Rh testing and/or treatment, cervical dilator, specimen handling, and the surgical tray were also included in the analysis since many state laws mandating coverage, include the abortion itself as well as abortion-related medical services.

States That Require No Cost-Sharing For Abortion
Codes Used to Identify Other Services Provided on Day of Abortion or Within Five Days Prior to Abortion