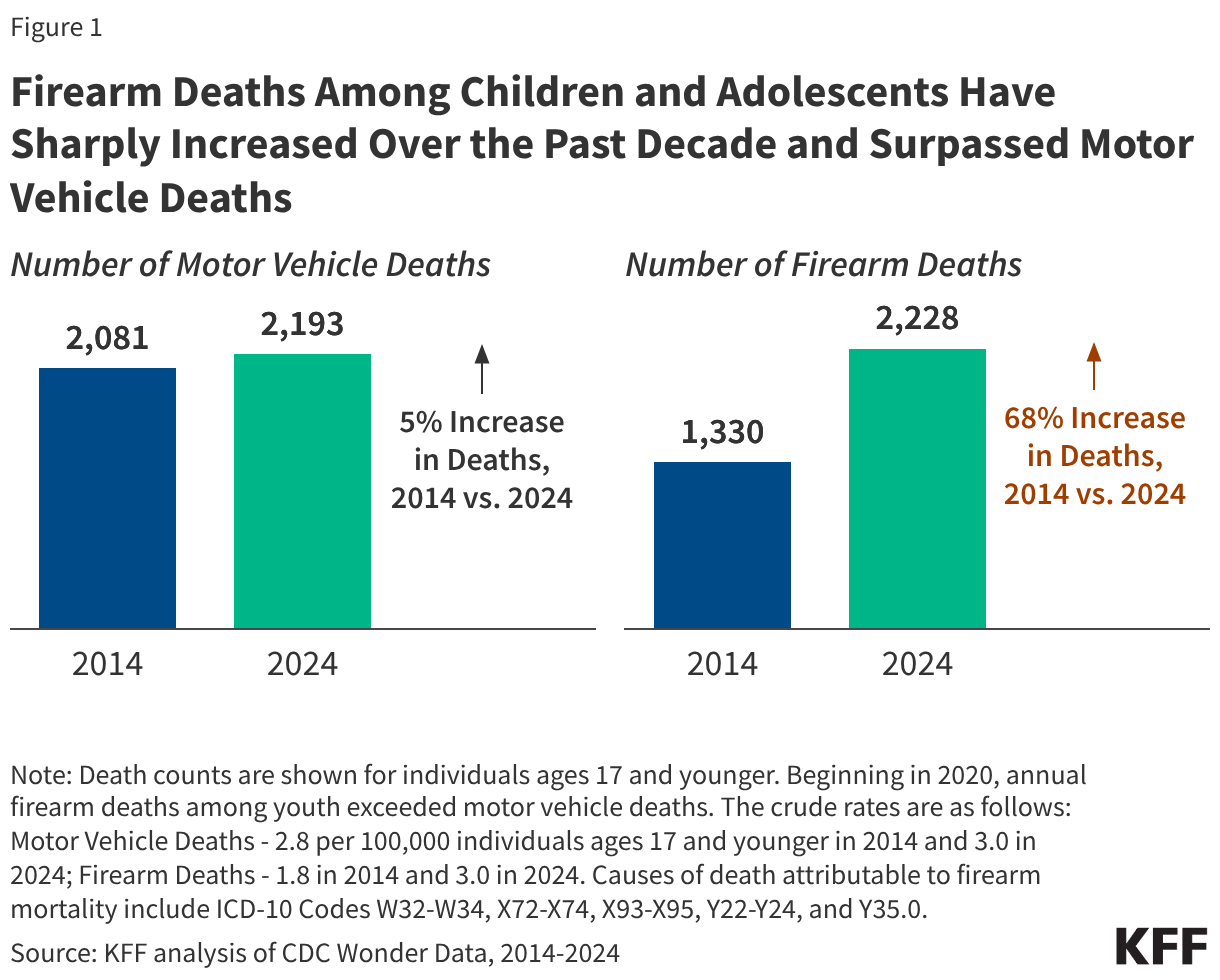
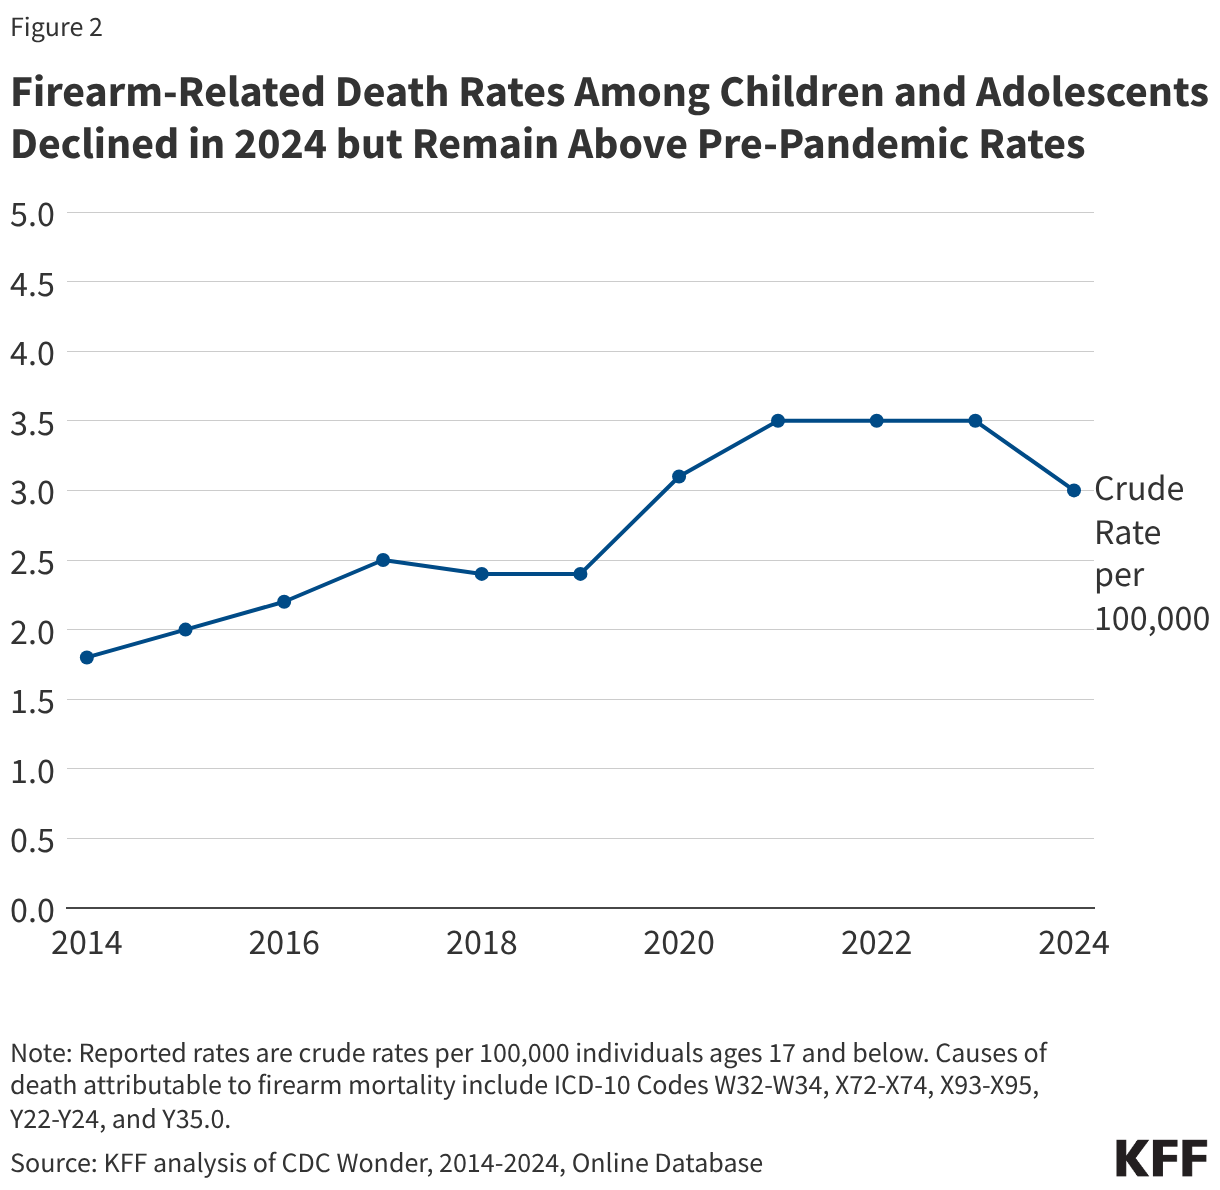
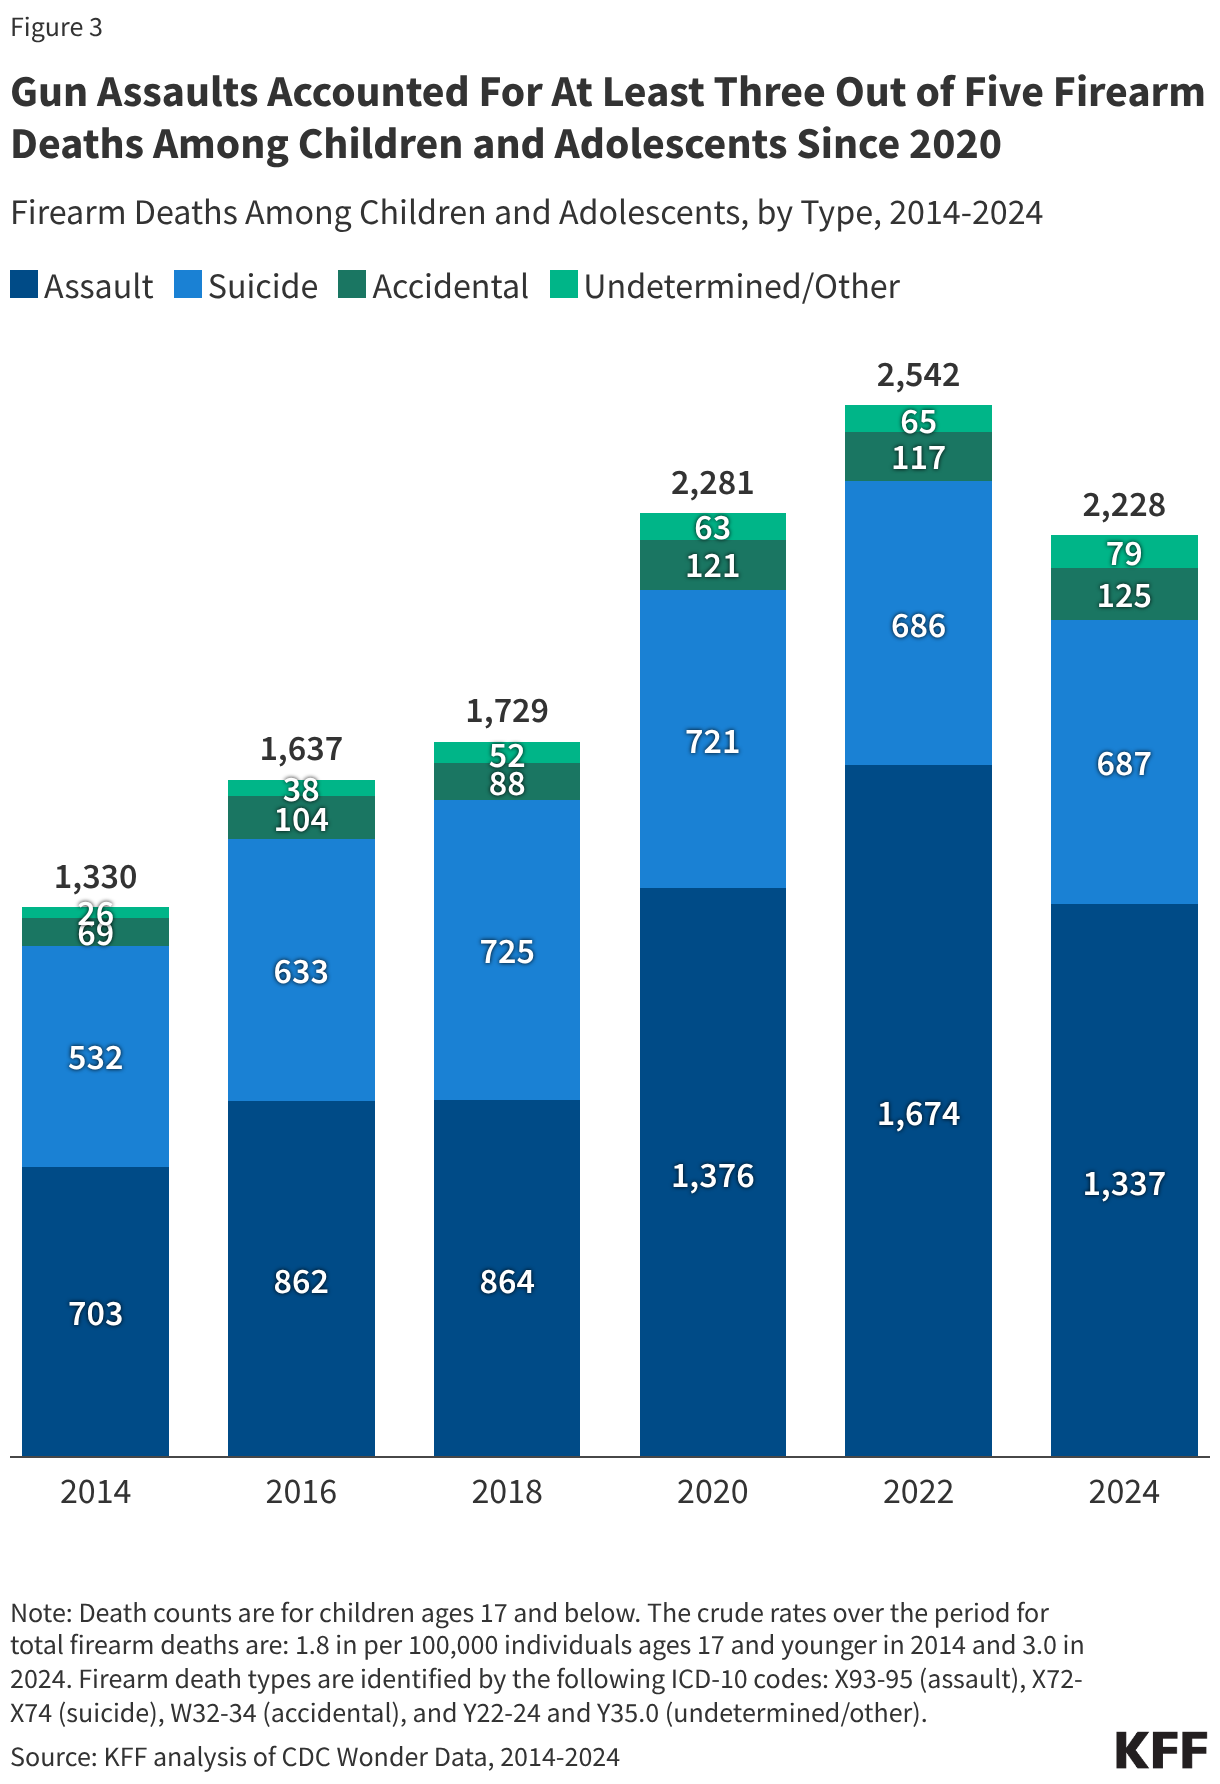
Summary
Following the record declines in life expectancy amid the COVID-19 pandemic, life expectancy in the U.S. has rebounded but remains lower than that of comparable countries. Chronic diseases, homicide, and substance use disorders contribute to the U.S.’ lower life expectancy. While life expectancy is improving in the U.S., with 2024 estimates showing a return to pre-pandemic rates, racial and ethnic disparities persist.
This analysis examines trends in life expectancy between 2021 and 2023 by race and ethnicity as well as the drivers of life expectancy and leading causes of death by race and ethnicity. It is based on KFF analysis of National Center for Health Statistics data. While overall life expectancy data are available through 2024, the latest available data by race and ethnicity are as of 2023. Key takeaways include:
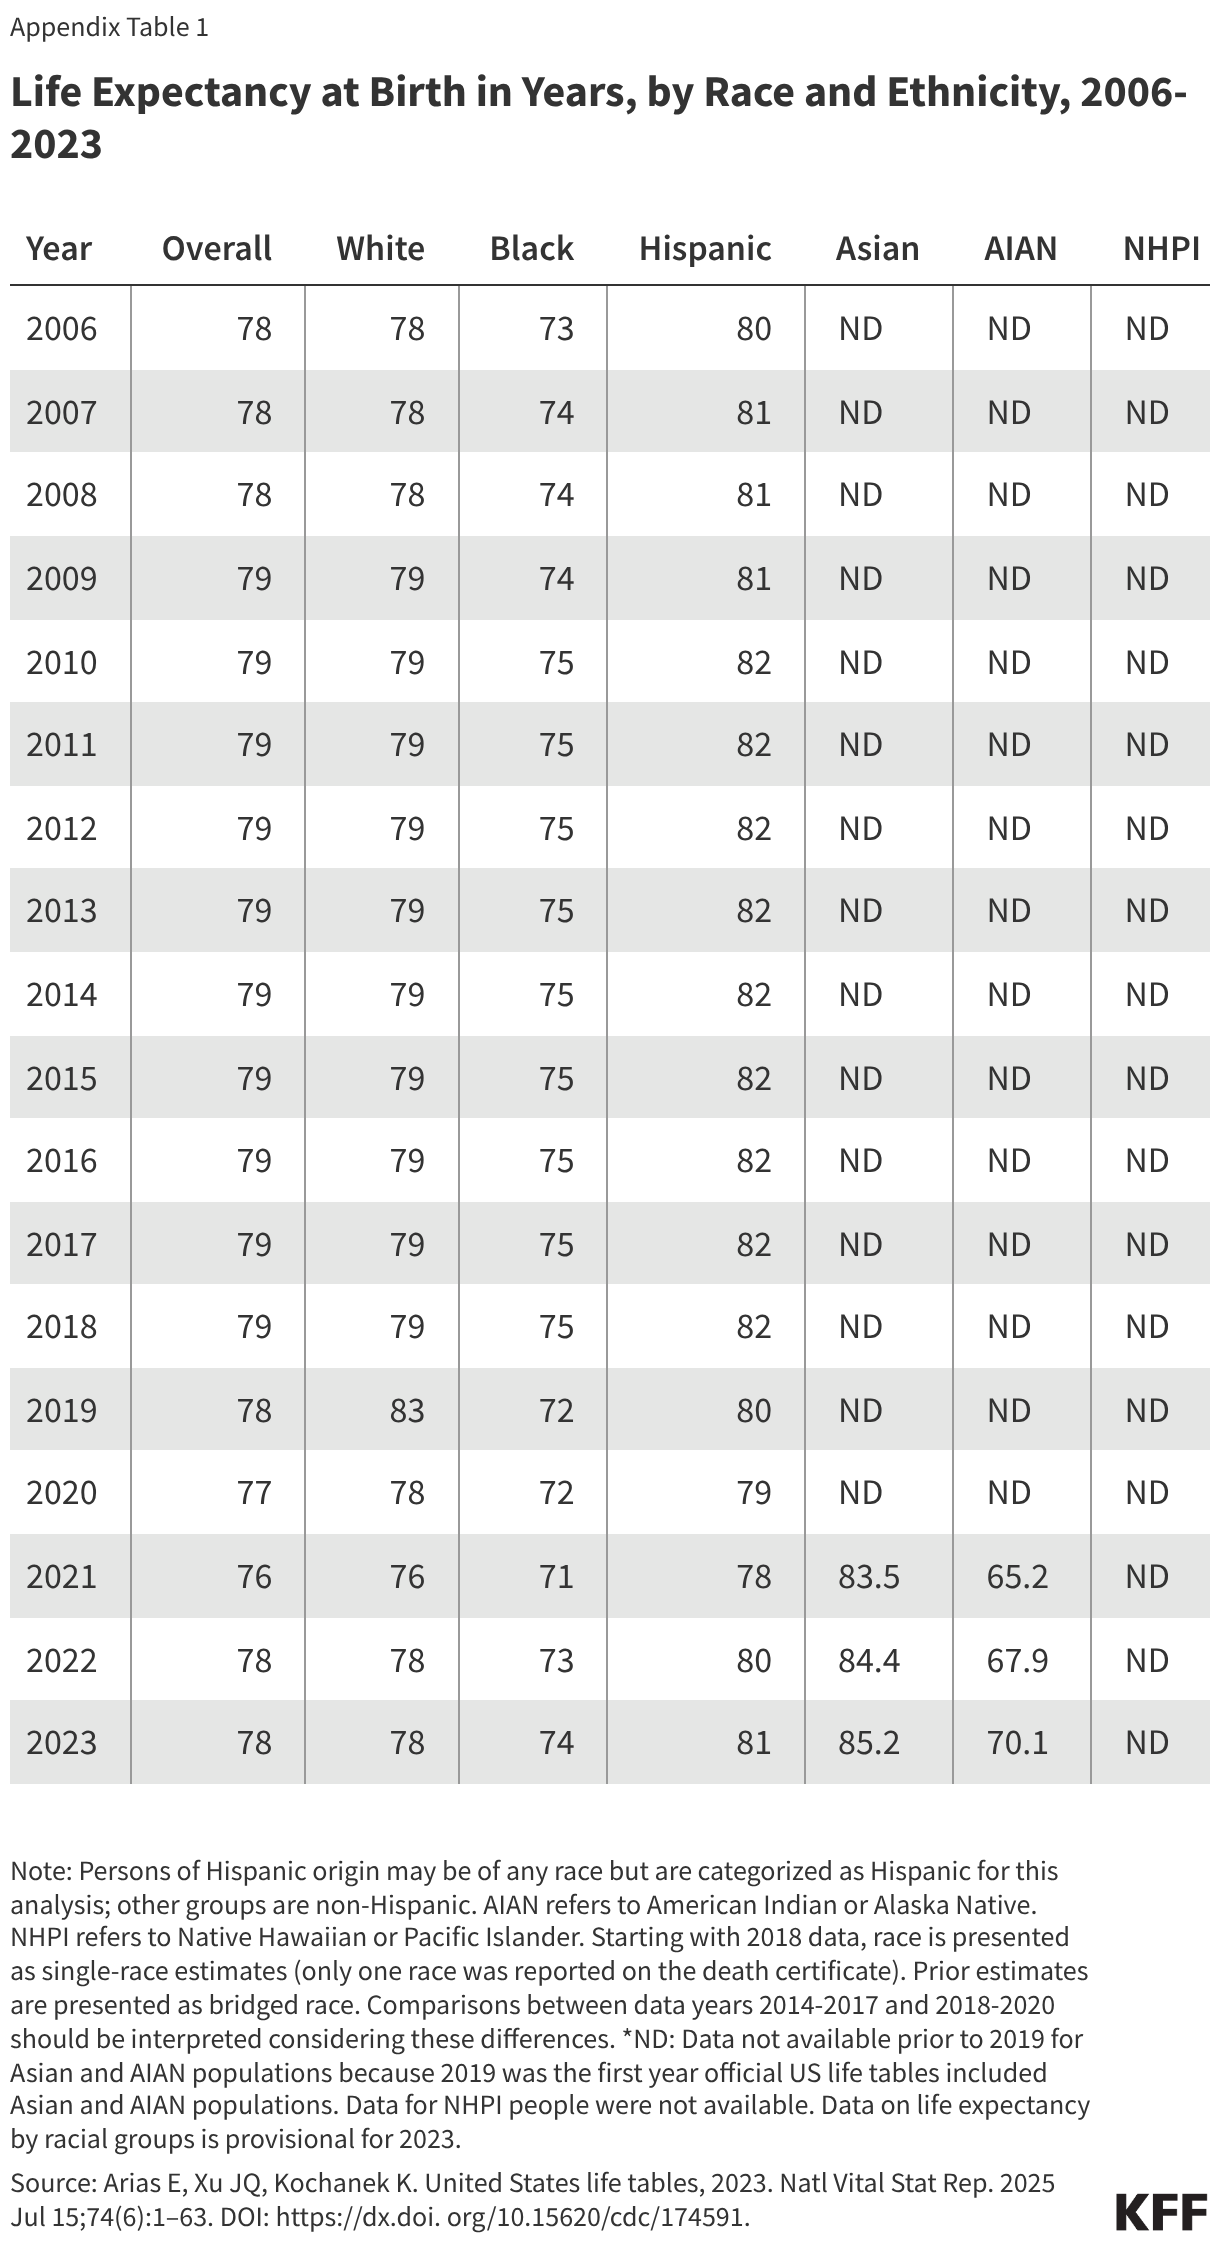
- There was an increase in life expectancy between 2021 and 2023 across all racial and ethnic groups. American Indian and Alaska Native (AIAN) people experienced the largest increase in life expectancy of 4.5 years during this time, followed by Hispanic (3.5 years) and Black people (2.8 years).
- Despite these increases, life expectancy was lowest for AIAN people at 70.1 years, followed by Black people, whose expectancy was 74 years as of 2023. In comparison, life expectancy was 78.4 years for White people and 81.3 years for Hispanic people. Life expectancy was highest for Asian people at 85.2 years. Data were not available for Native Hawaiian or Pacific Islander (NHPI) people.
- The increases in life expectancy were largely driven by the decline in COVID-19 deaths, which disproportionately impacted groups of color during the pandemic. Although falling COVID-19 mortality was the primary contributor to the recent increase in life expectancy across groups, other contributors varied by race and ethnicity.
Multiple factors contribute to racial and ethnic differences in life expectancy, including differences in health insurance and access to care and social and economic factors that influence health. Some life expectancy patterns are not fully understood. Notably, Hispanic people have longer life expectancy than their White counterparts despite facing inequities typically associated with poorer health outcomes, which researchers have hypothesized may stem from better outcomes for some subgroups, particularly recent immigrants to the U.S. Measures of life expectancy for Asian people may mask underlying differences among subgroups of the population who vary across health access and social and economic factors.
Trends in Life Expectancy by Race and Ethnicity
Life expectancy at birth represents the average number of years a group of infants would live if they were to experience throughout life the age-specific death rates prevailing during a specified period. Life expectancy is one of the most used measures of population health, enabling comparisons in health status between countries, states, local communities, and demographic groups. Differences in life expectancy occur across a broad range of dimensions which often intersect with each other, including race, socioeconomic status, gender, geography, and other characteristics. For example, in the U.S. and all other comparable countries, men tend to have shorter life expectancy at birth than women. In 2024, life expectancy for women in the U.S. was 4.9 years higher than for men (81.4 years vs. 76.5 year, respectively), and similar gender disparities persisted within racial and ethnic groups. This analysis focuses on differences in life expectancy by race and ethnicity overall, but within racial and ethnic groups there is variation by these other factors.
Prior to COVID-19, life expectancy generally increased, with a peak in 2014 followed by small declines, with racial disparities persisting throughout. While gains in life expectancy were experienced across racial and ethnic groups, Black people have consistently had a lower life expectancy than White people, and Hispanic people have had a longer life expectancy. When life expectancy reached its peak in 2014, life expectancy for Black people was more than three years shorter than White people (75.3 vs. 78.8 years), and Hispanic people had a longer life expectancy at 82.1 years. Separate data were not reported for Asian, AIAN and NHPI people for this period. In 2018 and 2019, life expectancy remained relatively stable overall and across groups (Appendix Table 1).
Amid the COVID-19 pandemic life expectancy declined by 2.7 years and racial and ethnic disparities widened between the years 2019 and 2021 (Figure 1). Between 2019 and 2021, AIAN people experienced a decline of 6.6 years in life expectancy, the largest across racial and ethnic groups during that period, followed by Hispanic people at 4.2 years and Black people at 4.0 years. Declines were smaller for White (2.4 years) and Asian people (2.1 years). These declines widened gaps in life expectancy for AIAN and Black people compared to White people and reduced the advantage in life expectancy experienced by Hispanic people relative to White people.
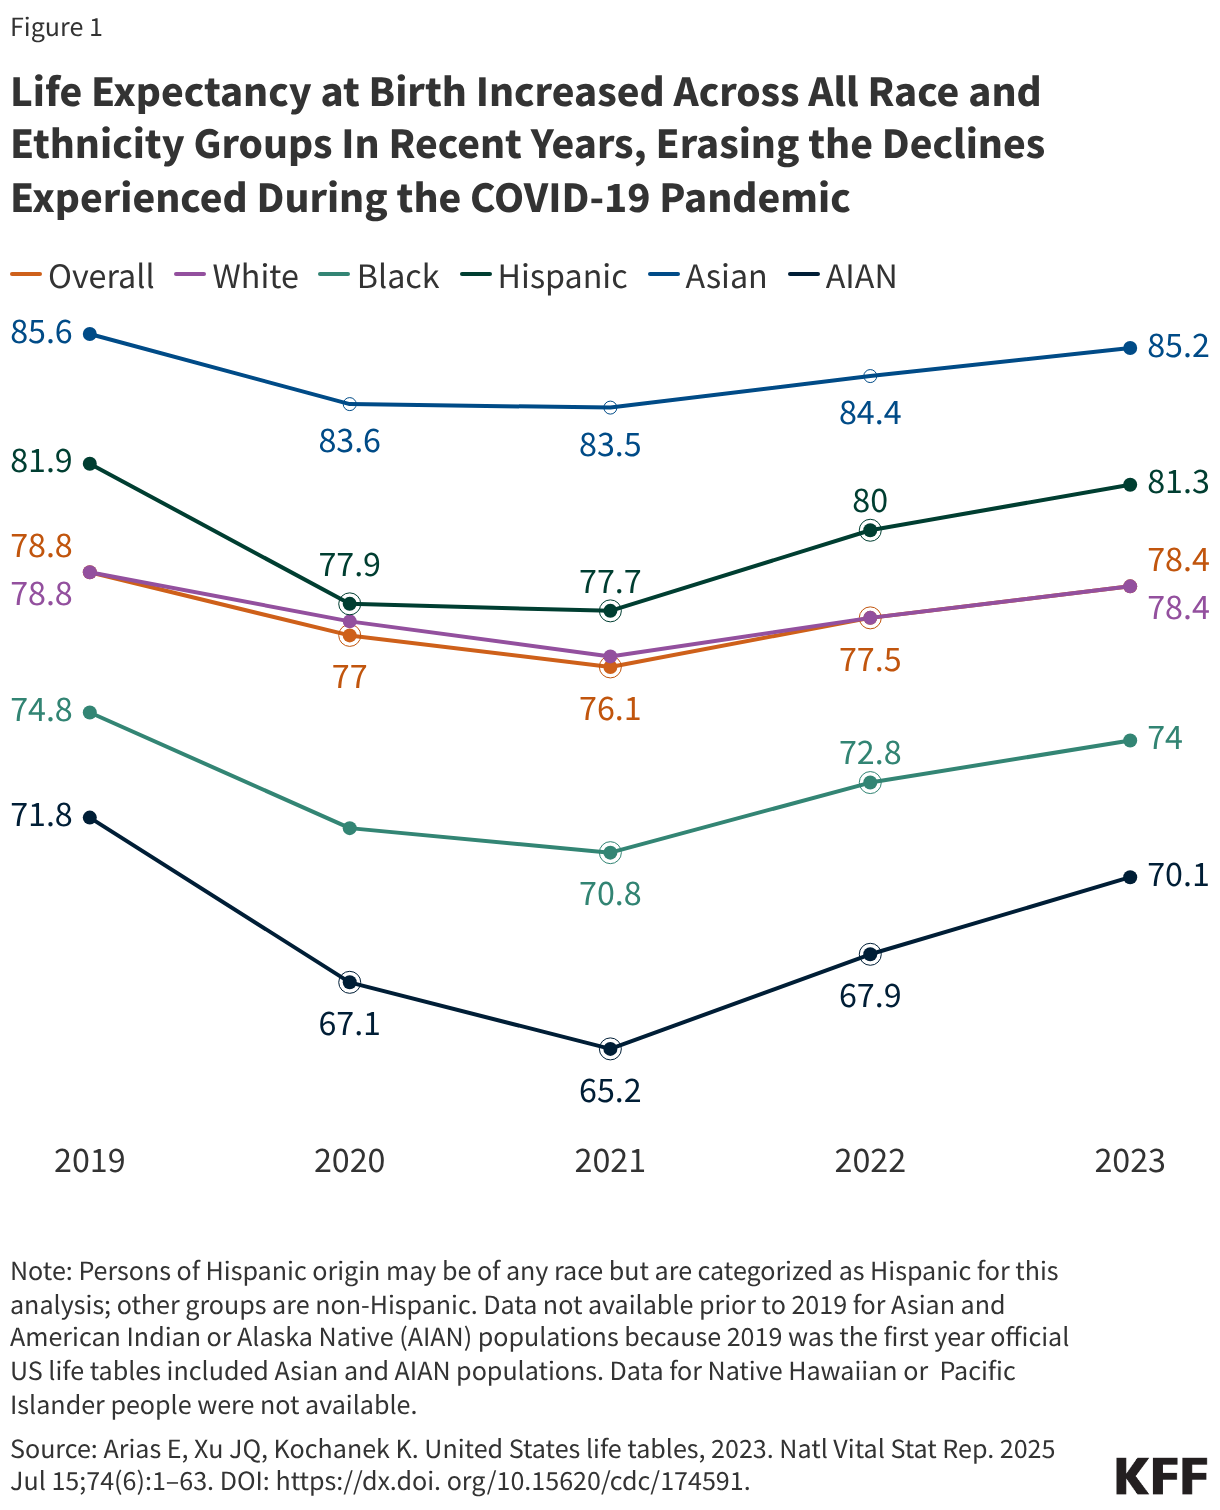
Following the COVID-19 pandemic, life expectancy increased and racial disparities narrowed. Between 2021 and 2023 there was an increase of 2.3 years in life expectancy, largely erasing the decline experienced during the pandemic. Gains in life expectancy were larger for most racial and ethnic groups between 2021 and 2022 compared to 2022 and 2023, reflecting the large drop in COVID-19 deaths in these years. Between 2021 and 2022, there were larger increases in life expectancy for AIAN (2.6 years), Hispanic (2.3 years), and Black (2 years) people compared to White (1.1 years) and Asian (0.9 years) people, narrowing the gaps in life expectancy. While the increases between 2022 and 2023 were smaller, the trends were similar with AIAN people having the largest gain (2.3 years), followed by Hispanic (1.3 years) and Black people (1.2 years), and smaller increases for White (0.9 years) and Asian (0.8 years) people. Overall life expectancy estimates for 2024 show an increase of 2.9 years (76.1 to 79.0 years) between 2021 and 2024, reversing the declines experienced during the COVID-19 pandemic. However, life expectancy data by race and ethnicity are not yet available for 2024.
Causes of Recent Life Expectancy Changes
The pandemic resulted in higher mortality rates, which drove rapid declines in life expectancy between 2019 and 2021. COVID-19 was the largest contributor to the decline in life expectancy for AIAN, Black, and White people and was the second largest contributor for Hispanic and Asian people, in 2020 and 2021. While COVID-19 was a major cause of death during the pandemic, it was the third leading cause of death in both 2020 and 2021, following heart disease and cancer. The variation in declines across racial and ethnic groups reflected underlying social and economic factors that affected communities’ exposure to the virus and subsequent access to COVID-19 vaccinations and treatment options.
The increase in life expectancy since 2021 largely reflects a decline in deaths due to COVID-19, which disproportionately affected AIAN, Black, and Hispanic people. As COVID-19 mortality fell, life expectancy rebounded among most groups, with larger increases among those that experienced the largest losses. Previous KFF analysis found that people of color accounted for 59% of excess years of life lost during the pandemic, despite making up 40% of the population. Research shows that between 2022 and 2023 falling COVID-19 deaths accounted for 56.9% of the increase in life expectancy for Hispanic people, 50.9% for Asian people, 50% for White people, 48.3% for Black people and 41.9% for Asian people. The magnitude of gains varied across groups, reflecting both the scale of each group's pandemic-era losses and the degree to which other causes of death contributed to or offset the recovery.
Beyond declines in COVID-19 deaths, decreases in other causes of death also contributed to life expectancy gains across racial and ethnic groups. AIAN people experienced the largest overall increases in life expectancy in 2023, driven not only by falling COVID-19 mortality but also declines in deaths due to chronic liver disease, heart disease, diabetes, and accidents. Hispanic people saw the second largest increase, reflecting declines in COVID-19, heart disease, cancer, diabetes, and Alzheimer disease, though increases in deaths related to perinatal conditions, suicide, and nutritional deficiencies tempered overall gains.For Black people, declines in COVID-19, heart disease, homicide, diabetes, and cancer drove improvements, partially offset by rising deaths due to suicide, birth defects, nutritional deficiencies, and certain other conditions. Among White people, reductions in COVID-19, heart disease, unintentional injuries, diabetes, and cancer contributed to gains, but increases in deaths from nutritional deficiencies, Parkinson disease, and several infectious diseases limited progress. Asian people experienced the smallest increase, with declines in COVID-19, heart disease, cancer, stroke, and Alzheimer disease offset by increases in deaths from birth defects, flu and pneumonia, septicemia, nutritional deficiencies, and homicide.
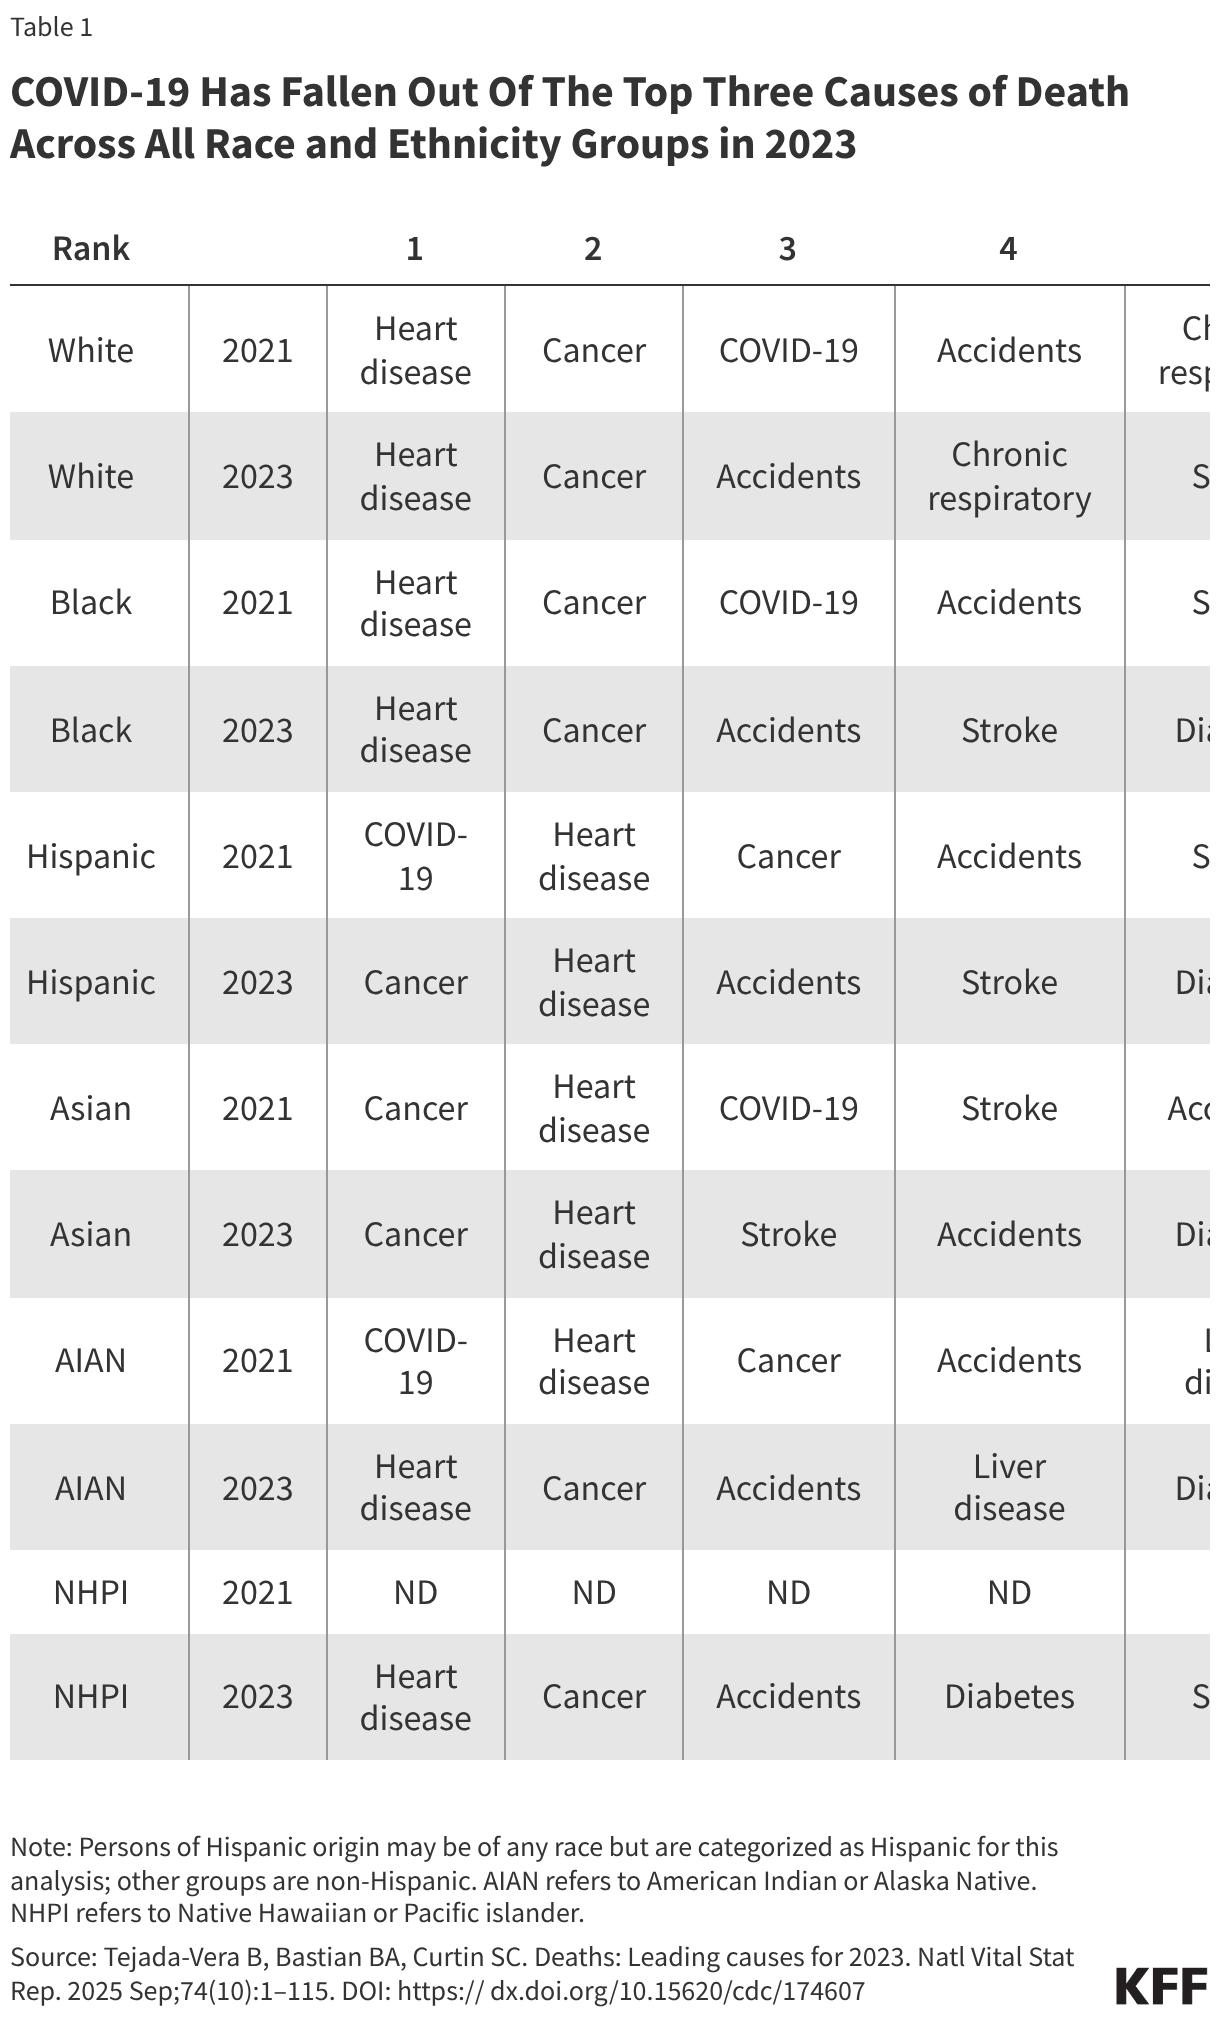
As in prior years, the leading causes of death in 2023 continued to vary by race and ethnicity, with the most significant change since 2021 being the disappearance of COVID-19 from the top causes of death (Table 1). In 2021, COVID-19 ranked among the top three leading causes of death across every racial and ethnic group. By 2023, it had fallen to eighth place among White people and dropped out of the top ten entirely for all other groups. Heart disease and cancer reemerged as the top two causes of death across nearly all groups, restoring a pre-pandemic mortality pattern. Among AIAN people, accidents and drug overdoses ranked third and liver disease fourth. Deaths by suicide were a significant contributor to deaths among AIAN people, ranking eighth in 2023. Other recent data show particularly high rates of opioid overdose deaths, alcohol use disorder related deaths and deaths by suicide among AIAN people compared to other groups. Among Black people, homicide remained the sixth leading cause of death in 2023, reflecting disparities in gun violence.
Research suggests that the factors driving disparities in life expectancy are complex and multifactorial. They include differences in health insurance coverage and access to care, social and economic factors, and health behaviors that are rooted in structural and systemic racism and discrimination. Data show that people of color are less likely to have health insurance and more likely to face barriers to accessing care, such as not having a usual source of care. Among AIAN people, chronic underfunding of the Indian Health Service further contributes to barriers to health care. Research shows that, overall, uninsured people are more likely than those with insurance to go without needed medical care due to cost and less likely to receive preventive care and services. Research further shows that uninsured people have higher mortality rates and lower survival rates than people with insurance.Hispanic, AIAN, and Black people are more likely to have lower incomes and educational attainment levels compared to White people, and studies find that people with higher incomes and more education live longer lives. Other social and economic factors may also affect life expectancy. For example, historic housing policies, including redlining, and ongoing economic inequities have resulted in residential segregation that pushed many low-income people and people of color into segregated urban neighborhoods.Research finds that living in racially segregated neighborhoods is associated with shorter life expectancy and higher mortality rates for Black people.
Some life expectancy patterns are not fully understood or observable in the data presented. Notably, Hispanic people have longer life expectancy than their White counterparts despite experiencing increased barriers to accessing health care and social and economic challenges typically associated with poorer health outcomes. Researchers have hypothesized that this finding, sometimes referred to as the Hispanic or Latino health paradox, in part, may stem from variation in outcomes among subgroups of Hispanic people by origin, nativity, and race, with better outcomes for some groups, particularly recent immigrants to the U.S. However, the findings still are not fully understood. Measures of life expectancy for Asian people as a broad group may mask underlying differences among subgroups of the population who vary across health access and social and economic factors. Research has shown variation in life expectancy among Asian subgroups, with Chinese people having the longest life expectancy and Vietnamese people having the shortest life expectancy, which may in part reflect differences in socioeconomic status. Additionally, data limitations for NHPI people prevented the ability to include them in this analysis. Efforts to expand and improve data collection for NHPI people will be important to gain a better understanding of their experiences, particularly since they suffered disproportionate impacts on mortality from COVID-19.