What to Know About Medicare Coverage of Telehealth
Editorial Note
This explainer was updated on March 19, 2026 to include the latest data about telehealth in Medicare.
Introduction
Use of telehealth, which includes a range of health care services delivered to patients by providers at a separate location, has grown rapidly in recent years, among both privately-insured patients and Medicare beneficiaries. Prior to the COVID-19 pandemic, telehealth utilization in traditional Medicare was very low, but it rose dramatically in 2020 following temporary measures put in place at the start of the COVID-19 public health emergency that greatly expanded the scope of Medicare coverage of telehealth. Since early 2021 telehealth use has declined steadily, but it remains higher than pre-pandemic levels, with considerable variation by level of income, disability, and urban versus rural location, among other factors.
Congress has repeatedly extended several pandemic-era flexibilities around Medicare coverage of telehealth, but with a few key exceptions (discussed below), most pandemic-era telehealth flexibilities remain temporary. This leaves them vulnerable if authorization lapses, such as during the government shutdown that began on October 1, 2025, when Medicare coverage of many telehealth services briefly lapsed before being retroactively reinstated on November 12, and creates uncertainty for both providers and beneficiaries. Many of Medicare’s telehealth flexibilities were recently granted a two-year extension under the Consolidated Appropriations Act of 2026 and will remain in effect through December 31, 2027, while a handful have been incorporated into the program on a permanent basis through prior legislation and through the annual physician fee schedule rulemaking process. There is bipartisan support for proposed legislation to permanently expand Medicare coverage of telehealth, and many health care providers are supportive of keeping these services accessible, but questions remain about the longer-term impact on patient care, Medicare spending, and program integrity.
This brief provides answers to key questions about the current scope of Medicare telehealth coverage, including both temporary and permanent changes adopted through legislation and regulation, and policy considerations that lie ahead.
Key Takeaways:
- Congress has enacted legislation several times to extend Medicare’s expanded coverage of telehealth, which is currently due to expire in December 2027. Prior to the COVID-19 public health emergency, Medicare coverage of telehealth was limited to beneficiaries in rural areas and to certain types of providers, facilities, and services.
- While use of telehealth in traditional Medicare has declined since the early months of the COVID-19 pandemic, use remains nearly two times higher than it was pre-pandemic. Use is higher among urban (vs. rural) beneficiaries, beneficiaries who are dually eligible for both Medicare and Medicaid (vs. beneficiaries who are not Medicaid eligible), and beneficiaries with disabilities or end-stage renal disease (vs. beneficiaries who qualify for Medicare based on age).
- Medicare currently pays telehealth providers at different rates depending on the location of the beneficiary receiving the service. Medicare pays telehealth providers at a higher rate for telehealth services provided to beneficiaries located in their homes than for telehealth services provided to beneficiaries located in a separate clinical setting from the provider. When telehealth is provided to beneficiaries in clinical settings, Medicare also pays a separate fee for practice expenses to the facility where the beneficiary is located, which results in total Medicare payments that are generally higher relative to home-based telehealth despite the lower provider payment rate.
- Coverage rules are different in Medicare Advantage, where plans have some flexibility to offer additional benefits, including telehealth benefits, not routinely covered by traditional Medicare (outside of the current temporary flexibilities).
- Policymakers have considered legislation that would permanently expand Medicare coverage of telehealth, and are weighing the implications for Medicare spending and program integrity.
What is the Current Scope of Medicare Telehealth Coverage?
Prior to the declaration of the COVID-19 public health emergency, Medicare coverage of telehealth was largely restricted to beneficiaries in rural areas and to certain types of providers, facilities, and services. Beneficiaries were typically required to travel from their homes to an approved site, such as a clinic or doctor’s office, when receiving telehealth services. To make it easier and safer for beneficiaries to seek medical care during the pandemic, the Secretary of the Department of Health and Human Services (HHS) waived many of these restrictions in March 2020, enabling broader use of telehealth for all Medicare beneficiaries. While the pandemic-related expansion of telehealth coverage under Medicare was initially due to expire at the end of the COVID-19 public health emergency, Congress has extended these flexibilities several times, most recently through December 2027, and incorporated select provisions into the program on a permanent basis (Figure 1).
The following list summarizes key provisions related to coverage of telehealth in traditional Medicare under current law, both temporary and permanent, as well as limited changes made through the annual physician fee schedule rulemaking process. (See section below for a discussion of telehealth coverage by Medicare Advantage plans.)
Temporary Telehealth Provisions (Extended by Congress Through December 31, 2027)
- Waiver of geographic and “originating site” requirements: Telehealth is currently available to Medicare beneficiaries in both urban and rural areas, and patients can receive telehealth services from any location, including their home as the “originating site.” Prior to the expansion, telehealth coverage in traditional Medicare was generally limited to rural areas, and patients were required to travel to an approved originating site, such as a clinic or doctor’s office, when receiving telehealth services. (Providers participating in select accountable care organizations (ACOs) are permitted to waive these requirements under the Bipartisan Budget Act of 2018, and may continue to provide telehealth services without geographic restrictions, and to beneficiaries in their homes, should the current temporary flexibilities expire.)
- Expansion of covered telehealth services: Medicare currently offers coverage for an expanded set of telehealth services, including physical and occupational therapy, emergency consultations, and nursing facility care. Prior to the expansion, Medicare offered coverage for a more limited set of telehealth services, such as preventive health screenings, office visits, and psychotherapy. The Centers for Medicare & Medicaid Services (CMS) has the authority to expand the list of allowable telehealth services when there is a demonstrable clinical benefit and continues to evaluate select services for inclusion on this list. Beginning in 2026, CMS has taken steps to simplify the process of expanding telehealth coverage to new services, such as eliminating the distinction between “provisional” and “permanent” services. In past years, services were often added on a provisional basis before being considered for permanent inclusion.
- Coverage of audio-only services: Medicare currently allows many telehealth services to be provided to patients via audio-only platforms, such as a telephone or a smartphone without video. Prior to the expansion, Medicare required all telehealth services to be provided via a two-way audio/video connection, such as an interactive audio-video system or a smartphone with video enabled.
- Expansion of eligible “distant site” telehealth providers: Currently, any health care provider who is eligible to bill for Medicare-covered services can provide and bill for telehealth as a “distant site” telehealth provider and may conduct an initial telehealth visit whether or not they have treated the beneficiary previously. Additionally, federally qualified health centers (FQHCs) and rural health clinics (RHCs) are authorized to provide and bill for telehealth. Prior to the expansion, only physicians and certain other providers (e.g., physician assistants, clinical social workers, and clinical psychologists) were permitted to bill for telehealth services as the distant site provider and must have treated the beneficiary receiving those services within the last three years. FQHCs and RHCs were not authorized to serve as distant site providers but could serve as originating sites if located in a qualifying area.
- Waiver of in-person visit requirement for behavioral health: Currently, Medicare beneficiaries receiving behavioral health services may opt to receive these services via telehealth with no in-person visit requirements. The Consolidated Appropriations Act of 2021 made numerous changes to Medicare coverage of behavioral telehealth (see below), including a provision that beneficiaries must have an in-person visit with their behavioral health provider no more than six months before their initial telehealth appointment and annually thereafter. Subsequent legislation has delayed this requirement, which is currently due to take effect in January 2028.
- Use of telehealth for hospice recertification: Patient recertification for the Medicare hospice benefit can currently be conducted via telehealth, provided there is a two-way audio/video connection that allows for real-time interaction between the patient and hospice provider. Prior to the expansion, only in-person encounters could be used for the purposes of hospice recertification.
Permanent Telehealth Provisions:
- Behavioral health: The Consolidated Appropriations Act of 2021 permanently removed geographic and originating site restrictions for any telehealth service used to diagnose, evaluate, or treat a mental health disorder. (These restrictions had already been lifted for treatment of substance use disorders and co-occurring mental health disorders in 2018.) While many provisions related to Medicare telehealth coverage are due to expire at the end of 2027, Medicare beneficiaries may continue to receive behavioral health services from their homes, in both urban and rural areas, and may do so via audio-only platforms if they are unable to access a video connection or do not consent to video use. Additionally, FQHCs and RHCs are permanently allowed to serve as “distant site” telehealth providers for behavioral health services.
- Removal of frequency limitations: CMS recently finalized a provision in the 2026 Physician Fee Schedule Final Rule that permanently removes frequency limitations for subsequent inpatient visits, nursing facility visits, and critical care consultations provided via telehealth. This provision took effect on January 1, 2026. However, in the absence of further action by Congress, as of January 1, 2028 (when the current temporary flexibilities expire), implementation of this provision will be limited to the types of providers, services, and settings where telehealth was permitted before the current flexibilities were put in place.
- Virtual instruction and direct supervision: The 2026 Physician Fee Schedule Final Rule also includes provisions permanently allowing direct supervision of many procedures by physicians and other supervising providers to be conducted virtually via two-way audio/video connections as well as permanently allowing teaching physicians to instruct residents virtually in all teaching settings when overseeing services provided via telehealth. These provisions took effect on January 1, 2026. However, as with other changes made through the physician fee schedule rulemaking process, implementation of these provisions will be limited in scope after January 1, 2028 should the current flexibilities expire.
What Share of Medicare Beneficiaries Use of Telehealth Services?
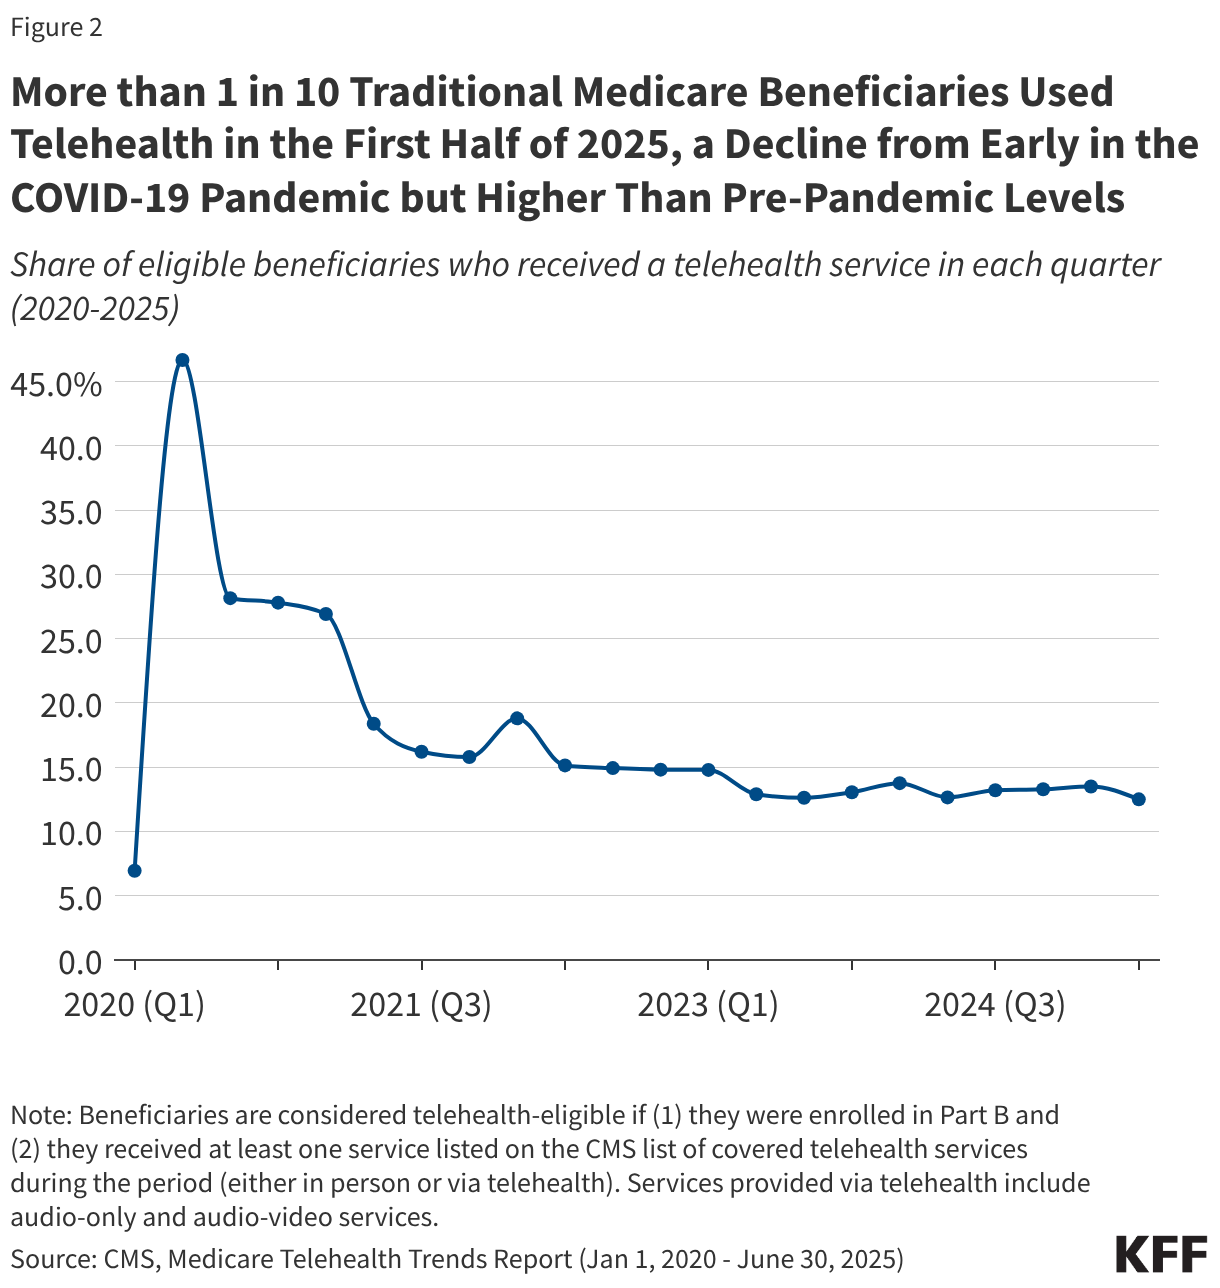
Telehealth use in traditional Medicare increased dramatically at the start of the COVID-19 public health emergency, with nearly half (46.7%) of all eligible beneficiaries receiving at least one telehealth service in the second quarter of 2020, compared to just 6.9% in the first quarter (Figure 2). While use has declined since that time, it remains nearly two times higher than pre-pandemic levels, with more than one in ten (12.5%) eligible beneficiaries receiving a telehealth service in the second quarter of 2025 (the most recent period for which data is available).
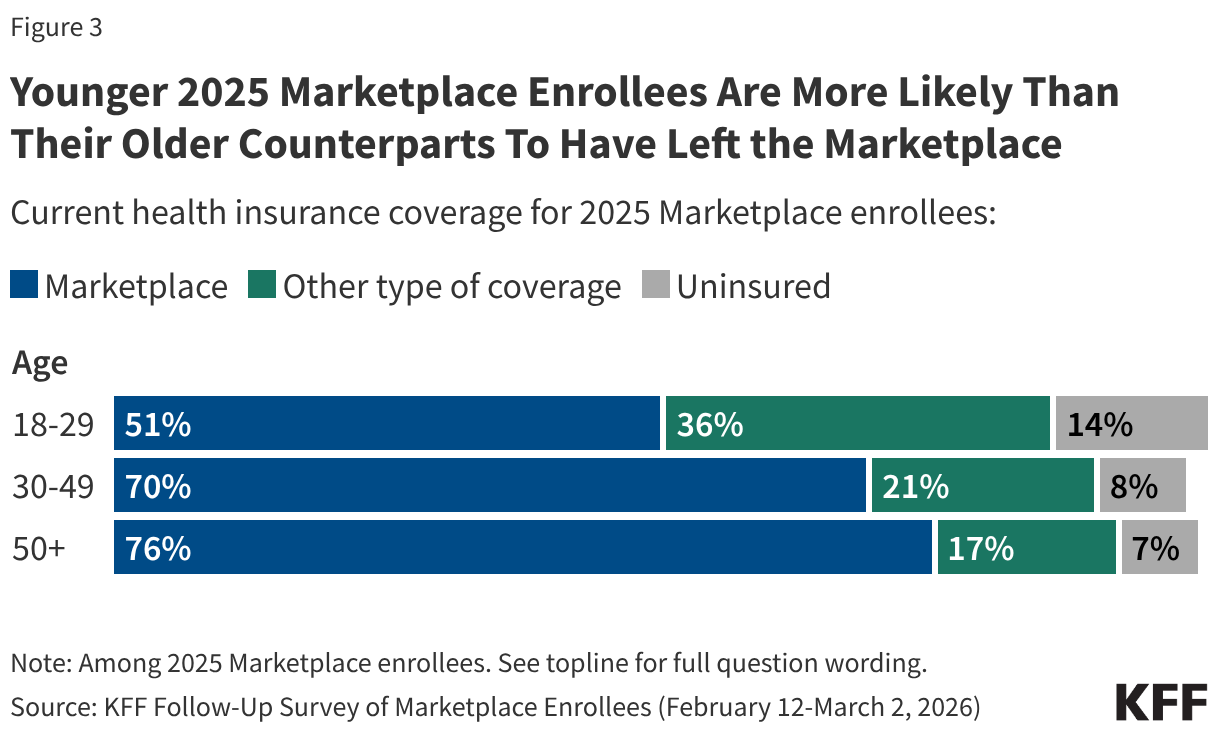
Use of telehealth services varies by geography, race and ethnicity, reason for Medicare eligibility, and dual enrollment in Medicare and Medicaid (Figure 3).
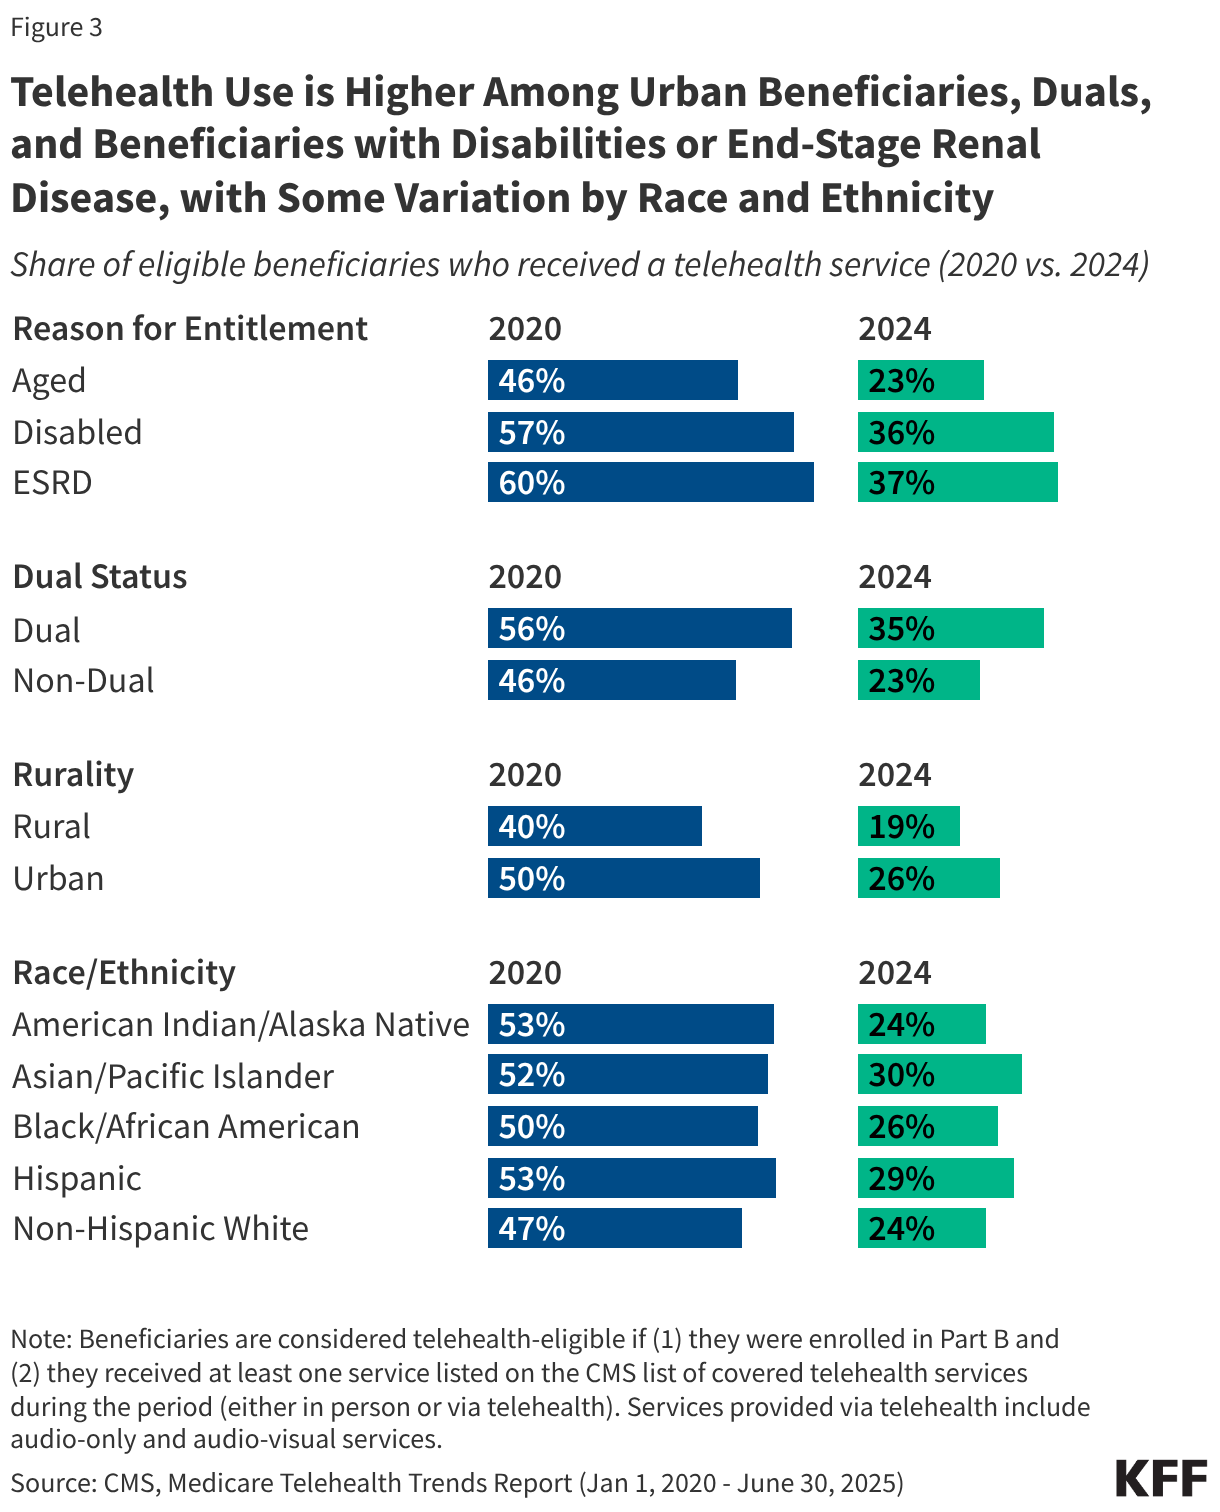
Reason for Medicare eligibility: Rates of telehealth use in 2024 were higher among beneficiaries who qualify for Medicare based on having end-stage renal disease (ESRD) (37%) or a long-term disability (36%), relative to those who qualify based on age (23%). This may be due in part to higher overall rates of service use among people with ESRD and disabilities (whether in-person or via telehealth) but may also reflect a preference for telehealth among these populations, or a greater ease of accessing care via telehealth relative to in-person care. Beneficiaries under age 65 who qualify for Medicare based on having long-term disabilities are more likely than older beneficiaries to report having three or more limitations in activities of daily living, and may be more likely to benefit from the increased flexibility of receiving health care services from their home via telehealth.
Dual-eligible individuals: Rates of telehealth use in 2024 were higher among beneficiaries dually eligible for both Medicare and Medicaid compared to Medicare beneficiaries who were not Medicaid eligible (35% vs. 23%). Dual-eligible individuals are four times more likely than other Medicare beneficiaries to live on incomes of less than $20,000. Prior studies have found that having lower income or living in a socioeconomically deprived neighborhood is associated with higher rates of telehealth use, suggesting that telehealth may have the potential to improve health care access for beneficiaries with limited access to in-person services.
Geography: Rates of telehealth use in 2024 were higher among beneficiaries living in urban areas than those in rural areas (26% vs. 19%), which may be due in part to disparities in access to broadband and other communication technologies. Beneficiaries in rural or underserved areas may lack the infrastructure to support reliable video telehealth visits or the means to afford internet access, which may further impede access to telehealth if coverage of audio-only services is reduced or eliminated.
Race and ethnicity: Rates of telehealth use in 2024 were highest among Asian and Pacific Islander (30%) and Hispanic (29%) beneficiaries, and somewhat lower among Black (26%), American Indian or Alaska Native (24%), and non-Hispanic White beneficiaries (24%). Given that beneficiaries of color are more likely than non-Hispanic White beneficiaries to report difficulty accessing needed health services, telehealth use may help to improve access to care for certain groups.
How Does Medicare Pay Providers for Telehealth Services?
As of January 2024, Medicare pays for telehealth services based on the location of the beneficiary. Medicare pays providers at a higher rate for telehealth services provided to beneficiaries who are located in their homes and a lower rate for telehealth services provided to beneficiaries who are located in a separate clinical setting (i.e., originating site) (with that lower rate being the same regardless of whether the clinical setting is a doctor’s office or a facility, such as a rural health clinic). According to CMS, the higher rate paid by Medicare for telehealth services provided to beneficiaries in their homes better reflects the practice expenses of providers in mental health and certain other specialties who provide a significant share of their services via telehealth, but also maintain an office for in-person services, an arrangement that became common after the telehealth expansion allowed for greater numbers of beneficiaries to access telehealth from home.
However, when beneficiaries receive telehealth services in clinical settings, such as a rural health clinic, Medicare makes a separate payment to the originating site (the “facility fee”) to reimburse for the cost of practice expenses, and the telehealth service provider is reimbursed at a lower rate that solely reflects the cost of the service itself. This results in total Medicare payments that are generally higher when beneficiaries receive telehealth in clinical settings despite the lower payment to the telehealth service provider.
In contrast, Medicare pays for most in-person services based on the location of the provider. For services furnished in a non-facility setting, such as a doctor’s office, providers are reimbursed at a higher rate that reflects the cost of some practice expenses as well as reimbursement for the service itself (equivalent to the rate paid for telehealth services provided to beneficiaries in their homes). For services furnished in a facility setting, such as a hospital outpatient department, providers are solely reimbursed for the service provided (equivalent to the rate paid for telehealth services provided to beneficiaries in clinical settings), and practice expenses are reimbursed directly to the facility as a separate facility fee. As in the case of clinic-based telehealth, the addition of the facility fee means that total Medicare payments are generally higher for facility- than non-facility-based services, though the provider portion of these payments is smaller.
How Do Medicare Advantage Plans Cover Telehealth?
Medicare Advantage plans are required to cover all Part A and Part B benefits covered under traditional Medicare, and have some flexibility to offer additional benefits as well, including telehealth benefits not routinely covered by traditional Medicare (outside of the current telehealth expansion), such as telehealth services provided to enrollees in their own homes, services provided outside of rural areas, and services provided through audio-only platforms.
Since 2020, Medicare Advantage plans have been permitted to include the costs associated with select telehealth services in their basic Medicare Part A and B benefit package, and may continue to do so after December 2027 regardless of the status of the temporary telehealth expansions in traditional Medicare. Telehealth services may be included in a plan’s basic benefits package if they meet certain requirements, such as coverage under Medicare Part B when the same service is provided in person. When these requirements are not met, plans may continue to offer supplemental telehealth benefits via remote access technologies and/or telemonitoring services, but must cover the cost of these benefits using rebates or supplemental premiums.
What Has Been Proposed to Expand Medicare Coverage of Telehealth?
While Congress has enacted legislation to extend temporary telehealth flexibilities in Medicare since 2023, there has been little movement on bills that would permanently extend these flexibilities. For example, the CONNECT for Health Act of 2025, introduced by Senator Schatz, would permanently implement several key pandemic-era telehealth flexibilities, such as the removal of geographic and originating site requirements and the broad expansion of providers eligible to offer telehealth, but has not been scheduled for a vote.
Trump administration officials, including CMS Administrator Dr. Mehmet Oz, have voiced support for the use of telehealth and other health technologies to increase access to health care services and promote treatment of chronic disease. The upcoming Advancing Chronic Care with Effective, Scalable Solutions (ACCESS) Model from the Center for Medicare & Medicaid Innovation (CMMI) will test the impact of new payment options designed to incentivize the use of technologies such as telehealth platforms, wearable devices, and health care apps for prevention and management of certain chronic conditions, though these payment options will be temporary and limited to the performance period of the model.
Finally, at the state level, certain states have taken action to develop multi-state licensure compacts, which have allowed for additional flexibility related to licensure in participating states. Medicare providers are generally required to be licensed in any state where they are practicing, and this requirement extends to telehealth. In most cases, a distant site telehealth provider must be licensed in the state where the beneficiary receiving services is located when the telehealth visit takes place, but multi-state licensure compacts can extend these permissions to a wider area. These compacts are formed when states agree upon a uniform standard of care and enact state laws which allow qualified providers to practice across state lines while maintaining a single license, to maintain multiple licenses, or which expedite the process of gaining additional licensure across member states. These compacts may be continued beyond December 2027, though other restrictions may limit their use if the current flexibilities are allowed to expire.
What Are the Implications of Telehealth for Program Integrity?
As policymakers weigh whether to permanently implement current flexibilities around Medicare coverage of telehealth, several questions have been raised about the impact of telehealth services on patient care quality and program spending, as well as the potential for fraud and overuse.
Since the current flexibilities were introduced, state and federal agencies have filed several lawsuits regarding the submission of fraudulent claims by telehealth companies to Medicare and other insurers. However, investigations by the HHS Office of the Inspector General (OIG) into provider billing patterns during the first year of the COVID-19 pandemic found that just 0.2% of providers who billed for a telehealth service during the period engaged in excessive billing patterns that posed a high risk to the Medicare program, and clinicians generally complied with Medicare requirements when providing Evaluation and Management services through telehealth, suggesting little evidence of widespread misuse to date. MedPAC has recommended that CMS take certain precautions going forward, such as applying additional scrutiny to “outlier” clinicians who deliver more telehealth services than others and requiring in-person visits before high-cost tests and medical equipment are paid for.
What are the Implications of Telehealth for Medicare Spending?
The impact of expanded telehealth coverage on Medicare spending is difficult to assess, as it depends on several factors. Some telehealth services may replace in-person care, as in the case of behavioral health visits, but easier access to telehealth may also lead to an overall increase in use of services and higher costs. Prior research has found modest increases in clinical encounters and spending per person among Medicare beneficiaries in geographic areas and health systems with higher rates of telehealth use. At the same time, there is evidence to suggest that beneficiaries with greater access to telehealth services may have fewer emergency department visits and improved adherence to certain medications. Additional research could help policymakers and other interested parties assess the degree to which any increases in Medicare spending as a result of expanded telehealth coverage are offset by improvements in quality of care or decreases in other costs, such as spending on preventable hospital admissions and other types of acute care services.
The Congressional Budget Office (CBO) scored the extension of current telehealth flexibilities through December 2027 under the Consolidated Appropriations Act of 2026 as costing $3.8 billion from 2026 to 2028. CBO has not yet scored the cost of recent legislative proposals, such as the CONNECT for Health Act of 2025, that would implement these flexibilities on a permanent basis.