Key Takeaways
Health Status
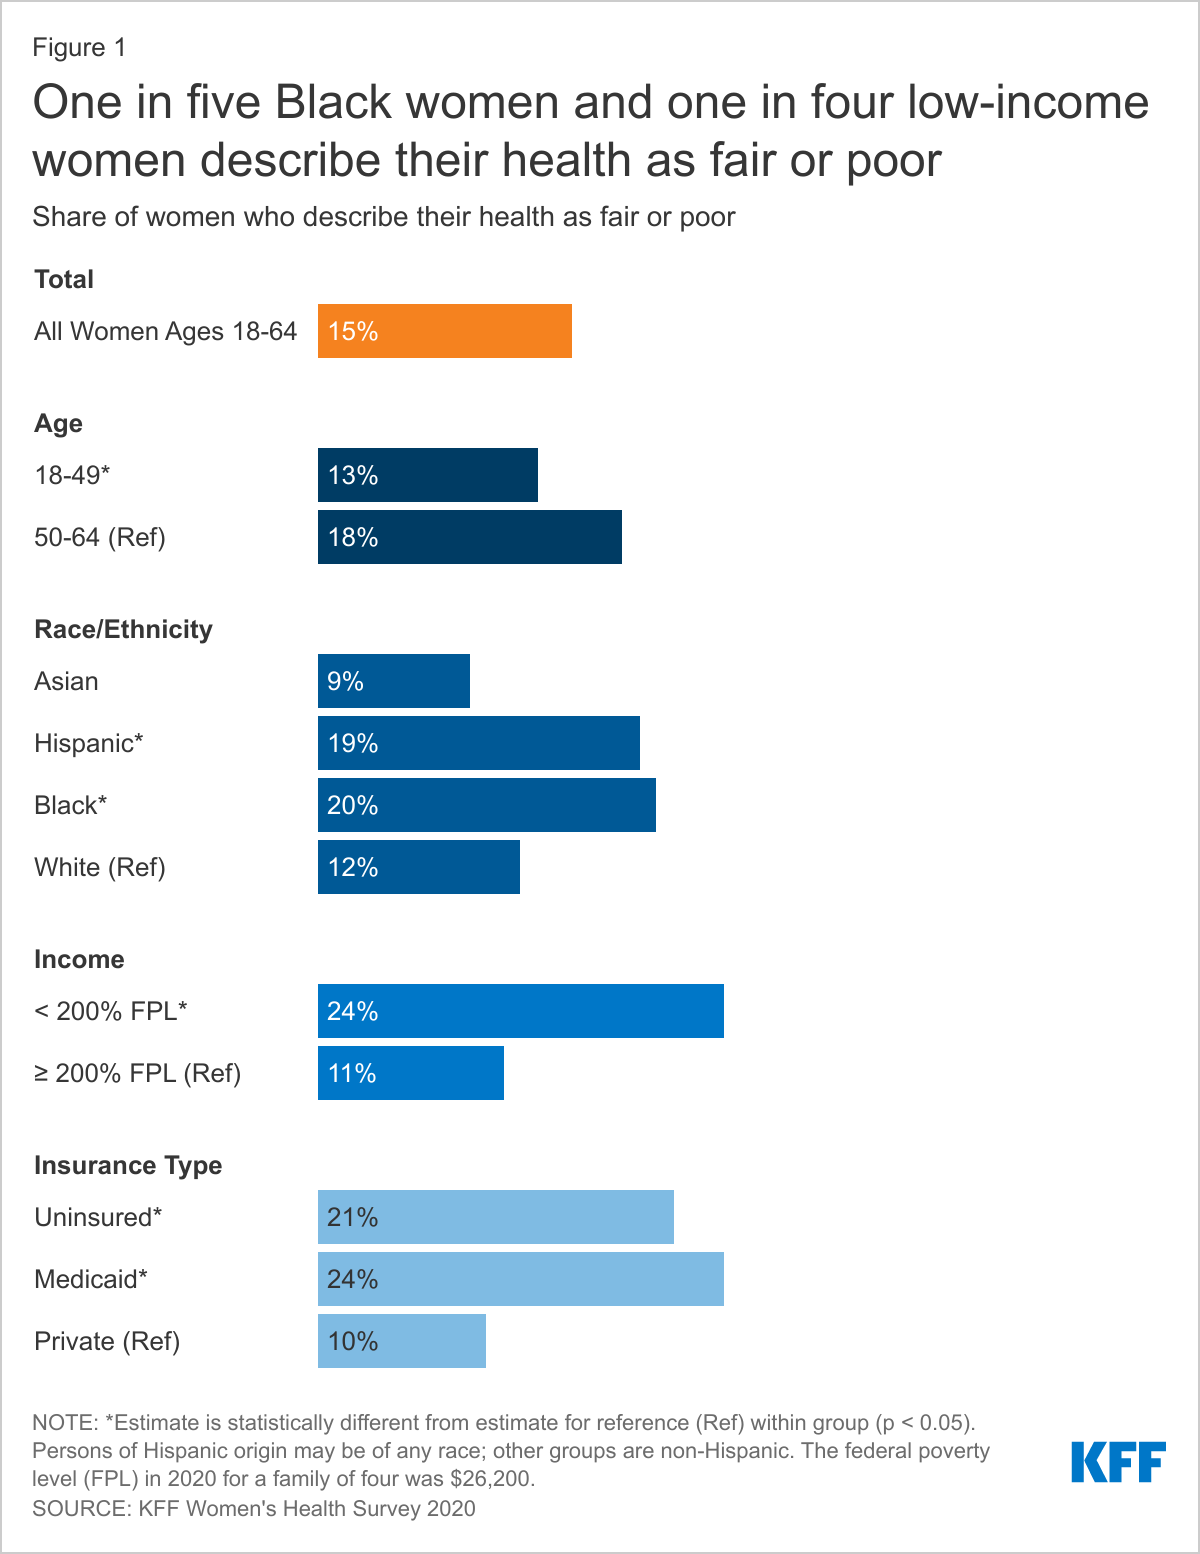
- Large shares of lower-income women and women with Medicaid report being in fair or poor health. One in five Black (20%) and Hispanic (19%) women report being in fair or poor health compared to 12% of White women and 9% of Asian women.
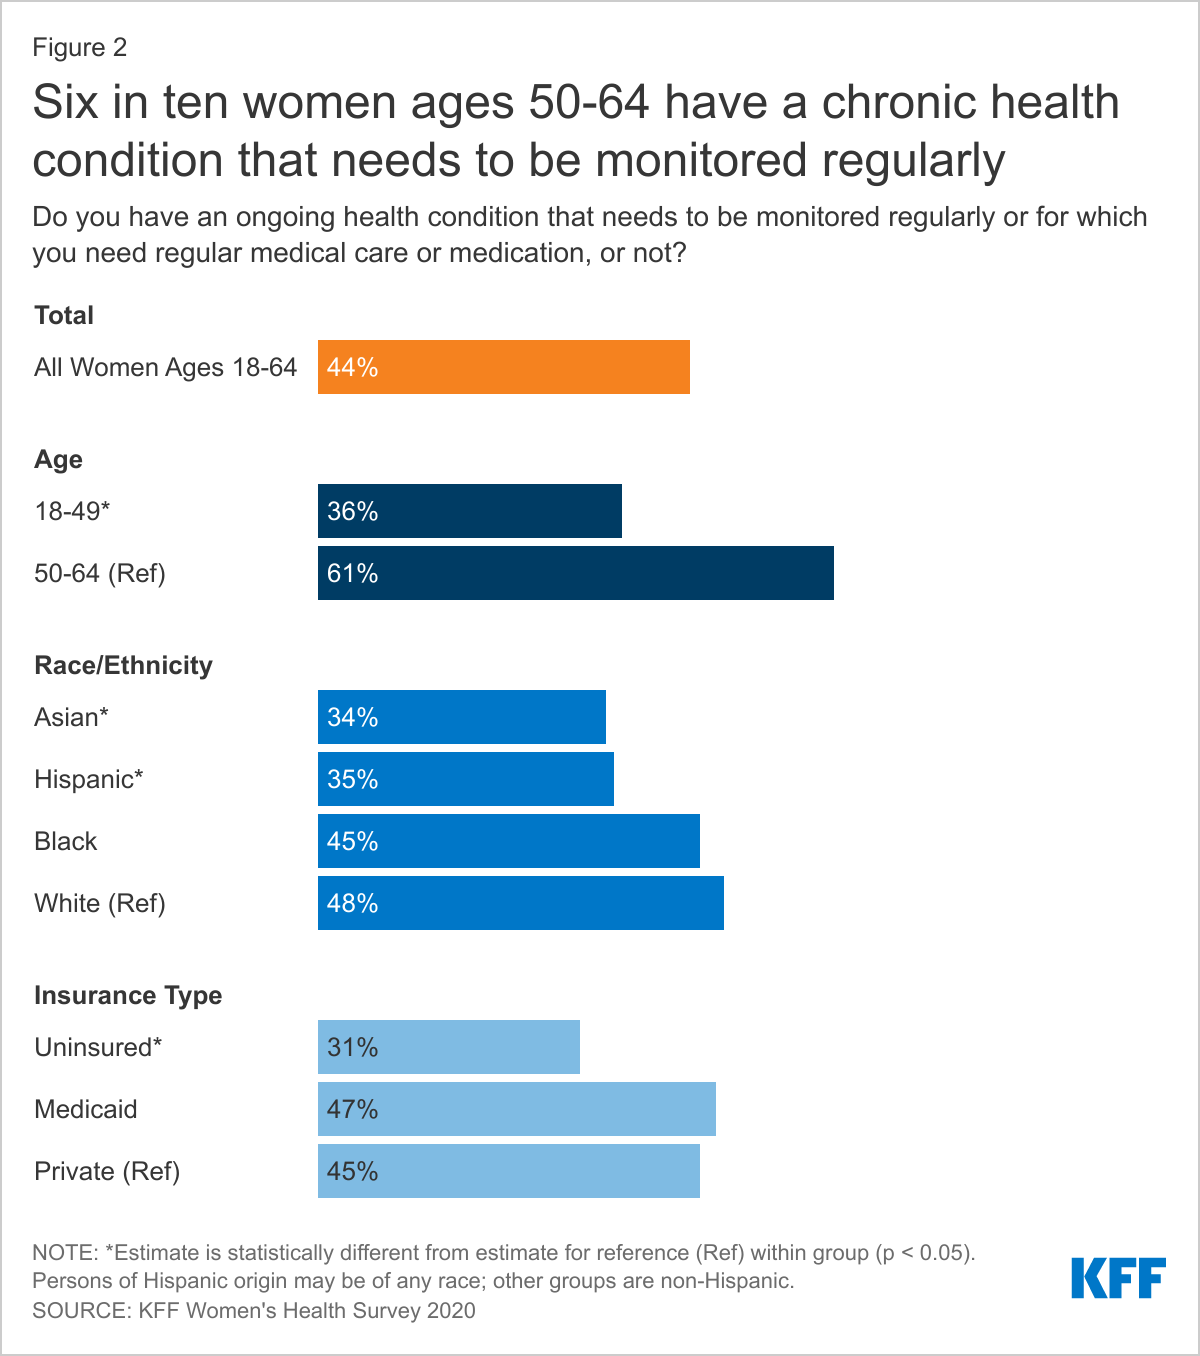
- Six in ten (61%) women ages 50-64 and almost half of White women (48%) and women with Medicaid (47%) report having a chronic health condition that requires regular monitoring, medical care, or medication.
Health Care Utilization
- More than nine in ten (93%) women have seen a doctor or health care provider in the past two years, but a smaller share has had a general check-up or well-woman visit (73%).
- One in ten (10%) women with an ongoing health condition do not have a regular doctor or health care provider.
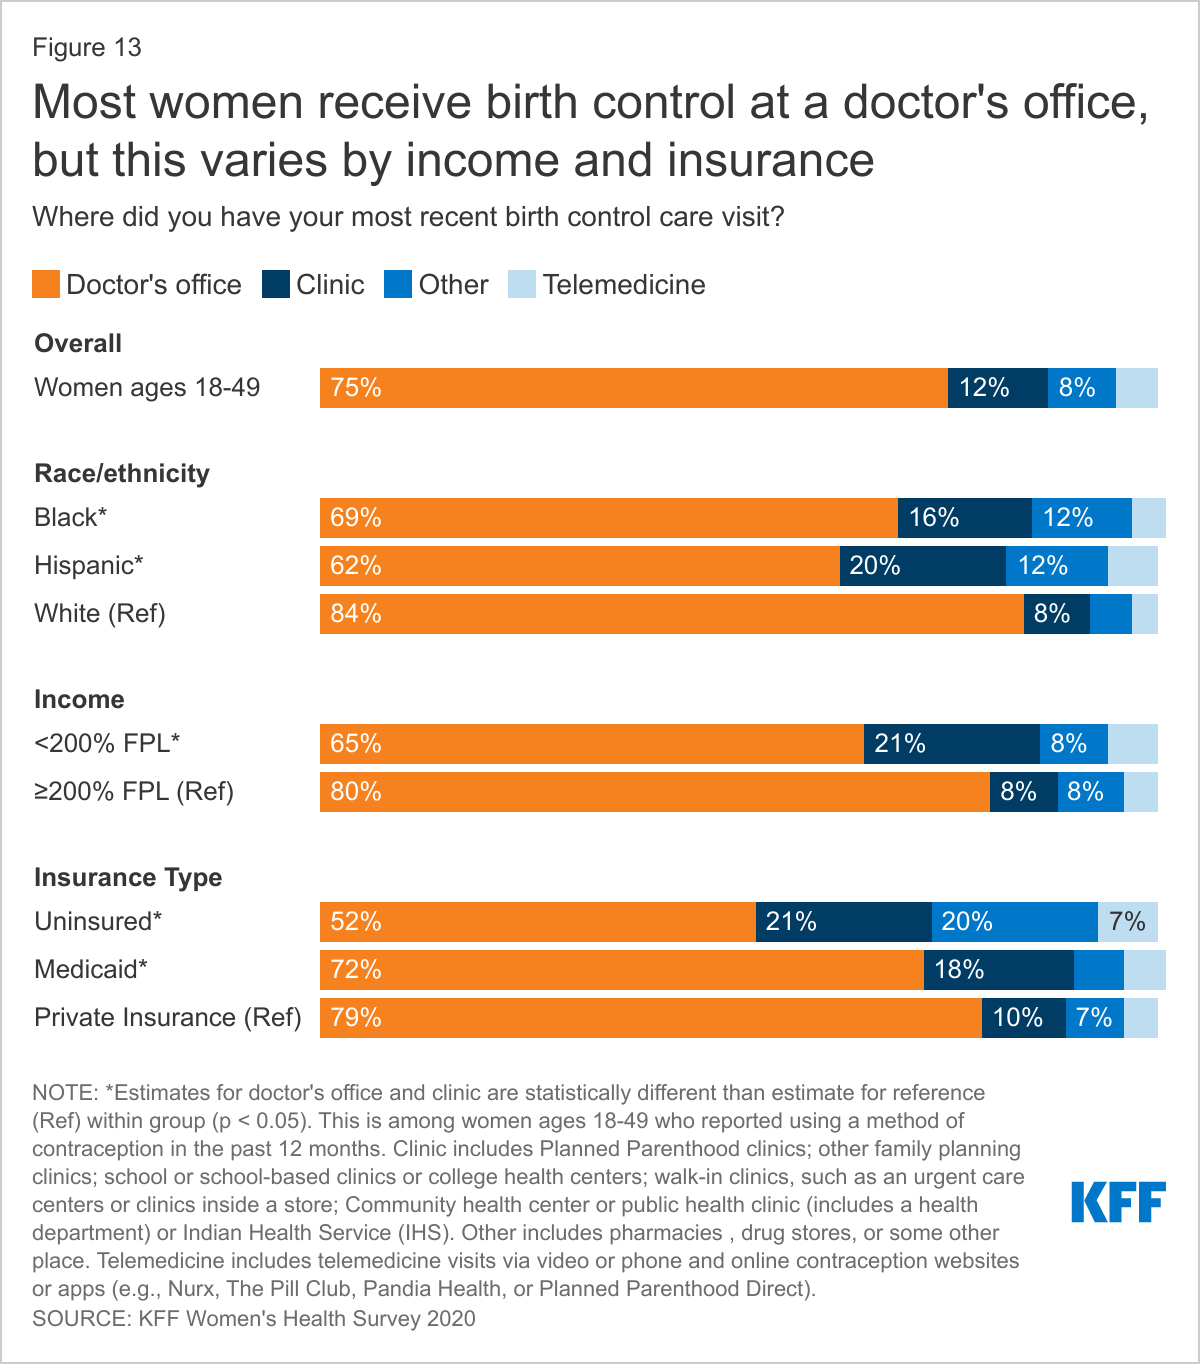
- Most women obtain their care at doctors’ offices, but many uninsured women, those with Medicaid, and Black and Hispanic women visit health centers or clinics.
- Nearly half (46%) of women who usually visit a health center or clinic for their care go to a walk-in clinic such as an urgent care facility or clinic inside a store or pharmacy. One-third (34%) visit a community health center or health department.
- Women with Medicaid coverage are more likely than women with employer-sponsored insurance to report experiencing health insurance coverage limitations. Nearly three in ten women with Medicaid (29%) and individual insurance (28%) say a doctor they wanted to see was not covered by their plan, compared to 15% of women with employer-sponsored insurance.
Health Care Experiences
- Among women who have been to the doctor in the past two years (93%), uninsured women (55%) are significantly less likely to have discussed mental health issues with their health care provider than women with health insurance (70%). Black (61%) and Asian (60%) women are less likely to have had this discussion with their provider than White women (72%).
- Among people who have visited a doctor in the past two years, women are more likely than men to say a health care provider has dismissed their concerns (21% vs. 12%) or didn’t believe they were telling the truth (10% vs. 7%). One in three (30%) women who had a negative provider experience say they were treated this way because of their age and one in five (20%) say it was because of their gender. Nearly four in ten (38%) Black women say they were treated this way because of their race/ethnicity.
Health Care Costs
- One in four (24%) women report having had problems paying medical bills in the past 12 months, over half (57%) of whom say this was due, at least in part, to the COVID-19 pandemic.
- Among women experiencing problems with medical bills in the past year, nearly half (48%) have had difficulty paying for basic necessities like food, heat, or housing because of the bills, as have six in ten (61%) low-income women.
Introduction
Women’s access to health care depends greatly on the availability of high-quality providers in their communities as well as their own knowledge about maintaining their health through routine checkups, screenings, and provider counseling. Social determinants of health, structural racism, and experiences with health care providers shape health outcomes and health equity.
While the Affordable Care Act (ACA) expanded pathways to affordable coverage to millions of women, coverage and affordability barriers persist for many. Women with health insurance may experience difficulty affording health care. Many insured women face health care costs in the form of cost sharing or balance billing resulting from receiving care from an out-of-network provider or hospital, which can also impact their financial well-being. The ACA contains provisions aimed at alleviating some of the financial barriers to health care access; however, many women still face challenges with health care costs and medical bills, particularly those who are uninsured or low-income.
This brief presents findings from the 2020 KFF Women’s Health Survey on women’s use of health care services, costs, and experiences accessing health care. The 2020 survey is a nationally representative survey of 3,661 women ages 18 to 64, conducted between November 19 and December 17, 2020. See the Methodology section for more details.
Health Status and Use of Prescription Medications
The majority of women ages 18-64 report being in good or excellent health, but higher shares of older and lower-income women, as well as Black and Hispanic women and those with Medicaid, report being in poorer health.
Most women (85%) rate their health as excellent, very good, or good; however, 15% of women describe their health as fair or poor, similar to other national estimates.1 As women age, they are more likely to rate their health as fair or poor (Figure 1). Nearly one in four (24%) low-income women, women with Medicaid (24%), and uninsured women (21%) rate their health as fair or poor.2 Black (20%) and Hispanic (19%) women are more likely than White (12%) and Asian (9%) women to report being in fair or poor health.3
Many women are managing chronic conditions or living with disabilities that impact daily life.
Just under half of women (44%) report that they have a chronic health condition that requires regular monitoring, medical care, or medication (Figure 2). This rate increases steadily with age, from about one in four (24%) women ages 18-25 to six in ten (61%) women ages 55-64. Almost half of White (48%) and Black (45%) women report having a chronic health condition compared to just over one-third of Hispanic (35%) and Asian (34%) women. Insured women with Medicaid coverage (47%) and private coverage (45%) report higher rates of chronic health conditions requiring regular maintenance than do uninsured women (31%).
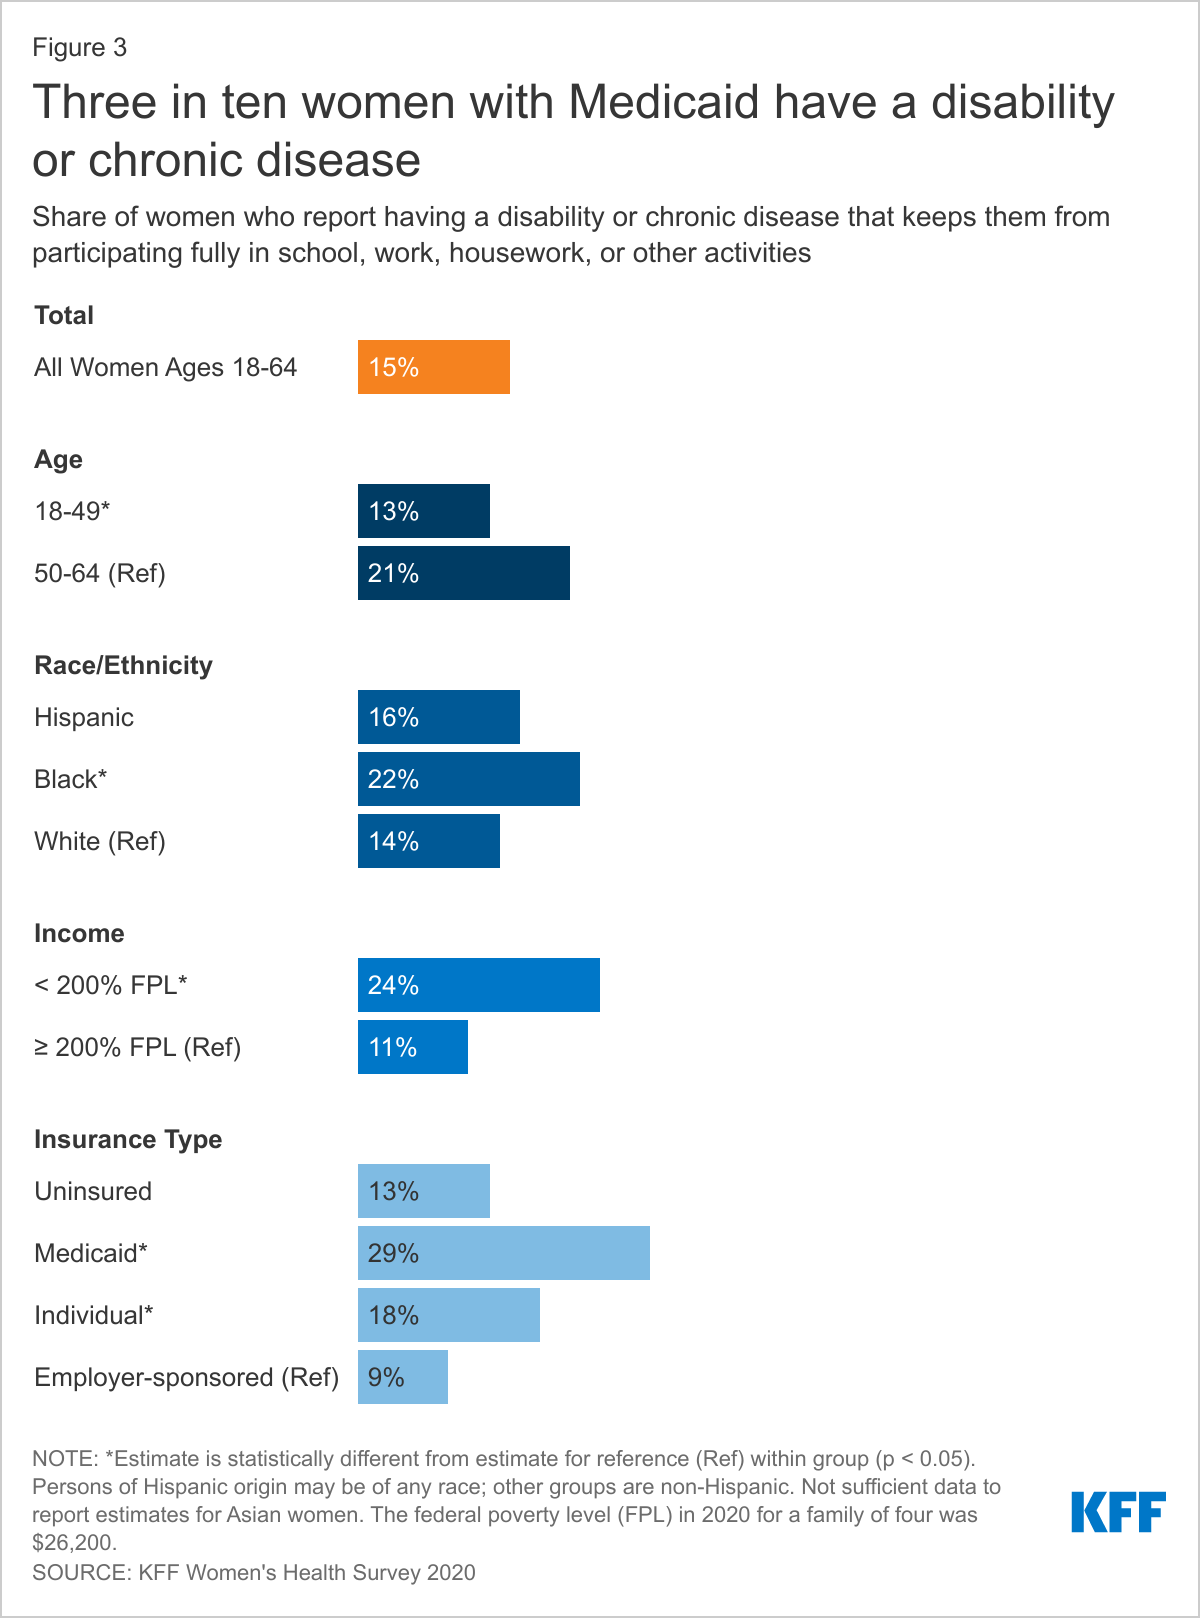
Fifteen percent of women report having a disability or chronic disease that keeps them from participating fully in work, school, housework, or other activities (Figure 3). Women with Medicaid (29%), low-income women (24%), and older women (21%) are more likely than their counterparts to report having a disability or chronic disease.
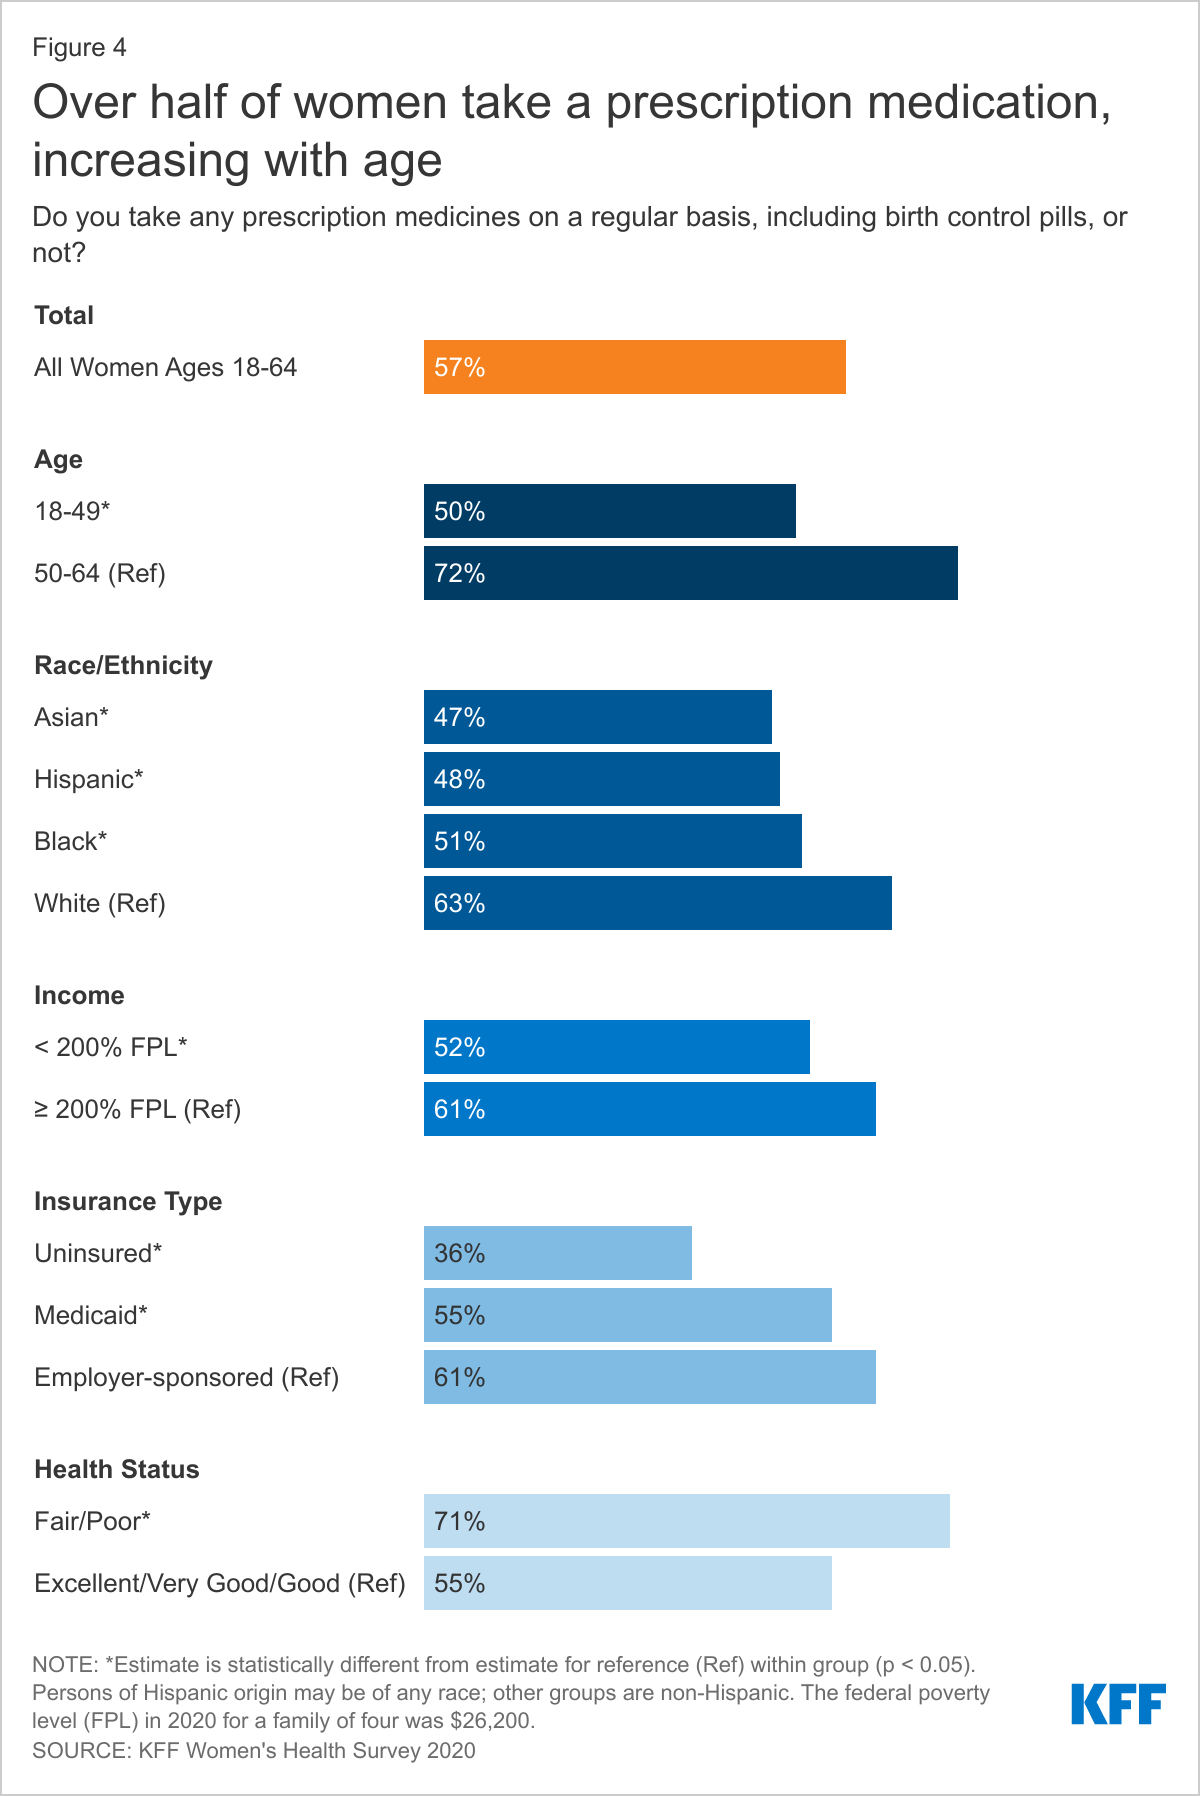
More than half of women are taking at least one prescription medication on a regular basis.
Women may take prescription medications to treat or manage chronic conditions and acute illnesses or to prevent pregnancy. More than half (57%) of women report taking at least one prescription medicine on a regular basis, including oral contraceptives (Figure 4). Prescription medication use increases with age, with about four in ten (42%) women ages 18-49 taking at least one on a regular basis compared to about seven in ten (72%) women ages 50-64. Women in poorer health (71%) are more likely than women in better health (55%) to report taking a prescription medication regularly.4 Low-income women (52%) are less likely than women with higher incomes (61%) to take a prescription medication regularly and uninsured women (36%) are less likely than insured women (60%). White women (63%) are more likely than Asian (47%), Hispanic (48%), and Black (51%) women to take a prescription medication.
Health Care Utilization
Sites of Care
Most women obtain their care at doctors’ offices, but clinics are common sites of care for underserved communities, particularly for uninsured women and those with Medicaid.
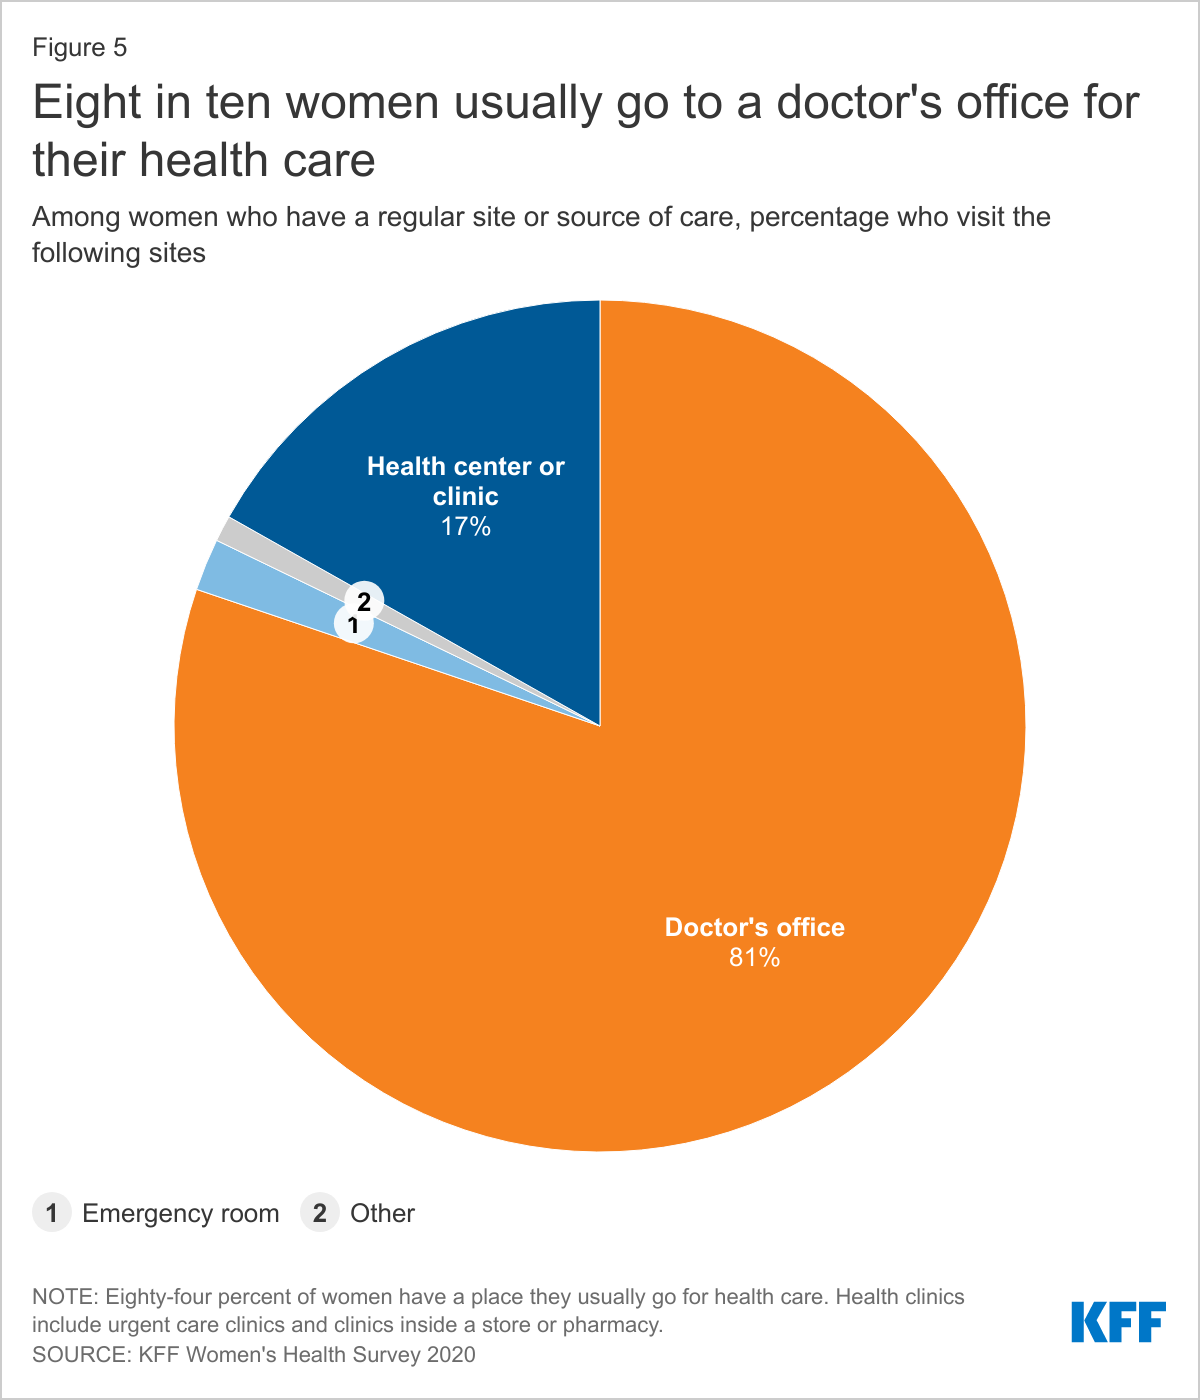
Eighty-four percent of women report that they have a place they usually go when they are sick or need advice about their health. Eight in ten (81%) women with a usual place of care report that they obtain their care at a doctor’s office (Figure 5). Seventeen percent obtain care at a clinic, such as a health center, urgent care clinic, or clinic inside a store or pharmacy. A very small share (2%) cites the emergency room as their usual site of care and 1% go to some other place.
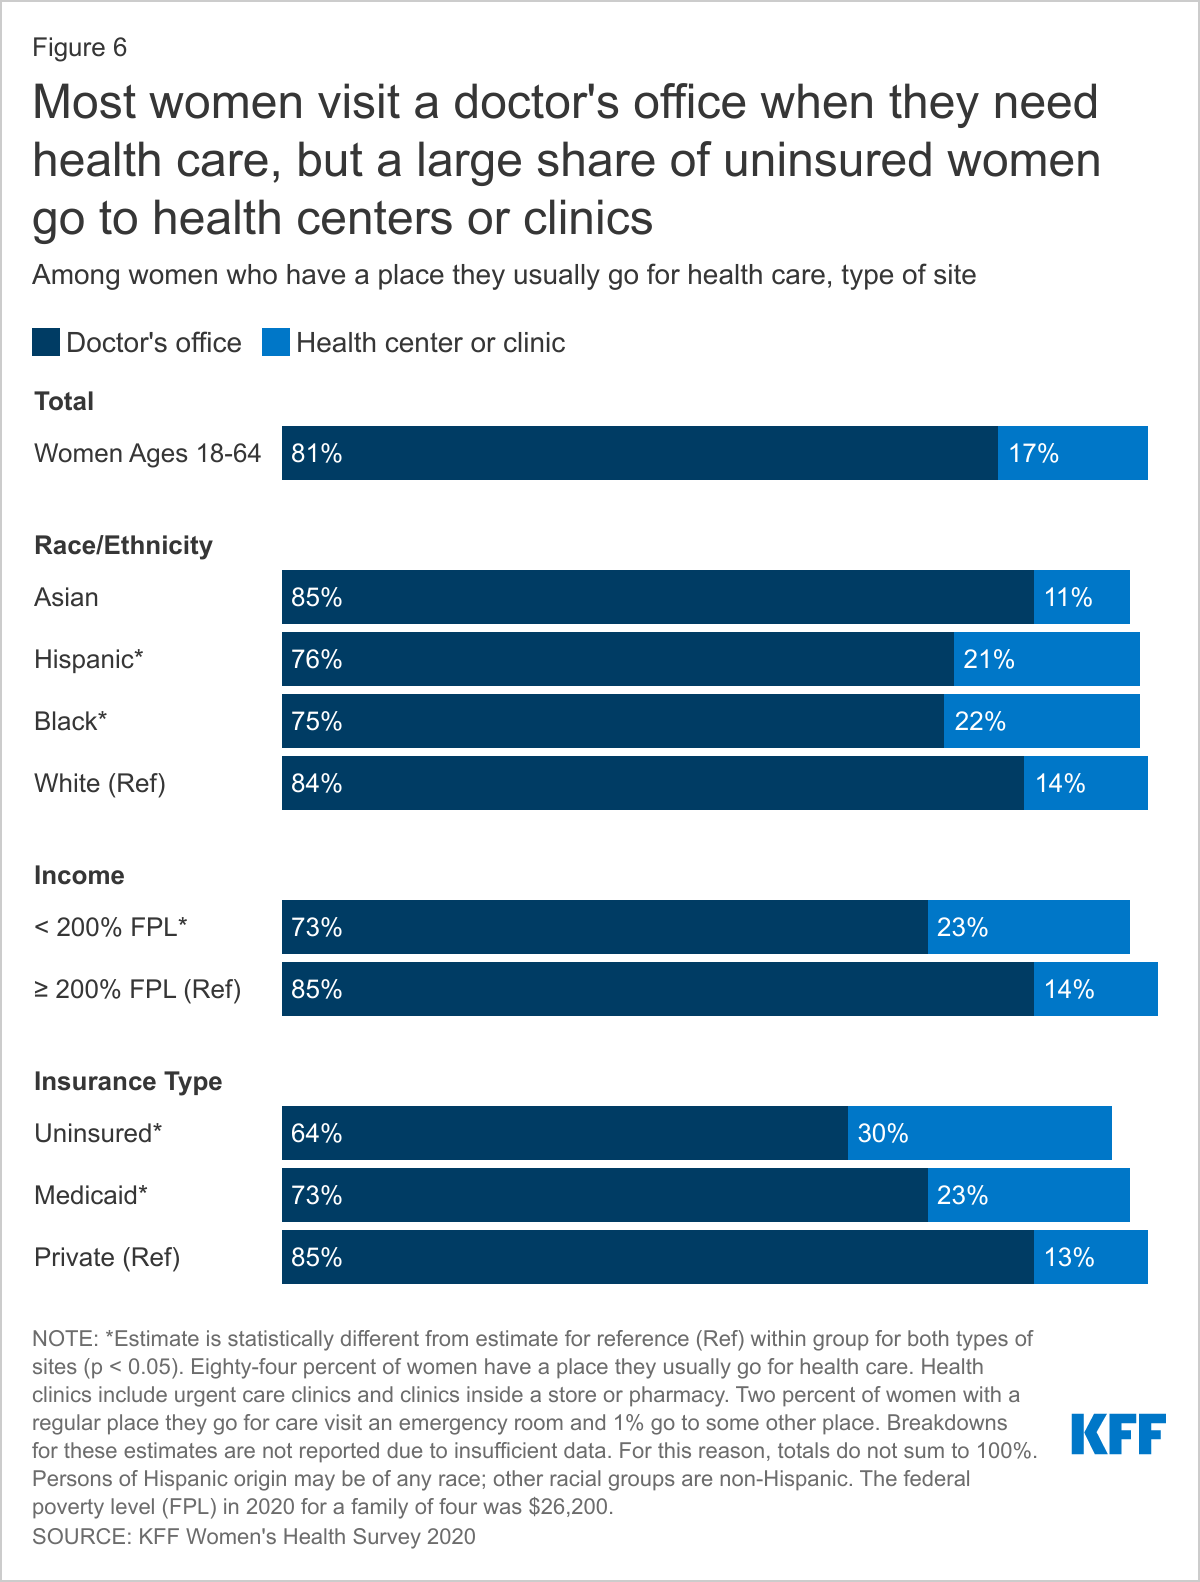
The share of women with private health insurance (85%), higher-income women (85%), and White (84%) and Asian (85%) women who visit a doctor’s office is higher than those of their counterparts (Figure 6). Approximately one-quarter of women with Medicaid (23%) and one in three (30%) uninsured women usually visit a health center, urgent care clinic, or clinic inside a store or pharmacy. Hispanic (21%) and Black (22%) women are more likely to visit one of these clinics than White (14%) women or Asian (11) women.
Among women who obtain care at a health center or clinic, more than half of women with private insurance visit a walk-in clinic while uninsured women and women with Medicaid are more likely to visit a community or public health center for care.
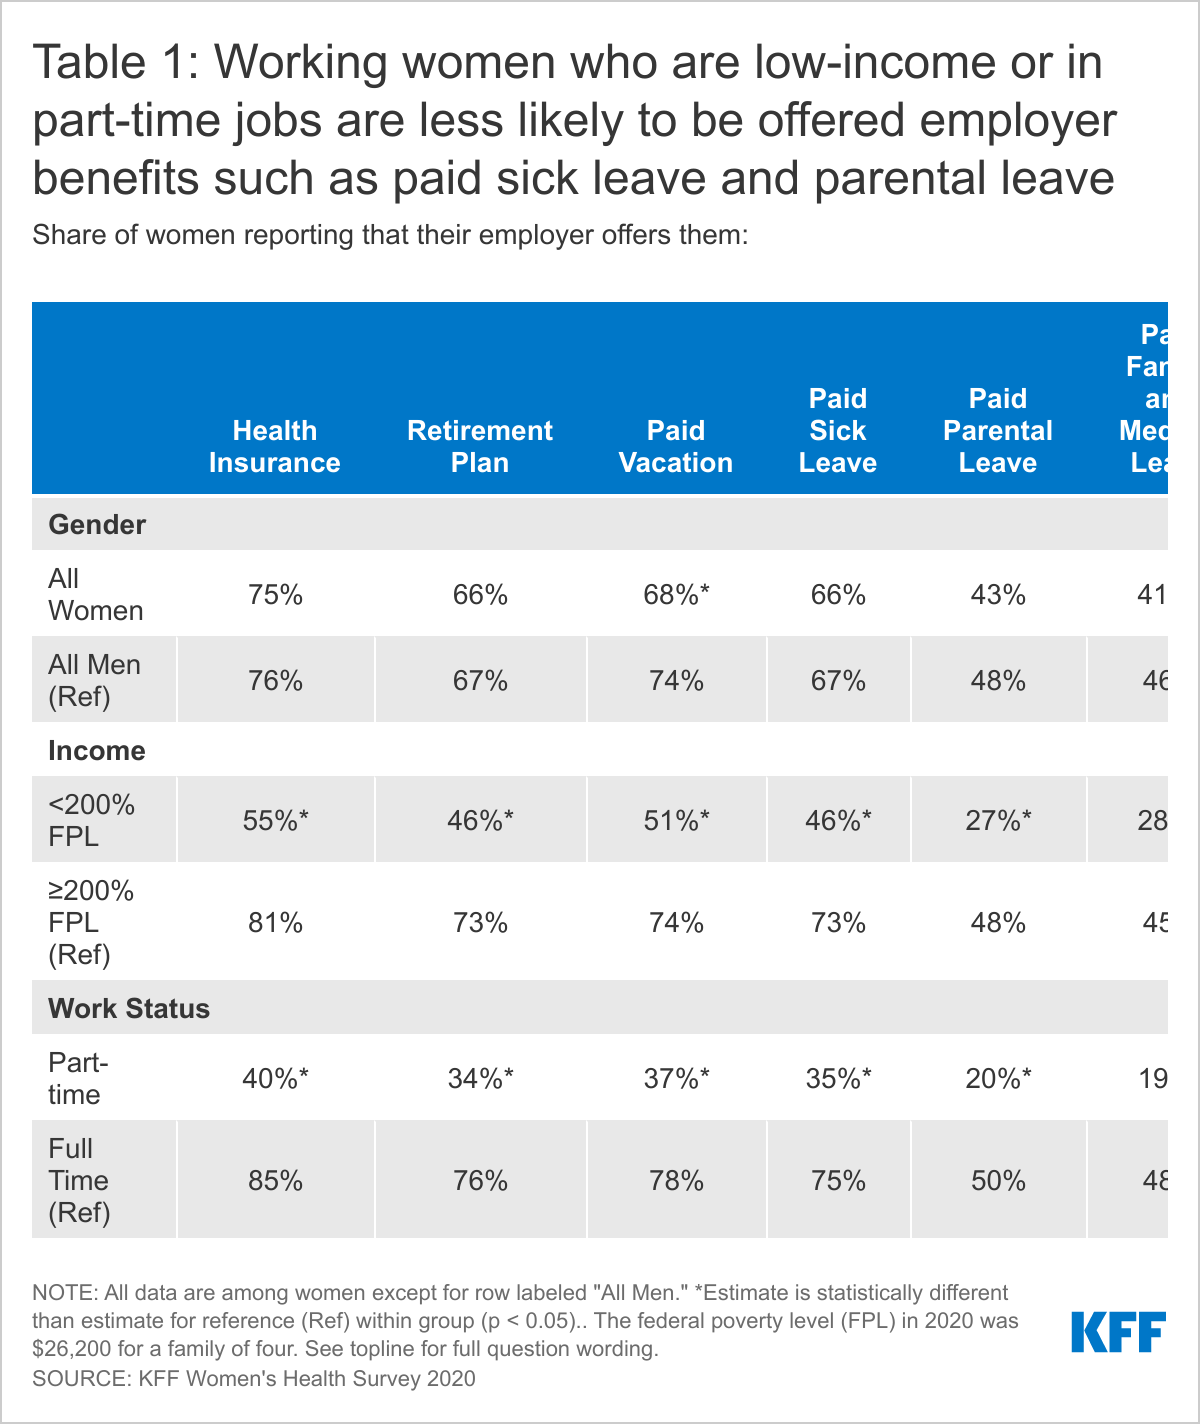
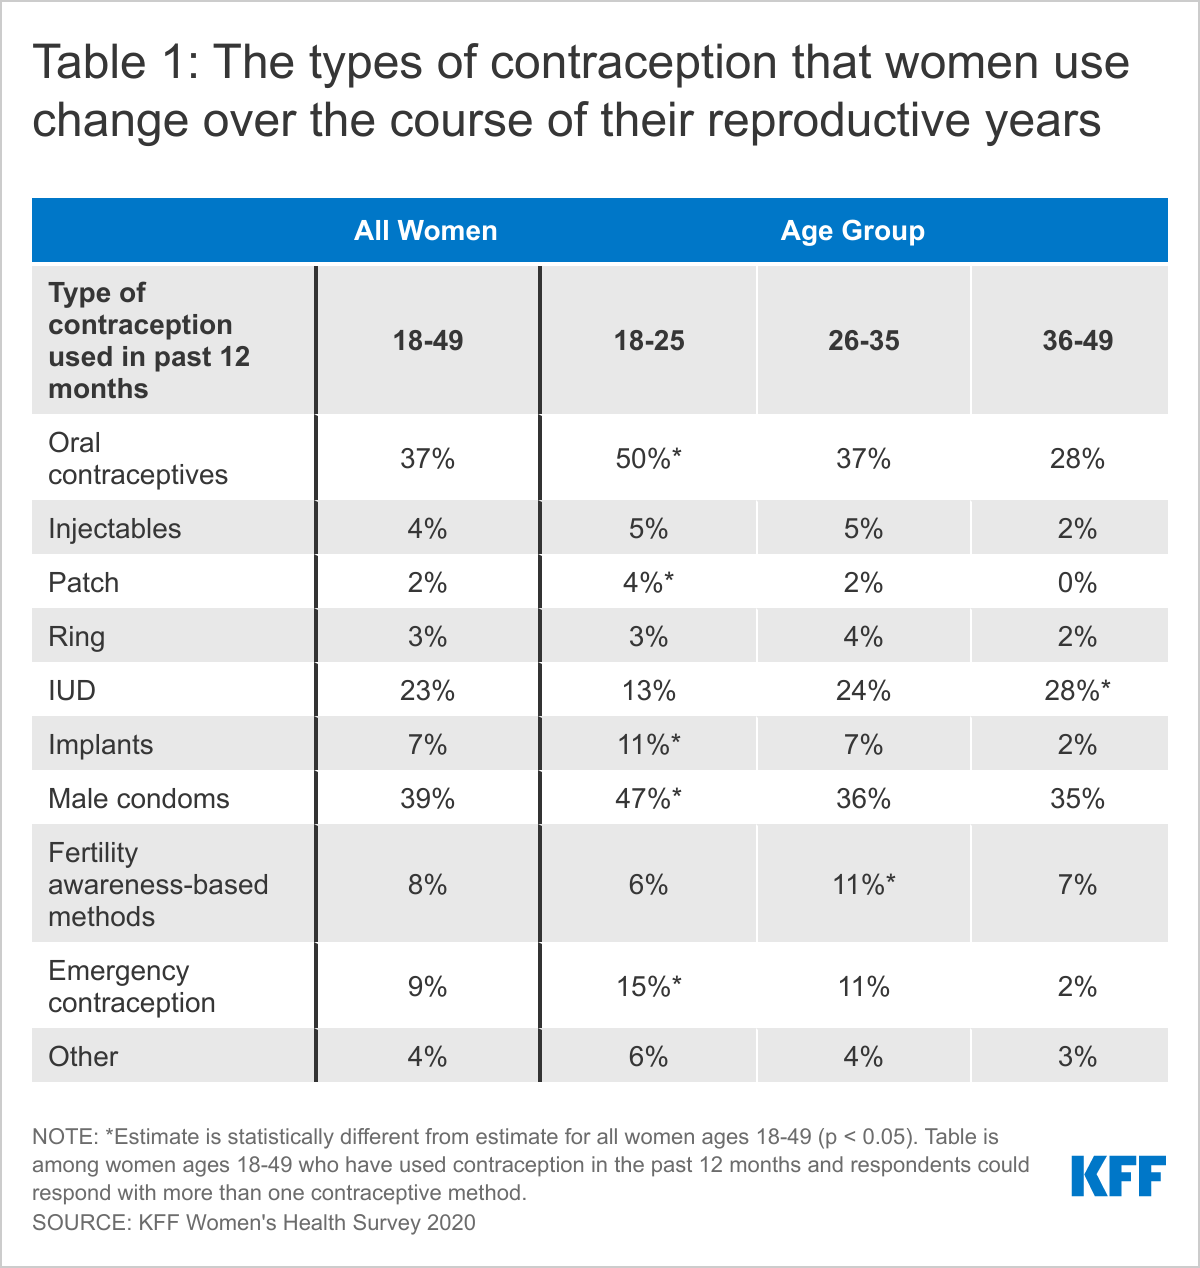
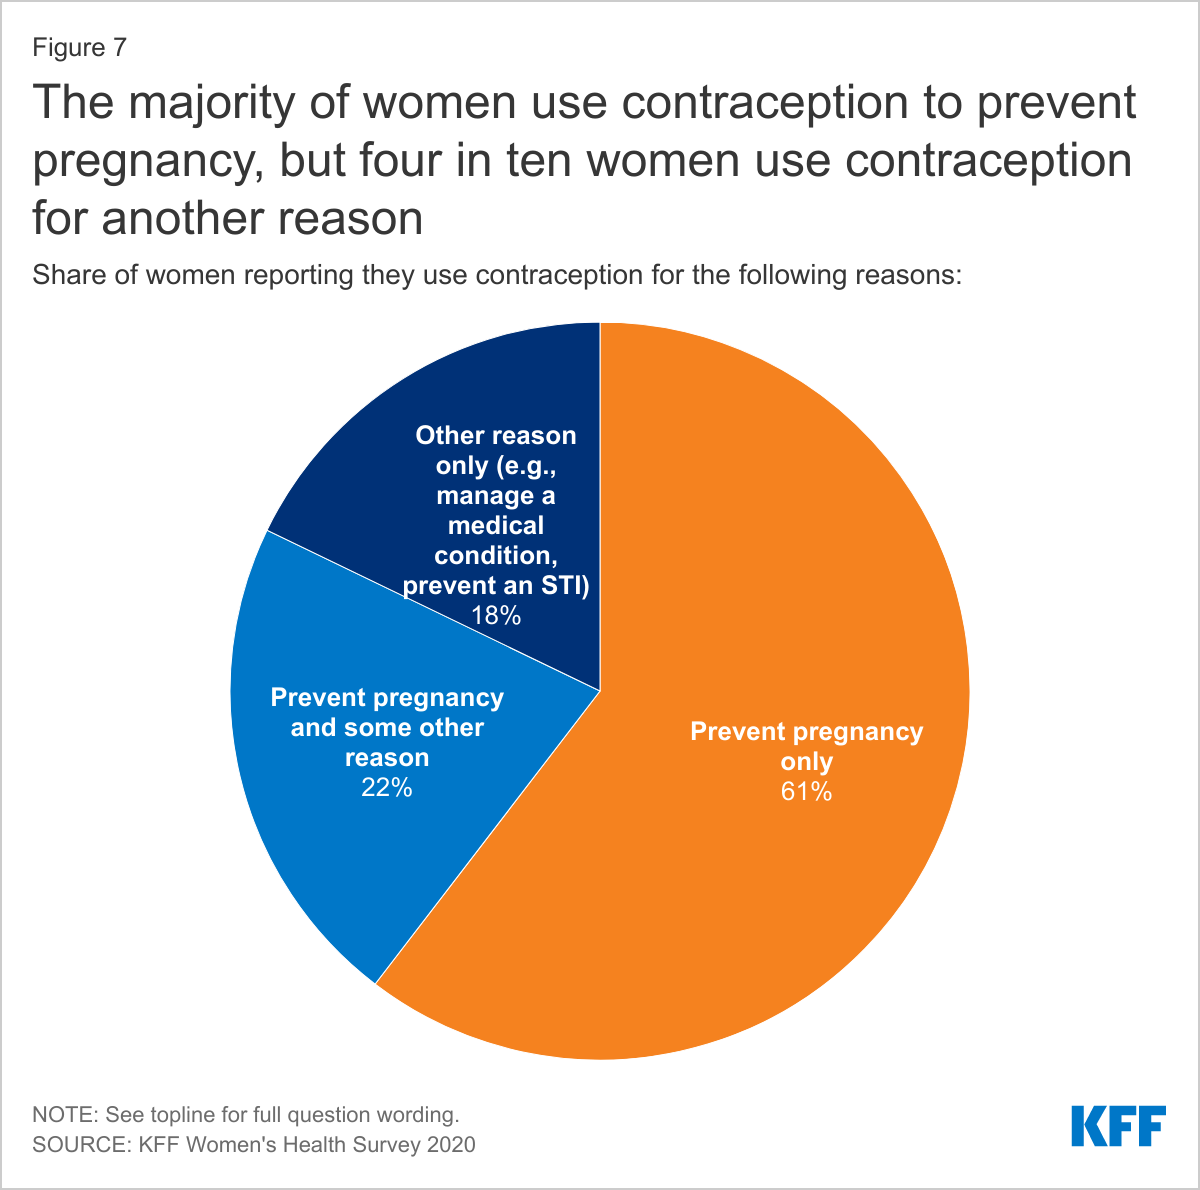
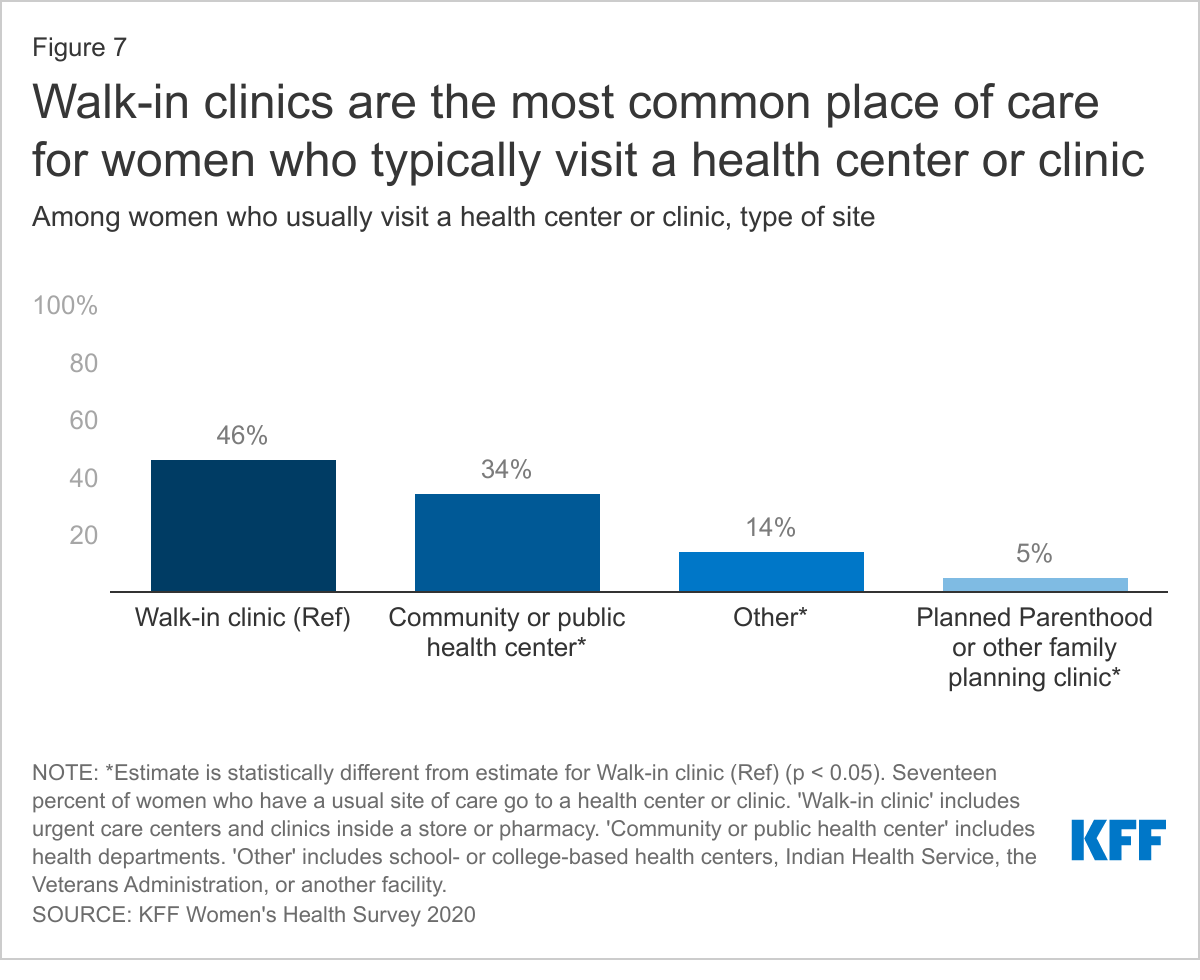
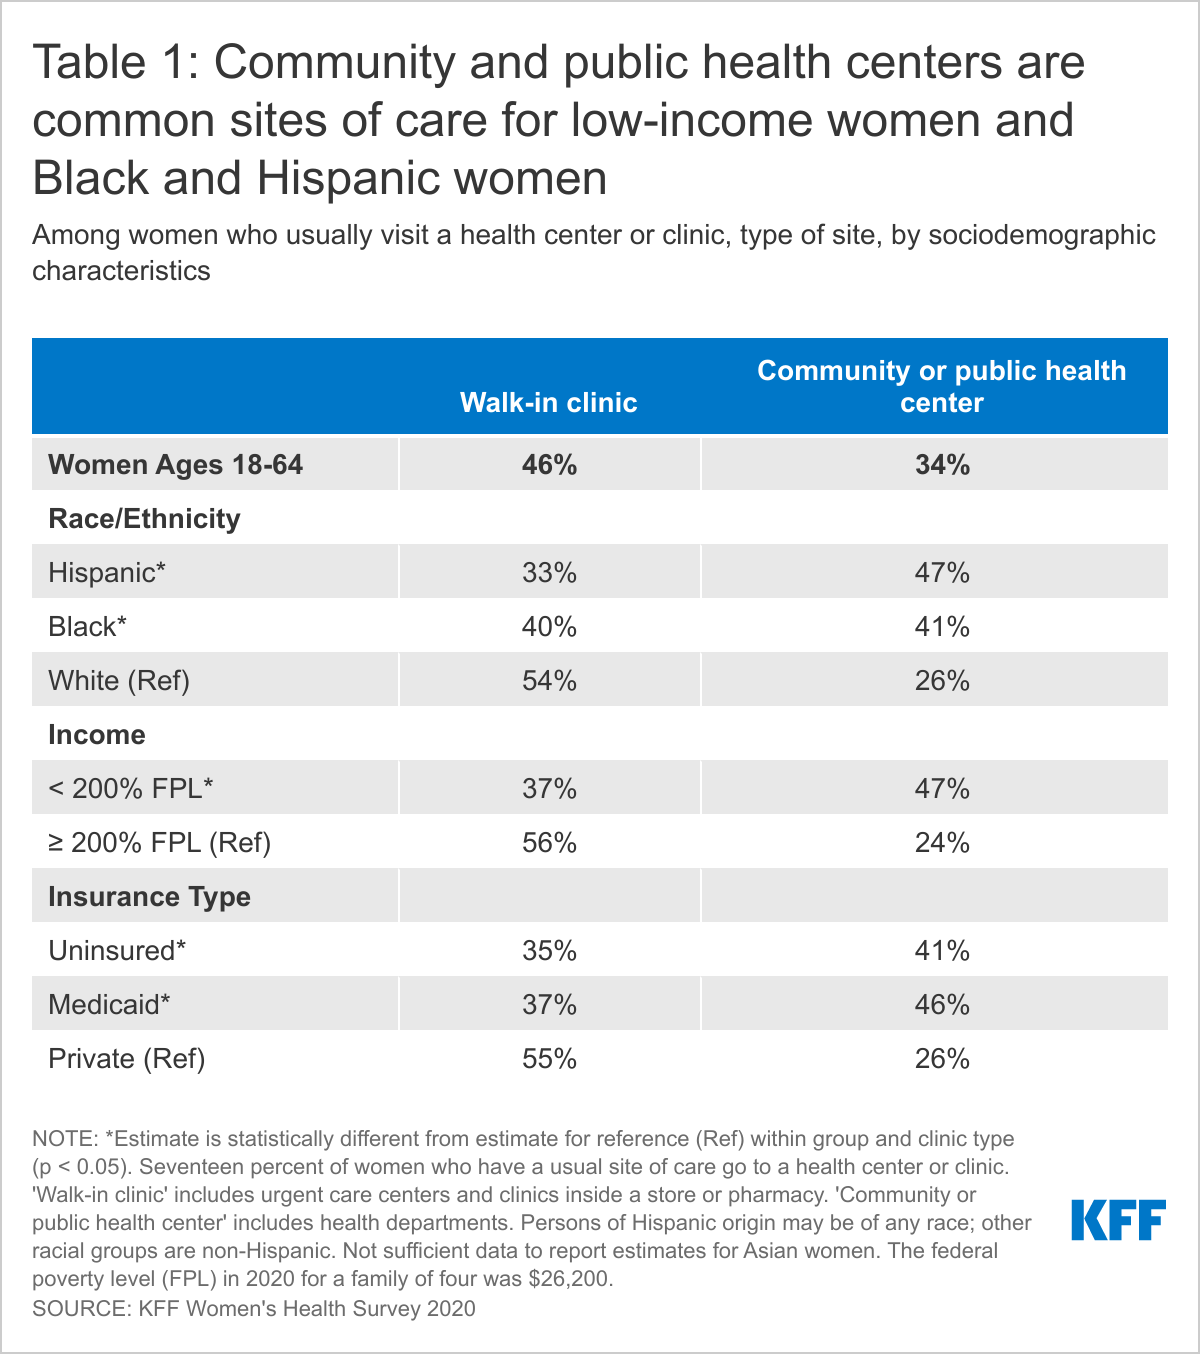
Among women who usually visit a clinic, almost half (46%) use a walk-in clinic such as an urgent care center clinic inside a store or pharmacy (Figure 7). These clinics are often staffed by advanced practice clinicians and treat minor illnesses and injuries and provide some preventive care. Women with employer-sponsored insurance (59%) are far likelier to use one of these clinics than are women with individual insurance (30%) or Medicaid coverage (37%) and uninsured women (35%) (Table 1). About one-third (34%) of women who usually visit a health clinic go to a community health center or health department. Community health centers and health departments are common among women with Medicaid (46%) and uninsured women (41%), Hispanic (47%) and Black women (41%), and low-income women (47%).
Sources of Care
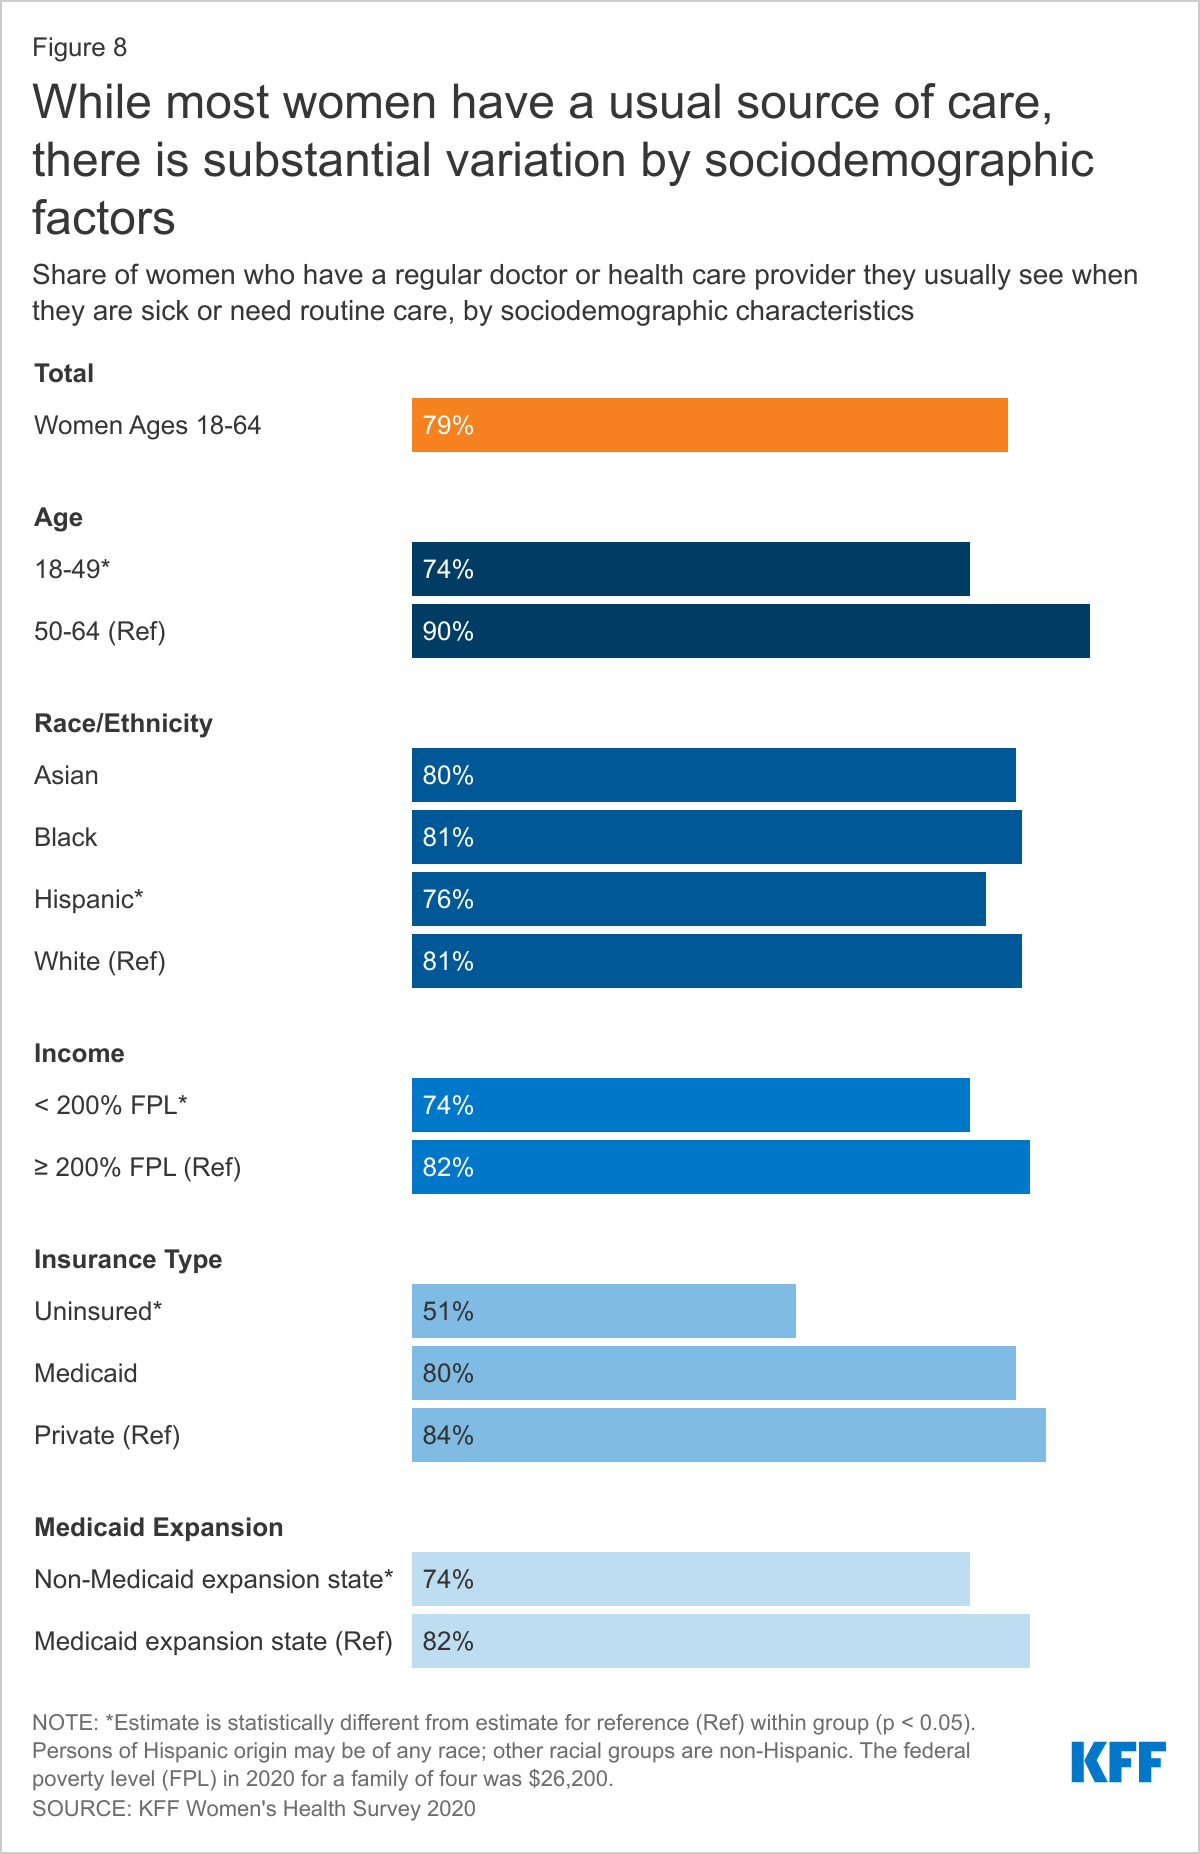
While the vast majority of women have a regular provider they turn to for routine care, only half of uninsured women have a usual source of care.
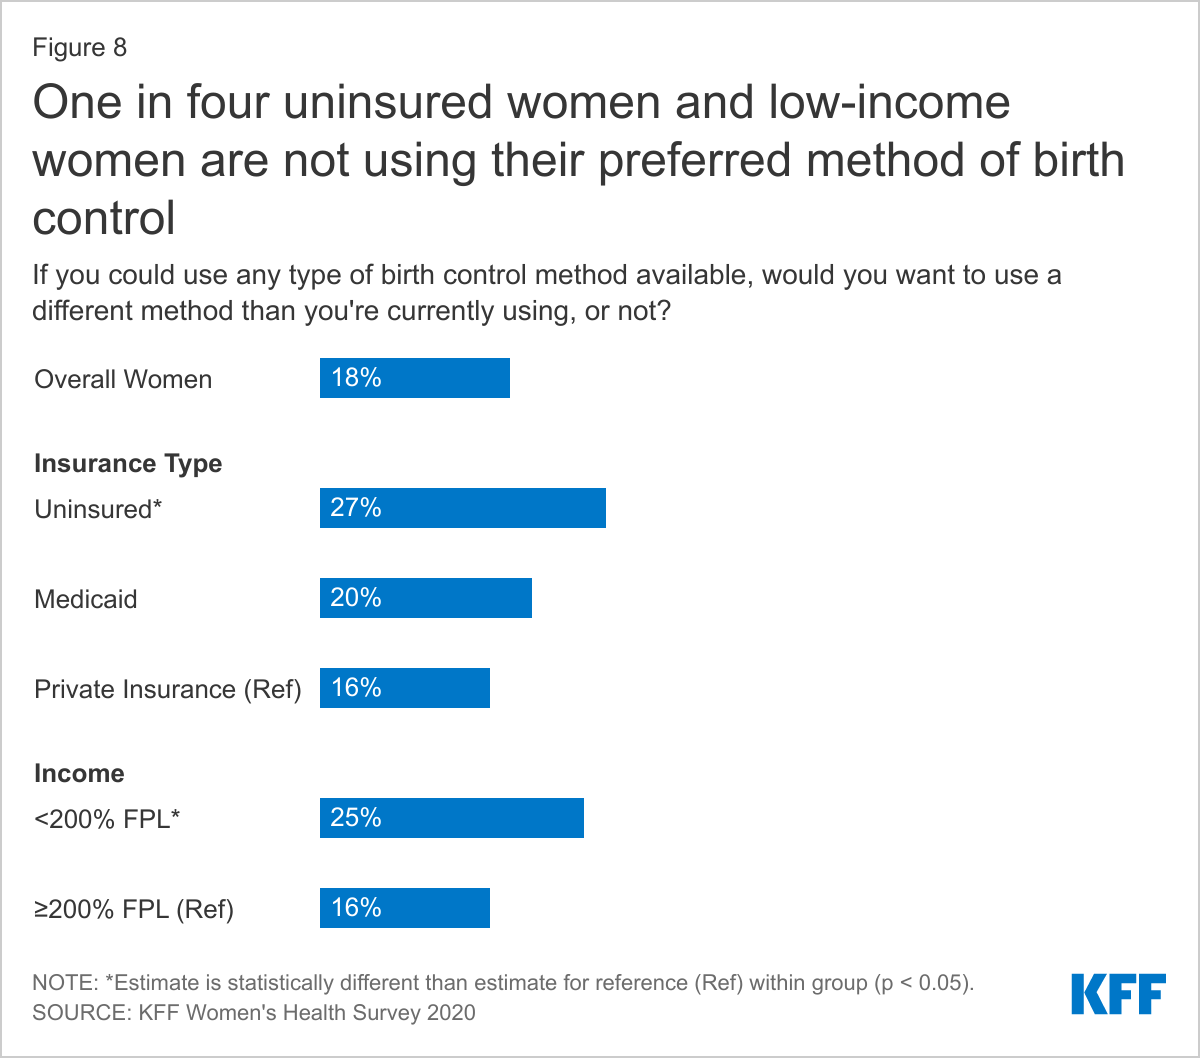
Having a usual source of health care is associated with increased use of preventive care and better health outcomes. Seventy-nine percent of women have a regular doctor or health care provider they see when they are sick or need routine care. The likelihood of having a regular provider increases with age (Figure 8). Women who live in a state that expanded Medicaid are more likely to have a usual source of care than women in states that have not expanded Medicaid (82% vs. 74%). Fewer uninsured (51%) and low-income (74%) women report having a usual source of care than their counterparts. Hispanic women (76%) are less likely than White women (81%) to have a usual source of care. Ten percent of women with an ongoing health condition do not have a regular doctor or health care provider (data not shown in figure).
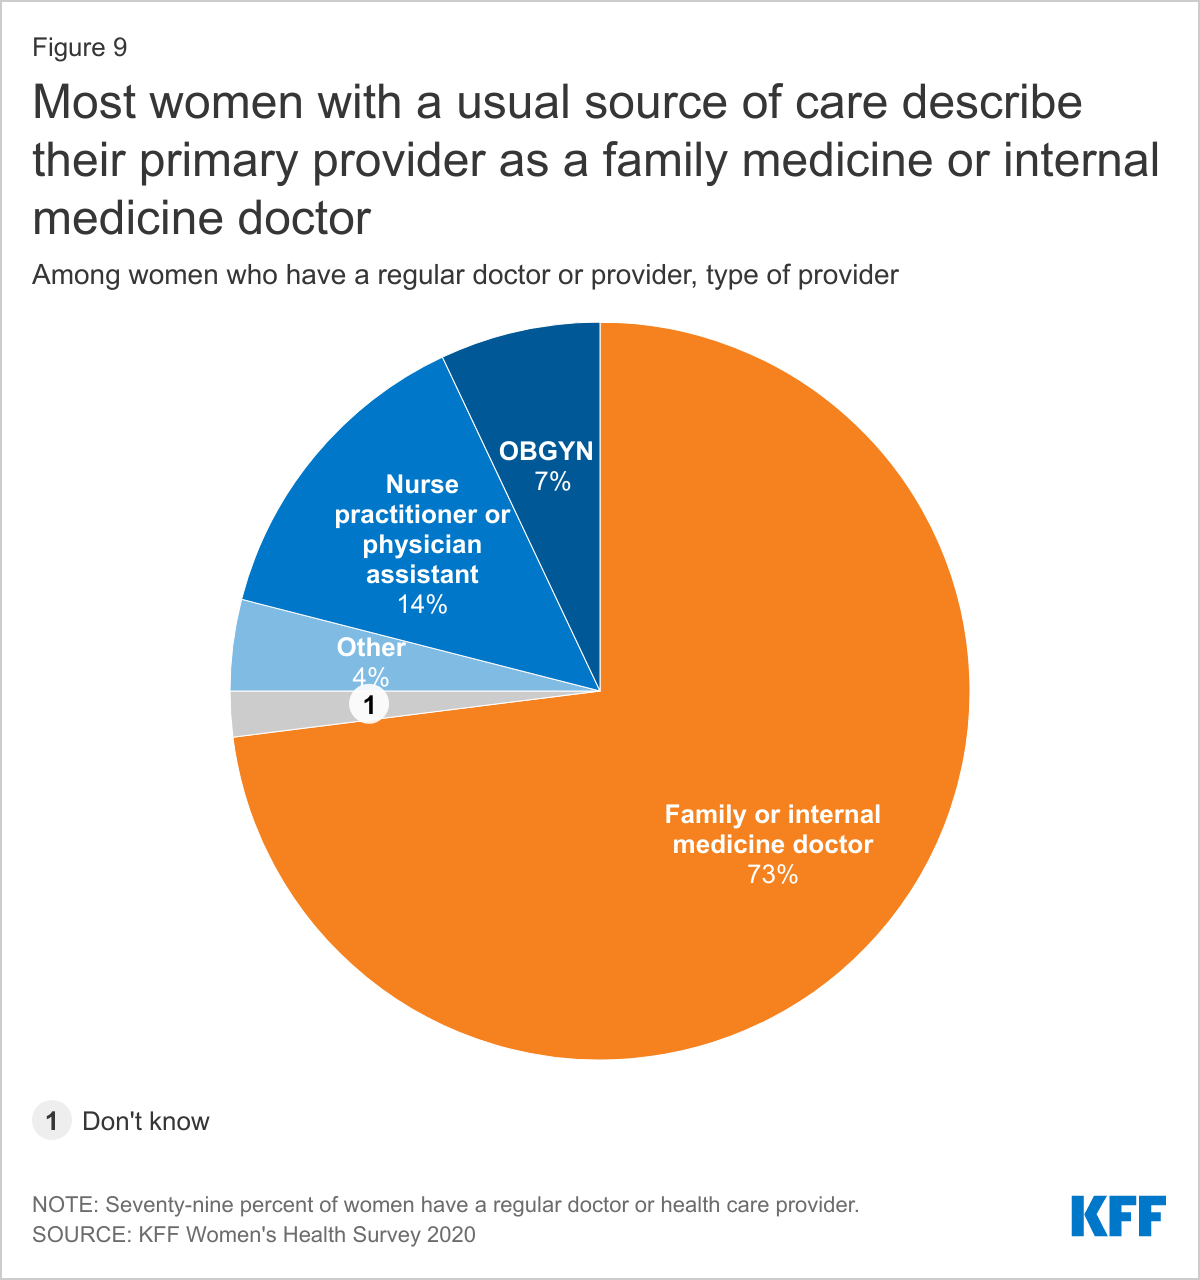
Nearly three-quarters (73%) of women with a regular doctor or health care provider describe their primary provider as a family medicine or internal medicine doctor (Figure 9). Fourteen percent of women with a regular provider go to an advanced practice clinician such as a nurse practitioner or physician assistant, and 7% see an OBGYN.
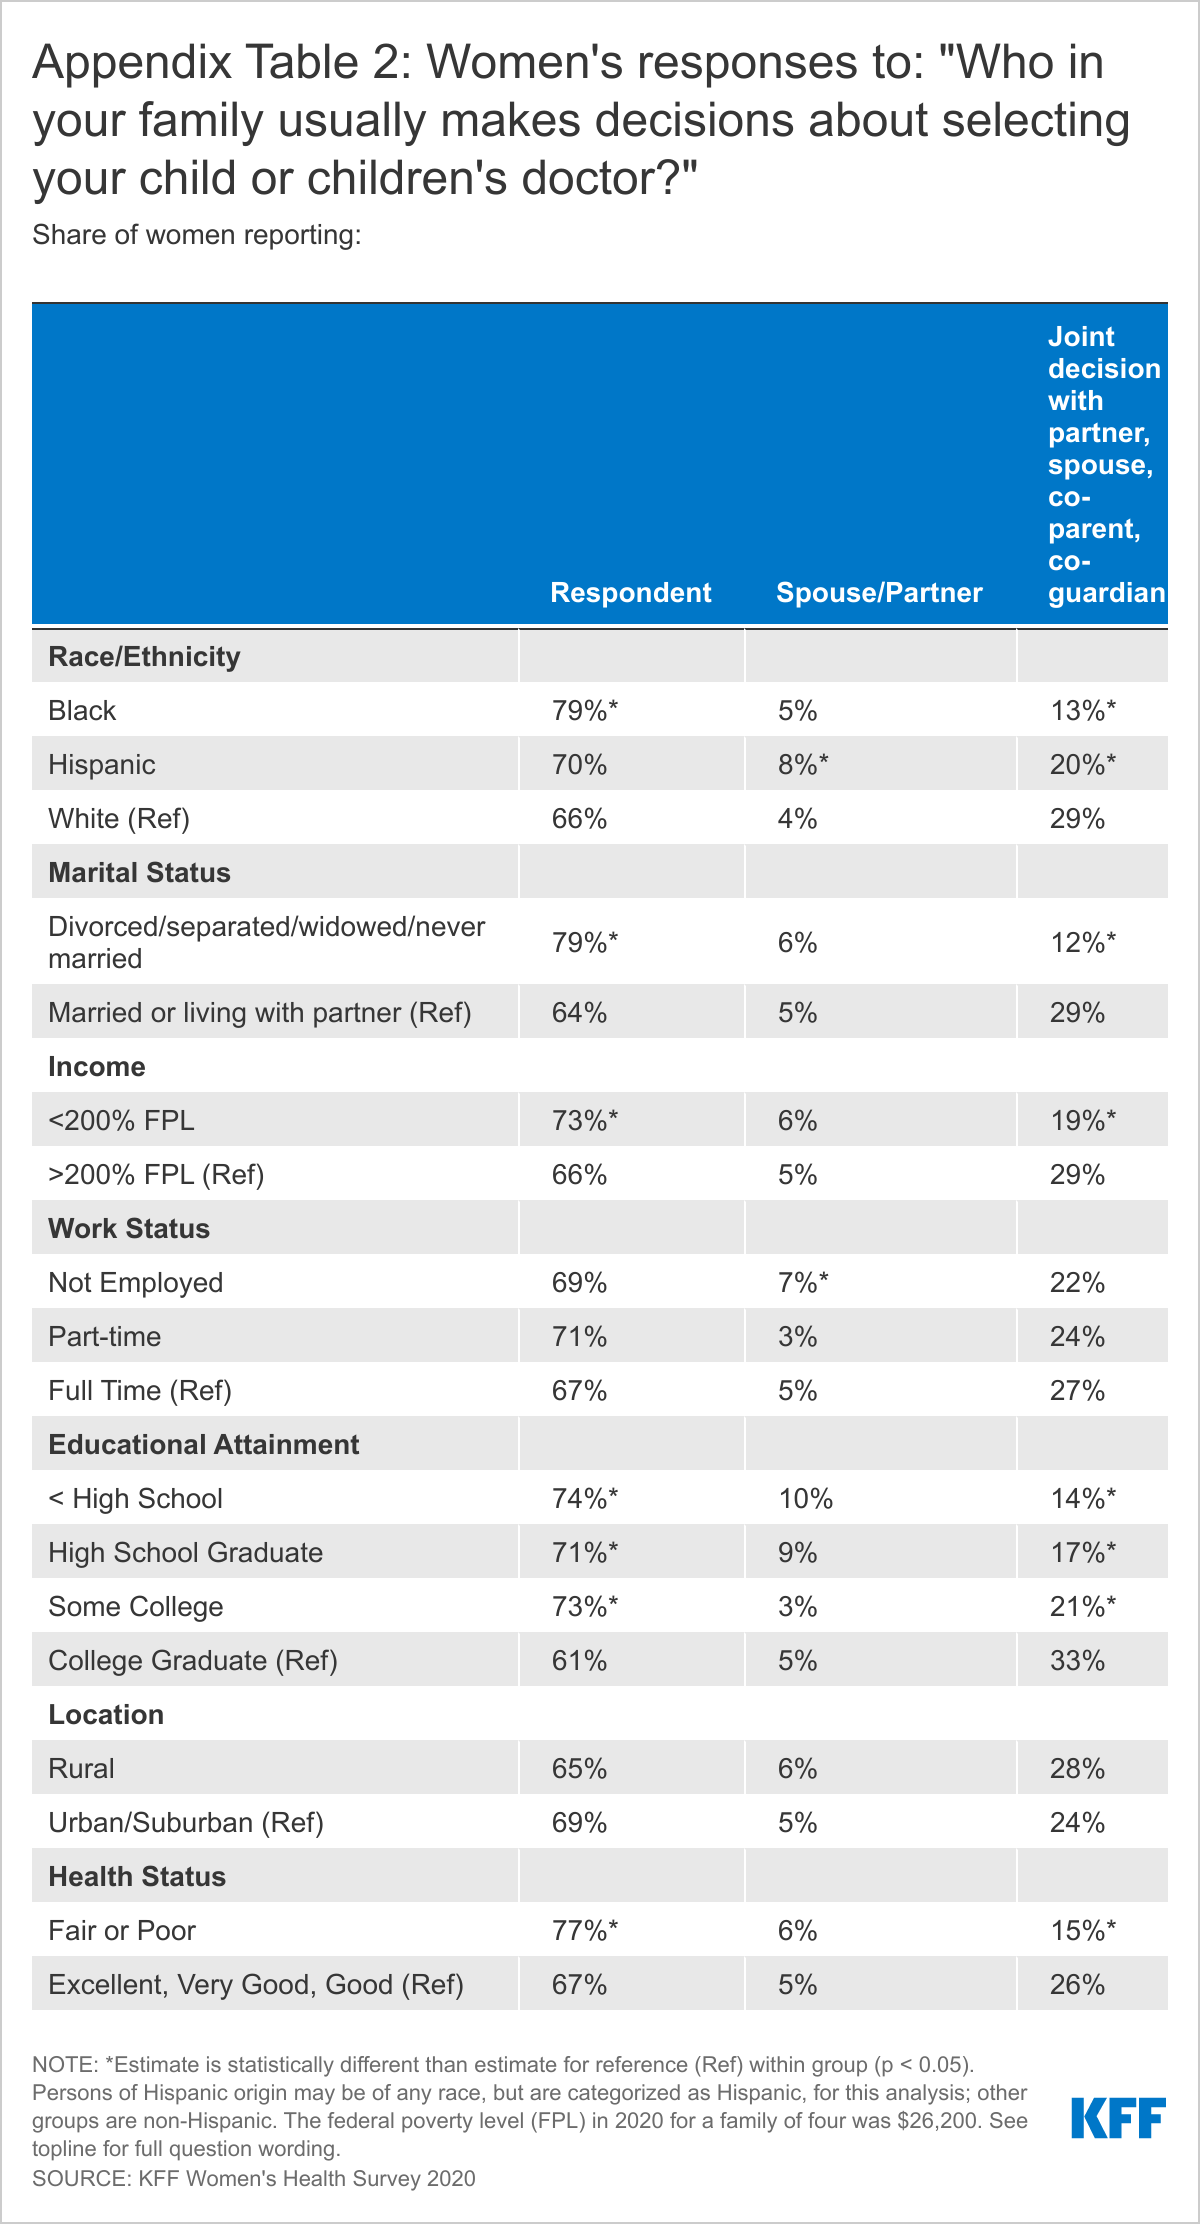
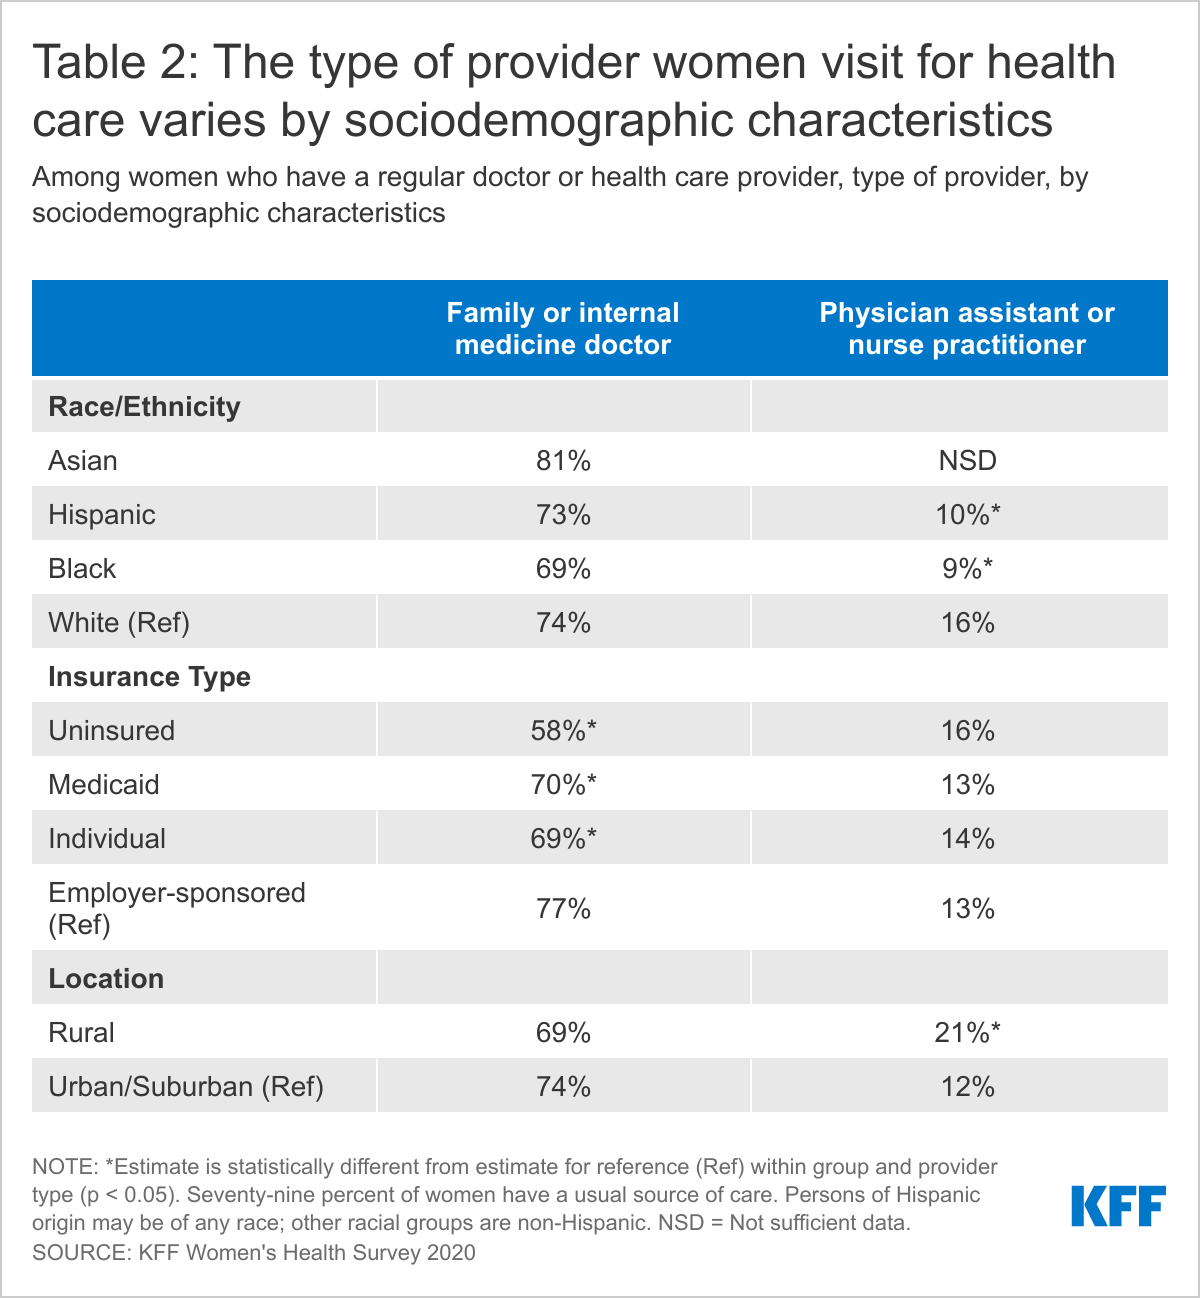
About three-quarters (77%) of women with private insurance and low-income women report having a family or internal medicine doctor as their primary provider (Table 2). Women who live in rural areas are more likely than women in urban/suburban areas to say their primary provider is an advanced practice clinician (21% vs. 12%). OBGYNs are the primary type of provider for more uninsured (12%) than insured (7%) women and Black women (12%) than White women (6%) (data not shown in table).
Health Insurance
Many insured women report that their plan didn’t always cover all their needed medical care, or that it paid less than they expected.
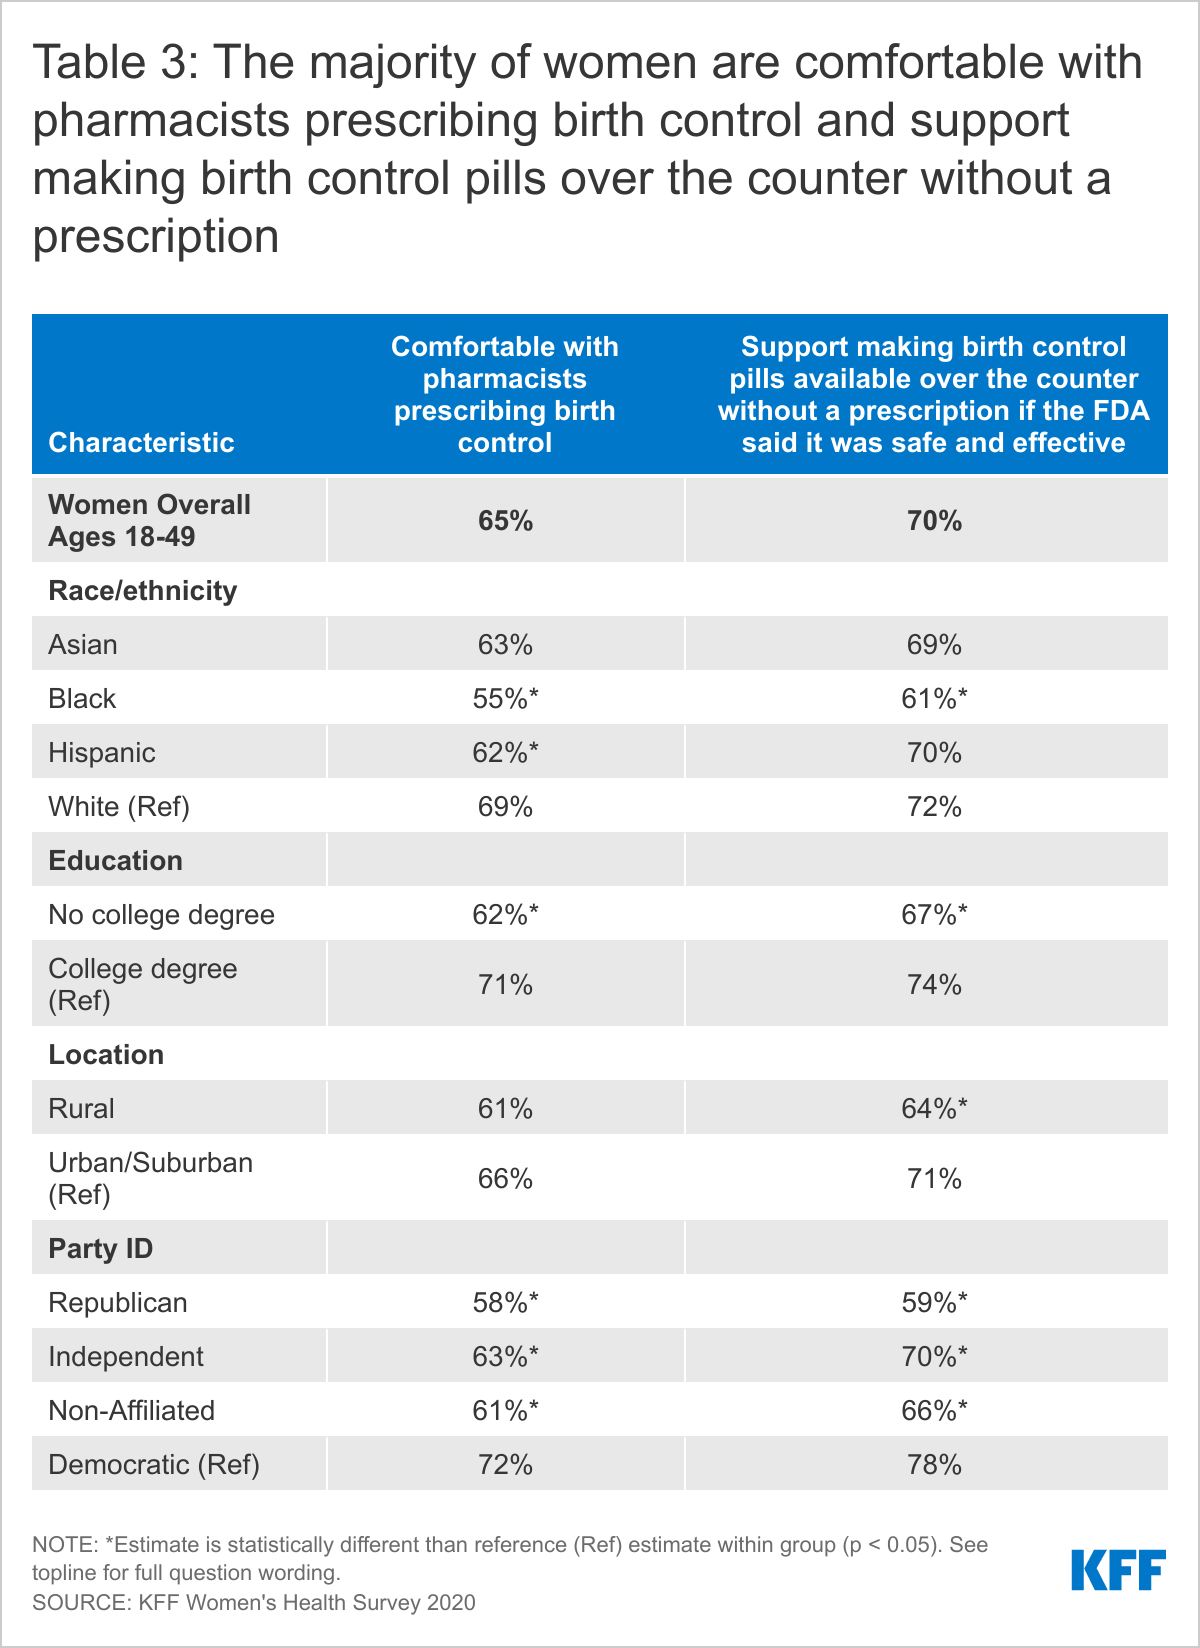
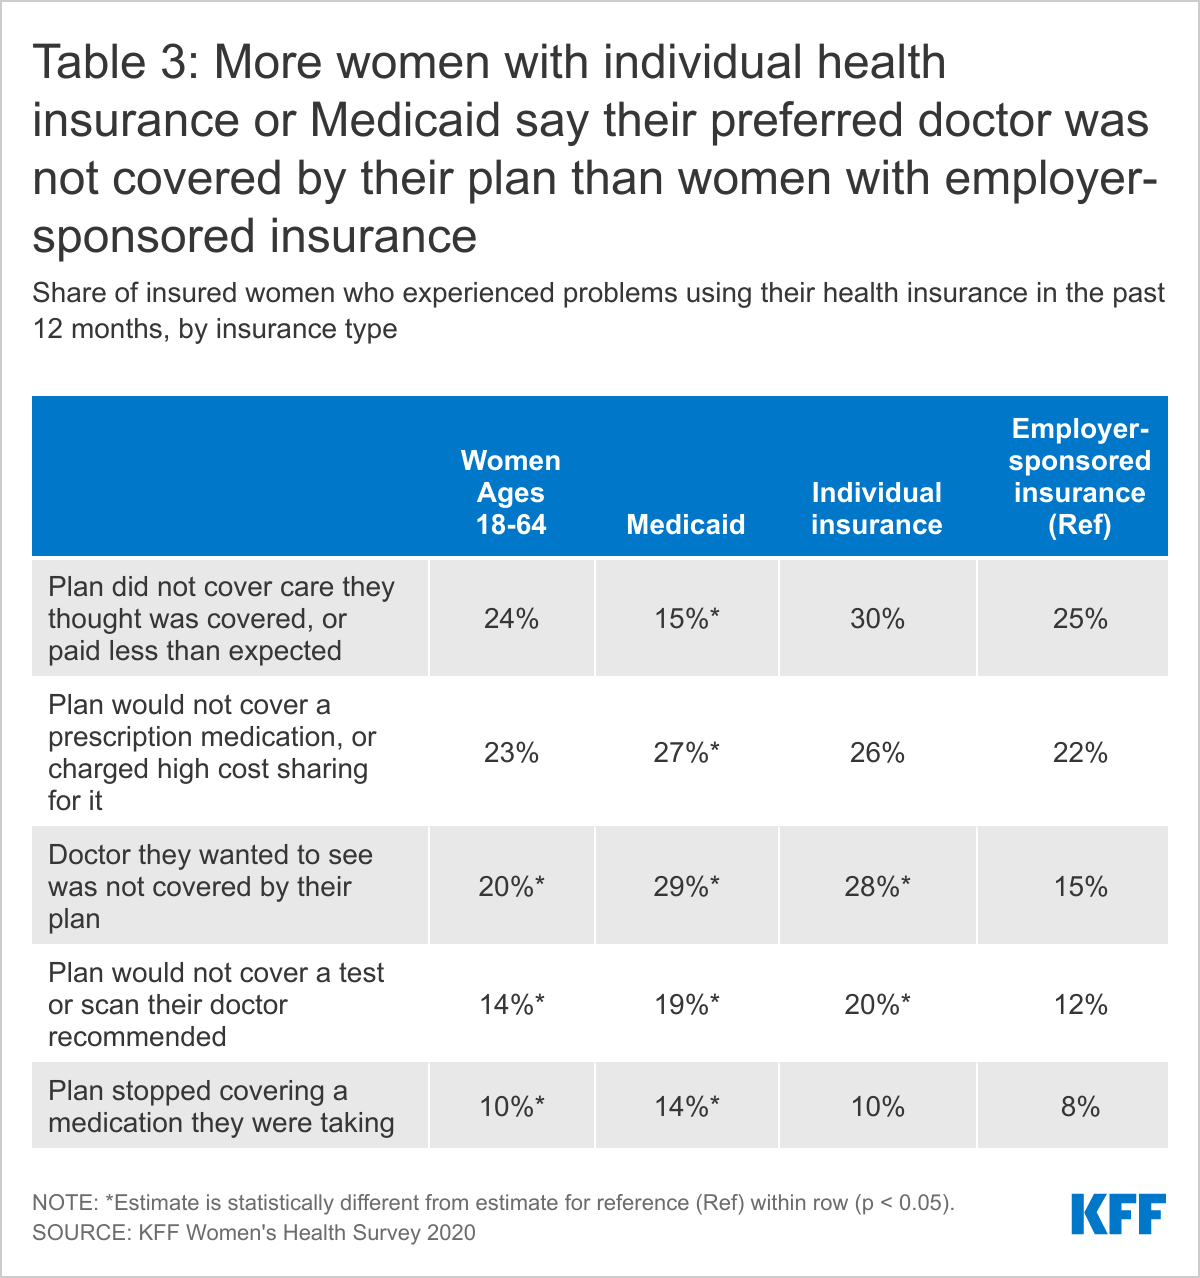
One in five women (20%) with health insurance report that a doctor they wanted to see was not covered by their plan (out-of-network) and 14% said their plan would not cover a test or scan their doctor recommended (Table 3). More than one in five insured women (23%) said their plan would not cover a prescription medication, or charged high cost sharing for it, and one in ten (10%) said their plan stopped covering a medication they were taking. Nearly one-quarter (24%) of women with health insurance (through either individual or employer plans or Medicaid) reported that their plan did not cover a medical bill for services they thought were covered, or that it paid less for that service than they expected. About one-quarter (23%) of these women said this was due to the provider being out-of-network, 43% believed it was for some other reason, and one-third (33%) said they did not know why this happened.
Some of these problems vary by type of insurance coverage. For example, one in four (25%) women with employer-sponsored insurance say their plan didn’t cover medical care they thought was covered, or paid less than expected, compared to 15% of women with Medicaid. Women with Medicaid (29%) or individual market coverage (28%) are nearly twice as likely as women with employer-sponsored insurance (15%) to report that a particular doctor they wanted to see not covered by their plan. Nearly twice as many women with Medicaid (14%) as with private insurance (8%) reported their plan stopped covering a prescription medication they were taking.
General Check-ups and Provider-Patient Counseling
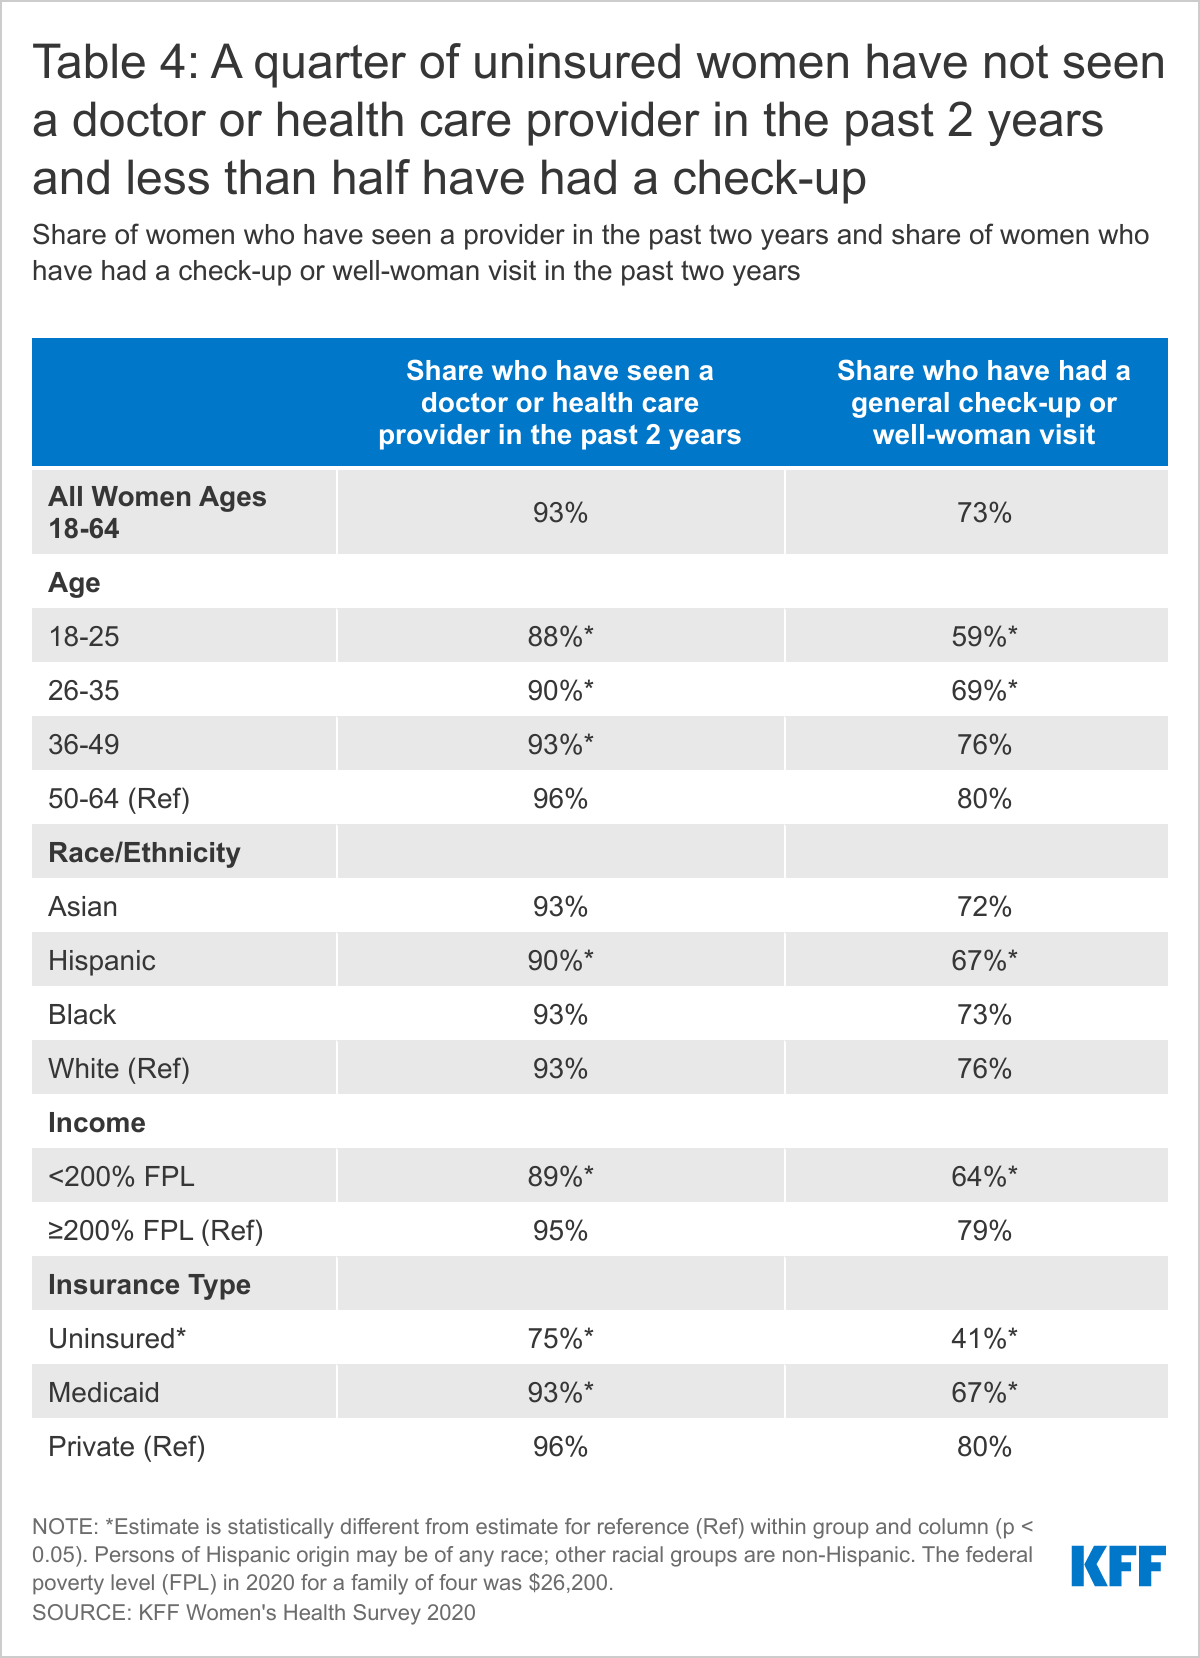
While most women have visited a doctor in the past two years and had a check-up, rates are lower among younger women and uninsured women.
Regular provider visits give women an opportunity to talk with clinicians about a broad range of issues, including preventing illness, the role of lifestyle factors on health, and management of chronic illnesses. Under the ACA, most health plans must cover at least one annual check-up or well-woman visit, which can include assessments of diet and physical activity, preconception care, and cancer screenings. The majority of women have seen a medical provider in the past two years, but fewer have had a well-woman visit or general check-up.
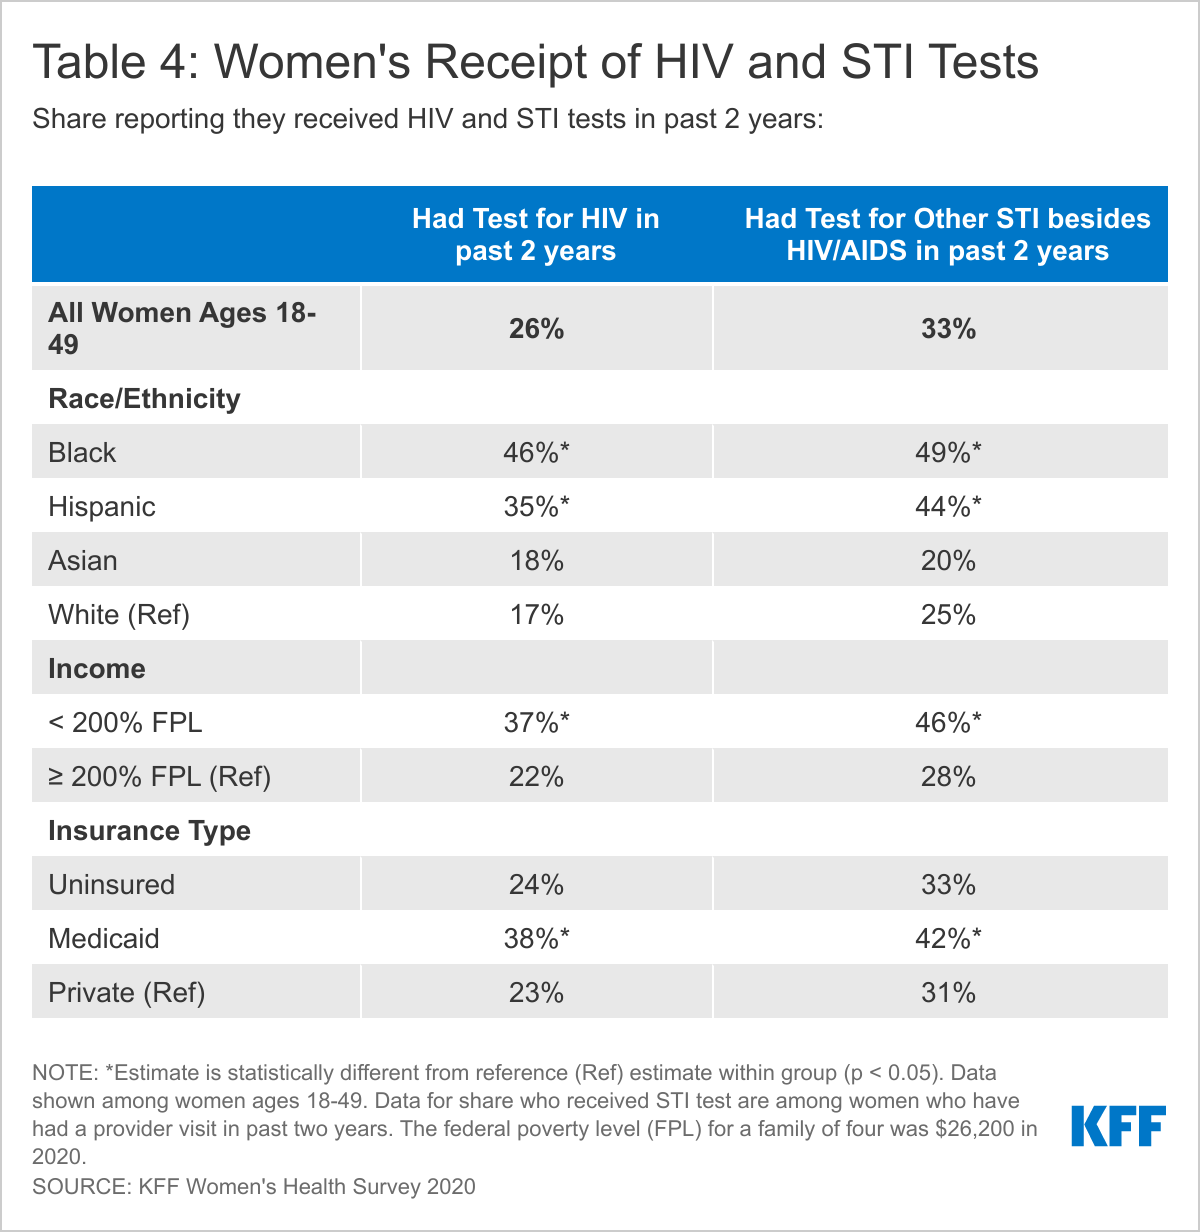
More than nine in ten (93%) women have seen a doctor or health care provider in the past two years (Table 4). However, fewer young women ages 18-25 (88%), uninsured women (75%), and low-income women (89%) have visited a doctor than the average.
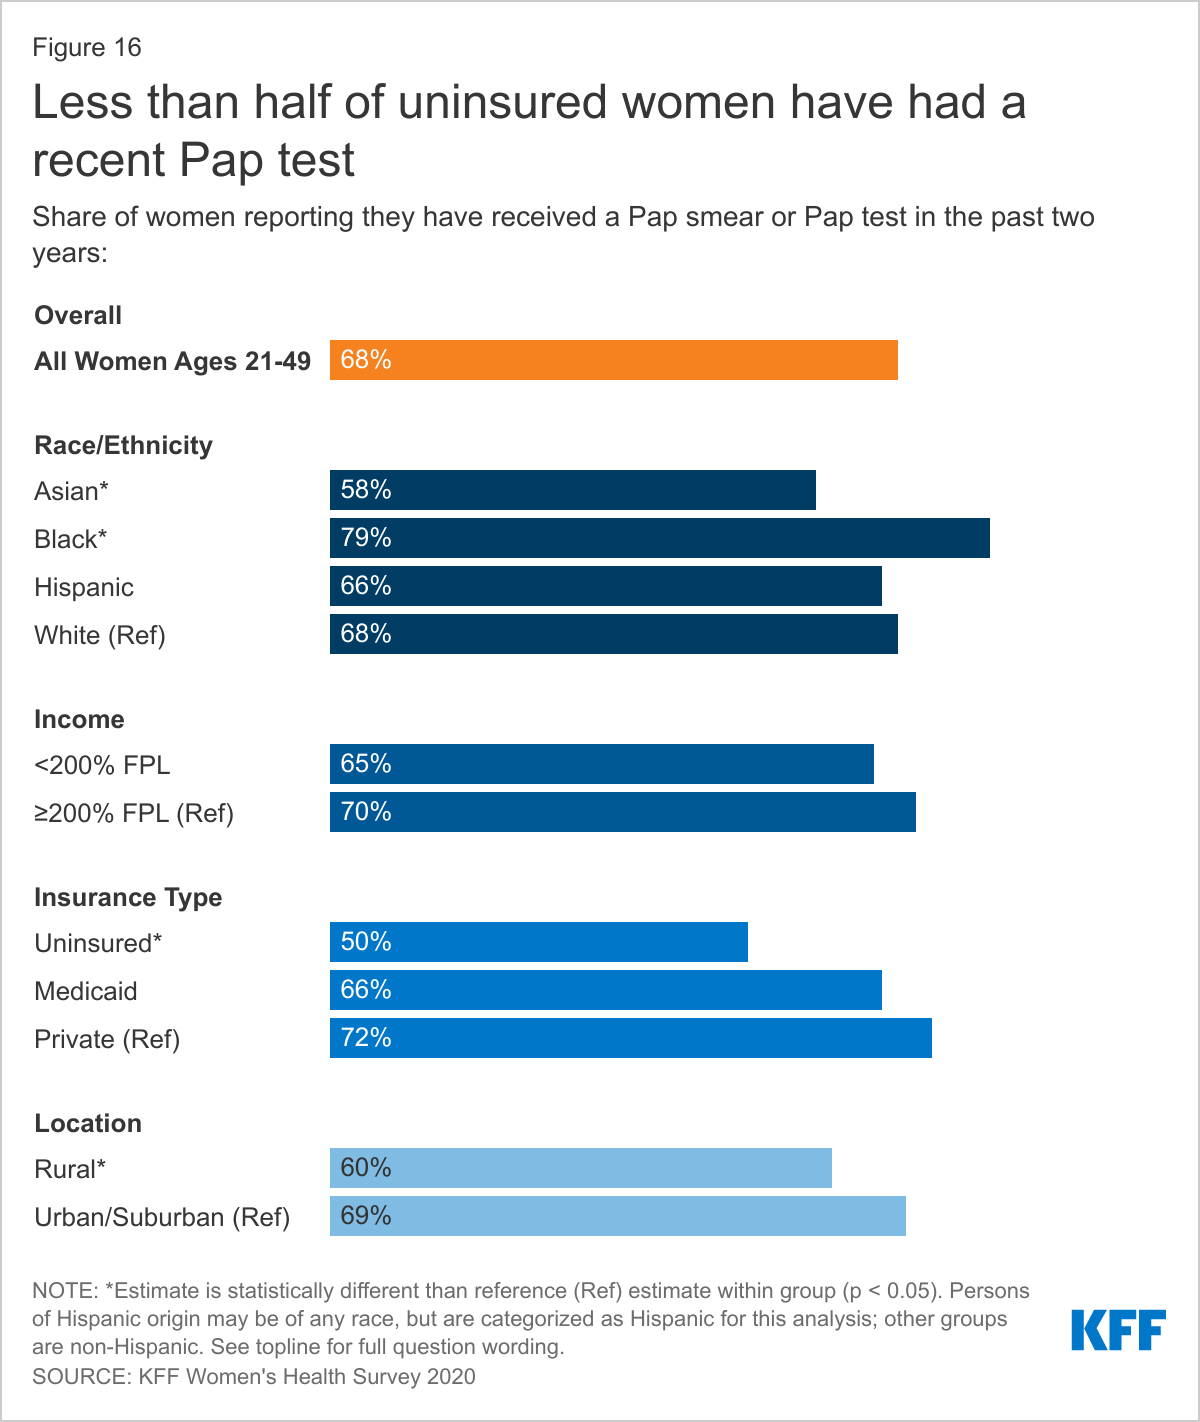
About three-quarters of women (73%) have had a general check-up or “well-woman visit” in the past two years. However, uninsured women (41%), low-income women (64%), and women in poorer health (66%) are less likely to have had a recent checkup. Hispanic women (67%) are less likely than White women (76%) to have had a check-up in the past two years.
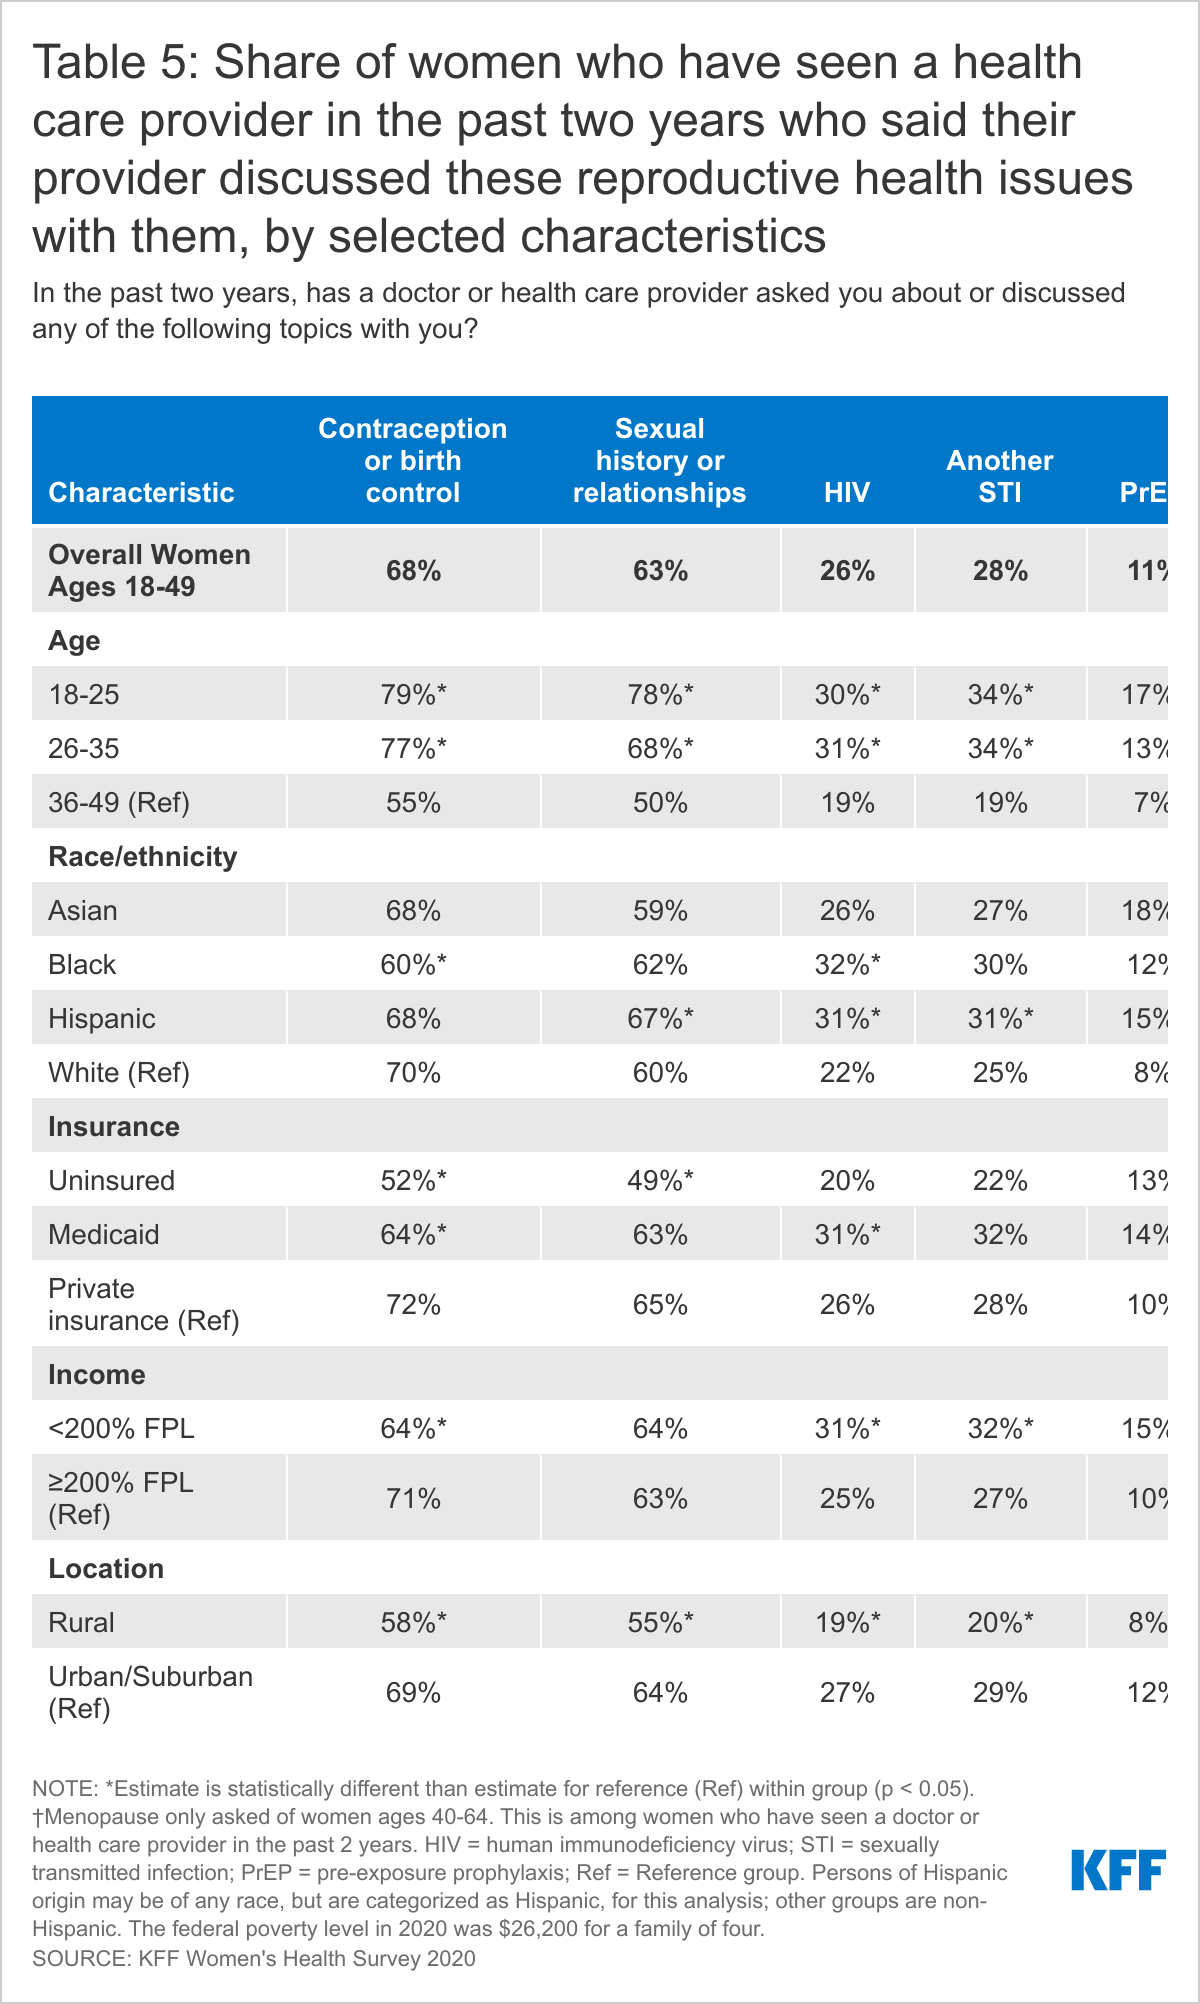
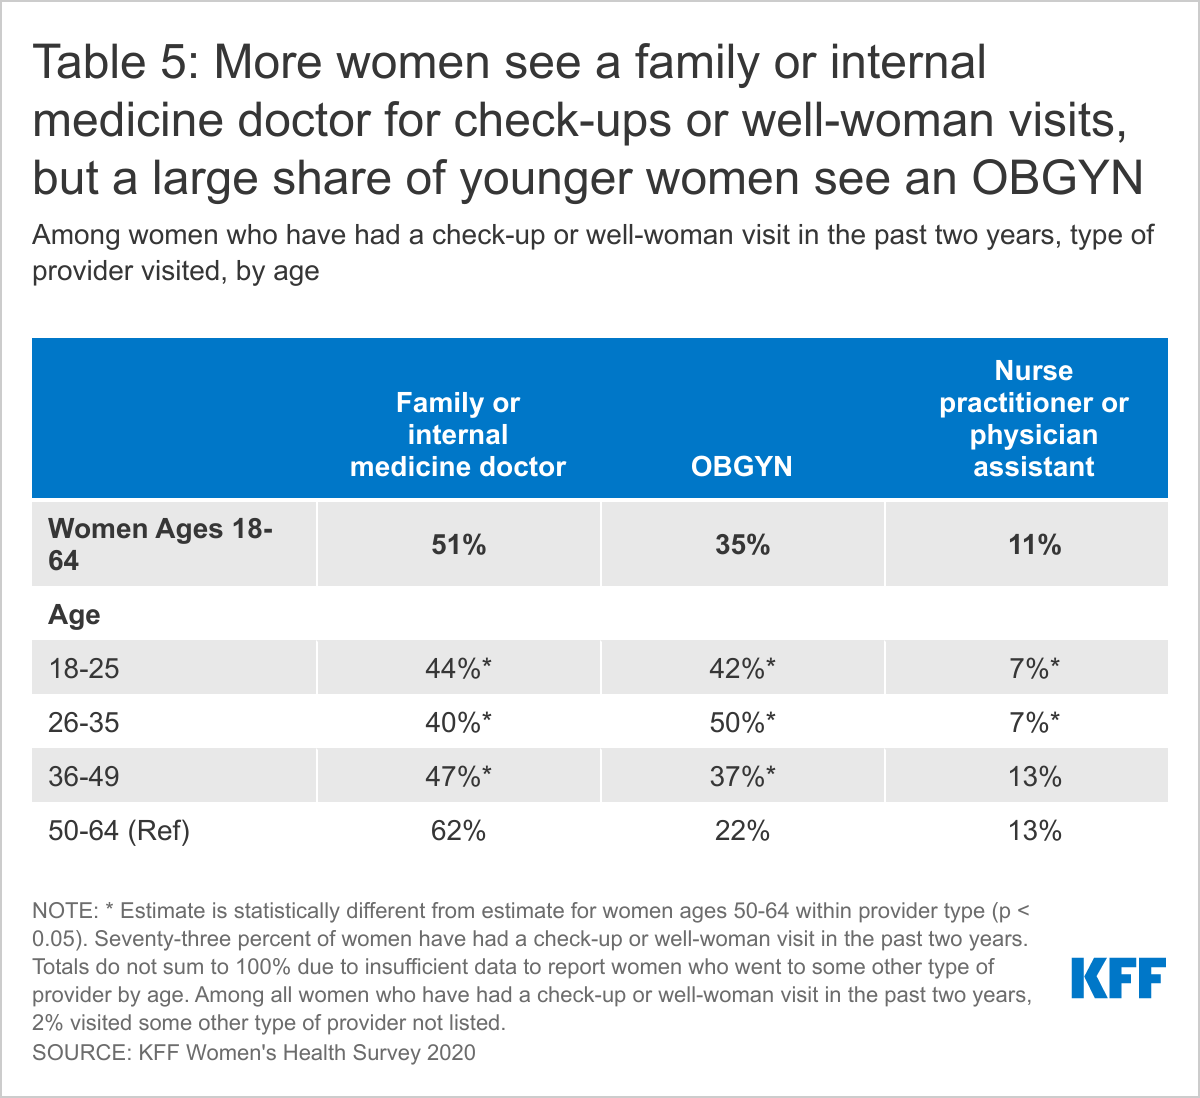
More than half (51%) of women who have had a check-up or well-woman in the past two years report that they went to a general practice or internal medicine doctor for their visit (Table 5). About two-thirds (35%) went to an OBGYN. Older women ages 50-64 (62%) are more likely to visit a general practice doctor than younger women ages 18-25 (44%), while younger women (42%) are more likely to visit an OBGYN than older women (22%). About one in ten (11%) women who have had a check-up in the past two years report that they saw a nurse practitioner or physician assistant for their visit; this share is higher among women ages 50-64 (13%) than women ages 18-35 (7%).
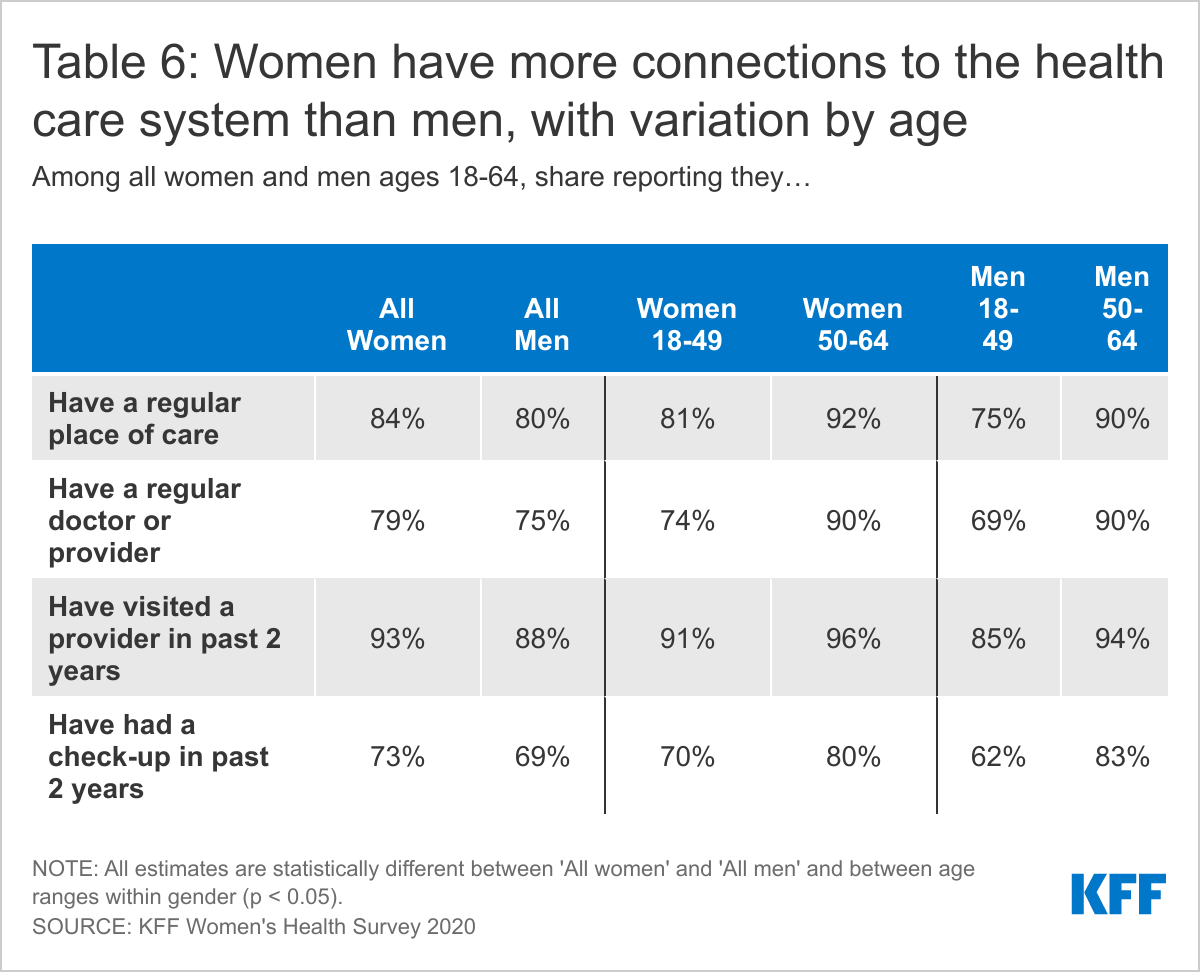
Overall, women have more connections to the health care system than men. Higher shares of women than men report having a usual source of care and a visit to a health provider in the past two years.
Women are slightly more likely than men to report having a regular place of care (84% vs. 80%) and a regular doctor or provider (79% vs. 75%) (Table 6). Ninety-three percent of women have visited a health care provider in the past two years and 73% have had a check-up, compared to 88% and 69% of men, respectively. Even within genders, there are differences by age, with older people more likely than younger people to report having each of these regular connections. For example, nine in ten (90%) women ages 50-64 have a regular doctor or health care provider compared to three-quarters (74%) of women ages 18-49. For men, nine in ten (90%) men ages 50-64 have a regular doctor or provider compared to seven in ten (69%) men ages 50-64.
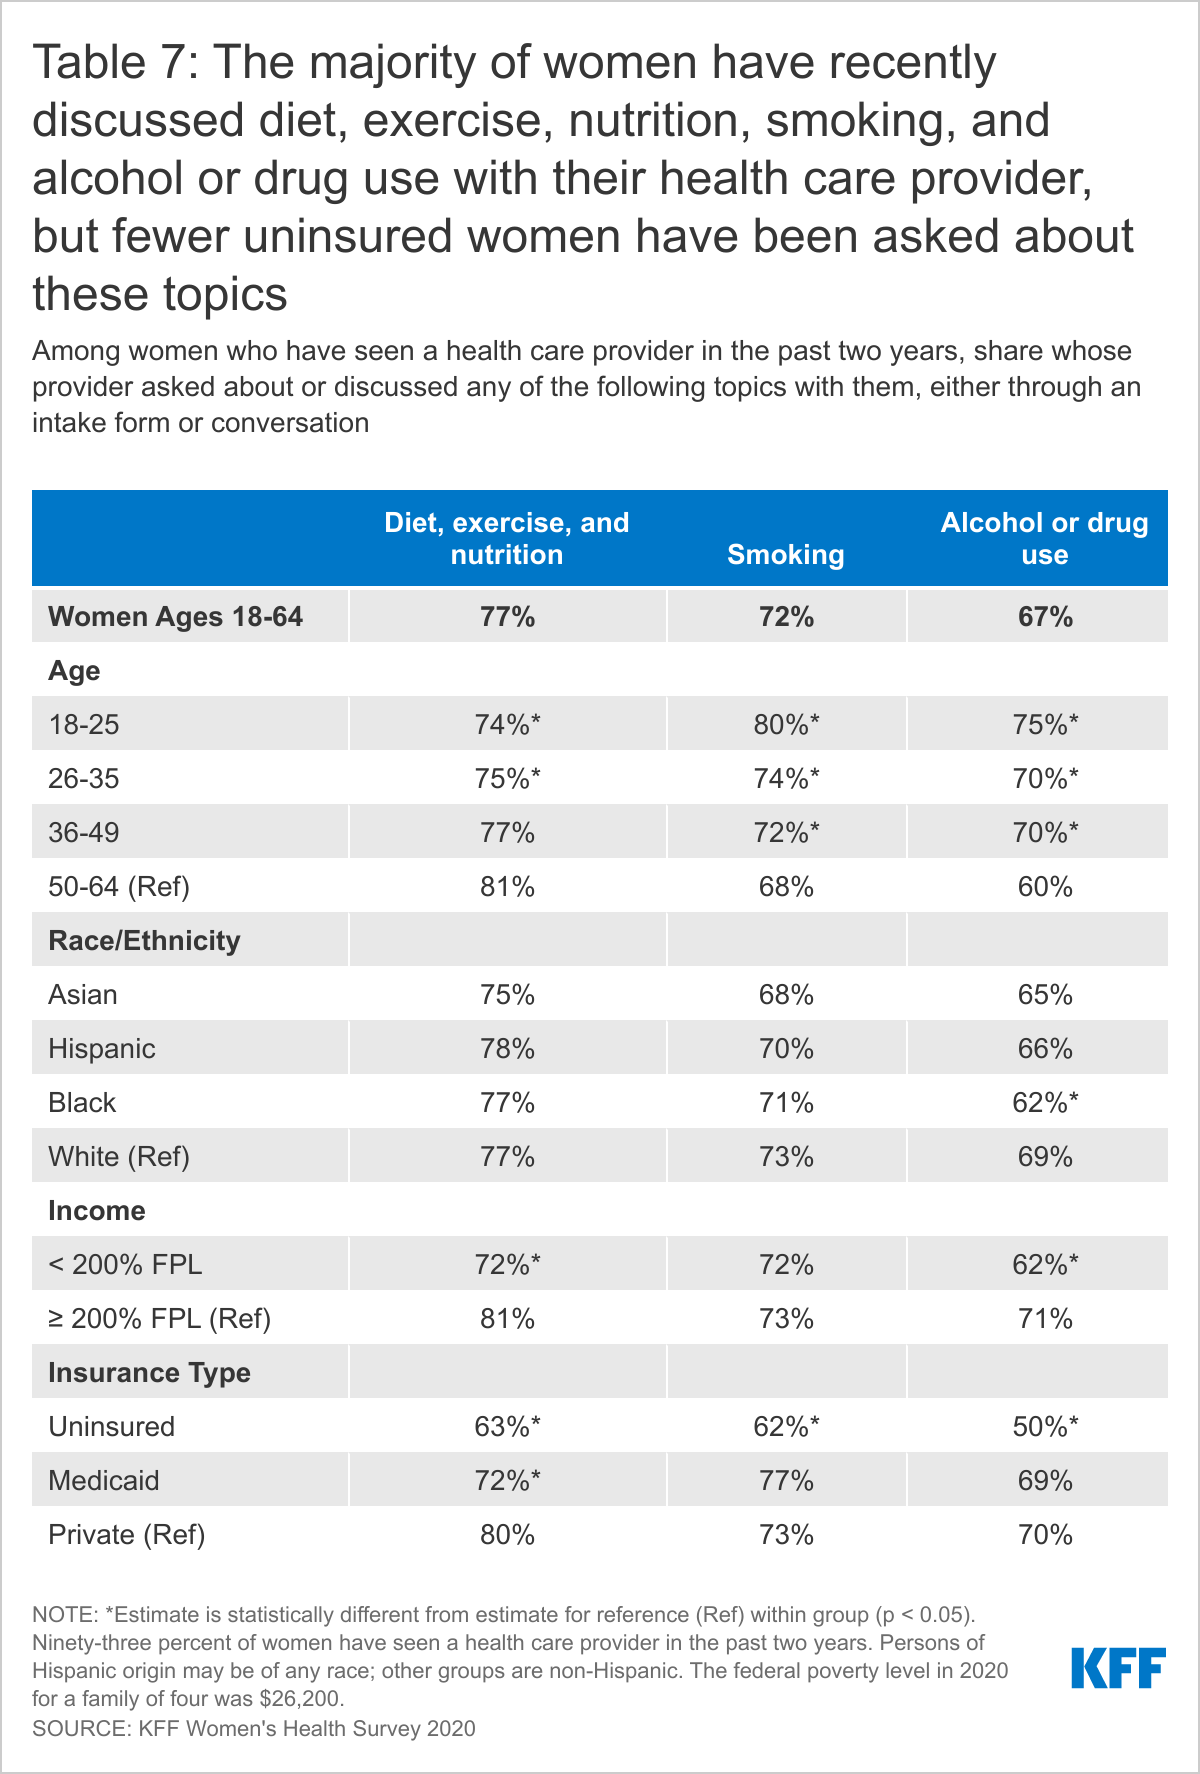
Most women report that they have spoken with a health care provider about health behaviors such as diet, exercise, and nutrition as well as smoking and alcohol or drug use.
Counseling on health-related behaviors such as diet, smoking, and alcohol use is an important component of women’s primary care. More than three in four (77%) women who have seen a provider in the past two years report their provider asking about or discussing diet, exercise, and nutrition with them.
Slightly fewer (72%) have discussed smoking and approximately two-thirds (67%) have discussed alcohol or drug use with a provider in the past two years. Older women ages 50-64 (81%), higher-income women (81%), and those with private insurance (80%) are more likely than their counterparts to have discussed diet, exercise, and nutrition with their provider. Younger women ages 18-49 are more likely than older women ages 50-64 to have discussed smoking (75% vs. 68%) or alcohol or drug use (71% vs. 60%). Across the board, insured women have higher rates of counseling on these issues than uninsured women (Table 7).5
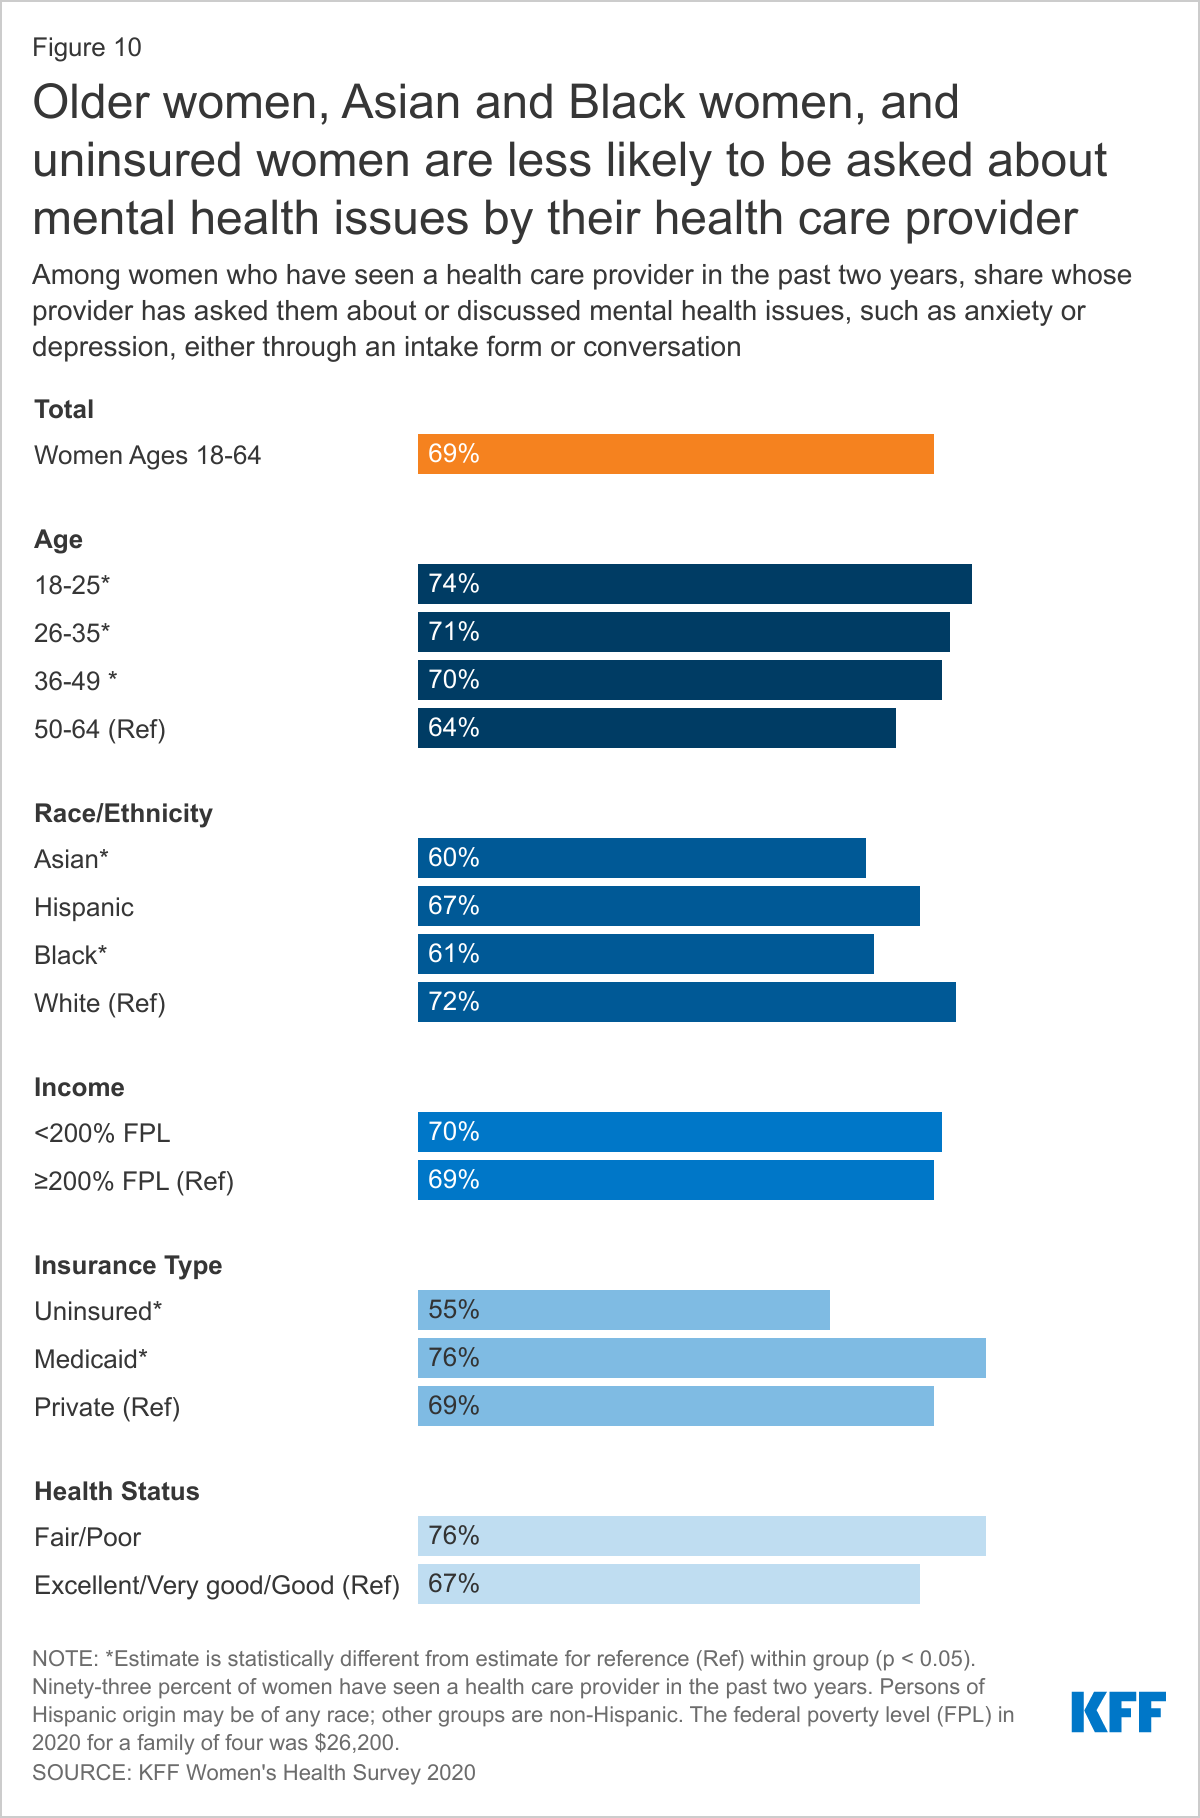
Smaller shares of Asian and Black women than White women report that a provider has asked about or discussed mental health issues such as anxiety and depression with them.
Most plans must cover treatment for mental health care and other medical conditions equally. Depression and anxiety affect a higher share of women than men over their lifetimes. The U.S. Preventive Services Task Force (USPSTF) recommends women receive depression screenings, though it does not have a recommendation for frequency. The Women’s Preventive Services Initiative (WPSI) now recommends that women and teens also receive anxiety screenings. The ACA requires health plans to cover both of these screenings without cost sharing.
Among women who have seen a health care provider in the past two years, nearly seven in ten (69%) report that their provider asked about or discussed mental health issues, such as anxiety or depression (Figure 10). More White women (72%) than Black (61%) and Asian (60%) women are asked about mental health issues. Younger women and women covered by Medicaid (76%) are more likely than their counterparts to have discussed mental health issues with their provider. Women with health insurance (70%) and those in poorer health (76%) are more likely than uninsured women (55%) and women in better health (67%) to have had this discussion with their health care provider.
Social Determinants of Health
Few women report that their health care providers have asked them about issues such as their ability to afford food, their housing situation, and access to reliable transportation.
In recent years, the social determinants of health have been recognized as critical factors that shape health outcomes. These factors include housing, transportation, nutrition, and financial well-being. Although there are no formal recommendations for routine screening for social determinants of health, there is increasing awareness among the medical community that better tools are needed to help target assistance to patients to improve health. Health care providers who ask their patients about these factors may be able to help connect patients who are experiencing challenges to local assistance and resources.
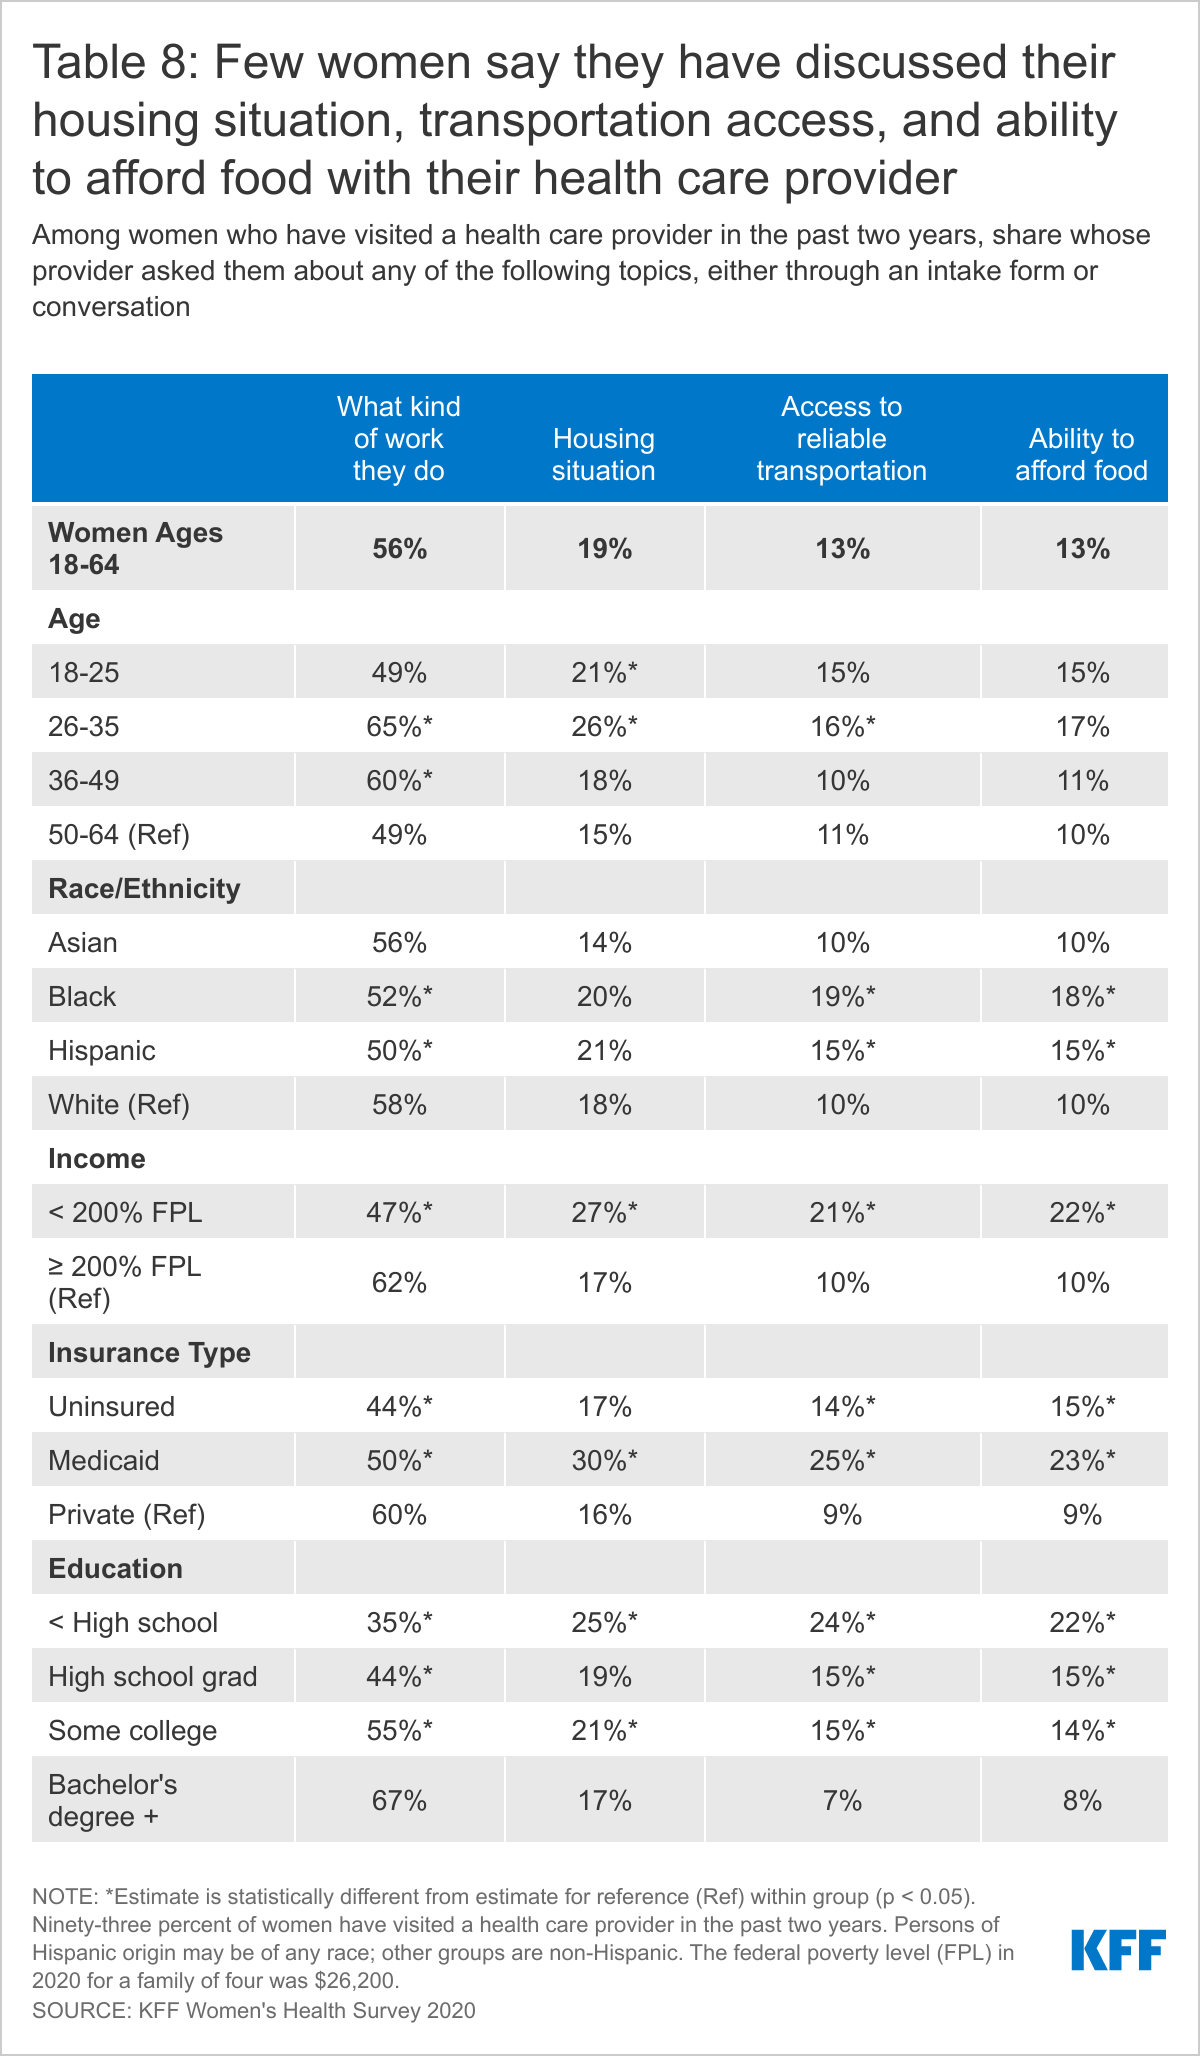
More than half of women who have visited a doctor in the past two years were asked about the kind of work they do while only 13% were asked about their access to reliable transportation or ability to afford food. Three in ten women with Medicaid were asked about their housing situation.
Over half (56%) of women who have seen their health care provider in the past two years report that their provider asked about what kind of work they do, with higher shares among women ages 26-35 (65%) and women with a college degree (67%) (Table 8). Two in ten (19%) women who have seen a health care provider in the past two years report having been asked about their housing situation, with higher shares among women with Medicaid coverage (30%) and low-income women (27%). Fewer women (13%) report that their provider asked them about their access to reliable transportation or their ability to afford food. Women with Medicaid or who are lower-income are more likely than their counterparts to have been asked about these two topics with their health care provider in the past two years.
Screening Tests
Use of preventive services can lead to early identification of conditions when they are more responsive to medical interventions. This is especially true for certain types of cancers and cardiovascular conditions. For example, the USPSTF recommends routine mammograms every two years for women ages 50-74 to identify breast cancer as well as colorectal cancer screenings for women ages 50-75, though the recommended frequency varies by type of screening test. These services are covered in full by most private plans under the ACA’s preventive services coverage requirements and by most state Medicaid programs.6
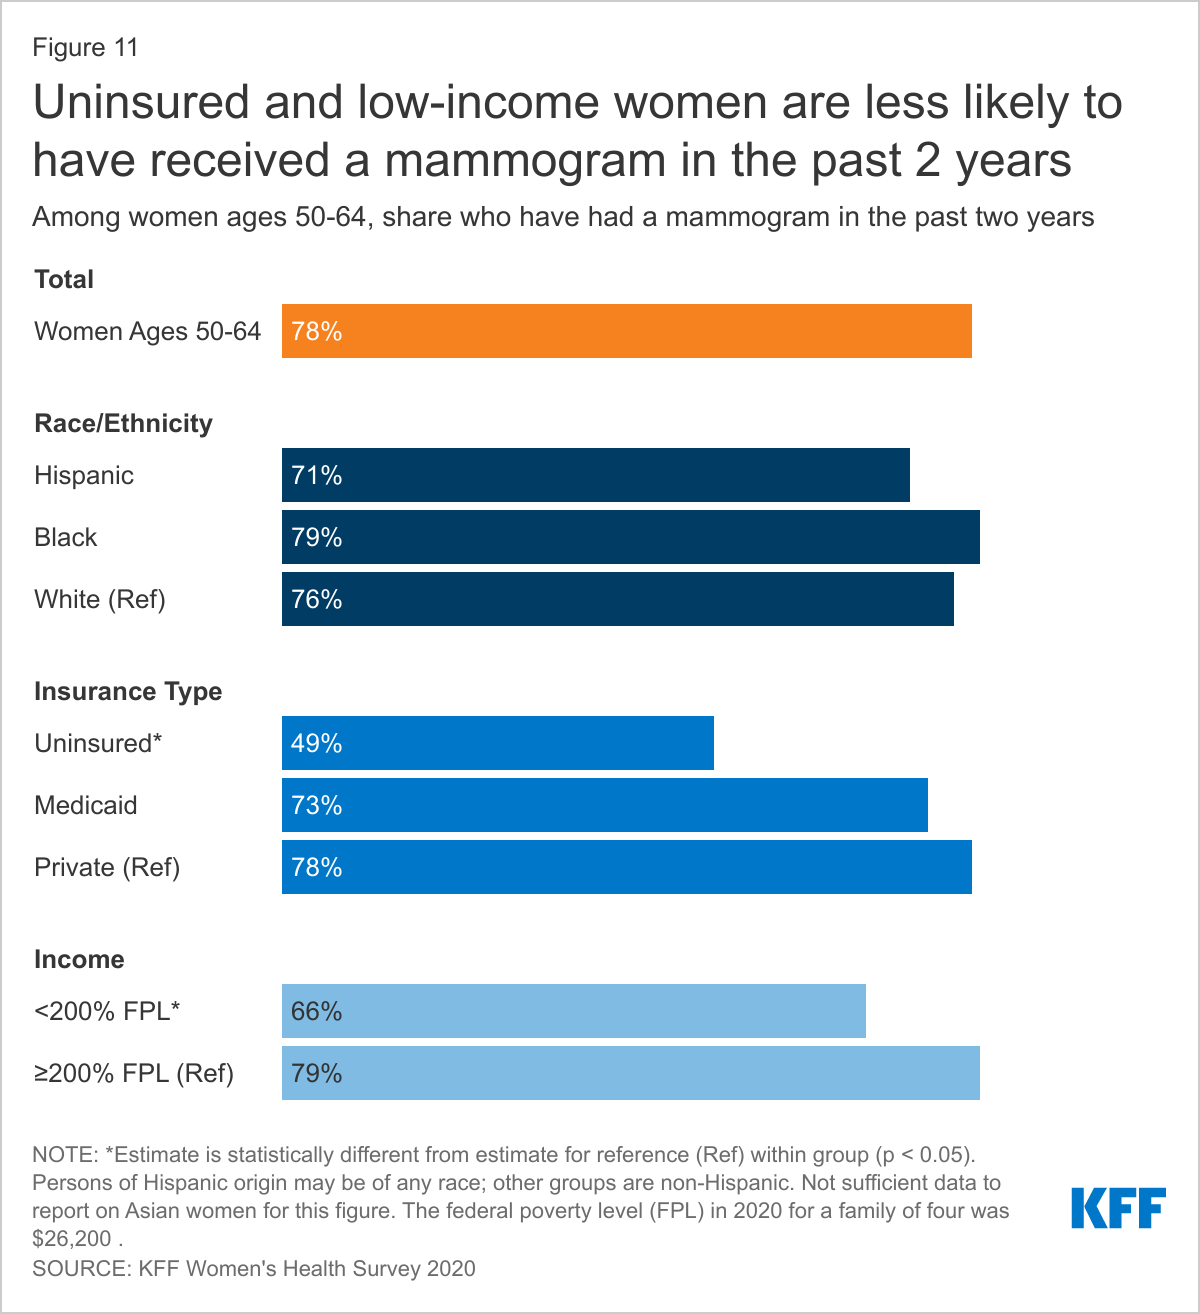
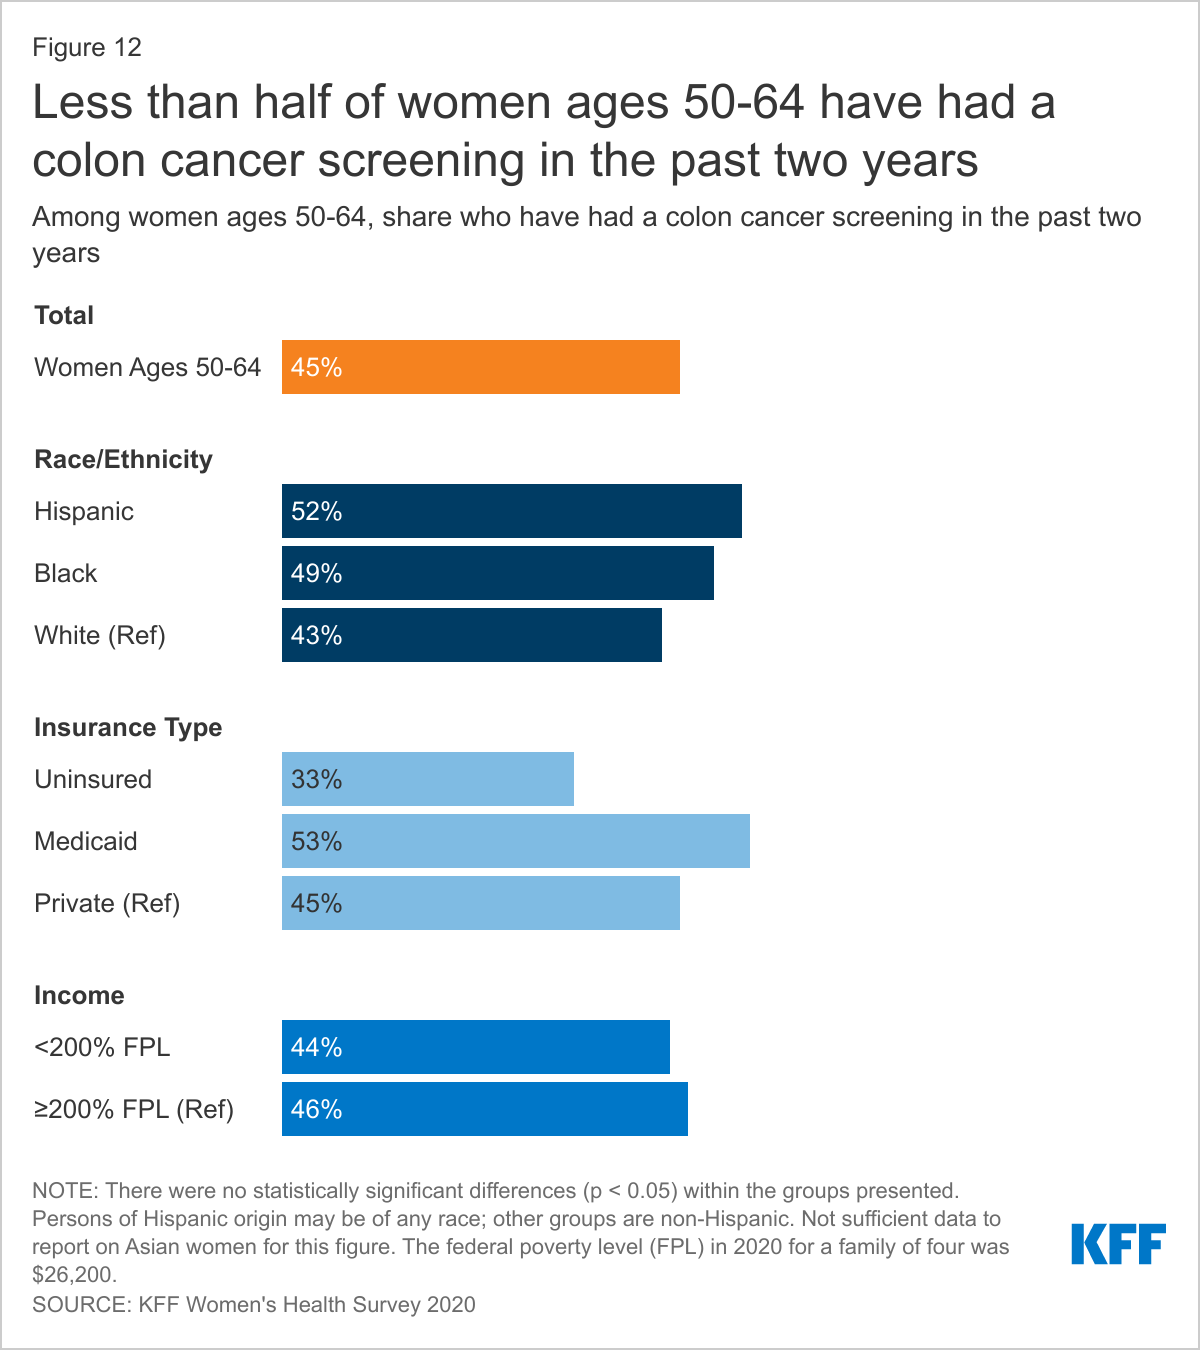
Most women ages 50-64 say they have had a mammogram in the past two years; fewer have had a recent colon cancer screening.
Most (78%) women ages 50-64 have had a mammogram in the past two years (Figure 11). Insured women ages 50-64 (78%) are more likely than uninsured women (49%) to have had a mammogram in the past two years. Low-income women (66%) are less likely than higher-income women (79%) to have received a mammogram in the past two years. The survey found no statistically significant differences in mammogram screening rates by race/ethnicity.
Less than half (45%) of women ages 50-64 report having had a colon cancer screening in the past two years (Figure 12). Women with insurance (47%) are more likely than uninsured women (33%) to have had a colon cancer screening in the past two years. The survey did not find any statistically significant differences in recent colon cancer screening rates by race/ethnicity, insurance type, or income.
Health Care Experiences
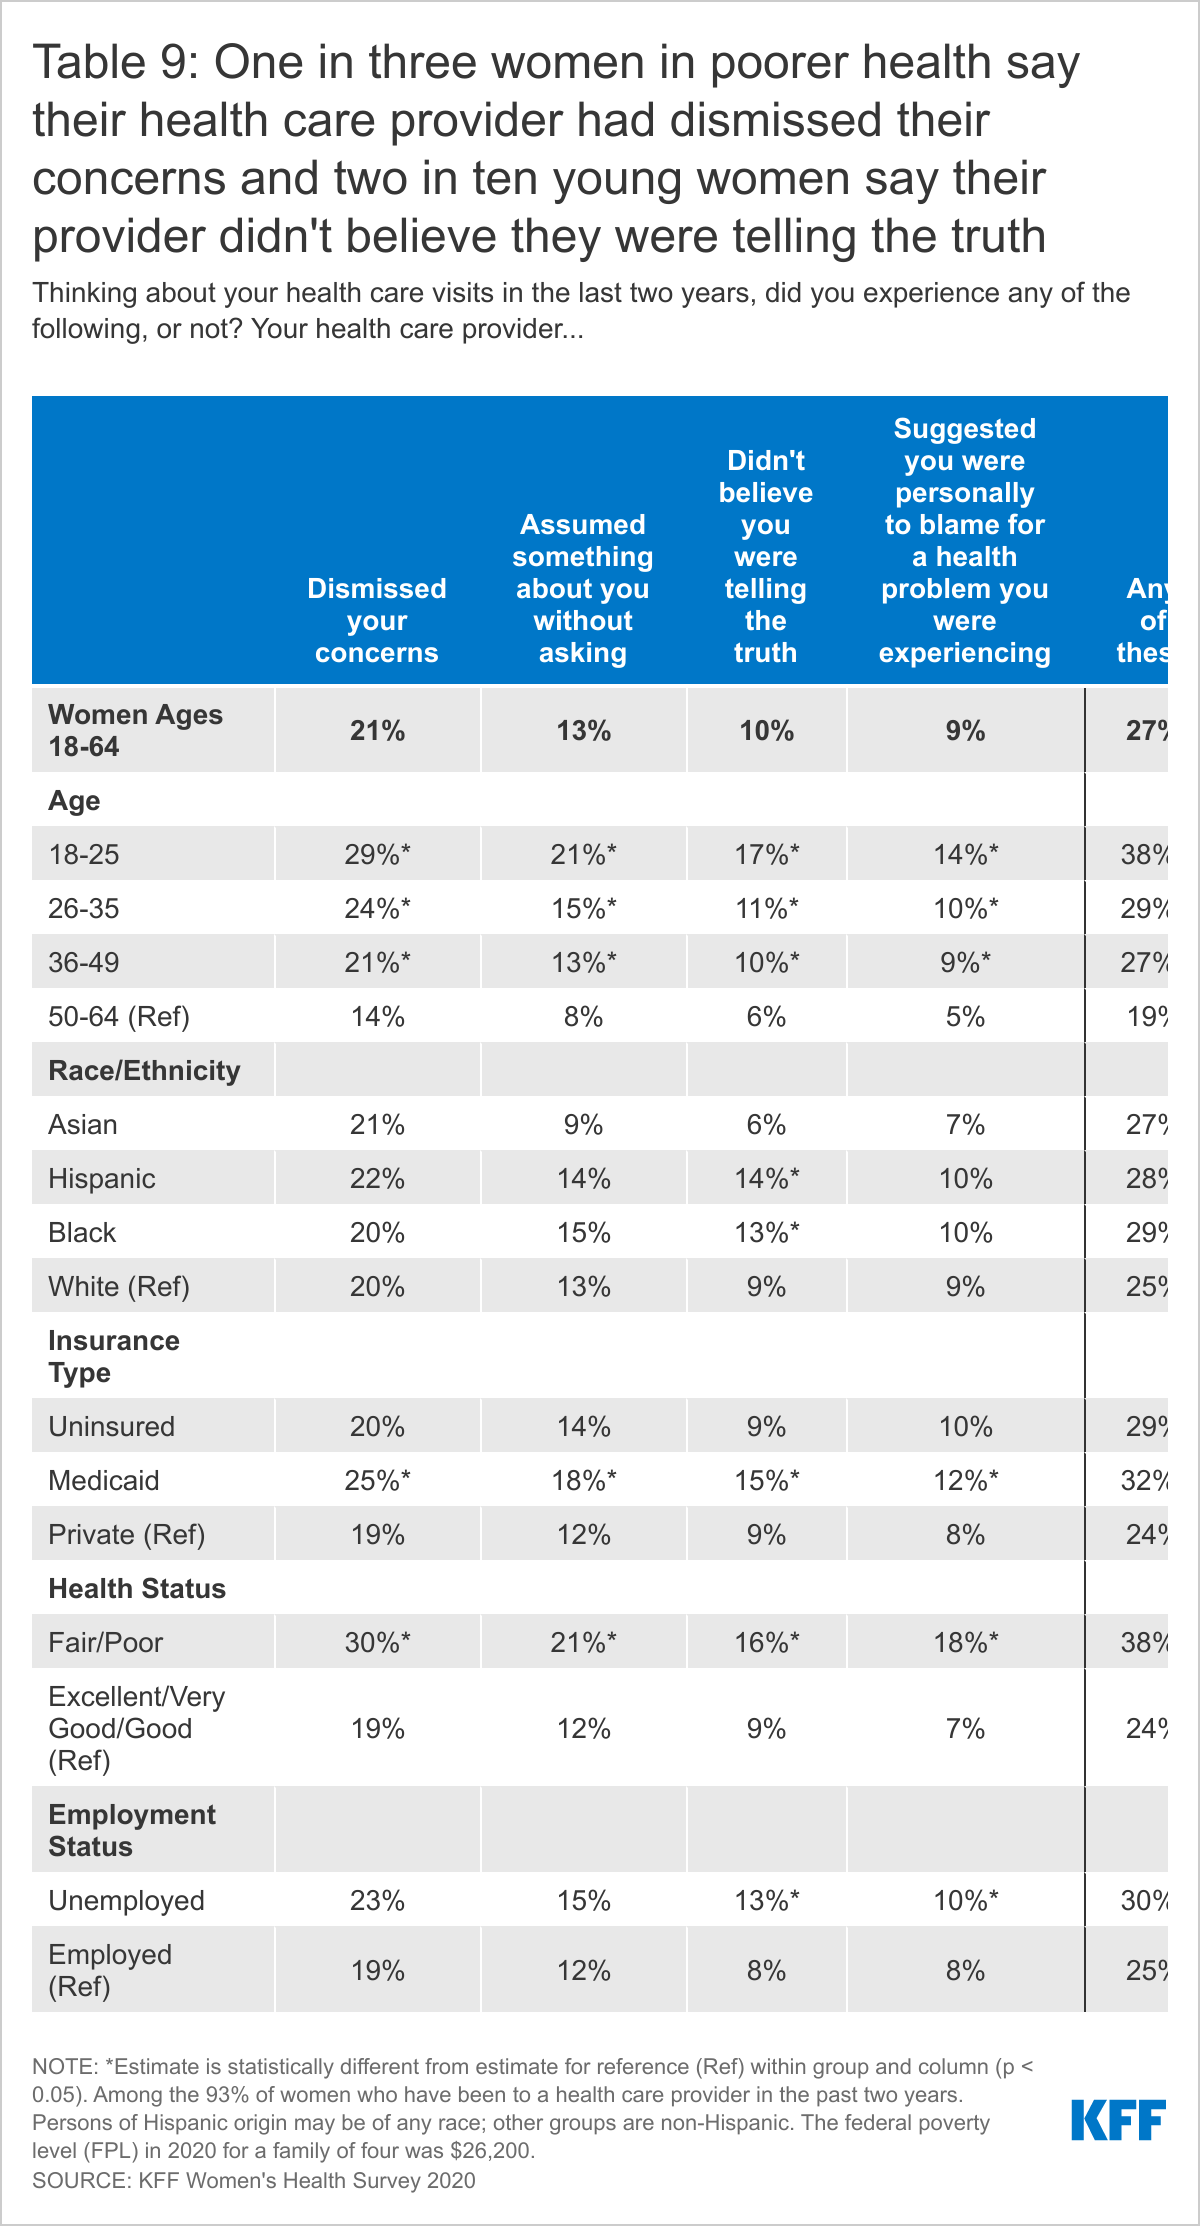
Negative experiences with the health care system can contribute to poorer health outcomes, distrust of the health care system, and health disparities. Two in ten women who have seen a health care provider in the past two years say that their provider dismissed their concerns and 13% report that their provider assumed something about them without asking. These shares are higher among younger women, women with Medicaid, and women in poorer health.
The impact of bias in health care, including implicit bias, has garnered increased attention in recent years and is recognized as having detrimental effects on women’s health. To gain greater insight into women's experiences with health care providers, our survey asked whether they had encountered any of four negative experiences when visiting their provider in the past two years.
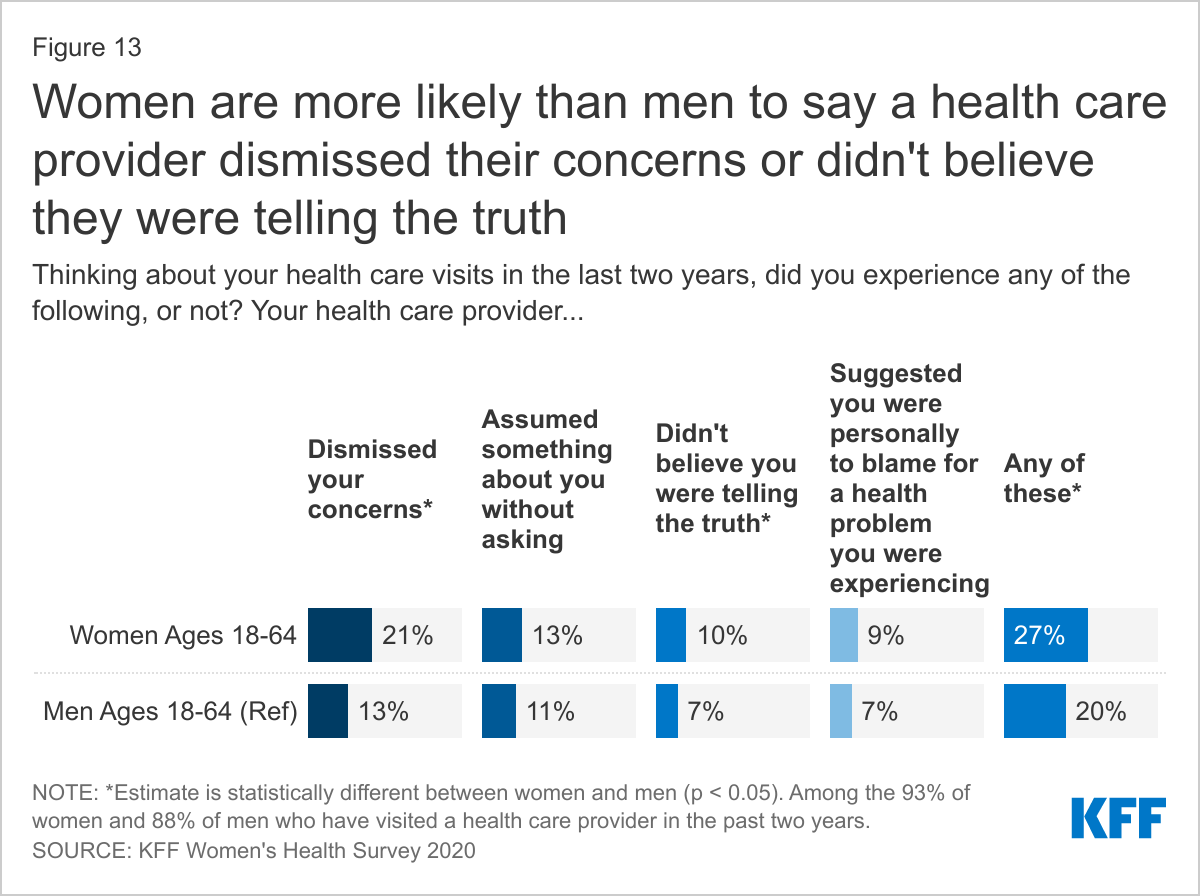
Among women and men who have visited a health care provider in the past two years, 21% of women report that their doctor had dismissed their concerns, compared to 13% of men (Figure 13). Thirteen percent of women and 11% of men who have been to a doctor in the past two years say their doctor assumed something about them without asking. Ten percent of women who have visited a provider in the past two years have had a provider who didn’t believe they were telling the truth, compared to 7% of men. Nine percent of women and 7% of men report that a provider suggested they were personally to blame for a health problem. Women are more likely than men to have had at least one of these negative experiences with their provider in the past two years (27% vs. 20%).
Women who are younger, covered by Medicaid, or in poorer health are more likely than their counterparts to have had each of these four experiences with their provider in the past two years (Table 9). Hispanic (14%) and Black (13%) women are more likely than White women (9%) to say their doctor did not believe they were telling the truth. Thirteen percent of unemployed women who have visited a health care provider in the past two years report that their doctor did not believe they were telling the truth, compared to 8% of employed women. Nearly four in ten (38%) women ages 18-25 and women in poorer health have had at least one of these four experiences.
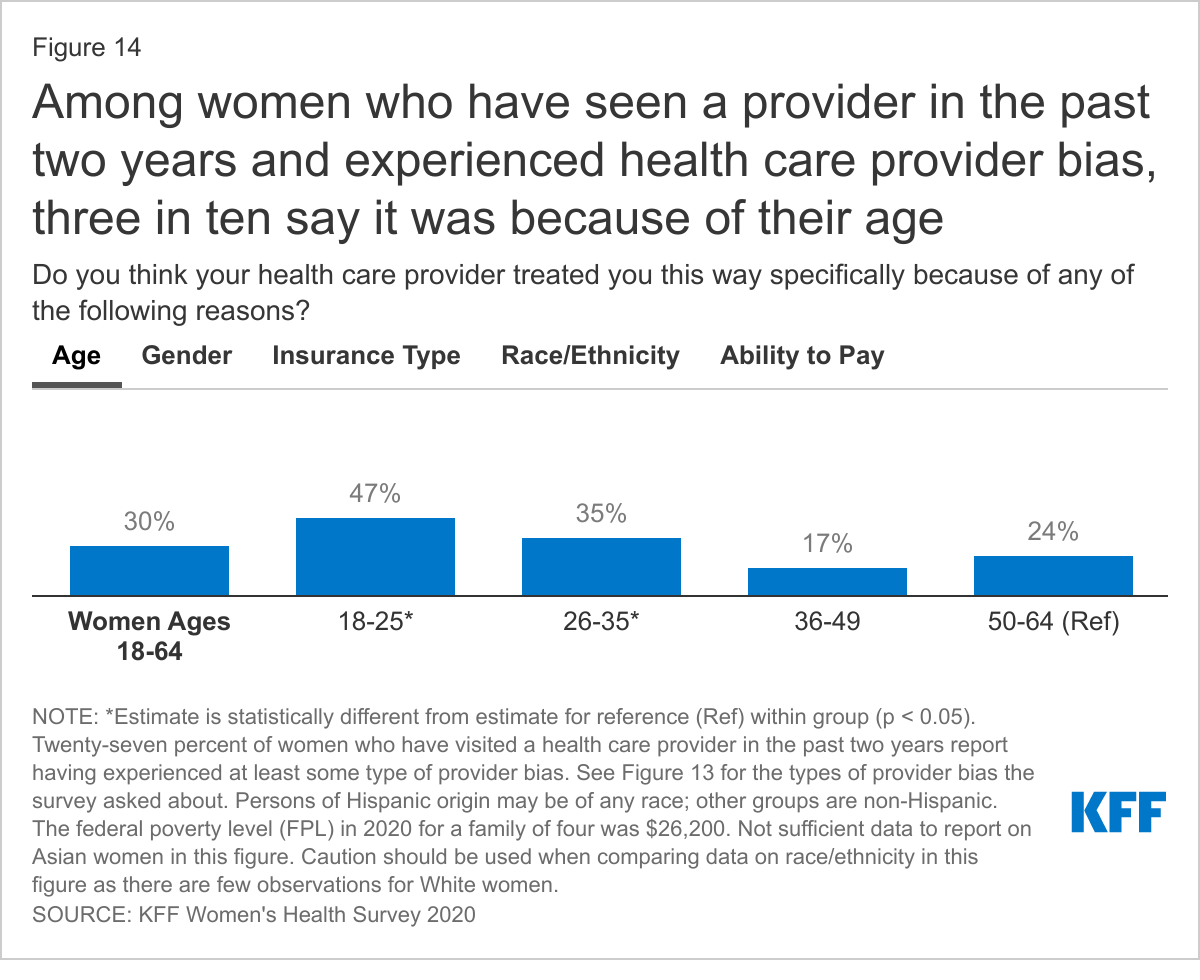
Among women who have been treated in at least one of these ways, many say it was because of their age and/or gender. Black and Hispanic women are more likely than White women to say they were treated this way because of their race/ethnicity.
Among women who had at least one of these four types of experiences with their provider, 30% believe they were treated this way because of their age; 20% say it was because of their gender; 13% think it was because of their insurance type; 11% believe it was due to their race or ethnicity; 8% think it was because of their ability to pay, and 22% do not know (Figure 14). Notably, 32% of women who had one these negative experiences with their provider said that it happened for 'none of these reasons.'
Among women who have had one of these experiences with their provider in the past two years, younger women ages 18-25 (47%) and 26-35 (35%) are more likely than women ages 36-49 (17%) and 50-64 (24%) to say they experienced this because of their age. Women are almost twice as likely as men to say they were treated this way because of their gender (20% vs. 12%). Women with Medicaid are nearly four times more likely than women with private insurance to say they were treated this way because of the type of insurance they had (30% vs. 8%). Black women (38%) and Hispanic women (16%) are more likely than White women (2%) to say they were treated this way by their provider because of their race/ethnicity.7 Low-income women are almost three times more likely than higher-income women to say they experienced this treatment because of their ability to pay (14% vs. 5%).
Health Care Costs
Out-of-Pocket Costs for Preventive Care
When it comes to annual check-ups or well-woman visits, more than four in ten women report having at least some out-of-pocket costs associated with these preventive visits.
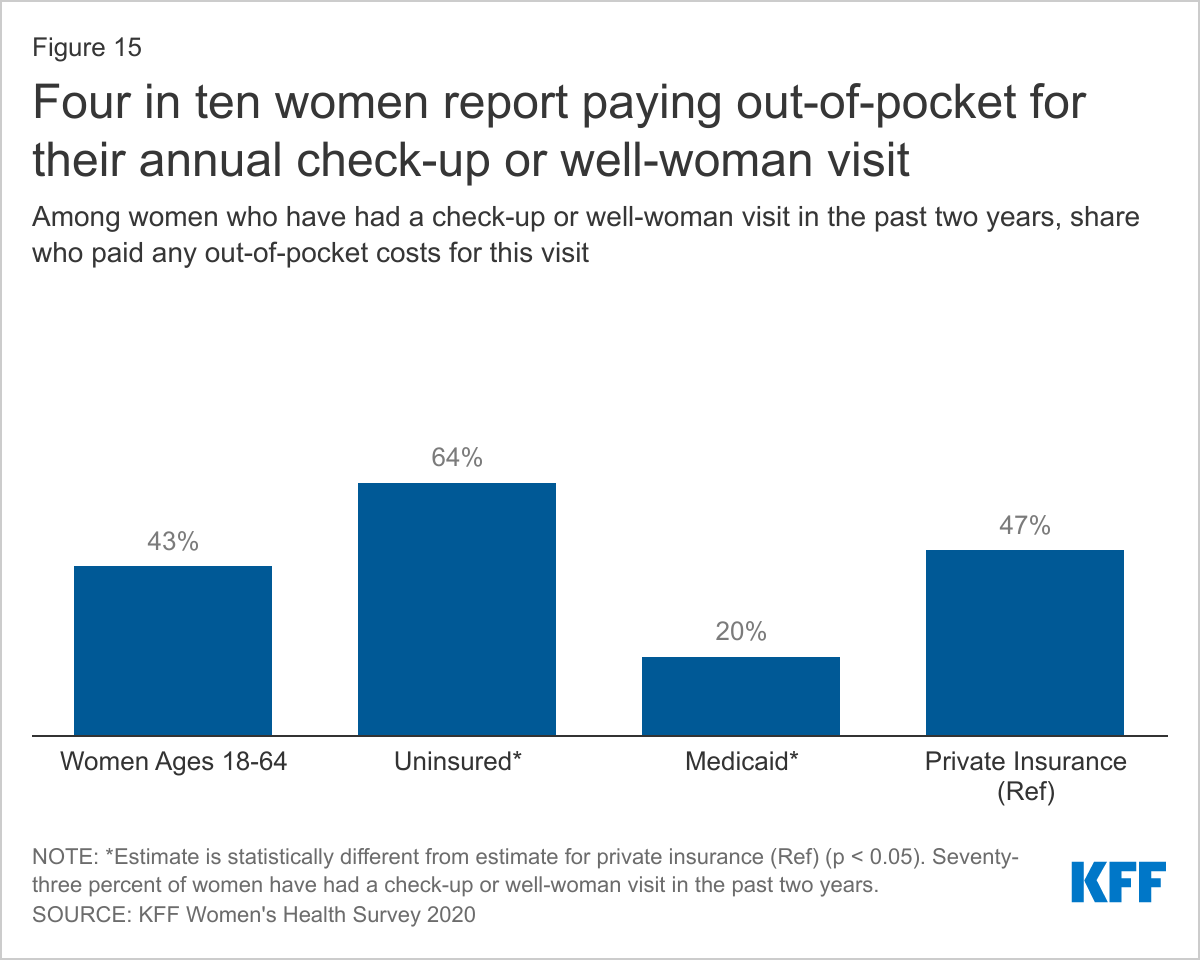
The ACA and most state Medicaid programs require plans to cover preventive health care without cost sharing (deductibles, coinsurance, and copayments). This includes an annual check-up or well-woman visit. Despite this requirement, many women still have at least some out-of-pocket expenses for their check-up or well-woman visit. Among women who have had a check-up or well-woman visit in the past two years, more than four in ten (43%) women report having to pay at least some out-of-pocket costs for their annual check-up or well-woman visit.
Nearly half (47%) of women with private insurance and one in five (20%) women with Medicaid had out-of-pocket spending for their check-ups or well-woman visits.
Among women with private insurance plans, most of which are prohibited from charging cost sharing for check-ups/well-woman visits and many preventive services, almost half (47%) report that they had out-of-pocket expenses for their check-up or well-woman visit (Figure 15). It is possible that some respondents may have mistaken another type of visit as a check-up or well-woman visit. There are several reasons why some women are still being exposed to cost sharing for these visits. While many preventive services are provided in the context of a check-up/well-woman visit, additional health services received during that visit, such as diagnostic tests or labs, may be subject to cost sharing. In addition, some women may be enrolled in a grandfathered health plan, which is not subject to the requirement to cover an annual check-up without cost sharing, though there are relatively few people still enrolled in one of these plans. Finally, the requirement to cover preventive care without cost sharing applies to care received in-network, so if a woman goes to an out-of-network provider for their check-up, they will likely be exposed to out-of-pocket costs.
While cost sharing is routine in the private insurance market, it is less common, though not prohibited, in the traditional Medicaid program. Women who are enrolled through the ACA’s Medicaid expansion option are entitled to no-cost preventive care. One in five women with Medicaid (20%), whether traditional or expansion, paid at least some out-of-pocket costs for their check-up. The requirement to cover an annual check-up is not applicable to those without health insurance. About two-thirds (64%) of uninsured women have incurred out-of-pocket costs for their visit. It should be noted that while this question asked about cost sharing for a check-up in the past two years, data on insurance coverage reflects coverage at the time the respondent completed the survey and may have changed during the prior two years.
Medical Bills
While the ACA has helped alleviate some of the financial barriers to accessing health care, many women, including those with insurance, still report problems paying medical bills. Some women incur significant medical expenses because of an unexpected diagnosis such as cancer, or an illness or injury that limits their ability to work and earn income to pay off bills. Costly medical bills can also arise after receiving care from an out-of-network provider, commonly referred to as surprise medical bills.
One in four women report having had problems paying medical bills in the past year, with higher rates among uninsured women and women in poorer health.
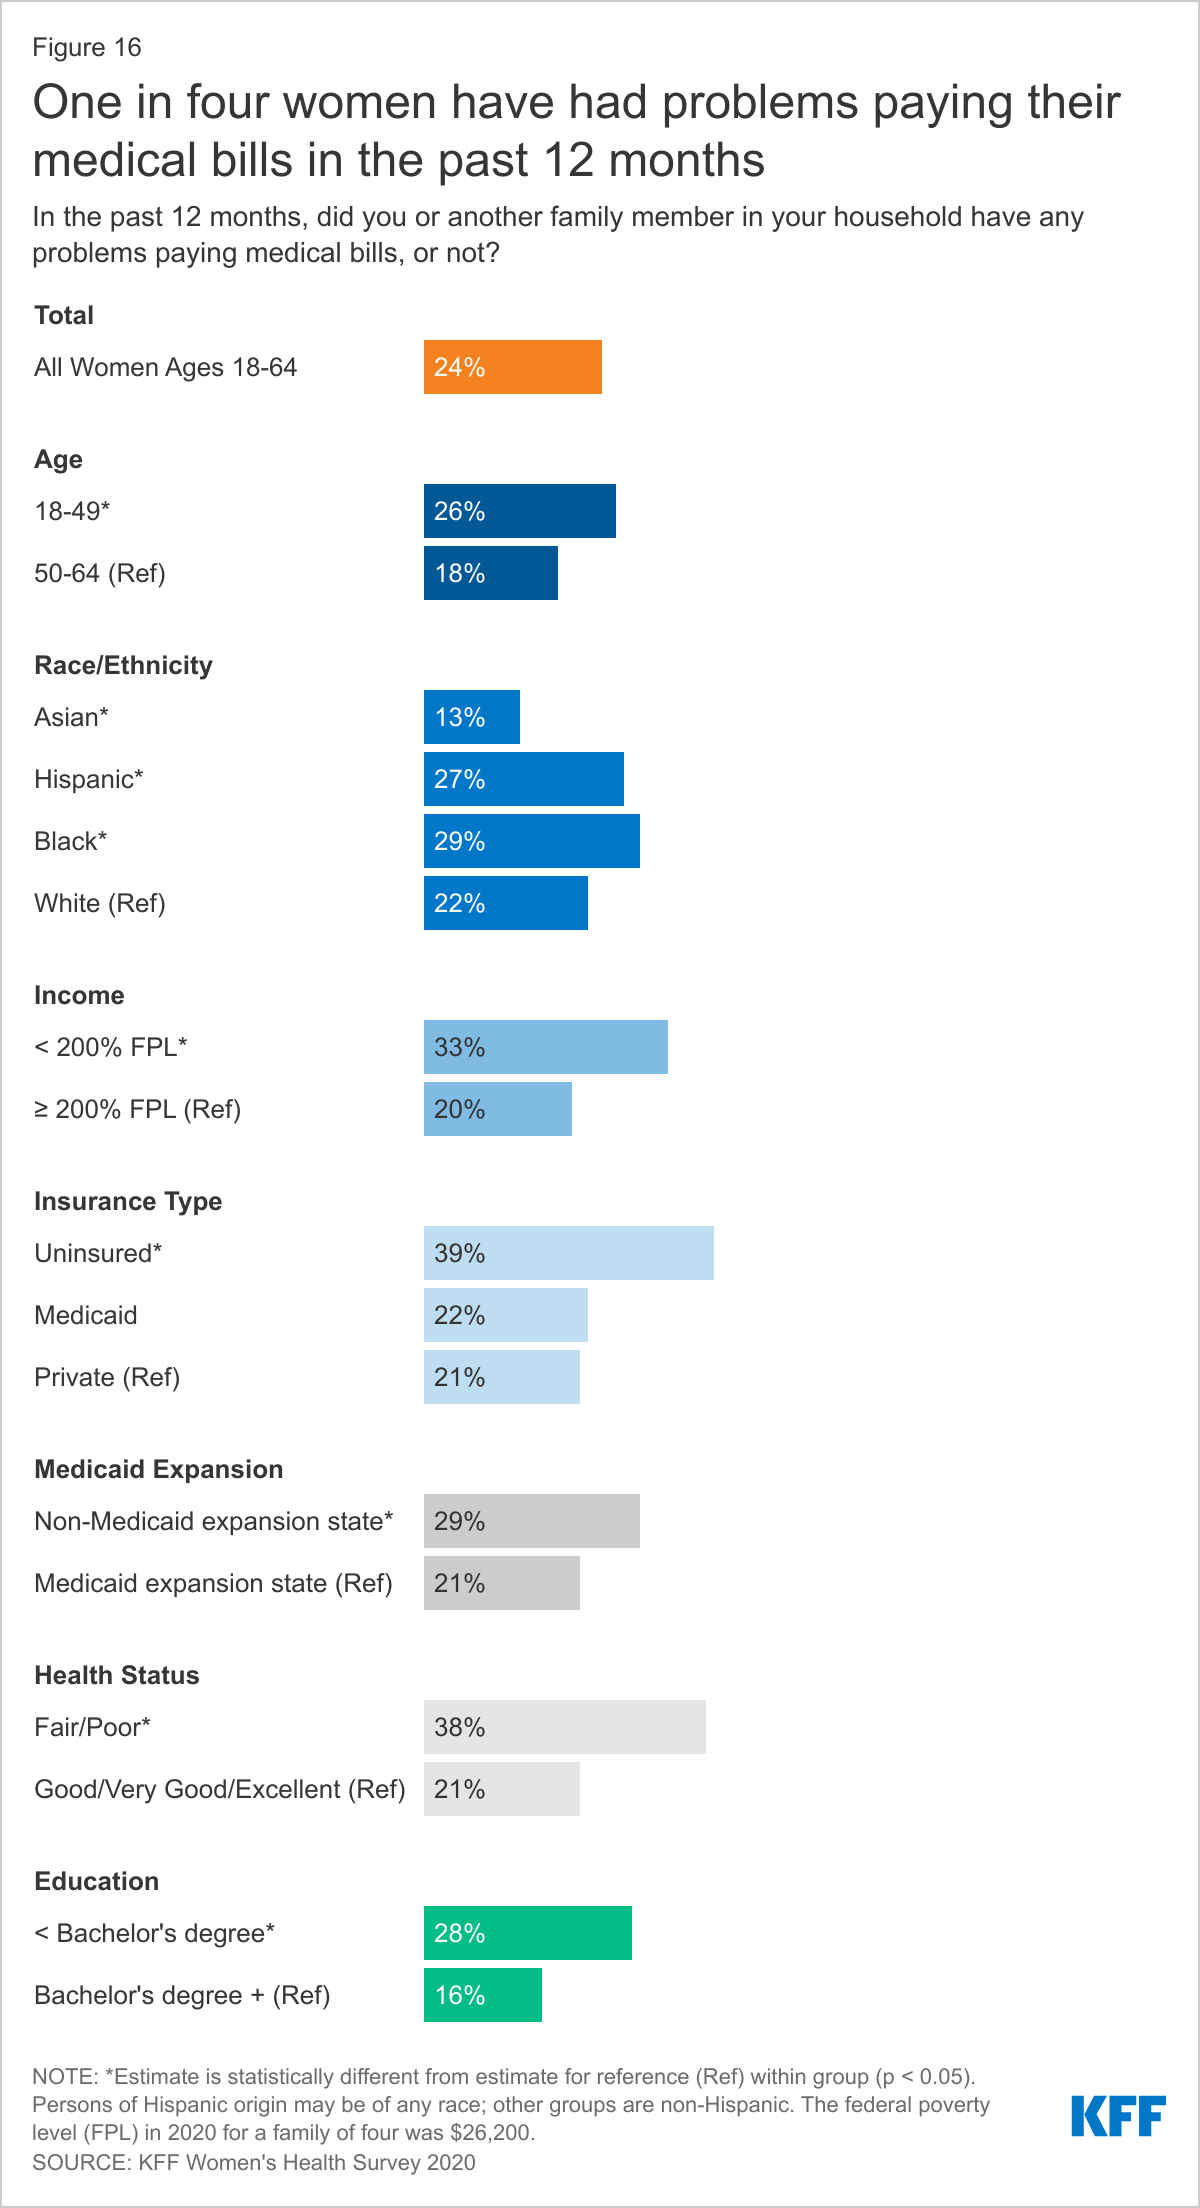
Twenty-four percent of women report that they or a household family member has had problems paying medical bills in the past year. Problems paying medical bills are more common among women than men (17%). While more women with children (27%) report problems paying medical bills than do women without children (22%), the share of men with children (19%) and men without children (16%) that have problems paying medical bills is statistically similar.
Outstanding medical bills are more common among uninsured and lower-income women and those in poorer health (Figure 16). This includes nearly four in ten uninsured women (39%) and women in poorer health (38%), and one-third of low-income women (33%). About three in ten Black women (29%), women who live in states that did not expand Medicaid (29%), and those without a college degree (28%) also report having trouble paying medical bills in the past year.
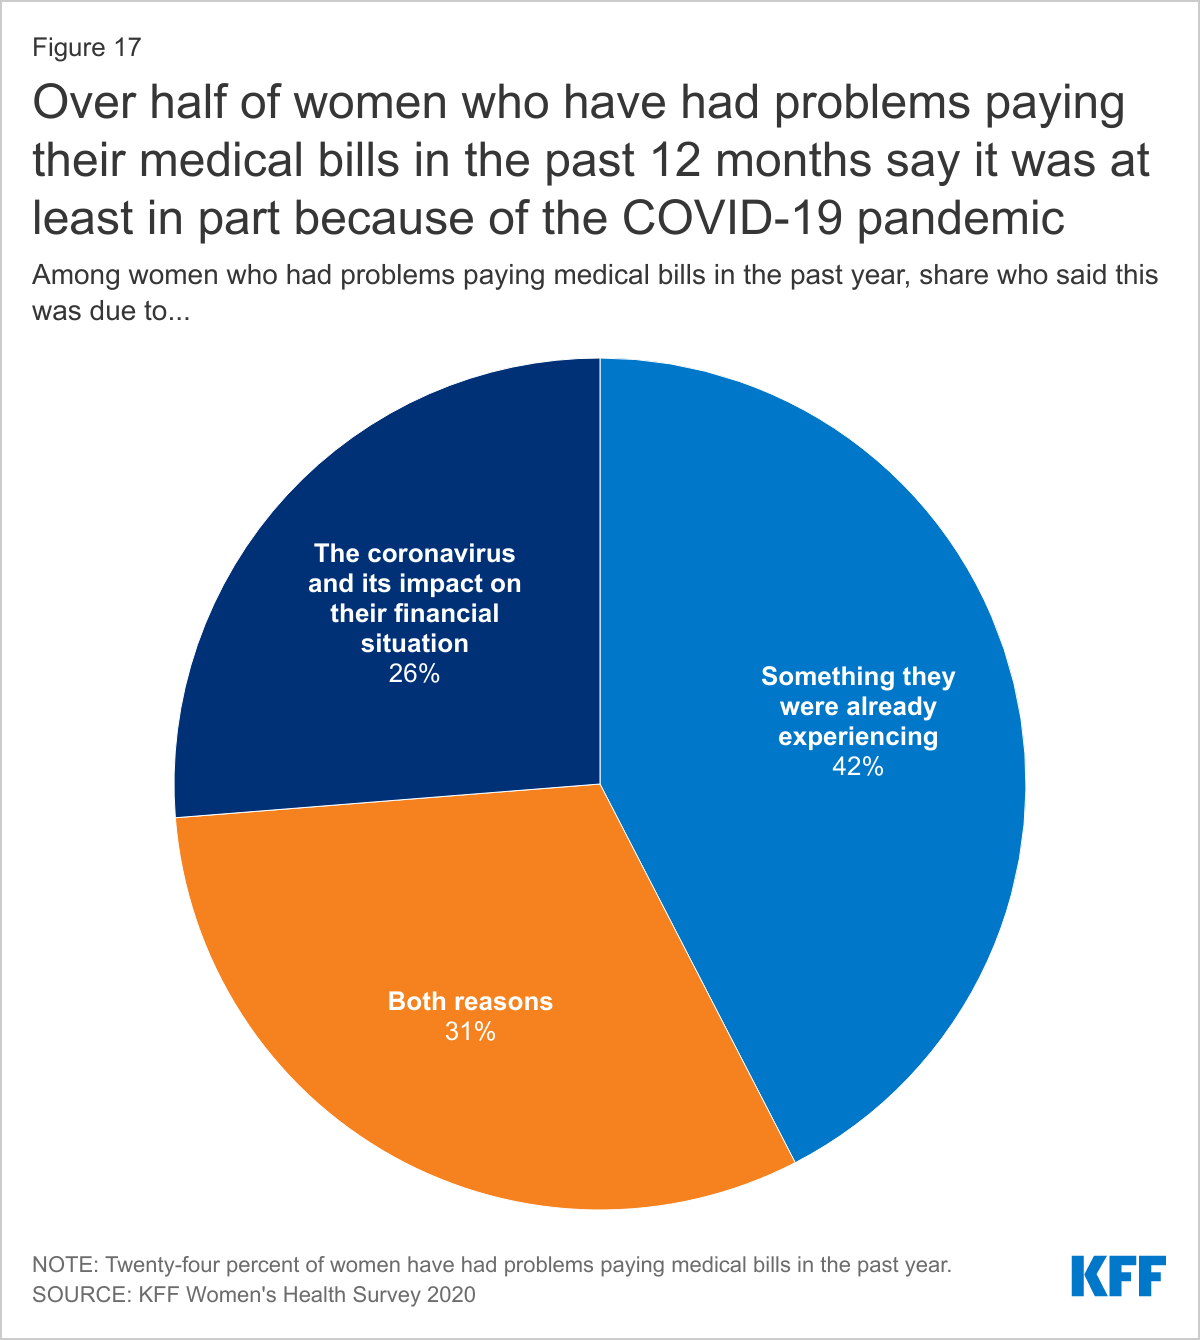
The financial turmoil many people have experienced because of the COVID-19 pandemic has compounded the challenges some women face in their ability to pay medical bills.
Among women who report having had problems paying medical bills in the past year, one-quarter (26%) say it was because of the coronavirus and its impact on their financial situation. This could be due to financial impacts from job loss or furlough, health-related consequences, or other reasons related to coronavirus. About four in ten (42%) women who have had problems paying medical bills in the past year say they were having problems paying medical bills before the pandemic and three in ten (31%) say it was a combination of both (Figure 17).
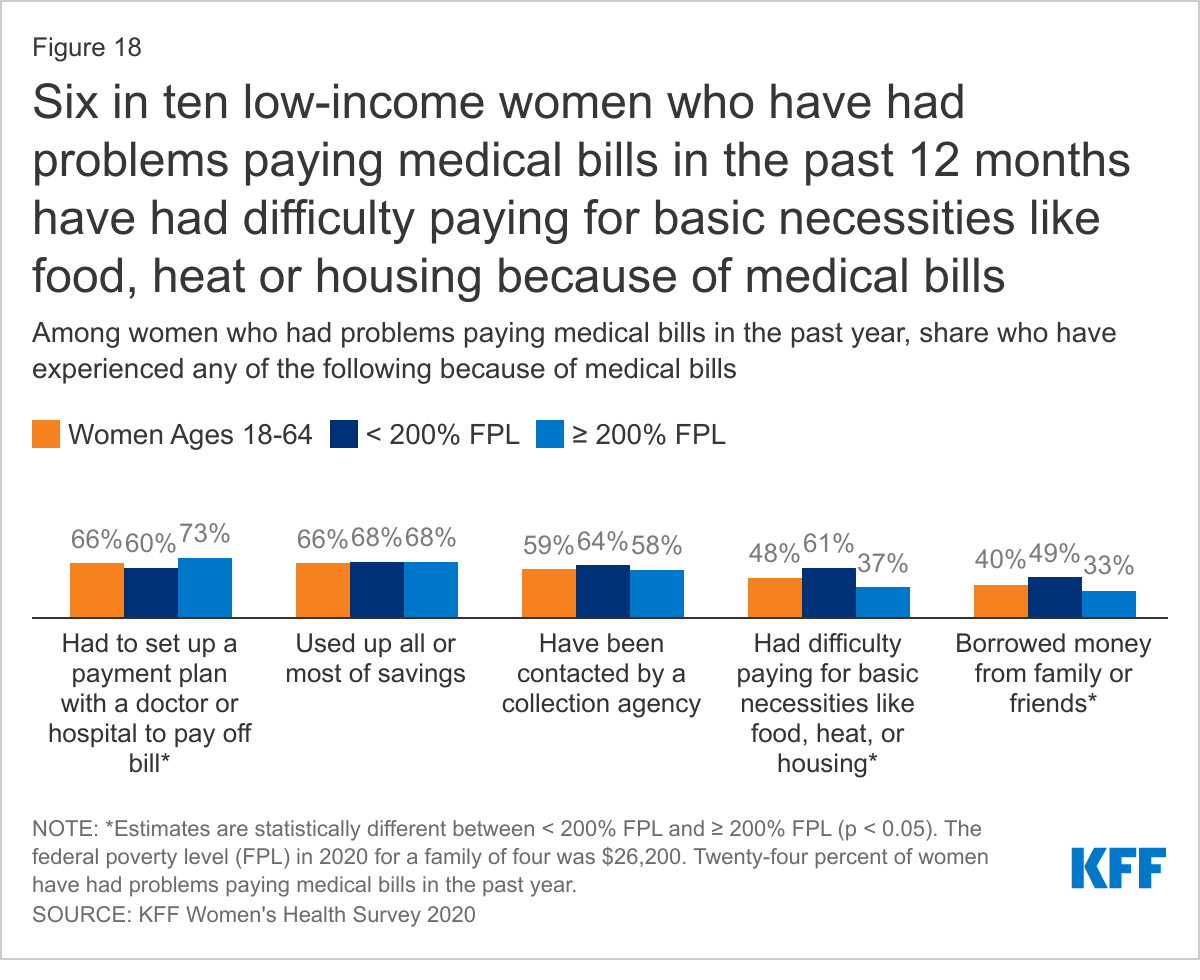
Medical bills can have serious consequences for women’s financial well-being and ability to afford basic necessities.
Among women who report trouble paying medical bills in the past year, two-thirds (66%) had to set up a payment plan with a doctor or hospital and/or used up all or most of their savings (Figure 18). About six in ten (59%) have been contacted by a collection agency, nearly half (48%) have had difficulty paying for basic necessities like food, heat, or housing, and four in ten (40%) borrowed money from family or friends. These shares are similar between women and men.
Low-income women who have had problems paying medical bills in the past year are more likely than higher-income women to report having had difficulty paying for basic necessities such as food, heat, or housing (61% vs. 37%), having been contacted by a collection agency (64% vs. 58%), or borrowing money from family or friends (49% vs. 33%). Higher-income women with problems paying medical bills in the past year are more likely than low-income women to have set up a payment plan with a doctor or hospital (73% vs. 60%).
Conclusion
Women’s access to and use of health care services has an impact on their health outcomes. Most women report having a regular source of care and having had a recent doctor’s visit. However, connections to the delivery system are more tenuous for low-income and uninsured women, who are less likely to report a recent visit or regular place of care. The ACA prioritized prevention by requiring insurance plans to cover routine check-ups and several screening tests without any out-of-pocket costs. Most women report they have had a general check-up or well-woman visit in the past two years, but similar to other measures, rates are lower among low-income and uninsured women. While a large share of women receive provider counseling on health issues like nutrition, exercise, and alcohol or drug use, a small share report that a provider has asked them about or discussed their mental health in the past two years.
Health insurance coverage helps link women to care and reduces patients’ financial risks when they need routine care, get sick, or need to be hospitalized. However, even women with insurance report having problems using their insurance, such as receiving health care they thought was covered but wasn’t and not being able to see the doctor of their choice because the doctor was out-of-network.
Health care costs continue to be a challenge for a significant share of the population, with many women reporting they have had to pay cost sharing for a preventive care visit or that they have had trouble paying medical bills. This is particularly true for low-income and uninsured women. For many women, the COVID-19 pandemic has added to their health-related financial burdens.
Finally, the importance of the social determinants on health outcomes has gained recognition in recent years but it seems few providers are discussing important factors such as food insecurity and transportation challenges with their patients. Gender bias and racial discrimination in the health care system can contribute to health disparities and poorer health outcomes. Women are more likely than men to report having experienced some type of health care bias, particularly those who are in poorer health, younger, or low-income.
The COVID-19 pandemic has further exposed many of the long-standing weaknesses in the health care system that have disproportionately impacted women, especially those who are low-income, women of color, or who are uninsured. For many women, the ACA helped strengthen access to coverage and protected them from many out-of-pocket costs. However, there is still much that can be done to make health care and coverage more affordable, expand equitable access to care, improve the quality and content of that care, and address the bias and discrimination that many women still experience when they seek care.