News Release

Although Their Share of the Market Varies By State, Enrollment in Medicare Advantage Plans Has More Than Doubled Over the Past Decade, with More than 4 in 10 Medicare Beneficiaries Now Enrolled in the Private Plans

Three KFF Analyses Examine the Latest Data and Trends in Medicare Advantage Enrollment, Premiums, Plan Benefits, Out-of-Pocket Limits, Cost Sharing, Star Ratings and Bonuses, and More

Published: Jun 21, 2021

The private plans known as Medicare Advantage now cover more than 4 in 10 Medicare beneficiaries, reflecting a more than doubling of enrollment over the past decade even as the plans remain a far larger presence in some states than others, according to a new KFF analysis.

More than 26 million of the nation’s nearly 63 million Medicare beneficiaries are enrolled in Medicare Advantage plans in 2021. The share varies considerably by state, ranging from less than 20 percent in Vermont, Maryland, Alaska, and Wyoming, to more than 50 percent in Minnesota, Florida, and Puerto Rico, the analysis finds.

Enrollment rates also vary widely across counties, within states. In Florida, for example, it ranges from 16 percent in Monroe County (Key West) to 73 percent in Miami-Dade County. Nationally, 29 percent of Medicare beneficiaries live in a county where more than half of all Medicare beneficiaries are enrolled in Medicare Advantage plans.

The new analysis is one of three released by KFF today that examine various aspects of Medicare Advantage, a type of Medicare coverage that the Congressional Budget Office has projected will cover 51 percent of all Medicare beneficiaries by 2030.

One brief provides current information about Medicare Advantage enrollment, including the types of plans in which Medicare beneficiaries are enrolled, and how enrollment varies across geographic areas. A second analysis describes Medicare Advantage premiums, out-of-pocket limits, cost sharing, extra benefits offered, and prior authorization requirements. A third compares Medicare Advantage plans’ star ratings and federal spending under the quality bonus program.

Among other key findings:

• Nine in ten Medicare Advantage enrollees are in plans that include prescription drug coverage and nearly two-thirds of these enrollees (65%) pay no premium other than the monthly Medicare Part B premium ($148.50 in 2021).

• Virtually all Medicare Advantage enrollees (99%) would pay less than the traditional Medicare Part A hospital deductible of $1,484 for an inpatient stay of three or fewer days. But for a six-day stay or longer, about half (53%) would incur higher costs than beneficiaries in traditional Medicare with no supplemental coverage.

• In 2021, the weighted average out-of-pocket limit for Medicare Advantage enrollees is $5,091 for in-network services and $9,208 for in-network and out-of-network services combined. For enrollees in HMOs, the average out-of-pocket (in-network) limit is $4,566.

• Most enrollees in individual Medicare Advantage plans have access to some benefits not covered by traditional Medicare, including eye exams and/or glasses (99%), telehealth services (94%), dental care (94%), a fitness benefit (93%) and hearing aids (93%). Other benefits are offered far less frequently, such as a meal benefit (55%), transportation (37%), and in-home support services (7%), and when they are offered, tend to be offered more frequently in special needs plans.

• More than 80 percent of Medicare Advantage enrollees in 2021 are in plans that receive bonus payments from Medicare based on quality star ratings, substantially higher than the share in 2015 (55%). Spending on bonus payments to Medicare Advantage plans totals $11.6 billion in 2021, almost four times the amount in 2015.

The full analyses are available online and include:

Medicare Advantage in 2021: Enrollment Update and Key Trends

• Medicare Advantage in 2021: Premiums, Cost Sharing, Out-of-Pocket Limits and Supplemental Benefits

Medicare Advantage in 2021: Star Ratings and Bonuses

For more data and analyses about Medicare Advantage, visit kff.org

Asian Immigrant Experiences with Racism, Immigration-Related Fears, and the COVID-19 Pandemic

Authors: Samantha Artiga, Latoya Hill, Bradley Corallo, and Jennifer Tolbert
Published: Jun 18, 2021

Summary

Asian immigrants have faced multiple challenges in the past year. There has been a rise in anti-Asian hate crimes, driven, in part, by inflammatory rhetoric related to the coronavirus pandemic, which has spurred the federal government to make a recent statement condemning and denouncing acts of racism, xenophobia, and intolerance against Asian American communities and to enact the COVID-19 Hate Crimes Act. At the same time, immigrants living in the U.S. have experienced a range of increased health and financial risks associated with COVID-19. These risks and barriers may have been compounded by immigration policy changes made by the Trump administration that increased fears among immigrant families and made some more reluctant to access programs and services, including health coverage and health care. Although the Biden administration has since reversed many of these policies, they may continue to have lingering effects among families.

Limited data are available to understand how immigrants have been affected by the pandemic, and there are particularly little data available to understand the experiences of Asian immigrants even though they are one of the fastest growing immigrant groups in the U.S. and are projected to become the nation’s largest immigrant group over the next 35 years. To help fill these gaps in information, this analysis provides insight into recent experiences with racism and discrimination, immigration-related fears, and impacts of the COVID-19 pandemic among Asian immigrant patients at four community health centers.

The findings are based on a KFF survey with a convenience sample of 1,086 Asian American patients at four community health centers. Respondents were largely low-income and 80% were born outside the United States. The survey was conducted between February 15 and April 12, 2021. Key findings include:

  • One in three (33%) respondents report that they have personally felt more discrimination based on their racial/ethnic background since the COVID-19 pandemic began in the U.S. Asian health center respondents report facing a range of negative experiences due to their racial or ethnic background over the past 12 months, including 14% who say they experienced a personal verbal or physical attack due to their race/ethnicity.
  • Many respondents have immigration-related fears, and most say they don’t have enough information about how recent immigration policy changes affect their family. Over four in ten (44%) Asian health center respondents say they worry a lot or some that they or a family member could be detained or deported. One quarter (25%) say they or a member of their household did not apply for or stopped participating in a government program to help pay for health care, food, or housing in the past year due to immigration-related fears. Over half (54%) say they do not have enough information about how recent changes to U.S. immigration policy might impact them or their family.
  • Asian health center respondents report negative health and financial impacts from the COVID-19 pandemic. Nearly half (48%) of respondents say the COVID-19 pandemic negatively affected their ability to pay for basic needs like housing, utilities, and food, and over half (54%) say someone in their household experienced job or income loss due to the pandemic. Over four in ten (43%) report negative effects on their mental health.
  • Nearly six in ten (58%) respondents say they have worried at some point that they have been exposed to coronavirus. Most (60%) of those who worried about being exposed say they have been tested for the virus. Among those who worried about exposure but say they have not been tested, the most frequently cited reasons for not getting tested were thinking they could isolate at home (31%) or not knowing where to get tested (26%). Some also say concerns about costs (13%), effects on ability to work (12%), and fears of negative impacts on their or a family member’s immigration status (10%) are reasons for not getting tested. The large majority of Asian health center patients who responded say they are willing to get a COVID-19 vaccine, with nearly two in three (64%) wanting to get it as soon as possible at the time the survey was fielded.

Approach

The findings in this report are based on responses from a convenience sample of Asian patients at four community health centers. KFF worked with the Association of Asian Pacific Community Health Organizations (AAPCHO) and community health center staff to develop and field the survey. Because the survey is based on a convenience sample, the findings are not generalizable to a broader population and cannot be benchmarked against other population-based surveys. Respondents are limited to four locations and may be lower income than Asian immigrants overall as they are patients of federally qualified health centers serving a predominantly low-income population. Further, as patients of a community health center, respondents are connected to a source of health care. Despite these limitations, the findings increase the knowledge base for understanding Asian immigrant experiences, which remains very limited. (See Methods for more details.)

The health centers that fielded the survey serve a predominantly Asian, low-income population that likely includes many immigrants. Four health centers fielded the survey: Asian Health Services in Alameda County, CA; North East Medical Services, in San Francisco, CA; HOPE Clinic in Houston, TX; and International Community Health Services (ICHS) in King County, WA. Overall, 79% of patients at these health centers identify as Asian; over 87% have income below 200% of the federal poverty level, including 54% who have income below poverty; and 12% are uninsured.1  Health centers do not collect information on patient immigration status, but nearly seven in ten patients at these health centers are best served in a language other than English.2 

Mirroring the patient populations served by the health centers, respondents include Asian American patients who are largely low-income and born outside the United States. Overall, a total of 1,086 survey respondents self-identify as Asian patients of one of the health centers. Among Asian patient respondents, over six in ten (62%) identify as Chinese and roughly one in five (18%) identify as Vietnamese, with the remaining respondents representing a broad range of ethnic backgrounds. Eight in ten (80%) report that they were born outside the U.S. The remaining share report they were U.S.-born; however, these respondents may have an immigrant family member living in their household as many express immigration-related concerns in their survey responses. Over seven in ten (72%) respondents report total annual family income below $40,000, and 15% report they were uninsured.

Respondents include a larger share of patients age 65 or older compared to the total patient population served by the health centers. Nearly four in ten respondents (39%) are age 65 or older compared to 20% among the total patient population of the health centers. The higher share of respondents age 65 or older reflects that the health centers fielded the survey during the time they began COVID-19 vaccination efforts, which were initially focused on people in this age group.

Over half of respondents (57%) are patients at either of the two California-based health centers, while about a third (32%) are patients with ICHS in Washington state, and 11% are patients at HOPE clinic in Texas. California health center respondents are more likely than other health center respondents to be under age 65 (69% vs. 51%) and less likely to have lower household income (<$40,000 per year) (65% vs. 80%). They also are more likely to be Chinese (71% vs. 49%) and less likely to be Vietnamese (13% vs. 24%).

Given that the respondents are older than the overall patient population for these health centers, we examine findings by age to identify key differences in experiences of adults ages 18-64 and those ages 65 and older. In addition to comparing findings by age group, we also examine differences between California health center respondents vs. other health center respondents. The data allowed for comparisons between California health center respondents and other health center respondents, but the ability to make comparisons for Washington and Texas, specifically, was limited due to sample size restrictions. In addition, we highlight differences by gender and parental status (i.e., whether respondents are parents or guardians of children under age 18 living in their household). We also identify differences between Chinese and Vietnamese respondents; comparisons for other ethnicities were not possible due to sample size restrictions. All differences mentioned in the brief are significant at the .05 level.

Findings

Experiences with Racism and Discrimination

One in three (33%) Asian health center respondents say they have personally felt more discrimination based on their racial/ethnic background since the COVID-19 pandemic began in the U.S (Figure 1). Roughly three in ten indicate that they have not felt any discrimination (28%) or that they have felt about the same level of discrimination (28%), while less than one in ten (9%) report less discrimination.

Figure 1: 1 in 3 Asian Health Center Respondents Have Felt More Discrimination Since the Coronavirus Pandemic Began

The share reporting more discrimination since the pandemic began is somewhat higher among parents (37%) than those without children in the home (30%) and among adults under age 65 (35%) compared to adults over age 65 (28%). Chinese respondents are more likely than Vietnamese respondents to say that they have felt about the same level of discrimination since the start of the pandemic (30% vs. 19%) but less likely to say they have felt no discrimination (28% vs. 36%). Those who are 65 or older are more likely than those under age 65 to say that the amount of discrimination they feel has not changed, while those under age 65 are more likely to say they have not felt any discrimination since the pandemic began. California health center respondents are more likely to report both more and less discrimination since the start of the pandemic compared to those in other locations (Texas and Washington), while those in other locations are more likely to say they have felt the same level of discrimination.

Asian health center respondents say they have faced a range of negative experiences due to their racial or ethnic background over the past 12 months, including verbal and physical attacks. Over one in three (35%) report receiving poorer service than other people due to their racial or ethnic background at a store or other public place, one in five (20%) say they have been being denied a job for which they were qualified, and 18% report being denied housing they could afford. Others report more personal attacks based on their race/ethnicity, including 16% who say they were criticized for speaking a language other than English in public, 15% who say they have been accused of “spreading or causing COVID-19” or were told that they should go back to their home country, and 14% who say they were verbally or physically attacked (Figure 2).

Figure 2: Asian Health Center Respondents Report A Range of Recent Negative Experiences Due to Their Race or Ethnicity

Those who are age 65 or older are more likely to say they have received poorer service (44% vs. 30%) or been denied housing (30% vs. 11%) or a job (27% vs. 16%) based on their race/ethnicity compared to younger respondents, and men are more likely than women to report receiving poorer service (41% vs. 32%) and being denied housing (22% vs. 15%) (Figure 3). Similarly, respondents without children in the home were more likely than parents to report housing discrimination (21% vs. 13%). California health center respondents were less likely to say they experienced discrimination in housing (11% vs. 27%) or jobs (18% vs. 23%) compared to those of other health center locations (Washington and Texas).

CHART-TITLE

Over four in ten (42%) Asian health center respondents say they have been criticized for wearing a mask since the pandemic began in the U.S., while 13% say they have been criticized for not wearing a mask. There are some variations in experiences among respondents. For example, higher shares of those age 65 and older say they have been criticized for wearing a mask compared to those who are younger (57% vs. 32%) and men are more likely to say they have been criticized for mask wearing than women (47% vs. 38%). Respondents without children in the home also are more likely than parents to report being criticized for wearing a mask (48% vs. 29%). There are also variations in experiences by location, with California health center respondents less likely than those in other locations to report being criticized for wearing a mask (30% vs. 57%) and more likely to say they have been criticized for not wearing one (16% vs. 7%).

Over four in ten (44%) Asian health center respondents say they worry a lot or some that they or a family member could be detained or deported (Figure 4). Worries are higher among those age 65 or older, men, and those without children in the home, compared to those who are under age 65, women, and parents. Among parents, three in ten (30%) say their children have worries or fears that they or a family member might be detained or deported. Although there is no significant difference in their own levels of worry about detention or deportation by location, parents who are California health center respondents are more likely to say their children are concerned about a family member being detained or deported than parents in other locations (39% vs. 12%).

Figure 4: Over 4 in 10 Asian Health Center Respondents Say They Worry a Lot or Some About Detention or Deportation

One quarter (25%) of respondents say they or a member of their household decided not to apply for or stopped participating in a government program to help pay for health care, food, or housing in the past year due to immigration-related fears (Figure 5). Overall, nearly one in five (17%) say they did not apply for or stopped participating in a program that helps with housing, 12% for a program that helps with food, and 10% for a program that helps pay for health care. The shares who say they did not apply for or stopped participating in a program are higher among parents (32%) and respondents at California health centers (35%). However, parents also are more likely than those without children in the home to say they have received any type of government assistance to pay for things like housing, food, or health insurance in the past year (53% vs. 34%), as are California health center respondents compared to those in other locations (48% vs. 29%).

Figure 5: 1 in 4 Asian Health Center Respondents Say They Avoided a Program in the Past Year Due to Immigration Fears

Over half of (54%) respondents say they do not have enough information about how recent changes to U.S. immigration policy might impact them or their family (Figure 6). Chinese respondents are more likely than Vietnamese respondents to say they do not have enough information (59% vs. 41%).

Figure 6: Over Half of Asian Health Center Respondents Lack Enough Information on Recent Immigration Policy Changes

Asian health center respondents report relying on a variety of sources for information on immigration policy. The most frequently cited sources that they relied on very or somewhat often were television and radio in their native language (59%) followed closely by friends and families (56%) and social media (56%). Over half (51%) report relying on newspapers in their native language, and nearly half said they rely on English television and radio (44%) or English newspapers (40%) very or somewhat often. About four in ten report turning to nonprofit organizations (36%) or the government (34%) for this information, while over one in three said they rely on religious organizations (34%) or an attorney (32%).

In general, respondents age 65 or older are more likely to report using all sources of information very or somewhat often compared to their younger counterparts, except for social media or close family or friends. In addition, those without children in the home and men are more likely to report frequent use of certain information sources than parents and women, particularly English language television, radio, and newspapers. California health center respondents are less likely than those of other health centers to report frequent use of certain sources of information, including English language television and radio (16% vs. 35%), English language newspapers (10% vs. 27%), native language television or radio (21% vs. 30%), a nonprofit organization (6% vs. 13%), a religious organization or church (7% vs. 13%), government sources (5% vs. 20%), or an immigration attorney (5% vs. 25%).

Impacts of the COVID-19 Pandemic

Over half (54%) of Asian health center respondents say they or another adult in their household lost their job or had their income or hours reduced due to the pandemic (Figure 7). This share rises to 75% for those who are parents and nearly seven in ten among those under age 65 (69%) and who are California health center respondents (67%).

Figure 7: Over Half of Asian Health Center Respondents Say Someone in Their Household Lost a Job or Income

Respondents also report negative impacts on their ability to pay for basic needs, their mental health, and their children’s education and care (Figure 8). Nearly half (48%) say that the COVID-19 pandemic negatively affected their ability to pay for basic needs like housing, utilities, and food, four in ten (40%) report that it negatively affected their ability to do their job, and 43% say it has negatively impacted their mental health. The share reporting negative impacts on ability to pay for basic needs rises to over half among parents (53%) and men (53%). Vietnamese respondents are more likely than Chinese respondents to report negative impacts on their ability to pay for basic needs (61% vs. 44%) and their ability to do their job (51% vs. 37%), while Chinese respondents are more likely to report positive effects in these areas as well as on their mental health (30% vs. 20%).

Figure 8: The Pandemic Has Negatively Affected Asian Health Center Respondents’ Finances, Mental Health, and Children’s Education and Care

Over half of parents (52%) say the pandemic has negatively affected their children’s education and 41% say it has had negative impacts on their ability to care for their children. In contrast, three in ten say the pandemic has positively impacted their children’s education (30%) and their ability to care for their children (30%). California health center respondents are more likely than those of other health centers to report positive impacts on their children’s education (35% vs. 17%) and care (35% vs. 19%), while other health center respondents are more likely than California health center respondents to report no impact on education (26% vs. 11%) or care (39% vs. 20%).

Many respondents say worry and stress related to the pandemic has affected their behavior and health in certain ways. Nearly half (48%) say it has affected their sleep and 39% report changes in their appetite and eating (Figure 9). Others say it has led to frequent headaches or stomachaches (24%), increased difficulty controlling temper (15%), increased alcohol or drug use (10%), and worsened chronic conditions, like diabetes or high blood pressure (9%). Adults under age 65 are more likely than those age 65 and older to report some of these effects, including frequent headaches or stomachaches, difficulty controlling temper, and increased alcohol and drug use. There were also some differences by location, with California health center respondents more likely to report these same effects, which may also reflect that they are more likely to be under age 65.

Figure 9: Worry or Stress Due to the Pandemic has Affected Asian Health Center Respondents’ Behavior and Health

Three in ten (30%) Asian health center respondents say they put off or went without health care in the past 12 months and 37% of parents report doing so for their children. Among those who put off or went without health care for themselves, 42% say they did not seek health care because of concerns about exposure to coronavirus. Other factors include not being able to take time off work (45%) and not being able to afford the cost (31%), despite being patients of a community health center that provides free or low-cost care. Less than one in ten (6%) say they went without care because they were concerned it would negatively affect their or a family member’s immigration status. Adults under age 65 are more likely to say they put off or went without care than those age 65 and older (35% vs. 23%), and a higher share of parents say they went without care than those without children in the home (39% vs. 26%). Parents are more likely than those without children in the home to say they went without care because they couldn’t take time off work or due to difficulty getting to an office or clinic and less likely to cite concerns about exposure to coronavirus as a reason. California health center respondents are more likely than those at other centers to report putting off or going without health care for themselves (42% vs. 15%) and their children (44% vs. 20%). These differences may reflect demographic differences—California health center respondents are more likely to be under age 65 and parents—as well as differences in social distancing policies across locations.

COVID-19 Exposure, Testing, and Vaccines

Nearly six in ten (58%) Asian health center respondents say they have worried at some point about being exposed to coronavirus (Figure 10). Overall, less than half (46%) say they have ever been tested for coronavirus, but the share rises to 60% among those who say they have ever worried about exposure. Among those who worried they might have been exposed but were not tested, the main reasons they give for not getting tested are thinking they could isolate at home (31%) or not knowing where to go to get tested (26%). Some also report concerns about costs (13%) and being told by a health professional they did not need to get tested (13%). About one in ten say they had concerns about effects on their ability to work (12%) or fears of negative effects on their or a family member’s immigration status (10%), even though the federal government has clarified that getting tested will not negatively affect immigration status.  

Figure 10: Most Asian Health Center Respondents Say They Have Worried About Ever Being Exposed to Coronavirus

Concerns about ever being exposed to coronavirus are higher among adults under age 65, parents, and California health center respondents (Figure 11). Reflecting these increased worries, these groups are also more likely to report having received a COVID-19 test, overall. There are no notable differences by age or parental status in the share who say they have received a test among those who ever worried about exposure. However, among those who say they have ever worried about exposure, California health center respondents are more likely to report being tested than those of other health centers (66% vs. 49%).

Figure 11: Concerns About Coronavirus Exposure are Higher Among Asian Health Center Respondents Who are Nonelderly Adults, Parents, and in California

At the time of the survey, nearly two-thirds (64%) of respondents said they wanted to get the COVID-19 vaccine as soon as they can. About a quarter (23%) indicated they want to wait to see how it works for other people. Only 11% said they will only get the vaccine if required or definitely will not get it. Concerns about side effects, believing that the vaccine development process was rushed, and not believing they are at risk for getting seriously ill from the virus are the main reasons why people say they are not ready to be vaccinated. Broader data show that vaccine attitudes have shifted over the course of the vaccine rollout, with willingness to get a vaccine increasing across a number of groups.

Conclusion

While these findings are not representative of Asian immigrants or Asian health center patients overall, they provide new insight into and understanding of the experiences of Asian health center patients who are largely immigrants, a group for whom there remain very little data. The findings illustrate the ways Asian immigrants experience racism and discrimination in their daily lives and indicate that these experiences have increased amid the COVID-19 pandemic. They also suggest that immigration-related fears are ongoing among the community and contributing to reluctance accessing government assistance programs for food, housing, and health care. The findings further show the that the pandemic has taken a toll on mental health and well-being, finances, and access to health care for Asian immigrant families. This increased understanding can help inform COVID-19 response efforts as well as efforts to address health disparities more broadly. Going forward, continued efforts to assess and understand the experiences of smaller population groups, including Asian immigrants, remain important as they are often invisible in public data sources.

Methods

This analysis is based on a KFF survey of Asian patients at four community health centers: Asian Health Services in Alameda County, CA; North East Medical Services, in San Francisco, CA; HOPE Clinic in Houston, TX; and International Community Health Services (ICHS) in King County, WA. In 2019, these four health centers served a total of 154,604 patients, 117,617 of whom identified as non-Hispanic Asian, or 79% of patients with known race/ethnicity. Health centers do not collect information on patient immigration status, but nearly seven in ten patients at these health centers are best served in a language other than English.3  The survey instrument was designed by researchers at KFF in collaboration with staff at the Association of Asian Pacific Community Health Organizations and the community health centers who participated in the survey. Community health center staff translated the survey into Chinese (traditional), Vietnamese, Korean, and Burmese. Reflecting their patient demographics, Asian Health Services, North East Medical Services, and ICHS fielded the survey in English, Chinese, Vietnamese, and Korean, while HOPE Clinic fielded the survey in English, Chinese, Vietnamese, and Burmese.

The survey was conducted between February 15 and April 12, 2021 by health center staff. Over a third (34%) of respondents completed the survey in-person with clinic staff, 32% completed a paper version of the survey, 25% completed the survey online, and 7% completed the survey via phone. There were a total of 1,467 survey respondents. The analysis presented above was limited to 1,086 respondents who self-identified as Asian and indicated that they were a patient of one of the four health centers in their survey responses. Of those included in the analysis, 874 indicated that they were born outside the United States or Puerto Rico and 176 were born in the U.S. or Puerto Rico; 36 respondents did not answer the survey question on nativity.

This work was supported, in part, by the Blue Shield of California Foundation. We value our funders. KFF maintains full editorial control over all of its policy analysis, polling, and journalism activities. The authors thank the Association of Asian Pacific Community Health Organizations (AAPCHO) and community health center staff for their assistance developing and fielding the survey.

Endnotes

  1. KFF analysis of the 2019 Uniform Data System, Health Resources and Services Administration. ↩︎
  2. Ibid. ↩︎
  3. Ibid. ↩︎
News Release

Survey and Event Examine Experiences and Concerns of Asian Immigrants During COVID-19 Pandemic and Amid Rising Incidents of Anti-Asian Hate Crimes

Published: Jun 18, 2021

A KFF survey of Asian patients at four community health centers serving a predominantly Asian, low-income population finds a third (33%) of them have felt more discrimination based on their race/ethnicity since the COVID-19 pandemic began. Respondents, 80% of whom were born outside the U.S., reported a range of negative experiences including receiving poorer service in public settings, being denied employment and/or housing, and being verbally or physically attacked.

Asian Immigrant Experiences with Racism, Immigration-related Fears, and the COVID-19 Pandemic was released today at a briefing discussing the diversity of the Asian American population and how the pandemic and rising anti-Asian hate crimes have exacerbated existing challenges in health care access, especially mental health. Innovative care models and the impact of immigration policy were also topics. Congresswoman Judy Chu provided opening remarks which was followed by highlights from the survey and a panel discussion with the representatives from the Association of Asian Pacific Community Health Organizations and community health centers serving the Asian American community.

Over half (54%) of the 1,086 Asian health center respondents, a convenience sample drawn from locations in California, Texas, and Washington, say they don’t have enough information about recent immigration policy changes to understand how they impact their family. Four in ten report worrying some or a lot about they or a family member being detained or deported and a quarter say they or a member of their household stopped participating in or didn’t apply for government assistance with health care, housing or food in the past year due to immigration-related fears, despite many facing increased needs due to the pandemic.

Almost six in ten (58%) Asian health center respondents say they have worried at some point about being exposed to coronavirus, and over half say someone in their household lost a job or income since the pandemic began. The fear of exposure to coronavirus was one of several factors cited for the 30% of respondents who said they put off or went without health care in the past year.

The complete findings and methodology of the survey fielded from February to April of 2021 are available on kff.org.

State actions in response to the COVID-19 crisis have highlighted their divergent approaches to abortion access. Some states classified abortion as a non-essential service, effectively banning services, while others have clarified that abortion is an essential service. In a handful of states, some clinics have begun to offer medication abortions using telemedicine. This approach maintains access to abortion while social distancing, preserving personal protective equipment (PPE), and limiting in-person health care visits and risk of exposure. (more…)

Medication Abortion and Telemedicine: Innovations and Barriers During the COVID-19 Emergency

Authors: Amrutha Ramaswamy, Gabriela Weigel, Laurie Sobel, and Alina Salganicoff
Published: Jun 16, 2021

UPDATE

On April 12th, 2021, the FDA’s Center for Drug Evaluation and Research (CDER) notified ACOG that they will exercise enforcement discretion during the ongoing public health emergency with respect to in-person dispensing requirements of mifepristone based on a safety reviewEffectively, this will allow providers in states that do not have laws that would otherwise ban this practice to dispense mifepristone using the telehealth protocol for medication abortion. On May 7th, 2021, in response to the ACLU lawsuit, the FDA announced in a court filing that a review of the REMS is currently underway. 

State actions in response to the COVID-19 crisis have highlighted their divergent approaches to abortion access. Some states classified abortion as a non-essential service, effectively banning services, while others have clarified that abortion is an essential service. In a handful of states, some clinics have begun to offer medication abortions using telemedicine. This approach maintains access to abortion while social distancing, preserving personal protective equipment (PPE), and limiting in-person health care visits and risk of exposure. (more…)

How Do CMS’s New COVID-19 Vaccine Reporting and Education Rules Apply To Different Long-Term Care Settings?

Authors: Priya Chidambaram and MaryBeth Musumeci
Published: Jun 16, 2021

The COVID-19 pandemic has resulted in substantial cases and deaths among long-term care facility (LTCF) residents and staff, though these numbers dropped precipitously after vaccine rollout began. As of May 17th, 2021, the US has reported over 184,000 COVID-19 deaths among LTCF residents and staff, accounting for nearly one-third of all COVID-19 deaths in the US. These data do not reflect the full extent of COVID-19’s impact on LTCFs beyond nursing homes, however, as data gaps for settings serving nonelderly people with disabilities are an ongoing challenge. Settings for which data are incomplete include certain institutions, such as intermediate care facilities for people with intellectual or developmental disabilities (ICF/IIDs) and inpatient behavioral health settings, and congregate community-based settings, such as group homes, personal care homes, assisted living facilities (ALFs), and adult day programs.  

In addition to incomplete data, COVID-19 vaccine access and distribution efforts have varied across LTCF setting types. While the CDC’s Pharmacy Partnership for Long-Term Care facilitated the initial vaccination of residents and staff at most nursing homes and ALFs, other LTCF types were ineligible for the Partnership. Moreover, now that the Partnership has ended, CMS estimates that the number of new residents and staff entering nursing homes and ALFs over the next year is expected to exceed the number of those that were offered a vaccine through the Partnership.

Recognizing that ongoing vaccination efforts are crucial to ending the pandemic, CMS issued an Interim Final Rule with Comment Period (IFC) that establishes new vaccine reporting and/or education requirements for nursing homes and ICF/IIDs as of May 21st, 2021. Public comments are due July 12, 2021, after which CMS may revise the rule. CMS also seeks public comment about whether similar requirements should apply to inpatient behavioral health settings and community-based congregate settings. This issue brief explains the new requirements and identifies where gaps remain across different LTCF settings (Figure 1). The Appendix provides detail about the various types of LTCFs.

Figure 1: Which Long-Term Care Settings are Subject to New COVID Vaccine Reporting and Education Rules?

What are the new reporting requirements for LTCFs?

Under the new interim final rule, nursing homes must report weekly on the COVID-19 vaccination status of all residents and staff as well as COVID-19 therapeutic treatment administered to residents. These requirements apply to both Medicare skilled nursing facilities (SNFs) and Medicaid nursing facilities (NFs). The new vaccine data elements must be reported to the CDC’s National Healthcare Safety Network (NHSN) and include the total numbers of residents and staff, numbers of residents and staff vaccinated, numbers of each dose of COVID-19 vaccine received, and COVID-19 vaccination adverse events. As with other Medicare and Medicaid conditions of participation, nursing homes that fail to follow the new reporting requirements may have to pay a civil monetary penalty.

The new interim final rule does not mandate COVID-19 vaccination or treatment reporting for other LTCF types. CMS concluded that requiring ICF/IIDs to participate in mandatory vaccine reporting would create an administrative burden, as very few (only about 80 out of over 5,700) currently participate in the NHSN or another formal reporting program, and requiring participation could involve new equipment, staff, and training. CMS also notes that ICF/IIDs do not appear to be administering COVID-19 therapeutics at this time. The new reporting requirements also do not apply to other LTCFs, such as inpatient behavioral health settings or congregate community-based settings. For all of these settings, CMS encourages voluntary reporting as facilities are able to do so and seeks comment on reporting barriers and ways to encourage voluntary reporting. Another rule that requires CDC reporting on COVID-19 cases and deaths applies only to nursing homes and not to other LTCF types.

What are the new vaccine education and offering requirements for LTCFs?

The new interim final rule’s requirements to educate residents/clients and staff about the COVID-19 vaccine and offer the vaccine when available apply more broadly, to both nursing homes and ICF/IIDs. CMS notes that these new requirements build on existing regulations that govern influenza and pneumonia immunizations for nursing homes and preventive care including immunizations for ICF/IIDs. In the preamble, CMS clarifies that staff who must be educated about and offered the vaccine include those who work in the facility at least once a week. Facilities must maintain documentation on their vaccine education efforts, administration of multi-dose vaccines, and efforts to appropriately acquire subsequent doses as necessary for all residents/clients and staff. As with other Medicare/Medicaid conditions of participation, facilities may be subject to civil money penalties if they fail to comply with the new requirements.

Under the new rule, nursing home and ICF/IID vaccine education efforts must include the benefits, risks, and potential side effects of the vaccine and the most current information regarding additional doses. In the preamble, CMS notes that facilities may choose to include other staff education topics, such as further information on the development of the vaccine, how the vaccine works, particulars of the multiple doses, and the low likelihood of potential side effects. The preamble also states that residents/clients and their representatives should be told that they are able to receive the vaccine without copays or out-of-pocket costs. Finally, CMS reminds facilities that educational materials should be made available in accessible formats, such as large print, Braille, American Sign Language, closed captioning, audio descriptions, and plain language.

The new rule requires nursing homes and ICF/IIDs to offer the COVID-19 vaccine to all residents/clients and staff unless immunization is medically contraindicated or they have already been immunized. The rule specifies that residents/clients and staff may refuse the vaccine and may change their decision at any time. Recognizing that decisions about whether to receive the vaccine may change over time, the preamble notes that if an individual requests a vaccine but missed earlier opportunities for any reason, facilities should try to acquire a vaccination opportunity for that individual “as quickly as practicable.” In the preamble, CMS clarifies that facilities may provide the vaccine directly or arrange for vaccination through another provider, such as a pharmacy or health department.  

How are other congregate care settings addressed?

CMS is not requiring other LTCFs, such as inpatient behavioral health settings and congregate community-based settings, to report on COVID-19 vaccination, provide education, or offer the vaccine to residents and staff at this time. CMS notes that individuals in psychiatric facilities may only be inpatients for short periods, making a two-dose vaccine series challenging to administer, and CMS currently is unable to guarantee availability of the single-dose vaccine for these facilities. To facilitate vaccination for residents/clients and staff of congregate community-based settings, such as ALFs, group homes, and adult day centers, CMS encourages collaboration between these settings and state Medicaid agencies and state and local health departments to learn about vaccine distribution options.

CMS seeks public comment on the feasibility of extending COVID–19 vaccine reporting, education, and offering requirements to other congregate LTCFs. Specifically, CMS seeks public comment on:

  • Potential barriers that other LTCFs may face in meeting new requirements, such as staffing, resident/client population characteristics, and potential unintended consequences;
  • Any existing state or local licensing or certification requirements or facility policies related to vaccines for congregate community-based settings and any benefits or challenges from policy implementation;
  • Who should be responsible for vaccine access for residents and staff who participate in multiple settings (such as both residential and day programs);
  • How to ensure equitable vaccine access in congregate community-based settings and identify access barriers for staff;
  • Available data on admission rates, average length of stay, comorbidities that may increase residents/clients’ risk of severe illness from COVID-19, and rates of employee turnover and employee sharing across congregate living settings.

Looking Forward

The new COVID-19 vaccine reporting, education, and offering requirements establish some standards and oversight for ongoing vaccination efforts in nursing homes, as the CDC Partnership has ended but the pandemic continues. Still, as CMS recognizes, data gaps remain, and the new standards currently do not apply across all LTCF types. The new rule does not require nursing homes to report COVID-19 vaccination or treatment data by resident/staff demographics such as race/ethnicity, continuing a data gap that pre-dates the pandemic. While ICF/IIDs are subject to the new education and offering requirements, there are not similar requirements for other long-term care settings that present similar COVID-19 risk factors for residents and staff, including inpatient behavioral health facilities and congregate community-based settings, and none of these settings are required to report data. Until data, resource, and oversight gaps across the long-term care continuum are filled, nonelderly people with disabilities may continue to experience disproportionate barriers to vaccine access compared to people in nursing homes, and the full impact of COVID-19 on this population will not be completely understood.

Because Medicaid is the primary payer for long-term care services and supports provided in congregate community-settings, states may consider leveraging the new enhanced federal Medicaid HCBS funding included in the American Rescue Plan to support vaccination efforts in settings across the long-term care continuum. Recent CMS guidance confirms that states may use these additional federal funds to facilitate COVID-19 vaccine access for Medicaid HCBS enrollees, many of whom reside into the categories of HCBS congregate care settings discussed above. For example, states can use the new funds to assist Medicaid HCBS enrollees with scheduling vaccination appointments, provide direct support services during appointments, provide transportation to appointments, develop in-home vaccination options, and conduct vaccine outreach and education. While the availability of effective vaccines has helped alleviate the toll the pandemic has taken on LTCFs, continued education and data on vaccine access can help inform ongoing COVID-19 response efforts.

Appendix

Facilities Mentioned in Interim Final Rule

Nursing homes: Licensed nursing facilities that are certified for participation in the Medicare and/or Medicaid programs are colloquially referred to as “nursing homes”. Nursing homes primarily provide 3 types of services: skilled nursing, rehabilitation, and long-term care. Payment for these services in facilities largely depends on licensure by either Medicare and/or Medicaid. In 2020, there were 15,327 nursing homes licensed to participate in Medicare and/or Medicaid serving about 1.3 million residents. Four percent of these facilities were certified as Medicare skilled nursing facilities (SNFs), two percent were certified as Medicaid nursing facilities (NFs), and the remaining 94% of facilities were certified to participate in both Medicare and Medicaid. Medicare typically pays for short-term skilled nursing care and rehabilitation while Medicaid covers short-term skilled care, rehabilitation, and long-term care in nursing homes.

ICF/IIDs: Intermediate care facilities for individuals with intellectual or developmental disabilities are residential facilities that provide active treatment services for people with these conditions. Active treatment refers to aggressive, consistent implementation of a 24-hour program of specialized and generic training, treatment, health services and related services. ICF/IIDs are an optional Medicaid benefit, though all states have adopted the benefit. The latest data indicate that there are 5,768 certified ICF/IIDs across all 50 states serving over 64,800 individuals. These facilities are 100% Medicaid funded, so all residents in these facilities must financially qualify for Medicaid.

Inpatient Behavioral Health Settings: Inpatient behavioral health settings include inpatient psychiatric hospitals (IPFs) and psychiatric residential treatment facilities (PRTFs). IPFs are facilities that provide short-term treatment (typically under 30 days) for individuals with mental illness. PRTFs are non-hospital facilities with a provider agreement with a state Medicaid agency. The age limit imposed by regulation for the PRTF benefit is 21 years of age.

HCBS Congregate Settings: HCBS is an umbrella term for long-term supports and services that are provided to people in their own homes or other community settings rather than institutions. These programs serve a diverse population, including many nonelderly adults with disabilities. The individuals in these settings often have multiple chronic conditions that can increase the risk from COVID–19. HCBS congregate settings include group homes, day habilitation sites, assisted living facilities, shared living/host home settings, adult foster care homes, and more.

News Release

New Analysis: In Pursuit of a National Vaccination Benchmark, Hispanic and Black People’s Rates Projected to Lag Behind

Published: Jun 14, 2021

Much attention has focused on President Biden’s stated goal of vaccinating 70% of U.S. adults by July 4th. While achieving a high overall vaccination rate is important for recovery from the COVID-19 pandemic, a new analysis of people ages 12 and older—a different population than President Biden’s goal, but one that is currently eligible for vaccination—projects that 65% will have received at least one dose by July 4th, but 63% of Hispanic people and only about half (51%) of Black people will have received one dose at the current pace of vaccination. The lagging vaccinations among Black and Hispanic people stand in contrast to projections that Asian people will exceed a 70% level, while 66% of White people will reach it by Independence Day.

Researchers from Stanford University and KFF, using state-reported vaccination data by race/ethnicity, highlight how gaps in vaccines for Black and Hispanic people could persist even if an overall vaccination benchmark is achieved indicating the importance of addressing these gaps with focused efforts to reach specific populations. The analysis further estimates that at the current pace of vaccination, Hispanic people would reach a 70% coverage level at the end of July and White people would reach this level by early August, reflecting a faster recent pace of vaccination among Hispanic people. However, Black people would still not have reached this level by the beginning of September.

Due to data limitations, the projections focus on the vaccinations among people ages 12 and older rather than adults, using 70% receiving at least one dose by July 4th as an illustrative measure to examine potential disparities across groups. Vaccination rates among adults are higher than those among adolescents, who became eligible for the vaccine more recently.

The data note also looks at state-level projections. Asian people are on track to reach a 70% coverage rate in nearly all reporting states (40 of 44), and White people are on track in just over a third of reporting states (18 of 47). Hispanic people are projected to reach 70% by July 4 in 13 of 44 reporting states, while Black people are estimated to reach the level in only 5 of 47 reporting states.

You can read the full findings, Disparities in Reaching COVID-19 Vaccination Benchmarks: Projected Vaccination Rates by Race/Ethnicity as of July 4.

Disparities in Reaching COVID-19 Vaccination Benchmarks: Projected Vaccination Rates by Race/Ethnicity as of July 4

Authors: Marissa Reitsma, Samantha Artiga, Jeremy Goldhaber-Fiebert, Neesha Joseph, Jennifer Kates, Larry Levitt, Anna Rouw, and Joshua Salomon
Published: Jun 14, 2021

Data Note

Introduction

In the race to vaccinate as many people in the U.S. as possible, several benchmarks have been proposed, including President Biden’s goal of reaching 70% of adults in the U.S. with at least one dose by July 4. Whether or not this is attainable is unknown, as the pace of vaccination has slowed, and progress has varied substantially across states. Moreover, even where the 70% target is reached, whether nationally or in a particular state, achievement of the goal for the overall population may mask differences in vaccination rates across groups, particularly by race/ethnicity. To date, vaccination rates among Black and Hispanic people have lagged behind those of White people, largely due to access and logistical barriers as well as concerns about safety and potential side effects. As such, even if broad national vaccination goals are achieved, these groups may remain at higher risk, which could lead to widening health disparities and limit the nation’s recovery from the pandemic.

To further explore potential disparities in meeting vaccination benchmarks, researchers at Stanford University and KFF (Kaiser Family Foundation) used current state-reported vaccination data by race/ethnicity to project vaccine coverage going forward, by state and nationally. Specifically, using the current pace of vaccination, we projected the share of people ages 12 and older who would receive at least one dose of a COVID-19 vaccine as of July 4 for four racial/ethnic groups (White, Black, Hispanic, and Asian) and assessed when 70% of each group would have received at least one dose. We were not able to include other groups in the analysis due to data limitations.

Our focus on vaccinations among those ages 12 and older differs from President Biden’s goal, which is based on those 18 and older. We use a 70% vaccination rate as an illustrative measure for examining potential disparities across groups that may underlie an overall coverage rate.  We focus on those ages 12 and older due to lack of systematic data on vaccinations by race/ethnicity and age. Our projected coverage levels will be lower than those among adults given that younger adolescents have only more recently become eligible for vaccination. Reporting on race and ethnicity is incomplete and inconsistent across states. Previous reporting on racial/ethnic disparities in vaccination through the Centers for Disease Control and Prevention (CDC) and other sources has not adjusted for these data discrepancies, resulting in reported coverage levels that likely underestimate actual population coverage. Although we have adopted a standard set of definitions and rules for reconciling unknown or discrepant data elements to enable transparent and comparable estimation of coverage over time and place, results must be interpreted as approximations in the context of missing and sometimes noisy data.

Findings

At the current pace of vaccination, 65% of those ages 12 and older would be at least partially vaccinated by July 4, but rates would be lower for Hispanic, and especially Black, people. Asian people are the only group estimated to exceed a 70% vaccination rate, while White people (66%) and Hispanic people (63%) will be shy of reaching this level, and only about half (51%) of Black people will have received at least one COVID-19 vaccine dose by July 4, based on current trends (Figure 1). If the current pace of vaccination continues, Hispanic people nationally would reach a 70% threshold by the end of July (July 27), White people would reach this threshold by early August (August 2), but Black people would still not have reached this coverage level by the beginning of September. Hispanic people are projected to reach 70% coverage faster than White people despite having a lower rate of vaccination as of July 4, because their recent pace of vaccination has been faster than White people.

Figure 1: Share of People Age 12+ Estimated to Receive at Least One COVID-19 Vaccine Dose by July 4 at Current Vaccination Pace by Race/Ethnicity

Progress toward achieving a 70% vaccination rate among those ages 12 and older by July 4, and disparities across race/ethnic groups, would also vary significantly across states. At the current vaccination pace, Asian people are on track to reach 70% of those ages 12 and older with at least one COVID-19 vaccine dose in nearly all reporting states (40 of 44), and White people are on track in just over a third of reporting states (18 of 47). Hispanic people are projected to reach this threshold in 13 of 44 reporting states, while Black people are estimated to reach this coverage level in only 5 of 47 reporting states (Figure 2, Tables 1 and 2).

Estimates of States on Track to Have 70% of People Age 12+ Receive At Least One COVID-19 Vaccine Dose by July 4 at Current Vaccination Pace by Race/Ethnicity

To reach a 70% vaccination rate by July 4, the pace of vaccination would need to increase substantially in many states, particularly for Black people. Nationally, the daily pace of new vaccinations would need to be 7% faster than the current pace to achieve 70% vaccination coverage among Hispanic people ages 12 and older by July 4, while the pace for Black people would need to be over two and a half times faster than the current pace. The increases in vaccination rates needed to reach this coverage level also vary across states. The pace would need to at least double in 24 of 44 states reporting data for Hispanic people, 24 of 47 states reporting data for White people, and 36 of 47 states reporting data for Black people (Table 3).

If the pace of new vaccinations continues to slow even further, disparities between groups in achieving progress toward coverage goals would persist. For example, a slowdown of 25% would mean that, overall, the share of those ages 12 and older estimated to have received at least one COVID-19 vaccine dose would drop from 65% to 64%. Asian people would still reach a 70% coverage rate, coverage among White people would remain below this threshold, with 65% receiving at least one dose, and there would be larger gaps for Hispanic and Black people, with 61% and 50% receiving at least one dose by July 4, respectively. These patterns play out at the state level as well.

Implications

It remains to be seen whether President Biden’s goal of at least 70% of adults receiving at least one COVID-19 vaccine dose by July 4 will be achieved, particularly given the slowdown in vaccinations. Regardless of when this goal is achieved, it is important to recognize that this national benchmark may mask underlying disparities. This illustrative analysis, which examines potential disparities toward achieving a 70% coverage rate among people ages 12 and older, shows that Black and Hispanic people will likely be left behind even if and when national goals are achieved, with substantial variation across the country. As such, even if the nation, overall, reaches a broad level of protection through vaccination, certain groups and communities will remain at increased risk for COVID-19. These disparities in vaccination may lead to further widening of the disproportionate impacts of COVID-19 on people of color and health disparities more broadly. These findings underscore the importance of continuing to prioritize vaccine equity and focused efforts to deliver vaccinations to underserved people and areas, as well as the importance of maintaining these efforts even after broader national goals are achieved.

Marissa Reitsma, Jeremy Goldhaber-Fiebert, Neesha Joseph, and Joshua Salomon are with Stanford University. Samantha Artiga, Jennifer Kates, Larry Levitt, and Anna Rouw are with KFF.

Methodology

Stanford University and KFF (Kaiser Family Foundation) researchers used current state-reported vaccination data by race/ethnicity to project vaccine coverage, by state and nationally, among people ages 12 and older for four racial/ethnic groups (White, Black, Hispanic, and Asian). Specifically, we used data on distribution of vaccines administered by race/ethnicity extracted from state reporting dashboards by KFF, total numbers of people who have received at least one dose from the Centers for Disease Control and Prevention, and total population data from the 2019 American Community Survey to estimate the share of people ages 12 years and older receiving one or more COVID-19 vaccination doses, by state and race/ethnicity, through June 7. We then estimated coverage rates through September 1 based on the average daily vaccination rate implied by the change in coverage between May 24 and June 7 for each racial/ethnic group, by state.

Data on vaccination coverage by race/ethnicity vary by state in terms of reporting groups and completeness. We applied the following data processing steps to produce comparable estimates. We assumed vaccinations reported as “unknown” race/ethnicity were distributed proportional to shares of vaccinations with known race/ethnicity in each state. Examining vaccinations reported as “other” race/ethnicity, we found that in most states, the shares attributed to “other” greatly exceeded population shares (implying coverage >100%). We therefore adjusted shares by assuming “other” were vaccinated proportional to eligible population, and proportionally redistributed remaining vaccinations among specified racial/ethnic groups. We adjusted shares to avoid double-counting in states that report shares by race separate from shares by ethnicity. For racial/ethnic groups not reported by specific states, we assumed these groups were vaccinated proportional to population size and scaled down shares of vaccines to reported groups accordingly. We capped coverage among any racial/ethnic group at 100% of the eligible population, and in cases where implied coverage exceeded 100%, we proportionally redistributed the excess across other groups.

A handful of states required exceptions to the standard approach. The share of vaccinations by race/ethnicity from Nebraska was unavailable on June 7. As a result, projections for Nebraska were based on race/ethnicity-specific vaccination rates spanning May 10 to May 24. The share of vaccinations by race/ethnicity from Idaho and Tennessee were unavailable from May 24. As a result, projections for these states were based on the three-week period spanning May 17 to June 7. CDC reported coverage in New Hampshire decreased slightly between May 24 and June 7, likely due to reconciling reporting issues. As a result, projections for New Hampshire were also based on the three-week period spanning May 17 to June 7. The share of vaccinations by race/ethnicity for Pennsylvania reported in the state dashboard do not include vaccinations for Philadelphia County. Since Philadelphia County includes a substantial fraction of the Black, Hispanic, and Asian population living in Pennsylvania, we separately extracted and included data from the Philadelphia County dashboard.

Limitations of this analysis include reliance on several assumptions to address incomplete and heterogeneous reporting of vaccination data by race/ethnicity across states. Previous reporting on racial/ethnic disparities in vaccination through the CDC and other sources has not adjusted for these data discrepancies, resulting in reported coverage levels that likely underestimate actual population coverage. Although we have adopted a standard set of definitions and rules for reconciling unknown or discrepant data elements to enable transparent and comparable estimation of coverage over time and place, results must be interpreted as approximations in the context of missing and sometimes noisy data. Future work should continue to update these estimates and further assess uncertainty due to model assumptions.

Replication code and data are available at: https://github.com/PPML/covid_vaccination_coverage_disparities

Tables

Share of People Age 12+ Estimated to Receive At Least One COVID-19 Vaccine Dose by July 4 at Current Vaccination Pace by Race/Ethnicity and State
Estimated Date 70% of People Age 12+ will Have Received At Least One COVID-19 Vaccine Dose at Current Vaccination Pace by Race/Ethnicity and State
Percentage Increase in Vaccination Pace Needed for 70% of People Age 12+ to Receive at least One COVID-19 Vaccine Dose by July 4 by Race/Ethnicity and State
Poll Finding

KFF COVID-19 Vaccine Monitor: Profile Of The Unvaccinated

Published: Jun 11, 2021

The KFF COVID-19 Vaccine Monitor is an ongoing research project tracking the public’s attitudes and experiences with COVID-19 vaccinations. Using a combination of surveys and qualitative research, this project tracks the dynamic nature of public opinion as vaccine development and distribution unfold, including vaccine confidence and acceptance, information needs, trusted messengers and messages, as well as the public’s experiences with vaccination.

Who are the Unvaccinated?

As of late May 2021, a majority of U.S. adults have received a COVID-19 vaccine, with 62% of adults reporting having gotten at least one dose according to the KFF COVID-19 Vaccine Monitor. There are still substantial shares of the adult population who have not received a vaccine and many do not plan on getting vaccinated. This analysis, drawing on data from the KFF COVID-19 Vaccine Monitor, provides some insights into the demographics of the currently unvaccinated population as well as their views of vaccines generally and the pandemic more broadly.

Unvaccinated adults are a shrinking population in the U.S. that, as of late May 2021, consists of about one-third of U.S. adults (37%). Adults in this group are those, who despite outreach efforts and being eligible for a vaccine for at least six weeks, have not received a COVID-19 vaccine. The unvaccinated group are younger, more likely to identify as Republicans or be Republican-leaning, and more likely to have lower levels of education and lower incomes than the vaccinated population.

Compared To Those Who Have Received A COVID-19 Vaccine, Unvaccinated Adults Are Younger, Less Educated, More Likely To Be Republicans, People Of Color, And Uninsured

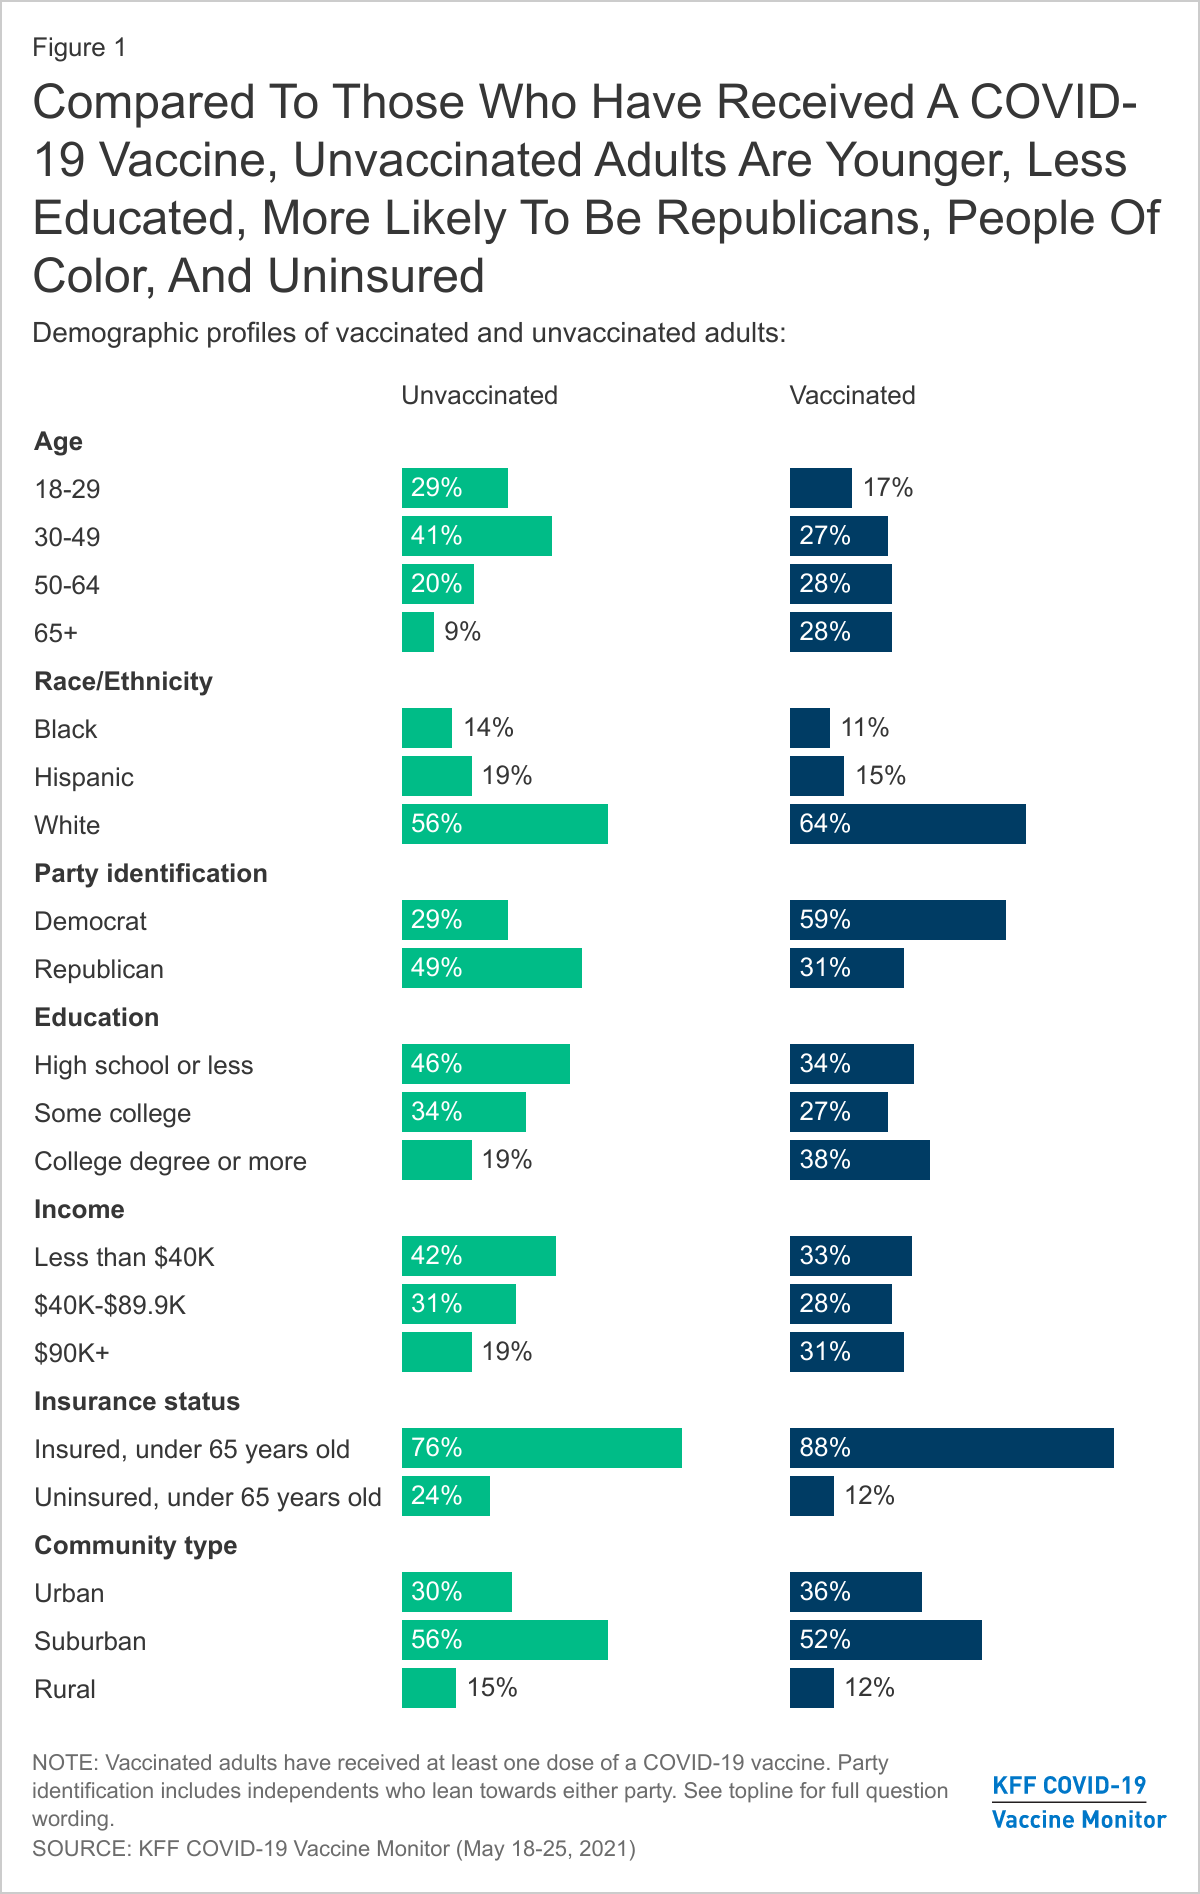
Unvaccinated adults are significantly younger, with 29% of those in the group falling in the 18-29 year old range compared to 17% of those in the vaccinated group. In addition, a smaller share of unvaccinated adults are 65 and older (9%) than the vaccinated group (28%). This may reflect recent changes in access to vaccines with older populations being among the first groups eligible to be vaccinated in states. President Biden announced that 90% of adults would be eligible to get the vaccine by April 19th but there were still significant waiting times for many adults who had just gotten eligible. Over the next few weeks we will better know whether these age differences are due to vaccine access or to actual different vaccine intentions among younger adults.

There are strong partisan differences in vaccine intentions with almost half (49%) of unvaccinated adults identifying as Republicans or Republican-leaning independents, compared to three in ten (31%) vaccinated adults. On the other hand, Democrats and Democratic-leaning independents make up a majority of the vaccinated population (about six in ten), while about three in ten in the unvaccinated population identify as Democrats or Democratic-leaning independents.

Compared to vaccinated adults, smaller shares of White adults are unvaccinated, with no significant differences for Black and Hispanic adults on whether they have received at least one-dose so far, despite Black and Hispanic adults lagging in vaccination rates compared to Whites. Around two-thirds (64%) of vaccinated adults are White, compared to 56% of unvaccinated adults. With difficulty accessing vaccine locations and services disproportionately impacting the non-White population, current outreach continues to strive to bridge the gap.

Americans with lower levels of education make up a larger share of the unvaccinated population than the vaccinated one, with 46% of unvaccinated adults holding a high school degree or less compared to 34% of vaccinated adults. Vaccinated Americans are twice as likely as unvaccinated to have a college degree or higher (38% vs. 19%).

The unvaccinated group also tends to include disproportionate shares of adults without health insurance coverage as well as those with lower levels of income. Those under the age of 65 without insurance make up about one quarter of the unvaccinated population, and 42% of all unvaccinated adults report earning less than $40K a year.

The “Definitely not” group compared to the “Wait and see” group

KFF has been tracking vaccine intentions over the past six months and while there are clear demographic differences between vaccinated adults and unvaccinated adults, there are also differences within the unvaccinated population depending on whether they are still open to getting a vaccine or not. Specifically, those who say they want to “wait until it has been available for a while to see how it is working for other people” before getting vaccinated, the wait and see group (12% of all adults) look distinctly different from the most vaccine resistant group, those who say they will “definitely not” get a COVID-19 vaccine (the definitely not group represents about 13% of U.S. adults). While the share of the U.S. adult population who self-identified as “wait and see” has decreased over the past several months as tens of millions of U.S. adults have received a vaccine and few people have experienced serious side effects from the vaccine, the share of the public who are in the “definitely not” group has not shifted dramatically over the past six months.

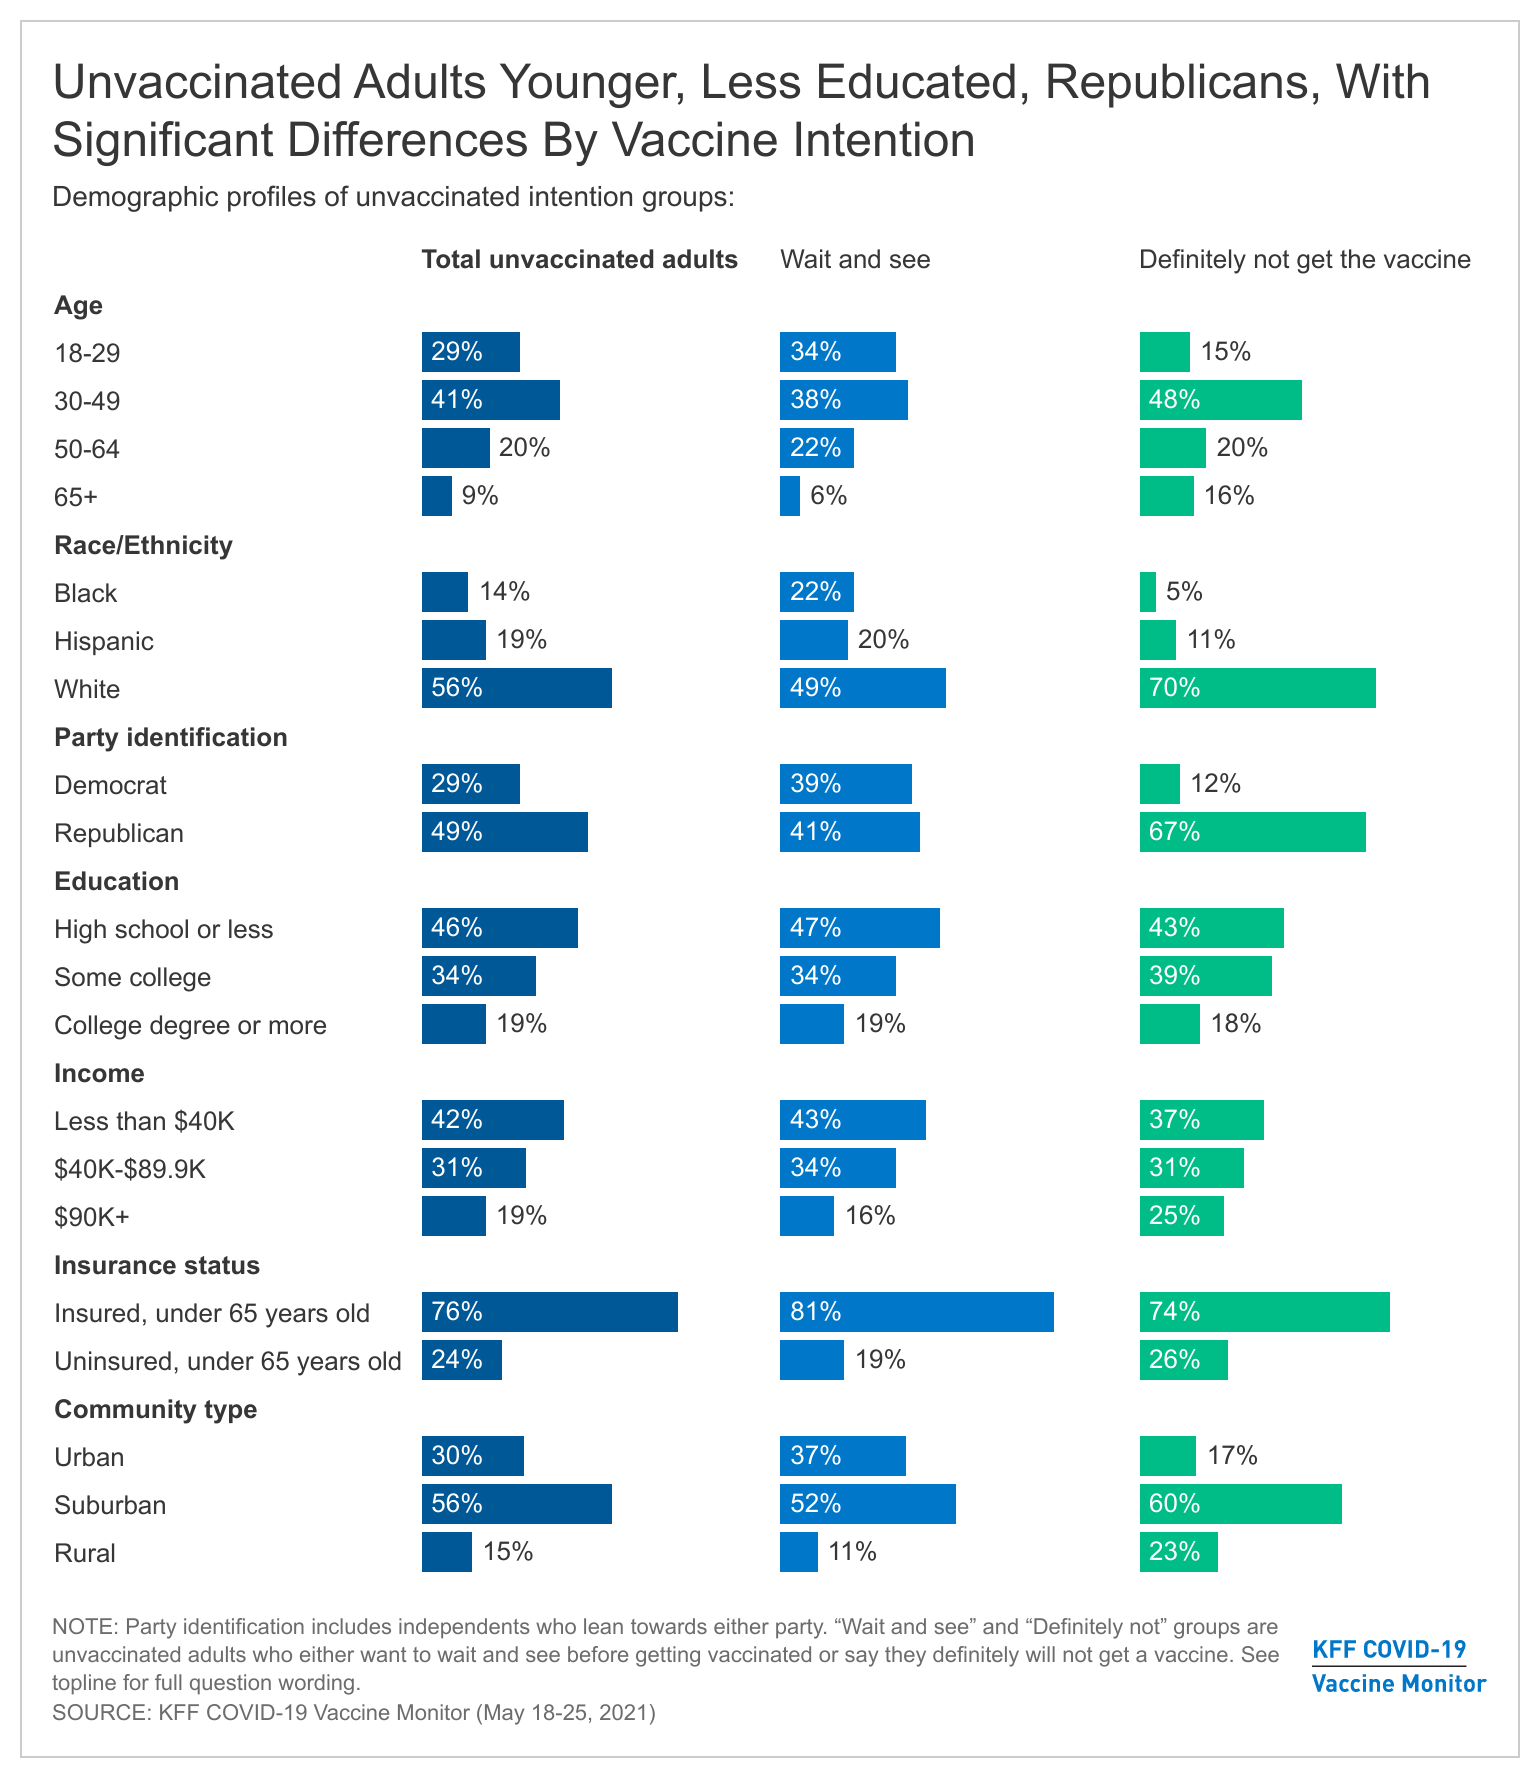
The key demographic differences between the “wait and see” and the “definitely not” groups center on racial and ethnic identity and political partisanship. Half of those in the “wait and see” group are people of color. Throughout the rollout of the vaccines, larger shares of Black and Hispanic adults have reported they would want to “wait until it has been available for a while to see how it is working for other people” before getting vaccinated. This still holds true in the latest KFF COVID-19 Vaccine Monitor with Black adults and Hispanic adults both representing about one-fifth of the “wait and see” group. On the other hand, the most vaccine resistant group, those who say they will “definitely not” get a COVID-19 vaccine is overwhelmingly made up of White adults (70% of the group compared to 49% of the “wait and see” group).

&quot;Wait And See&quot; Group Tends To Be More Black, Hispanic, Split Politically, While &quot;Definitely Not&quot; More White, Republican-Leaning

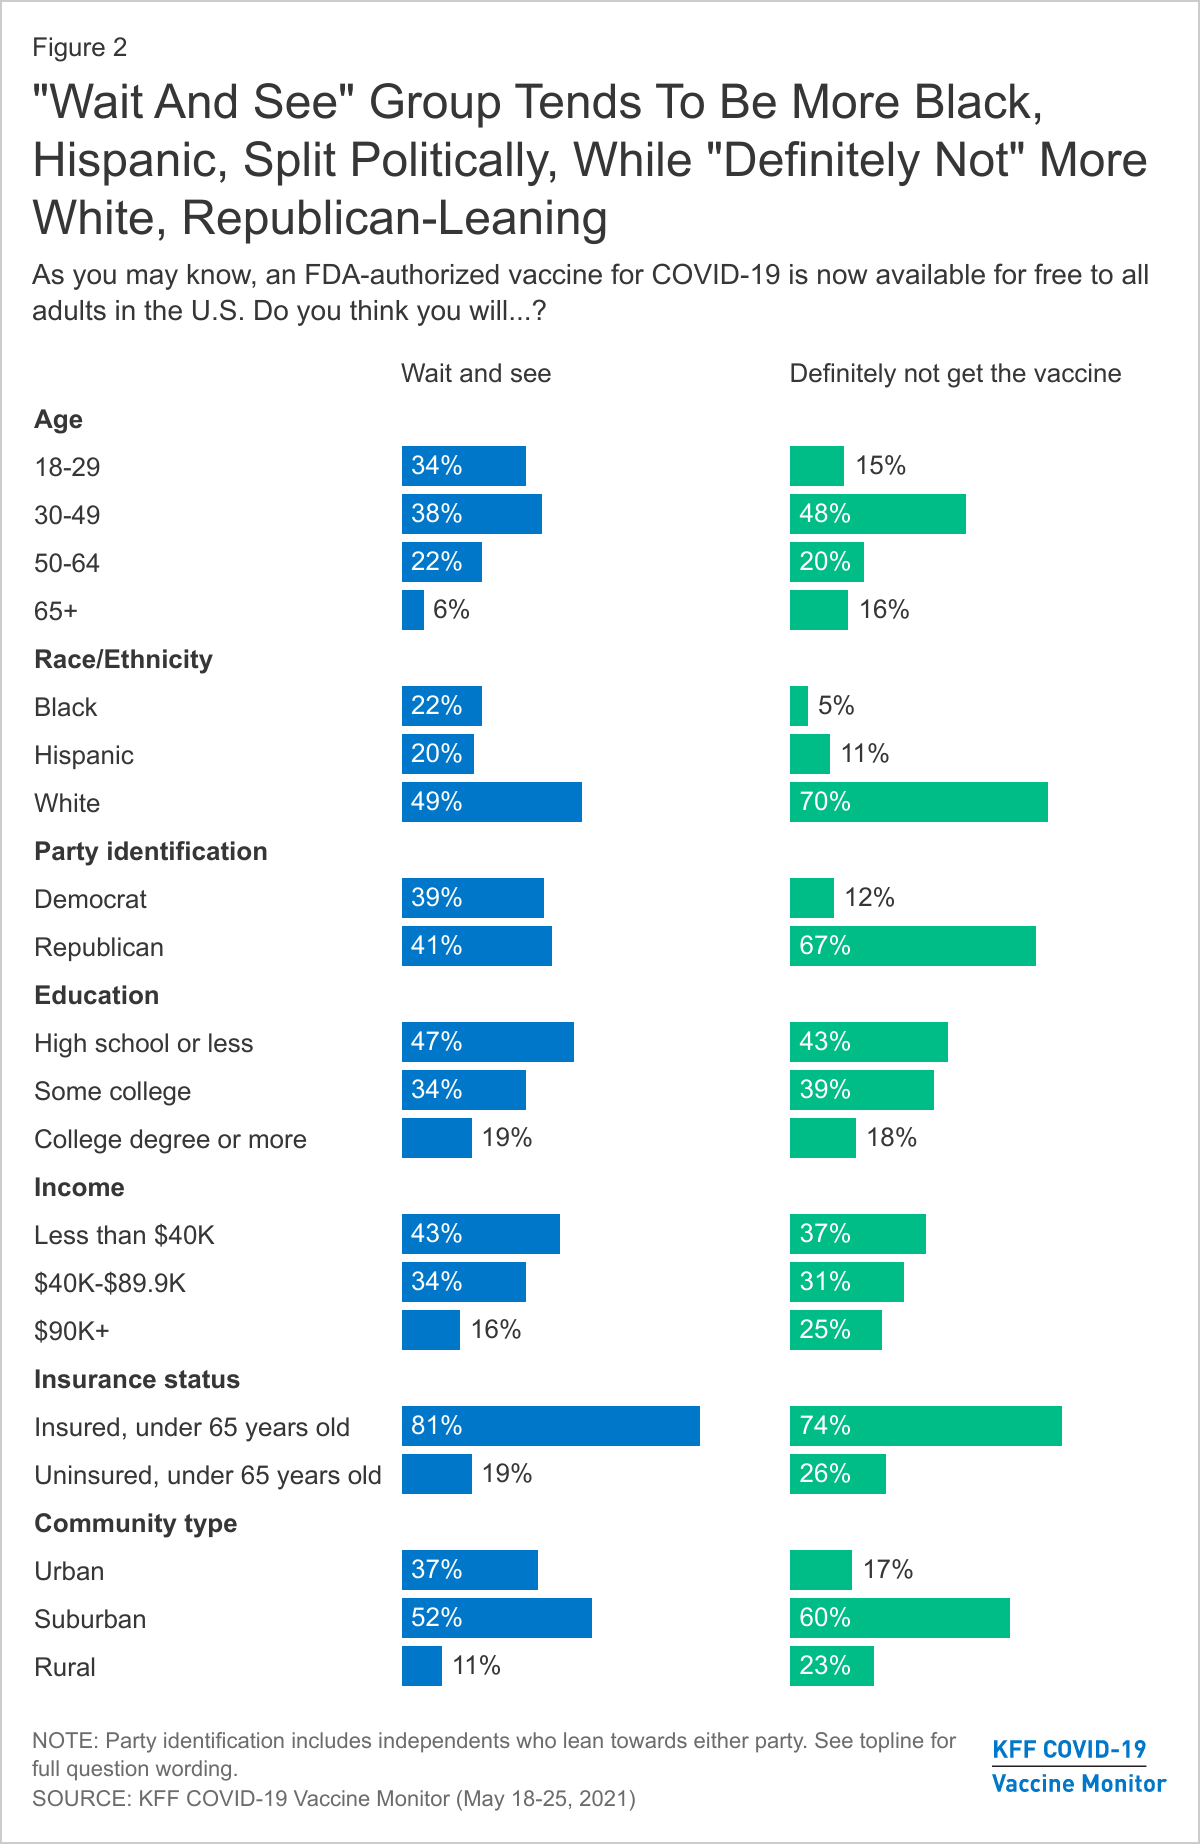
The “wait and see” group is also split politically, with about four in ten who identify as Republicans or Republican-leaning independents and another four in ten as Democrats or Democratic-leaning, while the more vaccine resistant “definitely not” group is overwhelmingly Republican-leaning, with two-thirds (67%) in the group identifying as either Republican or Republican-leaning independents.

There is a smaller share of rural residents in the “wait and see” group (11%) than in the “definitely not” group (23%) but the “definitely not” group is also characterized by other demographics that disproportionately live in rural areas, including more White adults and Republicans.

There are no significant differences when you look at age, education, and insurance status among those who are unvaccinated with about seven in ten in both unvaccinated groups under the age of 50, about one in five have college degrees, and similar shares reporting being uninsured.

Vaccine Intentions Among Unvaccinated Adults Strongly Connected To Views Of Pandemic, Past Flu Vaccine Behavior

People’s intentions to get a COVID-19 vaccine are also largely connected with their previous experience with vaccines and their overall views of the pandemic.

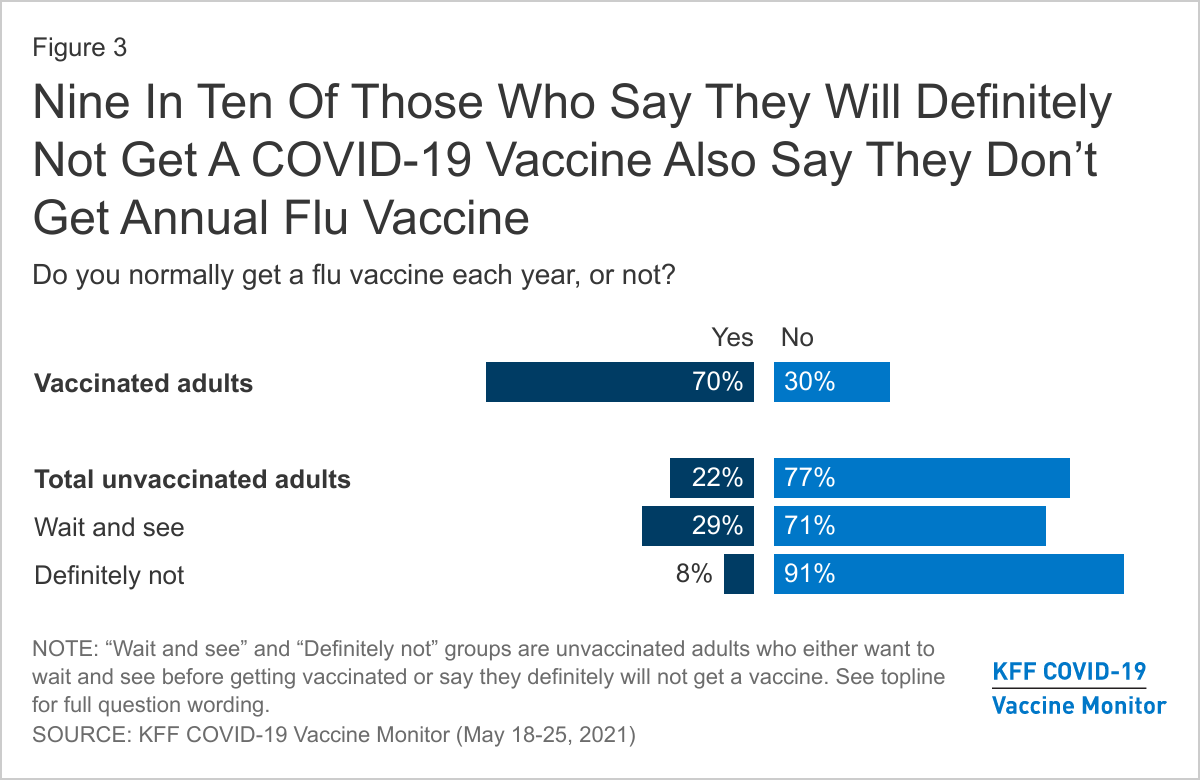
Unvaccinated adults are less likely to reporting getting of the flu vaccine, with over three-quarters (77%) saying they do not normally get a flu vaccine each year. The vast majority of unvaccinated adults who say they will “definitely not” get the COVID-19 vaccine say they don’t regularly get their flu vaccine (91%), compared to about seven in ten (71%) of those in the “wait and see” group.

Nine In Ten Of Those Who Say They Will Definitely Not Get A COVID-19 Vaccine Also Say They Don’t Get Annual Flu Vaccine

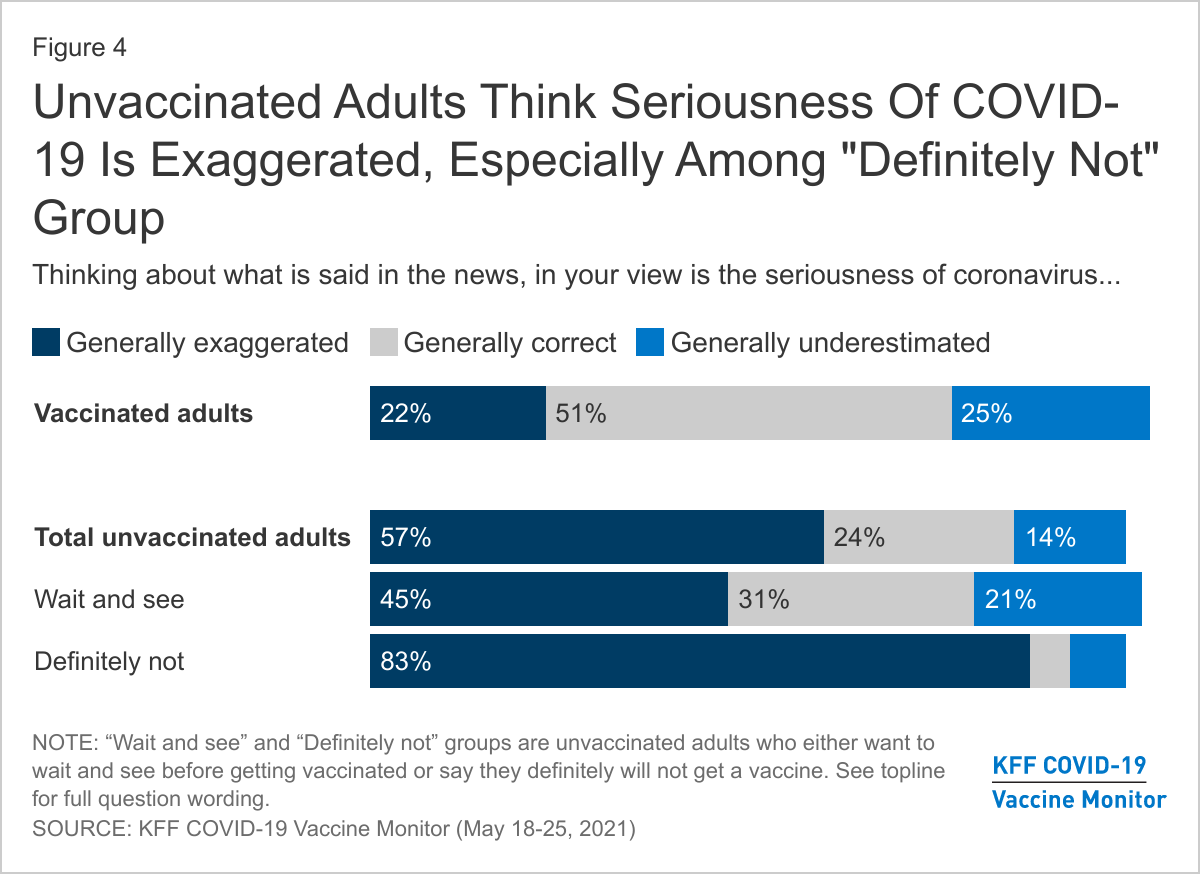
About six in ten unvaccinated adults (57%) think that what is said about COVID-19 in the news is generally exaggerated, significantly larger than the share of vaccinated adults who say the same (22%).  Again, differences exist between the “wait and see” and the “definitely not” with close to twice as many of the latter group saying the news has exaggerated Covid-19. About three-fourths of vaccinated adults either say the news have either been “generally correct” or “generally underestimated” the severity of the pandemic.

Unvaccinated Adults Think Seriousness Of COVID-19 Is Exaggerated, Especially Among &quot;Definitely Not&quot; Group

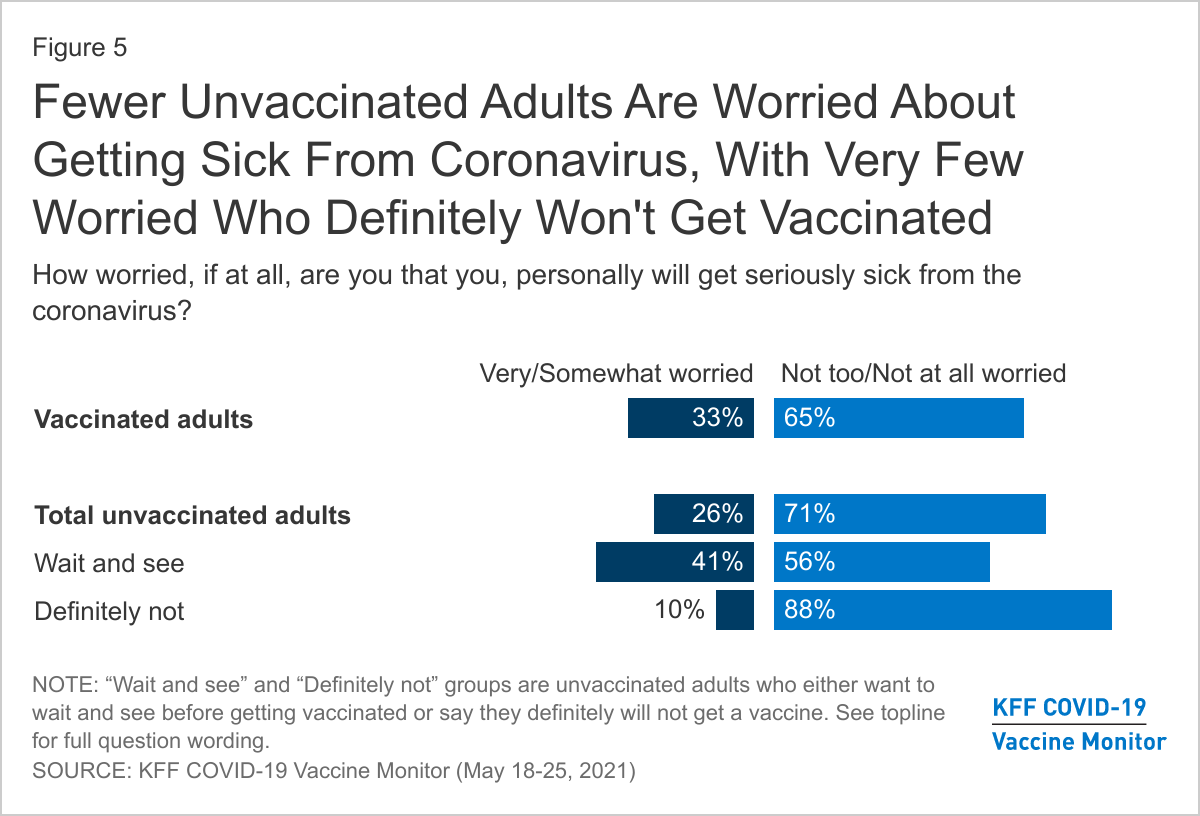
In addition to thinking the news has overstated the problem, most unvaccinated adults say they are not worried about getting sick from coronavirus. About seven in ten unvaccinated adults overall, including nearly nine in ten (88%) of those in the “definitely not” group say they are either “not too worried” or “not at all worried” about personally getting sick from COVID-19. Those in the “wait and see” group are more likely to say they are worried, but still a majority of them (56%) say they are not worried.

Fewer Unvaccinated Adults Are Worried About Getting Sick From Coronavirus, With Very Few Worried Who Definitely Won't Get Vaccinated

Despite being less likely to be worried about getting sick, one-third of unvaccinated adults say they know someone close who has died due to COVID-19, according to the April COVID-19 Vaccine Monitor – including 29% of those who say they definitely won’t get the vaccine.

Unvaccinated Adults Have Different Concerns and Some In The “Wait and See” Group Say Certain Incentives Could Persuade Them

The KFF COVID-19 Vaccine Monitor has consistently found that many unvaccinated adults report being concerned about the safety of the vaccines. This is true among both the “wait and see” group and the “definitely not” group with large majorities of both saying they are concerned the vaccines are not as safe as they are said to be. The two groups differ on other concerns. For example, they differ in terms of concerns about the vaccine’s impact on fertility (two-thirds of the “definitely not” group say they are at least somewhat concerned about this compared to 44% of the “wait and see” group) and on concerns about having to pay for a vaccine (one-third of the “wait and see” group is concerned about this compared to 19% of the “definitely not” group). Nearly four in ten (37%) in the “wait and see” group also express concern about being able to get the vaccine from a place they trust, perhaps another indicator of health care access issues within this group.

FDA Approval Is Convincing To Unvaccinated, Especially &quot;Wait And See,&quot; But Many Are Still Concerned About Safety, Fertility, and Cost

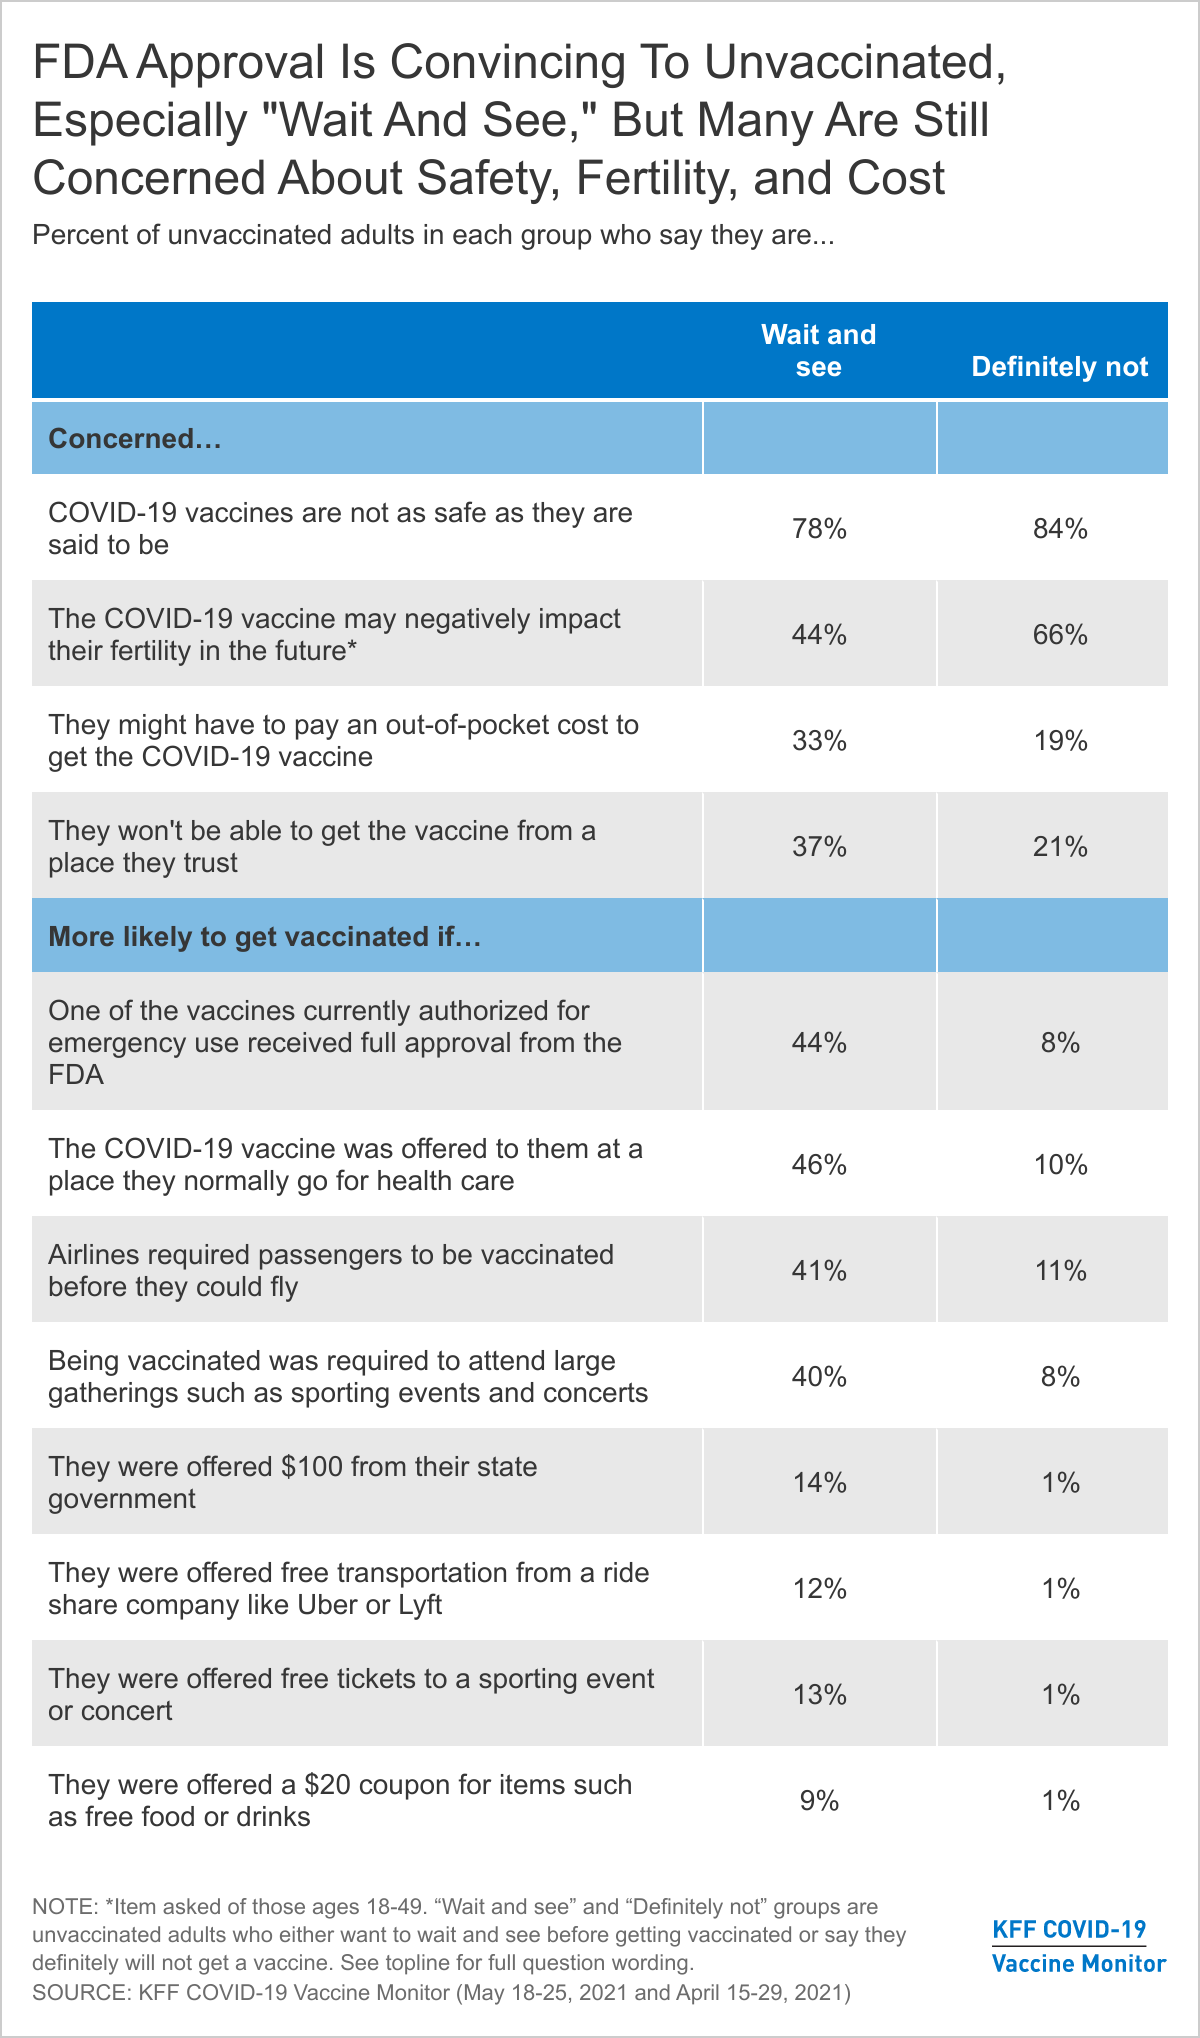
Many states, public health departments, and employers are working on incentives aimed at increasing vaccine uptake among the currently unvaccinated populations. KFF has been tracking the reported effectiveness of various potential incentives for the past few months and finds substantial shares of those in the “wait and see” group say they would be more likely to get the vaccine if it was offered to them at a place they normally go for care (46%), they were required to get vaccinated in order to fly on an airplane (41%) or attend large gatherings (40%). In addition, nearly half of the “wait and see” group (44%) say they would be “more likely” to get a vaccine if one of the vaccines currently authorized for emergency use received full approval from the FDA. Yet, few of those in the “definitely not” group say any of these incentives, conveniences, or requirements would make them more likely to get vaccinated. This is also consistent with previous reports that finds these two groups differ in terms of reported access, information needs, and influence of both “carrot” and “stick” methods of incentives to get vaccinated.

It is clear there are distinct groups within the unvaccinated population and their views are not monolithic. While some within the “wait and see” population may be persuaded to get a vaccine in the coming weeks, few in the “definitely not” group show any indication of changing their minds as their views towards the COVID-19 vaccine are consistent with past vaccine behaviors as well as overall views of the threat of COVID-19.

News Release

Who Remains Unvaccinated? A COVID-19 Vaccine Monitor Analysis

Published: Jun 11, 2021

As more people across the country get at least an initial dose of a COVID-19 vaccine, public health officials are increasingly trying to reach the shrinking pool of unvaccinated adults – now roughly a third of all adults.

The latest KFF COVID-19 Vaccine Monitor report explores this group’s demographic profile and finds that, compared to vaccinated adults, unvaccinated adults are younger and more likely to identify as Republican or Republican-leaning. They also have lower levels of education and income and are more likely to be uninsured.

Most (56%) are White adults, though large shares are Black (14%) and Hispanic (19%) adults, who are somewhat less likely to have received an initial dose than White adults are.

Among unvaccinated adults, there are significant differences between those who say they want to “wait and see” before getting a vaccine (12% of all adults) and those who say they will “definitely not” get one (13% of all adults).

While most in both groups live in suburban areas, the “wait and see” group includes a larger share of urban residents (37% v. 17%), while the “definitely not” group includes a larger share of rural residents (23% v. 11%).

The “wait and see” group is roughly evenly divided between White adults (49%) and people of color (51%), including many Black (22%) and Hispanic (20%) adults. They are also about as likely to say they are Democrats or Democrat-leaning (39%) as Republican or Republican-leaning (41%).

In contrast, those who say they will “definitely not” get a vaccine are largely White adults (70%) and Republican or Republican-leaning (67%).

The vast majority of the “definitely not” group (83%) and nearly half of the “wait and see” group (45%) also say that the seriousness of the COVID-19 pandemic has been “generally exaggerated” in the news. Among those who have been vaccinated, just 22% say so.