Poll Finding

Health and Health Care Experiences of Hispanic Adults

Authors: Samantha Artiga, Liz Hamel, Audrey Kearney, Mellisha Stokes, and Alauna Safarpour
Published: Jul 14, 2021

Findings

Introduction

The COVID-19 pandemic has taken a stark disproportionate toll on people of color, including the Hispanic population. These disparate impacts of the COVID-19 pandemic have exposed and exacerbated longstanding underlying disparities in health and health care facing Hispanic people. Prior to the pandemic, these disparities had already been compounded by immigration policies implemented during the Trump administration that increased fears among immigrant families and made some more reluctant to access programs and services, including health coverage and health care. Although the Biden administration has since reversed many of these policies, they likely continue to have lingering effects.

This report provides insights into the health care experiences of Hispanic adults amid the current environment and examines how they vary by key factors, including insurance and immigration status. A prior report examined the health and economic impacts of COVID-19 for Hispanic adults and their attitudes, experiences with, and barriers to getting COVID-19 vaccinations. This report from the KFF COVID-19 Vaccine Monitor is based on interviews with 778 Hispanic adults in the U.S., including 334 conducted in Spanish, 392 with adults born outside the U.S., including 185 who indicated that they do not have lawful permanent resident status (referred to in this report as “potentially undocumented”).1 

Employment and Income

Individuals’ employment and income affect access to health insurance and ability to afford health care. People in lower wage jobs are less likely to be offered health insurance by their employer and may have more difficulty affording it when it is offered due to their limited incomes. Moreover, people with limited incomes may face more challenges paying for health care costs.

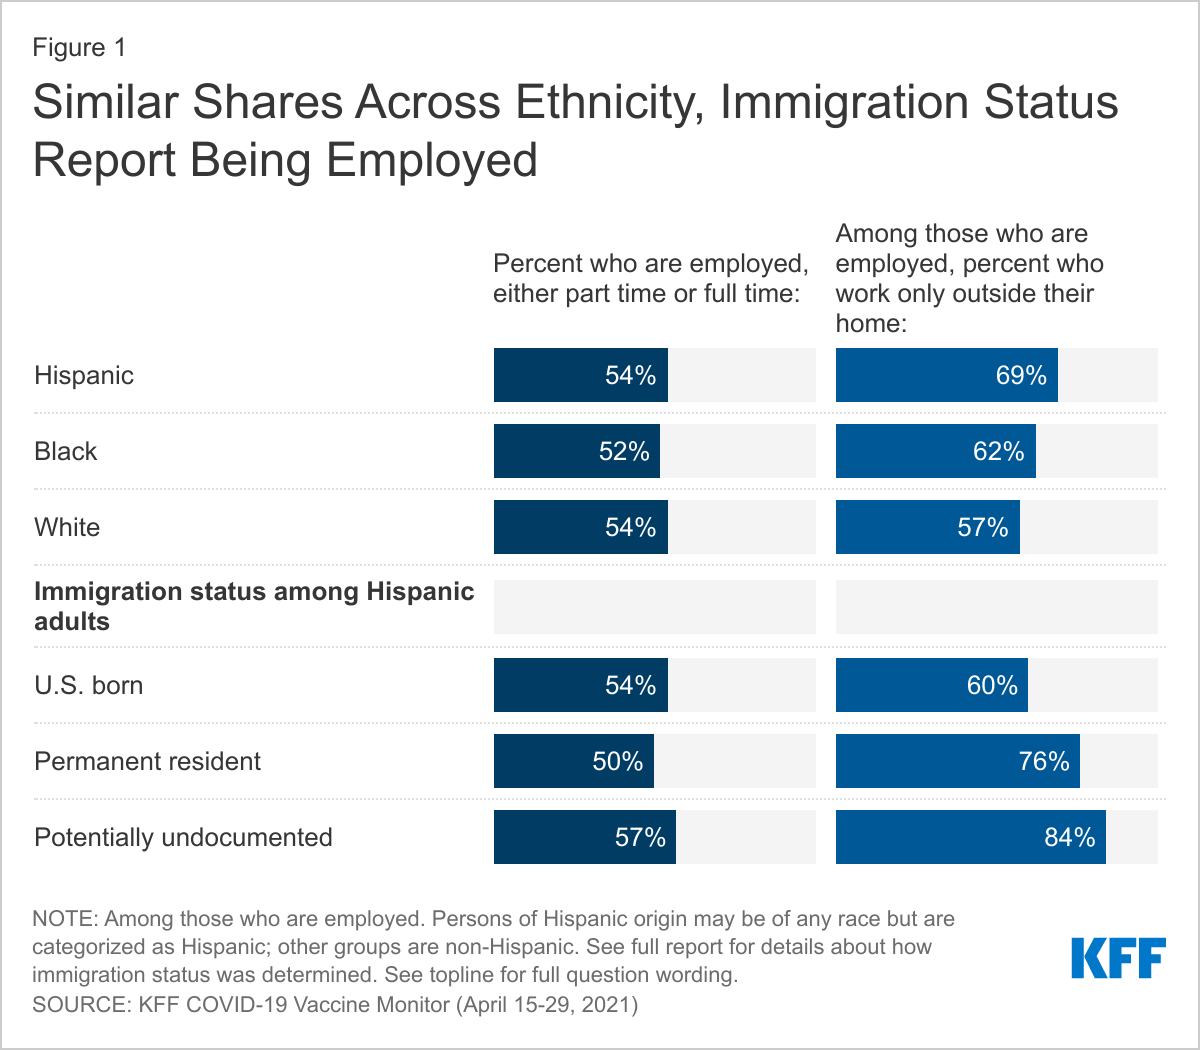
Although Hispanic adults are as likely as White adults to say they are employed, they are more likely to report living in a lower income household. Over half (54%) of Hispanic adults say they are employed, similar to the shares of Black (52%) and White (54%) adults (Figure 1). Among Hispanic adults, nearly six in ten (57%) potentially undocumented Hispanic adults say they are employed, similar to the shares among Hispanics who are U.S.-born (54%) and who are lawful permanent residents (50%). Employed Hispanic adults are more likely than employed White adults to say they currently work solely at a location outside their home (69% vs. 57%), contributing to increased risk of exposure amid the COVID-19 pandemic, particularly for those who are unvaccinated. Among employed Hispanic adults, those who are potentially undocumented are more likely to say they are currently working outside the home—84% of potentially undocumented employed Hispanic adults say they work only outside the home compared to 60% of employed U.S.-born Hispanic adults.

Similar Shares Across Ethnicity, Immigration Status Report Being Employed

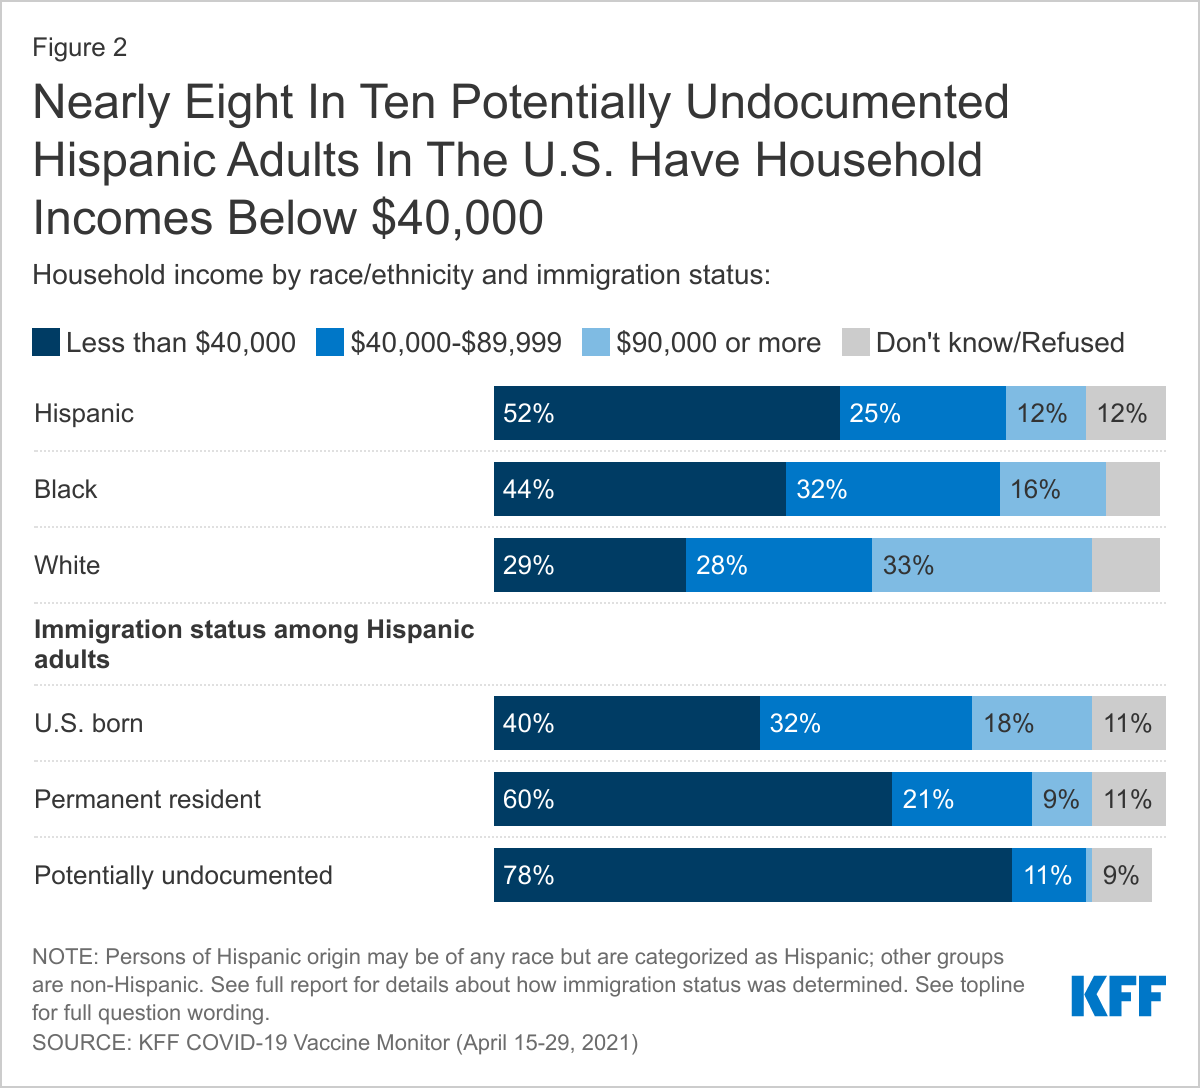
Despite being as likely as White adults to report being employed, about half (52%) of Hispanic adults say their annual household income is less than $40,000 compared to 29% of White adults (Figure 2). Nearly eight in ten (78%) potentially undocumented Hispanic adults report annual household income of less than $40,000, compared to 60% of lawful permanent residents and 40% of U.S.-born Hispanic adults.

Nearly Eight In Ten Potentially Undocumented Hispanic Adults In The U.S. Have Household Incomes Below $40,000

Health Coverage and Program Participation

Health insurance makes a difference in whether and when people get necessary medical care, where they get their care, and ultimately, how healthy they are. Uninsured adults are far more likely than those with insurance to postpone health care or forgo it altogether. Hispanic people have faced longstanding disparities in health coverage. They were more likely than their White counterparts to be uninsured prior to the pandemic and faced widening gaps in coverage between 2018 and 2019. These coverage declines may, in part, reflect changes to immigration policy, particularly the “public charge” policy under the Trump administration, which contributed to growing fears among immigrant families about participating in public programs, including health coverage. Although the Biden administration has since reversed many of these policies, they may continue to have lingering effects. Further, the economic impacts of the COVID-19 pandemic have likely contributed to additional coverage losses that may further widen disparities in coverage for Hispanic people.

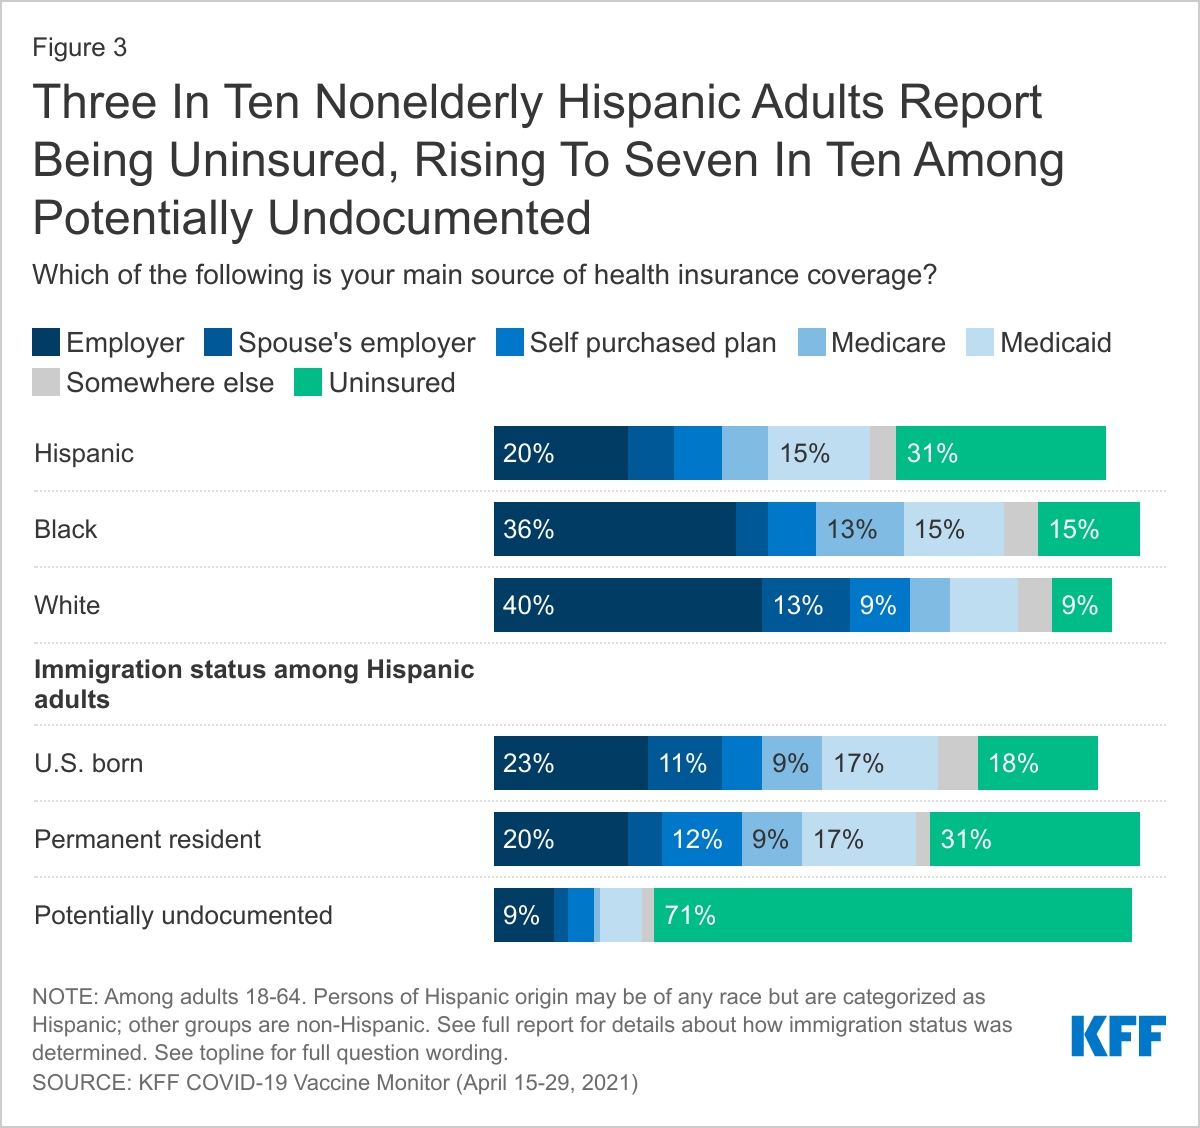
Three in ten nonelderly Hispanic adults (31%) say they are uninsured compared to 15% of Black adults and 9% of White adults (Figure 3). The share reporting they don’t have health insurance is much higher among nonelderly Hispanic adults who are potentially undocumented (71%) and somewhat higher among those who are lawful permanent residents (31%) compared to U.S.-born Hispanic adults (18%).

Three In Ten Nonelderly Hispanic Adults Report Being Uninsured, Rising To Seven In Ten Among Potentially Undocumented

These patterns likely reflect more limited access to employer-sponsored coverage among foreign-born Hispanic adults, due to higher rates of employment in low-wage jobs that are less likely to offer health coverage, as well as more limited access to and barriers to enrolling in public coverage options. Lawfully present immigrants may qualify for Medicaid and the Children’s Health Insurance Program, but many, including most lawful permanent residents, must wait five years after obtaining a qualified immigration status before they may enroll. Lawfully present immigrants can purchase coverage through the Affordable Care Act (ACA) marketplaces and may receive subsidies for this coverage, including those who are not eligible for Medicaid or CHIP because they are in the five-year waiting period. Although lawfully present immigrants are eligible for coverage, they face a range of potential enrollment barriers, including fear, confusion about eligibility policies, difficulty navigating the enrollment process, and language and literacy challenges. Undocumented immigrants are not eligible to enroll in Medicaid or CHIP or to purchase coverage through the ACA marketplaces.

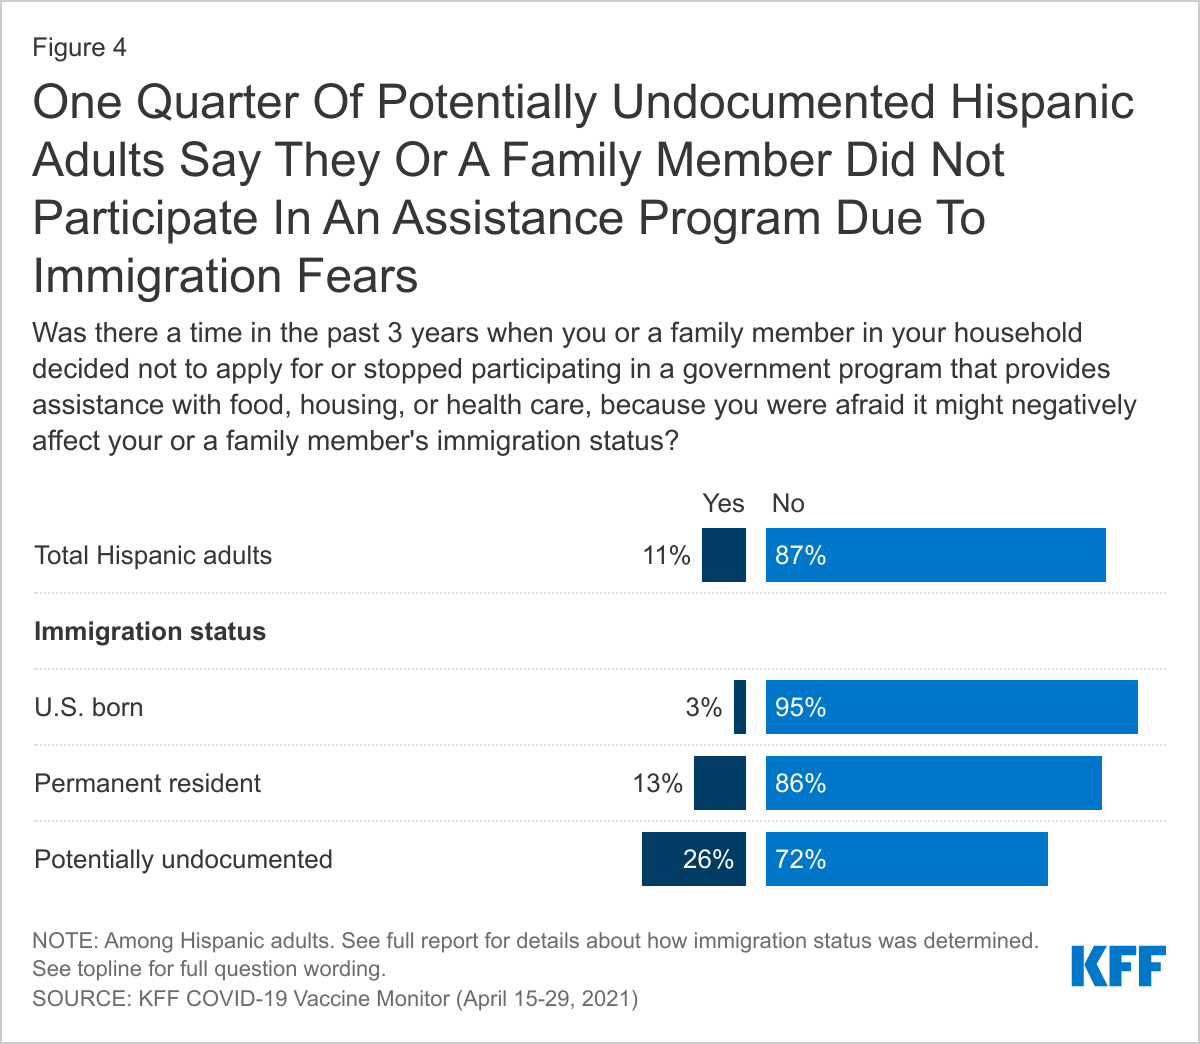
Some Hispanic adults, particularly those who are potentially undocumented, report that they have avoided seeking assistance for food, housing, and/or health care due to immigration-related fears. One in ten Hispanic adults (11%) say there was there a time in the past 3 years when they or a family member decided not to apply for or stopped participating in a government assistance program because they were afraid it might negatively affect their or a family member’s immigration status (Figure 4). Across Hispanic adults overall, 6% say they did not apply for or stopped participating a program to help with food, 4% say assistance for housing, and 3% say a health care program. The share saying they or a family member did not apply for or stopped participating in a program in the past 3 years due to immigration-related fears increased to 13% among lawful permanent residents and 26% among potentially undocumented Hispanic adults. Overall, 21% of potentially undocumented Hispanic adults say they did not apply for or stopped participating in a program to help with food, 12% say assistance for housing, and 11% say a health care program.

One Quarter Of Potentially Undocumented Hispanic Adults Say They Or A Family Member Did Not Participate In An Assistance Program Due To Immigration Fears

Access to and Experiences Obtaining Health Care

Beyond health coverage, other factors such as having a usual source for health care, accessibility of health care provider locations, and affordability of care have implications for individuals’ access to and use of care, including preventive and primary care as well as care for chronic conditions. Further, individuals’ experiences and relationships with health care providers, including patient-provider communications, can affect the quality of care they receive, their satisfaction with care, and health outcomes.

Usual Source of Care

A usual source of care is a health care provider where people usually go when they are sick or need advice about their health. Research finds that people with a usual source of care are more likely than those without a usual source to get care and less likely to have difficulty obtaining care or to go without receiving needed services.

Hispanic adults, particularly those who are potentially undocumented and uninsured, are more likely than their White counterparts to say they do not have a usual source of care other than the emergency room. Nearly one in four (24%) Hispanic adults overall report no usual source of care other than an emergency room, higher than the share of White adults (12%) and similar to the share of Black adults (28%) (Figure 5). Among Hispanic adults, roughly three in ten potentially undocumented (32%) and lawful permanent resident (29%) adults say they have no usual source of care other than the emergency room, compared to about one in five (19%) U.S.-born adults. Similarly, among nonelderly Hispanic adults, those who are uninsured are more likely than those with insurance to say they do not have a usual source of care other than the emergency room (37% vs. 20%).

Hispanic Adults Are More Likely Than White Adults To Say They Use A Neighborhood Clinic Or Have No Usual Source Of Health Care

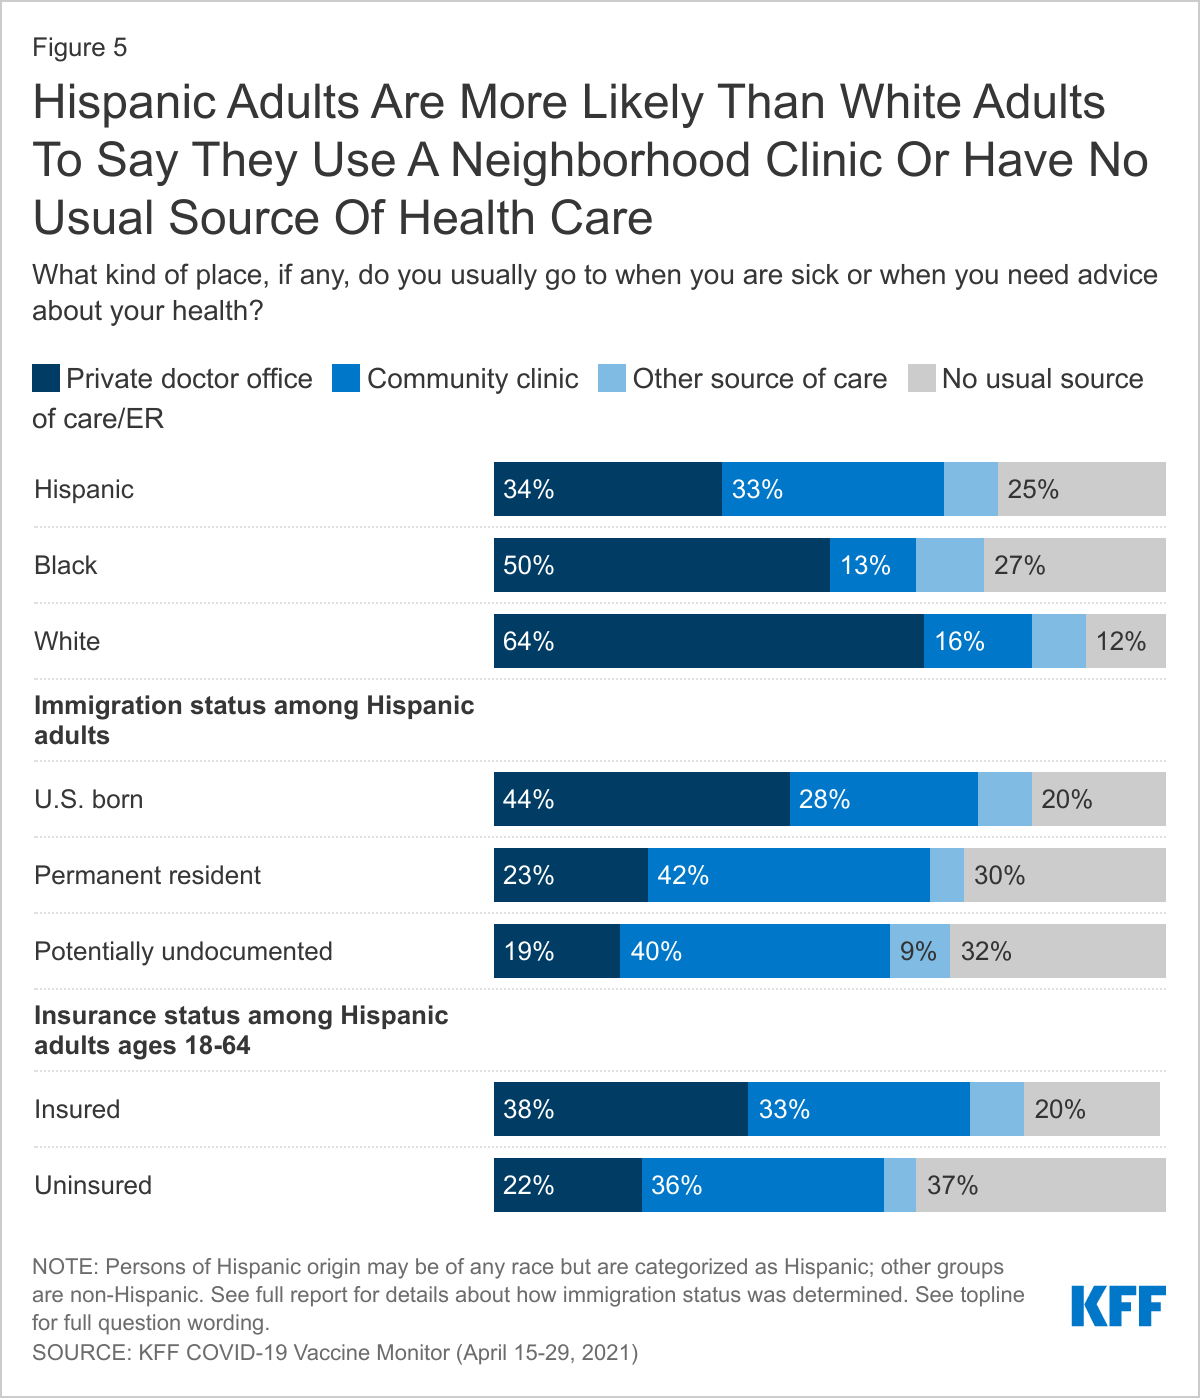
Hispanic adults are also more likely than White adults to say a neighborhood clinic or health center is their usual source of care (33% vs. 16%). The shares relying on a clinic or health center as their usual source of care are even higher among lawful permanent resident (42%) and potentially undocumented (40%) Hispanic adults. In contrast, Hispanic adults are less likely than White adults to say their usual source of care is a private doctor’s office (34% vs. 64%). The share saying a clinic is their usual source of care is similar for both uninsured (36%) and insured (33%) nonelderly Hispanic adults, but those who are uninsured are less likely to say they use a private doctor’s office as their usual source of care than their insured counterparts (22% vs. 38%).

Access to and Affordability of Care

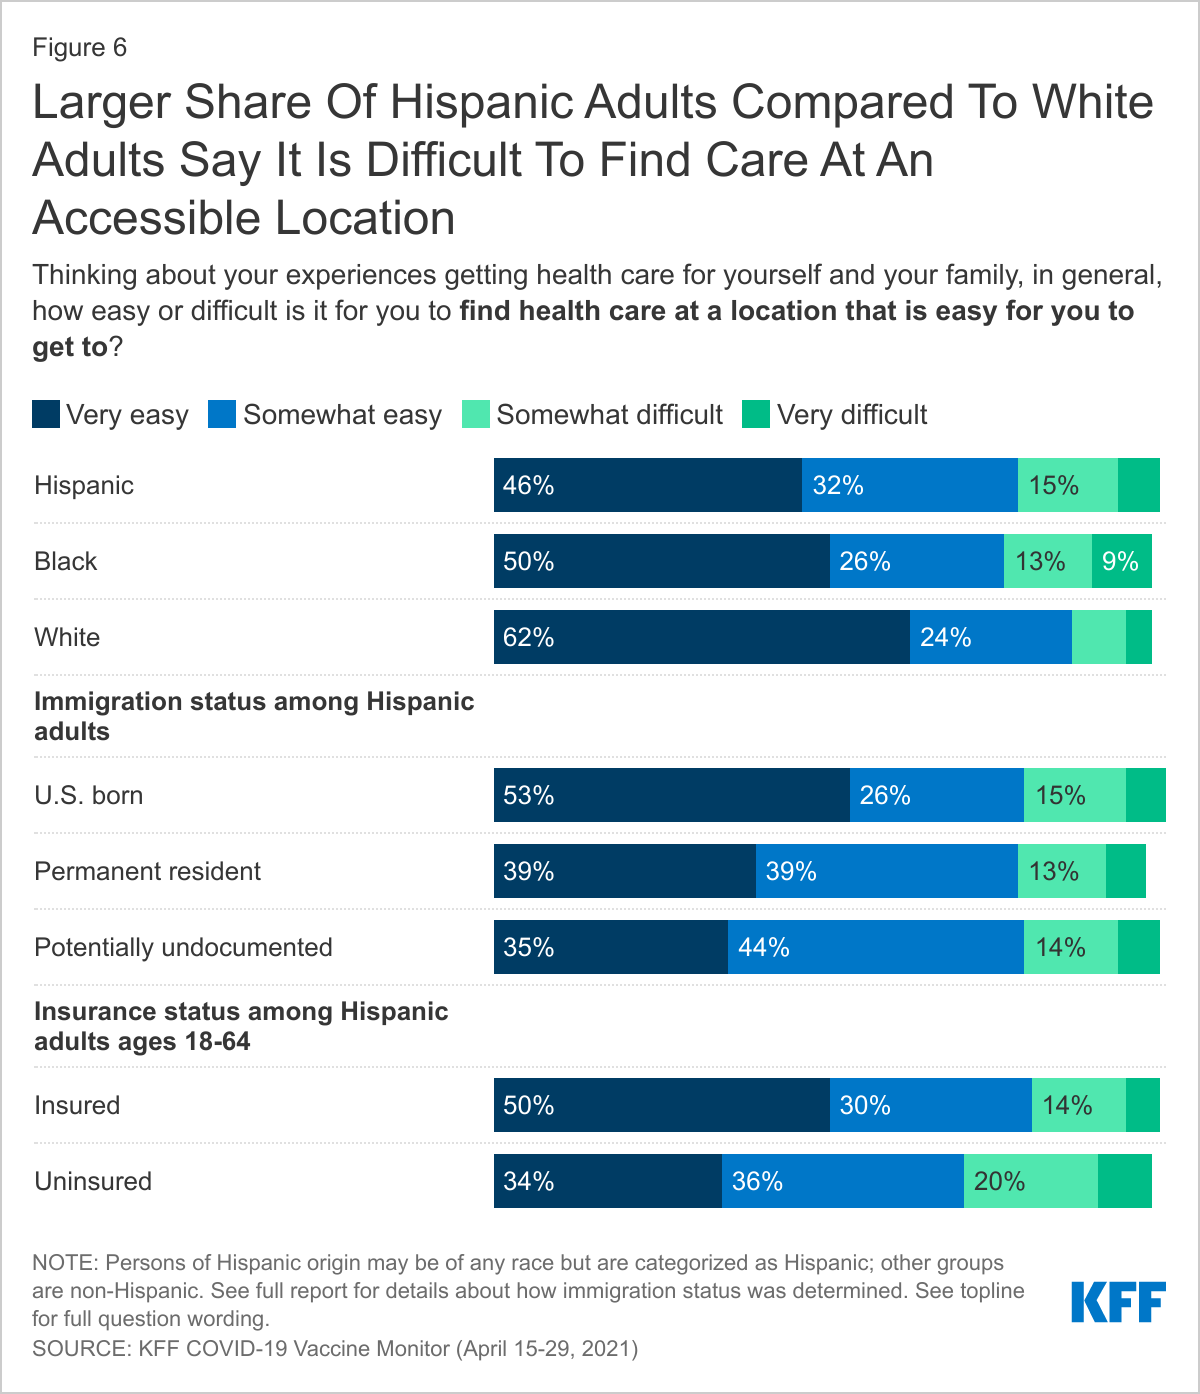
About one in five (21%) Hispanic adults say it is somewhat or very difficult to get to a location for health care versus 12% of White adults (Figure 6). The remaining nearly eight in ten Hispanic adults (78%) say it is very or somewhat easy to find health care at a location that is easy to get to, compared to 86% of White adults. Less than half of Hispanic adults say it is very easy (46%) compared to 62% of White adults. Among Hispanic adults, those who are foreign-born are less likely to say it is very easy to get to a location for health care, with 39% of lawful permanent residents and 35% of potentially undocumented adults saying it is very easy compared to 53% of those who are U.S.-born. Similarly, among nonelderly Hispanic adults, those who are uninsured are less likely to say it is very easy (34%) compared to those with health insurance (50%). Nearly three in ten uninsured Hispanic adults (28%) say it is very or somewhat difficult to find care at a location that is easy to get to.

Larger Share Of Hispanic Adults Compared To White Adults Say It Is Difficult To Find Care At An Accessible Location

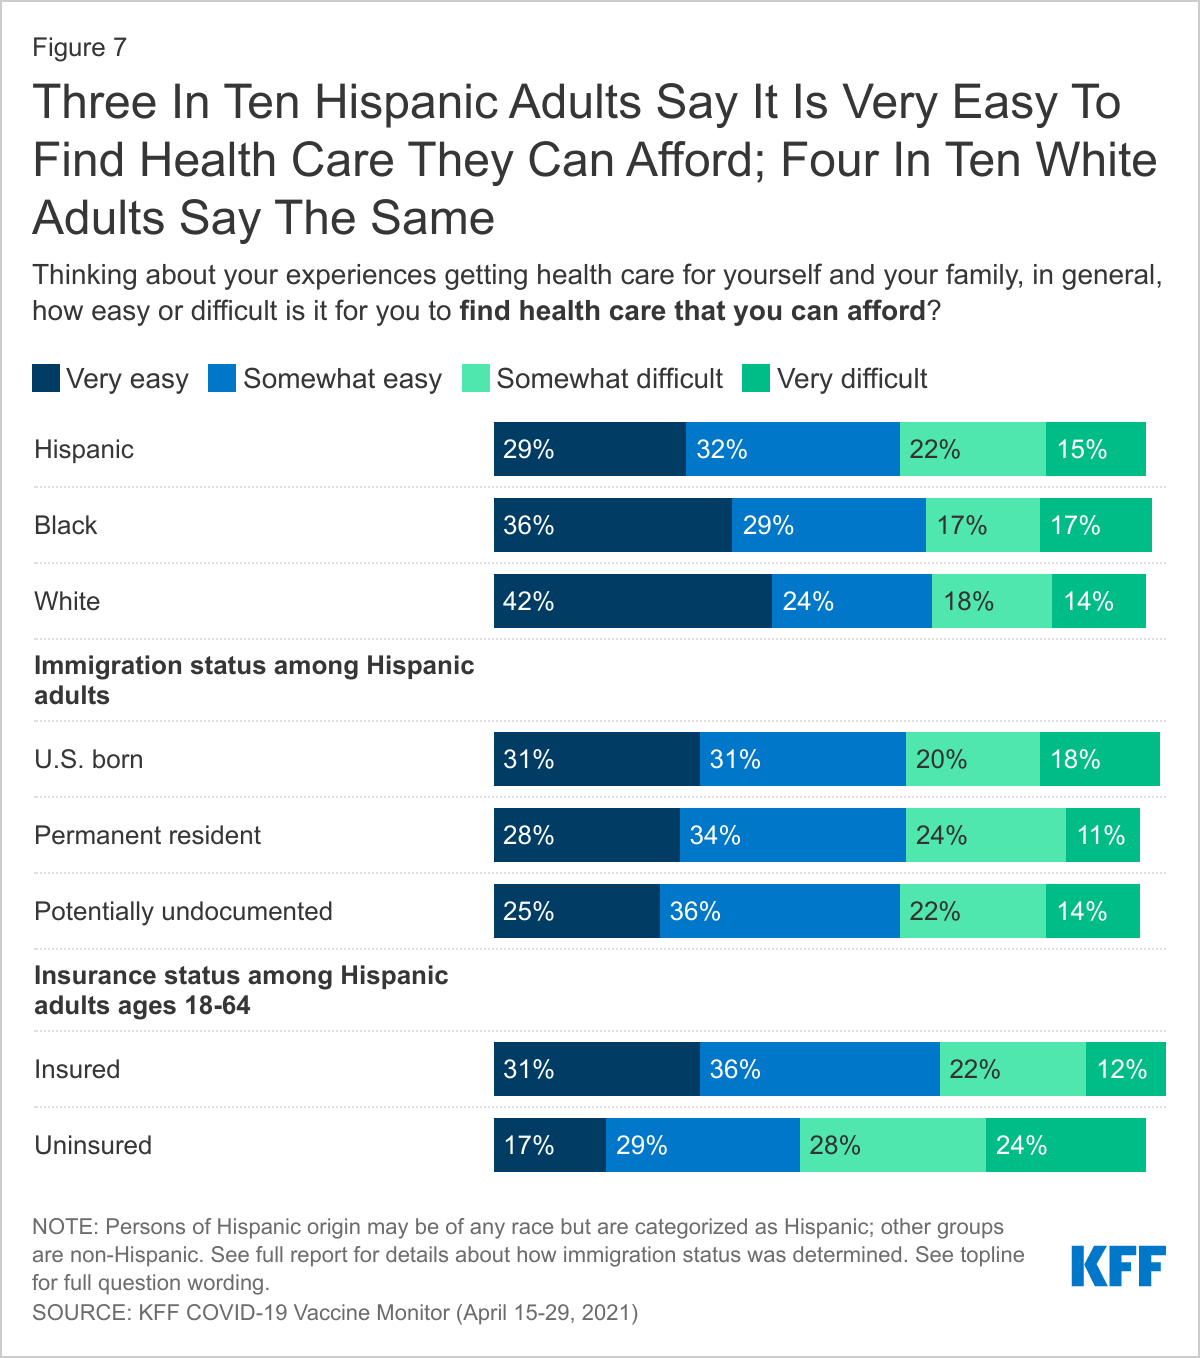
Overall, the share of Hispanic adults who say it is very or somewhat difficult to find health care they can afford is similar to the share of White adults (37% vs. 32%) (Figure 7). However, Hispanic adults are less likely than White adults to say it is very easy to find affordable care (29% vs. 42%). Further, among nonelderly Hispanic adults, those who are uninsured are twice as likely as those with insurance to say it is very difficult to find health care they can afford (24% vs. 12%). There are no major differences in the reported ease of finding affordable care by immigration status. The reliance on community health centers as a usual source of care by a high share of Hispanic adults may mitigate potential challenges finding affordable care among Hispanic adults even though they are more likely to be uninsured and have lower incomes than White adults, since health centers provide free or low-cost care regardless of insurance status. Other data also show that Hispanic adults are less likely to utilize care than their White counterparts.2 

Three In Ten Hispanic Adults Say It Is Very Easy To Find Health Care They Can Afford; Four In Ten White Adults Say The Same

Provider Communications and Linguistic Access to Care

Communication plays a key role in the delivery of health care and affects patient–provider relationships and the health care people receive. Studies have found that language barriers between providers and patients may result in excessive ordering of medical tests, lack of understanding of medication side effects and provider instructions, decreased use of primary care, increased use of the emergency department, and inadequate follow-up.

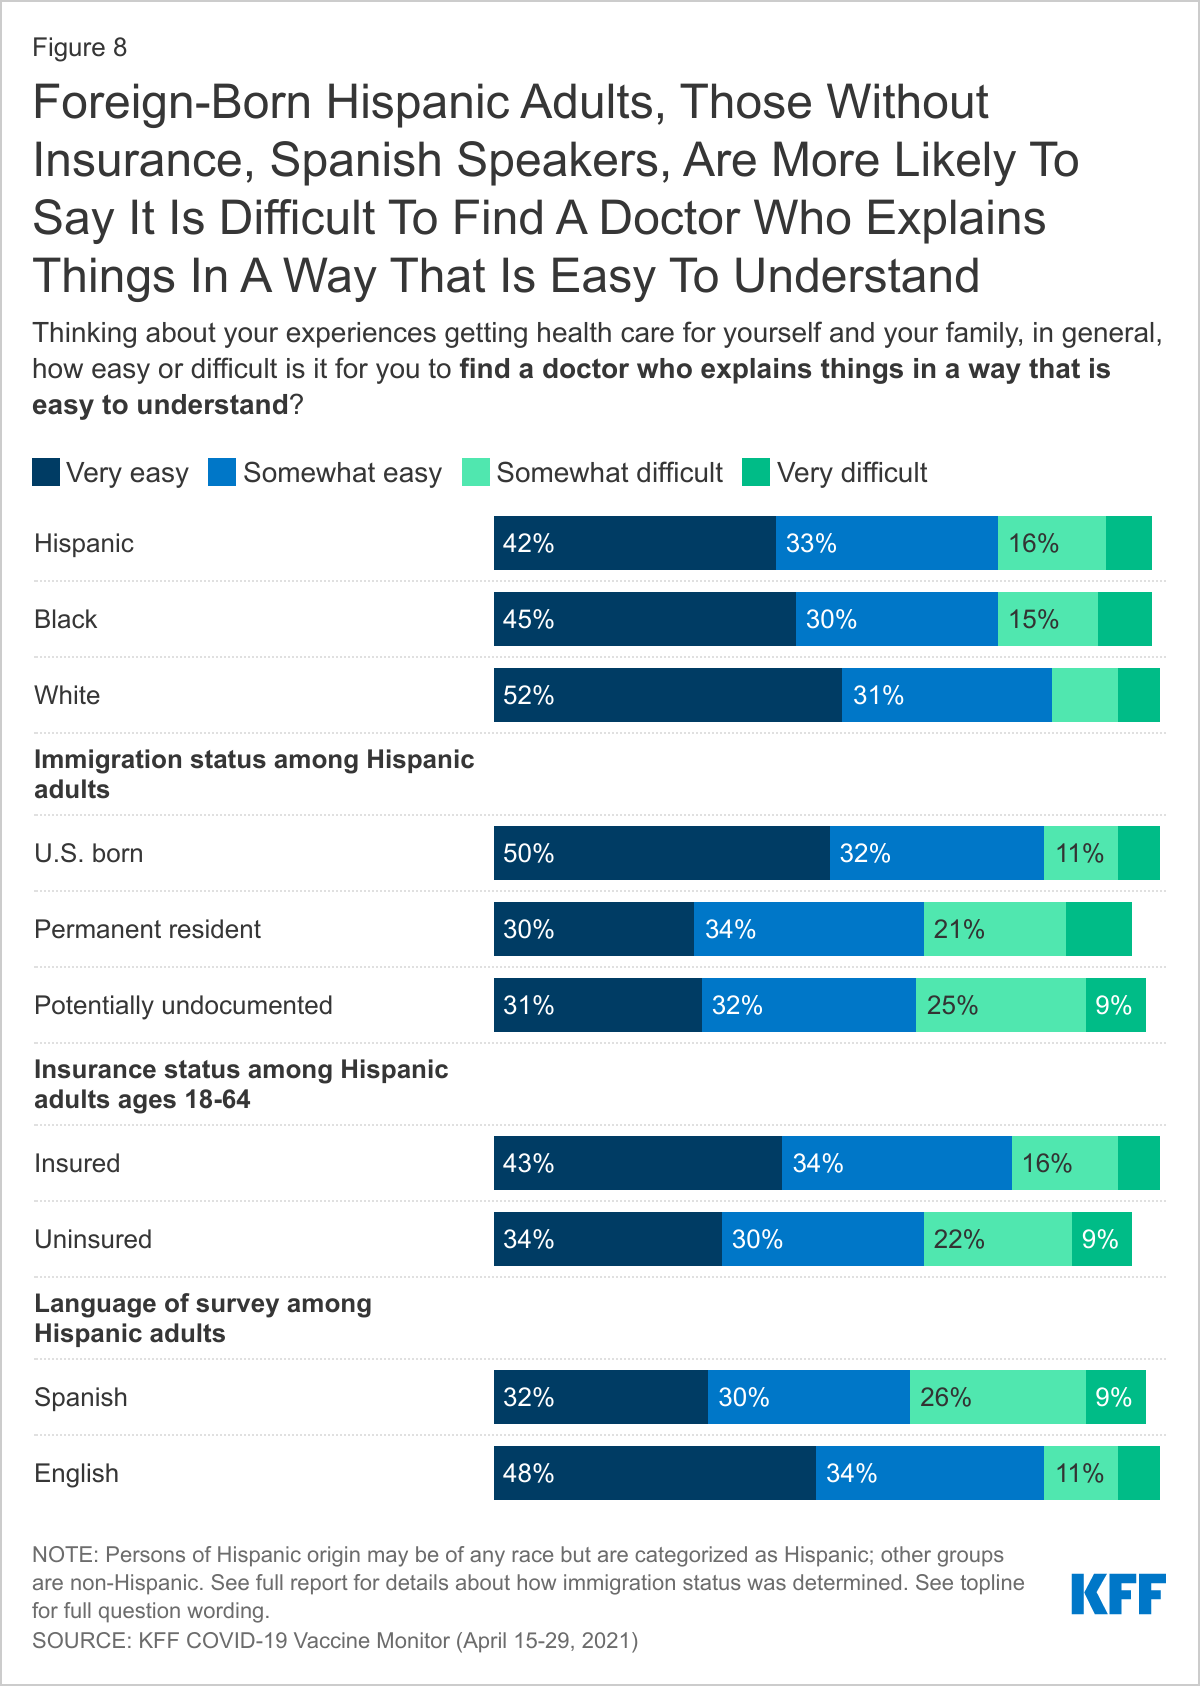
Some Hispanic adults, particularly those who are foreign born or uninsured, say it is difficult to find a doctor who explains things in a way that is easy to understand (Figure 8). Overall, three-quarters (74%) of Hispanic adults say it is very or somewhat easy to find a doctor who explains things in a way that is easy to understand, but nearly one-quarter (24%) say it is very or somewhat difficult, higher than the share of White adults (16%) and similar to the share of Black adults (23%). Foreign-born Hispanic adults are more likely than those born in the U.S. to say it is difficult to find a doctor who explains things in a way that is easy to understand, with 34% of potentially undocumented adults and 31% of lawful permanent resident adults saying it is somewhat or very difficult compared to 16% of those who are U.S.-born. Having a usual source of care also makes a difference in the ability to find a doctor who explains things in a way that is easy to understand, as Hispanic adults without a usual source of care are more likely to report it is somewhat or very difficult than those with one (30% vs. 21%). There are no significant differences in the share of nonelderly Hispanic adults who say it is difficult by insurance status, but those who are uninsured are less likely to say it is very or somewhat easy compared to those who are insured (65% vs 77%). Linguistic access to care is also a challenge for some Spanish-speaking adults. Among Hispanic adults who completed the survey in Spanish, one-third (33%) say it is very or somewhat difficult to find a doctor who speaks their preferred language or provides an interpreter when needed.

Foreign-Born Hispanic Adults, Those Without Insurance, Spanish Speakers, Are More Likely To Say It Is Difficult To Find A Doctor Who Explains Things In A Way That Is Easy To Understand

Experiences with Providers

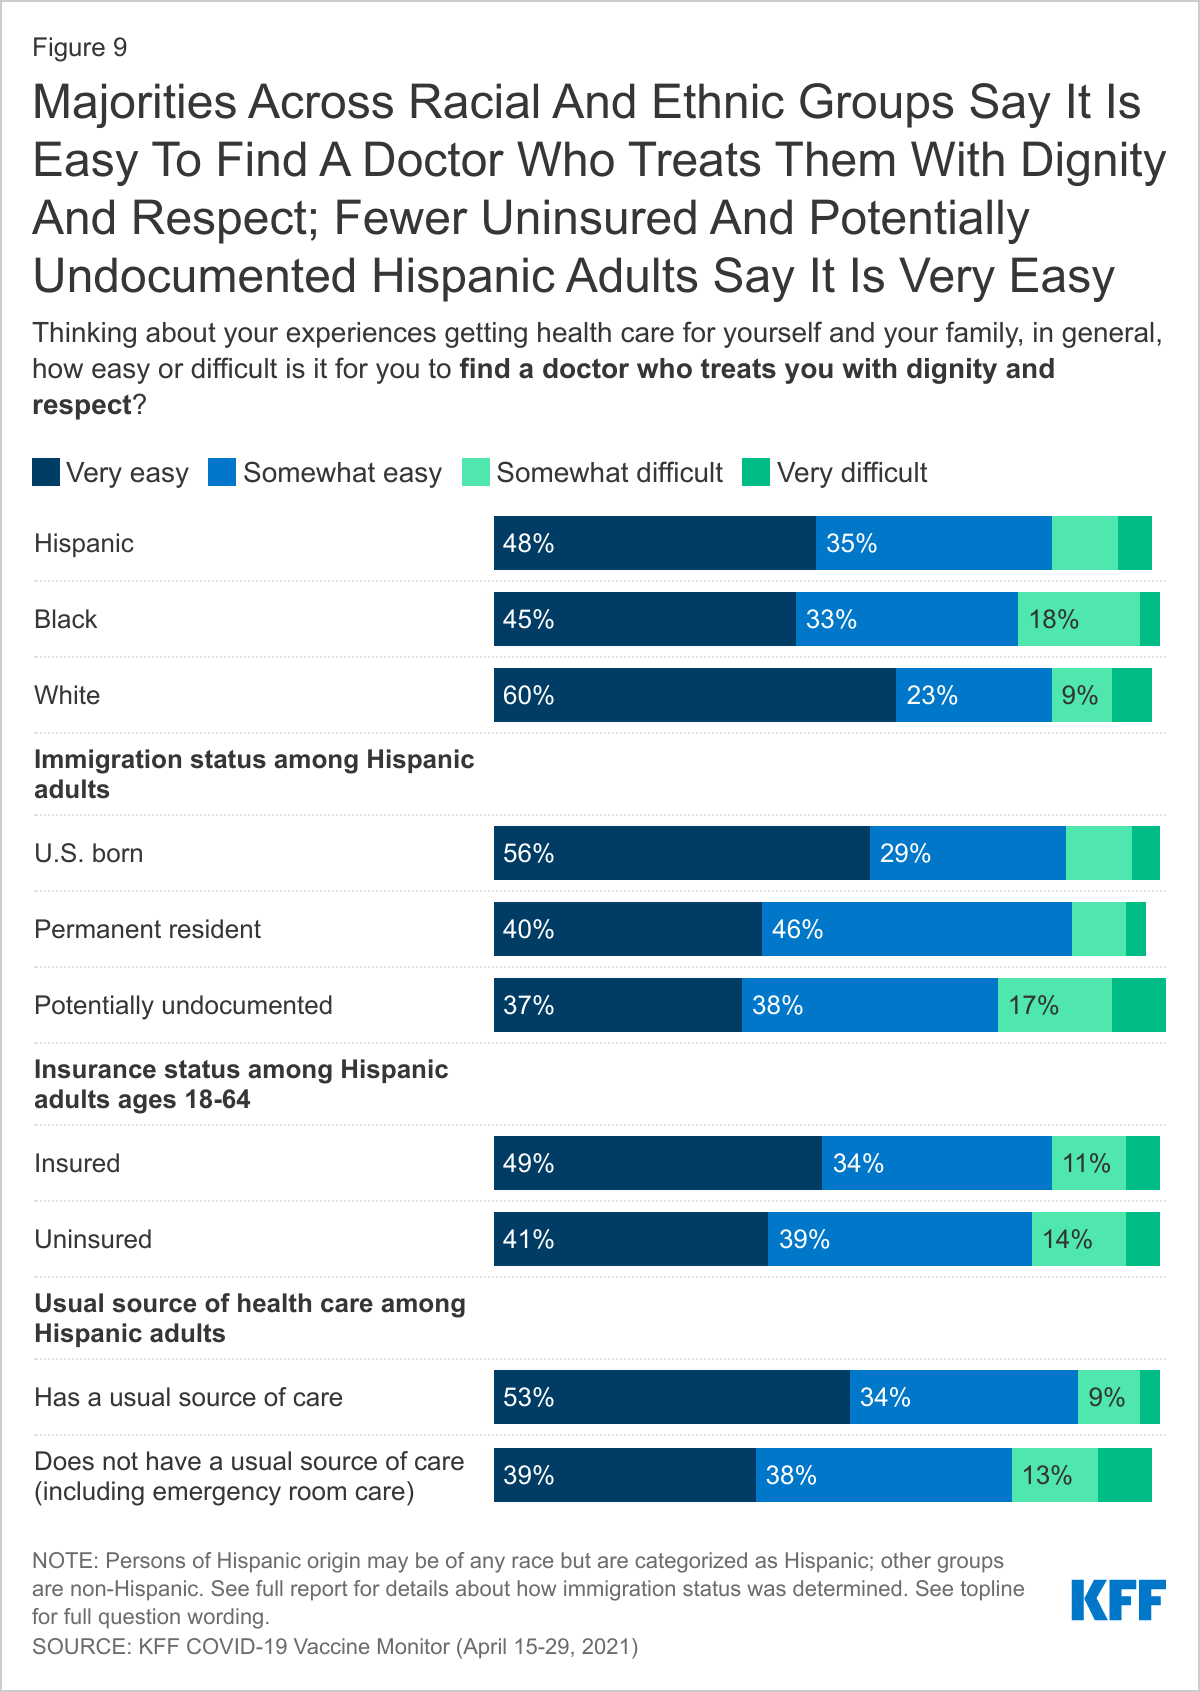
Most Hispanic adults (83%) say it is very or somewhat easy to find a doctor who treats them with dignity and respect, similar to the share of White adults (84%) who say so (Figure 9). However, about one in four (24%) potentially undocumented Hispanic adults say it is somewhat or very difficult, compared to 14% of U.S. born Hispanic adults and 11% of lawful permanent residents. Among nonelderly Hispanic adults, there are no significant differences in reported ease of finding a doctor who treats them with dignity and respect by insurance status. However, among Hispanic adults overall, those without a usual source of care are more likely to say it is very/somewhat difficult compared to those with a usual source of care (20% vs. 12%).

Majorities Across Racial And Ethnic Groups Say It Is Easy To Find A Doctor Who Treats Them With Dignity And Respect; Fewer Uninsured And Potentially Undocumented Hispanic Adults Say It Is Very Easy

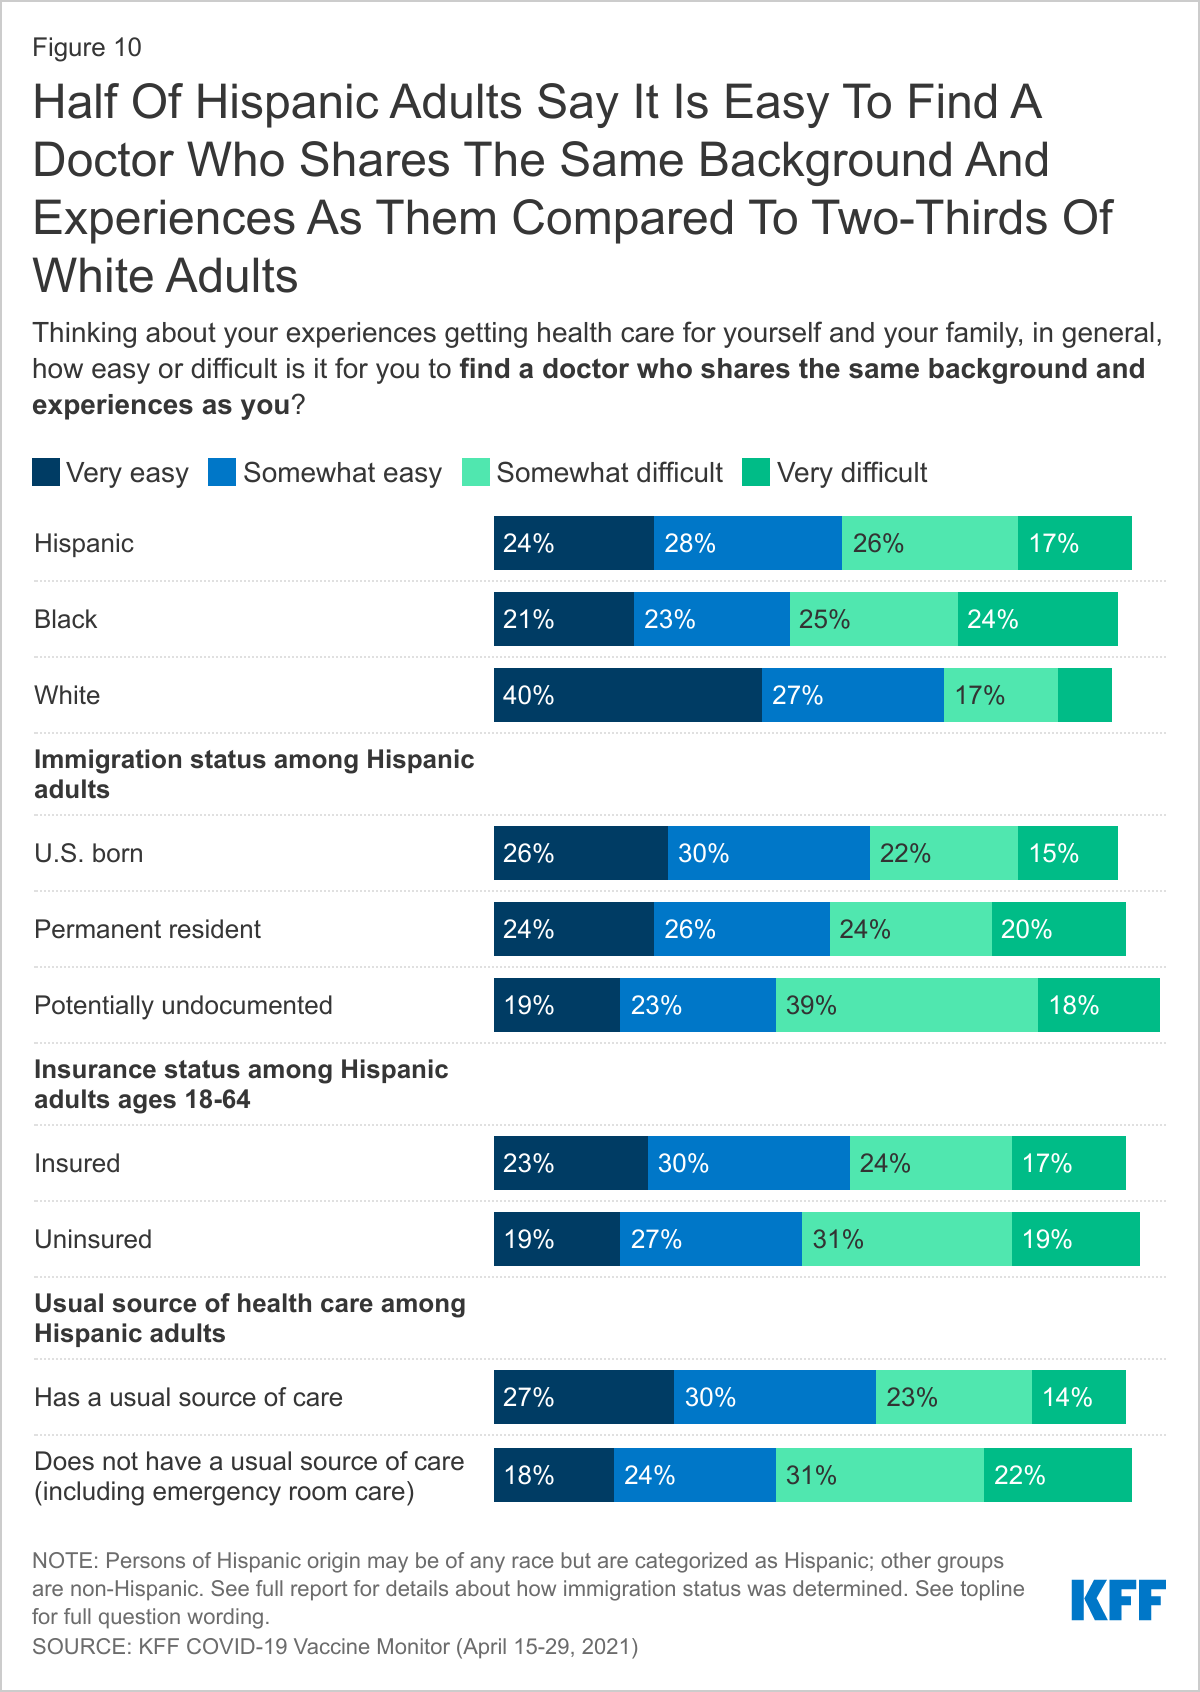
Just over half (52%) of Hispanic adults say it is easy to find a doctor with shared background and experiences to them versus over two-thirds (67%) of White adults (Figure 10). The share who say it is very or somewhat easy to find a doctor with shared background and experiences falls to 42% among potentially undocumented Hispanic adults compared to 56% of those who are U.S. born. Similar differences are observed among Hispanic adults based on whether they have a usual source of care, with 42% of those without a usual source of care saying it is very or somewhat easy compared to 56% of those with a usual source of care. Ease of finding a doctor with the same background and experiences does not vary by insurance status among nonelderly Hispanic adults.

Half Of Hispanic Adults Say It Is Easy To Find A Doctor Who Shares The Same Background And Experiences As Them Compared To Two-Thirds Of White Adults

Implications

Overall, these findings show that, consistent with research from prior to the pandemic, Hispanic adults are more likely to be uninsured than their White counterparts. They also are less likely to have a usual source of care other than an emergency room and to rely on community health centers as their source of care. Further, they are more likely than their White counterparts to say it is difficult to get to a location for health care. The findings further show that these access challenges generally are amplified among Hispanic adults who are foreign-born and uninsured. Beyond increased barriers to accessing care, the findings also highlight some challenges communicating with providers among Hispanic adults, particularly among those who are foreign-born and those without a usual source of care. These challenges include increased difficulty finding a doctor who explains things in a way that is easy to understand, finding a doctor with shared background and experiences, and linguistic access challenges for Spanish-speaking adults.

Despite having a higher uninsured rate and being less likely to have a usual source of care, Hispanic adults are not more likely than White adults say it is difficult to find affordable care. This finding may, in part, reflect the primary role community health centers play as a source of care among Hispanic adults. Community health centers provide comprehensive primary care as well as supportive services such as health education, translation, and transportation to patients who are disproportionately low-income, people of color, uninsured, or publicly insured. They provide these services regardless of patients’ ability to pay or immigration status and charge for services on a sliding fee scale. As such, health centers facilitate access to affordable, culturally and linguistically competent care and can help mitigate challenges to accessing care. This finding may also reflect that Hispanic adults are less likely than their White counterparts to utilize care. For example, other federal survey data show that a quarter of Hispanic adults have not seen a doctor in the past year, compared to less than one in five White adults.3 

The overall findings on Hispanic adults’ reported experiences and perceptions of care may reflect certain cultural norms, including an emphasis on politeness and conflict avoidance, and variations in expectations and experiences with the U.S. health care system. For example, research suggests that Hispanic people may give higher ratings to physicians and health plans despite worse health care experiences due to a cultural disposition to be deferential to those who are presumed to be of higher status. Moreover, immigrants may have lower expectations of the healthcare system based on prior experiences with health care in their countries of origin and less experience interacting with the U.S. health care system. Similarly, uninsured individuals’ reported experiences and perceptions of health care and health care system may reflect less interaction with the health care system.

Together these findings highlight the importance of addressing disparities in coverage, access to care, as well as in patient-provider communications for improving health and well-being of Hispanic adults. Further, they highlight the variation of experiences and needs within the Hispanic population which can help inform these efforts going forward. Addressing disparities in health and health care among the Hispanic population is of increasing importance given their growing share of the nation’s population and that they have been disproportionately affected by the COVID-19 pandemic.

Endnotes

  1. The survey used questions to determine the likely immigration status of respondents by asking those who were born outside the U.S. whether they were a permanent resident (i.e. had a green card) when they came to the U.S. or if their status had been changed to permanent resident since arriving. In the current survey, 18 percent of Hispanic adults said they have not been granted permanent resident status, indicating that they are likely to be undocumented immigrants, although this group may also include a small number of temporary lawful residents. ↩︎
  2. KFF analysis of 2019 National Health Interview Survey Data ↩︎
  3. Ibid. ↩︎

How Might the FDA’s Approval of a New Alzheimer’s Drug Impact Medicaid?

Authors: Rachel Dolan and Elizabeth Williams
Published: Jul 13, 2021

The recent approval of Aduhelm (aducanumab), which treats Alzheimer’s disease and carries an expected annual price tag of $56,000, has brought increased attention to high-cost drugs approved through the FDA’s accelerated approval pathway. While Medicare and its beneficiaries likely will be most impacted by the costs of the drug, as Alzheimer’s disease is most prevalent among older adults, the drug approval also has implications for Medicaid spending. Medicaid covers more than 80 million people, including many older adults who have not yet reached the age of Medicare eligibility. Medicaid will see increased costs through direct payment of Aduhelm for individuals who receive their drug coverage through Medicaid, as well as through potentially higher Medicare premium payments and cost-sharing for dual eligible beneficiaries (people eligible for both Medicare and Medicaid). Recent policy proposals targeted to accelerated approval drugs, as well as states actions to address coverage issues for very high-cost drugs in Medicaid, may mitigate the cost impact for Aduhelm, but challenges remain in addressing the impact of very high-cost drugs coming to market.

Despite rebates, Medicaid could face substantial costs for covering Aduhelm for enrollees who receive their prescription drug coverage through Medicaid. Because of the structure of the Medicaid Drug Rebate Program, Medicaid must cover nearly all FDA-approved prescription drugs, including those approved through the accelerated approval pathway, though the program receives substantial rebates on most drugs. Medicaid rebates vary for brand-name and generic drugs and also account for price increases over time. Applying the 23.1% base rebate for brand drugs to Aduhelm, the yearly net price would be reduced to approximately $43,000. In Medicaid, states and the federal government share in both drug spending as well as drug rebates received. Using the average of federal and state shares of spending and rebates, state net spending per year per enrollee for Aduhelm would be approximately $13,800, and federal net spending would be about $29,200.1  CBO analysis recently found that high-cost specialty drugs have an average base rebate (excluding inflation rebates) of 29%, so this calculation could underestimate the reduction in cost from rebates. In addition, rebates may increase if the drug’s price rises faster than inflation (Biogen has stated it will not raise the price for four years) or if other payers receive a discount higher than the minimum rebate, triggering the Medicaid “best price” rule.

Even though Medicaid enrollees account for a small share of people with Alzheimer’s disease, high per enrollee costs could lead Aduhelm to have a large aggregate impact on Medicaid drug spending. Nationally, 6 million people are estimated to have Alzheimer’s disease, though most receive their drug coverage through Medicare. Based on analysis of Medicaid drug utilization data, we estimate that approximately 67,000 Medicaid beneficiaries used current drugs for Alzheimer’s.2  If 25% of these beneficiaries switched to Aduhelm, the total net cost (post-rebate) would be approximately $720 million per year, states’ share of spending would be $230 million and the federal share would be $490 million. If 75% of these beneficiaries switched to Aduhelm, the total net cost would be more than $2 billion per year, which is 7% of current Medicaid net drug spending. States’ share of spending would be $695 million and the federal share would be $1.47 billion. These amounts could overestimate spending if fewer Medicaid beneficiaries switch drugs but could also underestimate spending because they do not account for beneficiaries with Alzheimer’s currently not using any drugs. Biogen has also announced a narrower prescribing policy for Aduhelm, which creates further uncertainty in how many beneficiaries would use the drug. Aduhelm is not a curative therapy, and costs could continue for multiple years for the program.

Policy proposals and state actions could further lower the cost of Aduhelm for Medicaid. A recent proposal recommended by MACPAC would increase the minimum rebate amount on accelerated approval drugs and would provide a further inflationary rebate if confirmatory trials are not completed in a specified amount of time. While the MACPAC proposal does not include specific rebate amounts, CBO scored the proposal assuming a 10 percentage point increase in the minimum rebate and a 20 percent increase in inflationary rebates.  Under this proposal, assuming the base rebate increases from 23.1% to 33.1%, total net spending would be $37,000 per enrollee per year based on the assumptions used above, of which approximately $12,000 would be state costs and $25,000 federal. States also may use utilization controls such as establishing clinical criteria for reimbursement and requiring prior authorization as they have for other high-cost drugs and those approved through the accelerated approval pathway, which would not lower the cost per person but would decrease the number of people receiving the drug.

Medicaid also will share in the costs of providing coverage and care to dual eligible enrollees, or people who are receive both Medicare and Medicaid. Medicaid provides some level of wrap-around assistance to approximately 12 million dual eligible Medicare enrollees, covering Medicare premiums and, in most cases, cost-sharing (Medicaid also provides full wraparound benefits to many dually eligible people). Aduhelm is covered under Medicare Part B as a physician-administered drug, making it subject to the 20% Medicare Part B cost-sharing that Medicaid covers for most dual eligible individuals. However, as allowed under federal rules, states may (and often do) pay the “lesser of” the Medicare cost-sharing amount or the difference between the Medicare payment and the Medicaid payment rate for the service, meaning states may not incur the entire 20% (or anything at all); if states do pay cost-sharing, they can also collect rebates for payments for the drugs, lowering their net cost.3 ,4  In addition, premiums for Medicare Part B may increase as a result of increased costs due to the drug, which would increase Medicaid payments on behalf of enrollees for whom Medicaid pays Medicare premiums. In 2019, the cost of Part B premiums to Medicaid was $19.7 billion in federal and state Medicaid spending, so even a small percentage increase could result in significant additional spending for Medicaid.5 

Other high-cost specialty drugs have had an impact on the Medicaid program, but Aduhelm stands out in that it is a high-cost maintenance drug without a verified clinical benefit that could potentially be widely-prescribed. Medicaid has covered other very costly outpatient drugs, including other maintenance drugs and curative therapies. Some drugs, such as antiretrovirals, drugs used to prevent and treat HIV, are both frequently prescribed in Medicaid and expensive, with list prices ranging between $20,000-$30,000 per year. Medicaid is the largest source of coverage for people with HIV and nearly 300,000 Medicaid enrollees are estimated to have HIV.  Other drugs carry one-time high cost, such as hepatitis C drugs, including Harvoni and Sovaldi, that entered the market at a list price of $84,000 for a single course of treatment. Although the hepatitis C population (around 2.5 million people in the U.S.) is smaller than the number of individuals with Alzheimer’s, a disproportionate share are enrolled in Medicaid, and despite state actions to limit costs, these drugs contributed to a 25% increase in Medicaid drug spending 2013-2014. Other accelerated approval drugs have carried very high sticker prices but have been targeted to relatively small populations: for example, a previous drug approved through the accelerated approval pathway in 2016, Exondys 51, for Duchenne muscular dystrophy also raised concerns with a cost of $300,000 per year or more. While the population impacted by the disease is extremely small, drug costs may be significant for Medicaid. The confirmatory trials were originally scheduled to be completed by 2020; however, they will not be completed until 2026, requiring Medicaid to cover the drug at least through that time.6 

Drug pricing remains on the policy agenda, and while the discussion remains focused on Medicare, expensive drugs, and proposed policies to address them, will also impact Medicaid. Other drugs may now seek approval through this pathway following on the success of Aduhelm’s approval which may have additional budgetary implications for Medicaid. States may also continue to seek alternatives to paying for expensive drugs approved through this pathway such as closed formularies, value-based agreements or restricting access through clinical criteria.

  1. Based on KFF analysis of CMS 64 data and MACSTATs, we estimate the federal government pays about 68% of drug costs and receives approximately 68.5% of rebates. MACPAC, Medicaid Drug Spending Trends, December 2020. https://www.macpac.gov/publication/medicaid-gross-spending-and-rebates-for-drugs-by-delivery-system/ ↩︎
  2. There were a total of 605,218 prescriptions for Alzheimer’s drugs in 2019. The median package is a 55 days supply. Analysis of utilization of the same Alzheimer’s drugs using Medicare data shows that 69.4% people used one drug, 26.6% used two, and 4.0% used three prescriptions, resulting in 67,754 people estimated to be using those prescriptions in Medicaid. ↩︎
  3. States can pay the “lesser of” the Medicare cost-sharing amount or the difference between the Medicare payment and the Medicaid rate for the service -most states pay using this lesser of formula. Medicaid and CHIP Payment and Access Commission. Effects of Medicaid coverage of Medicare cost sharing on access to care. In Report to Congress on Medicaid and CHIP: March 2015. Washington, DC: MACPAC. https://www.macpac.gov/wp-content/uploads/2015/03/Effects-of-Medicaid-Coverage-of-Medicare-Cost-Sharing-on-Access-to-Care.pdf ↩︎
  4. States can set payment rates for physician-administered drugs but to receive rebates the drug must be billed separately. Medicaid and CHIP Payment and Access Commission. Physician-administered drugs. https://www.macpac.gov/physician-administered-drugs/ ↩︎
  5. National Health Expenditure Accounts Table 05-5 reports $11.8 billion in federal spending and $7.9 billion in state spending in 2019. ↩︎
  6. MACPAC, Report to Congress on Medicaid and CHIP, June 2021. https://www.macpac.gov/wp-content/uploads/2021/06/June-2021-Report-to-Congress-on-Medicaid-and-CHIP.pdf ↩︎
News Release

Vaccine Monitor: Some Who Were Hesitant to Get a Vaccine in January Say They Changed Their Mind Because of Family, Friends and Their Personal Doctors

Published: Jul 13, 2021

A new KFF COVID-19 Vaccine Monitor report finds that people who were initially hesitant to get a vaccine in January but ultimately did so often say that family, friends and their personal doctors helped change their minds.

The report features a second round of interviews with a nationally representative sample of adults six months after they first shared their vaccine intentions in January, early in the nation’s vaccine distribution effort. The new survey assesses whether or not they got a COVID-19 vaccine, the reasons behind their choice, and how they feel about their decision.

Half initially told us that they planned on getting vaccinated as soon as possible or had already received at least one dose. Now two-thirds say have been vaccinated, including the vast majority (92%) of those who had planned to get vaccinated “as soon as possible” in January, along with slightly more than half (54%) of those who wanted to “wait and see.” At the same time, three quarters (76%) of those who previously said they would get vaccinated “only if required” or would “definitely not” get a COVID-19 vaccine remain unvaccinated.

Importantly, one in five (21%) of all adults are now vaccinated after expressing some level of hesitation in January, saying then that they planned on waiting to get vaccinated, would only get it if required, or would definitely not get vaccinated. Many in this group cite friends, family members, and their personal doctors as influencing their decision to get a vaccine. This includes seeing friends and family members get vaccinated without serious side effects (25%), pressure from friends and family (8%), being able to safely visit family members (3%), and conversations with their personal doctors (11%). Another one in ten (9%) say that easing of restrictions for vaccinated people was a factor.


In their own words: What did you learn or hear that persuaded you to get vaccinated?

“Not many side effects and others have been vaccinated” – 21 year old, male, white, independent, Georgia (“wait and see” in January)

“That it was clearly safe. No one was dying.” – 32 year old, male, white, Republican, South Carolina (“wait and see” in January)

“Five generations of our family are getting together in one week from now” – 68 year old, male, white, Democrat, California (“wait and see” in January)

“My Ob/Gyn advised it was safe to take while pregnant and/or trying to conceive and there are studies showing women who get pregnant that caught COVID had more hematological problems during and after birth” – 32 year old, female, white, independent, Alabama (“wait and see” in January)

In fact, some vaccinated adults cite protecting or being able to see their friends and family members as the main reason why they decided to get vaccinated. And two-thirds (65%) say they have personally tried to persuade friends and family members to get a shot.

One-third of all adults remain unvaccinated, including 16% of adults who had previously said they planned on getting vaccinated “as soon as possible” or wanted to “wait and see” see before getting a vaccine. When asked why they changed their minds, many cite the side effects of the vaccine as a key reason.


In their own words: What changed your mind?

“What’s changed my mind is people telling me how sick they got after they received the vaccination. I really don’t want to be sick from a vaccination so I kind of lost interest” – 54 year old, male, white, Republican, California (“ASAP” in January)

“I have allergies considering the possible risks. The risks in my opinion are not a chance I’m willing to take.” – 18 year old, male, Hispanic, Democrat, Florida (“ASAP” in January)

“My husband got the vaccine and he experienced a lot of side effects. I usually end of having some [or] all the listed side effects” – 42 year old, female, Hispanic, independent, California (“wait and see” in January)

Available through the Monitor’s online dashboard, the new report also quotes the open-ended responses given by many of those surveyed reflecting the diversity of their views and experiences related to their views and decision around vaccination.

The KFF COVID-19 Vaccine Monitor is an ongoing research project tracking the public’s attitudes and experiences with COVID-19 vaccinations. Using a combination of surveys and qualitative research, this project tracks the dynamic nature of public opinion as vaccine development and distribution unfold, including vaccine confidence and hesitancy, trusted messengers and messages, as well as the public’s experiences with vaccination.

Poll Finding

KFF COVID-19 Vaccine Monitor: In Their Own Words, Six Months Later

Published: Jul 13, 2021

Findings

The KFF COVID-19 Vaccine Monitor is an ongoing research project tracking the public’s attitudes and experiences with COVID-19 vaccinations. Using a combination of surveys and qualitative research, this project tracks the dynamic nature of public opinion as vaccine development and distribution unfold, including vaccine confidence and hesitancy, trusted messengers and messages, as well as the public’s experiences with vaccination.

Key Findings

At the beginning of 2021 as vaccine distribution began in the U.S., KFF conducted interviews with a nationally representative sample of adults using open-ended questions to better understand public concerns around receiving a COVID-19 vaccine. Six months later, we recontacted these individuals to find out whether they chose to receive a COVID-19 vaccine, their reasoning behind their decisions, and how they are feeling about their choice.

  • The vast majority (92%) of those who planned to get vaccinated “as soon as possible” in early 2021 have received at least one dose of a COVID-19 vaccine, as have slightly more than half (54%) of individuals who had previously said they wanted to “wait and see” before getting vaccinated. On the other hand, a majority (76%) of people who had previously said they would “only get vaccinated if required” or said they would “definitely not” get a COVID-19 vaccine remain unvaccinated.
  • One-fifth of adults (21%) now report being vaccinated after saying in January they planned on waiting to get vaccinated, would only get it if required, or would definitely not get vaccinated. Many of these individuals noted the role of their friends and family members as well as their personal doctors in persuading them to get a vaccine. Seeing their friends and family members get vaccinated without serious side effects, talking to family members about being able to safely visit, and conversations with their personal doctors about their own risks were all persuasive factors for these individuals. A small but meaningful share also say the easing of restrictions for vaccinated people was a factor in their decision to get a vaccine.
  • When asked to name the feeling that best describes how they feel now that they have been vaccinated, nearly a quarter of vaccinated adults offer responses around feeling safe (24%) and relieved (22%). Other positive feelings reported were freedom, confidence, and more certainty that if they did get COVID-19 it would be less serious or they were less likely to die from it. And while most respondents react with some positive emotion, one in ten said they felt the same or neutral. This feeling was more common among those who initially said they would “wait and see” in January or who said they would only get vaccinated if required or would not get vaccinated.
  • Conversations with family members and friends have played a major role in persuading people to get vaccinated. Two-thirds of vaccinated adults say they have tried to persuade their friends and family members to get a COVID-19 vaccine, and 17% of adults who are now vaccinated after saying in January they planned on waiting to get vaccinated, would only get it if required, or would definitely not get vaccinated, say they were persuaded to do so by a family member and 5% say they were persuaded by a friend. In addition to this, others cite protecting friends and family members as the main reason for getting vaccinated and others offer being able to see their friends and family members as well as family pressure or encouragement as the main reasons why they chose to receive a vaccine.
  • About one-fourth of those who previously said they planned on getting vaccinated “as soon as possible” or were wanting to “wait and see” before getting a vaccine, remain unvaccinated six months later. Some of these individuals either have an appointment to get a vaccine or still plan on getting it as soon as they are able, but one in ten (6% of total) now say they either will “only get vaccinated if required” or say they will “definitely not” get a vaccine. When asked what changed their mind, many offer concerns about the side effects of the vaccine as the reasons why they now do not plan on getting vaccinated.
  • Being concerned about side effects is the top reason offered by unvaccinated people for why they haven’t gotten a COVID-19 vaccine. When asked what would motivate them to get vaccinated against COVID-19, most in the “wait and see” group say they just want more time to see how the vaccine affects others who have already gotten it.

Vaccine Behavior Largely Matches Previous Intentions

Nine in ten (92%) of those who said back in January 2021 they would get vaccinated as soon as they were able now report, six months later, that they have received at least one dose of a COVID-19 vaccine. In addition, slightly more than half (54%) of those who were in the “wait and see” group back in January, say they have received a COVID-19 vaccine while 46% of adults in this group report not being vaccinated against COVID-19. A smaller share, one-fourth (24%) of those who said they would “only get vaccinated if required” or they would “definitely not” get vaccinated now report receiving at least one dose, while the majority (76%) of adults in this group say they remain unvaccinated.

Interactive DataWrapper Embed

Three-fourths (72%) of the most vaccine enthusiastic group (those who said they would get vaccinated as soon as they could back in January) say they received a COVID-19 vaccine more than two months ago, compared to a majority of vaccinated adults from the “wait and see” group who say they received their vaccine either less than one month ago (10%) or between one and two months ago (46%).

Overall nearly half of adults either were already vaccinated in January (8%) or had said they planned to get vaccinated as soon as possible and have now received at least one dose (39%). An additional one in five adults (21%) are now vaccinated after saying in January they planned on waiting to get vaccinated, would only get it if required, or would definitely not get vaccinated. One-third of adults remain unvaccinated after either planning to get it as soon as possible or were going to wait and see back in January (17%) or had said they were only going to get vaccinated if required or were definitely not getting a COVID-19 vaccine (16%).

Most Vaccine Behaviors Match What People Planned To Do Six Months Ago; One In Five Were Either Vaccine Hesitant Or Resistant And Have Gotten Vaccinated

What Made Some People Decide to Get vaccinated?

When the 21% of adults who are now vaccinated after saying in January they planned on waiting to get vaccinated, would only get it if required, or would definitely not get vaccinated are asked in their own words what they learned or heard that persuaded them to get vaccinated, many discussed the role of their friends and family members as well as their personal doctors in their decision.

A common response mentioned by one-fourth of these individuals was that seeing others, especially friends and family, get vaccinated without side effects made them decide to get a vaccine.

In their own words: What did you learn or hear that persuaded you to get vaccinated?

“Almost all of my friends were vaccinated with no side effects.” – 64 year old, female, black, Democrat, Tennessee (“wait and see” in January)

“Family members and friends who got vaccinated had no serious side effects. Lots of regulations got lifted for vaccinated people.” – 43 year old, female, Asian, independent, Massachusetts (“wait and see” in January)

“Not many side effects and others have been vaccinated” – 21 year old, male, white, independent, Georgia (“wait and see” in January)

“That it was clearly safe. No one was dying” – 32 year old, male, white, Republican, South Carolina (“wait and see” in January)

“I feel since our President got vaccinated & all is well with him, it was also safe for me.” – 75 year old, female, white, Democrat, Virginia (“wait and see” in January)

“I became convinced that some of the rumored side effects were not true” – 69 year old, male, white, independent, Colorado (“only if required” in January)

Others said they chose to get vaccinated either due to pressure from friends and family (8%), or they wanted to be able to safely visit with their friends and family members (3%).

In their own words: What did you learn or hear that persuaded you to get vaccinated?

“I went to visit my family members in another state and everyone there had been vaccinated with no problems so that encouraged me to go ahead and get vaccinated also I would the better protected and not a threat to them not being having it” – 63 year old, male, black, independent, Texas (“wait and see” in January)

“Friends and family talked me into it, as did my place of employment” – 28 year old, male, white, independent, Virginia (“definitely not” in January)

“My husband bugged me to get it and I gave in” – 42 year old, female, white, Republican, Indiana (“definitely not” in January)

“Five generations of our family are getting together in one week from now.” – 68 year old, male, white, Democrat, California (“wait and see” in January)

“My family persuaded me because of my sick kids” – 28 year old, female, Hispanic, Democrat, Texas (“wait and see” in January)

Another common response was that conversations with their doctors or health providers encouraged them to get vaccinated (11%).

In their own words: What did you learn or hear that persuaded you to get vaccinated?

“My doctor recommended it” – 70 year old, female, white, Democrat, Arizona (“definitely not” in January)

“My asthma doctor recommended I get it” – 64 year old, female, white, Republican, Texas (“wait and see” in January)

“My Ob/Gyn advised it was safe to take while pregnant and/or trying to conceive and there are studies showing women who get pregnant that caught COVID had more hematological problems during and after birth” – 32 year old, female, white, independent, Alabama (“wait and see” in January)

“My daughter is a doctor and she got vaccinated which was reassuring that it was okay to get vaccinated.” – 64 year old, female, Asian, Democrat, Texas (“wait and see” in January)

“I was nervous about breastfeeding while getting vaccinated, but then found out from doctors it's actually good to get vaccinated while breastfeeding because the babies will get antibodies also” – 28 year old, female, white, independent, Iowa (“wait and see” in January)

Half (52%) of those who were initially vaccine hesitant or resistant (saying in January they planned on waiting to get vaccinated, would only get it if required, or would definitely not get vaccinated) and have now received a COVID-19 vaccine say they heard or read something that persuaded them and more than one-third (36%) say they spoke with someone who persuaded them to get vaccinated.

Half Of Those Who Were More Vaccine Hesitant Say They Learned Or Heard Something Persuasive, More Than One-Third Say They Spoke With Someone Who Persuaded Them To Get A COVID-19 Vaccine

Most commonly, people reported talking to and being persuaded by a family member (17% of all previously vaccine hesitant or resistant individuals) or their own doctor or health care provider (10%), followed by a close friend (5%) or a co-worker or classmate (2%).

Many of those who said they were persuaded after talking to their own doctor mentioned their doctor encouraging them due to their own or a family member’s medical condition.

In their own words: What did they say that persuaded you to get vaccinated?

“Discussed my spouse’s immune system.” – 58 year old, male, white, Republican, Washington (“only if required” in January)

“I could not get treated for the lymphoma on my lower left leg unless I was vaccinated” – 78 year old, female, white, Republican, Missouri (“wait and see” in January)

“COVID causes lung damage not good with COPD” – 57 year old, male, white, independent, Pennsylvania (“wait and see” in January)

“I was told by my doctor that she strongly recommend I get the vaccine because I have diabetes.” – 47 year old, female, white, Republican, Florida (“wait and see” in January)

A small but meaningful share said the easing of restrictions for vaccinated people made them decide to get a vaccine.

In their own words: What did you learn or hear that persuaded you to get vaccinated?

 “Hearing that the travel quarantine restrictions would be lifted for those people that are vaccinated was a major reason for my change of thought. Also the possibility that business and other resources may be limited to non-vaccinated individuals was also a major factor.” – 43 year old, male, black, Democrat, Virginia (“wait and see” in January)

“To see events or visit some restaurants, it was easier to be vaccinated.” – 39 year old, male, white, independent, New Jersey (“only if required” in January)

“Bahamas trip required a COVID shot” – 43 year old, male, Hispanic, independent, Pennsylvania (“wait and see” in January)

Two-thirds (65%) of vaccinated adults, including many of those who were previously vaccine hesitant, say they have tried to persuade close friends or family members to get vaccinated.

What Made Some People Decide to Not Get vaccinated?

One-third of adults remain unvaccinated, including a quarter of adults who previously had said they planned on getting vaccinated “as soon as possible” or wanted to “wait and see” before getting a vaccine and remain unvaccinated six months later. Some of these individuals (3%) either have an appointment to get a vaccine or still plan on getting it as soon as they are able, but one in ten (6% of total) now say they either will only get vaccinated if required or say they will “definitely not” get a vaccine.

One In Ten Of Those Who Previously Said They Would Get Vaccinated "ASAP" Or Were Going To "Wait And See" Now Say They Will Either "Definitely Not" Get Vaccinated Or Will Only Get It If Required

When asked what changed their mind, many of these individuals offer concerns about the side effects of the vaccine as the reason why they now do not plan on getting vaccinated.

In their own words: What changed your mind?

“What's changed my mind is people telling me how sick they got after they received the vaccination I really don't want to be sick from a vaccination so I kind of lost interest” – 54 year old, male, white, Republican, California (“ASAP” in January)

“There’s still not enough data proving that the vaccine is effectively and definitely not enough data showing the side effects.” – 54 year old, female, black, Democrat, Arkansas (“wait and see” in January)

“I have allergies considering the possible risks. The risks in my opinion are not a chance I'm willing to take.” – 18 year old, male, Hispanic, Democrat, Florida (“ASAP” in January)

“My husband got the vaccine and he experienced a lot of side effects I usually end of having some all the listed side effects” – 42 year old, female, Hispanic, independent, California (“wait and see” in January)

“We are now starting to see adverse reactions, deaths and other problems with young people also. We do not know the long term effects on the body, reproduction etc.  it could take years to see that information come out” – 60 year old, male, white, Republican, Delaware (“wait and see” in January)

For some, others’ views of the pandemic influenced their decisions to not get vaccinated, with several people offering responses about the pandemic being exaggerated and no longer feeling that a vaccine was necessary.

In their own words: What changed your mind?

“COVID was not the pandemic it was made out to be and I am not getting vaccinated for it” – 26 year old, female, white, Republican, Iowa (“ASAP” in January)

“This event seems more and more just like the flu. Everyone is exposed and has the same chance of getting it. I never got a flu vaccine either. This whole mask thing is a joke. Most people wear them beneath their nose or even chin. This event is over for me except as mandated to me by those above me who control me in some way such as employer.” – 58 year old, male, black, independent, Alabama (“wait and see” in January)

“My daughter has had covid and I never tested positive or showed symptoms, and she never had symptoms.  My thought is I am either immune or I have antibodies.  My other thought is that we didn't have it and they made the numbers grow by false positive tests.” – 28 year old, female, white, Republican, Tennessee (“wait and see” in January)

The Experiences Of Vaccinated Adults

When adults who have received at least one dose of a COVID-19 vaccine were asked how they feel now they have been vaccinated, the most common responses were about feeling safe and relieved. One-fourth (24%) of vaccinated adults say they felt “safe” or some variation after being vaccinated, with a similar share (22%) offering responses that they felt relieved. Other positive feelings reported were those of freedom, confidence, and more certainty that if they did get COVID-19, it would be less serious, or they were less likely to die from it.

In their own words: What feeling best describes how you feel now that you have been vaccinated?

“Relief....I am a cancer guy and my immune system is compromised, so getting the vaccine is great news for me.” – 81 year old, male, white, independent, Washington (“ASAP” in January)

“I feel relieved and hopeful.” – 64 year old, female, black, Democrat, Tennessee (“wait and see” in January)

“There is no difference in my body or my mind, I just feel safer and more confident to go out to public places although I still wear a mask, where is it necessary.” – 33 year old, female, Hispanic, independent, Arkansas, (“wait and see” in January)

While most respondents reacted with some positive emotion, another one in ten said they felt the same or neutral. Others offered responses about not experiencing any or only mild side effects as a result of the vaccinations, while some were excited about the “return to normal.” A much smaller share expressed a negative emotion (about 1% of vaccinated adults).

Vaccinated Adults Feel Safer, Relieved, And Other Positive Emotions After Vaccination; One In Ten Feel No Different

Those who initially said they would “wait and see” in January were less likely than those most enthusiastic about the vaccine (“as soon as possible” in January) to say they felt relief (14% vs. 29%), and more likely to express feeling the same or neutral about getting vaccinated (19% vs. 5%).

In their own words: What feeling best describes how you feel now that you have been vaccinated?

 “In order to protect my family and myself, I chose to get vaccinated.” – 57 year old, female, black, Democrat, Kentucky (“wait and see” in January)

“Required for work.” – 27 year old, female, black, independent, South Carolina (“only if required” in January)

“Meh!!!” – 69 year old, male, white, independent, Illinois (“wait and see” in January)

More than a quarter of vaccinated adults say the main reason they chose to get vaccinated was to protect themselves or reduce their own risk (27%), while another 16% mentioned they were afraid of getting COVID-19 and wanted to avoid getting sick. One in ten respondents cited being at risk of getting sick due to their age or other health condition as their reason for getting vaccinated. Others wanted to protect their family members (7%) or protect others around them and help with herd immunity (6%).

In their own words: What is the main reason you chose to get vaccinated?

“To stop being afraid of getting it, afraid of the huge medical bills, to go back to normal, to protect others.” – 31 year old, female, white, Democrat, Nevada (“wait and see” in January)

“Protect my family from this deadly virus.” – 39 year old, male, black, Democrat, Virginia (“as soon as possible” in January)

“Because I had COVID already so the vaccine will only help me double.” – 20 year old, male, Hispanic, independent, Florida (“definitely not” in January)

Many Who Got Vaccinated Chose To Do So To Protect Themselves And Avoid Getting Sick

Those who previously had said they were going to “wait and see” offer similar reasons for getting vaccinated as the vaccine enthusiastic group but were slightly less likely to say they got vaccinated to protect themselves (21% vs. 33%), and slightly larger shares offer reasons related to not having to wear a mask anymore (5% vs. 0%) and because of encouragement or pressure from family members (6% vs. 1%).

In their own words: What is the main reason you chose to get vaccinated?

 “My holistic Dr. recommended it.” – 61 year old, female, white, Republican, Connecticut (“wait and see” in January)

“I wanted to start living my life and start traveling and stop wearing masks.” – 27 year old, female, black, Democrat, Ohio, (“wait and see” in January)

“To shut the wife up.” – 65 year old, male, white, Republican, Michigan (“wait and see” in January)

Reasons For Getting Vaccinated Vary Slightly By Previous Vaccine Intention

One of the most common responses among the more vaccine resistant group who have received a vaccine were about getting vaccinated in order to travel or being required to due to a job.

In their own words: What is the main reason you chose to get vaccinated?

“I am an educator and we needed to re-open schools.” – 51 year old, female, white, Democrat, Kentucky (“definitely not” in January)

“To be able to travel.” – 35 year old, male, black, Democrat, Virginia (“only if required” in January)

“Limited options without it.” – 51 year old, male, white, independent, New York (“only if required” in January)

Why Some Adults Remain Unvaccinated

When those who remain unvaccinated were asked about their main reason for not getting a COVID-19 vaccine, the most commonly offered reasons are around concerns about side effects (21%), followed by concerns that the vaccine was too new, too unknown, or not tested enough (16%). One in ten (12%) offer they haven’t gotten vaccinated because they don’t think they need the vaccine. Smaller, but still significant shares, say they haven’t gotten vaccinated because they just want to wait and see (7%), they don’t trust the vaccine and don’t normally get vaccines (7%), have a medical condition which prevents them from receiving a COVID-19 vaccine (7%), or think COVID-19 is not that bad or that the vaccine is worse (7%).

Concerns Over Side Effects, Newness Of Vaccine As Well As Perceptions About Not Needing The Vaccine Are Top Reasons Provided For Not Getting A COVID-19 Vaccine

Being concerned about side effects was also the top reason back in January why people said they may not get vaccinated. The latest report finds one-fifth of unvaccinated adults still offer concerns over possible side effects as the main reason why they haven’t gotten a COVID-19 vaccine.

In their own words: What is the main reason you have not gotten a COVID-19 vaccine?

“My husband got the vaccine and all the side effects. I cannot be sick, I am the rock of the family” – 42 year old, female, Hispanic, independent, California (“definitely not”)

“I’m scared of the side effects” – 20 year old, female, black, independent, Texas (“only if required”)

“I’m a little nervous knowing the possibility of side effects. I know it’s probably beneficial to my health, I just wanted to wait a little longer” – 43 year old, male, white, Republican, Arizona (“ASAP”)

“I didn’t want to get sick” – 26 year old, female, black Hispanic, Democrat, Florida (“definitely not”)

Another one of the most commonly offered reason for not getting vaccinated were concerns that the vaccine was too new, too unknown, or not tested enough. This was one of the top reasons offered across vaccine intention groups.

In their own words: What is the main reason you have not gotten a COVID-19 vaccine?

“Because I do not trust the vaccine safety and I’ve also heard and seen about side effects” – 22 year old, female, white, Republican, Arkansas (“definitely not”)

“Because it’s an experimental drug” – 59 year old, female, white, Republican, Texas (“definitely not”)

“I am not sure about it yet. I don't feel it was properly tested and there are so many different stories, good and bad, that I don't know what to believe anymore” – 44 year old, male, Hispanic, independent, California (“only if required”)

“I do not believe there has been adequate testing to show that this is a safe vaccine for everyone and every preexisting condition” – 51 year old, female, white, independent, North Carolina (“definitely not”)

“I feel as if it’s fairly new and not enough research has been done” – 40 year old, female black, Democrat, Pennsylvania (“only if required”)

Some unvaccinated people say they don’t see the benefit of getting vaccinated either because they do not think they are at risk of getting sick from the virus, or that they already had COVID-19.

In their own words: What is the main reason you have not gotten a COVID-19 vaccine?

“As a young and healthy person, I don’t think I need it” – 34 year old, male, black, independent, Mississippi (“only if required”)

“Benefit not worth the risks” – 55 year old, male, white, independent, Minnesota (“definitely not”)

“Didn’t feel the need!” – 26 year old, female, white, independent, Alabama (“only if required”)

“I don’t believe contracting COVID is a death sentence. We blew this entire pandemic out of proportion.” – 46 year old, male, white, Republican, Massachusetts (“definitely not”)

“I had the virus, I have antibodies.” – 50 year old, female, white, Republican, Nebraska (“only if required”)

“I had COVID for 3 weeks recently. I will have antibodies for a while. I also do not believe the vaccine(s) are true vaccines with antibodies. I've checked the CDC lists of ingredients and many are toxic, and they mess with RNA. I believe it's mainly about making money.” – 60 year old, female, white, independent, Montana (“definitely not”)

many unvaccinated Adults Just Want to Wait and See

As millions of adults in the U.S. have received a COVID-19 vaccine and access to vaccines has increased throughout the country, the share of adults who say they either will get vaccinated “as soon as possible” or want to “wait and see” before getting vaccinated has decreased to about one in eight adults. Few adults (9%) say they are now “more motivated” to get vaccinated than they were six months ago while most (65% of all unvaccinated adults and 60% of those in the “wait and see” group from January) say they have the same level of motivation now to get vaccinated as they did six months ago. About a quarter across groups say they are “less motivated” to get vaccinated than they were six months ago.

Interactive DataWrapper Embed

Among those who are still unvaccinated but are not resistant to getting vaccinated (now say they either plan to get it ASAP or are wanting to wait and see), about four in ten say they plan on waiting more than a year before getting a COVID-19 vaccine, while about three in ten (28%) say they plan on getting vaccinated within the next three months and an additional third say they will get vaccinated between 4 months and a year. Many adults in this group (unvaccinated adults who say they either plan to get it ASAP or are wanting to wait and see) offer side effects as the main reason why they have not gotten vaccinated yet.

In their own words: What is the main reason you have not gotten a COVID-19 vaccine?

“A lot of people have negative reactions to the vaccines and some die. I'm not willing to risk my life for a vaccine that you need yearly.” – 64 year old, female, white, independent, Ohio (“wait and see”)

“A little bit scared because of the side effect.” – 69 year old, female, Hispanic, Democrat, Florida (“ASAP”)

“Bad side effects. Will wait a year and then decide.” – 67 year old, male, white, Republican, New York (“wait and see”)

“It’s too soon to tell if it is safe. Not worth the risk” – 19 year old, female, black, independent, Indiana (“wait and see”)

“Not comfortable with unknown long-term possible side effects.” – unknown age, female, black, Delaware (“wait and see”)

“The ‘product’ was rushed into production, it is probably flawed and we have not seen these flaws.” – 57 year old, male, white, Republican, Texas (“wait and see”)

“Unsure about possible side effects, concerns over massive Johnson and Johnson recall.” – 38 year old, female, white, Democrat, Florida (“wait and see”)

When those who say they want to “wait and see” before getting vaccinated are asked what, if anything, would motivate them to get vaccinated against COVID-19, few tangible motivations are mentioned. Most of these individuals say they just want more time to see how the vaccine affects others who have already gotten it. A few individuals explicitly mention wanting full FDA approval, a motivation found in previous KFF COVID-19 Vaccine Monitor reports.

In their own words: What, if anything, would motivate you to get fully vaccinated against COVID-19? (among those who are “wait and see”)

 “Time and proof that it is working and has no lasting negative effects on the body.” – 60 year old, female, white, Republican, Washington

“Only time will motivate me.” – 44 year old, female, Asian, Democrat, North Carolina

“Years of study and an idea about possible long term effects of the vaccine. There is only Emergency Use Authorization for the vaccines. Not full approval for use as they have literally not completed the full testing process.” – 54 year old, male, white, Republican, Kentucky

“Waiting to see if people have any adverse effects” – 44 year old, female, black, Democrat, West Virginia

“Read more reports from people who have taken the vaccine and investigate if they had side effects.” – 81 year old, male, Hispanic, Democrat, Texas

Methodology

This KFF COVID-19 Vaccine Monitor: In Their Own Words, Six Months Later was designed and analyzed by public opinion researchers at the Kaiser Family Foundation (KFF). The survey was conducted June 15-23, 2021 using the SSRS Opinion Panel, a nationally representative panel of U.S. adults age 18 or older recruited using probability-based sampling techniques. For the Kaiser Family Foundation, SSRS re-invited adult panelists in the U.S. who previously participated in a survey in January 14-18, 2021. The original sampling targeted panel respondents by gender, age, race, education, and region. SSRS regularly monitored data collection to check for demographic composition of the sample and data quality. Cases determined to be poor-quality, as defined by surveys with a length of interview of less than 33% of the mean length of interview and with invalid text responses were removed from the final data. In total, 1,009 panelists were invited to participate in this follow-up survey and 878 respondents completed the full questionnaire online on June 15-23, 2021 with additional follow-ups conducted on July 2,2021. 859 surveys were completed in English and 19 surveys were completed in Spanish. Panelists were compensated for their participation, with incentives distributed by the SSRS Opinion Panel through their standard procedures.

The margin of sampling error including the design effect for the full sample is plus or minus 4 percentage points. Numbers of respondents and margins of sampling error for key subgroups are shown in the table below. For results based on other subgroups, the margin of sampling error may be higher. Sample sizes and margins of sampling error for other subgroups are available by request. Note that sampling error is only one of many potential sources of error in this or any other public opinion poll. Kaiser Family Foundation public opinion and survey research is a charter member of the Transparency Initiative of the American Association for Public Opinion Research.

GroupN (unweighted)M.O.S.E.
Total878± 4 percentage points
Total who have gotten a COVID-19 vaccine632± 5 percentage points
Total who have not gotten a COVID-19 vaccine246± 8 percentage points
January Vaccine Intentions
As soon as they can395± 6 percentage points
Wait and see242± 8 percentage points
Only if required/ Definitely not getting a vaccine168± 10 percentage points
June Vaccine Intentions
Only if required/ Definitely not getting a vaccine161± 10 percentage points

Medicaid Emergency Authority Tracker: Approved State Actions to Address COVID-19

Published: Jul 1, 2021

During the COVID-19 Public Health Emergency, states used a number of Medicaid emergency authorities to address the coronavirus emergency. Between March 2020 and July 2021 we tracked details on Medicaid Disaster Relief State Plan Amendments (SPAs), other Medicaid and CHIP SPAs, and other state-reported administrative actions; Section 1115 Waivers; Section 1135 Waivers; and 1915 (c) Waiver Appendix K strategies. This page aggregates tracking information on approved Medicaid emergency authorities. This page was last updated July 1, 2021 and is no longer being updated.

Contents of Tracker:

Visit our State Data and Policy Actions COVID-19 Tracker for additional data on state responses to COVID-19, and our special coronavirus topic page for all our resources.

Approved Medicaid Emergency Authorities as of July 1, 2021

(back to top)

>


Medicaid and CHIP State Plan Amendments and Other State-Reported Administrative Actions to Address COVID-19: This table summarizes changes approved through Medicaid Disaster Relief SPAs and other Medicaid and CHIP SPAs based on approvals posted to Medicaid.gov, and also includes information on state-reported administrative actions to respond to COVID-19 based on review of state Medicaid agency and other state-level websites. CMS provided a template for states to request approval of Medicaid Disaster Relief State Plan Amendments (SPAs) related to the COVID-19 National Emergency. The Disaster Relief SPA allows states to make temporary changes to their Medicaid state plans and address access and coverage issues during the COVID-19 emergency. States can also make changes through traditional SPAs and can implement changes under existing authority that do not require SPA approval. (Note that some state-reported actions may require and/or are pending SPA approval.) Data under the “Telehealth” header are provided by Manatt Health (for more information see notes below the table). While this table captures state-reported actions taken in response to the COVID-19 emergency, there is considerable variation across states and states may have adopted policy options prior to the emergency that are not reflected here.


SPA and Other Administrative Actions to Address COVID-19 as of July 1, 2021

(back to top)

>


Section 1115 Waivers to Address COVID-19: In response to the COVID-19 public health emergency, CMS developed a new Medicaid Section 1115 demonstration opportunity and application template. These demonstrations can be used to extend HCBS flexibilities available under 1915 (c) home and community-based services waiver Appendix K (separately detailed in this tracker) to beneficiaries receiving long-term services and supports (LTSS) under SPA authorities (such as 1915 (i) state plan HCBS and 1915 (k) Community First Choice) and to allow for applicant self-attestation of resources for the purpose of determining eligibility for certain groups. States must complete a final monitoring and evaluation report one year after the demonstration ends. These demonstrations could be retroactive to March 1, 2020 and will expire no later than 60 days after the end of the public health emergency.


Approved Section 1115 Waivers to Address COVID-19 as of July 1, 2021

(back to top)

>


Section 1135 Waivers to Address COVID-19: If the President has declared an emergency or disaster and the Secretary of Health and Human Services (HHS) has declared a public health emergency, the Secretary can use Section 1135 authority to waive or modify certain Medicare, Medicaid, and CHIP requirements to ensure that sufficient health care items and services are available to meet the needs of Medicaid enrollees in affected areas. On March 13, 2020, President Trump issued a proclamation that the COVID-19 outbreak in the United States constitutes a national emergency, beginning March 1, 2020.  After this declaration, the Center for Medicare and Medicaid Services (CMS) issued blanket Section 1135 waivers for many Medicare provisions. Additionally, states were able to submit to CMS for approval Section 1135 waivers for Medicaid provisions. These approved state waivers are summarized in the table below.


Approved Section 1135 Waivers to Address COVID-19 as of July 1, 2021

(back to top)

>


Section 1915 (c) Waiver Appendix K Strategies to Address COVID-19: Most Medicaid home and community-based services (HCBS) are provided through Section 1915 (c) waivers. Other states use Section 1115 to authorize HCBS that could have been provided under Section 1915 (c). The table below includes Appendix K approvals for both 1915 (c) and 1115 HCBS waivers. States can use Section 1915 (c) waiver Appendix K to amend either of these HCBS waivers to respond to an emergency. For example, states can modify or expand HCBS eligibility or services, modify or suspend service planning and delivery requirements, and adopt policies to support providers. CMS posted a sample Appendix K template for COVID-19 for COVID-19 waiver amendment requests. Per updated guidance in December 2020, CMS may extend emergency authorities adopted under Appendix K through up to six months after the public health emergency ends.


Approved Section 1915 (c) Waiver Appendix K Strategies to Address COVID-19 as of July 1, 2021

(back to top)

>

Intersection of State Abortion Policy and Clinical Practice: June 2021 Update

Published: Jul 1, 2021

This infographic updates a prior JAMA infographic that presents state policies related to abortion and their intersection with clinical practice. The graphic highlights state-level abortion specific policies, ranging from waiting period laws to medication abortion requirements.

These charts highlight the 24% decrease in the abortion rate between 2009 to 2018, the 18 states that have jail sentences for providers that perform abortions beyond their state’s gestational limit, and the many states that restrict abortion access by placing limits on the provision of medication abortion, banning insurance coverage of abortion in private and Medicaid plans, and enforcing policies such as waiting periods, and requiring patients to be counseled on topics about abortion harms that are unsupported by medical evidence.

View Source Slides

House Appropriations Committee Releases the FY22 State and Foreign Operations (SFOPs) Appropriations Bill

Published: Jun 30, 2021

The House Committee on Appropriations released its FY 2022 State, Foreign Operations, and Related Programs (SFOPs) appropriations bill on June 28, 2021 and accompanying report on June 30, 2021. The SFOPs bill includes funding for U.S. global health programs at the State Department and the U.S. Agency for International Development (USAID). Funding for these programs, through the Global Health Programs (GHP) account, which represents the bulk of global health assistance, totaled $10.6 billion, an increase of $1.4 billion (16%) above the FY 2021 enacted level and $591 million (6%) above President Biden’s FY 2022 request, which was released on May 28, 2021. The bill provides higher levels of funding for almost all program areas compared to both the FY 2021 enacted level and the FY 2022 request, with global health security receiving most of the increase. Key highlights are as follows (Unless otherwise specified, funding comparisons are for the GHP account only. See Table for additional detail on global health funding):

  • Funding for global health security totals $1 billion, an increase of $810 million (426%) above the FY 2021 enacted level ($190 million) and $95 million (10%) above the FY 2022 request ($905 million).
  • Bilateral HIV funding through the President’s Emergency Plan for AIDS Relief (PEPFAR) is $4,850 million ($4,520 million through State and $330 million through USAID), $150 million (3%) above the FY 2021 enacted level and FY 2022 request.
  • The House bill includes $1,560 million for the U.S. contribution to the Global Fund to Fight AIDS, Tuberculosis and Malaria (Global Fund), matching the FY 2021 enacted level and FY 2022 request. The Global Fund was the only area that did not increase.
  • Funding for tuberculosis (TB) totals $469 million, $150 million (3%) above the FY 2021 enacted level and FY 2022 request ($319 million).
  • Funding for malaria totals $820 million, $50 million (6%) above the FY 2021 enacted level and FY 2022 request ($770 million).
  • The House bill includes $880 million for maternal and child health (MCH), $24.5 million (3%) above the FY 2021 enacted level ($865.5 million) and essentially matching the FY 2022 request ($879.5 million). Specific areas under MCH include:
    • Gavi, the Vaccine Alliance funding totals $290 million, matching the FY 2021 enacted and FY 2022 request levels.
    • Polio funding totals $65 million, matching the FY 2021 enacted level. The President’s FY 2022 request did not specify funding for polio.
    • Funding for the U.S. contribution to the United Nations Children’s Fund (UNICEF) provided through the International Organizations and Programs (IO&P) account totals $139 million, matching the FY 2021 enacted level and FY 2022 request.
  • Funding for nutrition totals $160 million, $10 million (7%) above the FY 2021 enacted level and FY 2022 request ($150 million).
  • Bilateral family planning and reproductive health (FP/RH) funding totals $760 million in the House FY22 SFOPs bill, all of which is provided through the GHP account. This amount is $185 million (32%) above the FY 2021 enacted level ($575 million, of which $524 million is through the GHP account and $51 million is through the ESF account) and $176 million (30%) above the FY 2022 request ($584 million, of which $550 million is through the GHP account and $33.7 million is through the ESF account).
  • Funding for the United Nations Population Fund (UNFPA) totals $70 million, $37.5 million (115%) above the FY 2021 enacted level ($32.5 million) and $14 million (25%) above the FY 2022 request. The House FY 2022 bill notes that if this funding is not provided to UNFPA it “shall be transferred to the ‘Global Health Programs’ account and shall be made available for family planning, maternal, and reproductive health activities.”
  • Funding for the vulnerable children program totals $30 million, $5 million (20%) above the FY 2021 enacted level and FY 2022 request ($25 million).
  • Funding for neglected tropical diseases (NTDs) totals $112.5 million, $10 million (10%) above the FY 2021 enacted level and FY 2022 request ($102.5 million).
  • The House bill states that up to $90 million may be made available through the GHP account for the Emergency Reserve Fund, a mechanism that is used to quickly respond to emerging infectious disease outbreaks. The FY 2022 request provided $90 million for the Emergency Reserve Fund through the GHP account.

The SFOPs bill also includes the following policy provisions:

  • Removes the Helms amendment restrictions, which prohibit the use of foreign assistance to pay for the performance of abortion as a method of family planning or to motivate or coerce any person to practice abortion (see KFF fact sheet on major statutory requirements and policies pertaining to U.S. global FP/RH efforts here).
  • Repeals the Mexico City Policy (see KFF explainer here).
  • Provides the authority to transfer an amount “not to exceed an aggregate total of $200,000,000 of the funds appropriated by this Act” for international infectious disease outbreaks.
  • States that an unspecified amount of funding from the GHP account “may be made available for a contribution to an international financing mechanism for pandemic preparedness.”

Resources:

  • House FY 2022 State, Foreign Operations, and Related Programs (SFOPs) Appropriations Bill – Text
  • House FY 2022 State, Foreign Operations, and Related Programs (SFOPs) Appropriations Bill – Report

The Table (.xls) below compares global health funding in the FY 2022 House bill to the FY 2021 enacted funding amounts as outlined in the “Consolidated Appropriations Act, 2021” (P.L. 116-260; KFF summary here) and the FY 2022 request (KFF summary here).

See the KFF budget tracker for details on historical annual appropriations for global health programs.

Note: Some funding amounts (e.g. global health funding provided through the Economic Support Fund account at USAID) will be determined at the agency level, and are not earmarked by Congress in the SFOPs appropriations bill.

Table: KFF Analysis of FY22 House Appropriations for Global Health
Department / Agency / AreaFY21Enactedi(millions)FY22Request(millions)FY22Houseii(millions)Difference(millions)
FY22 House– FY21 EnactedFY22 House– FY22 Request
State, Foreign Operations, and Related Programs (SFOPs) – Global Health
HIV/AIDS$4,700.0$4,700.0$4,850.0$150 (3%)$150 (3%)
State Department$4,370.0$4,370.0$4,520.0$150(3%)$150(3%)
USAID$330.0$330.0$330.0$0(0%)$0(0%)
of which Microbicides$45.0$45.0$45.0$0(0%)$0(0%)
Global Fund$1,560.0$1,560.0$1,560.0$0 (0%)$0 (0%)
Tuberculosisiii$321.0 – –
Global Health Programs (GHP) account$319.0$319.0$469.0$150(47%)$150(47%)
Economic Support Fund (ESF) accountNot specified$2.0Not specified – –
Malaria$770.0$770.0$820.0$50 (6%)$50 (6%)
Maternal & Child Health (MCH)iv$1,039.5 – –
GHP account$855.5$879.5$880.0$24.5(3%)$0.5(<1%)
of which Gaviv$290.0$290.0$290.0$0(0%)$0(0%)
of which Polio$65.0$65.0$65.0$0(0%)$0(0%)
UNICEFvi$139.0$139.0$139.0$0(0%)$0(0%)
ESF accountNot specified$21.0Not specified – –
of which PolioNot specified$0.0Not specified – –
Nutritionvii$154.8 – –
GHP account$150.0$150.0$160.0$10(7%)$10(7%)
ESF accountNot specified$4.0Not specified – –
AEECA accountNot specified$0.8Not specified – –
Family Planning & Reproductive Health (FP/RH)viii$607.5$639.7$830.0$222.5 (37%)$190.3 (30%)
Bilateral FP/RHviii$575.0$583.7$760.0$185(32%)$176.3(30%)
GHP accountviii$524.0$550.0$760.0$236(45%)$210(38%)
ESF accountviii$51.1$33.7Not specified – –
UNFPAix$32.5$56.0$70.0$37.5(115%)$14(25%)
Vulnerable Children$25.0$25.0$30.0$5 (20%)$5 (20%)
Neglected Tropical Diseases (NTDs)$102.5$102.5$112.5$10 (10%)$10 (10%)
Global Health Security –$913.3 – – –
GHP account$190.0$905.0$1,000.0$810(426%)$95(10%)
USAID GHP accountx$190.0$655.0$1,000.0$810(426%)$345(53%)
State GHP accountxi –$250.0 – –
ESF accountNot specified$8.3Not specified – –
Emergency Reserve Fundxii$90.0xii – –
SFOPs Total (GHP account only)$9,196.0$10,051.0$10,641.5$1,445.5 (16%)$590.5 (6%)
Notes:
i – The FY21 final bill includes a provision giving the Secretary of State the ability to transfer up to $200,000,000 from the ‘Global Health Programs’, ‘Development Assistance’, ‘International Disaster Assistance’, ‘Complex Crises Fund’, ‘Economic Support Fund’, ‘Democracy Fund’, ‘Assistance for Europe, Eurasia and Central Asia’, ‘Migration and Refugee Assistance’, and ‘Millennium Challenge Corporation’ accounts “to respond to a Public Health Emergency of International Concern.”
ii – The FY22 House SFOPs bill provides the authority to transfer an amount “not to exceed an aggregate total of $200,000,000 of the funds appropriated by this Act” for international infectious disease outbreaks. The FY22 House SFOPs bill states that an unspecified amount of funding from the GHP account “may be made available for a contribution to an international financing mechanism for pandemic preparedness.”
iii – Some tuberculosis funding is provided under the ESF account, which is not earmarked by Congress in the annual appropriations bills and determined at the agency level (e.g. in FY19, TB funding under the ESF account totaled $3.6 million).
iv – Some MCH funding is provided under the ESF account, which is not earmarked by Congress in the annual appropriations bills and determined at the agency level (e.g. in FY19, MCH funding under the ESF account totaled $14.42 million).
v – The FY21 final bill text provides additional funding to Gavi to support coronavirus response efforts, stating, “For an additional amount for ‘Global Health Programs’, $4,000,000,000, to remain available until September 30, 2022, to prevent, prepare for, and respond to coronavirus, including for vaccine procurement and delivery: Provided, That such funds shall be administered by the Administrator of the United States Agency for International Development and shall be made available as a contribution to the GAVI, Alliance.”
vi – UNICEF funding in the FY21 final bill and FY22 House bill includes an earmark of $5 million for programs addressing female genital mutilation.
vii – Some nutrition funding is provided under the ESF account, which is not earmarked by Congress in the annual appropriations bills and determined at the agency level. (e.g. in FY17, nutrition funding under the ESF account totaled $21 million).
viii – The FY21 final bill states that “not less than $575,000,000 should be made available for family planning/reproductive health.” The FY22 request funding amounts are based on a bilateral total of $583.7 million as specified in the FY22 OMB Budget Appendices for the Department of State and Other International Programs. The FY22 House SFOPs bill text states that “not less than $760,000,000 shall be made available for family planning/reproductive health.” According to the FY22 House SFOPs bill report, $760 million is provided through the GHP account; however, it is possible that the administration could provide additional funding for FPRH activities through the ESF account.
ix – The FY21 final bill and FY22 House SFOPs bill texts state that if this funding is not provided to UNFPA it “shall be transferred to the ‘Global Health Programs’ account and shall be made available for family planning, maternal, and reproductive health activities.”
x – According to the Department of State, Foreign Operations, and Related Programs FY22 Congressional Budget Justification, $300 million of this funding is “for contributions to support multilateral initiatives leading the global COVID response through the Act-Accelerator platform.”
xi – According to the Department of State, Foreign Operations, and Related Programs FY22 Congressional Budget Justification, this funding is “to support a new health security financing mechanism, which would be developed alongside U.S. partners and allies, to ensure global readiness to respond to the next outbreak.”
xii – The FY21 final bill states that “up to $50,000,000 of the funds made available under the heading ‘Global Health Programs’ may be made available for the Emergency Reserve Fund.” The FY22 House SFOPs bill text states that “up to $90,000,000 of the funds made available under the heading ‘Global Health Programs’ may be made available for the Emergency Reserve Fund.”

The Status of Medicaid Expansion in Missouri and Implications for Coverage and Cost

Authors: Madeline Guth, Rachel Garfield, Robin Rudowitz, and Anthony Damico
Published: Jun 30, 2021

On June 23, 2021, a circuit court decision in Missouri put the state’s expansion of Medicaid under the Affordable Care Act (ACA) in limbo. Though a successful 2020 state ballot measure directed the expansion to be in effect by July 1, 2021, the legislature excluded expanded coverage from its fiscal year (FY) 2022 budget and the circuit court judge held that the state was not required to implement expansion. This decision, if upheld, has implications for coverage in the state as well as the availability of federal financing to cover the cost.

Figure 1: What is the status of Medicaid expansion in Missouri?

While expansion passed in Missouri through ballot initiative, the governor has since said that the state will not expand Medicaid because the legislature did not include expansion in its FY 2022 budget (Figure 1). On August 4, 2020, Missouri voters approved a ballot measure that added Medicaid expansion to the state’s constitution and required implementation of expansion coverage by July 1, 2021. Language in the constitutional amendment prohibits the imposition of additional burdens or restrictions on eligibility or enrollment for the expansion population (such as work requirements or premiums). In early 2021, Republican Governor Mike Parson included expansion in his proposed FY 2022 budget and the state submitted a State Plan Amendment (SPA) to CMS to implement expansion beginning July 1, 2021. In May, however, Governor Parson announced that the state’s Department of Social Services (DSS) was withdrawing its SPA submission and would not implement expansion as scheduled due to a lack of funding: the ballot measure did not include a revenue source and the Republican-controlled state legislature excluded the program from its final FY 2022 budget. Although advocates subsequently filed a lawsuit in state circuit county court against the DSS, in June a judge ruled that DSS’ refusal to expand Medicaid is lawful because the ballot initiative violated the state constitution by failing to provide a funding source. The plaintiffs appealed this decision and the state Supreme Court is set to hear oral arguments in this appeal on July 13.

Figure 2: Who are the 127,000 uninsured adults in the coverage gap in Missouri?

If the ACA Medicaid expansion does not proceed, the nearly 127,000 uninsured nonelderly adults who currently fall into the coverage gap would remain ineligible for coverage (Figure 2). These adults would be eligible if the state expanded but currently have incomes above Missouri’s current Medicaid levels (0% of the federal poverty level (FPL) for childless adults and 21% for parents) but below the 100% FPL ($12,880 for an individual or $21,960 for a family of 3 in 2021) minimum eligibility for tax credits through the ACA marketplace. National estimates by KFF indicate that nearly 2.2 million adults are in the coverage gap across all non-expansion states (these estimates exclude Missouri as the state had previously been scheduled to implement expansion in July). As in other states, most people in the coverage gap in Missouri are adults without dependent children (75%). Though most people in the Missouri coverage gap are White (74%), the gap disproportionately includes people of color when compared to the population of Missouri as a whole (79% White, non-Hispanic). Most (63%) adults in the coverage gap have at least one full-time (41%) or part-time only (22%) worker in their family. Without Medicaid expansion, those in the coverage gap have limited options for affordable health coverage and are likely to face barriers to needed health services.

Figure 3: What would be the fiscal impact of Medicaid expansion in Missouri?

Not expanding Medicaid in Missouri would lead the state to forego more than $1 billion in additional federal funds available under the American Rescue Plan Act (ARPA) (Figure 3). Governor Parson’s proposed FY 2022 budget allocated $1.57 billion in total for the Medicaid expansion; the federal government would cover the vast majority of this cost as states receive a 90% federal matching rate (FMAP) for the expansion population. The Missouri Legislature estimated that state costs of expansion would be $156 million in FY 2022, but ultimately chose not to appropriate these funds. The state has recently seen increasing revenue and an unprecedented budget surplus. ARPA provides a temporary fiscal incentive for states to newly implement the ACA Medicaid expansion by providing a 5 percentage point increase in the state’s traditional FMAP for two years. This increase would more than offset Missouri’s increased costs of expansion: Missouri would receive an estimated $1.15 billion over FY 2022 to 2023 as a result of the ARPA financial incentive. However, the state would ultimately need to cover its 10% share of the cost of expansion over time.

A comprehensive literature review of Medicaid expansion studies identifies positive financial impacts of expansion for state budgets and economies, on top of improvements in coverage, access, and health outcomes for individuals. Excluding Missouri, the other 12 non-expansion states are foregoing an estimated $16.4 billion in additional federal funds available under the ARPA incentive (on top of the existing 90% expansion FMAP). Similar to Missouri, Oklahoma voters approved a Medicaid expansion initiated constitutional amendment in June 2020; unlike Missouri, however, expansion coverage in Oklahoma is scheduled to begin on July 1. Since ARPA was enacted prior to the implementation of the expansion, Oklahoma is eligible for the ARPA fiscal incentive. Enrollment in expansion coverage began June 1 in Oklahoma and neared 100,000 after just one week. While fiscal issues are part of the calculus for states not expanding Medicaid—i.e., the need to cover 10% of the cost over time—opposition to the ACA continues to be a factor as well.

News Release

Workers Are More Likely to Get a COVID-19 Vaccine When Their Employers Encourage It and Provide Paid Sick Leave, Though Most Workers Don’t Want Their Employers to Require It

3 in 4 Adults Live in Homes Where Either Everyone is Vaccinated or Everyone Remains Unvaccinated

Published: Jun 30, 2021

A Third of Parents with Kids Ages 12-17 Report Their Kids Are Now Vaccinated; Most Parents Oppose Mandatory Vaccinations for School Children

As more employers return to in-person work, the latest KFF COVID-19 Vaccine Monitor report shows that workers are more likely to have gotten a COVID-19 vaccine when their employer encourages it or provides paid sick leave to get the vaccine and recover from side effects.

About two-thirds of workers report that their employer is encouraging vaccinations, and half say that their employer is providing paid time off for workers to get the vaccine and recover from any side effects.

Those actions appear to have an effect: About three-quarters of workers whose employers encourage getting a vaccine (73%) or offer paid time off to do so (75%) say the have gotten at least one shot, significantly more than the shares whose employers don’t encourage vaccination (41%) or don’t offer paid time off (51%). The differences persist even after controlling for workers’ age, race and ethnicity, education, income, party identification and other demographic characteristics.

Relatively few workers say that their employer required them (9%) or offered a cash bonus or other incentive (12%) to get a vaccine.

While the public overall is split on whether employers should require workers to get vaccinated unless they have a medical excuse (51% favor, 46% oppose), most workers (61%) say they do not want their own employer to require vaccinations. Opposition is especially high among workers who are not yet vaccinated (92% oppose a mandate) and among those who identify as or lean Republican (85%).

“Getting more Americans vaccinated isn’t only up to the government. Even without requiring workers to get a vaccine, employers can play a role by offering paid time off to get vaccinated and encouraging their workers to do so,” KFF President and CEO Drew Altman said.

Overall, nearly two-thirds (65%) of adults report having gotten at least one dose of a COVID-19 vaccine, up only slightly since May (62%). An additional 3% say they want to get a vaccine as soon as they can, and one in ten (10%) say they want to “wait and see” how the vaccine works for others before getting it.

About a fifth of the public remains in the more resistant categories, saying they that would get a vaccine “only if required” for work, school or other activities (6%), or that they will “definitely not” get a vaccine (14%). These shares are essentially unchanged since January even as most other adults got vaccinated.

Most adults are in homes where everyone else shares their vaccination status. Half (50%) of adults say that they and everyone in their household have gotten at least one shot, while a quarter (25%) say that neither they nor anyone else in their household has gotten a shot.

Two-thirds (67%) of Democrats say they live in fully vaccinated households, while nearly four in ten Republicans (37%) live in completely unvaccinated homes.

With new COVID-19 cases at their lowest level since testing became widely available more than a year ago, about three-quarters (76%) of the public now says they are optimistic that the country is nearing the end of the pandemic.

This optimism ironically may be contributing to the slowdown in new vaccinations. Half (50%) of those who are unvaccinated say that cases are now so low that there is no need for more people to get a shot. In comparison, the vast majority (91%) of people who have gotten at least one dose say that more people still need to get vaccinated. These findings underscore the importance of vaccine communication that emphasizes that the pandemic is not over.

What Might Increase Vaccination Rates?

The Monitor also looks at other potential incentives or developments that could boost vaccine take-up rates among those currently unvaccinated, particularly among those in “wait and see” mode.

Similar to last month, the new report finds that three in ten (31%) unvaccinated adults – and roughly half (49%) of the “wait and see” group – say that they would be more likely to get a vaccine if the U.S. Food and Drug Administration (FDA) granted full approval for one of the available vaccines.

However, those views may be more of a proxy for general safety concerns, as just a third (32%) of adults overall are aware that the FDA has only authorized the existing vaccines for emergency use while the rest either believe the vaccines already have full approval (21%) or aren’t sure (45%). Among unvaccinated adults who are aware that the vaccines are available under emergency use authorization, 32% say they would be more likely to get a vaccine if it were fully approval by the FDA.

Other potential motivators for the unvaccinated include:

• Nearly a quarter (23%) say they would be more likely to get vaccinated if they were entered in a lottery with a chance to win $1 million. This includes even larger shares of unvaccinated young adults ages 28-29 (33%), Black adults (34%) and those with household incomes under $40,000 annually (31%).

• About one in six (17%) say they would be more likely to get vaccinated if a mobile clinic came to their neighborhood. The share is higher among Hispanic (33%) and Black (22%) adults than among White adults (10%).

• Among unvaccinated parents, 13% say they would be more likely to get vaccinated if they were provided free childcare to get the vaccine and while they recover from side effects.

Vaccination Rates Among Children Ages 12-17 Rise, though Many Parents Worry about Heart IssueLess than two months after the FDA authorized the emergency use of a COVID-19 vaccine for children as young as 12 years old, a third (34%) of parents with children ages 12-17 say their children have already received at least one dose of the vaccine, up from a quarter (24%) in May. An additional 8% say they will get their 12-17 year old children vaccinated right away.

Parents of younger children who are not yet eligible to get a COVID-19 vaccine remain more cautious. About a quarter (27%) say they would get their child vaccinated as soon as they are able, while a third (33%) want to “wait and see.” Others say they would get their younger children vaccinated only if required by their school (11%) or not at all (26%).

Large shares of the public (67%) and of parents (74%) say they have heard at least a little about the U.S. Centers for Disease Control and Prevention (CDC) investigation about 800 cases of rare heart problems and inflammation that has occurred in some teenagers and young adults after they were vaccinated.

About half of parents (50%) say they are at least somewhat concerned about the risk. These parents tend to be more cautious about getting their children vaccinated than parents who haven’t heard about the potential heart issue or aren’t concerned about it.

Most parents (61%) say they do not think K-12 schools should require students to get vaccinated for COVID-19. This reflects a significant partisan divide, with most parents (58%) who identity as Democrats or lean that way saying schools should mandate vaccinations, while nearly eight in ten (79%) of those who identify as Republicans or lean that way saying they shouldn’t.

When it comes to colleges and universities, similar majorities of the public (58%) and of college students (58%) favor a requirement that all students get vaccinated unless they have a medical excuse. These views also diverge along partisan lines, with Democrats more than twice as likely to support a vaccination mandate at colleges and universities than Republicans are (82% vs. 33%).

Poll Finding

KFF COVID-19 Vaccine Monitor: June 2021

Published: Jun 30, 2021

Findings

The KFF COVID-19 Vaccine Monitor is an ongoing research project tracking the public’s attitudes and experiences with COVID-19 vaccinations. Using a combination of surveys and qualitative research, this project tracks the dynamic nature of public opinion as vaccine development and distribution unfold, including vaccine confidence and acceptance, information needs, trusted messengers and messages, as well as the public’s experiences with vaccination.

Key Findings

  • Reflecting other data indicating a slowdown in U.S. COVID-19 vaccination rates, the latest KFF COVID-19 Vaccine Monitor finds that nearly two-thirds of adults (65%) have received at least one vaccine dose, with only a small share (3%) saying they intend to get the vaccine as soon as they can. While vaccine intentions vary by party, race, ethnicity, age, and other demographics, at least half across most demographic groups now report being vaccinated, with the exception of those who lack health insurance, 48% of whom say they have received at least one dose of a COVID-19 vaccine.
  • In a new measure, we find that most adults live in homogenous households when it comes to COVID-19 vaccination status, with three-quarters (77%) of vaccinated adults saying everyone in their household is vaccinated and a similar share (75%) of unvaccinated adults saying no one they live with is vaccinated. Overall, half of adults report living in vaccinated households and one in four live in fully unvaccinated households. The remainder, about one in five adults, live in households with both vaccinated and unvaccinated household members including some households with children under the age of 12 who are not currently eligible to receive a vaccine. Notably, two-thirds of Democrats report living in all-vaccinated households while four in ten Republicans (39%) report living in all-unvaccinated homes.
  • With COVID-19 case rates at record lows and much of the country re-opening, most adults (76%) are optimistic that the U.S. is nearing the end of the pandemic. However, this optimism has the potential to hamper further vaccination efforts, with half of unvaccinated adults saying that the number of cases is now so low there is no need for more people to get the vaccine.
  • Consistent with last month’s results, three in ten unvaccinated adults, rising to about half of those in the “wait and see” group, say they would be more likely to get vaccinated if one of the vaccines currently authorized for emergency use were to receive full approval from the FDA. However, this finding likely suggests that FDA approval is a proxy for general safety concerns, as two-thirds of adults (including a large majority of unvaccinated adults) either believe the vaccines currently available in the U.S. already have full approval from the FDA or are unsure whether they have full approval or are authorized for emergency use. In terms of other incentives and interventions, a million dollar lottery could motivate about a quarter of the unvaccinated to get a shot, while mobile vaccine clinics motivate about one in six overall, but notably higher shares of Black and Hispanic adults, suggesting such outreach could help further reduce racial and ethnic disparities in vaccination rates.
  • Two-thirds of employed adults say their employer has encouraged workers to get vaccinated and half say their employer provided them paid time off to get the vaccine or recover from side effects. Notably, workers who say their employer did either one of these things are more likely to report being vaccinated, even after controlling for other demographics, suggesting that more employers encouraging vaccination and offering paid time off could lead to higher vaccination rates among U.S. workers.
  • While half the public overall say employers should require their workers to get vaccinated, most workers do not want their own employer to require vaccination, including the vast majority of unvaccinated workers (92%) as well as four in ten workers who are already vaccinated (42%).  About four in ten adults say employers should provide cash bonuses or other incentives to workers who get vaccinated, but just 12% of workers say their own employer has offered such an incentive.
  • Reported vaccination rates continue to increase among children ages 12-17, with one-third of parents of children in this age range saying their child has received at least one vaccine dose, up from 24% in May. However, many parents are still waiting and one-quarter say they will “definitely not” vaccinate their child. Similar to employer requirements, about half the public overall supports K-12 schools requiring COVID-19 vaccination, but most parents are opposed, with divisions along partisan lines. A somewhat larger share of the public (58%) says colleges and universities should require students to be vaccinated, including 58% of those who say they are currently undergraduate or graduate students.

Reflecting other data indicating a slowdown in U.S. COVID-19 vaccination rates, the latest KFF COVID-19 Vaccine Monitor reports that about two-thirds of adults (65%) now say they have received at least one dose of a vaccine, up only slightly from May (62%). An additional 3% of adults say they intend to get the vaccine as soon as possible. One in ten adults say they want to “wait and see” before getting vaccinated, trending downward over time but statistically similar to the share that said the same last month (12%). The shares of adults who are more reluctant to get the COVID-19 have remained relatively unchanged since January, with about one in five saying they either will get a vaccine “only if required” for work or other activities (6%) or will “definitely not” get vaccinated (14%).

Among those who say they want to “wait and see” before getting vaccinated, a critical group to efforts to increase the adults vaccination rate, about a quarter (3% of all adults) say they plan to get vaccinated within the next three months. Notably, four in ten adults (37%) in the “wait and see” group say they are likely to wait more than a year before getting vaccinated.

As Rate Of Increase In COVID-19 Vaccine Uptake Slows, Two-Thirds Of Adults Report Receiving At Least One Dose

Demographic patterns in vaccine uptake and intentions are similar to those measured in previous surveys, with large majorities of older adults, those with serious health conditions, college graduates, and Democrats saying they have gotten at least one dose of the COVID-19 vaccine. Black and Hispanic adults along with younger adults remain somewhat more likely than their counterparts to say they will “wait and see” before getting vaccinated, while Republicans, rural residents, and White Evangelical Christians continue to be disproportionately more likely to say they will definitely not get vaccinated.

While younger adults remain less likely to report being vaccinated, the largest increases in self-reported vaccination between May and June were among those ages 18-29 (from 48% to 55%) and those ages 30-49 (from 51% to 59%).

There remains a large gap in vaccine uptake across education, with about eight in ten college graduates (79%) saying they have gotten at least one dose of the COVID-19 vaccine, compared to about six in ten adults without a degree who say the same (59%). There is also a large gap among adults under age 65 by insurance status, with 62% of insured adults reporting receiving at least one dose compared to about half (48%) of uninsured adults. Notably, however, with the exception of individuals without health insurance, at least half of adults across all demographic subgroups say they have received at least one dose of a vaccine.

Across Most Subgroups, At Least Half Report Receiving A COVID-19 Vaccine

A gender gap in vaccine uptake has emerged over the past several months, and women are now 9 percentage points more likely to report being vaccinated than men (70% vs. 61%), and a larger share of men than women say they will “definitely not” get the vaccine (17% vs. 11%). This difference appears to largely reflect differences in partisan identification between men and women, with 43% of men identifying as Republicans or Republican-leaning independents compared to 27% of women. In fact, self-reported vaccination rates are similar by partisanship across genders with half of Republicans and Republican-leaning men and women reporting receiving at least one dose  (50% of men and 52% of women) compared to eight in ten Democratic men and women (78% of men and 82% of women).

Vaccination Status of Households

This month’s Monitor finds that most U.S. households are homogeneous when it comes to their COVID-19 vaccination status. Half of adults report living in a vaccinated household (those in which every household member has received at least one dose of a COVID-19 vaccine) while one in four live in fully unvaccinated households (those in which no household member has been vaccinated) and about one in five live in a household with both vaccinated and unvaccinated individuals. Across partisans, two-thirds of Democrats say they live in a fully vaccinated household while nearly four in ten Republicans (37%) say they live in a fully unvaccinated household.

Three in four vaccinated adults (77%) say they live in fully vaccinated households while a similar share of unvaccinated adults (75%) say everyone in their household is unvaccinated. Among vaccinated adults living in a mixed-status household, one-third (34%) say all the unvaccinated members of their household are under age 12 and therefore ineligible to receive a COVID-19 vaccine, while the majority (65%) say at least one of their unvaccinated household members is age 12 or over and therefore eligible to get vaccinated.

Half Of Adults Live In Fully Vaccinated Households While One Quarter Live In A Fully Unvaccinated Household

How Optimism About The Pandemic’s End May Affect Vaccination Efforts

With COVID-19 cases at their lowest point since testing became widely available, and as the nation continues to open up with increased travel, large public events returning, and mask mandates being rescinded, about three-quarters of the public (76%) say they are optimistic that the U.S. is nearing the end of the COVID-19 pandemic. Vaccinated adults are somewhat more likely than those who are unvaccinated to express optimism, though large shares of both groups are optimistic (78% vs. 70%).

Public optimism about the end of the pandemic has the potential to hinder further vaccination efforts if low case rates decrease people’s sense of risk and therefore decrease their sense of urgency about getting vaccinated. The latest Monitor finds some evidence that this may be happening to a certain extent among unvaccinated adults. Overall, 73% of the public feels that “more people need to get the vaccine to help stop the spread of COVID-19,” while 22% say the number of cases “is so low that there is no need for more people to get the vaccine.” While the vast majority (91%) of vaccinated adults say that more people need to get vaccinated, half of unvaccinated adults say cases are so low that additional vaccinations are not necessary. This includes 43% in the potentially convertible “wait and see” group as well as two-thirds of those who say they will “definitely not” get the vaccine.

Half Of Unvaccinated Adults Say Cases Are So Low That There Is No Need For More People To Get Vaccinated

Concerns about the efficacy of the COVID-19 vaccines against new coronavirus variants could also deter some from getting vaccinated. Nearly half of unvaccinated adults, including six in ten of those in the “wait and see” group say they are worried that the currently available COVID-19 vaccines might not be effective against new strains of coronavirus.

Six In Ten Adults Who Want To &quot;Wait And See&quot; Before Getting Vaccinated Are Worried The Vaccine Won't Be Effective Against New Coronavirus Strains

Reasons Why Some Adults Remain Unvaccinated

Unvaccinated adults cite a variety of reasons why they have not gotten a COVID-19 vaccine, with half citing worries about side effects and the newness of the vaccine as major reasons (53% each). Other major reasons include just not wanting to get the vaccine (43%), not trusting the government (38%), thinking they do not need the vaccine (38%), not believing the COVID-19 vaccines are safe (37%), and not trusting vaccines in general (26%). Fewer cite as major reasons that they have a medical reason for not getting vaccinated (14%), they are too busy or have not had the time to get it (12%), they don’t like getting shots (12%), they are worried about missing work (7%), they would have difficulty traveling to a vaccination site (6%), they are worried about having to pay (5%), or they are not sure how or where to get the vaccine (5%).

When unvaccinated adults are asked to choose the main reason they have not yet gotten the COVID-19 vaccine, one in five cite the newness of the vaccine, followed by 11% each who say the main reason is that they are worried about side effects, they don’t trust the government, they don’t think they need the vaccine, and they just don’t want to get the vaccine.

Newness Of COVID-19 Vaccines And Worries About Side Effects Are Top Reasons Why Some Remain Unvaccinated

Reasons for not getting vaccinated differ between those in the “wait and see” group and those who say they will “definitely not” get vaccinated, as well as between unvaccinated adults with different partisan identities and those from different racial and ethnic backgrounds. While the newness of the vaccine and worries about side effects are prominent across groups, the vaccine’s newness is cited as a major reason by a larger share of those in the “wait and see” group compared to the “definitely not” group (67% vs. 52%). By contrast, those in the “definitely not” group are much more likely than those in the “wait and see” group to say they just don’t want to get the vaccine (63% vs. 25%), they don’t trust the government (55% vs. 29%), they don’t think they need the vaccine (54% vs. 21%), and that they don’t believe the vaccines are safe (50% vs. 31%).

When asked to choose the main reason they haven’t gotten vaccinated, the top two answers among the “wait and see” group are that the vaccine is too new (38%) and that they are worried about side effects (18%); among the “definitely not” group, the top reasons are they don’t trust the government (19%) and they just don’t want to get vaccinated (12%).

Consistent with previous research, unvaccinated Hispanic and Black adults are more likely than White adults to cite worries about missing work and having to pay for the vaccine as major reasons for not being vaccinated. In addition, unvaccinated Hispanic adults are more likely than unvaccinated White adults to say they are too busy, would have difficulty traveling to a vaccination site, or are not sure how or where to get the vaccine.

By partisanship, larger shares of unvaccinated Republicans than Democrats say they don’t want or need the vaccine, they don’t trust the government, or don’t believe the vaccines are safe. Larger shares of unvaccinated Democrats than Republicans say they are too busy, don’t like getting shots, or are worried about missing work.

Table 1: Major Reasons Why Unvaccinated Adults Have Not Gotten A COVID-19 Vaccine
Percent who say each is a MAJOR reason why they haven’t gotten vaccinated:Total unvaccinatedCOVID-19 Vaccination intentionRace/EthnicityParty ID
Wait and seeDefinitely notBlackHispanicWhiteDem.Ind.Rep.
The vaccine is too new53%67%52%55%54%54%63%50%51%
Worried about side effects535761556051575451
Just don't want to get the vaccine432563303448363455
Don't trust the government382955313440253547
Don't think they need the COVID-19 vaccine382154274238252847
Do not believe the COVID-19 vaccines are safe373150293840303446
Don't trust vaccines in general261938272126272726
Have a medical reason why they can't get the vaccine at this time1414177181591714
Too busy or have not had time to get it121361722917105
Don't like getting shots12121017141022124
Worried about missing work77391831183
Difficult to travel to a vaccination site6935134774
Not sure how or where to get the vaccine5726132651
Worried they will have to pay to get the vaccine57110122661

What Might Increase Vaccination Rates?

The May KFF COVID-19 Vaccine Monitor found that if the FDA were to give full approval to one of the COVID-19 vaccines, it could move some unvaccinated adults to get the vaccine. Findings were similar this month with 31% of unvaccinated adults saying they would be more likely to get a vaccine if one of the vaccines currently authorized for emergency use received full approval by the FDA, rising to nearly half of those in the “wait and see” group.

However, this reported increased likelihood does not necessarily reflect a nuanced understanding of the FDA approval process among unvaccinated adults and may be a proxy for more general concerns about safety. Two-thirds of the public either are unsure if the FDA has given full approval of the COVID-19 vaccines (45%) or think it has done so (21%), while just a third (32%) know that the vaccines have only been authorized for emergency use. Among unvaccinated adults, a majority (57%) say they are unsure whether the FDA had granted full approval or only emergency use authorization to the COVID-19 vaccines currently available in the U.S.

Among unvaccinated adults who are aware that the vaccines are available under emergency use authorization, a similar share as among all unvaccinated adults – 32% - say they would be more likely to get vaccinated if one of the vaccines were granted full approval by the FDA.

Most Adults Are Unaware That COVID-19 Vaccines Are Currently Available Under FDA Emergency Use Authorization

Over the past several months, we have been using the Vaccine Monitor surveys to test a number of potential incentives that may resonate with those who remain unvaccinated. Along with the 31% of unvaccinated adults who say they would be more likely to get the vaccine if the FDA granted full approval, the incentive tested in this month’s Monitor that appears to have the most resonance is a lottery with the chance to win one million dollars. About one in four (23%) of those who have not been vaccinated, including 31% of those who say they want to “wait and see,” say they would be more likely to get vaccinated if they were entered into a lottery with a chance to win one million dollars. Among the unvaccinated, about a third of adults ages 18 to 29 (33%), Black adults (34%), and those with a household income under $40,000 (31%) say being entered in a lottery would make them more likely to get the vaccine.

Incentives targeting vaccine access may also help increase vaccination rates and reduce racial and ethnic disparities in who is getting vaccinated. Seventeen percent of unvaccinated adults overall say they would be more likely to get vaccinated if a mobile vaccine clinic came to their neighborhood, a share that rises to nearly one-fourth of unvaccinated Black adults (22%) and one-third of Hispanic adults. In addition, 13% of unvaccinated parents say they would be more likely to get a vaccine if they were provided with free childcare while they get the vaccine and recover from side effects.

FDA Approval, Vaccine Lotteries, Mobile Clinics, And Free Childcare May Convince Some To Get Vaccinated

The Role of Employers in COVID-19 Vaccination

Workplace Vaccination Status And Feelings Of Safety

With businesses reopening across the country and many workplaces returning to in-person work, employers have a large role to play in providing worker with information about COVID-19 vaccines, encouraging them to get vaccinated, and making sure they can get vaccinated without losing pay. Among adults who are employed at least part-time, most (61%) now say they are working from a location outside their home, while one in five (19%) say they work solely from their home and another one in five (21%) say they work partially at home and partially at another location.

Although they may be at higher risk for exposure to coronavirus, those who work solely (54%) or partially (66%) outside their home are less likely to report receiving a COVID-19 vaccine compared to those who work solely from home (81%). Compared to those working from home, a larger share of those working solely outside their home say they will “wait and see” before getting vaccinated (15% vs. 4%) or that they will “definitely not” get the vaccine (18% vs. 8%). These differences are likely driven by other demographic factors, as those who work at home are more likely to be college-educated and to identify as Democrats compared to those who work outside their homes.

Those Working From Home Have Higher Self-Reported Vaccination Rates Than Those Working Outside The Home

Just as many households are homogeneous in their vaccination status, the latest Vaccine Monitor finds that many workplaces are as well. Among those who work at least partially outside their home, one-third (34%) say that all or most of their coworkers have been vaccinated for COVID-19 and another quarter (27%) say about half of their coworkers have been vaccinated. Notably, about half (53%) of those who have been vaccinated themselves say that all or most of their coworkers have been vaccinated while a similar share (49%) of unvaccinated workers say just a few or none of their coworkers have received a vaccine. There is also a large education divide among those working outside the home, with about half (52%) of workers who are college graduates saying all or most of their coworkers have been vaccinated compared to one-quarter of workers without a college degree. Notably, about one in ten of those working outside their home overall say they don’t know what share of their coworkers have received a COVID-19 vaccine.

Vaccinated Workers, College Graduates More Likely To Report That Most Of Their Coworkers Are Vaccinated

Despite mixed workplace vaccination status, the vast majority of workers say they feel at least somewhat safe when it comes to their risk of exposure to coronavirus when working outside their home, including 58% who say they feel “very” safe and 34% who feel “somewhat” safe. Black and Hispanic workers are less likely to report feeling “very” safe working outside their home compared to White workers (40%, 45%, and 66%, respectively), as are lower-income workers compared to those with higher incomes (47% of those with household incomes less than $40,000 vs. 66% of those with incomes of $90,000 or more).

Most Workers Feel Safe When Working Outside Their Home, But Fewer Black, Hispanic, And Lower-Income Workers Feel &quot;Very Safe&quot;

Among those who work outside their homes, a larger share of those who have not received a COVID-19 vaccine says they feel “very safe” compared to those who have received a vaccine (72% vs. 46%). This likely reflects the fact that those who have chosen not to get a COVID-19 vaccine are less likely to view the virus as a threat to their personal health. Among those who have been vaccinated, feelings of safety from exposure to the virus do not appear to be correlated with beliefs about coworkers’ vaccination status; about half of vaccinated workers say they feel “very safe” among those who say all or most of their coworkers have been vaccinated and among those who say half or fewer of their coworkers have gotten a vaccine.

Vaccinated Workers Less Likely To Feel &quot;Very Safe&quot; At Work Compared To Unvaccinated Workers

The Role Of Employers In Encouraging Vaccinations

Among the different roles employers might play, we find the most common are providing information and encouraging vaccination. Seven in ten of those who work for an employer say their employer has provided them with information about how to get a COVID-19 vaccine, and two-thirds (65%) say their employer has encouraged employees to get vaccinated. A larger share of workers with college degrees compared to those without college degrees say their employer has provided information (77% vs. 66%) or encouraged employees to get vaccinated (78% vs. 57%). Notably, 72% say they trust their employer a great deal or a fair amount to provide reliable information about the vaccines.

Half of workers overall say their say their employer provides them with paid time off to get a COVID-19 vaccine and recover from any side effects, though this share is lower among Black workers (38%), those without college degrees (41%), and those with household incomes less than $40,000 annually (41%). Among workers who don’t have health insurance, just one-third (33%) say their employer provides paid time off for vaccine administration and side effects.

About one in ten workers say their employer offered a cash bonus or other incentive to employees who get vaccinated (12%) or required them to get a COVID-19 vaccine (9%). The share saying their employer offered cash or another incentive rises to 22% among Black employees and 16% among those in households earning between $40,000 and $89,999 annually. One in six workers with household incomes under $40,000 (17%) say their worker required them to get vaccinated compared to smaller shares of those in middle- and higher-income households (4% and 7%, respectively).

Table 2: Employer Provided Vaccination Incentives By Race, Education, Income And Insurance Status
Percent of employed adults whose employer has done each of the following:Total employedRace/EthnicityEducationHousehold IncomeInsurance status
BlackHispanicWhiteLess than collegeCollege graduateLess than $40K$40K-$89.9K$90K+Insured under age 65Uninsured under age 65
Provided them with information about how to get a COVID-19 vaccine70%67%67%70%66%77%69%71%72%70%57%
Encouraged employees to get vaccinated6568686457786066696558
Provided them with paid time off to get the vaccine or to recover from any side effects5038514941644147635133
Offered a cash bonus or another type of incentive to employees who get vaccinated122211111311121671115
Required them to get a COVID-19 vaccine91397811174799

Workers who say their employer provided them with paid time off to get a COVID-19 vaccine and recover from side effects and those who say their employer encouraged vaccination are more likely to report receiving a COVID-19 vaccine compared to those whose employers have not taken these actions. Three-quarters of those who got paid time off say they’ve received at least one dose of the vaccine compared to about half (51%) of those who did not have this benefit. Similarly, 73% of those who say their employer encouraged vaccination report getting at least one dose compared to four in ten (41%) of those whose employer did not.

At least part of this difference may be due to differences in other demographic characteristics of those whose employers engaged in these activities compared to those who did not. However, using a statistical technique called multiple logistic regression, we find that employees who are encouraged by their employers to get vaccinated, or who are provided paid time off are more likely to get vaccinated, even after controlling for age, race, ethnicity, education, income, party identification, and other demographic characteristics that may impact vaccination uptake. This suggests that more employers encouraging vaccination and offering paid time off could lead to higher vaccination rates among employed adults in the U.S.

Workers Whose Employers Provided Paid Time Off Or Encouraged Vaccination Or  Are More Likely To Report Being Vaccinated

Views on Employer Requirements and Incentives

The public overall is divided in their views of employer requirements for COVID-19 vaccination, with about half (51%) saying employers should require employees to get vaccinated unless they have a medical exemption and a similar share (46%) saying they should not. Somewhat fewer support employers offering financial incentives, with four in ten (39%) saying employers should offer cash bonuses and other incentives to employees who get vaccinated and a majority (57%) saying employers should not do this.

On each of these questions, views diverge largely along partisan lines and by vaccination status. Three-quarters of Democrats (73%) support employers requiring COVID-19 vaccination compared to about half of independents (47%) and three in ten Republicans. Similarly, Democrats (52%) and independents (42%) are more likely than Republicans (21%) to say employers should offer incentives for vaccinated employees. Vaccinated adults are also more likely than unvaccinated adults to support employer requirements (68% vs. 19%) and financial incentives (45% vs. 29%).

Public Split On Employer Vaccination Requirements, Fewer Support Employer Incentives

Although about half the public overall supports employers requiring workers to get vaccinated, most of those who work for an employer say they do not want their own employer to require employees to get vaccinated (61%). About three in ten (28%) say they want their employer to require vaccination and another 9% say their employer already requires it. As among the public, views among workers diverge by partisanship and vaccination status. The vast majority of Republican workers (85%) and six in ten of those who identify as independents (62%) say they do not want their employer to require vaccination, while over half of Democrats say they want their employer to require it (46%) or that they already do (16%).

Not surprisingly, nine in ten (92%) unvaccinated workers don’t want their employer to require them and other employees to get a COVID-19 vaccine. When unvaccinated workers are asked what they would do if their employer required them to get vaccinated to continue working, four in ten (42%) say they would get the vaccine and half say they would leave their job.

Vaccinated workers are split on the question of employer requirements, with roughly equal shares saying they do (43%) and do not (42%) want their employer to require vaccination and 13% saying it is already required. Notably, vaccinated workers’ views on employer vaccination requirements are similar regardless of whether they report working in a mostly-vaccinated or a mostly-unvaccinated workplace.

Most Workers Do Not Want Their Employer To Require COVID-19 Vaccination, But Vaccinated Workers Are Split

Views On COVID-19 Vaccines For Children And School Requirements

Parents’ Intentions for Vaccinating Children

About a month and a half after the FDA authorized the Pfizer COVID-19 vaccine for use in children ages 12 and older, the latest Monitor finds about four in ten (42%) parents of children ages 12-17 say their child has already received at least one dose of the vaccine (34%) or that they will get them vaccinated right away (8%). About one in five parents of adolescents say they will “wait a while to see how it is working” before getting their child vaccinated (18%), while one in ten say they will get their child vaccinated only if their school requires it and an additional one in four say they will “definitely not” get their 12-17 year-old vaccinated.

Since May, the share of parents who say their 12-17 year old child has been vaccinated has risen by about ten percentage points while the share who say they will get their child vaccinated “right away” has fallen by a similar amount. From May to June, the shares of parents who say they want to “wait a while to see how it is working,” will only get their child vaccinated if their school requires it, or will “definitely not” get their child vaccinated has remained about the same.

When those who say they want to wait and see before getting their 12-17 year-old child vaccinated are asked how long they think they will wait, responses are split. Seven percent of all parents of children ages 12-17 say they will wait three months or less, 4% say they will wait between four months and one year, and 7% say they plan to wait longer than one year to vaccinate their child.

Four In Ten Parents Say Their Adolescent Has Already Received A COVID-19 Vaccine Or Will Do So Right Away, Similar To Last Month

Parents of younger children, for whom a COVID-19 vaccine is not yet authorized, remain more cautious in their approach to the vaccine. About one-quarter (27%) say they will get their child under age 12 vaccinated as soon as a vaccine is authorized for their age group, while one-third intend to wait a while to see how the vaccine is working. An additional 11% say they will vaccinate their young child only if school requires it and one-quarter (26%) say they will definitely not get them vaccinated. These shares are virtually unchanged from when this was first asked in May 2021.

One-Quarter Of Parents Of Children Under Age 12 Say They'll Get Their Child A COVID-19 Vaccine As Soon As It's Available

Among parents of younger children, intentions for vaccinating children vary by parents’ own vaccination status, their ethnicity, and party identification. Among parents of children under age 12 who have received a vaccine themselves, about half (48%) say they will get their younger child a vaccine as soon as one is authorized for their age group compared to just 4% of parents who have not received a vaccine. By contrast, nearly half (48%) of unvaccinated parents say they will “definitely not” get their child under age 12 vaccinated compared to 7% of parents who have received the vaccine themselves. A similar pattern emerges by partisanship, as nearly half (45%) of Democrats and Democratic-leaning parents of children under age 12 say they will get their child vaccinated “right away,” and the same proportion (46%) of Republicans and Republican-leaning independents say they will “definitely not” get their young child vaccinated. While similar shares of Hispanic and White parents say they will vaccinate their child under age 12 as soon as a vaccine is authorized, a larger share of Hispanic parents than White parents say they will “wait and see” (47% vs. 25%) while a smaller share say they will “definitely not” get the vaccine for their child (12% vs. 32%). (The sample size of Black parents of younger children is too small to report separately.)

Parents’ Intentions For Vaccinating Children Under Age 12 For COVID-19 Differ By Ethnicity, Partisanship, And Parent Vaccine Status

Recently, the CDC announced that it is investigating about 800 cases of rare heart problems and inflammation that have occurred in some teenagers and young adults after they received the Pfizer or Moderna COVID-19 vaccines. The CDC and many physician groups continue to strongly recommend vaccination for young people despite these rare cases.

Two-thirds of adults, rising to 74% of parents, say they have heard at least a little about these rare cases of heart problems in young people related to the vaccine. Among young adults ages 18-29, a somewhat smaller share (60%) say they’ve heard at least a little. Across age groups and parent status, few say they’ve heard “a lot” about these cases.

Two-Thirds Have Heard At Least A Little About Rare Heart Problems In Young People Vaccinated For COVID-19

About four in ten adults overall, rising to half of parents of children under age 18, say they have heard about rare cases of heart problems among young adults and teenagers who have been recently vaccinated for COVID-19 and that they are very or somewhat concerned about these cases.

Four In Ten Overall, Half Of Parents Are Concerned About Rare Cases Of Heart Problems In Young People Vaccinated For COVID-19

Parents of children ages 12-17 who have heard about and are concerned about heart problems linked to the COVID-19 vaccine in young people are notably more cautious about getting their children vaccinated compared to parents who say they are not concerned or have not heard about these cases. One-quarter (24%) of parents who express concern about these events say their child is already vaccinated compared to 45% of parents who haven’t heard or do not express concern.

Parents Of Children Ages 12-17 Who Are Concerned About Potential Heart Problems Are Less Likely To Say They Will Vaccinate Their Child For COVID-19

Views on Schools Requiring COVID-19 Vaccinations

The public overall is somewhat divided on whether schools should require students to get vaccinated for COVID-19. About half the public (52%) say K-12 schools should require students to get vaccinated unless they have a medical exemption while a similar share (45%) say they should not. Notably, parents of children under age 18 are less likely to say K-12 schools should require vaccination compared to adults who do not have minor children (37% vs. 57%). Among parents of children ages 12-17, for whom vaccines are currently authorized, 38% say that K-12 schools should require students to be vaccinated.

Overall public support is somewhat higher for colleges and universities requiring students to be vaccinated; 58% say they should, including 58% of those who are current undergraduate or graduate students at a college or university.

As is the case with employers requiring workers to be vaccinated, views on school requirements diverge largely along partisan lines and by vaccination status. Large majorities of Democrats support vaccination requirements by K-12 schools and universities compared to about half of independents and about a third of Republicans. At least seven in ten vaccinated adults support each type of requirement, compared to about one in five of those who have not been vaccinated.

More Than Half Say Colleges, Universities And K-12 Schools Should Require Students To Be Vaccinated; Fewer Parents Support K-12 Vaccination Requirements

Overall, six in ten (61%) parents of children under 18 say that K-12 schools should not require students to get vaccinated for COVID-19. However, similar to the partisan split among the general public on this question, parents are split on partisan lines. Nearly six in ten (58%) parents who identify as Democrats or lean that way say K-12 schools should require students to be vaccinated, while about eight in ten (79%) Republican-leaning parents say they should not require this.

Parents' Views Of K-12 School Vaccination Requirements Diverge Along Partisan Lines

Who Do People Trust For Reliable Information On COVID-19 Vaccines?

When asked who they trust to provide reliable information about the COVID-19 vaccines, personal doctors, including pediatricians, top the list, with 83% of adults saying they trust their own doctor a great deal or a fair amount and 85% of parents saying the same about their child’s pediatrician. Employers and health insurance companies also garner a high degree of trust, with 72% of workers saying they trust their employer and 73% of those with health insurance saying they trust their insurer to provide reliable vaccine information. About seven in ten each say they trust the CDC (71%), the FDA (69%), and their local public health department (69%). Somewhat fewer, but still more than half, trust President Joe Biden (58%), Dr. Anthony Fauci (57%), and their state government officials (56%). Levels of trust in most government sources of information has remained steady since this question was last asked in December 2020, but trust in Dr. Fauci has fallen somewhat, from 68% to 57%.

Personal Doctors And Pediatricians Are The Most Trusted Source For Reliable COVID-19 Vaccine Information

Among unvaccinated adults, majorities trust their own doctor, their child’s pediatrician, their health insurance company, and their employer for reliable information about COVID-19 vaccines, while trust in other sources is somewhat lower than among vaccinated adults. About half of unvaccinated adults say they trust the CDC, FDA, and their local health department, while about four in ten trust their state government officials and fewer trust President Biden (32%) or Dr. Fauci (27%). Trust in government sources of information is especially low among those who say they will “definitely not” get the vaccine.

Table 3: Trust In Sources Of COVID-19 Vaccine Information By Vaccination Status And Intention
Percent who say they have a great deal or fair amount of trust in each of the following to provide reliable information about the COVID-19 vaccines:COVID-19 vaccination statusCOVID-19 vaccination intention
Total vaccinatedTotal unvaccinatedWait and seeDefinitely not
Their child’s pediatrician*95%73%--
Their own doctor8969  78%  60%
Their health insurance company**79607545
Their employer***78616064
The U.S. Centers for Disease Control and Prevention, or CDC82486228
The U.S. Food and Drug Administration, or FDA79516037
Their local public health department80495730
President Joe Biden72323615
Dr. Anthony Fauci, the director of the National Institute of Allergy and Infectious Diseases7427348
Their state government officials64414627
NOTE: *Item asked only of those who are parents/guardians of children under 18 in household. Sample size too small for some subgroup analysis. **Item asked only of those who are insured. ***Item asked only of those who are employed and not self-employed.
Table 4: Trust In Sources Of COVID-19 Vaccine Information By Party ID
Percent who say they have a great deal or fair amount of trust in each of the following to provide reliable information about the COVID-19 vaccines:Party identification
DemocratIndependentRepublican
Their child’s pediatrician*88%85%-
Their own doctor888382%
Their health insurance company**827163
Their employer***836371
The U.S. Centers for Disease Control and Prevention, or CDC916948
The U.S. Food and Drug Administration, or FDA836856
Their local public health department866952
President Joe Biden915522
Dr. Anthony Fauci, the director of the National Institute of Allergy and Infectious Diseases875530
Their state government officials715445
NOTE: *Item asked only of those who are parents/guardians of children under 18 in household. Sample size too small for some subgroup analysis. **Item asked only of those who are insured. ***Item asked only of those who are employed and not self-employed.

Methodology

This KFF COVID-19 Vaccine Monitor was designed and analyzed by public opinion researchers at the Kaiser Family Foundation (KFF). The survey was conducted June 8-21, 2021, among a nationally representative random digit dial telephone sample of 1,888 adults ages 18 and older (including interviews from 512 Hispanic adults and 497 non-Hispanic Black adults), living in the United States, including Alaska and Hawaii (note: persons without a telephone could not be included in the random selection process). Phone numbers used for this study were randomly generated from cell phone and landline sampling frames, with an overlapping frame design, and disproportionate stratification aimed at reaching Hispanic and non-Hispanic Black respondents as well as those living in areas with high rates of COVID-19 vaccine hesitancy. Stratification was based on incidence of the race/ethnicity subgroups and vaccine hesitancy within each frame. High hesitancy was defined as living in the top 25% of counties as far as the share of the population not intending to get vaccinated based on the U.S. Census Bureau’s Household Pulse Survey.  The sample also included 39 respondents reached by calling back respondents that had previously completed an interview on the KFF Tracking poll at least nine months ago. Another 309 interviews were completed with respondents who had previously completed an interview on the SSRS Omnibus poll (and other RDD polls) and identified as Hispanic (n = 142; including 78 in Spanish) or non-Hispanic Black (n=167). Computer-assisted telephone interviews conducted by landline (225) and cell phone (1,663, including 1,228 who had no landline telephone) were carried out in English and Spanish by SSRS of Glen Mills, PA. To efficiently obtain a sample of lower-income and non-White respondents, the sample also included an oversample of prepaid (pay-as-you-go) telephone numbers (25% of the cell phone sample consisted of prepaid numbers) Both the random digit dial landline and cell phone samples were provided by Marketing Systems Group (MSG). For the landline sample, respondents were selected by asking for the youngest adult male or female currently at home based on a random rotation. If no one of that gender was available, interviewers asked to speak with the youngest adult of the opposite gender. For the cell phone sample, interviews were conducted with the adult who answered the phone. KFF paid for all costs associated with the survey.

The combined landline and cell phone sample was weighted to balance the sample demographics to match estimates for the national population using data from the Census Bureau’s 2019 U.S. American Community Survey (ACS), on sex, age, education, race, Hispanic origin, and region, within race-groups, along with data from the 2010 Census on population density. The sample was also weighted to match current patterns of telephone use using data from the January- June 2020 National Health Interview Survey. The weight takes into account the fact that respondents with both a landline and cell phone have a higher probability of selection in the combined sample and also adjusts for the household size for the landline sample, and design modifications, namely the oversampling of prepaid cell phone numbers and areas with high incidence of Black or Hispanic residents or high levels of vaccine hesitancy, as well as the likelihood of non-response for the re-contacted sample. An additional weighting adjustment was made to account for survey break-off by COVID-19 vaccination status within each race/ethnicity group. All statistical tests of significance account for the effect of weighting.

The margin of sampling error including the design effect for the full sample is plus or minus 3 percentage points. Numbers of respondents and margins of sampling error for key subgroups are shown in the table below. For results based on other subgroups, the margin of sampling error may be higher. Sample sizes and margins of sampling error for other subgroups are available by request. Note that sampling error is only one of many potential sources of error in this or any other public opinion poll. Kaiser Family Foundation public opinion and survey research is a charter member of the Transparency Initiative of the American Association for Public Opinion Research.

This work was supported in part by grants from the Chan Zuckerberg Initiative DAF (an advised fund of Silicon Valley Community Foundation), the Ford Foundation, and the Molina Family Foundation. We value our funders. KFF maintains full editorial control over all of its policy analysis, polling, and journalism activities.

GroupN (unweighted)M.O.S.E.
Total1,888± 3 percentage points
COVID-19 Vaccination Status
Have gotten at least one dose of the COVID-19 vaccine1,285± 4 percentage points
Have not gotten the COVID-19 vaccine572± 6 percentage points
Race/Ethnicity
White, non-Hispanic754± 4 percentage points
Black, non-Hispanic497± 6 percentage points
Hispanic512± 5 percentage points
Party Identification
Democrats698± 6 percentage points
Republicans364± 7 percentage points
Independents497± 6 percentage points
Parents
Parents of children under 18 in household453± 6 percentage points
Parents of children ages 12-17239± 9 percentage points
Parents of children under 12 years old314± 8 percentage points