LGBT+ People’s Health and Experiences Accessing Care
Key Findings
Key Takeaways
Understanding the health care needs and experiences of LGBT+ people in the United States is important for addressing barriers and facilitating access to care and coverage. We analyzed nationally representative data from a new KFF survey to compare the experiences of self-identified LGBT+ adults to their non-LGBT+ counterparts. Key findings include the following:
- The demographics of the LGBT+ community differ in some ways from that of their non-LGBT+ counterparts, differences that may have implications for health needs and access. Specifically, LGBT+ adults are younger, lower income, and less likely to be married.
- LGBT+ people more commonly report being in fair or poor health than non-LGBT+ people, despite being a younger population, and report higher rates of ongoing health conditions and disability or chronic disease.
- While LGBT+ people are as likely to have a usual source of care and regular provider, and use similar sites of care as their non-LGBT+ counterparts, they were more likely to report a range of negative provider experiences, including being blamed for health problems or having their concerns dismissed. At the same time, LGBT+ people were more likely to discuss certain health and social issues with their providers than non-LGBT+ people.
- LGBT+ people also more commonly report that they or a household family member has had problems paying medical bills in the past 12 months than non-LGBT+ people, and as for non-LGBT+ people, this is a challenge that sometimes impacts their ability to afford basic necessities.
- LGBT+ people’s utilization of health services compared to non-LGBT+ people varies considerably by service type. For example, LGBT+ women were less likely to report having had a recent mammogram or ever had gynecological exam than non-LGBT+ women but LGBT+ people were more likely to report having received other preventive screenings, including for sexual health.
- In some cases, LGBT+ people faced more challenging COVID-related circumstances than non-LGBT+ people, including a higher share of LGBT+ people seeking mental health care because of the pandemic.
- Smaller, but still substantial, shares of LGBT+ women report ever being pregnant compared to non-LGBT+ women, and majorities reported giving birth, though miscarriage was also a common experience.
Introduction
Understanding the health care needs and experiences of the more than 11 million LGBT people in the United States is important for addressing barriers and facilitating access to care and coverage. Studies have found that LGBT+ people experience certain health and access to care challenges at higher rates than their non-LGBT+ peers. Recognizing this, the National Institutes of Health (NIH) has identified sexual and gender minorities as a “health disparity population” to encourage and support research in this area. Health disparities among LGBT+ people can vary across the population and can intersect with factors beyond sexual orientation and gender identity to include race/ethnicity, class, nationality, and age, among other aspects of identity.
Despite some significant progress in researching these issues over the last decade, a recent study found that most population-based research still does not include measures of sexual orientation and gender identity, limiting the ability of policymakers, policy implementers, and researchers to assess national trends, disparities, and identify needed interventions. We sought to add to the knowledge base in this area by analyzing newly available, nationally representative data from the 2020 KFF Women’s Health Survey to compare the experiences of self-identified LGBT+ adults to their non-LGBT+ counterparts.
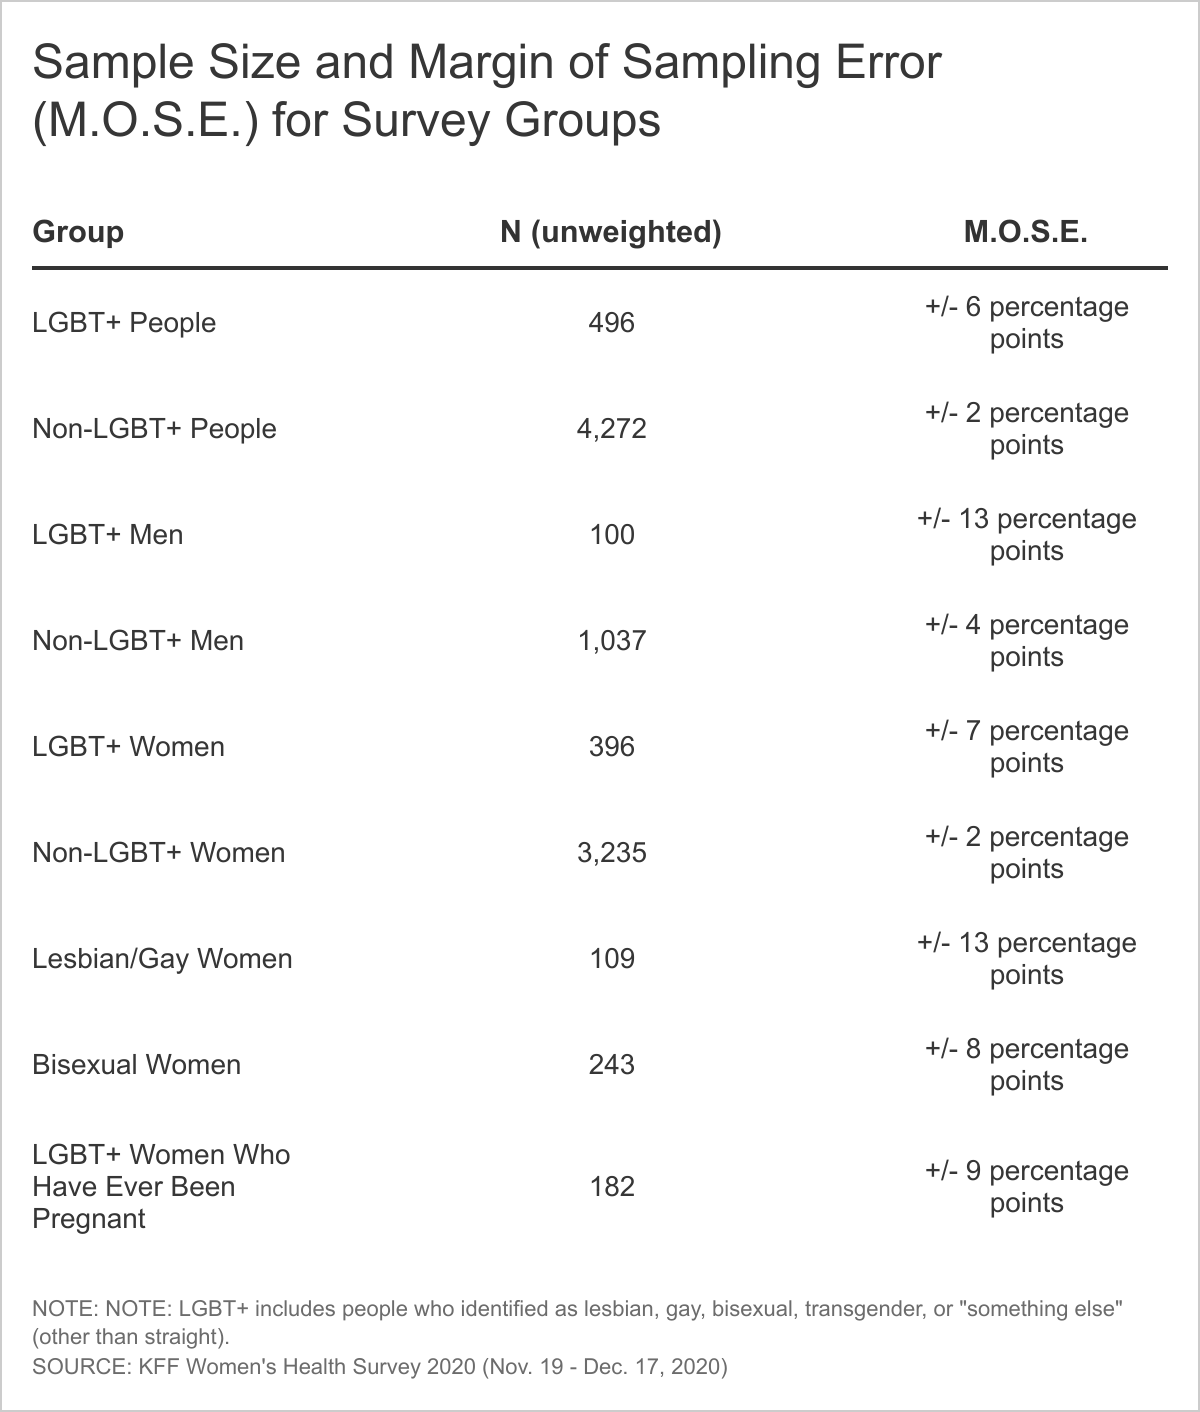
The survey included measures of sexual orientation and gender identity, as well as other demographic characteristics, and asked about a range of issues from general well-being to experiences engaging in the health system, HIV, reproductive health care, and the impact of COVID-19. The survey, conducted between November and December 17, 2020, included a nationally representative sample of 4,805 people ages 18-64 using an online probability-based panel, including 492 LGBT+1 people and oversampled lesbian and bisexual women.2 (A breakdown of sample size by LGBT+ group is available in the appendix.) Data are representative of people who self-identified as ‘female’ or ‘male’ (regardless of sex assigned at birth) and two separate survey questionnaires were designed for these two gender groups. While we aimed to be as inclusive as possible, we were not able to obtain a large enough sample to support a separate questionnaire focused on non-binary or gender-fluid people. In addition, small sample size limits our ability to report representative estimates of experiences among transgender people.
Report
Browse by topic:
Demographics and Family
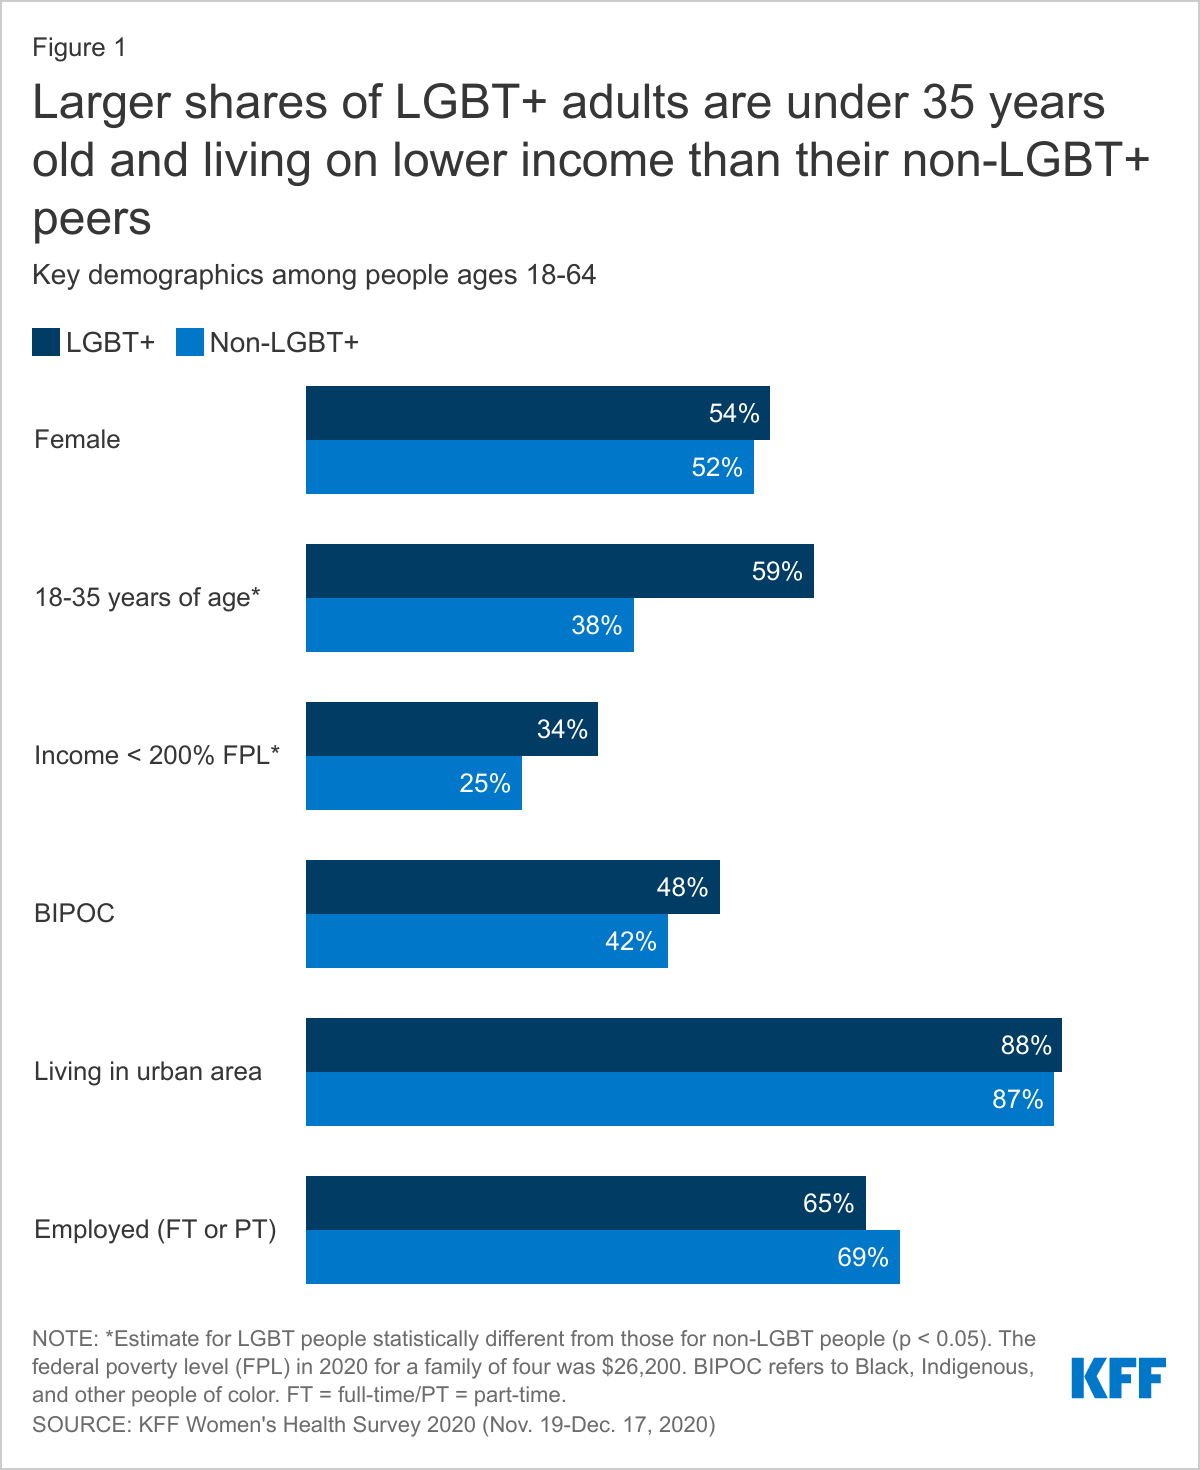
The demographics of the LGBT+ community differ in some ways from that of their non-LGBT+ counterparts, differences that may have implications for health needs and access (Figure 1):
- LGBT+ people are younger than non-LGBT+ people. More than half (59%) are between the ages of 18-35 compared to 38% of non-LGBT+ people.
- LGBT+ people are also more likely to be low-income, with 34% having incomes below 200% of the federal poverty level (FPL)3 compared to 25% of non-LGBT+ people.
- While LGBT+ people report being employed at similar rates to non-LGBT+ people (65% v. 69%, respectively), they more commonly report that their employment is part-time (17% v. 12%, not shown in figure).
- Similar shares of LGBT+ and non-LGBT+ individuals are people of color, identify as female, and live in urban areas.
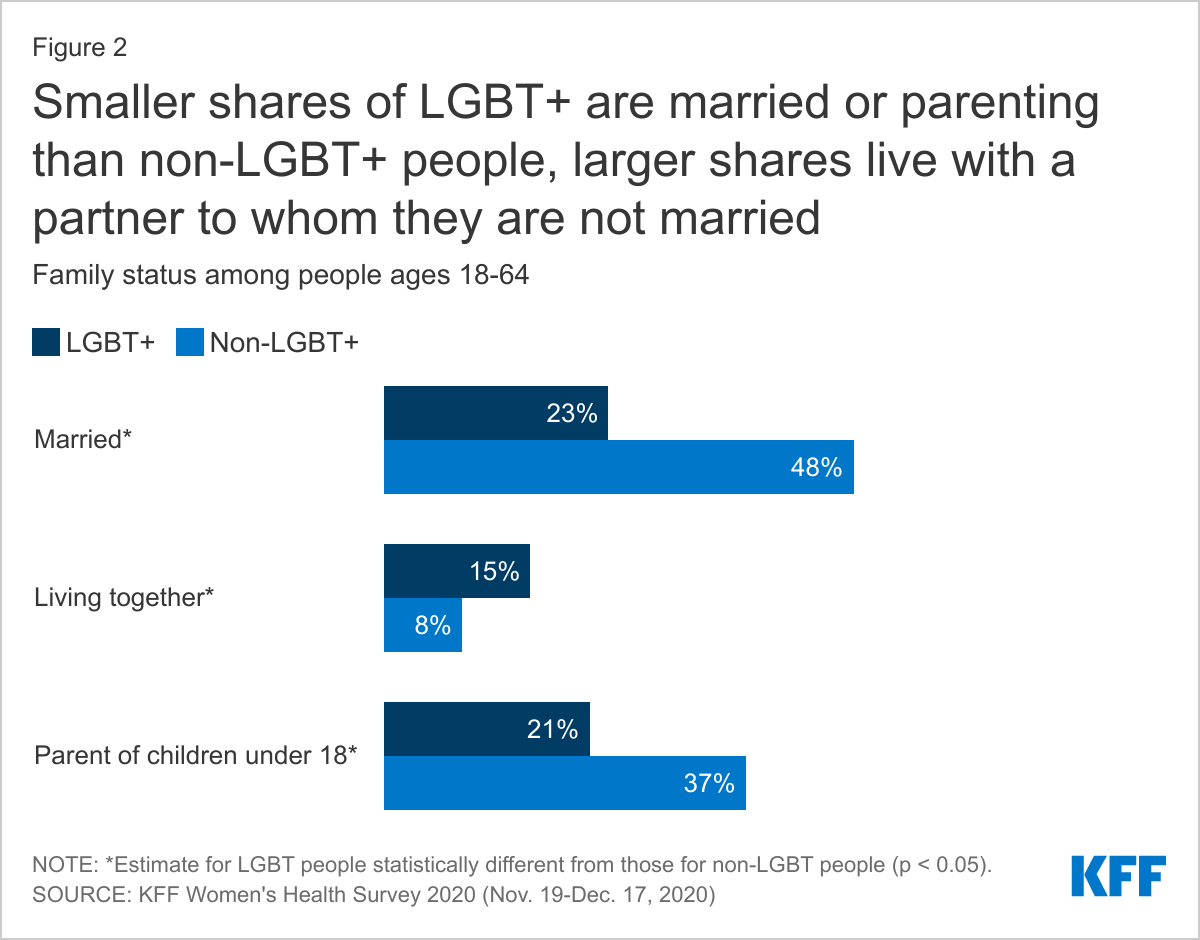
Family structure also differs for LGBT+ and non-LGBT+ people, differences which may have bearing on health and insurance coverage (Figure 2).
- LGBT+ people are less likely to be living with a partner than non-LGBT+ people (39% v. 56%), including being half as likely to be married (23% v. 48%). LGBT+ people are more likely, however, to be living with a partner to whom they are not married (15% v. 8%).
- One in five LGBT+ people (21%) are parents of children under age 18, a smaller share than non-LGBT+ adults (37%).
Health Status
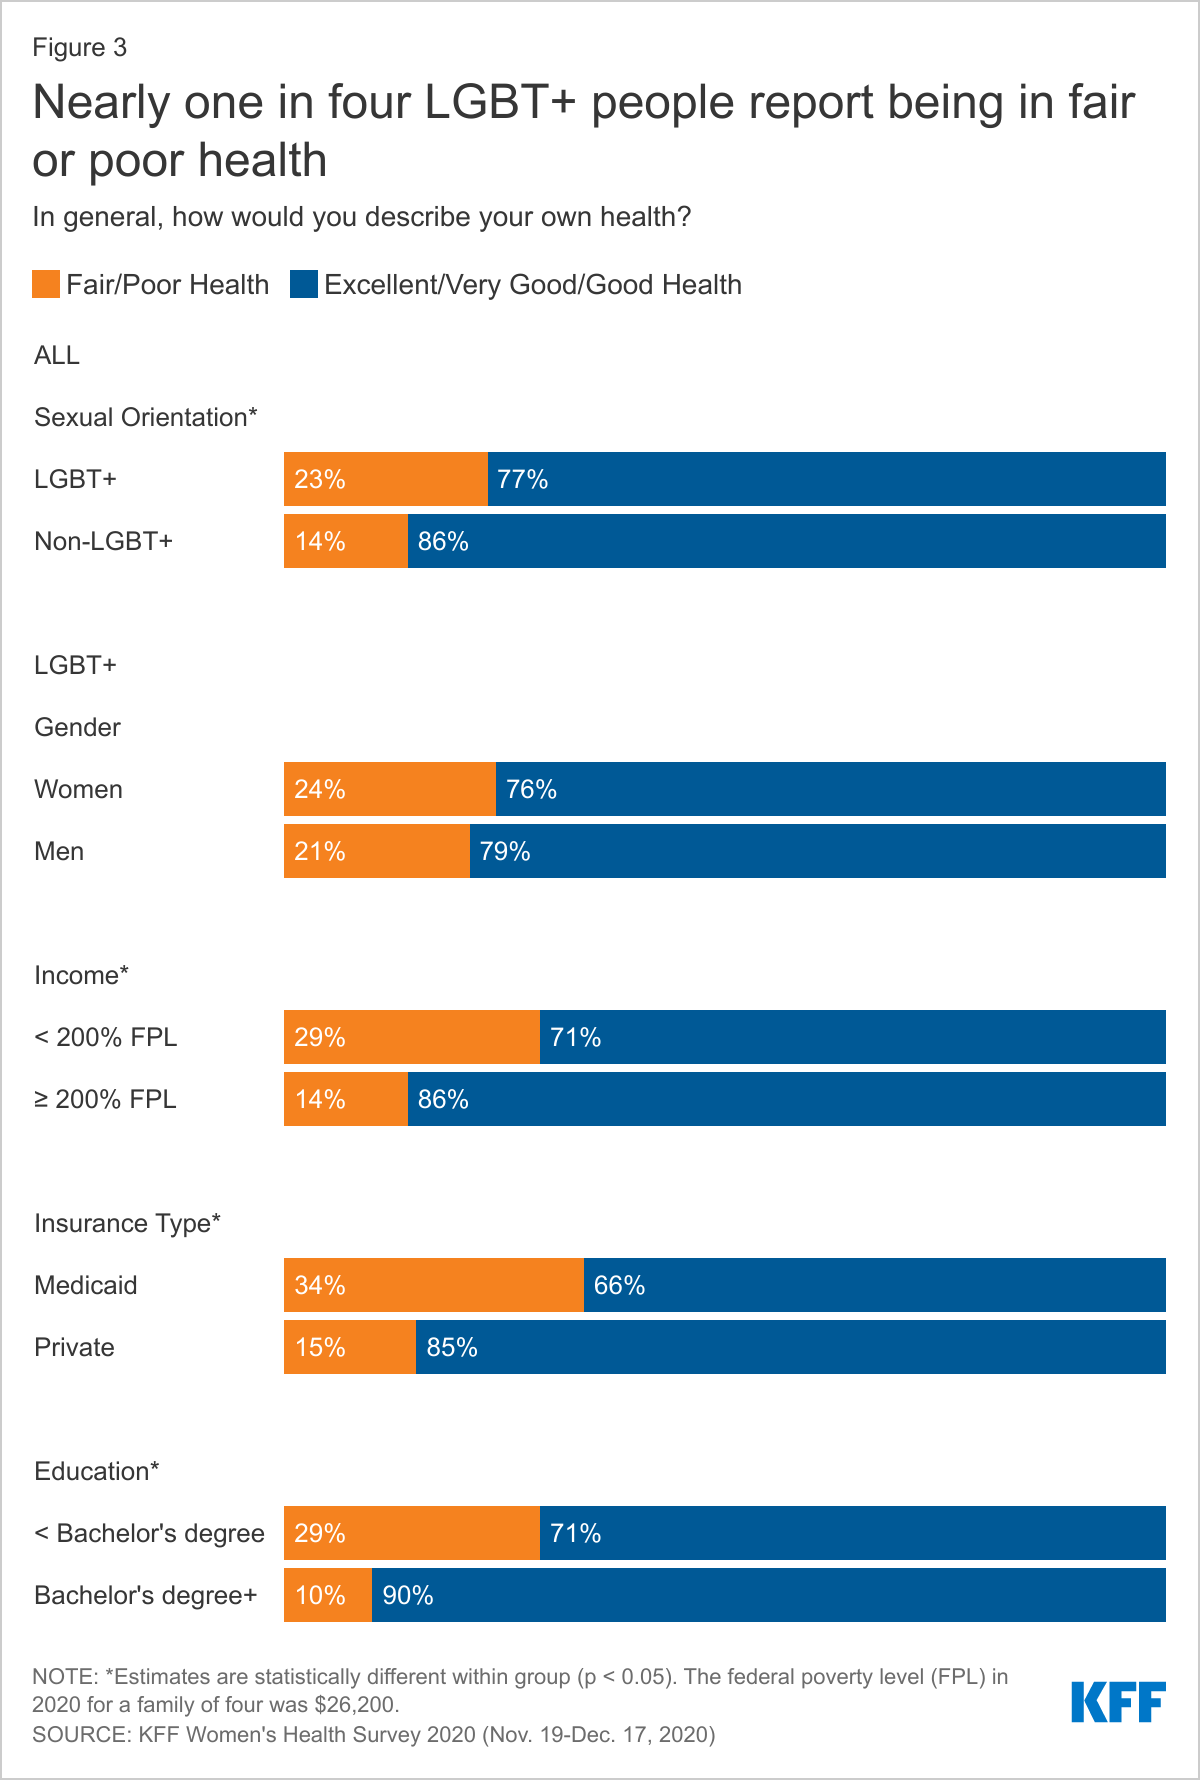
Data on the health status of the LGBT+ community reveals some of the disparities that exist for this group compared to their non-LGBT+ peers (Figure 3).
- Despite being a younger population that would typically be expected to be in better health, LGBT+ people more commonly report that their health is fair or poor than non-LGBT+ people (23% v. 14%), who are more likely to report good or excellent health (86% v. 77%).
- Among LGBT+ people, those with Medicaid coverage (compared to private insurance4 ), lower education, and lower incomes report fair/poor health status at higher rates than their LGBT+ peers in other groups.
Chronic Health Conditions and Disabilities
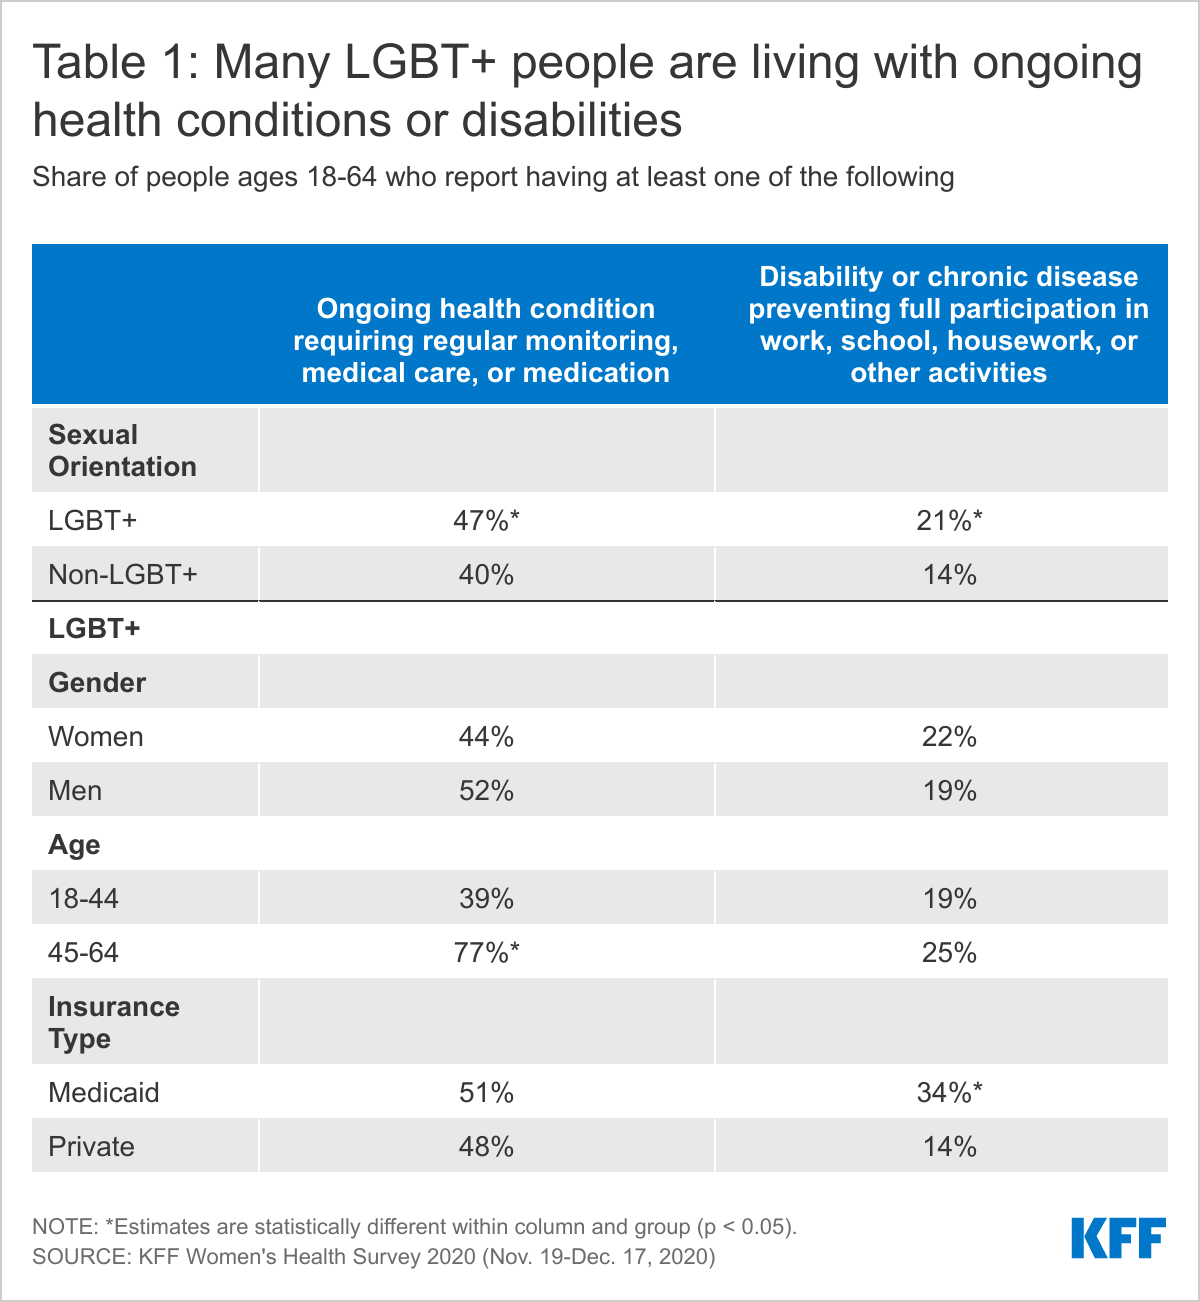
Many LGBT+ people are managing chronic conditions or living with disabilities that impact daily life, in some cases more so than among non-LGBT+ people (Table 1).
- Almost half (47%) of LGBT+ people report that they have an ongoing health condition that requires regular monitoring, medical care, or medication, a higher share than for non-LGBT+ people (40%).
- This is particularly the case for LGBT+ people aged 45 and older, who are twice as likely to report having an ongoing health condition than younger LGBT+ people (77% v. 39%).
- LGBT+ men and women report similar rates of an ongoing health conditions (52% and 44%, respectively. Similarly, rates of ongoing conditions do not vary between those with private insurance and those with Medicaid (48% and 51%, respectively).
- A larger share of LGBT+ people report having a disability or chronic disease that keeps them from participating fully in work, school, housework, or other activities than non-LGBT+ people (21% v. 14%).
- LGBT+ people with Medicaid are more likely to report a disability or limiting chronic disease than LGBT+ people with private insurance (34% v.14%).
Health Care Access
Sites of Care and Providers
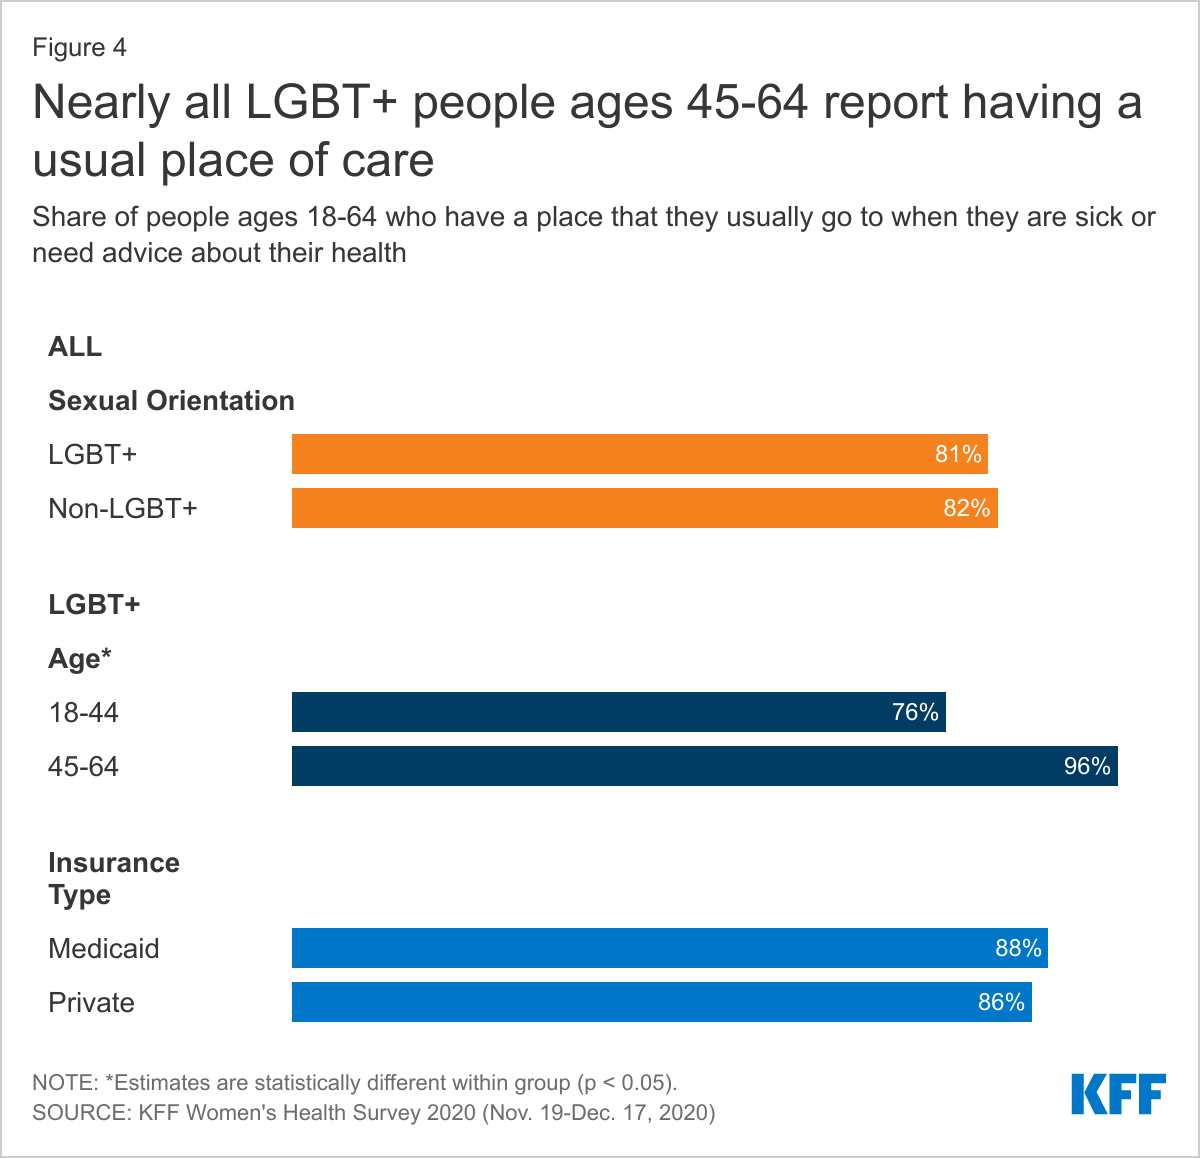
LGBT+ people are as likely to have a usual source of care and report using similar sites of care as their non-LGBT+ counterparts, factors that are associated with increased use of preventive care and better health outcomes (Figure 4).
- Eighty-one percent (81%) of LGBT+ people report that they have a place they usually go when they are sick or need advice about their health, similar to non-LGBT+ people (82%) and rates increase among older LGBT+ people (96%).
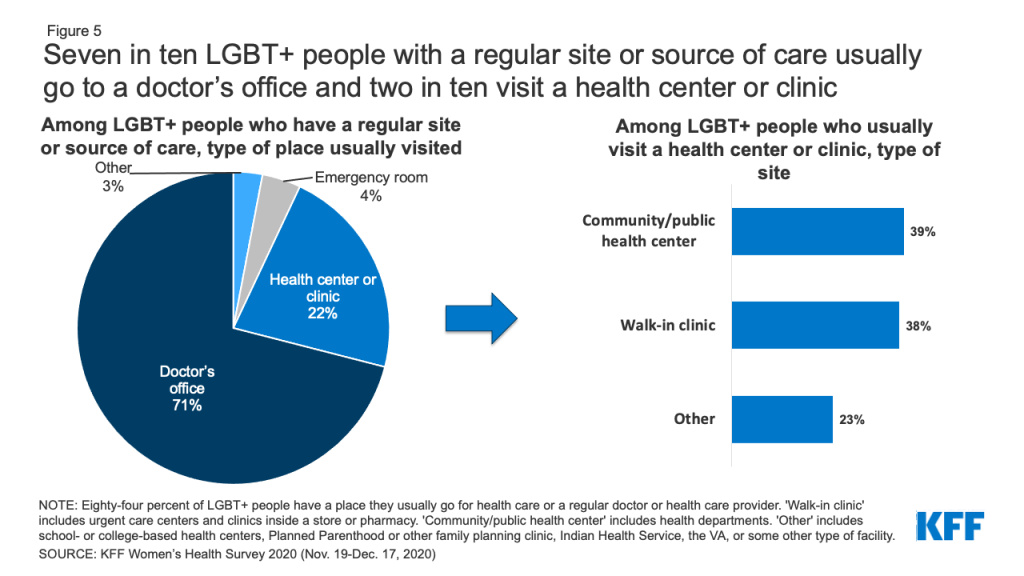
- The type of location where care is received is also similar among LGBT+ and non-LGBT+ people (Figure 5). Most LGBT+ people with a usual source of care receive it at a doctor’s office (71%), though one in five (22%) obtain care at a clinic, such as a health center, urgent care center, or clinic inside a store or pharmacy. Smaller shares go to an emergency room (4%) or some other place (3%).
- Among LGBT+ people who usually visit a health center or clinic, 39% go to a community health center or public health department and 38% go to a walk-in clinic such as an urgent care center or clinic inside a store or pharmacy.
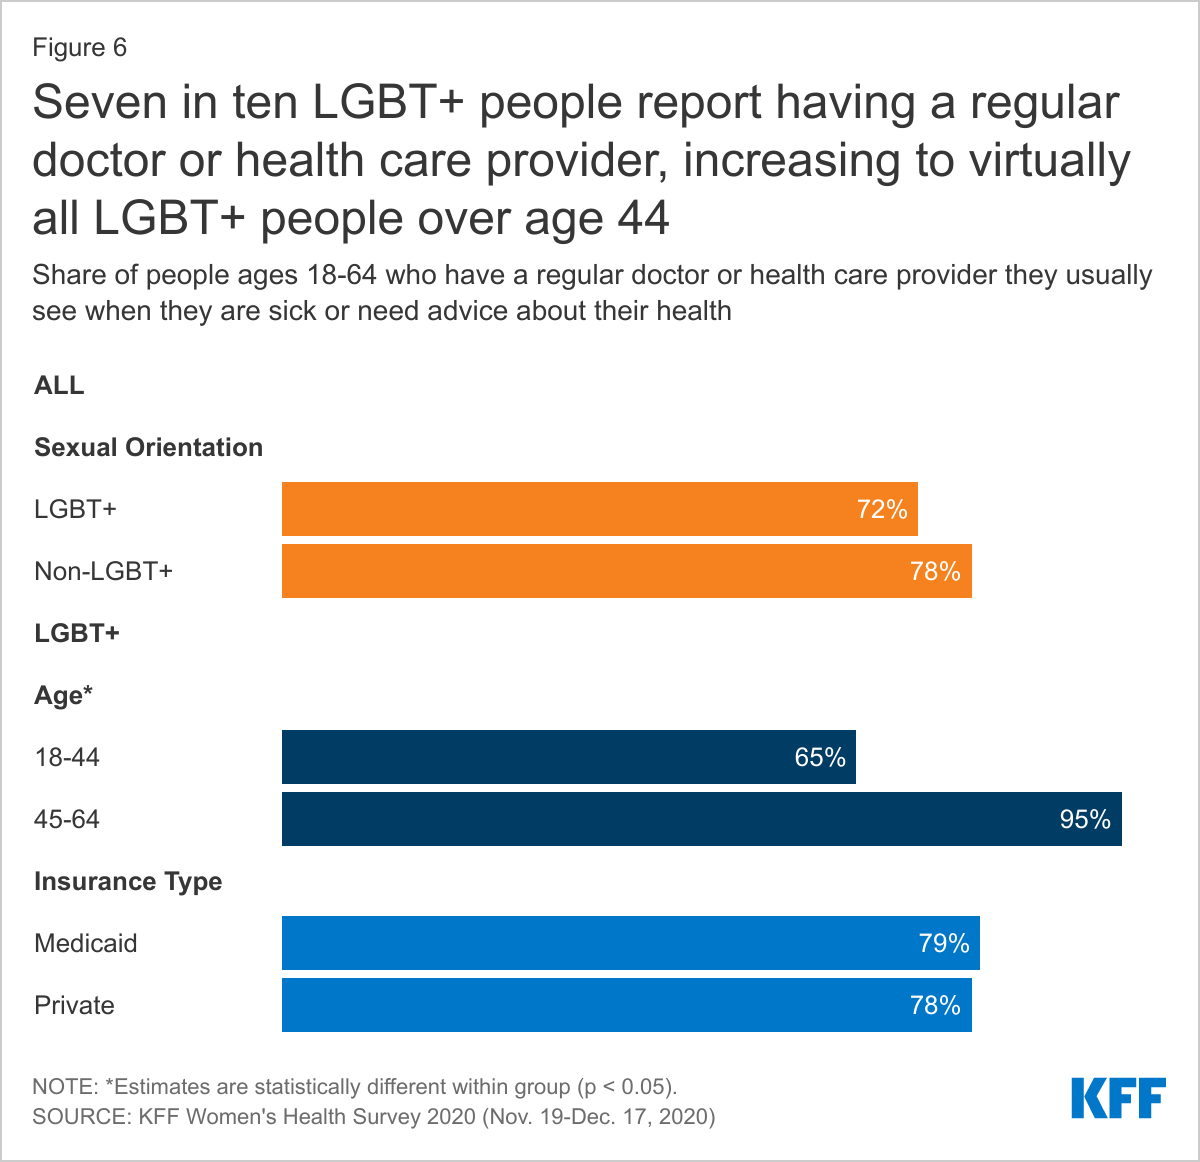
- In addition to having a regular place to get care, most LGBT+ people (72%) have a regular doctor or health care provider they see when they are sick or need routine care, similar to non-LGBT+ people (78%) (Figure 6).
- This share increases with age, from 65% among those 18-44 years old to 95% among those 45-65 years old but does not differ between those with private insurance and those with Medicaid.
- Despite these high rates, 16% of LGBT+ people with an ongoing health condition that requires regular monitoring, medical care, or medication do not have a regular provider (data not shown in figure).
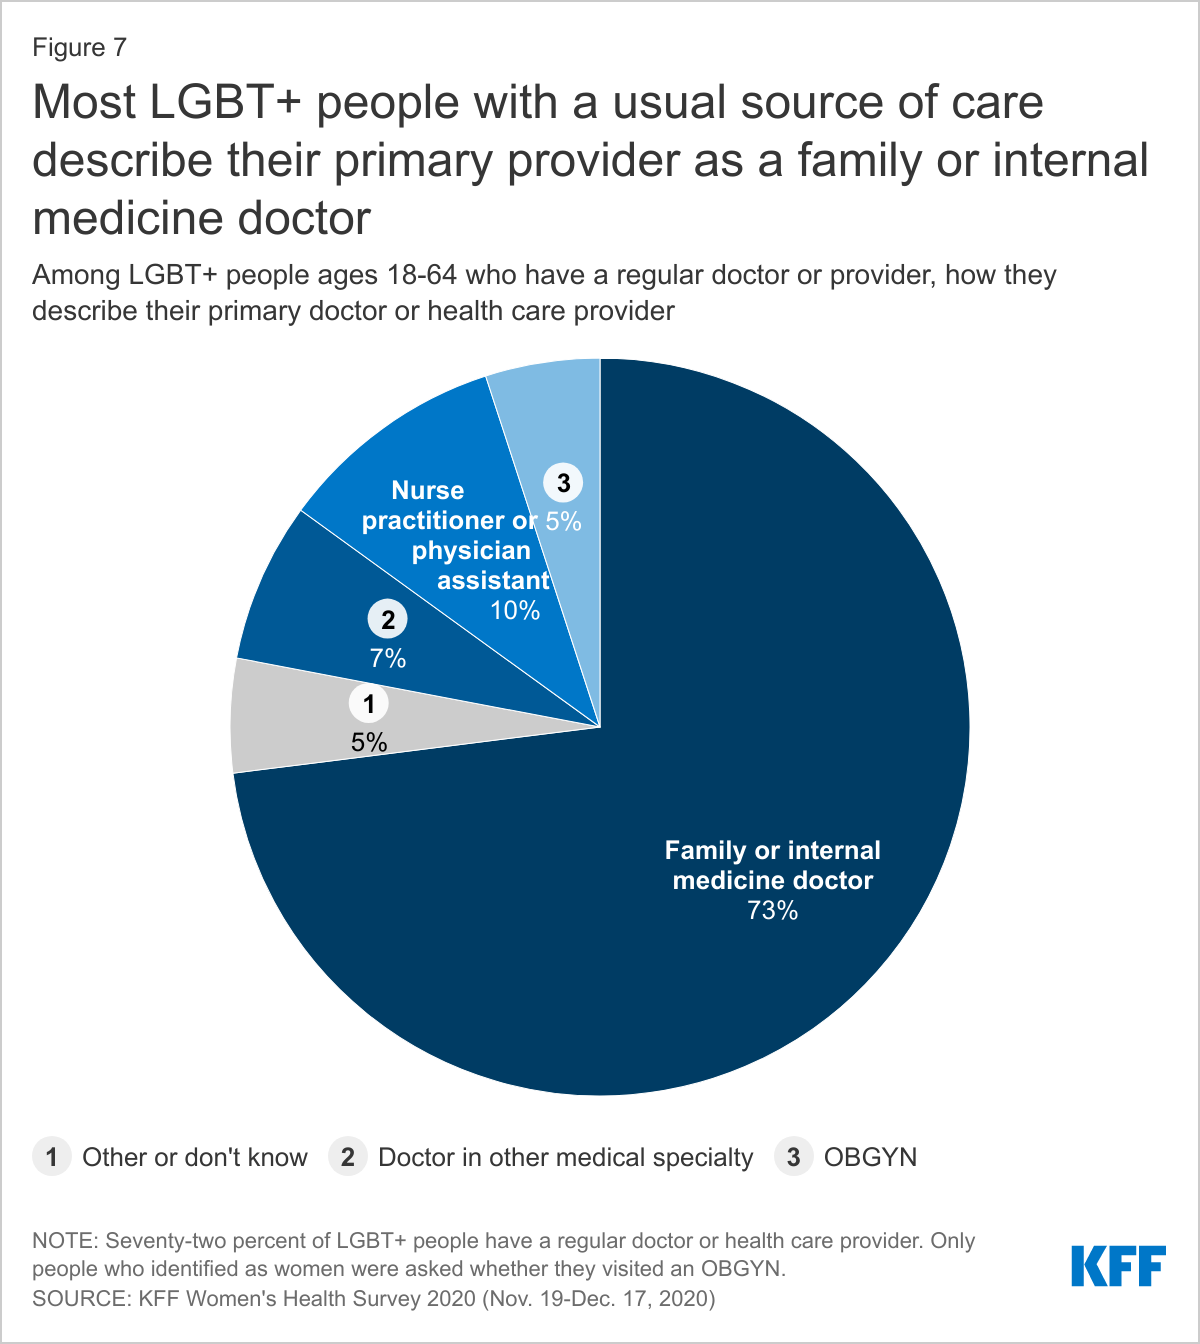
- About seven in ten (73%) LGBT+ people with a regular doctor report that they obtain their health care from a family or internal medicine doctor. Ten percent (10%) describe their primary provider as a physician assistant or nurse practitioner. Smaller shares see another type of provider (Figure 7).
Experiences Accessing Care
LGBT+ people report different, and in some case more challenging, experiences accessing care than their non-LGBT+ peers.
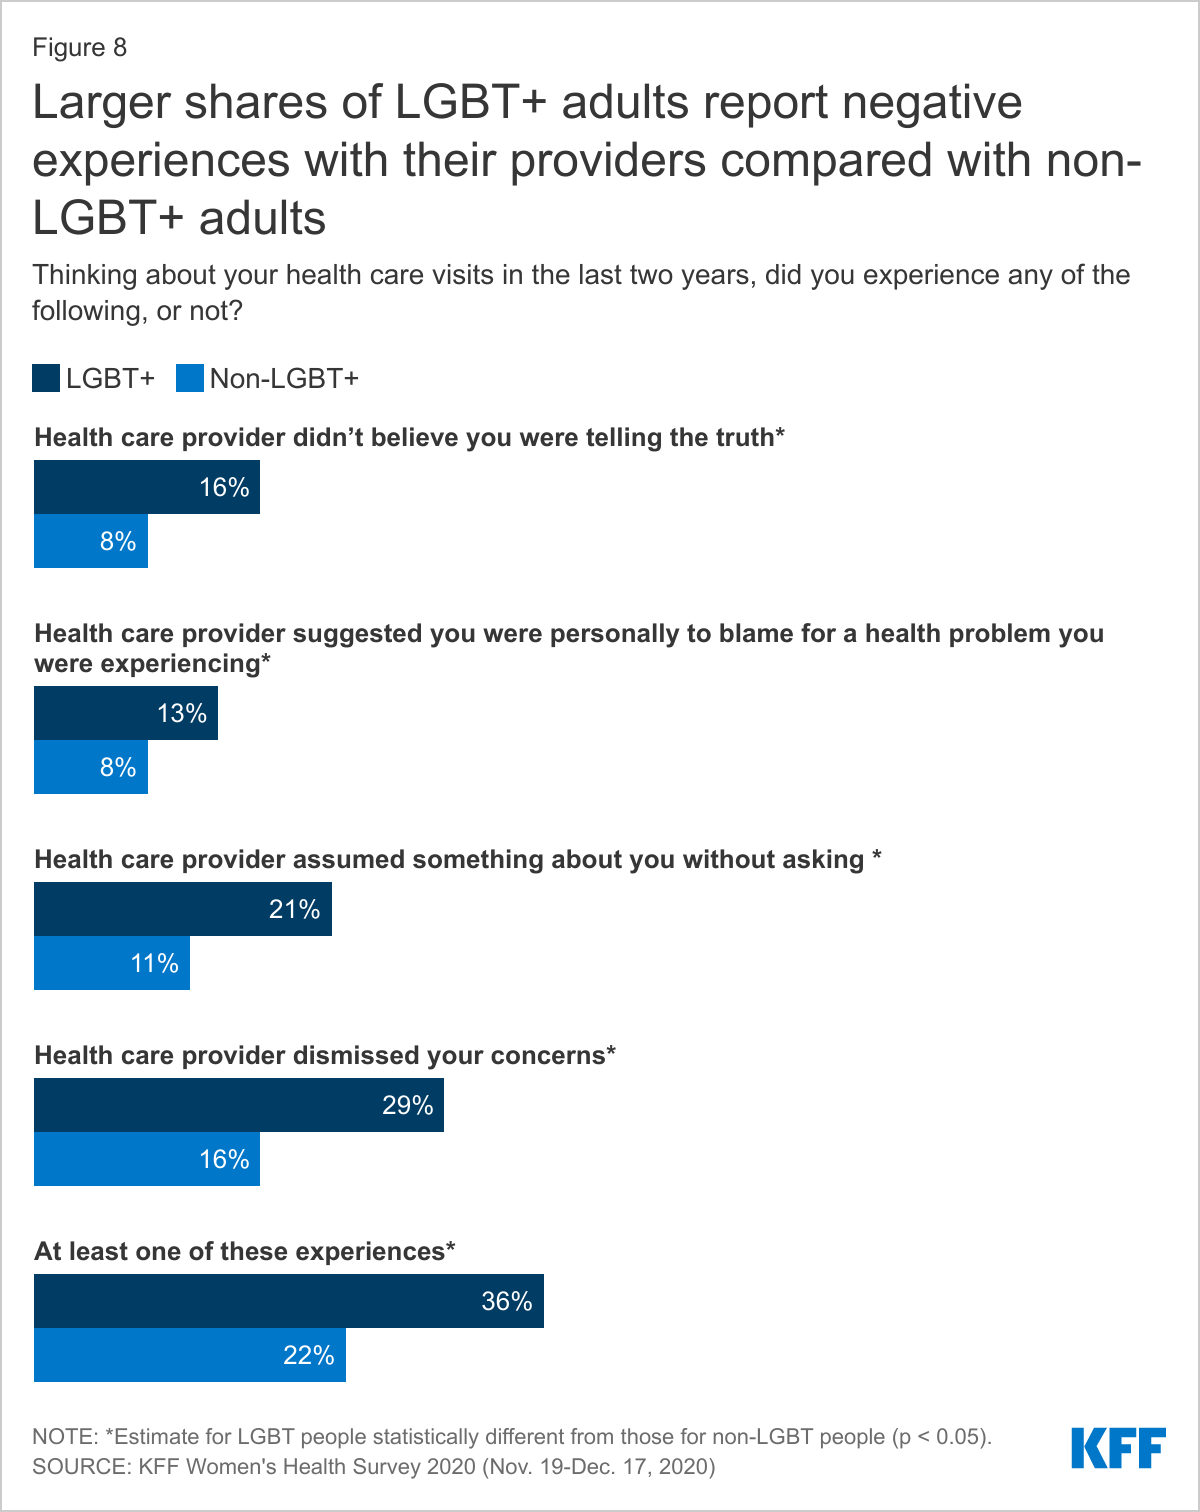
- LGBT+ people are more likely to report the following providers experiences compared to non-LGBT+ people (Figure 8). Had a provider…
- Not believe they were telling the truth (16% v. 8%)
- Suggest they were personally to blame for a health problem (13% v. 8%)
- Assume something about them without asking (21% v. 11%)
- Dismiss their concerns (29% v. 16%)
- Altogether, over one-third (36%) of LGBT+ people reported at least one of these negative experiences with a provider, compared to fewer than one in five (22%) non-LGBT+ people.
- Generally, these differences were especially apparent among LGBT+ women compared to non-LGBT+ women (data not shown).
- Those reporting mistreatment most commonly thought they were treated this way because of their age, followed by their gender, and then race/ethnicity. LGBT+ women are more likely to believe they had received poor treatment because of their gender compared to non-LGBT+ women (33% v. 18%).
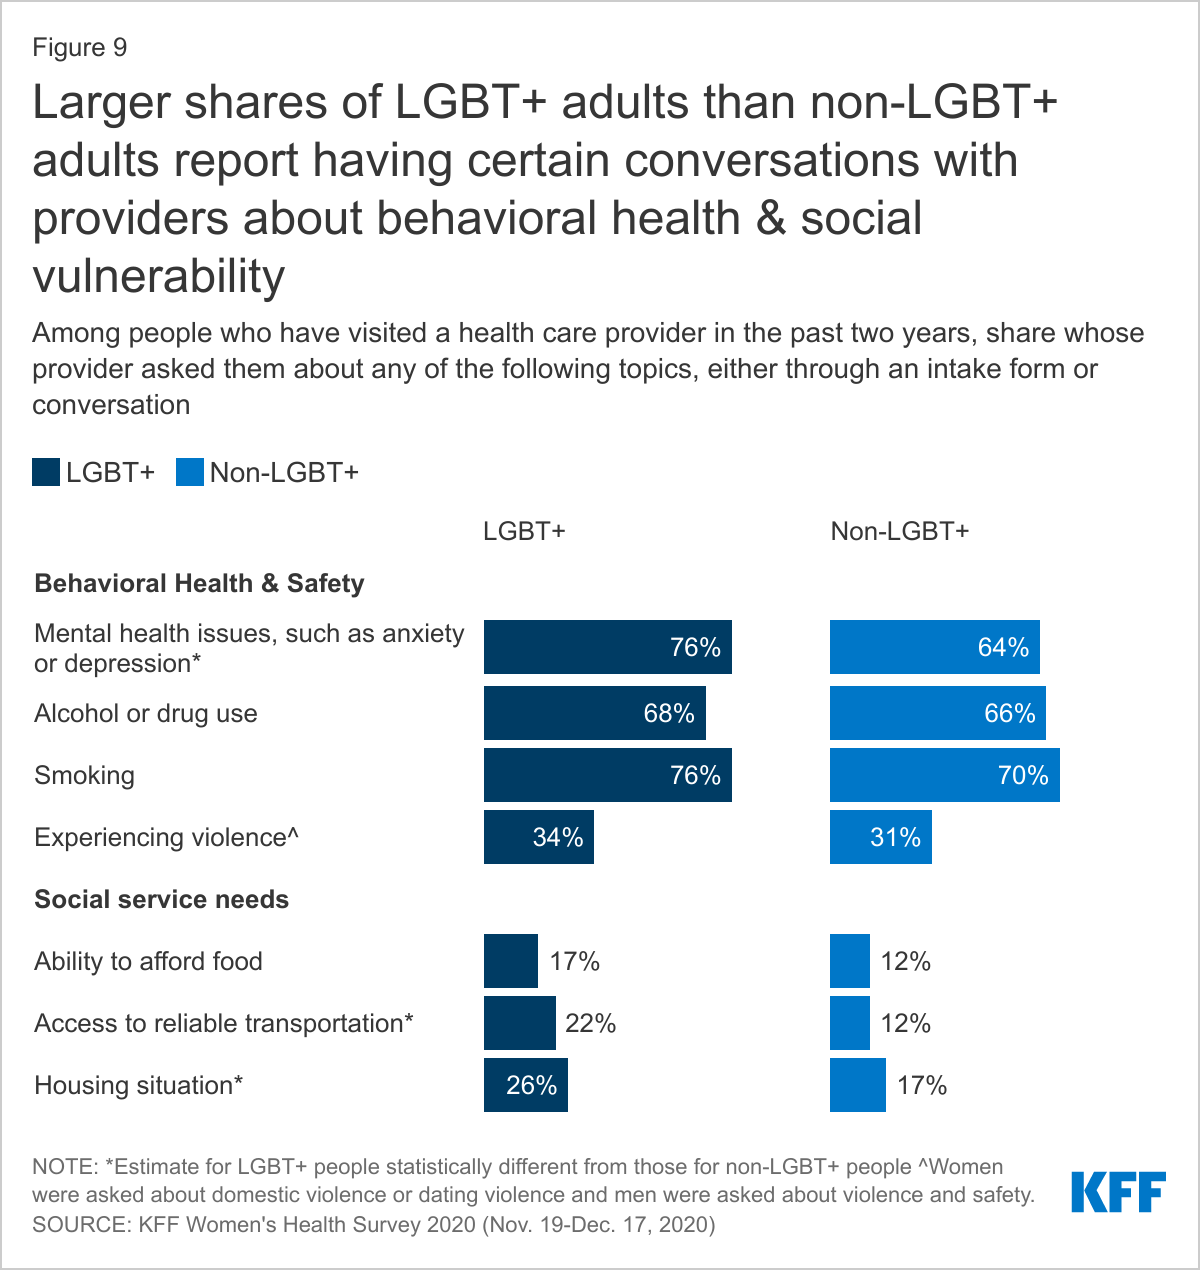
While larger shares of LGBT+ than non-LGBT+ people reported negative provider experiences, LGBT+ people are also more likely to discuss certain health issues with their providers (Figure 9).
- Larger shares of LGBT+ people report having had a conversation with a provider or being asked about mental health than non-LGBT+ people (76% v. 64%), potentially reflecting higher mental health care needs in this group. Similar shares of LGBT+ people and non-LGBT+ people report having conversations or being asked about smoking (76% v. 70%) and alcohol or drug use (68% vs. 66%).
- LGBT+ people are more likely than non-LGBT+ people to have had a conversation about or been asked on a form about social vulnerability issues including housing security (26% v. 17%) and access to reliable transportation (22% v. 12%). (LGBT+ people are also more likely to discuss sexual health with their providers – see section on Sexual Health.)
Health Care Costs
LGBT+ people report having problems with health care costs at higher rates than non-LGBT+ people, including those related to medical bills and other insurance costs, potentially reflecting both lower incomes and higher health needs.
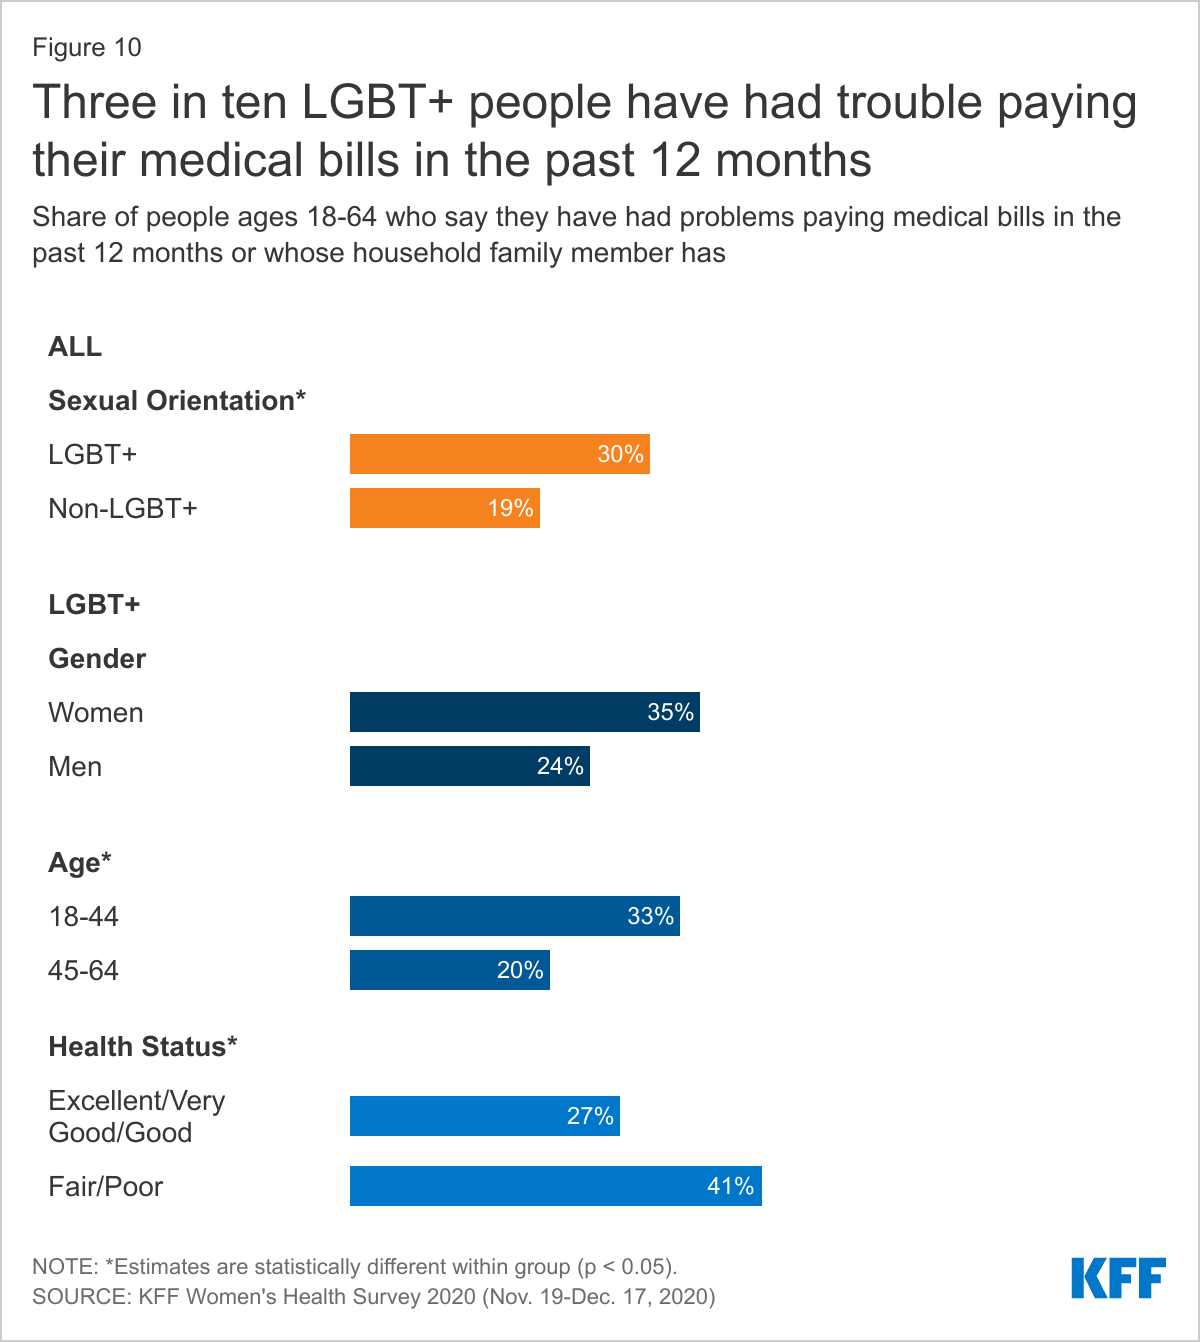
- A larger share of LGBT+ people report that they or a household family member has had problems paying medical bills in the past 12 months than non-LGBT+ people (30% v. 19%) (Figure 10).
- This was more common among LGBT+ people ages 18-44 than ages 45-64 (33% v. 20%) and LGBT+ people in self-described poorer health (41% v. 27%), findings that may be correlated with income.
- Thirty-five percent (35%) of LGBT+ women have had problems paying medical bills in the past two years, as have nearly one-quarter of LGBT+ men (24%).
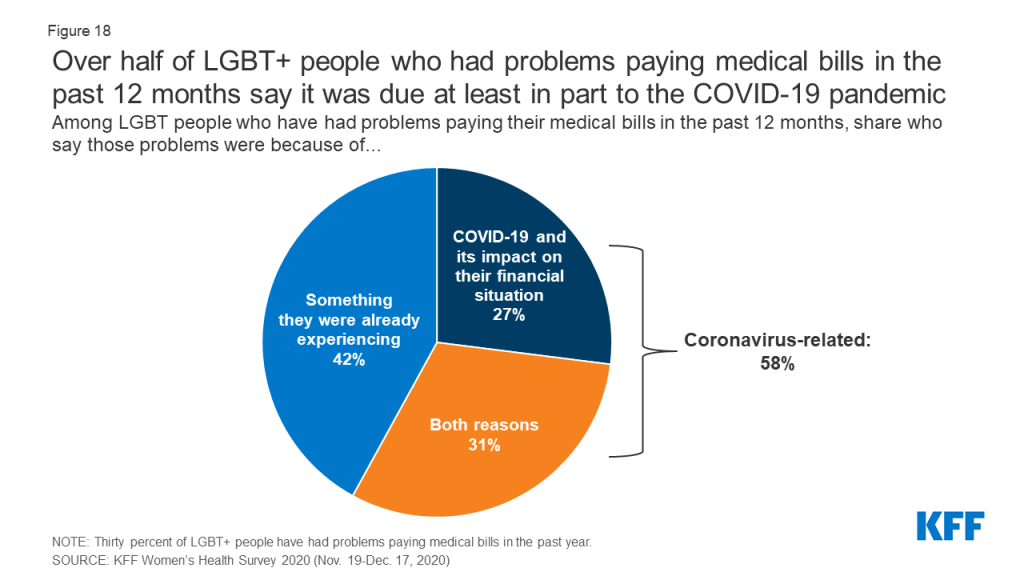
- Among the 30% of LGBT+ people who had trouble paying medical bills in the past 12 months, nearly six in ten (58%) say that it was due, at least in part, to the COVID-19 pandemic. (See the COVID-19 Experiences section for more details.)
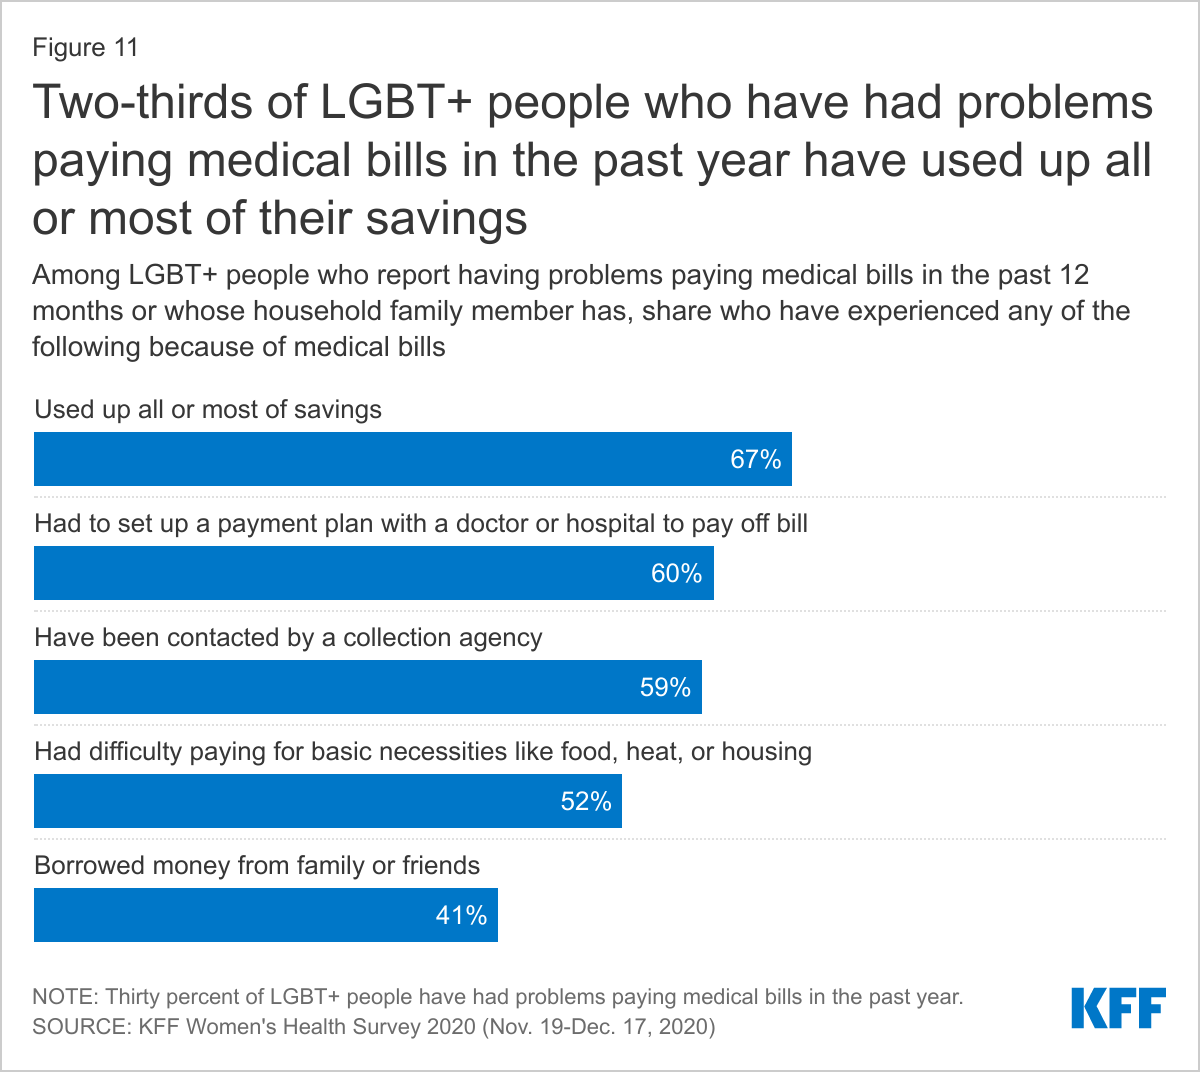
Medical bills have consequences on LGBT+ people’s financial well-being, including their ability to afford basic necessities, similar to experiences among non-LGBT+ people (Figure 11).
- Among the 30% of LGBT+ people who report having trouble paying medical bills in the past 12 months, two-thirds (67%) say they used up all or most of their savings, and six in ten had to set up a payment plan with a doctor or hospital (60%) and/or have been contacted by a collection agency (59%).
- Half (52%) of LGBT+ people who had trouble paying medical bills in the past 12 months have had difficulty paying for basic necessities like food, heat, or housing, and four in ten (41%) borrowed money from family or friends.
Insurance Barriers
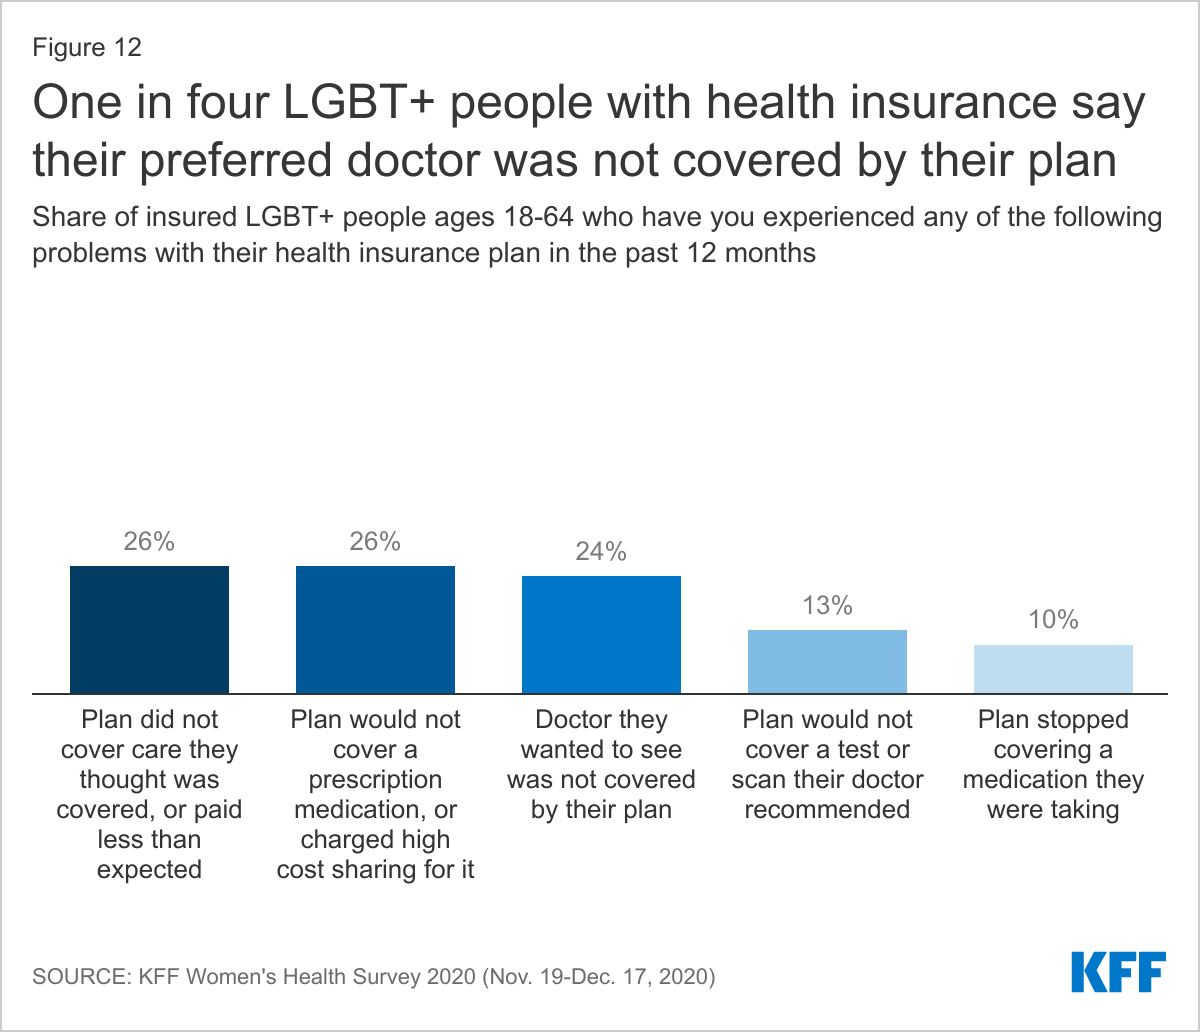
Even with health insurance, some LGBT+ people experience barriers or problems accessing or paying for health care (Figure 12).
- Similar to non-LGBT+ people, one in four (25%) LGBT+ people with health insurance report their plan would not cover a prescription medication, or charged high cost sharing for it, in the past 12 months; 10% say their plan stopped covering a medication they were taking; and 13% say that their plan would not cover a test or scan their doctor recommended.
- About one in four (26%) LGBT+ people with health insurance report that their plan did not cover a medical bill for themselves or a family member that they thought would be covered, or that it paid less for that service than expected. Twenty-four percent (24%) say the doctor they wanted to see was not covered by their health plan.
Utilization of Health Services
In addition to asking about experiences with and barriers related to accessing health care, we explored LGBT+ people’s use of primary care services, including prescription drugs, wellness check-ups, and preventive cancer screenings. Utilization rates among LGBT+ and non-LGBT+ people vary considerably by service type
Prescription Drug Use
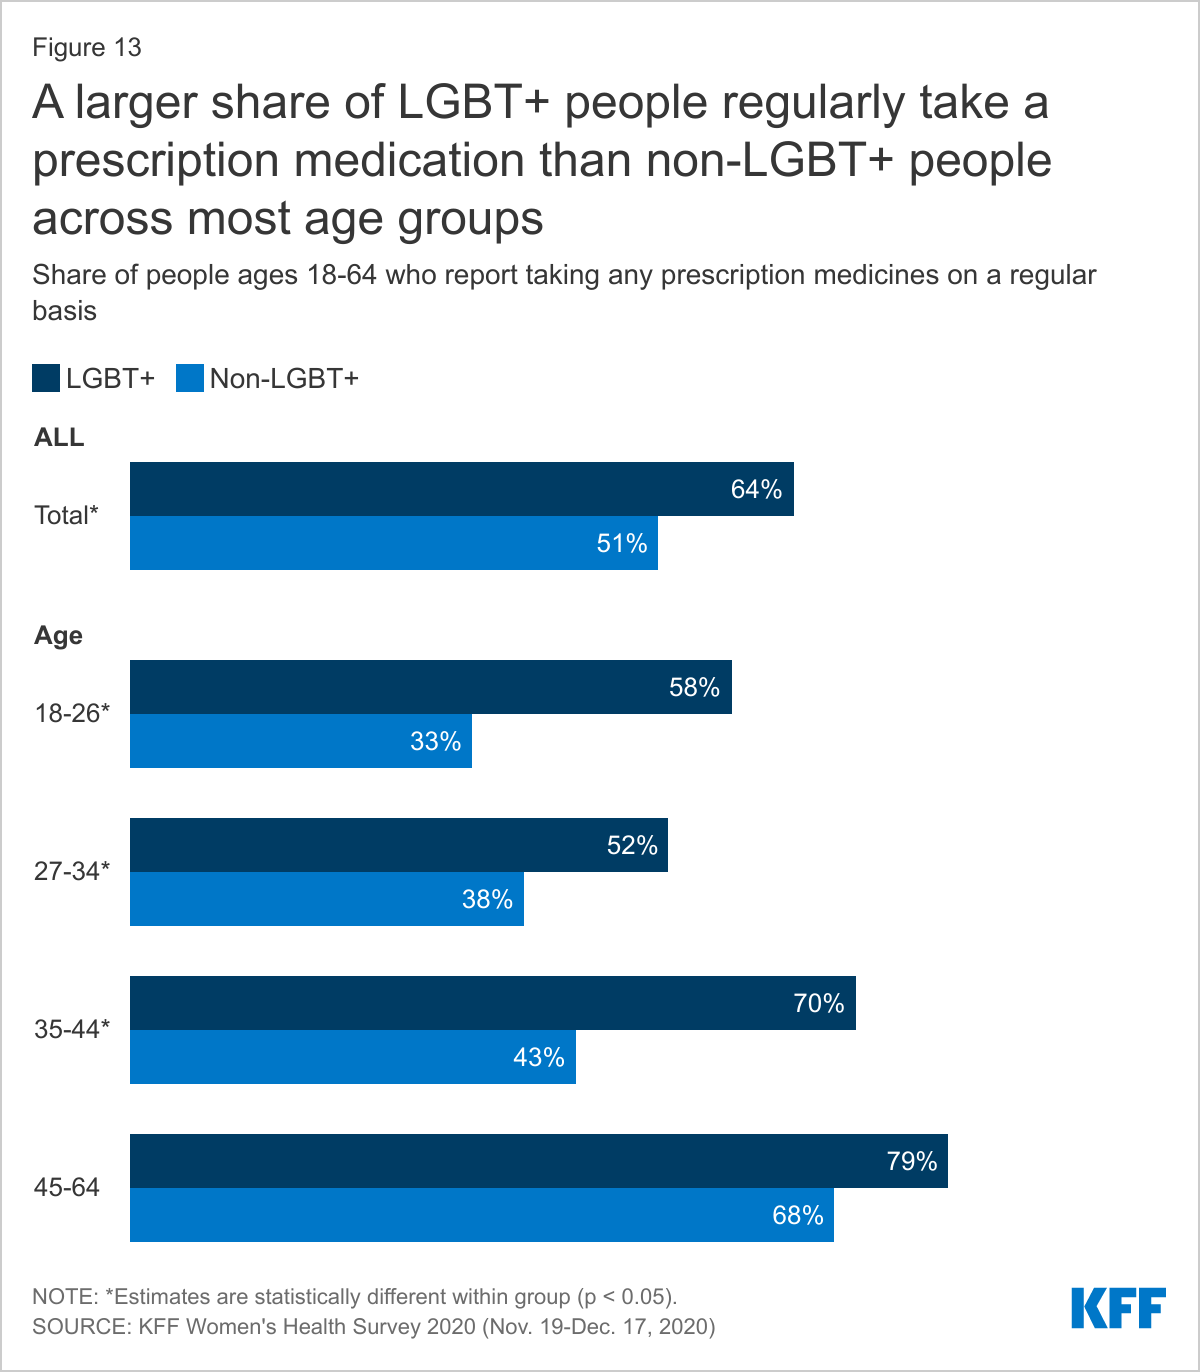
People take prescription medications for a range of reasons including to treat or manage chronic conditions and acute illnesses or to prevent pregnancy. Larger shares of LGBT+ people report taking at least one prescription medication on a regular basis than non-LGBT+ people (64% v. 51%) and as with non-LGBT+ people, prescription use increases with age (Figure 13).
General Check-ups
Regular provider visits give people an opportunity to address new, chronic, and emerging health issues, access preventive screenings, and discuss a broad range of issues with a clinician.
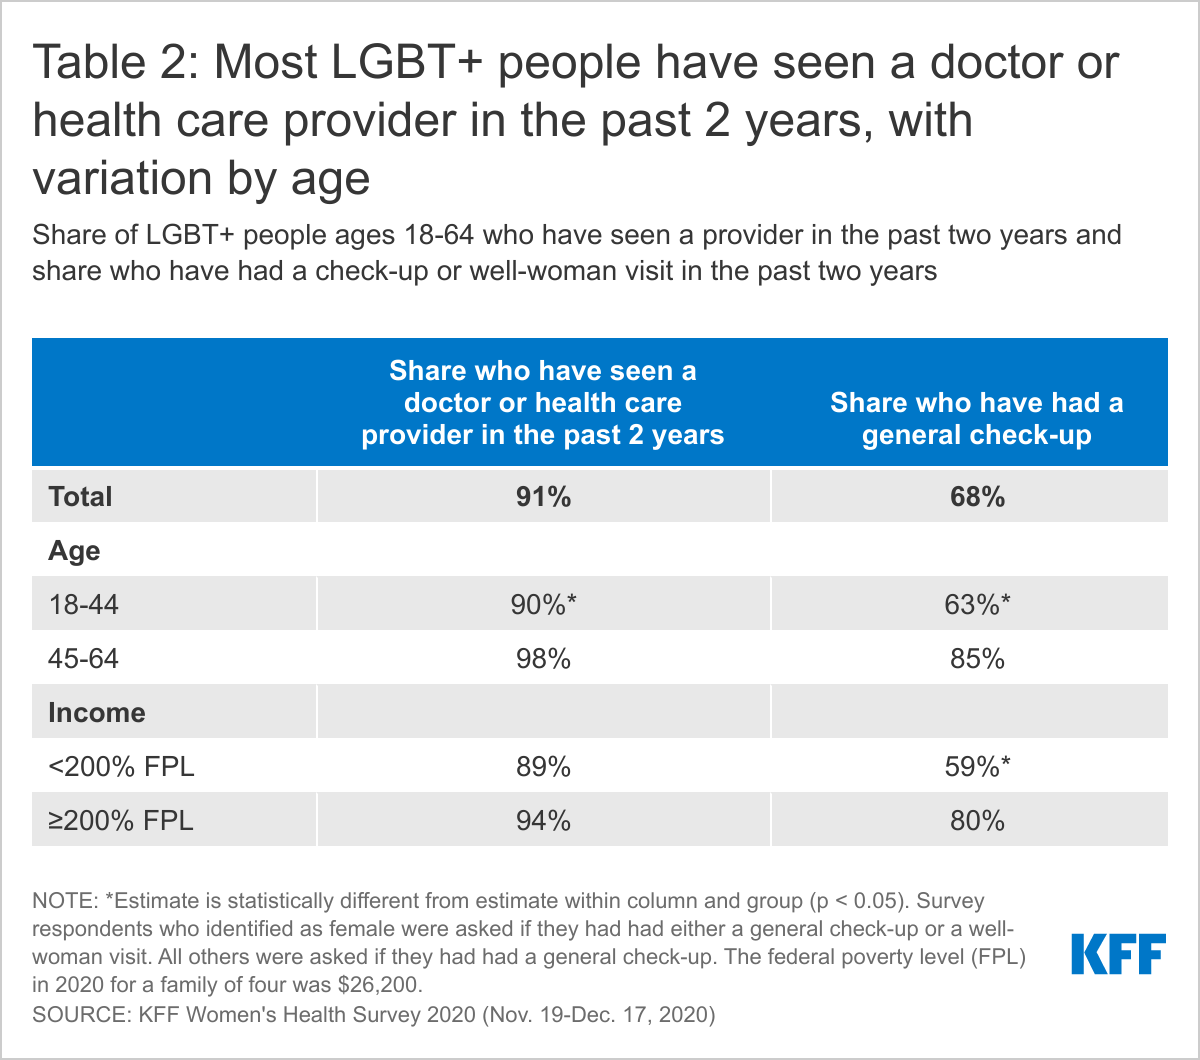
- While nine in ten (91%) LGBT+ people have seen a doctor or health care provider in the past two years, just three-quarters (68%) of this group has had a general check-up or well-woman visit5 in the past two years (Table 2). These shares are similar to non-LGBT+ people (90% and 71%, respectively).
Cancer Screenings
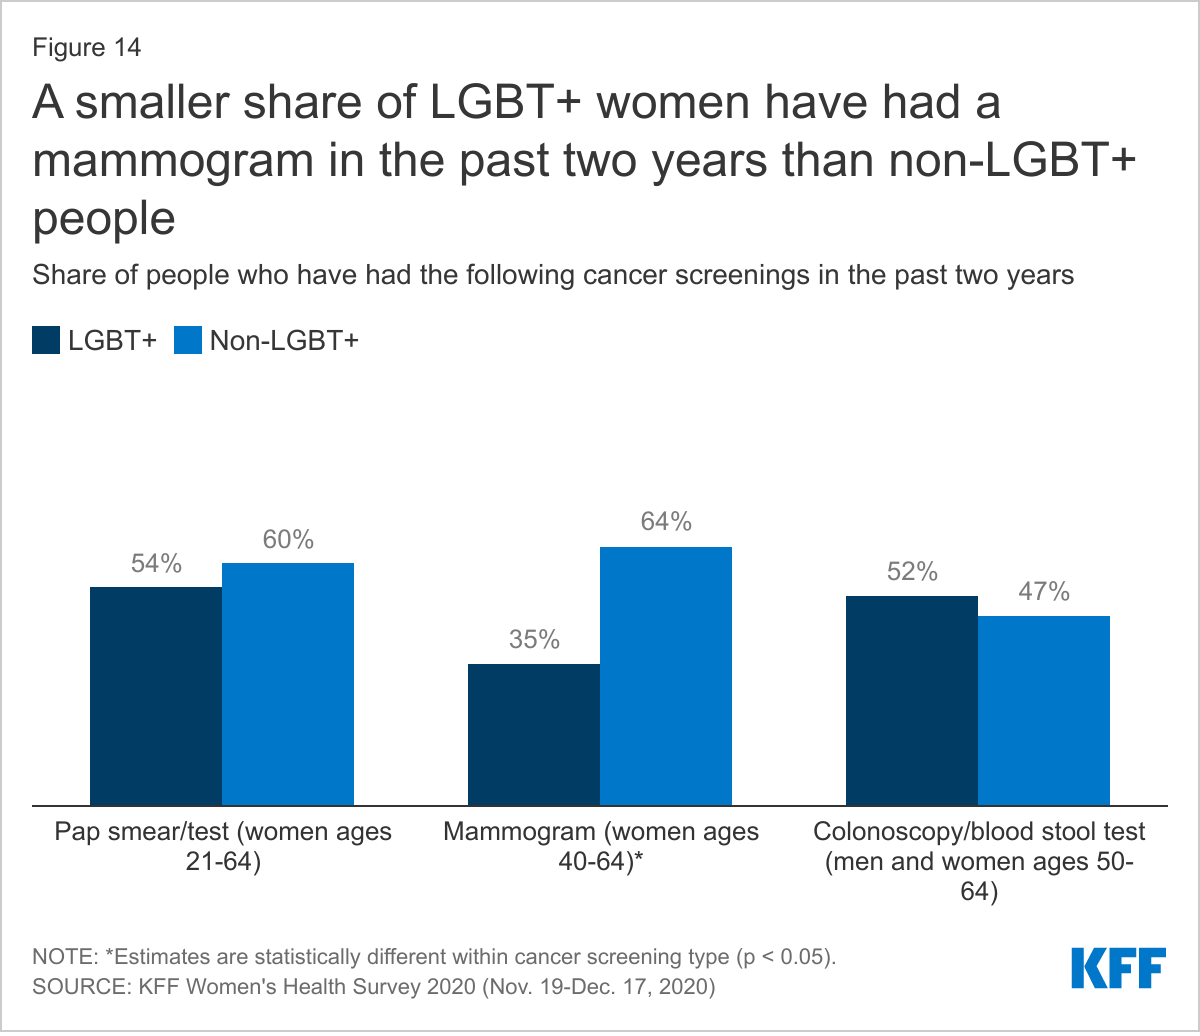
Use of preventive cancer screenings can lead to early identification of conditions when they are more responsive to medical interventions and potentially avert serious complications (Figure 14).
- Substantially smaller shares of LGBT+ women aged 40-64 report having had a mammogram in the past two years than non-LGBT+ women (35% v. 64%).
- LGBT+ people in the targeted screening groups report having Pap smears and colon cancer screenings in the past two years at similar rates as non-LGBT+ people (54% v. 60% and 52% v. 47%, respectively).
COVID-19 Pandemic Experiences
The COVID-19 pandemic has impacted people’s lives across the country. In some cases, LGBT+ people have had similar COVID-related experiences to non-LGBT+ people, but in other situations, they faced more challenging circumstances.
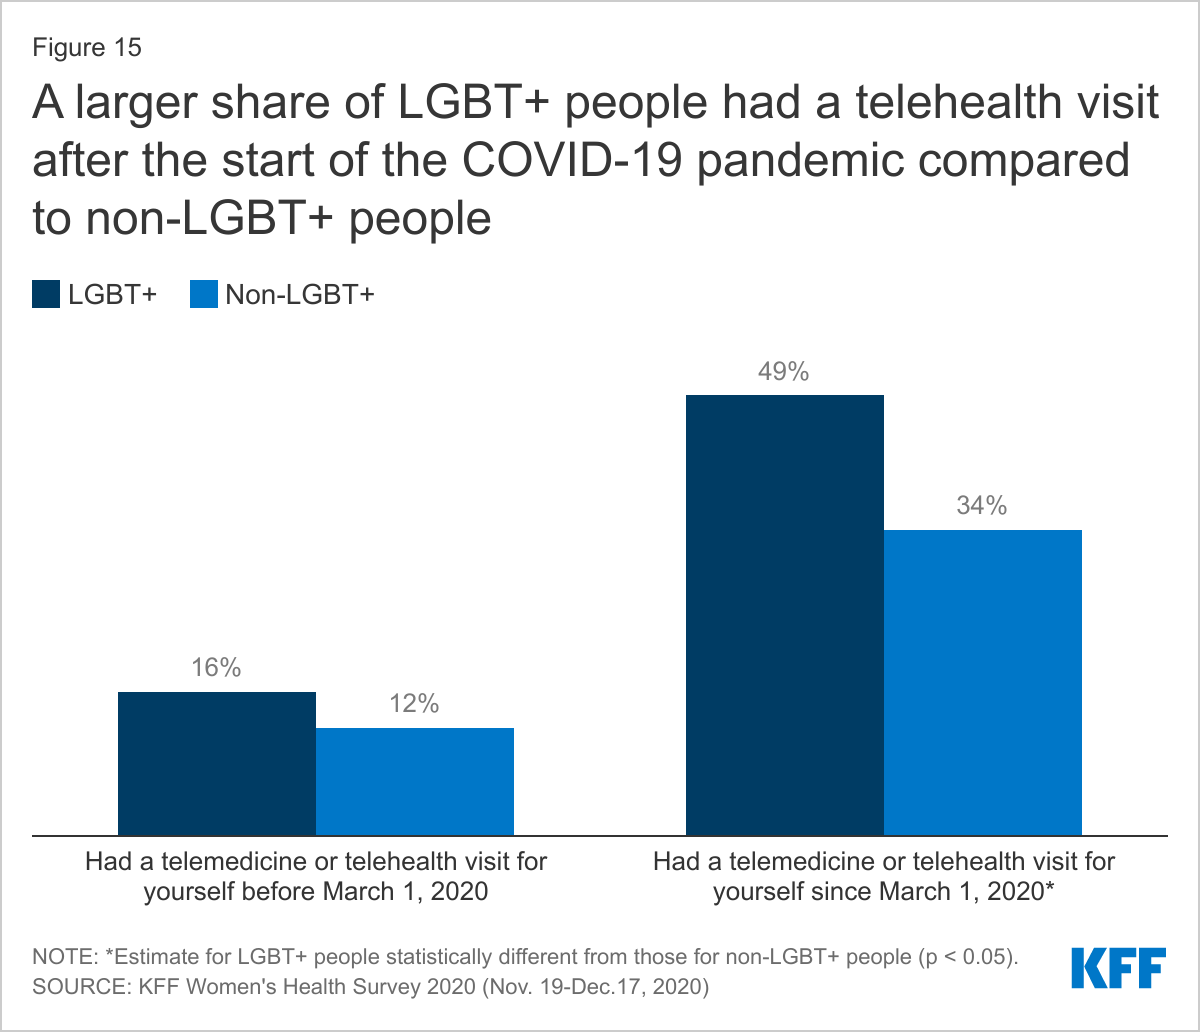
- LGBT+ people and non-LGBT+ people reported having used telehealth at similarly low rates prior to the pandemic (16% v 12%, respectively). While experience with telehealth increased for both groups during the pandemic, it was higher among LGBT people (49% v. 34%, respectively) (Figure 15).
- LGBT+ people and non-LGBT+ people reported difficulty getting appointments (29% v. 25%) and skipping or delaying care at similar rates because of the coronavirus pandemic, including with respect to accessing preventive services (36% v. 31%), a recommended test or treatment (24% v. 18%), and birth control (6% v. 4%).
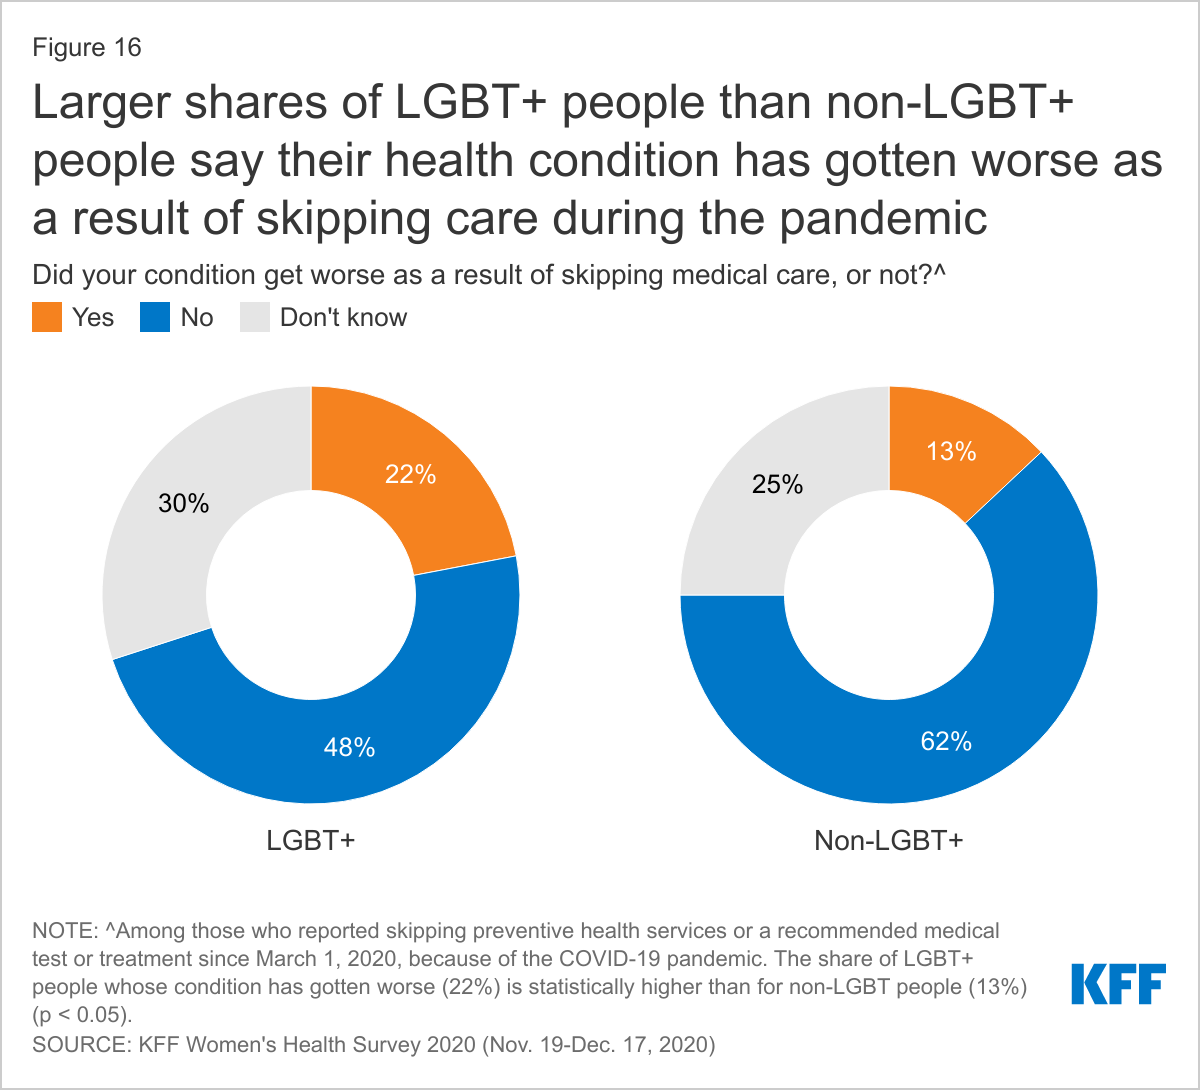
- While LGBT+ and non-LGBT+ people report skipping or delaying care at similar rates by a range of measures, LGBT+ people are more likely to report that their health condition worsened as a result of skipping care than non-LGBT+ people (22% v. 13%) (Figure 16).
- LGBT+ people also report similar rates of veering from prescription drug regimens (e.g., not filling prescriptions, cutting pills in half or skipping doses) as non-LGBT+ people (11% and 9%, respectively).
- In addition, LGBT+ people were more likely to report seeking mental health care because of the pandemic compared to non-LGBT+ people (24% v.12%), potentially reflecting separate findings that LGBT people report the pandemic negatively impacted their mental health more widely and severely than non-LGBT people.
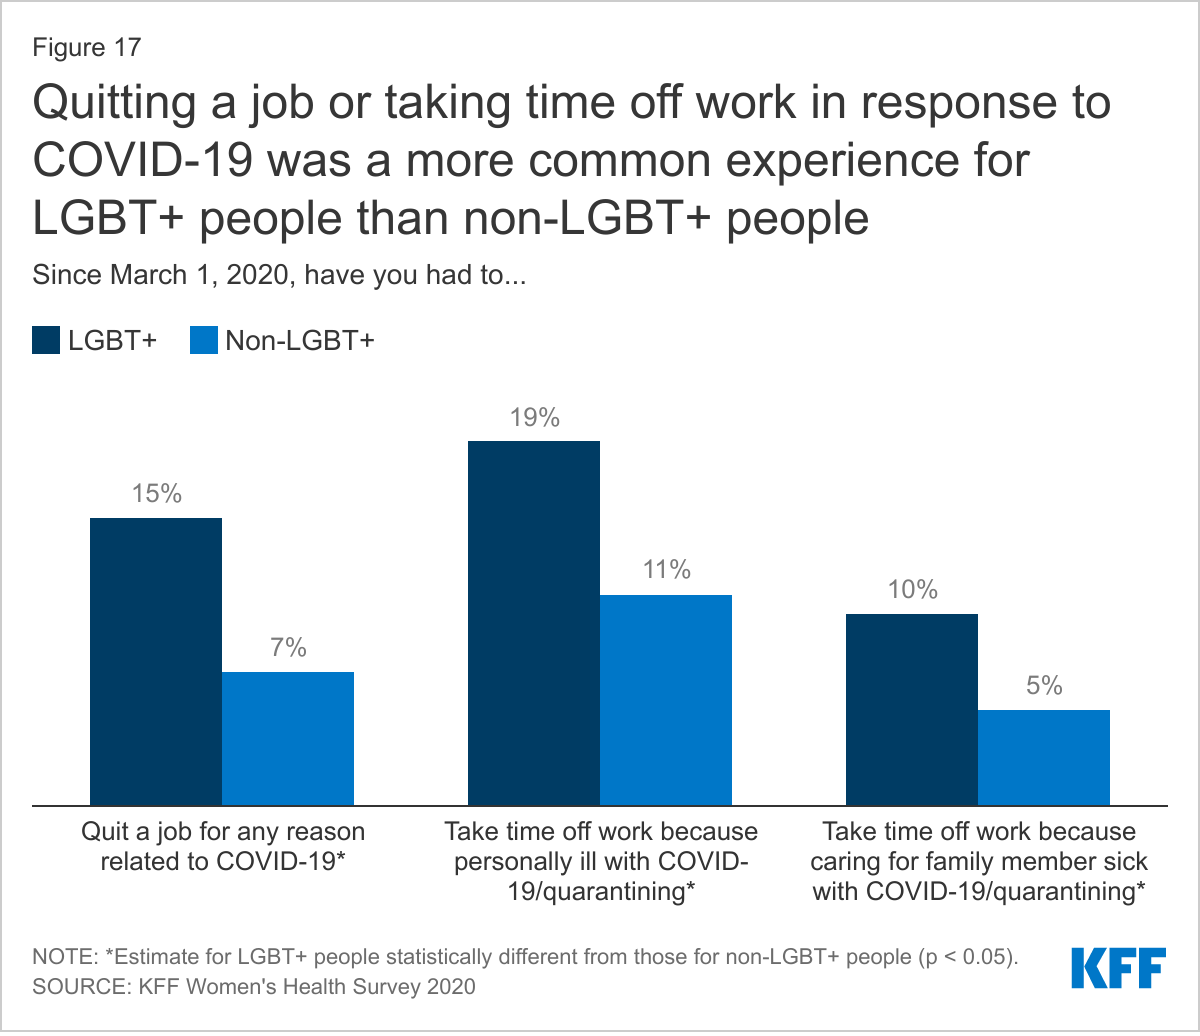
- LGBT+ people are also more likely than non-LGBT+ people to report having to quit a job for a reason related to COVID-19 (15% v. 7%), taking time off work because of personally becoming ill with COVID-19 or quarantining (19% v. 11%), or taking time off work to care for a family member who was sick with COVID-19 or quarantining (10% v. 5%) (Figure 17).
- Among the 30% of LGBT+ people who report having problems paying medical bills in the past 12 months (see section on health care costs), 58% say that it was at least in part because of the COVID-19 pandemic, with more than a quarter (27%) saying it was due only to the impact of the pandemic alone (Figure 18).
Sexual and Reproductive Health
STI and HIV Testing
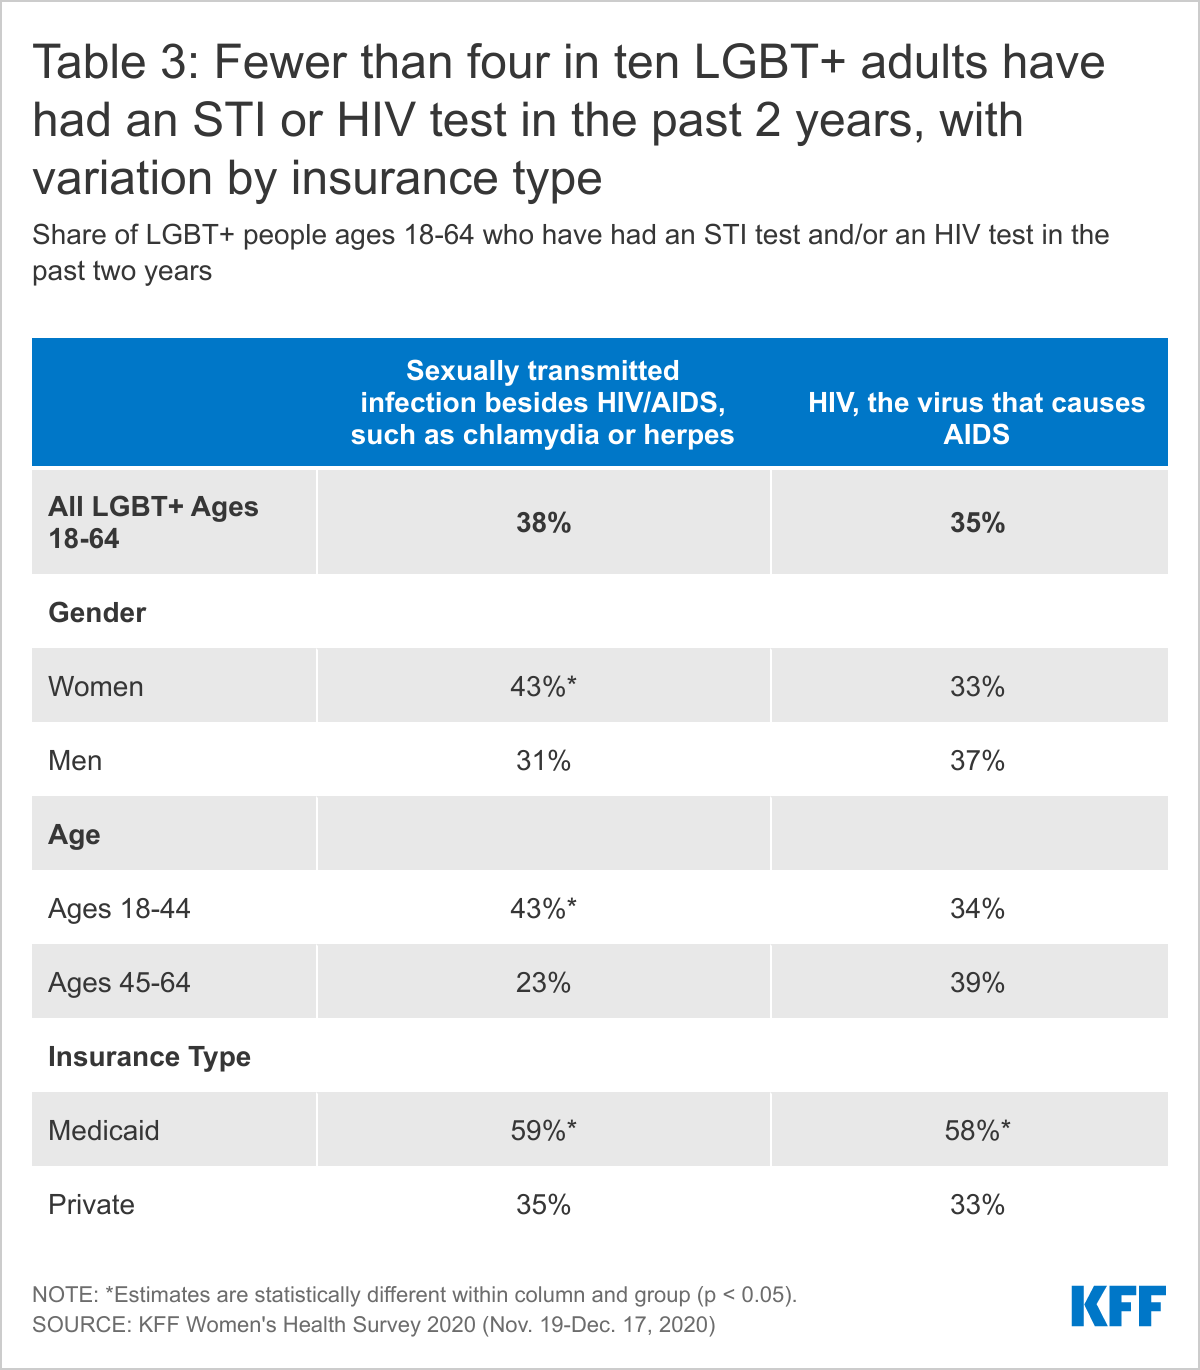
- LGBT+ people report higher rates of testing for sexually transmitted infections (STIs) and HIV than their non-LGBT+ peers, services that are recommended for early detection, treatment, and preventing transmission. This could reflect higher rates of STIs in the community as well as greater awareness of testing (Table 3).
- Thirty-five percent (38%) of LGBT+ people ages 18-64 have been tested for an STI (other than HIV) such as chlamydia or herpes in the past two years, higher than the share of non-LGBT+ people (17%). Among LGTB+ people, rates are higher among those with Medicaid (54%) than private insurance (33%). STI testing rates among bisexual women (46%) are higher than the average (data not shown in figure).
- Thirty-seven percent (37%) of LGBT+ people ages 18-64 have been tested for HIV in the past two years, higher than the share of non-LGBT+ people (16%). Approximately six in ten LGBT+ people with Medicaid (60%) report being tested for HIV in past two years.
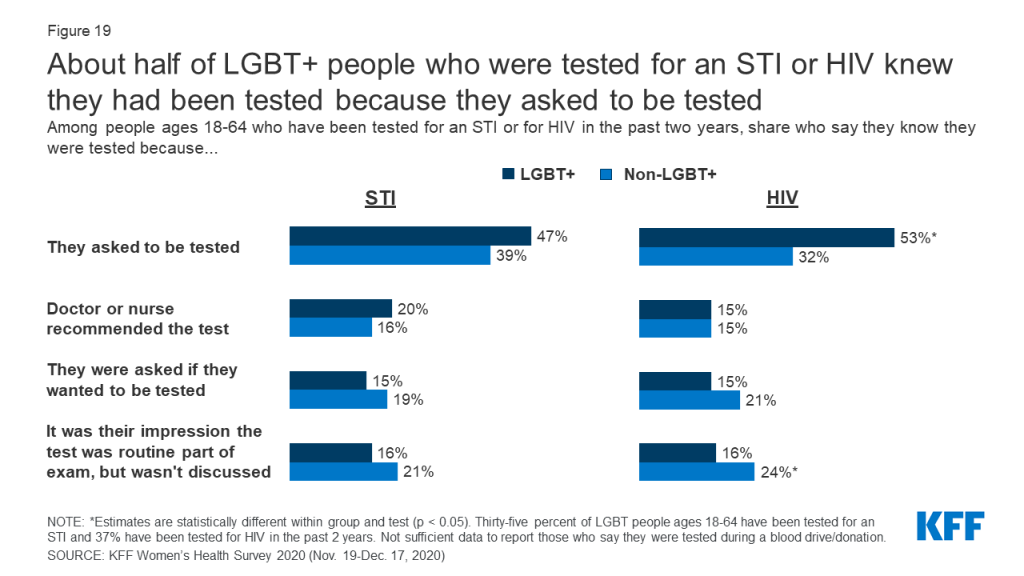
The survey also asked how people knew they had been tested for STIs and HIV (Figure 19).
- Among LGBT+ people who report that they have been tested for HIV or another STI in the past two years, about half say they asked to be tested. LGBT+ people are more likely to request HIV testing than non-LGBT+ people (53% v. 32%).
- Some LGBT+ people say they had been tested for HIV (16%) and STIs (16%) because they believed it was a routine part of their exam. It is possible that some in this group who believe they were tested but it wasn’t discussed may not have actually received the test. Larger shares of non-LGBT+ believe they had been tested for HIV but that it wasn’t discussed than non-LGBT+ people (24%).
Sexual Health Counseling
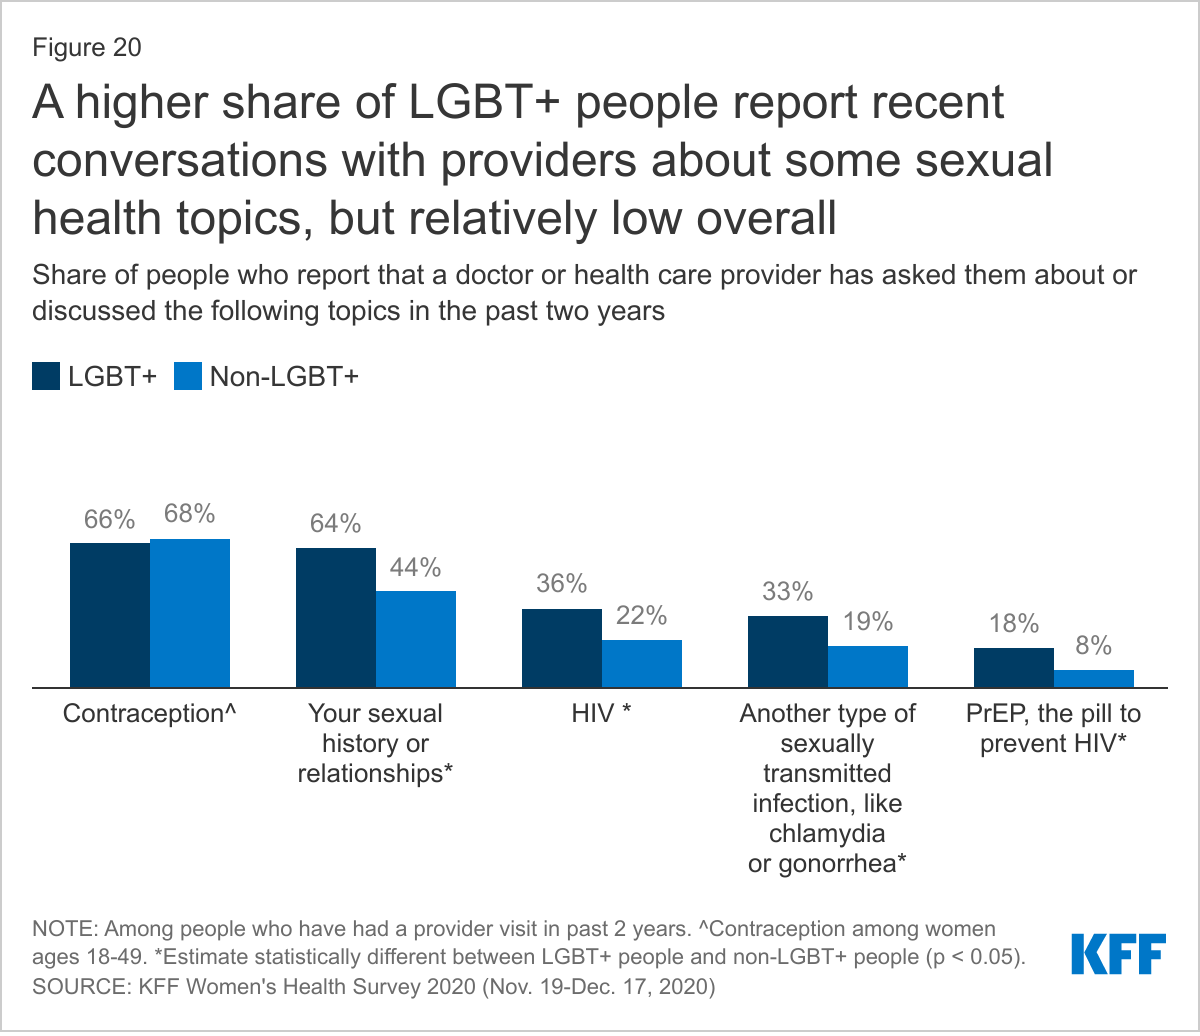
LGBT+ people more commonly report talking with a provider about a range of sexual health and relationship issues than non-LGBT+ people, counseling that, for most insured people, is required to be covered without cost-sharing (Figure 20).
- Among the 90% of people who have visited a provider in the past two years, larger shares of LGBT+ people report recently talking with a provider about their sexual history or relationships than non-LGBT+ people (64% v. 44%, respectively).
- LGBT+ people also more commonly report talking with providers about HIV (36% v. 22%) and other STIs (33% v. 19%) than non-LGBT+ people.
- While conversations about PrEP, a medication that prevents HIV, are relatively uncommon among both groups, they are more than twice as common among LGBT+ people than non-LGBT+ people (18% v. 8%).
- We note some key differences by gender:
- Among LGBT+ women who have visited a provider in the past two years, bisexual women report the highest rates of conversations about sexual history (74%), HIV (30%) and other STIs (36%) with providers. Rates are generally lower among lesbian and non-LGBT+ women. LGBT+ women and non-LGBT+ women have similarly low rates of conversations about PrEP with their providers (11% and 9%, respectively).
- Compared to non-LGBT+ men, LGBT+ men are more likely to talk to their providers about their sexual history (56% v. 34%), HIV (43% v. 22%), and other STIs (32% v. 17%). In particular, LGBT+ men are more than 3 times as likely to talk with their providers about PrEP than non-LGBT+ men (25% v. 8%).
- Approximately two-thirds of LGBT+ (67%) and non-LGBT+ (68%) women report that they have discussed contraception with a provider in the past two years.
- Approximately four in ten (39%) LGBT+ women and 44% of non-LGBT+ women rate their most recent contraceptive care provider as “excellent” on all four items of person-centered contraceptive counseling.
Reproductive Health Experiences
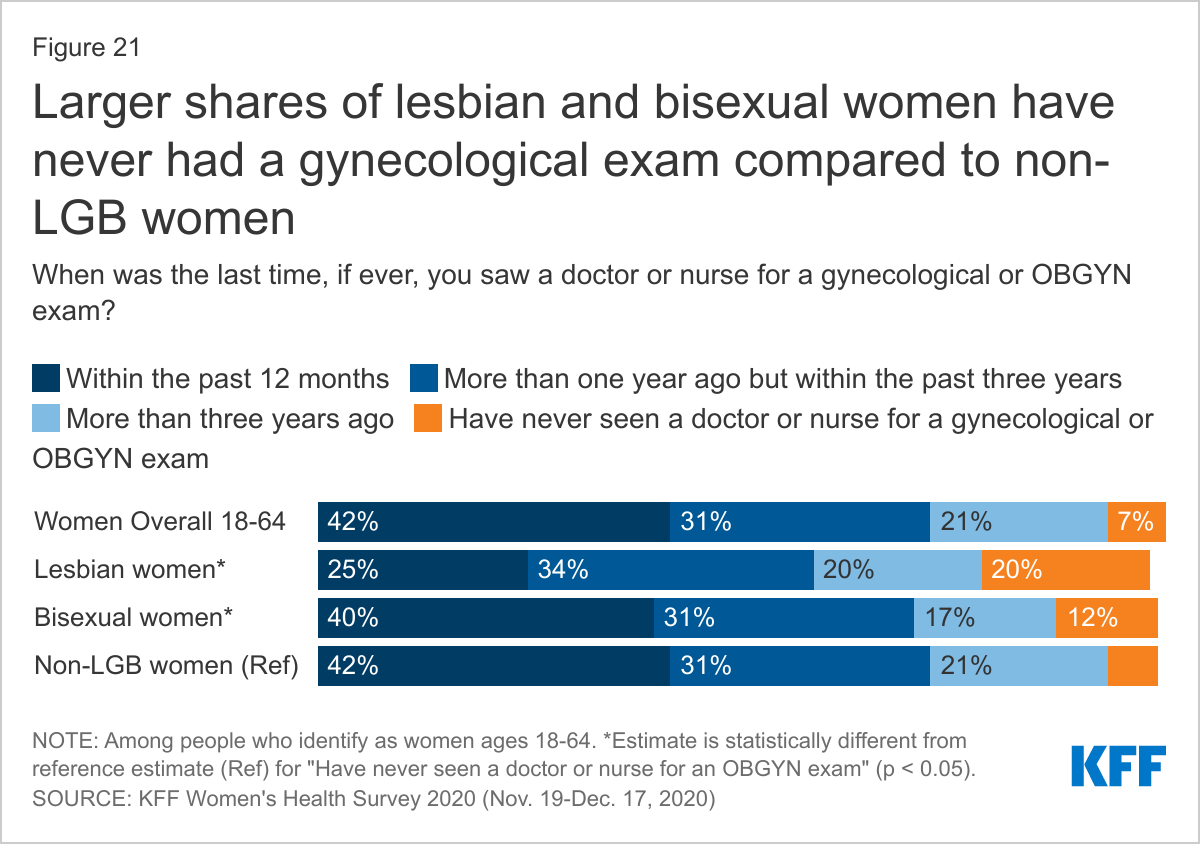
Gynecological exams typically include cervical and breast cancer screening, education, and counseling and in some cases, LGBT+ women report lower rates of accessing this care (Figure 21). We did not assess service utilization based on sex assigned at birth/biological need for services. As such, transgender men, and others who could benefit from reproductive care, may have been excluded from these findings drawn from a base of respondents who identified as female.
- Smaller shares of lesbian women aged 18-64 report having had a gynecological visit in the past three years compared to non-LGBT+ women (59% v. 73%).
- One in five (20%) lesbian women and 12% of bisexual women say that they have never seen a doctor or nurse for a gynecological exam, which is significantly higher than non-LGBT+ women (6%).
Contraception
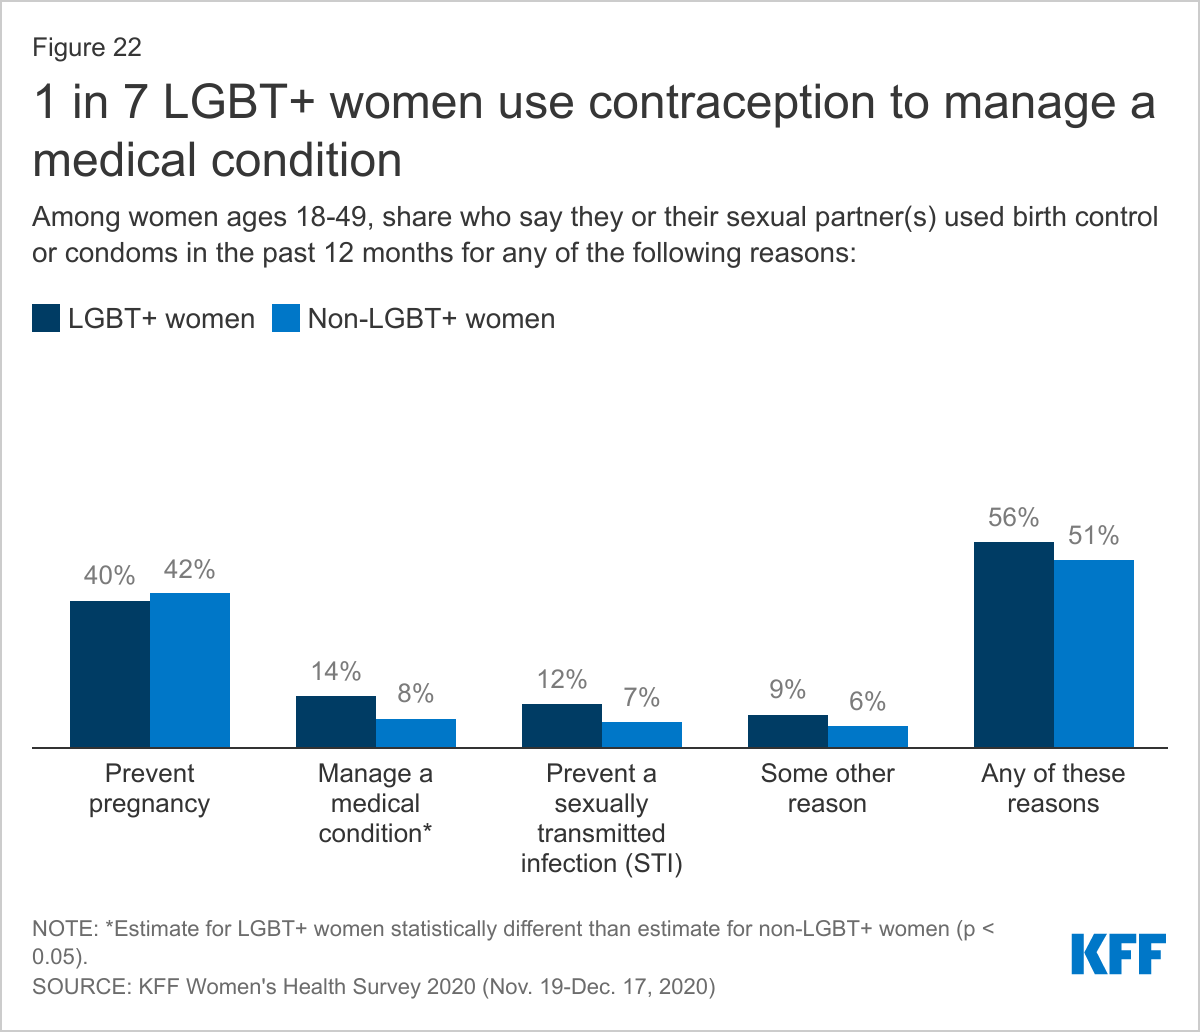
People use contraception for a range of reasons and sometimes for more than one reason at a time (Figure 22).
- In the past 12 months, over half of LGBT+ women ages 18-49 (56%) and half of non-LGBT+ women (51%) report using contraception to prevent pregnancy, manage a medical condition, prevent a sexually transmitted infection (STI), or some other reason.
- Contraception use among LGBT+ women is driven by bisexual women, nearly two-thirds (63%) of whom have used it in the past 12 months (data not shown in figure).
- One in seven LGBT+ women ages 18-49 (14%) use contraception to manage a medical condition, which is nearly twice the share of non-LGBT+ women (8%).
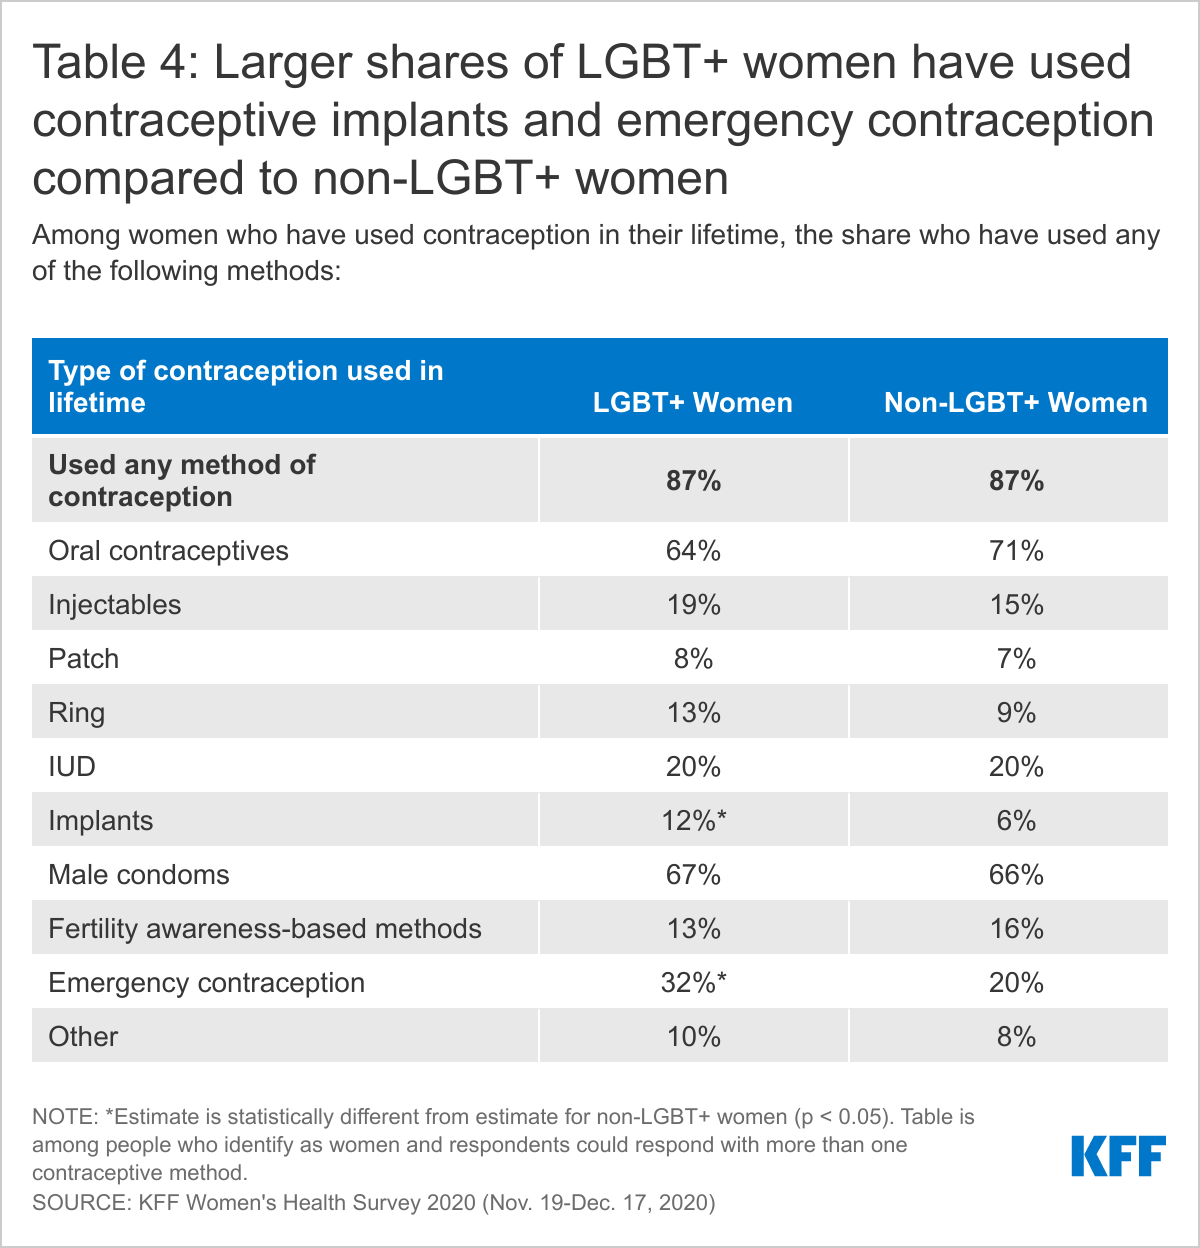
- The majority of LGBT+ (87%) and non-LGBT+ (87%) women ages 18-64 report using contraception in their lifetime. Among LGBT+ women, this share is driven by bisexual women (Table 4).
- Male condoms and oral contraceptives are the most commonly used methods among both LGBT+ women and non-LGBT+ women. LGBT+ women, driven by bisexual women, are more likely to report using contraceptive implants (12%) and emergency contraception (32%) than non-LGBT+ women.
- LGBT+ women reported using an average of 3.6 different contraceptive methods throughout their lifetime, similar to the average of 3.4 methods among non-LGBT+ women.
- One in four LGBT+ women (25%), primarily bisexual women, said if they could use any type of birth control method available, they would want to use a different method than they’re currently using, compared to one in six (17%) non-LGBT+ women.
Pregnancy Experiences
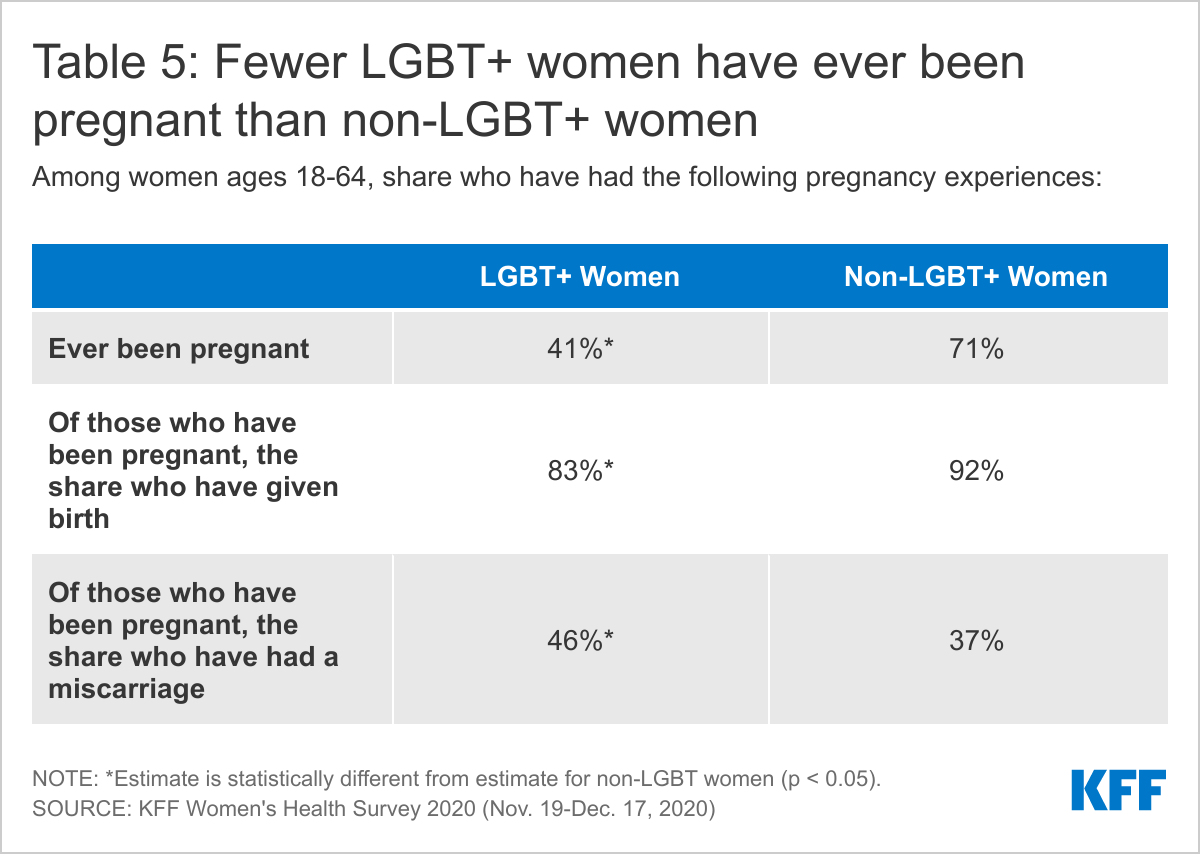
Over four in ten (41%) LGBT+ women ages 18-64, including 45% of bisexual women and 19% of lesbian women, report ever being pregnant in their lifetime compared to seven in ten (71%) non-LGBT+ women (Table 5).
- Of those who report ever having a pregnancy, 83% of LGBT+ women and 92% of non-LGBT+ women report giving birth. Nearly half (46%) of LGBT+ women and 37% of non-LGBT+ women who have been pregnant report having a miscarriage.
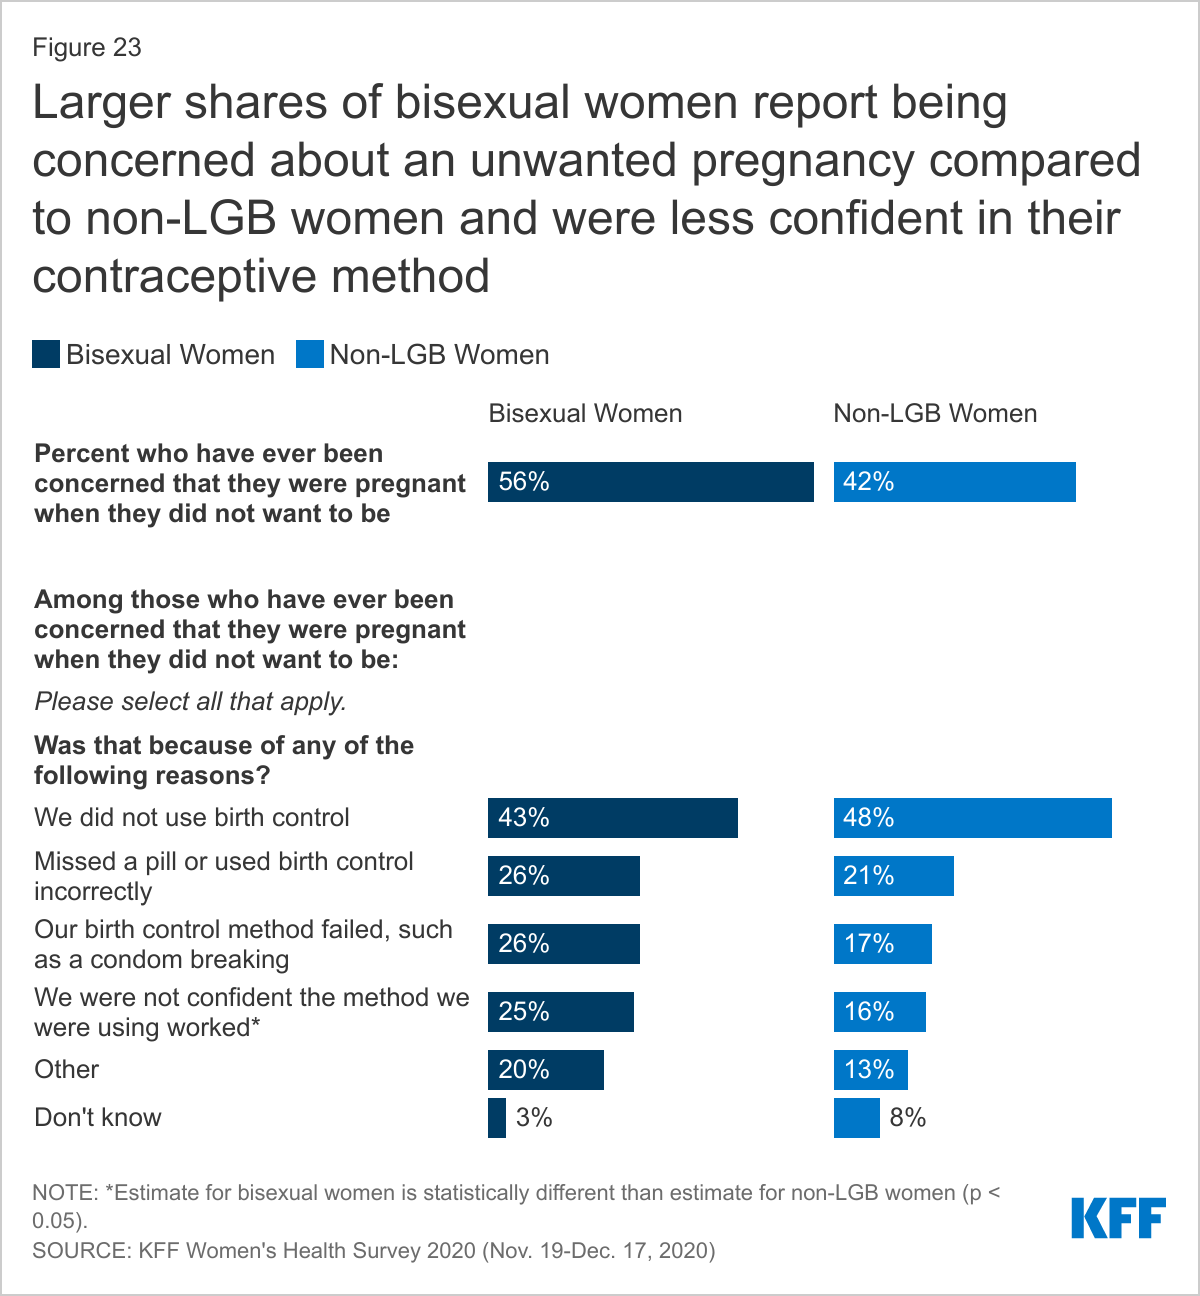
- Over half (56%) of bisexual women and 21% of lesbian women report a time they were concerned they were pregnant when they did not want to be, compared to 42% of non-LGB women (Figure 23).
- The top reason for both groups of women was they did not use birth control, followed by missing a pill or using birth control incorrectly, and a birth control method failure, such as a condom breaking.
- Larger shares of bisexual women (25%) report not being confident the method they were using worked than non-LGB women (16%).
Abortion
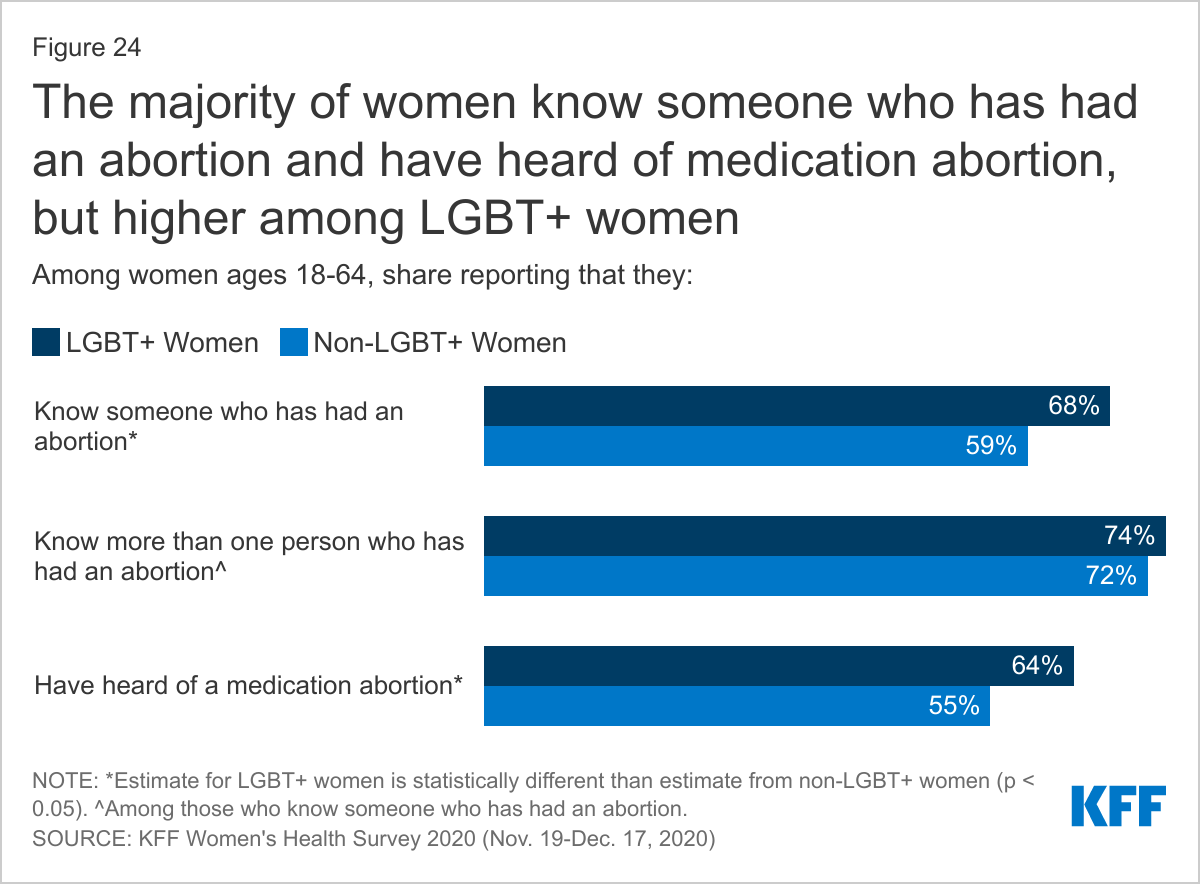
Most women say that they know someone who has had an abortion. This is higher among LGBT+ women (68%) than non-LGBT+ women (59%). Nearly two-thirds of LGBT+ women (64%) say they have heard of a medication abortion (a pregnancy termination protocol used up to the first 10 weeks of pregnancy that involves taking two different drugs, mifepristone and misoprostol), higher than the share of non-LGBT+ women (55%) (Figure 24).
Conclusion
This brief aims to add to the evolving body of work on the health of LGBT+ communities. We find that while in many cases LGBT+ people have similar health and health care experiences to non-LGBT+ people, there are some notable differences, particularly with respect to some poorer health outcomes and negative provider experiences, as well as lower utilization of care in some cases and a higher burden of medical bills. LGBT+ people have also experienced certain COVID-era challenges at higher rates.
While data collection on LGBT+ people is improving, particularly at the federal level, it is still not standard, and as such, knowledge gaps remain, including with respect to health status, health needs, and health care access. Lack of research in this area limits the ability of those in both policy and health care sectors to address health needs and disparities within the population. Given LGBT+ people’s common experiences with stigma, discrimination, and violence in a range of environments (e.g., home, work, school, health care, etc.) and the evolving legal protections based on sexual orientation and gender identity, collecting this data is especially important in furthering goals of equity and access.
This work was supported in part by the Elton John AIDS Foundation. We value our funders. KFF maintains full editorial control over all of its policy analysis, polling, and journalism activities.
Appendix
Endnotes
- LGBT+ is defined to include people who identified as lesbian, gay, bisexual, transgender, or “something else” (other than straight). ↩︎
- See the Methodology section for more details and the toplines for full question wording. ↩︎
- The FPL for a family of four in 2020 was $26,200. ↩︎
- Private health insurance includes insurance provided through an employer and insurance purchased individually. ↩︎
- Survey respondents who identified as female were asked if they had had either a general check-up or a well-woman visit. All others were asked if they had had a general check-up. ↩︎