News Release

KFF’s Kaiser Health News and NPR Launch Diagnosis: Debt, a Yearlong Reporting Partnership Exploring the Scale, Impact, and Causes of the Health Care Debt Crisis in America

About 4 in 10 Adults Have Some Debt Due to Medical or Dental Bills, Finds a National KFF Survey Conducted for the Project

Published: Jun 16, 2022

KFF’s Kaiser Health News (KHN) and NPR today launched a yearlong investigative project that explores the scale, impact, and causes of the health care debt crisis in the United States.

Drawing upon a special KFF poll conducted for the project, original data analysis, and hundreds of interviews, the investigation reveals a problem far more pervasive than previously reported. That’s because much of the medical debt is hidden as monthly installments paid via credit card, loans from family, and payment plans arranged directly with hospital and doctor’s offices.

About 4 in 10 adults report having medical or dental debt, the KFF poll finds, a share that roughly translates into an estimated 100 million adults. Many expect repaying the debt to take years, and about 1 in 5 say they do not expect to ever pay it all off.

The problem drives millions of Americans from their homes or into bankruptcy, but the consequences are not just financial. About 1 in 7 people with health care debt say they have been denied access to a hospital, doctor, or other provider because of unpaid bills. The toll of medical debt tends to fall most severely on the poor, the sick, and people of color, the investigation reveals.

Diagnosis: Debt is a multimedia series featuring KHN senior correspondent Noam N. Levey and NPR correspondent Yuki Noguchi. The first installment will run today on kffhealthnews.org and npr.org and air on NPR’s Morning Edition, which can be found at participating member stations. It represents a fusion of the investigative power of KHN and NPR, the public opinion survey expertise of the KFF polling team, and original data analysis.

The project will feature a series of digital and audio stories to be published and aired over the rest of this year, as well as an NPR podcast and profiles of Americans whose lives have been upended by health care debt. In addition to the poll and other research, KHN and NPR reporters conducted hundreds of interviews with patients, physicians, health industry leaders, consumer advocates, and researchers.

The first installment spotlights the plight of people like Elizabeth Woodruff, of Binghamton, New York., who spent through her retirement account and worked three jobs after she and her husband were sued for nearly $10,000 by the hospital where his infected leg was amputated. There is Ariane Buck of Peoria, Arizona, near Phoenix, who was unable to get an appointment with his doctor for an intestinal infection because the office said he had outstanding bills. Nurse practitioner Allyson Ward of Chicago worked extra shifts and she and her husband loaded up credit cards, borrowed from relatives, and delayed repaying student loans after the premature birth of their twins left them $80,000 in debt.

Forthcoming stories will examine U.S. hospital billing and collections practices as well as the flourishing medical debt industry that is now an integral part of American health care.

“From our joint Bill of the Month series with NPR, we knew that debt was a major byproduct of the American medical system. But in this investigation, we sought to quantify the scale of the problem and detail its impact on families’ financial health,” said KHN Editor-in-Chief Elisabeth Rosenthal. “It was a huge task, pulling in the reporting muscle of both our teams, outside data help, and an important survey performed by our colleagues at the KFF polling team.”

“This series represents the culmination of months of investigations and reporting by NPR and KHN, said Andrea Kissack, NPR’s Chief Science and Health Editor. “In addition to some of these stunning findings, the project will explore some of the little-known ways to avoid debt traps and how the mental health and substance abuse crisis is impacting debt and how the pandemic may influence racial disparities.”

A novel poll

In the national poll conducted for the project, KFF survey researchers found that about 1 in 4 four adults with health care debt (translating to 1 in 10 adults overall) owes at least $5,000, including about 1 in 8 who owe $10,000 or more (1 in 20 adults overall). Those who are uninsured, with low incomes, and Black and Hispanic adults are among the groups most likely to carry health care debt.

The survey used a broad lens to measure health care debt, including medical and dental bills people are unable to pay as well as different forms of debt accruing from health care bills such as payment plans, credit cards, bank loans, and borrowing from family and friends. About 1 in 5 adults (21%) say they are paying off health care bills through an installment plan with a hospital or other provider. One in 10 say they owe money to a friend or family member who covered their medical or dental bills.

Most people with health care debt (63%) say they or a household member had to cut spending on food, clothing, and basic household items as a result. Nearly half (48%) say they used up nearly all their savings. About 4 in 10 increased their credit card debt (41%), took on an extra job or worked more hours (40%), or skipped or delayed paying other bills (37%).

Having insurance is not a panacea. While 62% of working-age uninsured adults report having health care debt, so do 44% of working-age adults with health coverage, according to the poll.

A link between medical debt and chronic illness

Also published today is an interactive graphic showing where debt is concentrated in the U.S., based on original research the Urban Institute conducted for this project analyzing credit report data. The graphic features county and state maps as well as charts comparing counties and showing the link between medical debt and chronic illness.

Researchers find that chronic illness is a strong predictor of debt. In the 100 U.S. counties with the highest levels of chronic disease, nearly a quarter of adults have medical debt on their credit records, compared with fewer than 1 in 10 in the healthiest counties.

Patient debt is growing despite increased access to insurance through the Affordable Care Act, the investigation finds. Over the past decade the medical industry has posted record profits as hospitals, physicians, and other providers steadily raised prices, while health insurers have shifted costs onto patients through higher deductibles.

KHN is KFF’s award-winning news service with a national newsroom in Washington, D.C., and a rapidly growing network of regional bureaus in California, the Midwest, the Mountain States, and the South. Earlier this year KHN established a Rural Health Desk to produce and distribute stories on health care issues relevant to rural communities.

NPR and KHN have partnered for over a decade to bring important health stories from NPR member stations around the country to NPR and KHN’s audiences and to improve and expand health reporting at these stations. They also maintain a long-standing collaborative investigative project entitled “Bill of the Month,” which examines surprising medical bills and what they tell us about the U.S. health care system.

KHN works with many editorial partners, and media outlets can publish KHN stories at no charge. KHN also will publish the stories on kffhealthnews.org and promote them through its social media platforms. KHN journalists also are available for interviews about their stories. News organizations interested in working with KHN should contact the news service at KHNPartnerships@kff.org, and those interested in helping to expand and improve health journalism around the country should contact KFF at healthjournalism@kff.org.

About KFF

KHN (Kaiser Health News) is one of the four major operating programs at KFF (Kaiser Family Foundation), together with Policy Analysis, Polling and Survey Research, and Social Impact Media. KFF is an endowed nonprofit organization providing information on health issues to the nation. It has no connection to Kaiser Permanente.

About NPR

NPR’s rigorous reporting and unsurpassed storytelling connects with millions of Americans every day — on the air, online, and in person. NPR strives to create a more informed public — one challenged and invigorated by a deeper understanding and appreciation of events, ideas, and cultures. With a nationwide network of award-winning journalists and 17 international bureaus, NPR and its member stations are never far from where a story is unfolding. Listeners can find NPR by tuning in to their local member stations (npr.org/stations), and now it’s easy to listen to NPR stories on smart-speaker devices. Ask your smart speaker to “Play NPR,” and you’ll be tuned in to your local member station’s livestream. Your speaker can also access NPR podcasts, NPR One, and NPR News Now, and the Visual Newscast is available for screened speakers. Get more information at npr.org/about and by following NPR Extra on Facebook, Twitter, and Instagram.

About the KFF Survey

The KFF Health Care Debt Survey was designed and analyzed by public opinion researchers at KFF in collaboration with KHN journalists and editors. The survey was conducted online and via telephone Feb. 25-March 20, in English and Spanish, among a nationally representative sample of 2,375 U.S. adults, including 1,292 adults with current health care debt. The margin of sampling error is plus or minus 3 percentage points for the full sample and 3 percentage points for those with current debt. For results based on subgroups, the margin of sampling error may be higher.

Health Care Debt In The U.S.: The Broad Consequences Of Medical And Dental Bills

Published: Jun 16, 2022

Overview

The KFF Health Care Debt Survey is part of a broader investigative project on health care debt conducted by our colleagues at KHN in partnership with NPR. The survey was designed and analyzed by public opinion researchers at KFF in collaboration with KHN journalists and editors. This Report contains findings from the survey as well as the topline and methodology. The KFF Health Care Debt Survey provides a broad measure of health care debt, including medical and dental bills people are unable to pay as well as different forms of debt accruing from health care bills such as payment plans, credit cards, bank loans, and borrowing from family and friends. It also explores the effects of health care debt on individuals and the financial and personal sacrifices they make due to their debt.

Diagnosis: Debt is a multimedia investigative journalism series by KHN and NPR that explores the scale, impact, and causes of health care debt in America. It represents a fusion of the investigative power of KHN and NPR, the public opinion survey expertise of the KFF polling team, and original data analysis.

Explore the project’s journalism:

Diagnosis Debt:100 Million People in America Are Saddled With Health Care Debt, published June 16, 2022.

Upended: How Medical Debt Changed Their Lives, published June 16, 2022.

NPR Morning Edition: Sick and struggling to pay, 100 million people in the U.S. live with medical debt, aired June 16, 2022.

Medical Bills Can Shatter Lives. North Carolina May Act to ‘De-Weaponize’ That Debt, published June 21, 2022.

In America, Cancer Patients Endure Debt on Top of Disease, published July 9, 2022.

Nursing Homes Are Suing the Friends and Family of Residents to Collect Debts, published July 28, 2022.

Few Places Have More Medical Debt Than Dallas-Fort Worth, but Hospitals There Are Thriving, published Sept. 28, 2022.

Main Findings

Introduction

This is a companion report by the KFF polling group for an investigative project on health care debt conducted by our colleagues at KHN in partnership with NPR. The KFF Health Care Debt Survey was designed and analyzed by public opinion researchers at KFF in collaboration with KHN journalists and editors. The survey provides a broad measure of health care debt in the U.S. and explores the effects of health care debt on individuals and the financial and personal sacrifices they make due to their debt.

Rising health care costs have been a dominant concern in the U.S. for both individuals and for the nation as a whole for many years. For individuals, these rising – and sometimes unexpected – health care costs can often lead to debt. Discussions about the problem of health care-related debt in the United States have typically focused more narrowly on medical bills that people are unable to pay or those that have been sent to collections. However, the problem of health care debt is ultimately much larger when looking at different types of debt that are caused at least partially by medical or dental bills. Indeed, often individuals use other forms of borrowing or debt, such as payment plans, credit cards, bank loans, and borrowing from family and friends to pay their medical and dental bills. These forms of debt are sometimes not included in estimates of medical debt from other surveys and administrative data.

To fill this gap, KFF conducted an in-depth, nationally representative survey with 2,375 adults, including interviews with 1,292 adults with current health care debt. The survey defined health care debt as any money respondents currently owe or debt they have due to medical or dental bills for their own or someone else’s medical or dental care, including any bills that are past due or that they are unable to pay, any bills they are paying off over time directly to a provider, any debt they owe to a bank, collection agency, or other lender that includes debt or loans used to pay medical or dental bills, any bills they have put on a credit card and are paying off over time and any debt owed to a family member or friend for money they borrowed to pay medical or dental bills.

Executive Summary

Debt due to medical and dental bills is a widespread issue in the United States, affecting both uninsured and insured adults. Health care related debt encompasses more than just unpaid or past due bills from providers. Substantial shares of adults carry debt from medical and dental bills that they have paid off by taking on other forms of debt, including credit cards, personal bank loans, or loans from family and friends. The KFF Health Care Debt Survey finds that four in ten adults have some form of health care debt. Yet the likelihood of having health care debt is not evenly distributed. Uninsured adults, women, Black and Hispanic adults, parents, and those with lower incomes are especially likely to say they have health care-related debt.

Unexpected bills can be a major contributor to health care debt. Most adults with health care debt say the bills that led to their debt were from a one-time or short-term medical expense, which are often unexpected. Indeed, about half of adults – including three in ten of those who do not currently have health care debt – are vulnerable to falling into debt, saying they would be unable to pay a $500 unexpected medical bill without borrowing money. While about a third of adults with health care debt owe less than $1,000, even small amounts of debt can have significant financial consequences for some. Though a third of those with current debt expect to pay it off within a year and about a quarter expect to pay it within one to two years, nearly one in five adults with health care debt think they will never be able to pay it off.

In their efforts to service or pay off their debt, adults with health care debt report making a number of sacrifices and enduring substantial financial consequences. Most report cutting back on household spending, and more than four in ten say they or a household member have used up all or most of their savings due to their health care debt. Many also report more serious consequences like skipping payment on other bills, delaying college or buying a home, or changing their housing situation as a result of their debt. In addition, about half of adults with health care debt say they have made what they feel to be a difficult sacrifice in order to pay down their debt. These sacrifices have left some individuals feeling as if they could not provide a good life for their families, or with a general sense that they will never be able to extricate themselves from debt. Other reported consequences of debt, such as being contacted by debt collectors and having their credit scores negatively affected, can lead to additional financial problems such as difficulty buying vehicles needed for work or buying or renting a home.

Health care debt can also affect the ability of individuals to access needed medical or dental care. One in seven adults with health care debt say they have been denied care by a provider due to unpaid bills. In addition, adults with health care debt are more than twice as likely as those without debt to say they or someone they live with have postponed or skipped getting needed health care because of the cost.

The unequal consequences of health care debt are evident in the survey results. Among those with debt due to medical or dental bills, those with lower incomes and people of color (particularly Black adults), are more likely than their counterparts to report experiences like being contacted by collection agencies due to health care debt, being denied subsequent care, and making difficult sacrifices like changing their housing situation to pay down their debt.

Who Has Health Care Debt Due To Medical And Dental Bills?

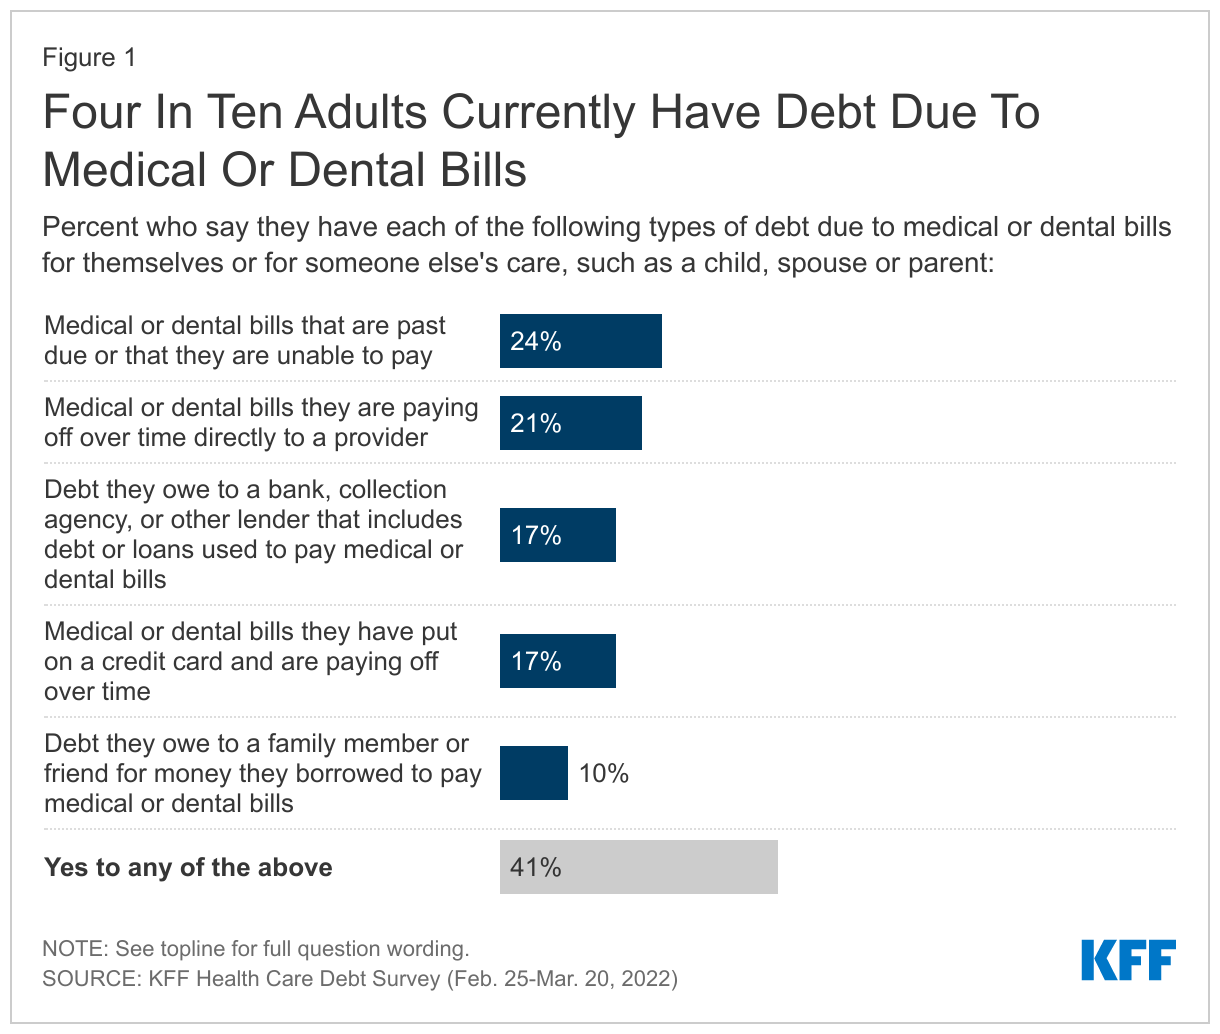
The KFF Health Care Debt Survey finds that 41% of adults currently have some debt caused by medical or dental bills. To develop this measure, we asked respondents to think about any money they currently owe or debt they have due to medical or dental bills for their own medical or dental care or someone else’s care, such as a child, spouse, or parent. We then asked whether they currently have five different types of debt due to medical or dental bills: any bills that are past due or that they are unable to pay; any bills they are paying off over time directly to a provider; any debt they owe to a bank, collection agency, or other lender that includes debt or loans used to pay medical or dental bills; any bills they have put on a credit card and are paying off over time; or any debt owed to a family member or friend for money they borrowed to pay medical or dental bills.

Estimating The Prevalence of Health Care Debt

The total share of U.S. adults with health care debt is difficult to estimate with precision and varies widely depending on the measures. The Consumer Financial Protection Bureau (CFPB) estimates that $88 billion in medical debt is reflected on Americans’ credit reports, though they acknowledge the total amount of medical debt is likely higher because not all medical debt is visible to consumer reporting companies and those data only reflect debt among people with credit reports (not all adults). A recent Census Bureau analysis of data from the 2020 Survey of Income and Program Participation (SIPP) on medical debt at the household level found 17% of households owed medical debt in 2019. A KFF analysis of the 2020 SIPP found that one in ten adults in the U.S. have significant medical debt (“significant” defined as medical debt of over $250) and that U.S. adults owe at least $195 billion in medical debt.

Nationally representative surveys generally capture a larger share of people and more types of medical debt than analyses of credit reports, yet challenges remain in capturing data of people who have debt due to medical and dental bills. Certain types of medical debt may not be disclosed or present on credit reports or can be disguised as another form of debt not typically captured in surveys. For example, people may pay for a medical expense on a credit card or fall behind on other payments in order to keep up with medical bills. The KFF Health Care Debt Survey asked about different forms of debt individuals may have used to pay their medical and dental bills in order to provide a broader estimate of adults who currently have health care debt. Other estimates of medical debt from recent years can be found in the Appendix of this report.

More specifically, about a quarter of adults (24%) say they currently have medical or dental bills that are past due or that they are unable to pay, about one in five (21%) say they have bills they are paying off over time directly to a provider, about one in six say they have debt they owe to a bank, collection agency, or other lender that for loans used to pay medical or dental bills (17%) or say they have medical or dental bills they have put on a credit card and are paying off over time (17%), and one in ten (10%) say they have debt they owe to a family member or friend for money borrowed to pay medical or dental bills.

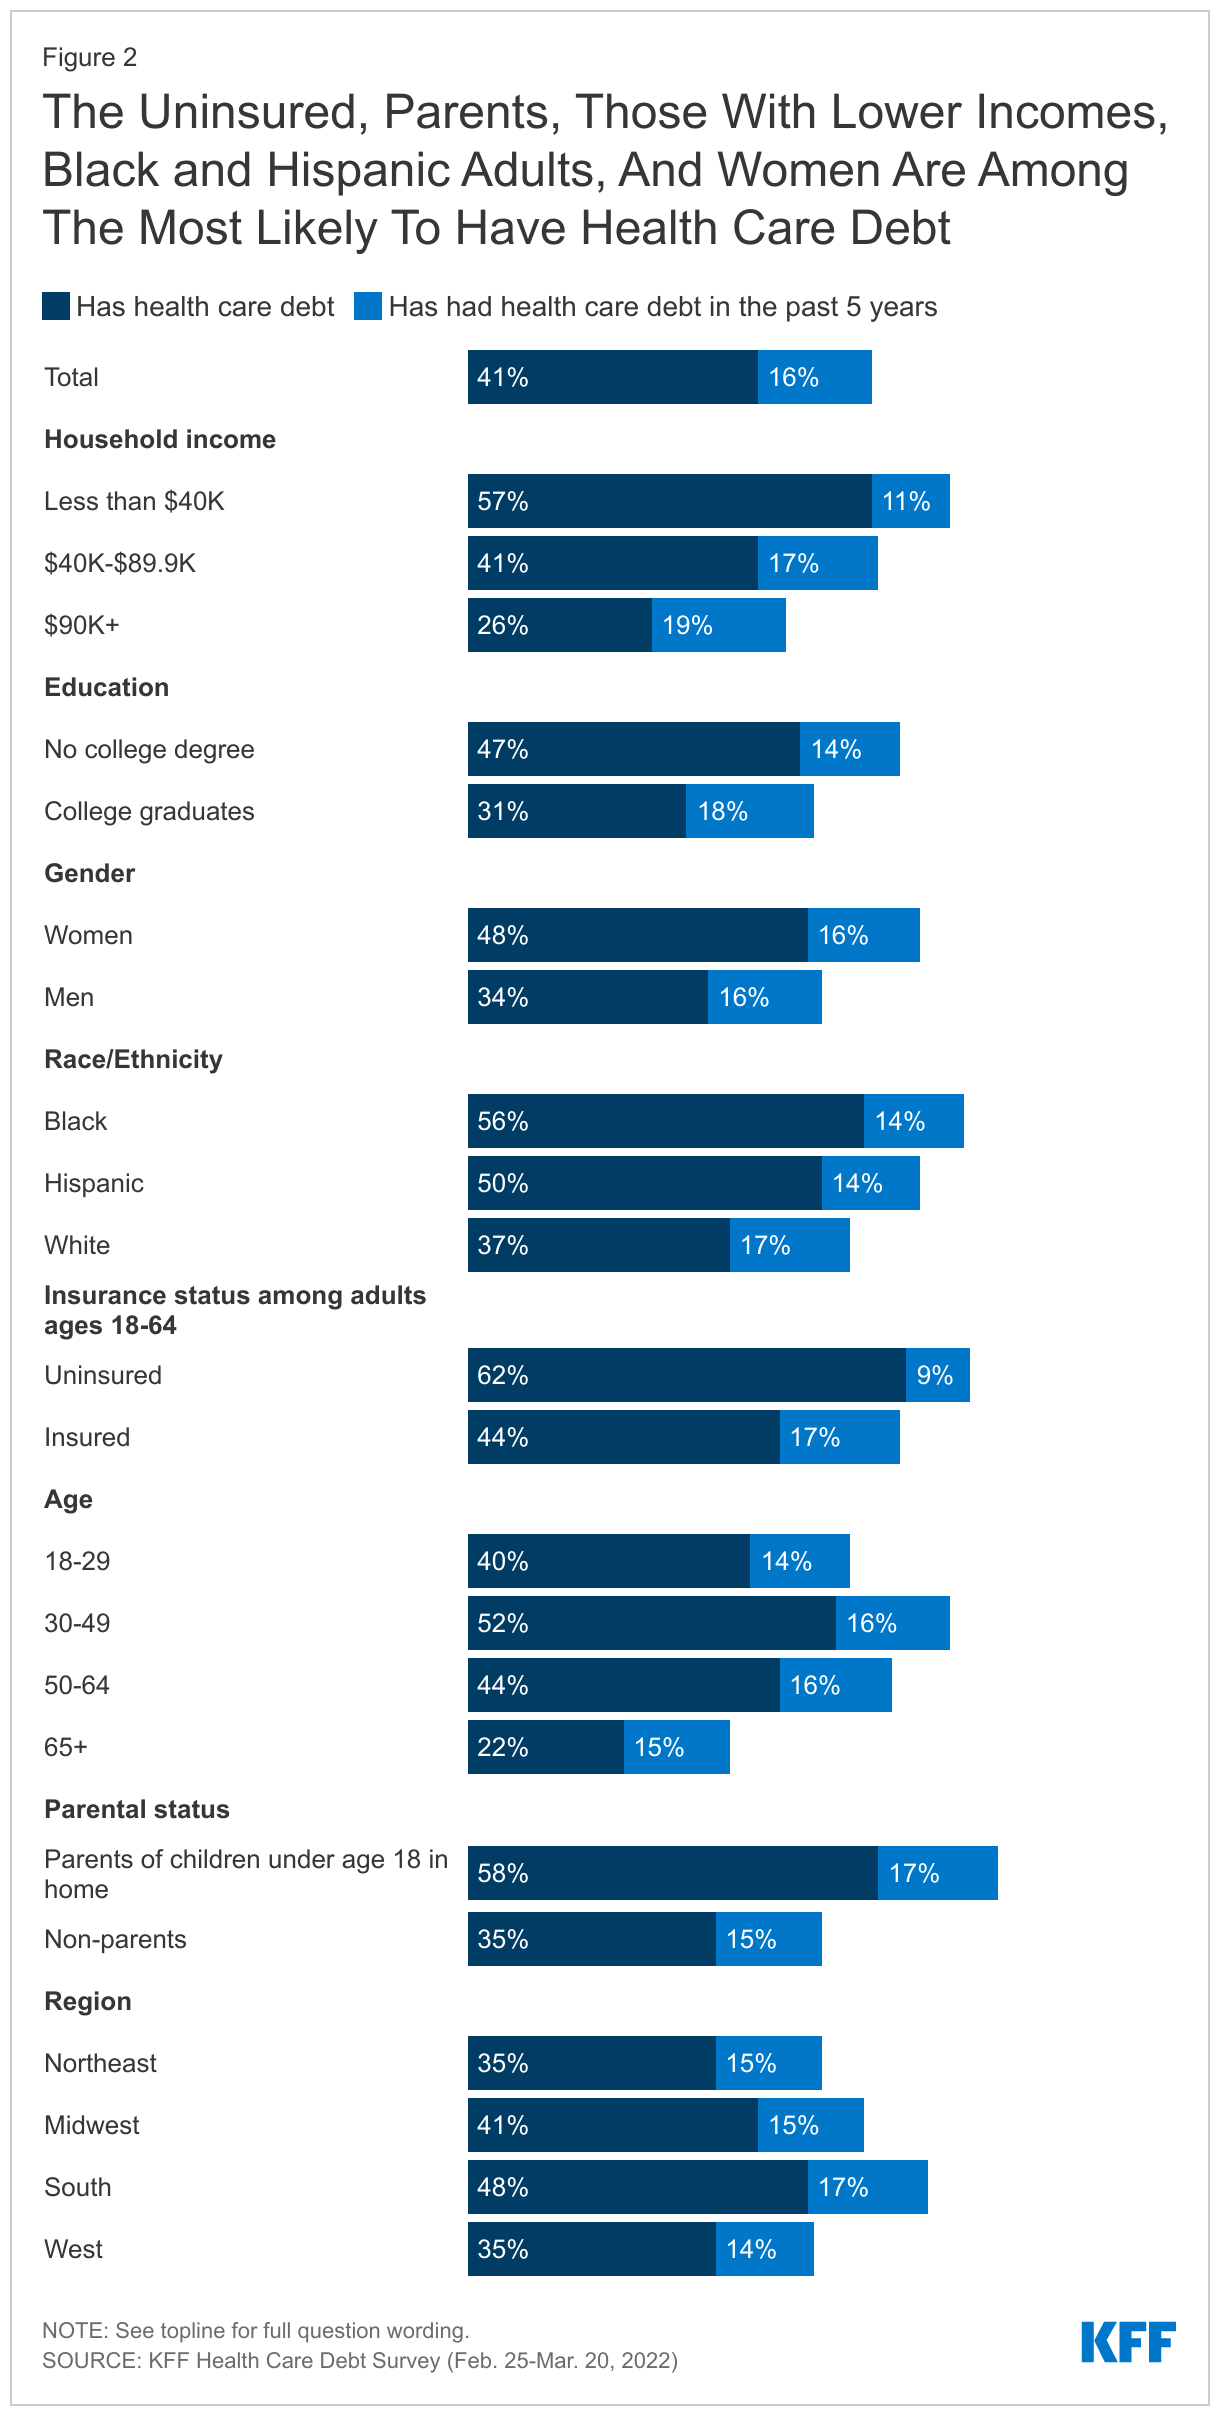
Beyond the 41% of adults who currently have some form of health care debt, a further 16% of adults say they have had debt due to medical or dental bills in the past five years that has since been paid off.1  This means in total, most adults (57%) have experienced owing money due to medical or dental bills at some point in the past five years.

Four In Ten Adults Currently Have Debt Due To Medical Or Dental Bills

Adults with lower levels of education and income are more likely than those with higher education and higher income to say they have current health care debt due to medical or dental bills. Nearly half of without a college degree (47%) say they have health care debt compared to about three in ten college graduates (31%). While a majority (57%) of adults with household incomes under $40,000 say they currently have debt due to medical or dental bills, it is also notable that health care debt is not entirely uncommon among those with higher incomes (26% of those in households earning $90,000 or more). Among adults with health care debt, those with higher incomes are more likely to report debt due to medical bills in the form of credit card debt or bank loans, while those with lower incomes are more likely to report being indebted to friends or family.

There are also differences by gender, race, and ethnicity when it comes to current health care debt. Nearly half of women say they have debt due to medical or dental bills, compared to about a third of men (48% vs. 34%). Across race and ethnic groups, at least half of Black (56%) and Hispanic (50%) adults say they have debt due to medical or dental bills, compared to fewer White adults (37%). Unsurprisingly, among adults under 65, those who are currently uninsured are more likely to say they have health care debt than those who currently have health insurance (62% vs. 44%), though it’s notable that over four in ten adults with health insurance also report current debt.

By age, health care debt peaks among those between the ages of 30 and 49, with 52% in this age group saying they have current health care debt. This is likely related to the fact that about half of people in this age group are parents of children under 18, and parents are significantly more likely than non-parents to report having health care debt from their own or someone else’s medical or dental bills (58% vs. 35%). Over one in five adults ages 65 and over (22%) say they currently owe money due to medical or dental bills. Medicare provides near universal coverage to seniors, but it has gaps that can leave beneficiaries with substantial out-of-pocket costs.

Notably, across regions of the country, almost half of adults in the South say they have health care debt, compared to about a third of adults in the Northeast and in the Western U.S. who say the same. In addition, nearly half of adults (47%) in the twelve states that have not expanded their Medicaid program under the Affordable Care Act say they have current health care debt, compared to 39% in Medicaid expansion states.

The Uninsured, Parents, Those With Lower Incomes, Black and Hispanic Adults, And Women Are Among The Most Likely To Have Health Care Debt

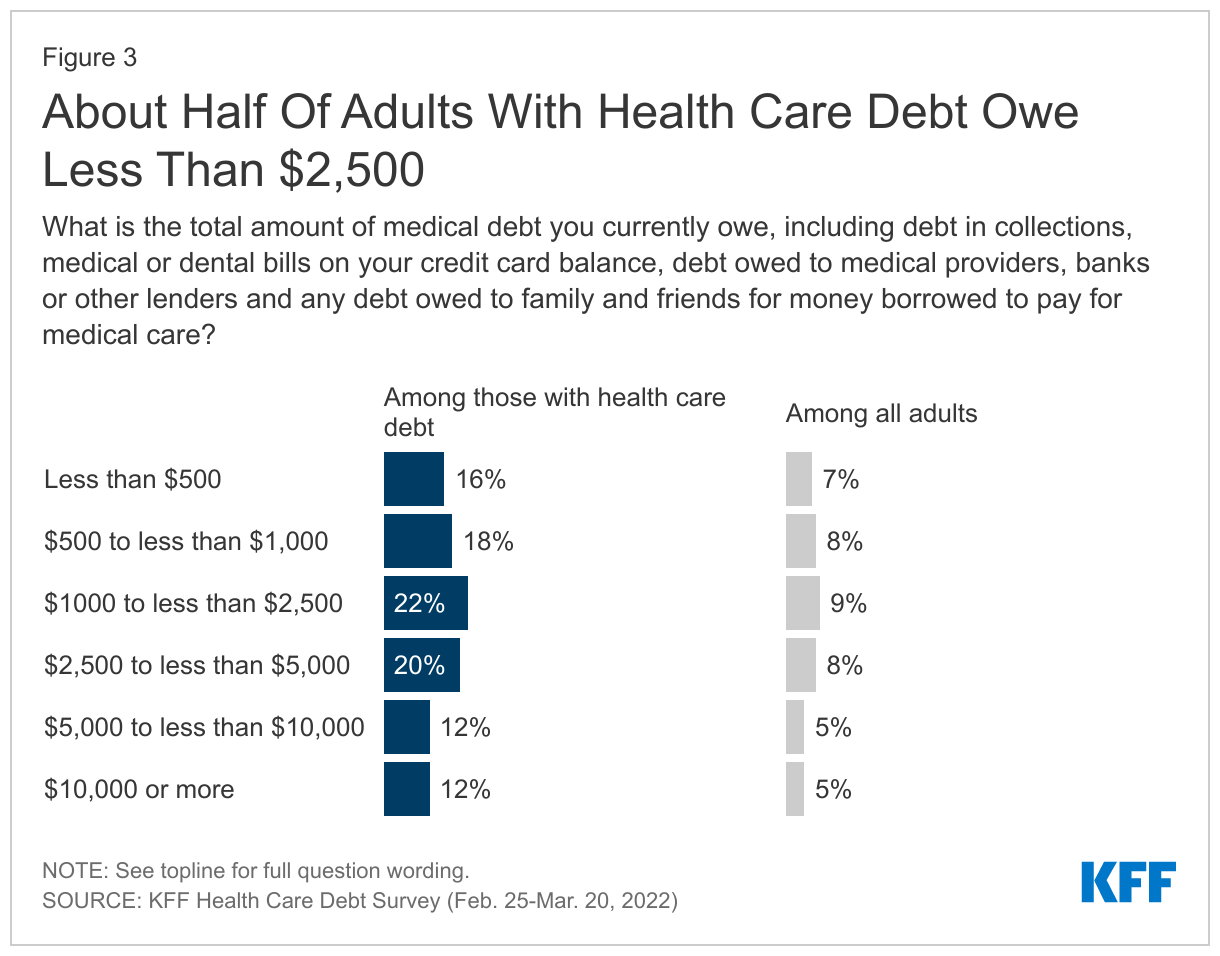
Health care debt does not have to be enormous for people to have problems paying it off, though some do report owing large amounts. About half of adults with current health care debt (56%) say they owe less than $2,500, including 16% who say they owe less than $500 and 18% who owe between $500 and $1,000. Nearly half (44%) report owing at least $2,500 due to medical or dental bills, including about one in eight (12%) who say they owe $10,000 or more.

About Half Of Adults With Health Care Debt Owe Less Than $2,500

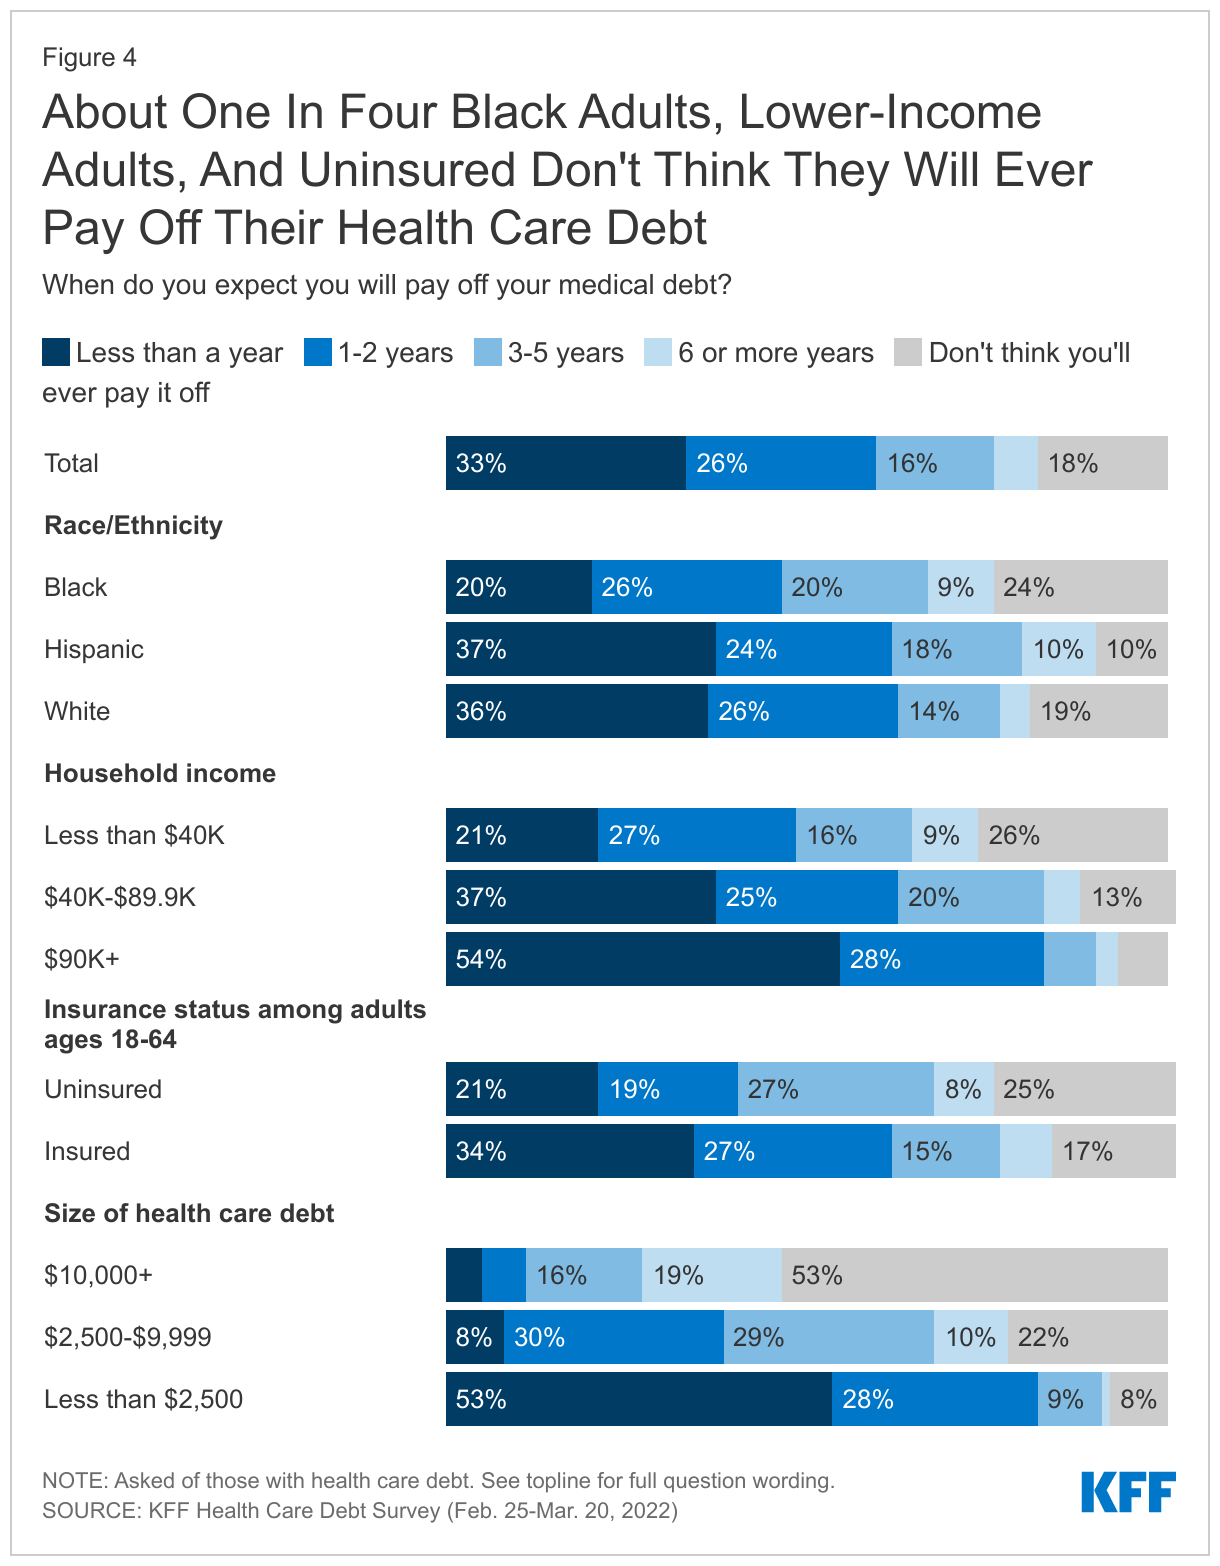
Most (59%) adults with current health care debt think they will be able to pay off their debt within two years, including a third who think they will pay it off within a year. However, nearly one in five (18%) say they don’t think they will ever pay it off. Notably, about one in four Black adults (24%), adults with household incomes under $40,000 (26%), and those who are uninsured (25%) say they don’t think they will ever pay off their health care debt.

Expectations of paying off health care debt also vary widely by the amount of debt. Among those who owe less than $1,000, nearly two-thirds (63%) say they expect to pay it off within one year. By contrast, about half (53%) of those who owe $10,000 or more say they’ll never be able to pay it off.

About One In Four Black Adults, Lower-Income Adults, And Uninsured Don't Think They Will Ever Pay Off Their Health Care Debt

Causes Of Health Care Debt

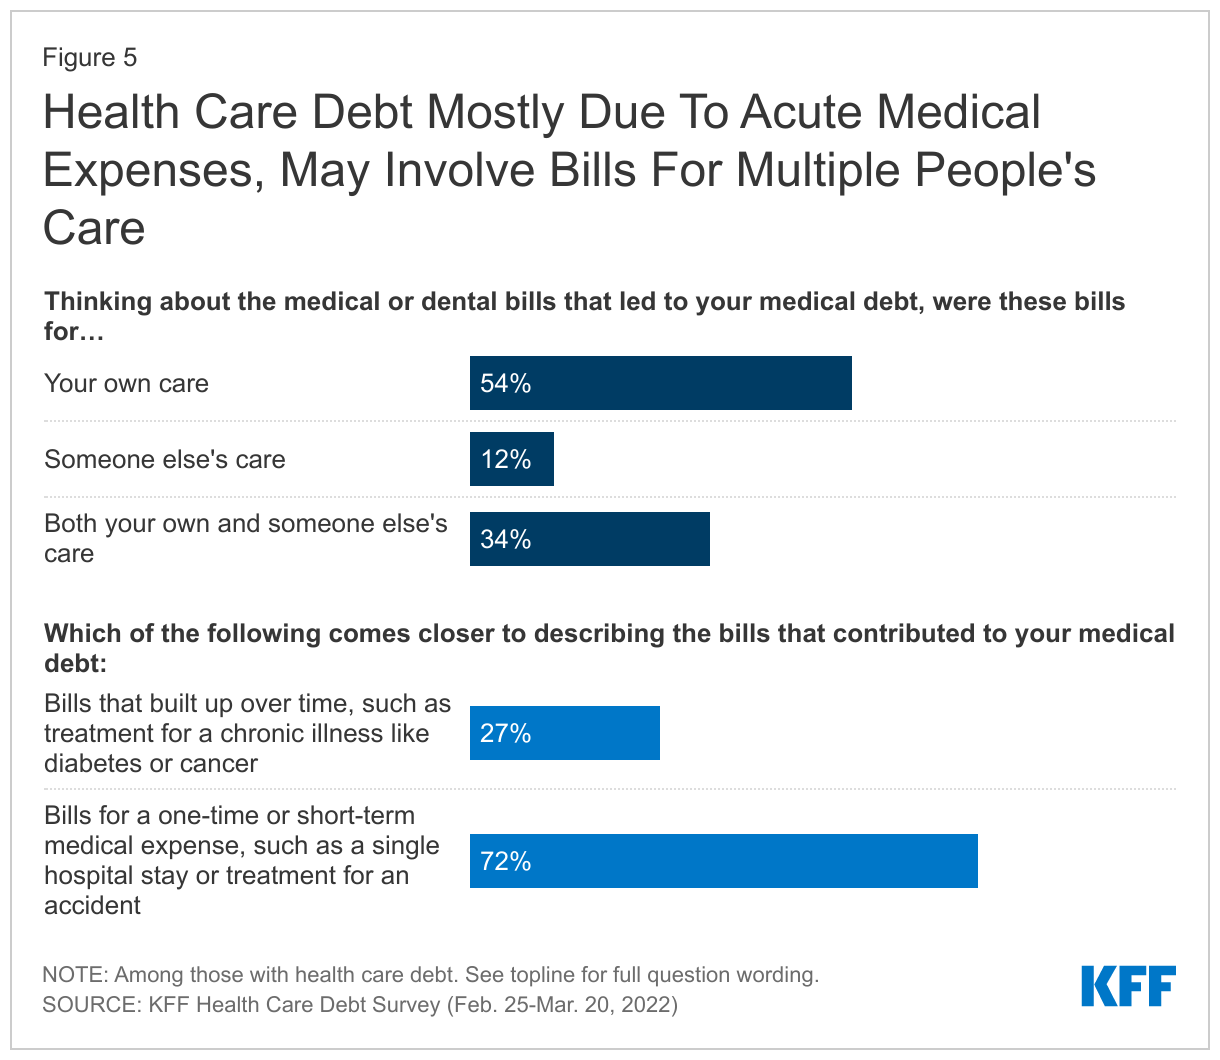
Debt due to health care bills can be driven by one individual’s medical care, but often multiple family members’ bills can contribute to overall debt. While about half (54%) of adults with health care debt say the bills that led to their debt were only for their own care, 12% say their health care debt stemmed from bills for someone else’s care and another third (34%) say that bills for both their own and someone else’s care contributed to the debt.

Highlighting how one acute medical or dental incident can lead to persistent debt, seven in ten adults with health care debt (72%) say the bills that led to their debt were for a one-time or short-term medical expense, such as a single hospital visit or treatment for an accident. Many in this group (24%, or 30% of all adults with health care debt) say the incident that led to their debt occurred three or more years ago. About a quarter of adults (27%) say their medical debt built up over time, such as treatment for a chronic illness.

Health Care Debt Mostly Due To Acute Medical Expenses, May Involve Bills For Multiple People's Care

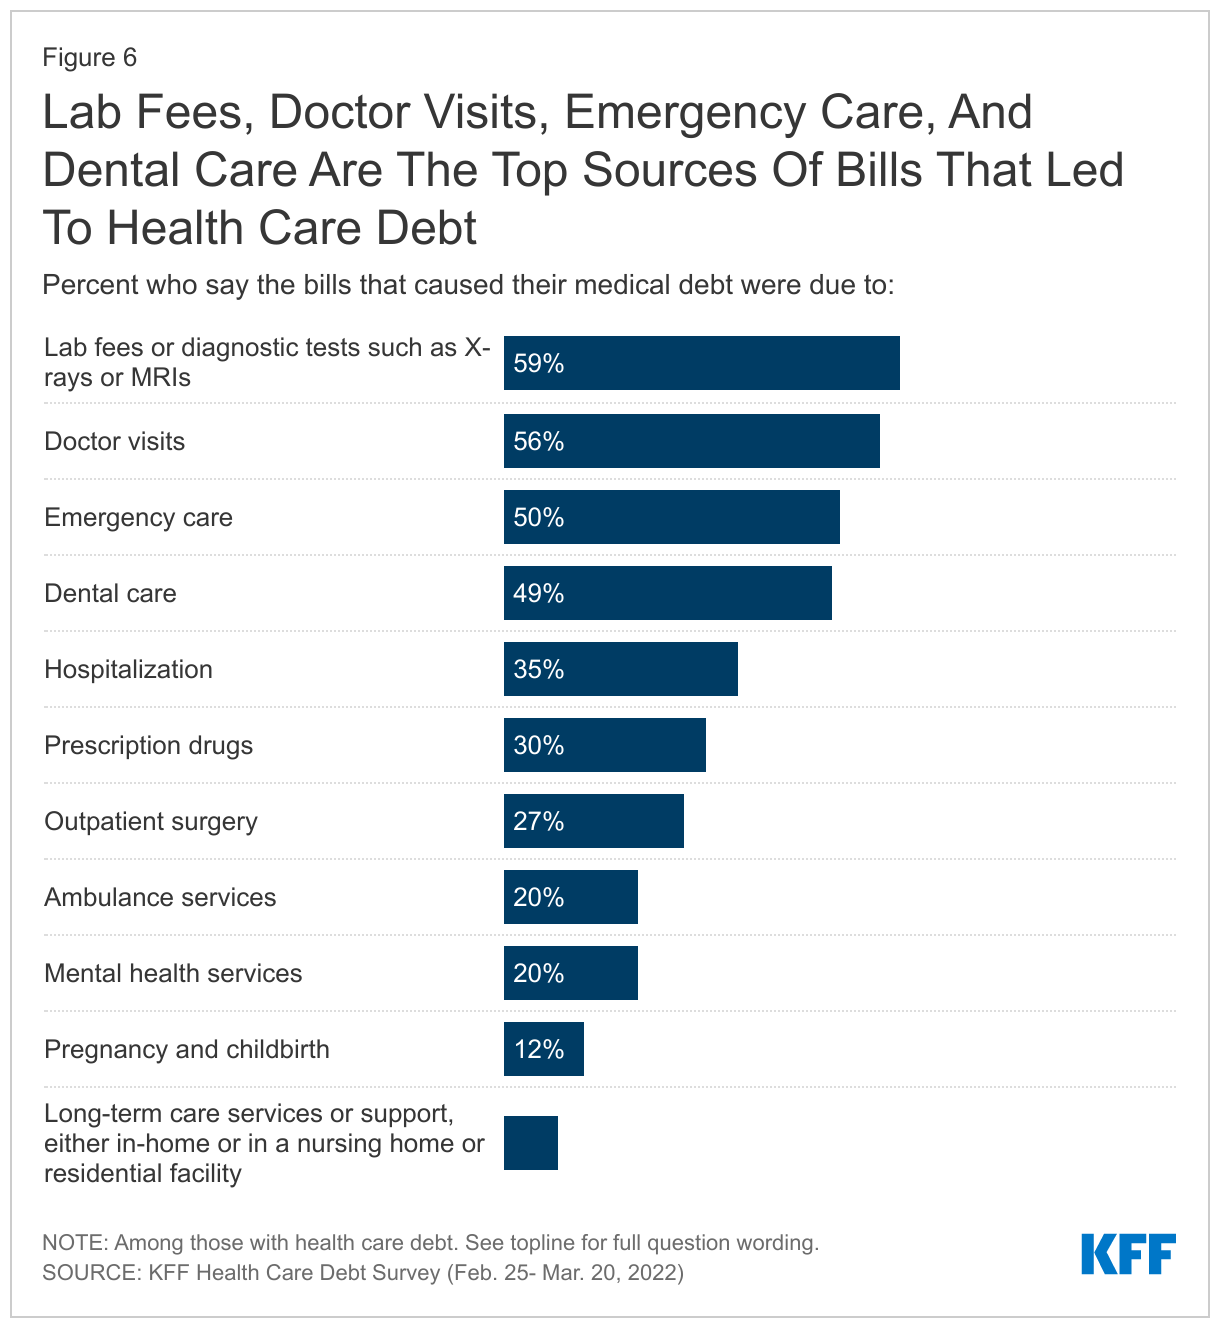
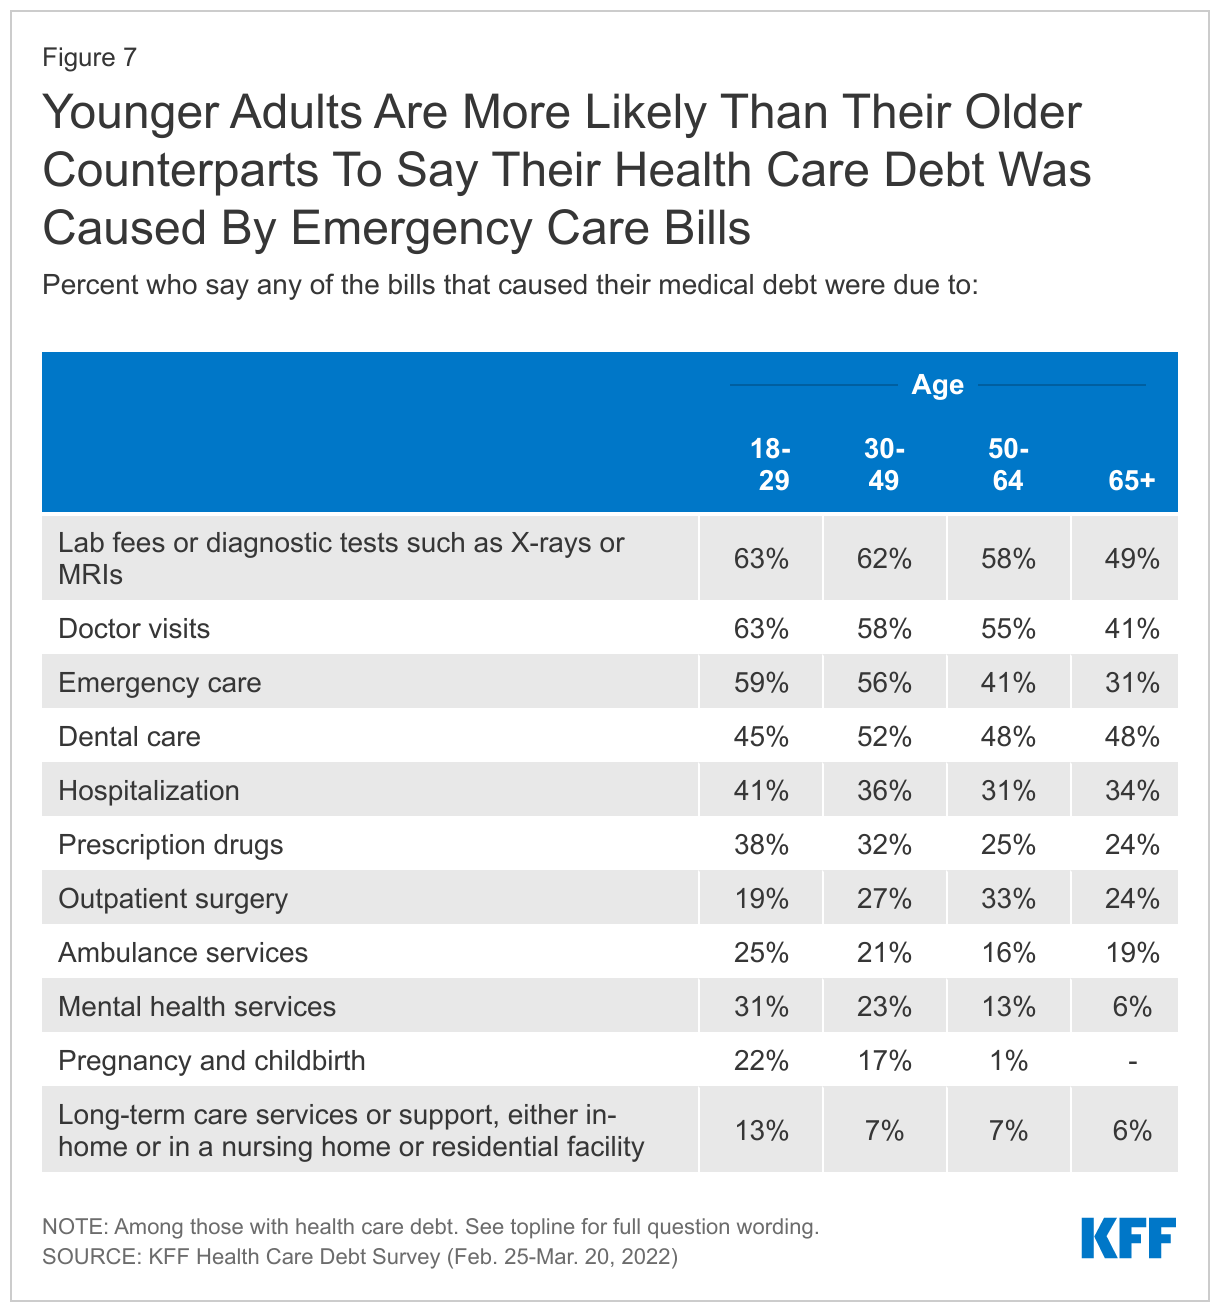
Common health care needs such as lab and diagnostic test and doctor’s visits are also common sources of health care debt. Among adults with health care debt, about six in ten (59%) say some of the bills that led to their debt were due to lab fees or diagnostic tests and over half (56%) say bills from doctor visits contributed to their debt. Half of adults with health care debt say bills from emergency care (50%) caused their debt, again highlighting how one-time acute medical events can cause people to fall into health care debt.

About half of adults with health care debt (49%) say dental bills caused some of their debt. Notably, dental insurance, which typically has annual limits on coverage, does not necessarily protect individuals from falling into debt due to dental bills. Among those who say dental bills contributed to their health care debt, 60% say they or the person whose bills led to their debt had dental coverage at the time.

Lab Fees, Doctor Visits, Emergency Care, And Dental Care Are The Top Sources Of Bills That Led To Health Care Debt

The types of bills that lead to health care debt vary by age. Notably, one of the most common types of bills leading to health care debt for older adults is dental care, likely because traditional Medicare does not provide dental coverage (though some beneficiaries in private Medicare Advantage plans do have dental coverage, with the scope varying widely). By contrast, older adults are less likely than their younger counterparts to say their health care debt resulted from lab fees, doctor visits, or emergency care.

Other types of bills are more common sources of health care debt among younger adults. A majority of adults with health care debt under age 50 say their debt was at least partially due to bills for emergency care, compared to about four in ten (41%) of those ages 50-64 and about three in ten (31%) of those ages 65 and over. Adults under age 30 are also more likely than their older counterparts to report their health care debt is due at least partially to bills for mental health services (31%).

For young families, pregnancy and childbirth can lead to health care debt. Among adults under age 30 who have health care debt, 22% say that bills from pregnancy and childbirth contributed to their debt, rising to 29% of women in this age range.

Younger Adults Are More Likely Than Their Older Counterparts To Say Their Health Care Debt Was Caused By Emergency Care Bills

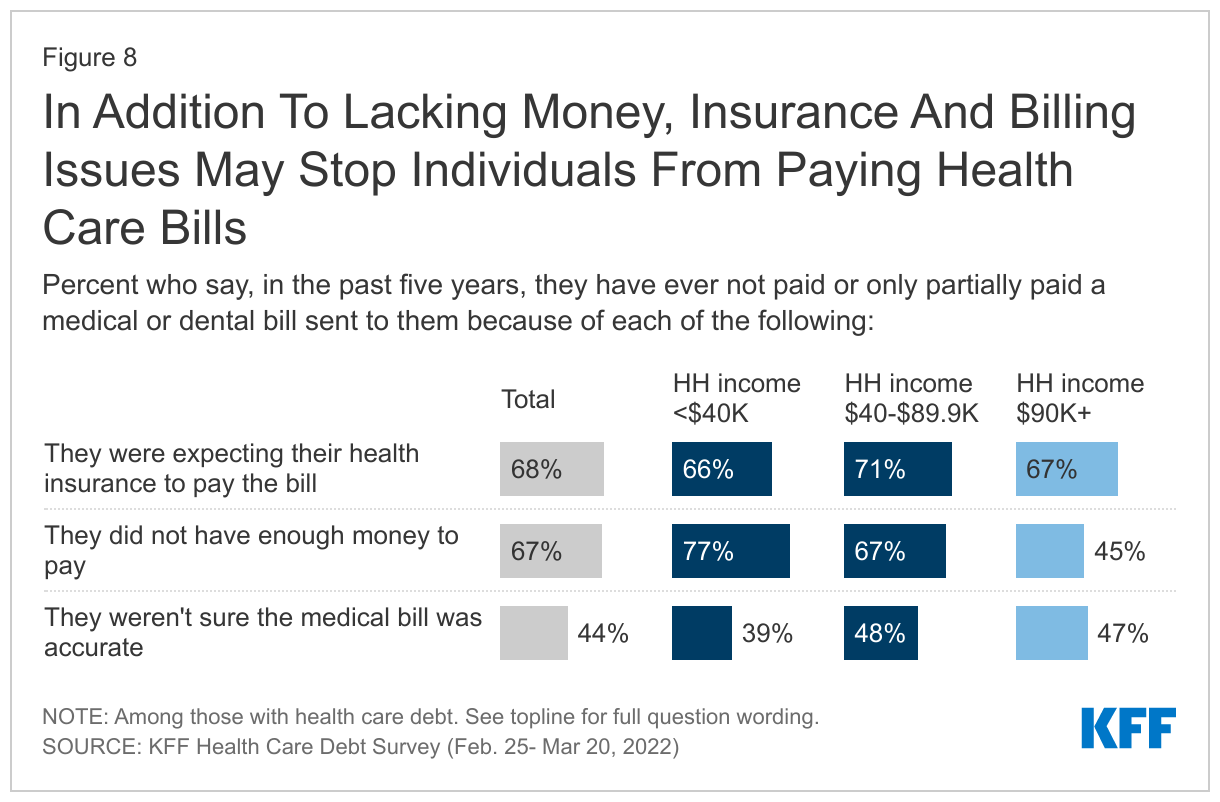
Lacking money to pay a bill is often a reason people fall into debt, but complications in billing and insurance practices may also be contributing factors for some. Two-thirds (67%) of those with health care debt say that in the past five years, they have not paid or only partially paid a medical bill because they didn’t have enough money to pay it. But a roughly equal share (68%) say they have not paid a bill in full because they were expecting their health insurance to pay the bill. About four in ten (44%) adults with health care debt say that they did not pay a bill in full in the past five years because they weren’t sure the bill was accurate.

Unsurprisingly, lack of money to pay a bill is particularly an issue for those with lower household incomes. More than three in four adults with health care debt whose income is under $40,000 (77%) say they have failed to pay a medical bill for because they did not have enough money, compared to fewer than half of those with incomes of $90,000 or more. Yet issues with insurance occur across income levels as majorities with health care debt across income groups say they have not paid a medical or dental bill that was sent to them because they expected their health insurance to pay.

In Addition To Lacking Money, Insurance And Billing Issues May Stop Individuals From Paying Health Care Bills

The Consequences Of Health Care Debt

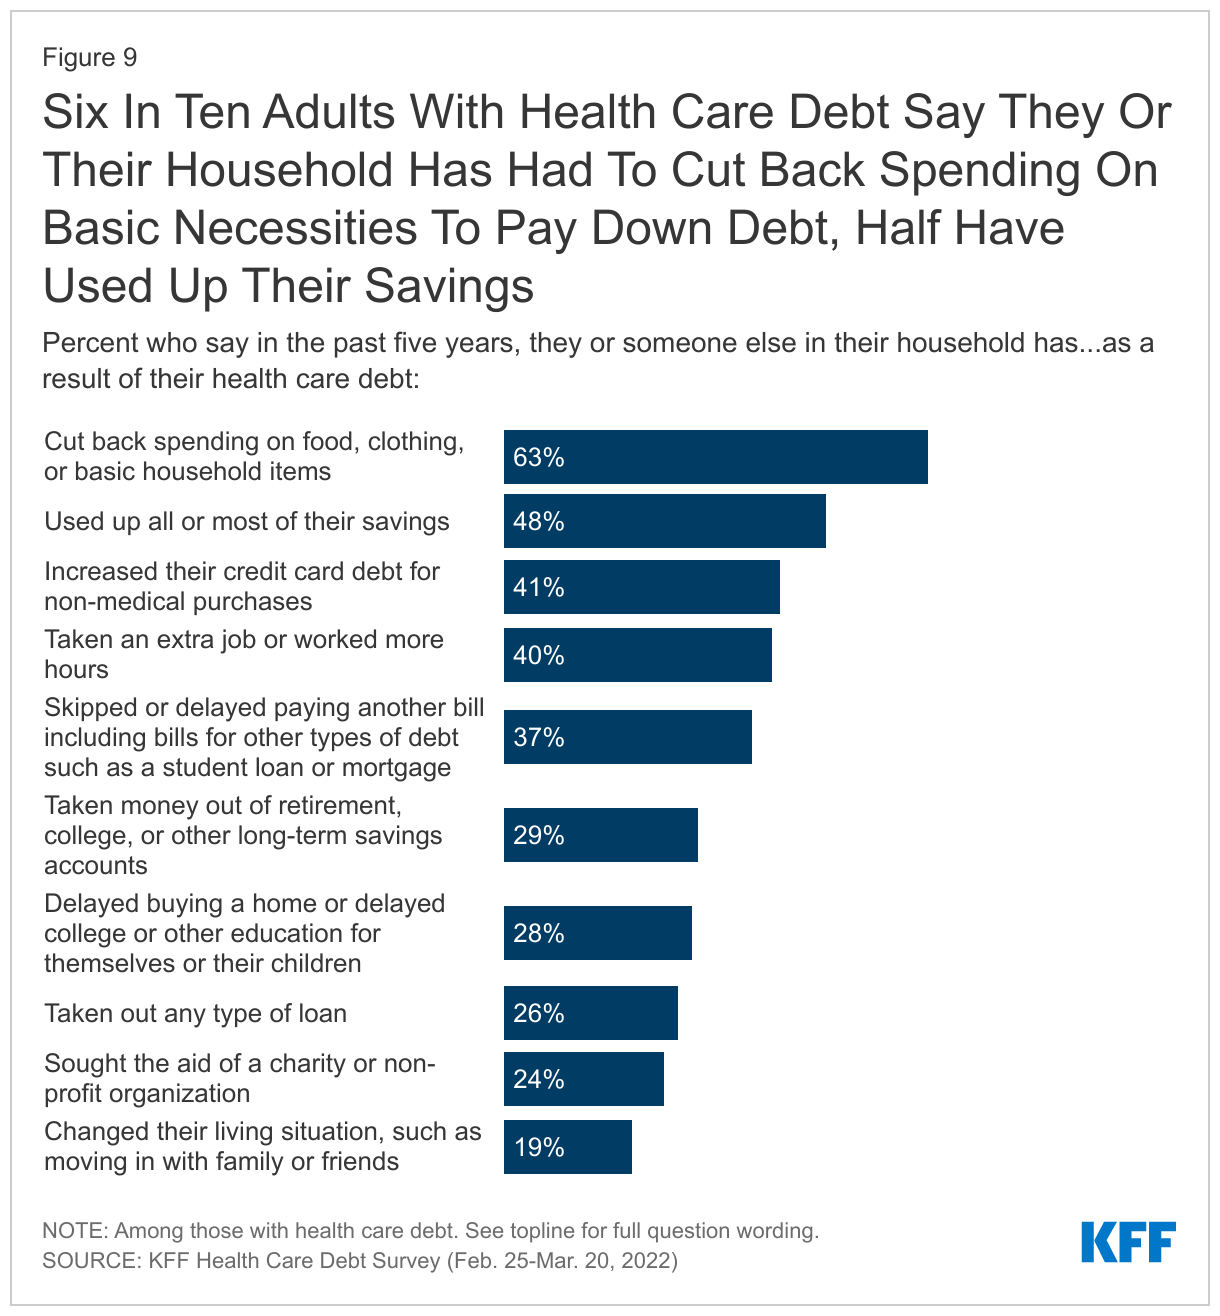
Debt due to medical and dental bills can have broad consequences for individuals and families. When asked about some specific problems they or someone in their household may have experienced in the past five years as a result of their health care debt, six in ten adults with health care debt say they cut back spending on food, clothing, and basic household items (63%). Nearly half say they used all or most of their savings (48%) and about four in ten say they increased their credit card debt for other purchases (41%), took on an extra job or worked more hours (40%), and skipped or delayed paying other bills or debt (37%) due to their health care debt. Fewer, but substantial shares, say they have taken money out of long-term savings accounts (29%), delayed buying a home or delayed education for themselves or their child (28%), taken out other loans (26%), sought aid from a charity (24%) or changed their living situation, such as living with family or friends because of their health care debt (19%).

Six In Ten Adults With Health Care Debt Say They Or Their Household Has Had To Cut Back Spending On Basic Necessities To Pay Down Debt, Half Have Used Up Their Savings

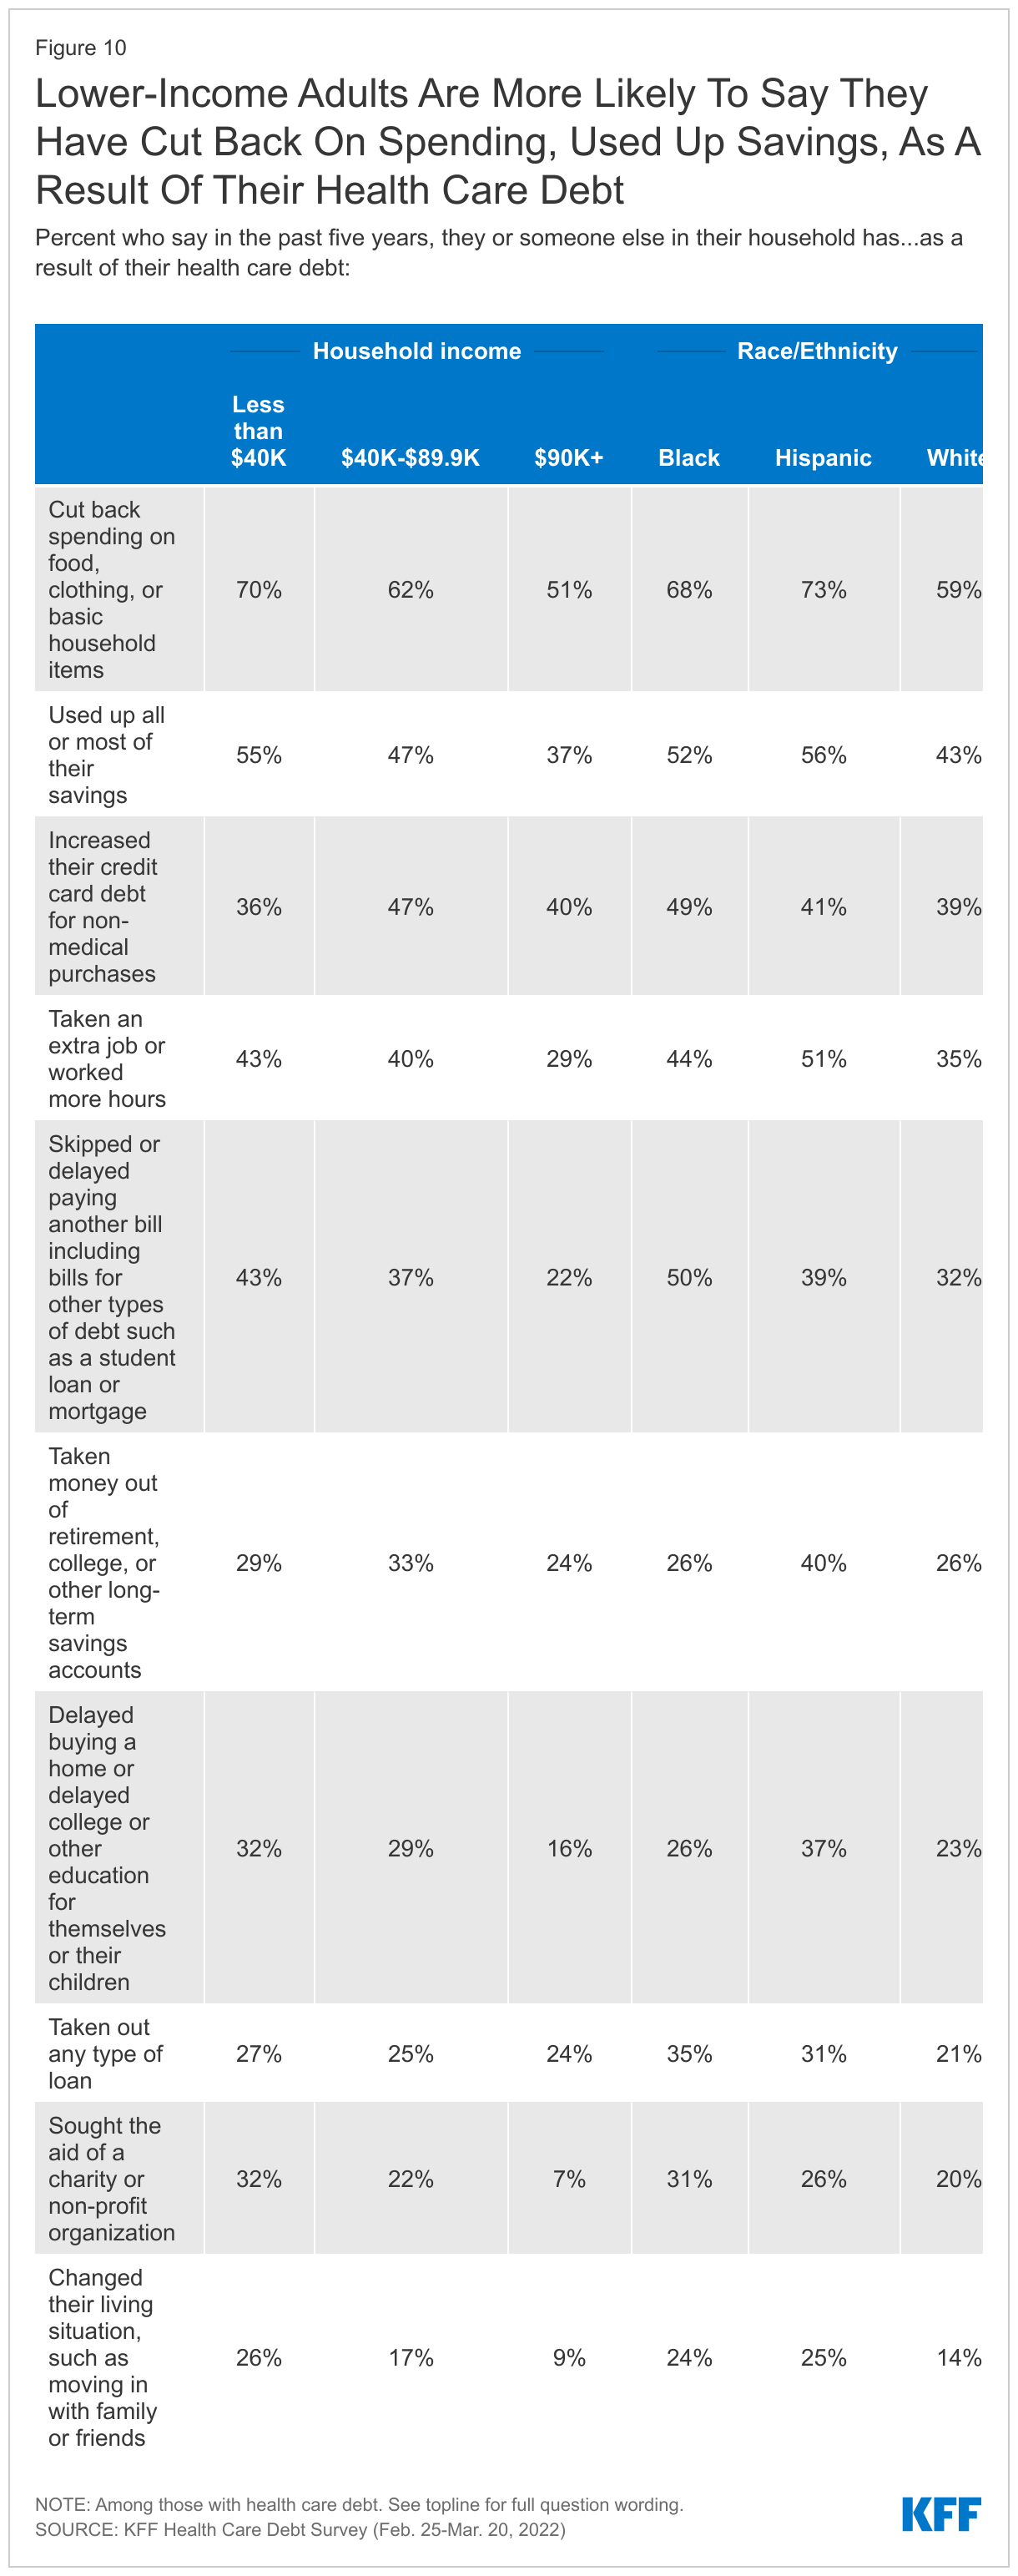
Among adults with health care debt, majorities across race and ethnic groups and at least half across income groups say they have cut back on household spending due to their medical debt. However, lower-income adults are more likely than those with higher incomes to say they have experienced certain negative consequences due to their debt. For example, over half (55%) of those with health care debt whose household income is less than $40,000 say they used up all or most of their savings due to their debt, which may put them in a further precarious financial position if they encounter future medical or other expenses. Compared to those with higher incomes, larger shares of lower-income adults with debt say they have skipped or delayed paying other bills (43%) or sought aid from charity or non-profit organization (32%). Notably, about a quarter of lower-income adults (26%), Black adults (24%), Hispanic (25%) adults with health care debt say they had to change their housing situation, such as moving in with family or friends, as a result of their debt.

Lower-Income Adults Are More Likely To Say They Have Cut Back On Spending, Used Up Savings, As A Result Of Their Health Care Debt

Sacrifices Made Due To Health Care Debt

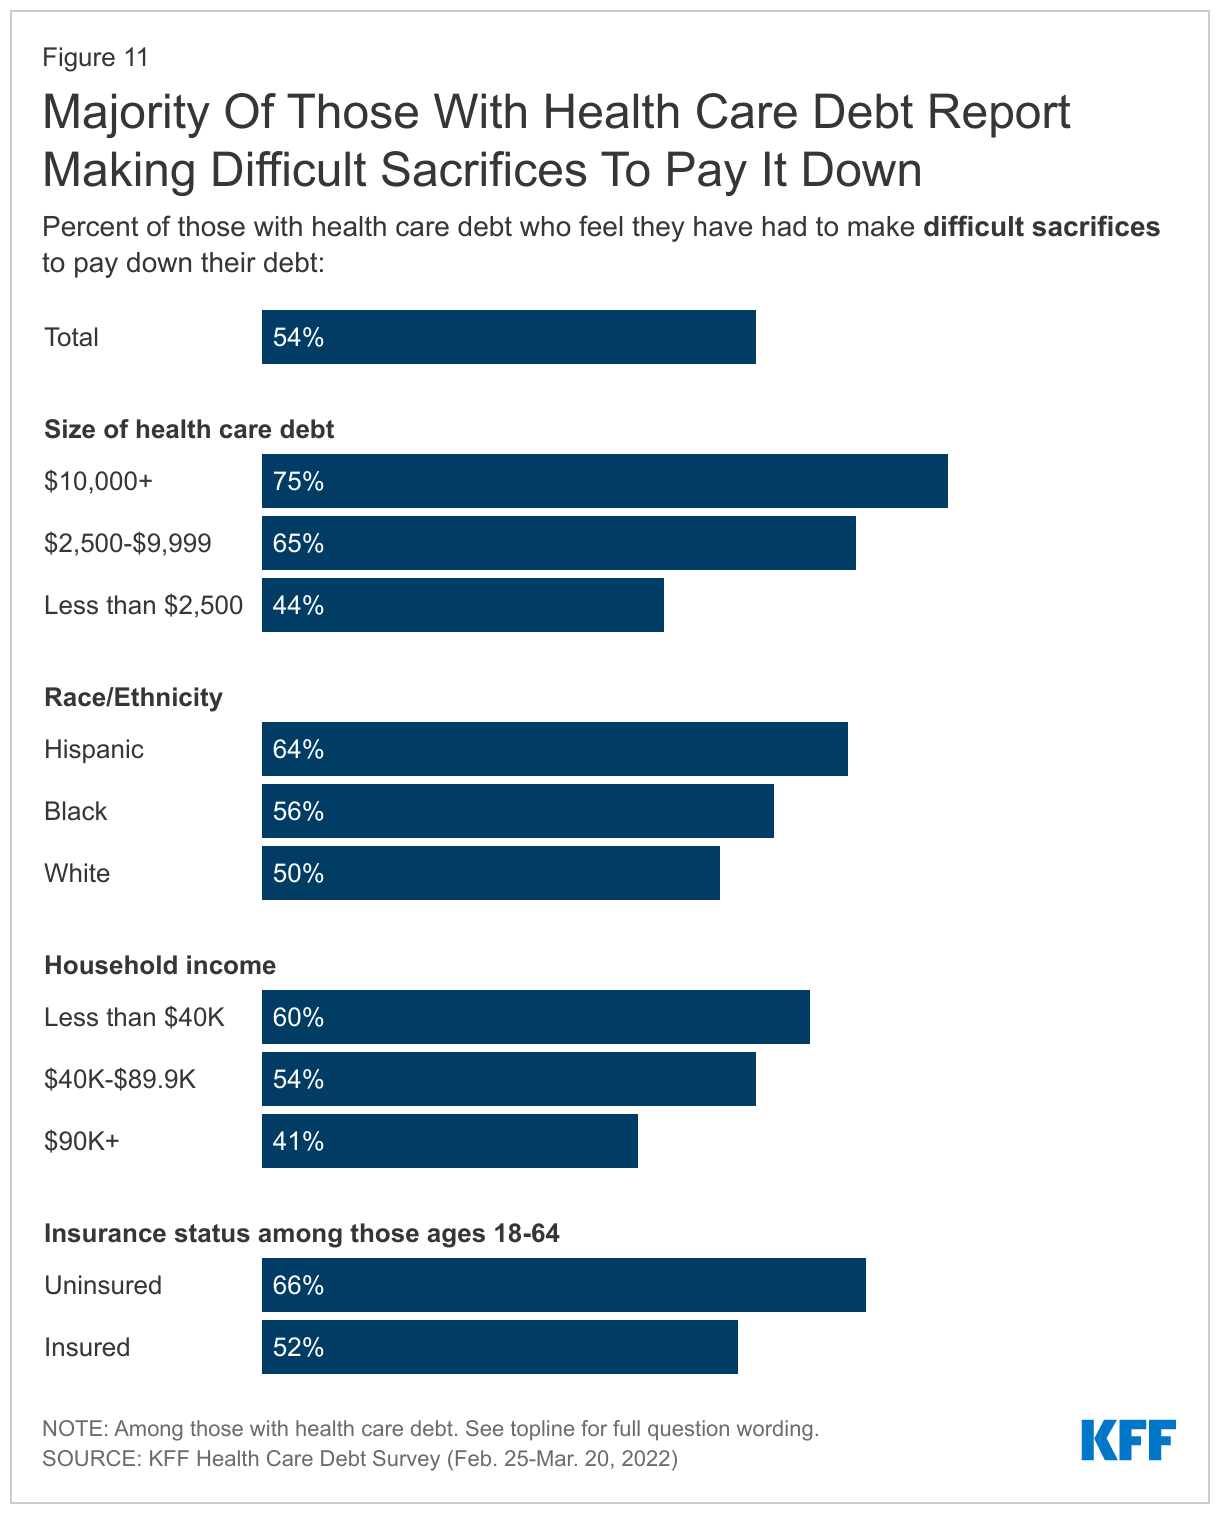
In addition to the specific consequences discussed above, over half (54%) of adults with debt due to health care bills say they have had to make what they feel is a difficult sacrifice to pay down their debt, Including at least six in ten of those in households with incomes under $40,000 (60%), Hispanic adults (64%) and those with current debt who were uninsured at the time the debt was incurred (66%).

Not surprisingly, those with greater amounts of debt are more likely to report having to make sacrifices, with three in four of those with debts of $10,000 or more reporting making a difficult sacrifice. A significant share of adults with smaller debts, however, also say they’ve had to make sacrifices (44% of those with debts under $2,500).

Majority Of Those With Health Care Debt Report Making Difficult Sacrifices To Pay It Down

The sacrifices adults with health care debt say they have had to make due to their debt are wide-ranging. When adults with health care debt were asked to describe in their own words the most difficult sacrifices they have made, the most commonly cited sacrifices include cutting back spending on food or eating less (14%), followed by cutting back on discretionary spending on things such as vacations and entertainment (8%), changing their housing or living situation (7%), and increasing work hours (7%). Other sacrifices mentioned include skipping or missing payments on other bills (6%), cutting back spending in general (5%), skipping medical or dental care (5%), taking money out of savings (5%), and delaying or not buying a vehicle or selling their vehicle (5%). Many of the sacrifices cited by adults with health care debt have their own consequences that can further negatively affect their financial and emotional wellbeing. Below, in their own words, are some examples of the difficult sacrifices that adults with health care debt say they have made to pay down their debt.

In Their Own Words: What is the most difficult sacrifice you’ve made to pay down your medical debt?

Had to move into rental place from home and not able to buy a house. Cut in some household or good food for kids.” -35 year old woman with $5,000-$10,000 in medical debt, Texas

“Quality of life. We've never been able to 'get ahead' because we have a 35 year old disabled daughter. We've had medical debt for 35 years varying from 30k down to $500.” -60 year old woman with $2,500-$5,000 in medical debt, Tennessee

“Not paying bills on time, creating larger bills due to late fees. Depleted savings.” -38 year old man with $2,500-$5,000 in medical debt, North Carolina

“Cutting out any expenses/services I can. No job, fixed income and chemo. Even with insurance, no one can afford cancer.” -67 year old woman with more than $25,000 in medical debt, Nebraska

“Limiting birthday/Christmas gifts for children and grandchildren.” -83 year old woman with $1,000-$2,500 in medical debt, New Jersey

“Getting a second job. I'm exhausted and I don't see a way out.” -44 year old woman with $1,000-$2,500 in medical debt, Ohio

“I can't do anything; I literally stay at home. Never taken my kids on vacation. I'm a single mother and all my money supports the household. So, there are not a lot of extras in my house.” -55 year old woman, with $2,500-$5,000 in medical debt, Missouri

“Strain on relationship with [my] father due to asking for help to pay medical expenses; negative impact on mental health issues (e.g., significant increase in anxiety symptoms).” -35 year old woman with $10,000-$25,000 in medical debt, New York

“This was medical debt for my (now deceased) husband -- my credit cards are maxed-out, savings is gone, I will need to relocate to afford rent and pay down bills.” -67 year old woman with $10,000-$25,000 in medical debt, Illinois

Financial And Housing Consequences

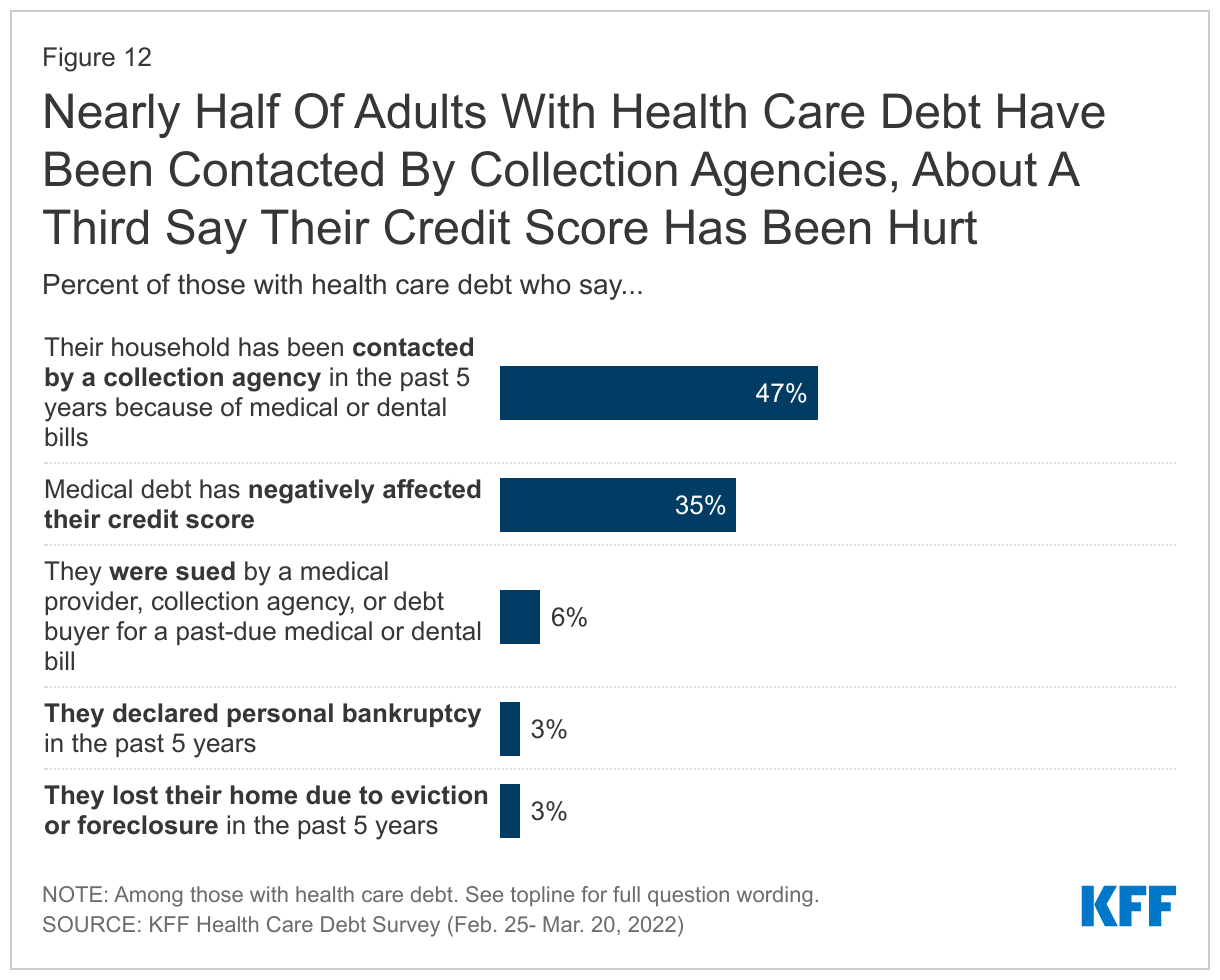
Health care debt can have significant financial consequences, including having bills going to collections, lowering credit scores, and for some can contribute to bankruptcy, home foreclosures or evictions. Nearly half of adults with health care debt say they or a member of their household has been contacted by a collection agency in the past five years because of medical or dental bills. In addition, a third of those with health care debt (35%) say it has negatively affected their credit score. Fewer say they have experienced more serious financial consequences in the past five years such as being sued by a provider (6%), declaring personal bankruptcy (3%), or losing their home due to foreclosure or eviction (3%).

Nearly Half Of Adults With Health Care Debt Have Been Contacted By Collection Agencies, About A Third Say Their Credit Score Has Been Hurt
Collections Agencies

Collection agencies are third-party, private companies contracted by lenders and creditors to recover funds that are past due. The Fair Debt Collection Practices Act (FDCPA) federally regulates debt collector’s malpractices to protect consumers from abusive, unfair, or deceptive practices. However, often those with debt can feel harassed and intimidated by collectors.

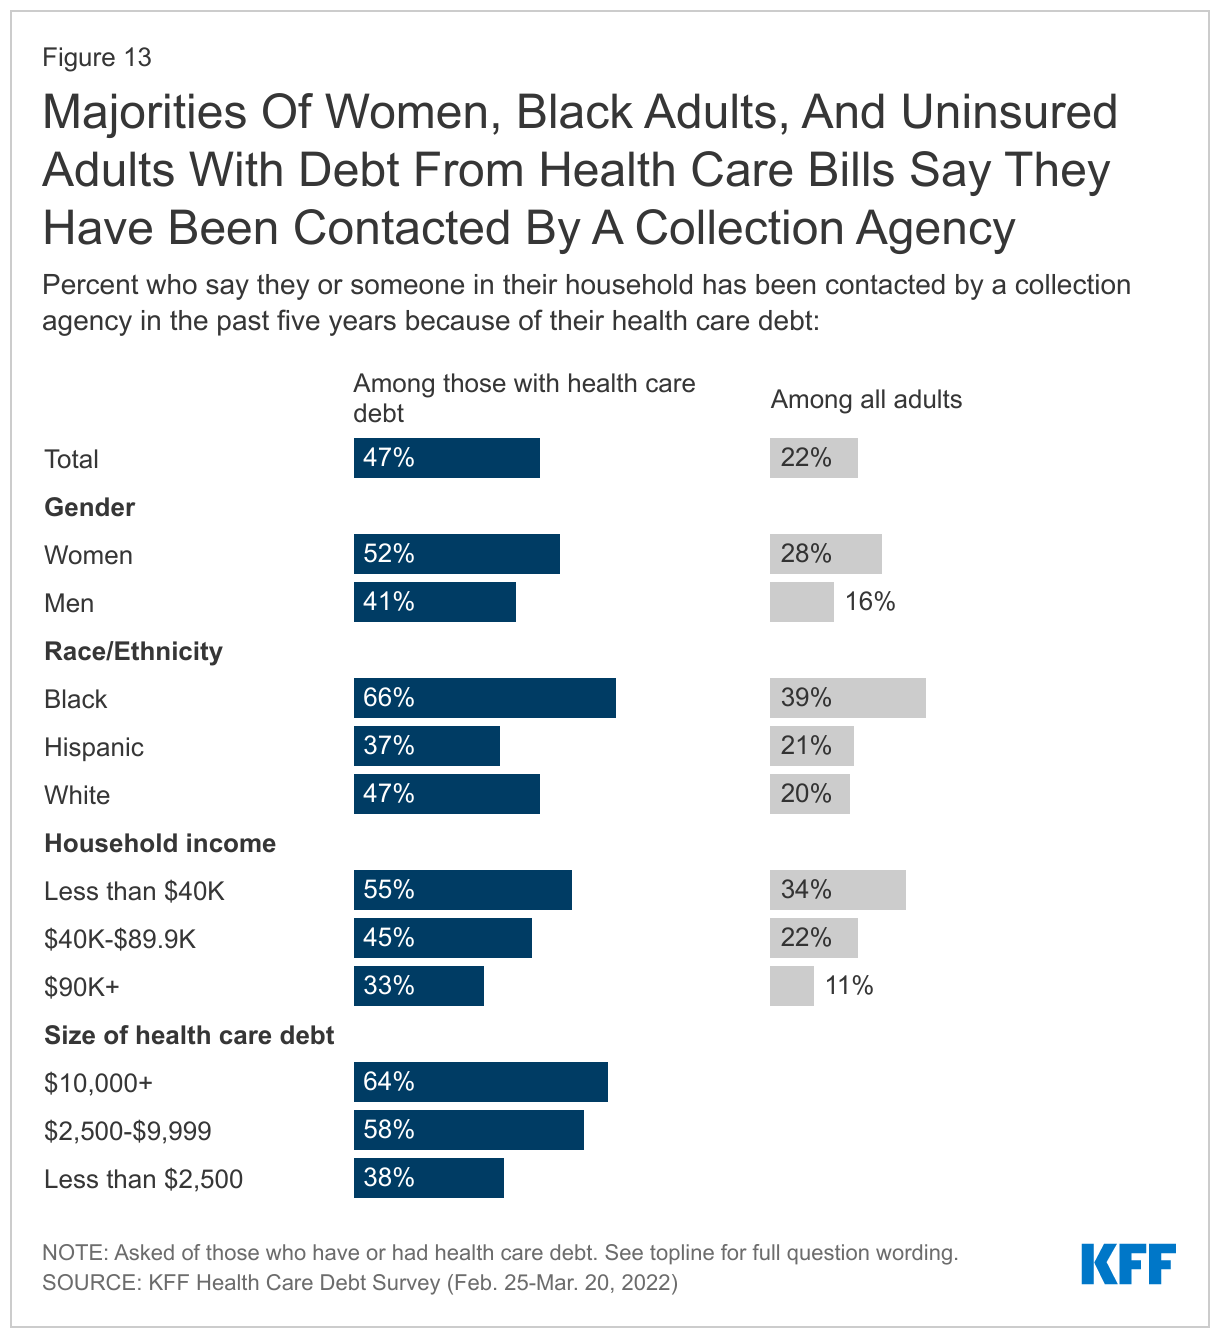
While half (47%) of adults with debt due to medical or dental bills say that they or someone in their household has been contacted by a collection agency because of these bills in the past five years, these shares are higher among Black adults (66%), those with lower incomes (55% of those with incomes under $40,000), and women (52%).

Majorities Of Women, Black Adults, And Uninsured Adults With Debt From Health Care Bills Say They Have Been Contacted By A Collection Agency
Credit Scores

Credit scores in the U.S. are important in determining financing for large purchases such as vehicles, for buying or renting a home, and for rates on future debts such as credit cards. Having a low credit score can be difficult to recover from and cause adults to go into further debt. Credit scores are determined by a number of factors, such as length of credit, unpaid balances, and missed or late payments. For many adults, it can be difficult to understand what factors are influencing the score. Recently, the three major credit bureaus in the U.S. announced that they would “no longer include medical collection debt under at least $500 on credit reports”, a move they estimate will remove nearly 70% of medical collection debt from credit reports.

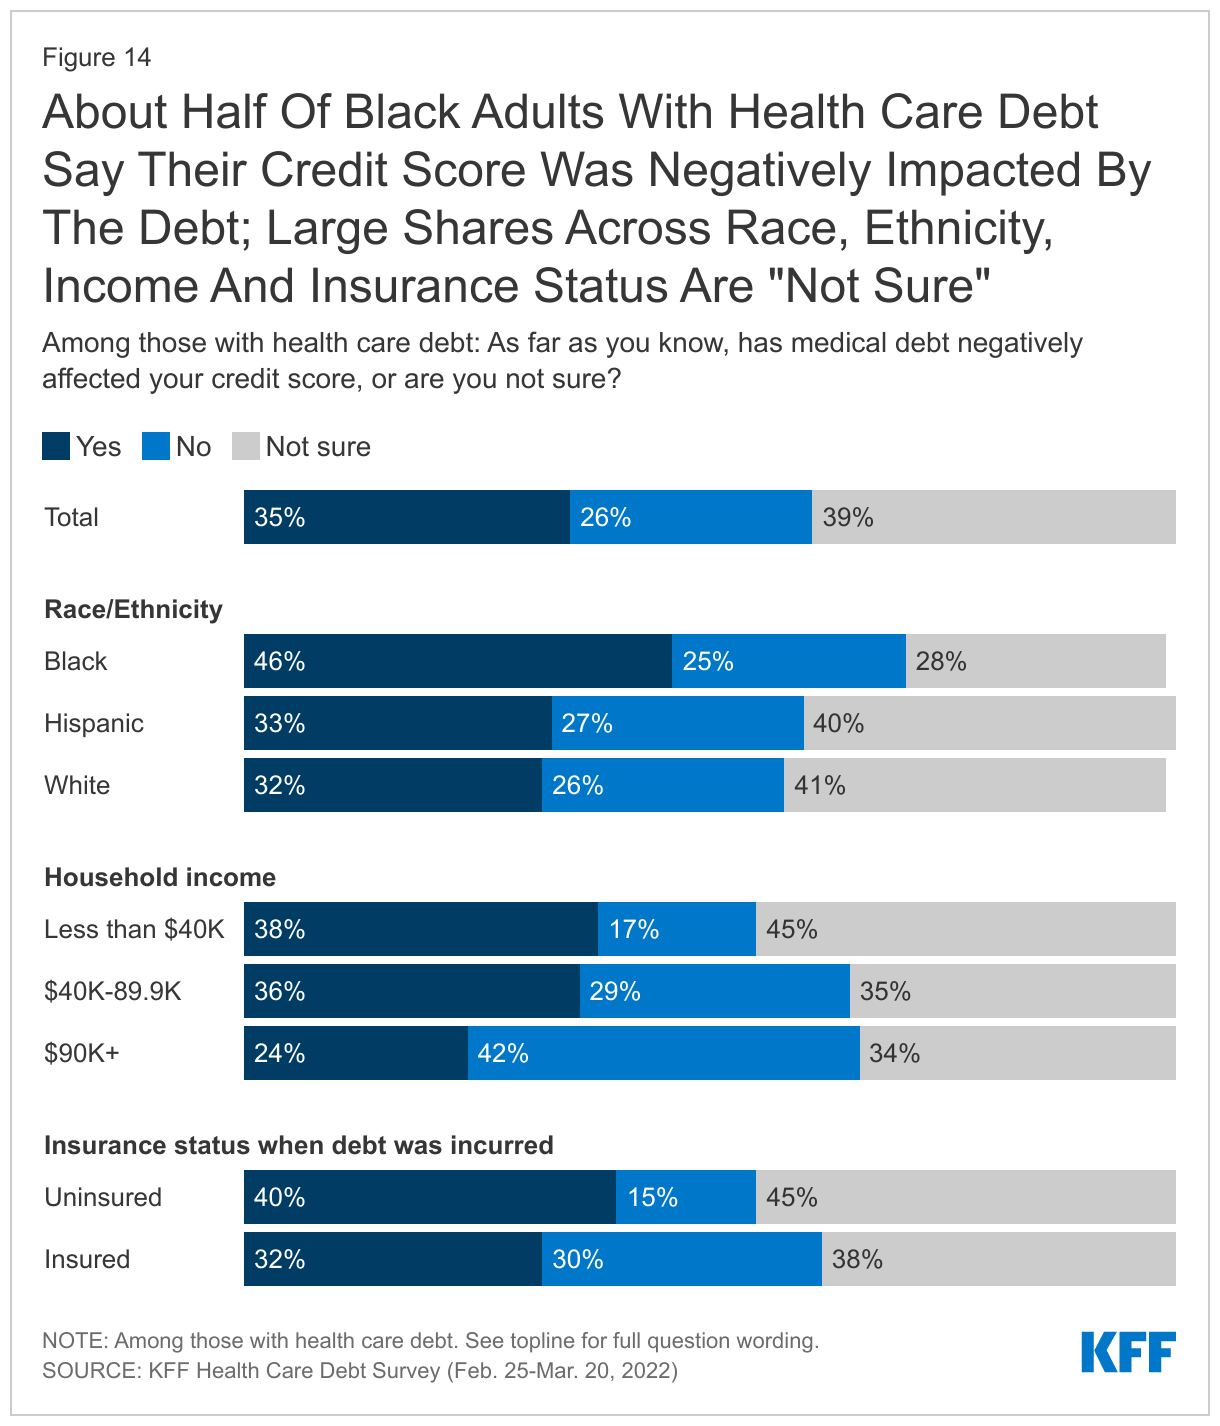
The KFF Health Care Debt survey finds that more than a third (35%) of adults with health care debt say this debt has negatively impacted their credit score, yet a similar share (39%) say they are unsure if their debt has impacted their credit score. Credit score decreases are more commonly reported by Black adults with debt, as nearly half (46%) say their credit score has been negatively impacted by the health care debt they carry, compared to a third of White (32%) and Hispanic (33%) adults who say the same. Nearly four in ten (38%) adults with health care debt in households with lower incomes say their credit score has been negatively impacted by their debt, compared to one in four (24%) of those with debt in higher earning households.

About Half Of Black Adults With Health Care Debt Say Their Credit Score Was Negatively Impacted By The Debt; Large Shares Across Race, Ethnicity, Income And Insurance Status Are "Not Sure"

The negative effect of health care debt on credit scores is noted by some adults with debt when asked to describe the sacrifices they’ve made. Some describe how poor credit scores have led to more severe financial consequences such as losing access to vehicles needed for work and to stable housing options.

In Their Own Words: The Effect Of Negative Credit Scores Due To Health Care Debt

“Said goodbye to any positive credit scores, meaning that since all my medical bills went to collections, I’ve lost over 250 points on my credit score and can no longer be even considered for any [loans].” -38 year old man with $1,000-$2,500 in medical debt, Iowa

“My credit score is so low I can't get financing for a vehicle causing me to lose my job due to lack of transportation.” -31 year old woman with $5,000-$10,000 in medical debt, Arkansas

“I became homeless because my debt has hurt my credit score.” -33 year old woman with 1,000-$2,500 in health care debt, California

Consequences For Getting And Receiving Health Care

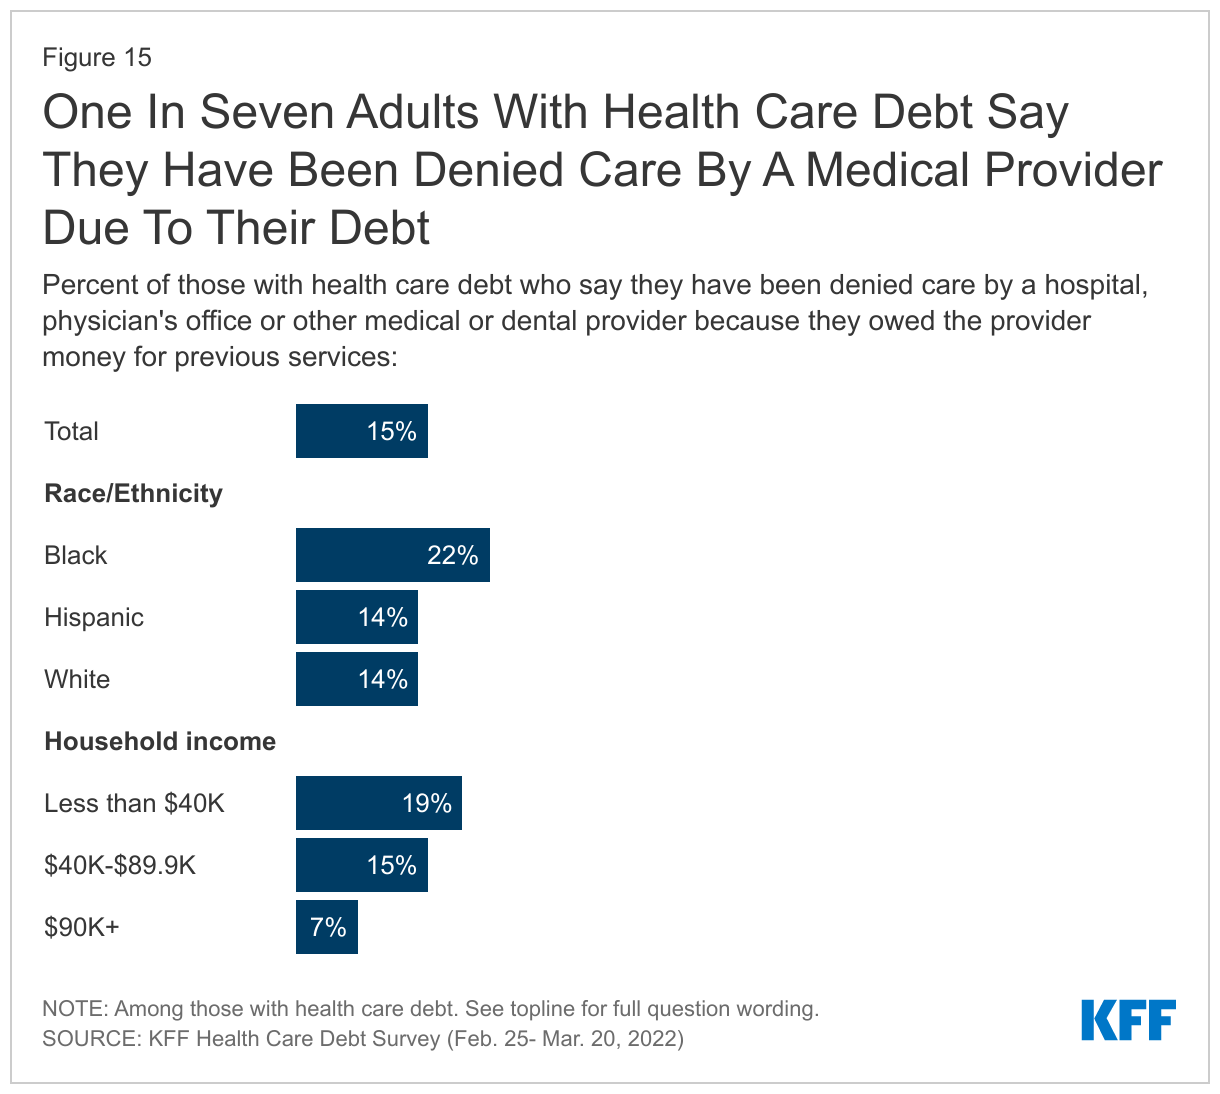
The consequences of health care debt are not limited to finances. For many, taking on health care debt can affect their ability to get future health care services or continue ongoing treatment. Fifteen percent of adults who currently have health care debt say they have been denied care by a hospital or other medical or dental provider because of their debt. Larger shares of Black adults with health care debt (22%) report this happening to them than their White (14%) or Hispanic (14%) counterparts. One in five (19%) adults with debt in households making less than $40,000 report being turned away from a medical provider, compared to 13% of those with higher household incomes.

One In Seven Adults With Health Care Debt Say They Have Been Denied Care By A Medical Provider Due To Their Debt

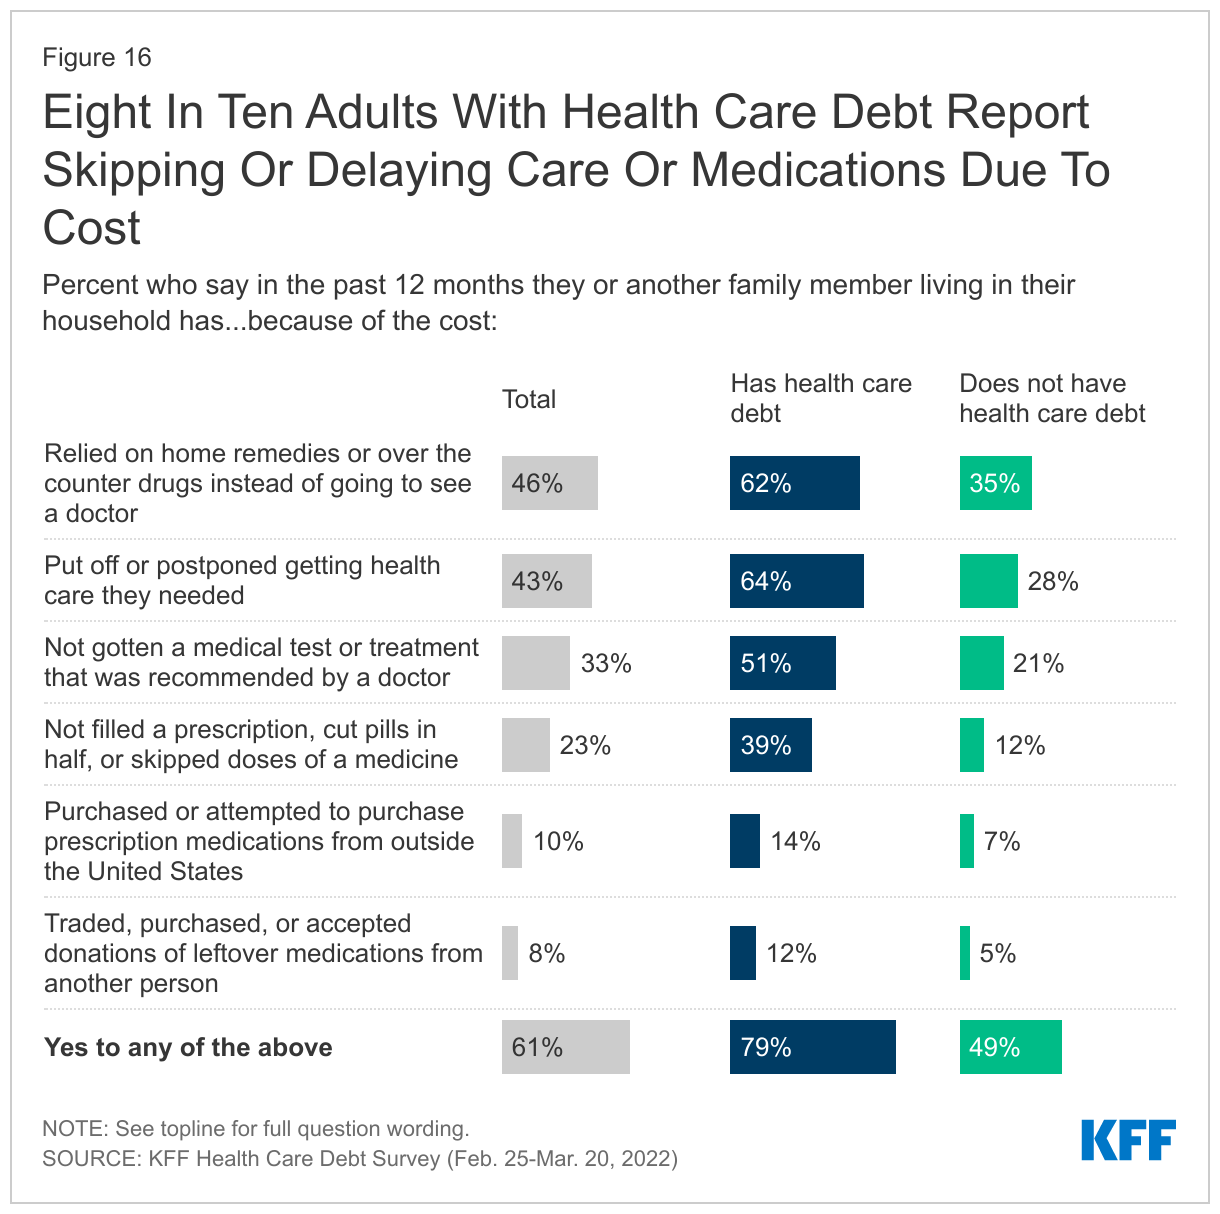
KFF polling has found that health care costs are a top concern for U.S. adults, and many—even those without debt—make decisions about whether to seek care based on how much it costs and whether they can afford it. This survey finds that those with health care debt are more likely to report delaying or skipping medical care due to costs, though significant shares of those without medical debt also say they or someone in their household has done these things as well. Adults with health care debt are more than twice as likely as those without debt to say they or someone in their family has put off health care they needed due to costs in the past 12 months (64% vs. 28%). Similarly, six in ten (62%) adults with health care debt, compared to about one-third (35%) of those without, say they have relied on home remedies or over-the-counter drugs in the last year instead of going to see a doctor due to costs. Adults with health care debt are also at least twice as likely as those without to say that in the past 12 months, because of the cost, they have skipped a medical test or treatment recommended by a doctor (51% vs. 21%), not filled a prescription, cut pills in half, or skipped doses of a medicine (39% vs. 12%), purchased or tried to purchase medications from outside the U.S. (14% vs. 7%), or obtained leftover medications that were prescribed to another person (12% vs. 5%).

Overall, about eight in ten (79%) of those with health care debt report taking at least one of these actions in the past 12 months because of the cost, compared to about half (49%) of those without health care debt.

Eight In Ten Adults With Health Care Debt Report Skipping Or Delaying Care Or Medications Due To Cost

When asked to describe the sacrifices they’ve made to pay down debt, many mention their reluctance to seek future medical or dental care for fear of incurring even greater bills.

In Their Own Words: How Health Care Debt Affects Access To Medical And Dental Care

We left the hospital a day after my wife gave birth via caesarean because we couldn't afford to stay.” -37 year old man with $5,000-$10,000 in medical debt, Texas

“Have neglected personal preventive [health care] since I feel like I have no right to step into a hospital since I am unable to pay.” -36 year old woman with $1,000-$2,500 in medical debt, Washington

“The most difficult sacrifice due to medical debt is avoiding dental [care] to avoid incurring any more debt. I have 6 broken teeth that could have been saved at some point if I had dental coverage.” -50 year old woman with less than $500 in health care debt, Minnesota

“I have skipped picking up prescriptions or seeking treatment, so my bill doesn't continue to get higher. The prescriptions are really the problem.” -60 year old woman, $500-$1,000 in health care debt, New Mexico

“I'm currently sacrificing my teeth. Insurance won't cover root canals. Only teeth pulling. And it's still like $500!” -29 year old man, $2,500-$5,000 in health care debt, New York

“There is a permanent anxiety with calling a doctor's office and scheduling a visit because I never know beforehand how much it will cost. Then, out of the blue, I'll get slammed with a bill I can't pay.” -25 year old woman with $500-$1,000 in health care debt, Ohio

A Precarious Position: Vulnerability To Health Care Debt

In addition to the four in ten adults who say they currently owe money due to medical or dental bills, many more may be one large bill away from landing themselves in this position. A KFF analysis has found that even among those with health insurance, many do not have the savings to pay typical health plan deductibles.

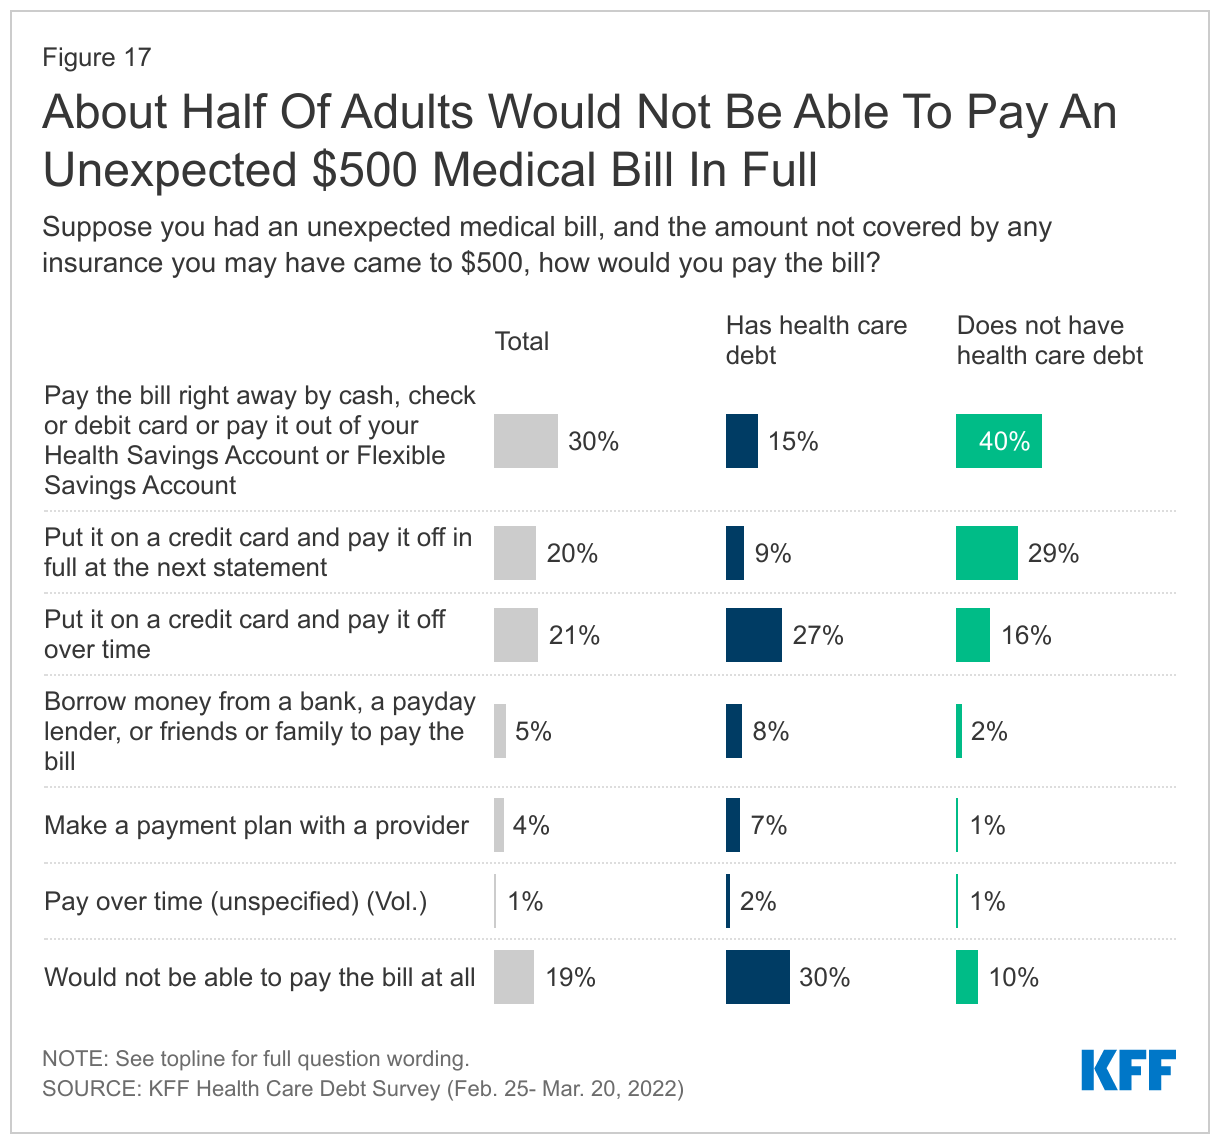
Among those with current health care debt, it is not surprising that the large majority say that if they got an unexpected medical bill for $500, they would either have to incur further debt to pay it (45%) or would not be able to pay the bill at all (30%). However, even among those who do not currently have health care debt, about three in ten say they would have to borrow money in order to pay such a bill (20%) or would not be able to pay it at all (10%).

About Half Of Adults Would Not Be Able To Pay An Unexpected $500 Medical Bill In Full

Public’s Views Of Policy Interventions To Address Or Assist Those With Health Care Debt

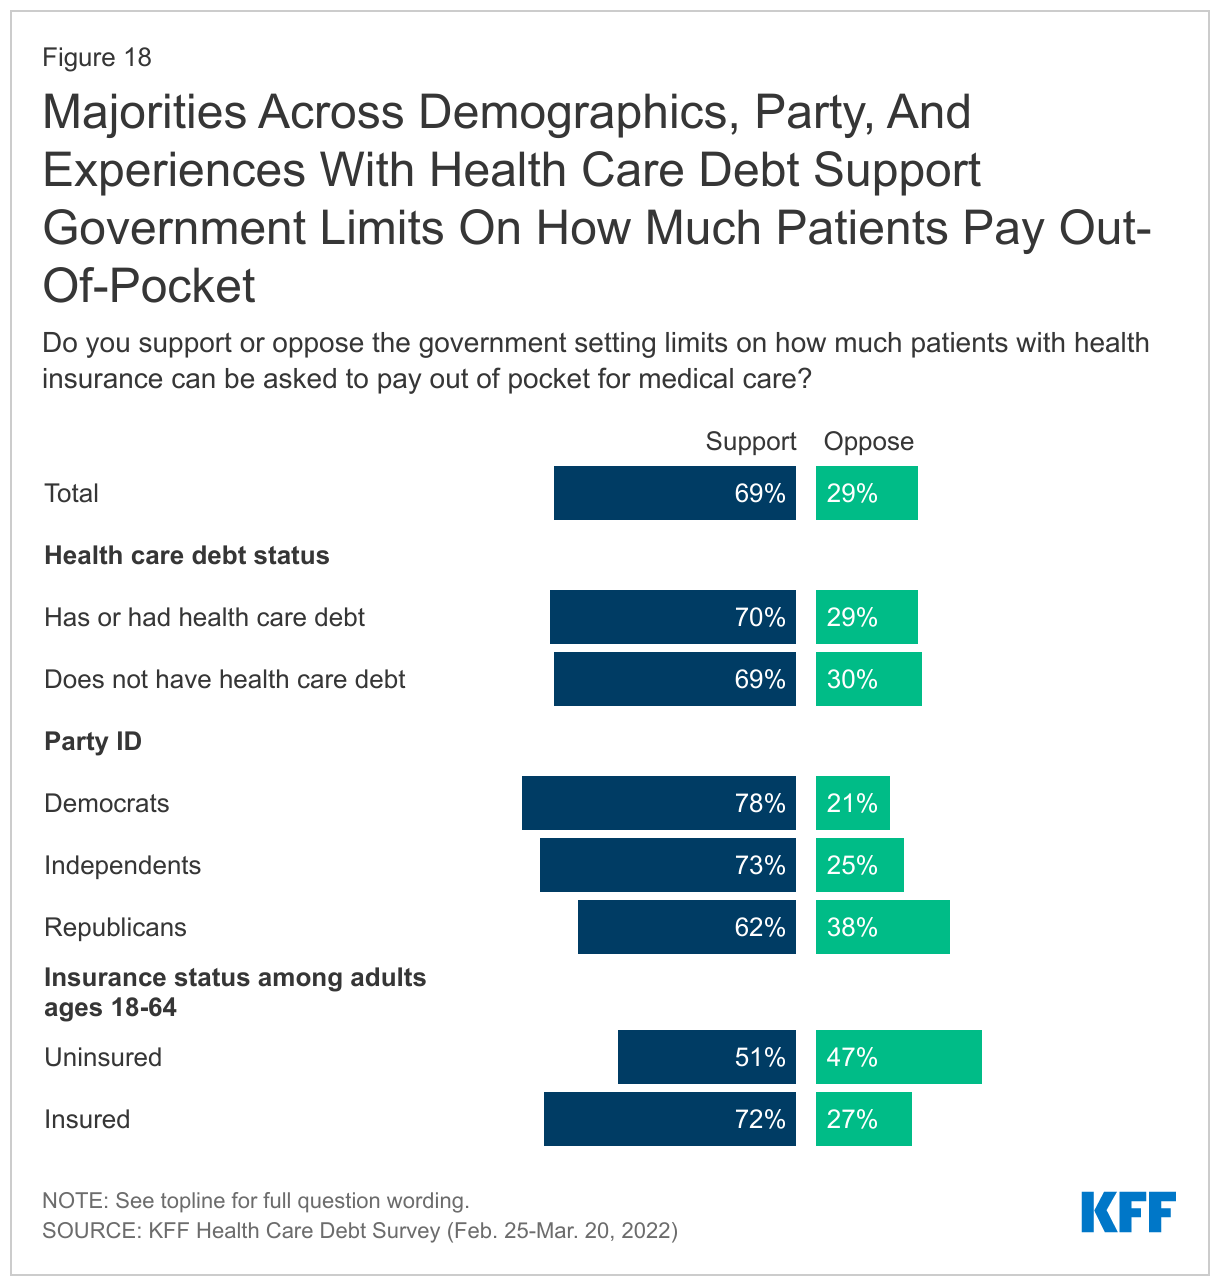
Given the relatively widespread nature of health care debt and the sizeable share of adults who would have to turn to debt to pay for a $500 unexpected medical bill, policies aimed at limiting costs for patients could potentially help individuals avoid health care debt. Majorities of both those who have and haven’t experienced health care debt say they support the government setting limits on how much patients with health insurance can be asked to pay out of pocket for medical care. While government regulation of health care is generally less popular among Republicans, majorities across partisans support such a proposal (though the share supporting among Democrats is 16 percentage points higher than among Republicans). Notably those who are insured and under age 65 (72%) are more likely to support this policy proposal than those who are uninsured (51%), likely because it would directly impact them.

It is worth noting that while overall support for this policy is high, the question on this survey did not ask individuals to consider any potential trade-offs related to the policy, such as higher health plan premiums or increased financial pressure of health care providers.

Majorities Across Demographics, Party, And Experiences With Health Care Debt Support Government Limits On How Much Patients Pay Out-Of-Pocket

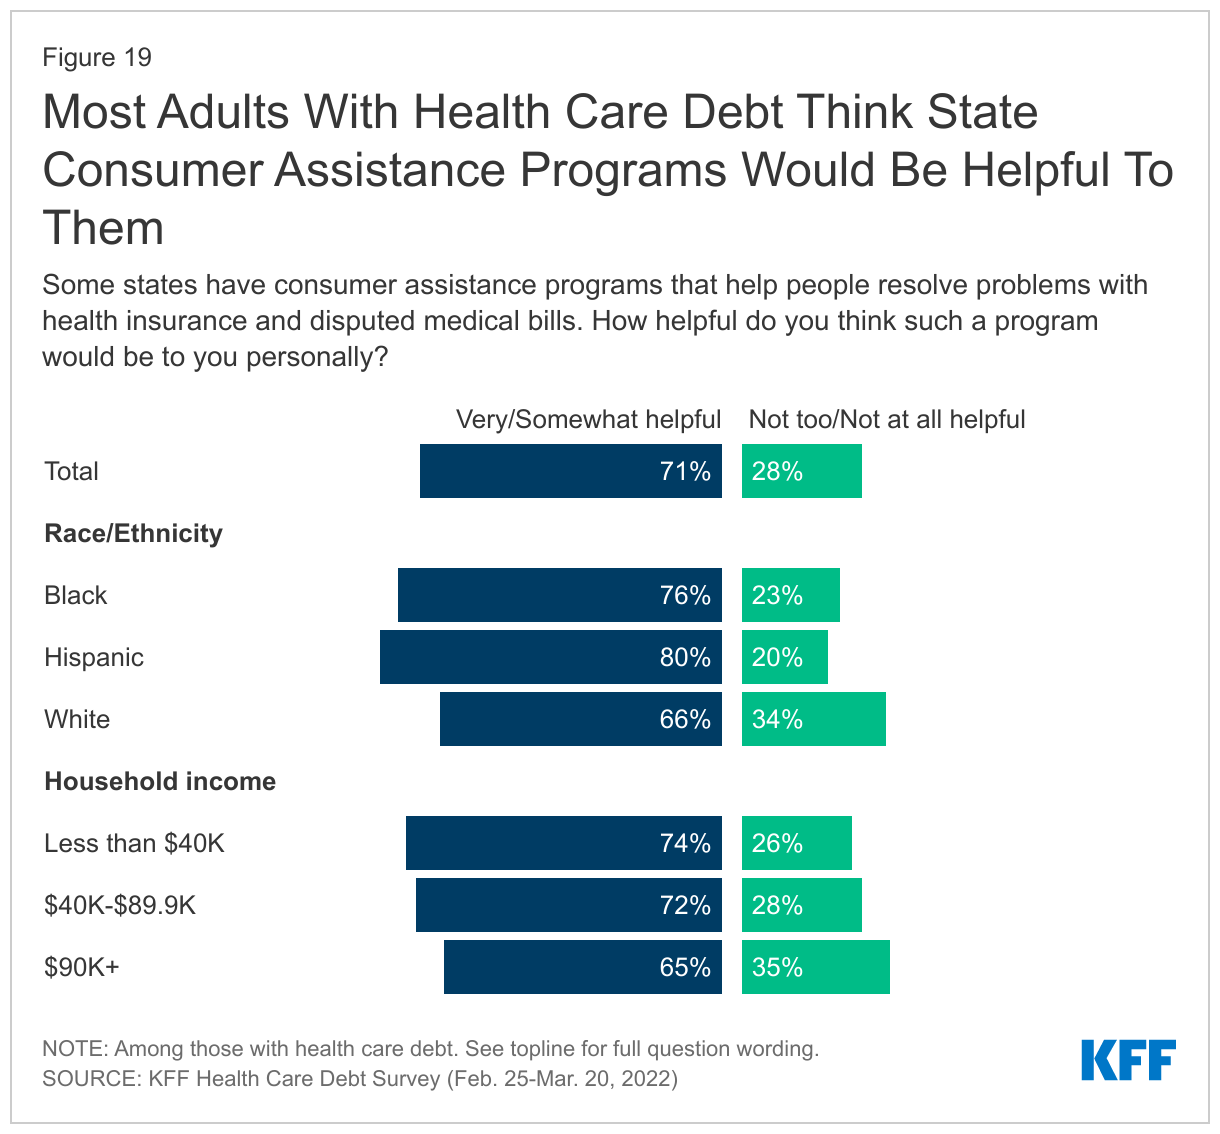
Consumer assistance programs have been established in many states to help individuals resolve issues with insurance providers and disputed medical bills, though no federal funding has been appropriated for these programs since 2010. With two-thirds of adults with health care debt reporting they have not paid a bill because they were expecting their insurance to pay it, it follows that many would welcome assistance in navigating disputes with insurance providers. Indeed, seven in ten adults with health care debt say they think a state consumer assistance program would be helpful to them personally. Black (76%) and Hispanic (80%) adults with debt are particularly likely to think these programs would be helpful to them compared to slightly fewer White adults (66%) who say the same. Moreover, majorities of adults with health care debt across income groups think consumer assistance programs would be helpful to them personally.

Most Adults With Health Care Debt Think State Consumer Assistance Programs Would Be Helpful To Them

Appendix

Appendix

Below are studies and analyses with measures and estimates of medical debt from recent years, including some which utilize a more narrow definition of medical debt.

StudyQuestion Wording / Analysis sourceFindingDates
KFF Health Care Debt SurveyPlease think about any money you currently owe or debt you have due to medical or dental bills. This may include bills for your own medical or dental care or someone else’s care, such as a child, spouse, or parent. Do you currently have:

a. Any medical or dental bills that are past due or that you are unable to pay

b. Any medical or dental bills you are paying off over time directly to a provider

c. Any debt you owe to a bank, collection agency, or other lender that includes debt or loans used to pay medical or dental bills

d. Any medical or dental bills you have put on a credit card, and you are paying off over time

e. Any debt you owe to a family member or friend for money you borrowed to pay medical or dental bills

41% of adults have health care debt due to medical or dental billsFebruary 25 – March 20, 2022
Peterson-KFF: The burden of medical debt in the United StatesAnalysis of the 2020 Survey of Income and Program Participation (SIPP)

Did ... have any medical bills he/she was unable to pay in full? Include bills for doctors, dentists, hospitals, therapists, medication, equipment, nursing home or home care. Include any bills of the respondent's children that have not already been reported.

23 million people (nearly 1 in 10 adults) owe significant medical debt ($250 of more). The SIPP survey suggests people in the United States owe at least $195 billion in medical debt.January– December, 2019
Consumer Financial Protection BureauAnalysis of consumer credit records$88 billion in medical debt on consumer credit recordsJune 2021
Commonwealth Fund Health Care Coverage and COVID-19 SurveyAdults who reported that over the prior 12 months they or a family member had problems paying medical bills, had been contacted by a collection agency about unpaid bills, had to change their way of life to pay their bills, or were paying off medical bills and debt over time.38% of adults reported problems paying bills, contact by collection, changing way of life or paying medical bills and debt over timeMarch 9 – June 8, 2021
U.S. Census Bureau, Survey of Income and Program Participation, 2020Did ... have any medical bills he/she was unable to pay in full? Include bills for doctors, dentists, hospitals, therapists, medication, equipment, nursing home or home care. Include any bills of the respondent's children that have not already been reported.17% reported medical bills they were unable to pay in fullJanuary-December, 2019
2019 Pew Research Center’s American Trends Panel – Wave 54Do you have any of the following types of loans or debt? Debt from medical bills29% yes, have debt from medical billsSep 16-29, 2019
2018 National Financial Capability StudyDo you currently have any unpaid bills from a health care or medical service provider (e.g., a hospital, a doctor’s office, or a testing lab) that are past due?23% reported past-due medical debtJune-October, 2018

Methodology

This KFF Health Care Debt Survey was designed and analyzed by public opinion researchers at the Kaiser Family Foundation (KFF) in collaboration with KHN journalists and editors. The survey was conducted February 25 through March 20, 2022 online and via telephone, in English and Spanish, among a nationally representative sample of 2,375 U.S. adults. The sample includes 1,674 adults with current or past health care debt and 698 adults who have not had health care debt in the past five years. The majority of respondents (n=2,146) were reached online through the SSRS Opinion Panel. The SSRS Opinion Panel is a nationally representative probability-based web panel recruited randomly in one of two ways: (a) Through invitations mailed to respondents randomly sampled from an Address-Based Sample (ABS). ABS respondents are randomly sampled through the U.S. Postal Service’s Computerized Delivery Sequence (CDS). (b) from a dual-frame random digit dial (RDD) sample, through the SSRS Omnibus survey platform. To ensure representation of respondents less likely to be reached online, 177 interviews were conducted from a random digit dial telephone sample of prepaid cell phone numbers. Both the RDD sample for the SSRS Omnibus and the prepaid cell phone numbers were obtained through Marketing System Groups (MSG).

The survey was designed to reach adults who currently have health care debt or have had health care debt in the last five years. In order to do this, the probability panel sample included an oversample of panel members with annual household incomes less than $30,000, individuals with current or past health care debt (n=641) were included in the sample. In addition, 52 adults with past or current health care debt were reached by calling back respondents that had previously completed an interview on the SSRS Omnibus poll (and other RDD polls) and reported an annual household income of less than $25,000.

The combined online and telephone samples, excluding oversamples, were weighted to match the sample’s demographics to the U.S. population using data from the Census Bureau’s 2021 Current Population Survey (CPS). On the basis of this weighted sample, parameters for the debt and no-debt populations were extracted. Weighting parameters for each group included sex, age, education, race/ethnicity, region, education, and income, as well as patterns of civic engagement from the September 2017 Volunteering and Civic Life Supplement data from the CPS. The sample was also weighted to match population density parameters from the Census Planning Database 2020. The weights take into account differences in the probability of selection for each sample type. This includes adjustment for the sample design and geographic stratification of the cell phone sample, within household probability of selection, and the design of the panel-recruitment procedure.

The margin of sampling error including the design effect for the full sample is plus or minus 3 percentage points. Numbers of respondents and margins of sampling error for key subgroups are shown in the table below. For results based on other subgroups, the margin of sampling error may be higher. Sample sizes and margins of sampling error for other subgroups are available by request. Sampling error is only one of many potential sources of error and there may be other unmeasured error in this or any other public opinion poll. Kaiser Family Foundation public opinion and survey research is a charter member of the Transparency Initiative of the American Association for Public Opinion Research.

GroupN (unweighted)M.O.S.E.
Total2,375± 3 percentage points
Health Care Debt Status
NET: Current or past health care debt1,674± 3 percentage points
Current health care debt1,292± 3 percentage points
Past health care debt382± 6 percentage points
No health care debt698± 5 percentage points

Endnotes

  1. Since adults with health care debt may carry that debt burden over a number of years, the survey asked adults to recall any health care debt they may have had in the past five years. Recall of health care debt was limited to a five-year time horizon as it may be difficult for people to accurately remember specifics about the type and origin of any debts incurred prior. ↩︎
News Release

Walgreens and Greater Than AIDS Partner with Health Departments and Community Organizations to Provide Free HIV Testing and Information in 250+ Cities on National HIV Testing Day (June 27)

Largest Coordinated HIV Testing Event in the Nation

Published: Jun 15, 2022

DEERFIELD, Ill. & SAN FRANCISCO, June 15, 2022 – Walgreens and Greater Than AIDS, a public information initiative of KFF (Kaiser Family Foundation), are teaming up with health departments and community organizations in more than 250 cities to host the largest coordinated National HIV Testing Day (NHTD) event in the nation. Click here for a list of participating Walgreens stores and hours to get a free HIV test on Monday, June 27.

“The last two years of COVID-19 saw declines in HIV testing, and many places are still not at the levels they were before,” said Tina Hoff, a senior vice president, KFF. “We are thrilled to support our community partners in getting out the word about the importance of routine HIV testing in both treatment and prevention and continue our partnership with Walgreens.”

According to the U.S. Centers for Disease Control and Prevention, about 13% of the estimated 1.2 million people in the U.S. living with HIV today are not aware of their status. Early diagnosis and treatment are vital to preserving health and preventing transmission.

Nearly 300 local health departments and community organizations will be at participating Walgreens stores to provide free, confidential and fast test results on-site, without the need to schedule an appointment. Counselors will be on hand to answer questions about HIV prevention and treatment options, including PrEP, a medication that offers another effective means to reduce the risk of getting HIV.

“HIV testing is recommended as part of routine health care, yet many Americans are not getting tested as often as advised. As a result, many people living with HIV are unaware of their status,” said Kevin Ban, MD, chief medical officer, Walgreens. “That’s why Walgreens and Greater Than AIDS, together with our community partners, are expanding free and confidential HIV testing—to help people know their HIV status and take control of their health.”

The Greater Than AIDS and Walgreens National HIV Community Partnership is an ongoing commitment to work with local health departments and community organizations to expand HIV testing and information through non-traditional settings. Since 2011, more than 72,000 free HIV tests have been provided as part of the annual event, including over 15,000 self-tests provided during the height of the COVID-19 pandemic to be administered at home.

Walgreens has supported people living with HIV/AIDS since the beginning of the epidemic more than 40 years ago. Walgreens invests in training of its pharmacy team members to address the specific challenges faced by people living with HIV, supports several local and national HIV organizations and continues to participate in ongoing research to help end the HIV epidemic.

Participating Walgreens stores and testing hours for this year’s NHTD activation are available here. Abbott, BioLytical Laboratories and OraSure Technologies, Inc. have provided community partners with donated HIV tests in support of the 2022 program.

About Walgreens

Walgreens (www.walgreens.com) is included in the United States segment of Walgreens Boots Alliance, Inc. (Nasdaq: WBA), an integrated healthcare, pharmacy and retail leader serving millions of customers and patients every day, with a 170-year heritage of caring for communities. As America’s most loved pharmacy, health and beauty company, Walgreens purpose is to champion the health and well-being of every community in America. Operating nearly 9,000 retail locations across America, Puerto Rico and the U.S. Virgin Islands, Walgreens is proud to be a neighborhood health destination serving approximately 9 million customers each day. Walgreens pharmacists play a critical role in the U.S. healthcare system by providing a wide range of pharmacy and healthcare services. To best meet the needs of customers and patients, Walgreens offers a true omnichannel experience, with fully integrated physical and digital platforms supported by the latest technology to deliver high-quality products and services in local communities nationwide.

About Greater Than AIDS

Greater Than AIDS is a leading national public information response from KFF focused on communities most affected. Through targeted media messages and community outreach, Greater Than AIDS and its partners work to increase knowledge, reduce stigma and promote actions to stem the spread of the disease.

About KFF

KFF (Kaiser Family Foundation) is a nonprofit organization focusing on national health issues, as well as the U.S. role in global health policy. KFF develops and runs its own policy analysis, polling, journalism and communications programs, sometimes in partnership with major news organizations. No affiliation with Kaiser Permanente.


[i] HIV.gov U.S. Statistics. Fast Facts. https://www.hiv.gov/hiv-basics/overview/data-and-trends/statistics. Last updated June 2, 2021. Accessed May 27, 2022.

Key Characteristics of Infants and Implications of the Recent Formula Shortage

Published: Jun 9, 2022

In recent weeks, the United States has been grappling with a baby formula shortage following supply chain issues, a voluntary recall, and the closing of a plant that produces a large share of the country’s formula. Data for the week ending May 28th show that the nationwide out-of-stock percentage for baby formula reached 74% among U.S. retailers. Since it is recommended that infants receive breast milk or formula until they are age one, this shortage has had a significant impact across the country. Infants in low-income families and infants of color, who are often covered by Medicaid, may be particularly impacted by the shortage resulting in potential short and long-term health risks. To better understand who may be particularly affected and at risk from the formula shortage, we analyzed data from the 2019 American Community Survey and data from the Centers for Disease Control and Prevention’s (CDC’s) National Immunization Survey for infants born in 2018 to describe the size and characteristics of the U.S. infant population as well as their use of formula.

Who does the formula shortage impact?

As of 2019, there were approximately 3.4 million infants under the age of one in the U.S..1  Almost half of children under the age of one are children of color, including more than a quarter who are Hispanic (25.4%), 13.1% who are Black, and 4.2% who are Asian (Figure 1). Smaller shares are American Indian or Alaska Native (AIAN) or Native Hawaiian or Other Pacific Islander (NHOPI) (<1% each). Nearly four in ten children under the age of one live in a family with income below 200% of the Federal Poverty Level (FPL), including 18.2% below poverty and 21.1% between 100-200% FPL (the FPL was $20,578 for a family of three in 2019). Over four in ten (42.0%) of all children under the age of one are covered by Medicaid/CHIP.

Distribution of Children Under Age 1 by Race/Ethnicity, 2019

More than half (54%) of infants born in 2018 received formula, either exclusively or as a supplement, by three months of life (Figure 2). The CDC reports that 46% of babies born in 2018 were exclusively breastfed through three months of age and 26% through six months. The CDC also reports that, among babies born in 2018, 19% of breastfed infants were supplemented with formula within two days of life.

Percent of Infants Born in 2018 Who Were Exclusively Breastfed by Age

Infants in low-income families, infants of color, and infants living in rural communities are more likely to use formula and therefore may be hardest hit by the formula shortage. Infants in lower income households are less likely than those in higher income households to report exclusive breastfeeding through the first three months of life (Figure 3). Similarly, data show that lower shares of Black and Hispanic infants are exclusively breastfed through their first three months of life compared to White infants (Figure 3). CDC data also show Black infants born in 2018 are less likely to be ever breastfed compared to Asian, White, and Hispanic infants. Infants living in rural areas are also less likely to be ever breastfed than those in urban areas. In addition to already being more likely to use formula, low-income families also may have less time and resources to search for and purchase in-stock formula, and those living in rural areas may have fewer retailers available in their proximity to access formula. Moreover, babies with complex health needs may require specific formula types, which may be more difficult to find.

Percent of Infants Born in 2018 Exclusively Breastfed Through 3 Months by Federal Poverty Level

Medicaid and CHIP cover many infants that are likely being hardest hit by the formula shortage. The majority of children under the age of one covered by Medicaid and CHIP are infants in low-income families and infants of color, who are more likely to be impacted by the formula shortage.2  Over one-third (34%) of all children who reported receiving formula during the first 12 months of their life were covered by Medicaid/CHIP only.3  Also, infants with Medicaid/CHIP as their sole source of coverage were more likely to report receiving formula for the first time before 6 months old compared to infants with private insurance only (Figure 4).

Share of Infants Who Were Less Than 6 Months Old When First Fed Formula by Health Insurance Coverage, 2020

Almost half of all formula in the U.S. is purchased by families enrolled in WIC. WIC is a nationwide program designed to support low-income women, infants, and children up to age five found to be at nutritional risk. State WIC programs provide infant formula to WIC participants and typically enter into rebate contracts with infant formula manufacturers, providing one brand of formula in exchange for a rebate. CDC data show infants enrolled in WIC are less likely to report ever being breastfed compared to those not receiving or ineligible for WIC. In addition, approximately three quarters of individuals eligible for the Special Supplemental Nutrition Program for WIC were also enrolled in Medicaid.

What are the implications of the formula shortage?

There may be health and economic consequences for infants and families who are not able to access enough formula. Baby formula provides vitamins and nutrients essential for a baby’s growth during an important period of child development. Without these nutrients, children can face significant short- and long-term health complications, including dehydration, slow growth, behavior problems, and developmental delays. Diluting formula or formula alternatives can also be dangerous for babies, slowing growth and possibly causing health issues including seizures. The data above suggest that low-income infants and infants of color may be at increased risk for facing these health risks, which may contribute to widening disparities in health for these groups. Infants with allergies or special health needs may also find it more difficult to find the specific formula they need, increasing their risk for health complications. Moreover, as the primary source of coverage for a majority of low-income children, Medicaid programs would be responsible for providing medical care to infants experiencing health complications. Further, the formula shortage comes at a time when inflation and prices for household goods and gas have risen, putting a strain on family budgets. There may be financial implications for families, with some WIC recipients reporting paying out of pocket to obtain the formula they need.

There are limited options for families navigating the formula shortage. The Department of Health and Human Services advises families to try different brands of formulas and to try formulas made in a different country. For infants relying on hypogenic or medical specialty formula, families are advised to talk to a pediatrician or other health care provider about substitutes, who may also be able to submit urgent product requests to Abbott Nutrition, which is releasing some specialty formulas on a case-by-case basis. As a major source of coverage for infants, Medicaid providers and health plans can be a source of trusted information to families about formula options and switching formula brands. State health agencies and WIC offices are also providing tips and information on how to access formula during this time.

A number of legislative actions have been taken to increase access to formula, especially for low-income families. While the formula plant that shutdown recently reopened, it will take weeks to bring the plant to full capacity and the shortage is expected to last until July. In the meantime, the Biden Administration has invoked the Defense Production Act (DPA) and is expediting the import of infant formula through Operation Fly Formula and addressing price gouging. President Biden also recently signed the Access to Baby Formula Act of 2022 into law, which waives certain WIC requirements during an emergency, and states are adopting flexibilities that expand the brands, sizes, and types of formula available to WIC recipients and allow for exchanges of formula purchased by WIC recipients. The House also passed a bill on May 18th that provides $28 million in emergency funding to the U.S. Food and Drug Administration (FDA) to provide resources to address the shortage and prevent future shortages. While these measures are expected to increase the availability of formula in the short-term, some are raising questions on the consolidation of the U.S baby formula market and how a shortage like this will be prevented in the future.

  1. KFF analysis of the 2019 American Community Survey. ↩︎
  2. KFF analysis of the 2019 American Community Survey. ↩︎
  3. KFF analysis of the 2020 National Survey of Children’s Health. Only children ages 0-5 were asked about formula feeding, and children less than 12 months were excluded from estimates. ↩︎
Poll Finding

KFF Health Tracking Poll: Views on and Knowledge about Abortion in Wake of Leaked Supreme Court Opinion

Published: Jun 9, 2022

Findings

For decades, KFF polling has provided insights into national and state-level reproductive health care policy including multiple public opinion polls examining the experiences and attitudes of the general public as well as the group most impacted by such policies – women between the ages of 18 and 49. This latest KFF poll was fielded the week following the leak of a draft of the U.S. Supreme Court opinion on Dobbs v. Jackson Women’s Health Center. If the final ruling in the case resembles the leaked draft, the Court would overturn Roe v. Wade and end the constitutional right to abortion. This analysis examines the public’s attitudes and understanding of the future of reproductive health and abortion access in the U.S. and looks at the role abortion and a decision on Dobbs may play in the upcoming midterm elections this November.

Key Findings:

  • Majorities of U.S. adults are aware of the leaked draft of the pending Supreme Court decision, and majorities across gender and partisanship say it is either “very likely” or “somewhat likely” the Supreme Court will be overturning Roe v. Wade this year. With this in mind, nearly two-thirds of adults do not want to see the decision overturned, and a large majority (74%) say abortion should be a personal choice and not something that is regulated by law.
  • Among those who live in the 17 states1  where abortion is certain or very likely to be banned if Roe v. Wade is overturned, majorities are aware that getting an abortion would be much harder in their state as a result of such a decision. However, partisans differ on whether this increased difficulty is a good or a bad thing, with Republicans more likely to say it would be a “good thing” that abortion would be harder to access in their state and Democrats more likely to view it as a “bad thing.”
  • Looking ahead to the role this decision could play in the anticipated Republican Wave in the midterm elections this November, most voters (57%) say a Supreme Court ruling overturning Roe v. Wade would not make a difference in their motivation to vote in the upcoming midterms and some (6%) say it would make them less motivated to vote. On the other hand, nearly four in ten voters (37%) say such a decision would make them more motivated to vote, including at least half of all Democratic voters (55%) and Democratic voters in states where abortion is likely or certain to be banned if Roe is overturned (51%). Majorities of Republican voters (73%) and Republican women voters (74%) say it would not make a difference in their motivation to vote.
  • While a Supreme Court ruling overturning Roe v. Wade doesn’t appear to motivate a majority of voters overall, there is a small share of voters (20%) who say they would be more motivated to vote and that they would only support a candidate who shares their view and wants to protect access to abortion. This includes nearly four in ten Democratic voters, Democratic women voters, and one-fourth of women voters ages 18-49. A smaller share of voters (4%) says they would be more motivated to vote by the Supreme Court decision, but in the opposite direction – to only support candidates who want to limit access to abortions.
  • There is an age divide among voters who prefer candidates who want to protect abortion access, that crosses partisanship and gender lines, with voters under age 50, regardless of party identification and gender, more likely to prefer such candidates compared to their older counterparts. For example, while fewer than four in ten male voters ages 50 and over (37%) say they prefer a candidate who wants to protect abortion access, this rises to a majority (56%) of male voters ages 18-49. Most voters who prefer a candidate who wants to protect access to abortion say they would not vote for a candidate who disagreed with them on this issue (63%), compared to half of those who prefer a candidate who wants to limit access to abortion.
  • If the Supreme Court overturns Roe v. Wade, states will set their own abortion policies without any federal constitutional standards. This poll finds there is some support for state restrictions on abortions, such as requiring women to wait 24 hours between a meeting with a health care provider and getting an abortion (67% support). However, majorities oppose other state laws, including at least three-fourths who oppose laws that would make it a crime for women to get an abortion (79%), allowing private citizens to sue people who provide or assist women in getting an abortion (80%), or making it a crime to cross state lines to obtain an abortion (80%).
  • This KFF poll also finds that there are significant knowledge gaps on the prevalence and the overall safety of abortions. Additionally, a majority of adults (73%) and of women between ages 18-49 (60%) have not heard of mifepristone or medication abortion, the method in which most abortions occur in the U.S.

The Supreme Court Draft Opinion Leak

On May 2, 2022, Politico published a leaked draft opinion of the U.S. Supreme Court on Dobbs v. Jackson Women’s Health Center that would overturn the precedent set by Roe v. Wade and Planned Parenthood v. Casey, eliminating federal protections to the right to an abortion. The Supreme Court acknowledged the authenticity of the draft but stated, “it does not represent a decision by the Court or the final position of any member on the issues in the case.” If the draft opinion is indicative of the final opinion to be released later this month, the constitutional right to an abortion established by the 1973 case would be overturned and it would be again up to individual states to decide whether to restrict or uphold a right to abortion services. Unlike other cases regarding abortion rights since Roe v. Wade, the Dobbs case comes at a time when the ideological composition of the Supreme Court is conservative by a strong majority 6-3, and the case’s plaintiffs, the state of Mississippi, have asked, the Court to outright overturn Roe v. Wade.

Awareness of the Leaked Supreme Court Opinion Draft

Majorities of the U.S. public, across gender and partisanship, say they have heard at least some about the draft opinion that was leaked to the press, including more than one-third (37%) who say they have heard “a lot” about it. Notably, the group most likely to be impacted by this decision – women of reproductive age (ages 18 to 49)2  – report hearing the least about the leak, with a quarter (23%) saying they have heard “a lot” and nearly half saying they’ve heard “little” (24%) or “none at all” (23%).

Majorities Of Adults Across Partisans And Gender Have Heard &quot;A Lot&quot; Or &quot;Some&quot; About The Leaked Supreme Court Draft Opinion On Dobbs

There is some confusion among the public about what the leaked draft of the Supreme Court opinion portends for the current and future state of abortion access in the country. The poll, conducted immediately following the leak of the draft opinion, finds that while about two-thirds (64%) are aware Roe v. Wade remains the law of the land, a small share (3%) incorrectly believe it has already been overturned and another third (33%) are unsure. Women are more likely than men to say it has already been overturned or that they are not sure (40% v. 33%). Nearly half of women ages 18-49 either say it has already been overturned (6%) or they are not sure (40%).

One-Third Of U.S. Adults Are Not Sure If Roe v. Wade Has Been Overturned By The Supreme Court, Few Say It Already Has

Two-thirds of adults say it is either “very likely” (22%) or “somewhat likely” (42%) that the Supreme Court will overturn Roe this year. While few (6%) women ages 18-49 incorrectly believe Roe v. Wade has already been overturned, most say that it is “very likely” (12%) or “somewhat likely” (45%) that Roe will be overturned. About one-third (35%) of women ages 18-49 do not think this is likely to happen this year.

Majorities Of Women And U.S. Adults Overall Say It Is  Likely The U.S. Supreme Court Will Overturn Roe v. Wade This Year

Supreme Court and Motivation in the Midterm Elections

If Roe v. Wade is overturned by the U.S. Supreme Court and the decision on abortion legislation is left to the states, the latest KFF polling finds a candidates’ positions on abortion could be a salient issue for a certain segment of Democratic-leaning voters but only motivates a small share of voters.

While a majority of voters (57%) say the Supreme Court overturning Roe v. Wade would not make a difference in their motivation to vote in the upcoming midterm and some (6%) say they would be less motivated, about four in ten voters (37%) say such a decision would make them more motivated to vote. As many election forecasters are projecting a Republican wave in the upcoming midterms, the poll finds the Supreme Court decision may motivate Democratic voters but fewer Republican or independent voters. More than half (55%) of Democratic voters say the Supreme Court decision will make them more motivated to vote. Majorities of Republican voters (73%), independent voters (62%), and Republican women voters (74%) say it would not make a difference to their motivation.

Majorities Of Voters Say A Decision From The Supreme Court Would Not Make Them More Motivated To Vote In The Midterms, Democrats Say It Would

A majority of voters who are motivated by the Supreme Court decision are pro-choice (75%), younger (55% under age 50), half are Democrats (51%), and about four in ten are liberal (38%). Similar shares of Black voters (40%), Hispanic voters (37%), and White voters (35%) report a Supreme Court decision overturning Roe would make them more motivated to vote. In addition, about one in five voters who say they would be motivated by the Supreme Court decision are Republican (18%), want a candidate who will limit access to abortions (19%), are conservative (21%) and independent (22%).

How Candidates’ Stance On Abortion May Impact Voters

If the Supreme Court overturns Roe v. Wade, between now and the midterm elections, one would expect the issue will become more salient in the midterms with increased attention in campaign advertisements and candidate talking points.3  The KFF Tracking Poll finds this salience may play an important role in persuading a small share of voters.

About half (52%) of voters overall say they are more likely to vote for a candidate in the upcoming election who wants to protect access to abortion, about one-quarter (27%) are more likely to vote for a candidate who will limit access to abortion, and one in five voters say a candidate’s position on abortion does not matter to their vote. Eight in ten (79%) Democratic voters say that they are more likely to vote for a candidate in the upcoming election who wants to protect access to abortion, 9% prefer a candidate who wants to limit access to abortion, and 11% say a candidate’s position on abortion would make no difference to their vote. At least half of Republicans say they want to vote for someone who wants to limit access to abortion (56%), 15% prefer a candidate who wants to protect access to abortion, and a sizeable three in ten (29%) Republican voters say it does not make a difference to their vote. Half (54%) of independent voters prefer a candidate who wants to protect access to abortion while half are split between preferring a candidate who wants to limit abortion (24%) or that it does not matter to their vote (22%).

Half Of Voters Say They Prefer A Candidate Who Wants To Protect Access To Abortion; One In Five Say It Does Not Make A Difference

Across key demographics, groups that typically lean more Democratic consistently report they want a candidate who will protect access to abortions. For example, more than half of Black voters (58%) and Hispanic voters (52%) say they are more likely to vote for such a candidate. In addition, younger voters are more likely than their older counterparts to say they want a candidate who will protect access to abortion, with six in ten (59%) voters ages 18-49 saying they are more likely to vote for a candidate who wants to protect access to abortion, compared to less than half (44%) of voters ages 50 and older.  This age divide on the issue of abortion is consistent with other studies and this poll finds the age divide exists across partisans and gender, with younger independents, Republicans and men being more likely than their older counterparts to say that they are more likely to vote for a candidate that wants to protect access to abortion.

Younger Partisans, Men, And Women Are More Likely To Prefer A Candidate Who Wants To Protect Access To Abortion In The Midterms

While the Supreme Court overturning Roe v. Wade doesn't appear to motivate a majority of voters overall, there is a small share of voters (20%) who say they would be more motivated to vote, and they would only support a candidate who shares their view, and they want candidates to protect access to abortion. This includes nearly four in ten Democratic voters, Democratic women voters, and one-fourth of women voters ages 18-49. A smaller share of voters (4%) say they are more motivated to vote by the Supreme Court decision, but in the opposite direction - to support candidates who want to limit access to abortions.

One In Five Voters Say Supreme Court Overturning Roe Makes Them More Motivated To Vote, And They Would Only Vote For A  Candidate Who Wants To Protect Access To Abortion

In Their OWn Words, Voters Say What About Overturning Roe Motivates Their Vote

When asked to say in their own words what it is about a Supreme Court decision overturning Roe that would make them more motivated to vote, about one-fourth cite a need to protect women’s rights to choose, rights to privacy and bodily autonomy (23%), about one in five mention wanting legislation to codify the right to an abortion or to vote for people who will protect abortion rights (18%), and 8% say that Roe v. Wade is the law and should not be overturned. About one in ten (9%) say they are motivated by wanting legislators who will ban abortions or support overturning Roe v. Wade. Five percent of voters who are motivated by Roe say that it is about having their voices heard and wanting legislators who represent their beliefs.

Voters Who Are Motivated To Vote By The Decision On Overturning Roe Cite Protecting Bodily Autonomy And Wanting To Vote For Pro-Choice Legislators

In Their Own Words: What specifically about the Supreme Court ruling that could overturn Roe v. Wade would make you more motivated to vote?

Among those who prefer a candidate who will protect access to abortion:

“I feel very strongly that everyone should have access to abortion, and I would be even more inclined to use my right to vote to help myself and others who think alike.” -21 year-old Democratic woman, Kentucky

“Voting in politicians who will protect abortion rights in their state if the federal government won't do it themselves.” -25 year-old Democratic woman, Florida “I'm actually not a person to jump out and vote but, on this issue, if my vote would make a difference then I will vote.” -37 year-old independent woman, California

“Protecting access to health care will make me even more likely to vote in the midterms.” -47 year-old independent man, Arizona

“I'm moderate not conservative. Every choice of a woman has different circumstances. I feel they should not all be subject to one blanket law. Democrats are more open minded about that.” -48 year-old Democratic woman, Missouri

In Their Own Words: What specifically about the Supreme Court ruling that could overturn Roe v. Wade would make you more motivated to vote?

Among those who want a candidate who will limit access to abortion:

"Vote for people in my state that would restrict abortion.” -79 year-old Republican woman, Missouri

“We need more moral minded leaders voted in.” -73 year-old Republican woman, Tennessee

“It would stop some of the murder of the pre-born.” -82 year-old Republican woman, Texas

“I would not want to see abortions done unless under certain circumstances.” -48 year-old Republican woman, Florida

“Murder shouldn’t be legal.” -46 year-old independent man, Minnesota

Public’s Opinion on Overturning Roe v. Wade, State Restrictions

KFF polling has consistently found that a majority of the public do not want to see Roe v. Wade overturned and the latest KFF poll is no different. About two-thirds (64%) U.S. adults say they do not want to see the Supreme Court overturn Roe v. Wade, while one-third of adults say they would like to see the case overturned. Majorities across gender and racial and ethnic groups say they don’t want to see it overturned, but there are differences by partisanship. Six in ten (61%) Republicans want to see the law overturned while a large majority of Democrats (85%) and six in ten independents (62%) do not want the Supreme Court to overturn Roe.

Majorities Of U.S. Adults Do Not Want To See The Supreme Court Overturn Its Decision On Roe v. Wade; Partisans Are Split

Once again, saliency lies on the side of those who want to protect abortion rights. While a large majority of Democrats (70%) say they feel “very strongly” that Roe v. Wade should not be overturned, Republicans are not as coalesced, with the about half as many Republicans (37%) feel “very strongly” that it should be overturned. A further one-quarter (24%) of Republicans feel “somewhat strongly” that Roe should be overturned, and a similar share (22%) feels “somewhat strongly” that it should not be overturned.

Seven In Ten Democrats Feel &quot;Very Strongly&quot; That Roe Should Not Be Overturned, Republicans Are More Split

The public has mixed feelings on the potential for the Supreme Court to overturn Roe v. Wade and allowing states to ban abortion, with about half of adults reporting that they would feel “sad” (53%) or “angry” (47%), and fewer saying they would feel “hopeful” (34%), “indifferent” (27%) or “enthusiastic” (22%) about this decision.

About Half Of Adults Say They Would Feel Sad If Roe v. Wade Was Overturned, Yet One-Third Also Say They Would Feel Hopeful

Partisans have very different emotional responses to the possibility of the Supreme Court overturning Roe v. Wade, with nearly three-fourths of Democrats reporting they would be “sad” (74%) or “angry” (72%), while more than half of Republicans saying they would feel “hopeful” (57%) and four in ten would be “enthusiastic” (41%).

While a majority of women report they would be “sad” (56%) or angry” (51%) if the Supreme Court overturned Roe, there are differences among women – and men – across age groups. Majorities of adults under age 50 – both men and women – say they would feel “sad” or “angry” if Roe were overturned while four in ten older men and women say they would feel “hopeful” if this occurred.

Majorities Of Younger Men, Women And Democrats Say Overturning Roe v. Wade Would Leave Them Feeling Angry, Sad

Most Say Abortion Should Be Personal Choice Rather Than Regulated, Some Support For Limited State Regulations

Despite divided views on the future of Roe v. Wade, the public is somewhat more aligned in believing that getting an abortion should be a personal choice rather than one regulated by the government. Three in four U.S. adults say generally, getting an abortion should be a personal choice (74%), while one in four say it should be something that is regulated by law. Large majorities of Democrats (90%) and independents (74%) say it should be a personal choice, while Republicans are split (52% saying it should be a personal choice and 48% say it should be regulated by law). Eight in ten (79%) women ages 18-49 say that getting an abortion should be a personal choice, including majorities across party; nine in ten (90%) Democratic women, eight in ten (80%) independent women and about six in ten (59%) Republican women ages 18-49 say this should be a personal choice.

Majorities Of U.S. Adults Across Partisans, Gender Say That Getting An Abortion Should Be A Personal Choice Rather Than Regulated By Law

Awareness Of State-Specific Abortion Legislation

Landscape of state-level abortion legislation in the U.S. if Roe v. Wade is overturned:

If Roe v. Wade is overturned, the availability and legality of abortion will vary from state to state, with many already preparing for the impending Supreme Court ruling and defining what a post-Roe world would look like in their states. Should the Court rule to overturn Roe v. Wade, abortion will likely become illegal immediately in 17 states that either already have laws that ban abortion that predate Roe v. Wade or have passed laws limiting abortion to the maximum extent permitted by federal law.4  Three states (GA, OH and SC) have 6 week bans that courts have temporarily blocked but could become effective soon after a decision overruling Roe v. Wade.

In contrast, 16 states and Washington, D.C., have explicit laws in place codifying the right to an abortion in their state. Many of these states have enacted new laws and are also considering bills  to expand funding and access to people who live in states where abortion will be banned or restricted, as well as legal protections for clinicians and patients who obtain abortions.5 

In the remaining states, the future of abortion access is less clear, and will likely depend on the political parties in office in the coming years.

Just over four in ten (45%) of those living in the 17 states with laws that would likely ban abortion immediately, known as trigger laws, or abortion bans still in place since before Roe v. Wade was decided in 1973, are aware that if Roe v. Wade is overturned, abortion will no longer be legal in their state, while four in ten (42%) are not sure, and 13% say it would continue to be legal. While a small majority (55%) of women ages 18-49 in these states are aware that abortion would immediately be banned in their state, nearly half are either not sure (33%) or incorrectly believe abortions would continue to be legal (12%).

Two-thirds (63%) of those living in states where the right to an abortion is explicitly protected are aware that abortion would continue to be legal if the case was overturned, while three in ten are unsure, and few (8%) think it would no longer be legal in their state.

Large Shares Of Adults In States With Trigger Bans Or Pre-Roe Abortion Bans Are Not Aware That Abortion Would Become Illegal In Their State If The Ruling Is Overturned

Populations Most Affected by Abortion Bans

If Roe v. Wade is overturned and many states across the country move to ban or restrict abortion access, people of color, lower-income people, and younger people would be disproportionately impacted by the laws largely due to the high cost of travel to neighboring states. The states seeking to ban abortions are concentrated heavily in the South, which has large shares of Black and Hispanic adults, the Plains which has a large Indigenous population, and the Midwest. Despite a few states passing legislation that would protect out-of-state residents seeking abortions in their state, many people in these populations would still be unable to travel to neighboring states to access abortion, forcing them to either seek abortion services outside of recognized clinical care, or carry their pregnancy to term.

Large majorities of adults who reside in states with trigger laws or pre-Roe abortion bans know that for various groups of women, getting an abortion will prove more difficult in their state if Roe is overturned. In the states where the right to an abortion will be most vulnerable, eight in ten say that a Supreme Court decision overturning Roe v. Wade will make it harder for young women (82%), lower-income women (78%), Black and Hispanic women (76%), and the women in their life (77%) to get an abortion in their state.

While there is widespread awareness of the impacts on certain populations, partisans differ on their assessment of whether this is a “good thing” or a “bad thing,” with larger shares of Republicans saying it is a “good thing” that it would be harder for each of these groups to get an abortion in their state and larger shares of Democrats viewing it as a “bad thing.” Notably, at least one in five Republicans say that it would be a “bad thing” that it would be more difficult for these groups to obtain an abortion.

Among women of reproductive age in these states, about six in ten believe overturning Roe v. Wade would make abortion harder to access in their state and that this is a “bad thing”, while between two and three in ten say making abortion harder to access would be a “good thing.”

In States With Trigger Laws Or Pre-Roe Abortion Bans, Majorities Know It Would Be Harder For Vulnerable Women To Access Abortions, Partisans Vary On Whether This Is A Good Or Bad Thing

State Legislation On Abortion

The Supreme Court’s 1992 decision for Planned Parenthood v. Casey established the right of states to regulate abortion services before viability as long as the regulation does not place an “undue burden” on women seeking an abortion. “Undue burden” is shorthand for a state regulation that has been found to have the purpose or effect of placing a substantial obstacle in the path of a person seeking an abortion. Since the Casey decision in 1992, many states have enacted a wide range of restrictions such as counseling, ultrasound and waiting period requirements; parental notification and consent requirements, restrictions on insurance coverage for abortion, and regulations specific to facilities and clinicians providing abortions. If the Supreme Court overrules Roe v. Wade, states will be able to enact abortion regulations without having to pass the “undue burden” standard and states could pass restrictions that could effectively block abortion access without actually passing a ban on abortion.

Among the public, there is some support for certain state-level restrictions on women seeking abortions, but majorities of the U.S. public oppose criminalizing women, doctors, or people who assist those seeking abortion care. Waiting periods are a common regulation on abortion and 27 states have enacted waiting periods ranging from 18 to 72 hours after contacting the clinic. Two-thirds of the public (67%) support laws requiring women to wait 24 hours between meeting with a health care provider and getting an abortion. Gestational limits are another type of law that states have enacted to limit how far into a pregnancy an abortion can be performed. Recently, several states have passed laws banning abortions after the time in which fetal cardiac activity can be detected, around 6 weeks of pregnancy (which is often before a person knows they are pregnant). While many of these laws have been blocked, this type of ban on all but the earliest abortions is currently in effect in Texas. Forty-four percent of adults support laws prohibiting abortions “once a fetal heartbeat is detected, which is usually around six weeks” (44%), while 54% are opposed to these types of laws. While this is unchanged from a 2019 KFF poll, that poll found that when the public was told that six weeks is usually before many women know they are pregnant, opposition to this policy increased to six in ten.

Large majorities oppose making it a crime for doctors to perform abortions (73%) or for women to get abortions (79%). With the impending Supreme Court decision on Roe, some states have passed restrictions to ban abortions using civil enforcement and penalties. Oklahoma and Texas have laws in effect that allow private citizens to sue people who provide or abet women in getting an illegal abortion. Some state legislators have considered making it a crime to travel across state lines to obtain an abortion, but such a law is not currently in effect in any state. KFF polling finds that eight in ten oppose each of these types of laws. It is also worth noting that several states have taken action to uphold the right or expand access to abortion and also protect doctors practicing in their states from criminal or civil liabilities for performing abortions in their state.

Interactive DataWrapper Embed

There is also majority opposition to many of these state policies on abortion among those who reside in states where there are trigger laws or pre-Roe abortion bans. At least two-thirds of people living in these 17 states oppose criminalizing doctors for performing abortions (69%), making it a crime for women to cross state lines to get an abortion (76%), making it a crime for a woman to get an abortion (74%), or allowing private citizens to sue people who provide or assist in abortions (78%).

Partisans differ in their level of support for these state-level abortion policies. A majority of Republicans support a 24-hour waiting period (90%) and prohibiting abortions once there is cardiac activity (70%). However, less than half of Republicans now support making it a crime for doctors to perform abortions that would result in fines or prison time (47%, down from 58% in 2019), making it a crime for women to get an abortion (36%, down from 49% in 2019), allowing private citizens to sue people who provide or assist women in getting abortions (32%) or making it a crime for a woman to cross state lines to get an abortion (35%). Independents are also less likely than they were in 2019 to support laws that would criminalize doctors (25%, down from 34% in 2019). About one in five independents continue to support criminalizing women seeking an abortion (19% v. 23% in 2019).

With the exception of the law that requires women to wait 24 hours between meeting a health care provider and getting an abortion, fewer than half of Democrats and independents support these laws.

Support For Laws Restricting Access To Abortion Services Divided Across Partisans

In states that have protected the right to an abortion, there is growing momentum to provide public funding to support their clinics to provide abortion care to out-of-state women who seek an abortion in their state. Among those who live in a state that has laws in place protecting the right to an abortion, majorities oppose (56%) using public funding to cover these costs. However, two-thirds (64%) would support a law that would require all employer provided health insurance plans to cover an abortion.

In States With Guaranteed Rights To Abortion, Majorities Support Employer Plans To Cover Abortion, Fewer Support Public Funding Going To Abortions For Out-Of-State Residents

If abortion is banned in many states across the country, the costs associated with obtaining an abortion will increase for those who are able to travel out of state to obtain abortion services. Some employers have begun offering to cover travel expenses for employees who need to travel out of state to obtain an abortion. Asked if they would support or oppose employers paying the travel costs for an employee to travel out-of-state to obtain an abortion if abortion is not available where they reside, a slim majority (51%) of U.S. adults say they would support this and 47% oppose. Seven in ten (72%) Democrats support this, and nearly eight in ten (78%) Republicans oppose. Independents are divided, with about half saying they support (53%) or oppose (44%) this workplace benefit. Younger adults across gender are more likely than their older counterparts to support this benefit.

Half

Gaps Remain in Public’s Knowledge About Abortion, Birth Control

This KFF poll examines what Americans know about abortion services and finds there are significant knowledge gaps on the prevalence and the overall safety of abortions.

How common are abortions? The number of abortions performed in the U.S. has been steadily decreasing over the last several decades, and reached a historic low in 2017, of 11.4 abortions per 1,000 women ages 15 to 44, although it increased slightly (by 2%) between 2017 and 2019. The decline in abortion rates is often attributed to greater affordability of contraception and increased use of highly effective long-acting reversible contraception such as IUDs and contraceptive implants. Still, using 2014 abortion rates, an estimated 1 in 4 reproductive-aged women (24%) will have had an abortion by age 45.

Does abortion cause breast cancer? No. The link between abortions and breast cancer has been refuted by The National Cancer Institute (NCI) and the American College of Obstetricians and Gynecologists (ACOG) but was used in misinformation campaigns from the 1970s until the early 2000s.

Does abortion cause infertility? No. A major study of the quality and safety of abortion by the National Academies of Science, Engineering, and Medicine found no association between abortion and secondary infertility. Only a minute fraction (0.23%) of legal abortions in a clinical setting in the U.S. have complications that could lead to infertility.

Is abortion safe? Yes. Abortion has fewer complications than many other common procedures, such as wisdom tooth removal (7%), tonsil removal (8-9%), appendix removal (13%), and childbirth (29%).

At what point in pregnancy do most abortions occur? The vast majority of abortions occur early in pregnancy; most (79%) occur at ≤9 weeks gestation, while almost all (93%) are performed at ≤13 weeks gestation (also referred to as the 1st trimester). Abortions later in pregnancy, at ≥21 weeks gestation, are rare, comprising only 1.2% of all abortions.

Two-thirds of U.S. adults (64%) say that they or someone they know has had an abortion, including at least six in ten Democrats, independents and Republicans, men, and women. Yet, about half of U.S. adults (49%) incorrectly say that less than 10% of women in the U.S. have had an abortion, when the actual share is closer to one-quarter. Men are more likely than women to underestimate the share of women who have had an abortion, with six in ten (56%) of men saying it is true that less than 10% of women have had an abortion.

A large majority of the public (87%) across partisan and age groups correctly says that it is false that a woman who has gotten an abortion has a higher risk of getting breast cancer. However, a small share (9%) of all adults, rising to 13% of Republicans, believe this to be true. Three quarters (72%) of U.S. adults correctly say that a woman who has gotten an abortion will not have a harder time getting pregnant again, while one-fourth (26%) say that this statement is true, rising to one-third of  Republicans.

Many also do not know at what point in pregnancy most abortions occur. Majorities (65%) incorrectly say most abortions occur after eight weeks of pregnancy, while one-third (32%) correctly say most occur fewer than eight weeks into pregnancy. Few, however, believe that most abortions occur more than 20 weeks into pregnancy (2%).

Few

How much does an abortion cost? Recent research finds that the median out-of-pocket cost of a first-trimester abortion is close to $600 for those who self-pay, not including costs that could be incurred to travel out of state or take time off from work.

Cost can be a barrier for women seeking abortion care, as many adults cannot afford the expense and not all health insurance plans cover abortion services. In fact, among women ages 18 to 49 who are insured, more than eight in ten (84%) say that they do not know if their insurance plan covers the cost of an abortion. Just 6% say that their insurance plan does cover the cost of an abortion, and one in ten say it does not. Most women of reproductive age do not know the cost of an abortion during the first trimester in the U.S. Just 14% correctly say that the cost out-of-pocket for a first-trimester abortion is between $500 and $700, while one-third (32%) are unsure of the cost, and many both over and underestimate the cost of this procedure.

Medication Abortion

While medication abortion now accounts for more than half of all abortions in the U.S., fewer than three in ten U.S. adults (27%) say they have heard of the medication abortion pill known as mifepristone, up slightly from 2019 (21%). Women ages 18-49 (40%) are twice as likely as women ages 50 and older (19%) and men (23%) to say they have heard of the medication abortion pill.

About

Of those who had heard of it, 63% (17% of total) correctly say that mifepristone can be effectively used to end a pregnancy up to the first 10 weeks. Few (12%) incorrectly say it is effective at any point during pregnancy. Six in ten of those who have heard of mifepristone (59%, 16% of total) know that a prescription is required to get medication abortion pills, while four in ten either incorrectly say it is available without a prescription (13%) or that they are unsure (28%).

Small Majorities Support requiring in-person appointments for Medication Abortion Prescriptions

Since the start of the COVID-19 pandemic, medical providers have been expanding their use of telehealth to consult with patients on issues that do not require in-person appointments. The expansion of telehealth has given some people access to health care when they otherwise would not be able to due to barriers to access, time, and distance required to travel to providers. The FDA no longer requires mifepristone to be dispensed in-person in a clinical setting, which has enabled people in many states to obtain the medications through the mail rather than having to go to a clinic or provider to receive the medication.

However, some states have explicitly banned the use of telehealth for abortion and others have instituted policies such as ultrasound requirements that necessitate the physical presence of the prescribing clinician, despite the FDA’s finding that the use of telehealth for medication abortion is safe.6  Among the 27% of U.S. adults who have heard of mifepristone, six in ten (16% of all adults) say they support the policy already in effect in 19 states that requires patients to have an in-person appointment to obtain a prescription for medication abortion pills, while 40% (11% of all adults) are opposed to such a requirement.

Some Confusion remains about difference between Emergency Contraceptive Pills and Medication Abortion

Some state lawmakers have discussed the possibility of placing additional restrictions or limits on the use of emergency contraceptive pills. Most U.S. adults (92%), have heard of emergency contraceptive pills, sometimes called the morning after pill or “Plan B,” similar to the share who had heard of it in 2019 and up from 85% in 2003, shortly after it was approved by the FDA. Yet some knowledge gaps remain when it comes to how the pills work. While most are aware that emergency contraceptive pills are not the same as the abortion pill (62%), and that some types are available over-the-counter without a doctor’s prescription (72%), a substantial share (73%) incorrectly think that emergency contraceptive pills can end a pregnancy in its early stages.

Majorities

Methodology

This KFF Health Tracking Poll was designed and analyzed by public opinion researchers at the Kaiser Family Foundation (KFF). The survey was conducted May 10-19, 2022, online and by telephone among a nationally representative sample of 1,537 U.S. adults. Interviews were conducted in English and in Spanish (n=95). The sample includes 1,285 adults reached through the SSRS Opinion Panel either online (n=1,246) or over the phone (n=39), with an oversample of women aged 18 to 49 (n=615). The SSRS Opinion Panel is a nationally representative probability-based panel where panel members are recruited randomly in one of two ways: (a) Through invitations mailed to respondents randomly sampled from an Address-Based Sample (ABS) provided by Marketing Systems Groups (MSG) through the U.S. Postal Service’s Computerized Delivery Sequence (CDS); (b) from a dual-frame random digit dial (RDD) sample provided by MSG. For the online panel component, invitations were sent to panel members by email followed by up to four reminder emails.

Another 252 interviews were conducted from a random digit dial telephone sample of prepaid cell phone numbers obtained through MSG. Phone numbers used for the prepaid cell phone component were randomly generated from a cell phone sampling frame with disproportionate stratification aimed at reaching Hispanic and non-Hispanic Black respondents. Stratification was based on incidence of the race/ethnicity groups within each frame.

The combined cell phone and panel samples were weighted to match the sample’s demographics to the national U.S. adult population using data from the Census Bureau’s 2021 Current Population Survey (CPS). Weighting parameters included sex, age, education, race/ethnicity, region, and education. The sample was also weighted to match patterns of civic engagement from the September 2017 Volunteering and Civic Life Supplement data from the CPS. The sample was also weighted to match frequency of internet use from the National Public Opinion Reference Survey (NPORS) for Pew Research Center.  The weights take into account differences in the probability of selection for each sample type (prepaid cell phone and panel). This includes adjustment for the sample design and geographic stratification of the cell phone sample, within household probability of selection, and the design of the panel-recruitment procedure.

The margin of sampling error including the design effect for the full sample is plus or minus 3 percentage points. Numbers of respondents and margins of sampling error for key subgroups are shown in the table below. For results based on other subgroups, the margin of sampling error may be higher. Sample sizes and margins of sampling error for other subgroups are available by request. Sampling error is only one of many potential sources of error and there may be other unmeasured error in this or any other public opinion poll. Kaiser Family Foundation public opinion and survey research is a charter member of the Transparency Initiative of the American Association for Public Opinion Research.

GroupN (unweighted)M.O.S.E.
Total1,537± 3 percentage points
Gender
Total women925± 4 percentage points
Women ages 18-49615± 5 percentage points
Total men594± 5 percentage points
Men ages 18-49291± 7 percentage points
Race/Ethnicity
White, non-Hispanic843± 4 percentage points
Black, non-Hispanic248± 8 percentage points
Hispanic306± 7 percentage points
Party identification
Democrats524± 5 percentage points
Republicans340± 6 percentage points
Independents391± 6 percentage points
Registered voters
Total voters1,227± 3 percentage points
Democratic voters459± 6 percentage points
Republican voters300± 7 percentage points
Independent voters316± 7 percentage points

Endnotes

  1. States that have enacted trigger bans or have a pre-Roe ban include: AL, AZ, AR, ID, KY, LA, MS, MO, ND, OK, SD, TN, TX, UT, WV, WI, WY. While Michigan has a pre-Roe abortion ban on its books, a Michigan judge recently blocked this law while litigation challenging the law as violating the Michigan State Constitution proceeds. ↩︎
  2. Data and research often assume cisgender identities and may not systematically account for people who are transgender and non-binary. This survey aims to be as inclusive as possible, allowing non-binary and transgender individuals to answer questions that best reflect their identity. ↩︎
  3. The Wesleyan Media Project finds that after the leak of the Supreme Court draft opinion, the number of U.S. House, Senate and gubernatorial ads mentioning abortion increased substantially, with 22% of pro-Democratic House ads and 24.5% of pro-Republican House ads mentioning abortion in the week following the opinion leak, up from 6.2% and 13.5% the week prior to the leak respectively. ↩︎
  4. States that have enacted trigger bans or have a pre-Roe ban include: AL, AZ, AR, ID, KY, LA, MS, MO, ND, OK, SD, TN, TX, UT, WV, WI, WY. While Michigan has a pre-Roe abortion ban on its books, a Michigan judge recently blocked this law while litigation challenging the law as violating the Michigan State Constitution proceeds. ↩︎
  5. States that have enacted protections for the right to an abortion: CA, CO, CT, DE, HI, IL, ME, MD, MA, NV, NJ, NY, OR, RI, VT, WA, DC. ↩︎
  6. Laws in AZ, AR, MO, LA, TX, and WV specifically ban telehealth for abortion consultations. ND, SD, NE, KS, OK, MS, AL, TN, KY, IN, NC, and SC “have enacted laws that require the clinician providing a medication abortion to be physically present during the procedure, effectively prohibiting the use of telehealth to dispense medication for abortion remotely.” All other states allow telehealth to be used for dispensing medication abortion in line with FDA regulations. See more from a KFF fact sheet on medication abortion here. ↩︎
News Release

Majority of Voters Say Overturning Roe Won’t Impact the Likelihood of Them Voting in Midterm Elections, But 1 in 5 of Voters and 1 in 4 Younger Women Voters Say it Will Motivate Them More And They Will Only Vote For A Pro-Choice Candidate

Published: Jun 9, 2022

Majorities Oppose State Laws Criminalizing Abortion, Even Those Living In States Where Abortion Will Become Illegal If Roe Is Overturned

Misconceptions Around Abortions Persist With Most Women of Reproductive Age Unaware Of Medication Abortion And Many Confusing It With Emergency Contraception

More than a third (37%) of voters say that they would be more motivated to vote in November’s Midterm Election if the Supreme Court overturns the Roe v. Wade decision establishing a constitutional right to an abortion, and this group is largely pro-choice and leans Democratic, finds a new KFF Health Tracking Poll focused on abortion issues.

Fielded after news broke about a leaked draft opinion in the pending Dobbs v. Jackson case that would overturn Roe, the findings suggest that a decision to overturn Roe could narrow a midterm voter enthusiasm gap, projected to favor the Republican party over the Democratic party. However, a majority of  voters (57%) say a ruling overturning Roe would not influence their motivation to vote in the midterms.

One in five of all voters (20%) say both that such a decision would make them more motivated to vote and that they would only vote for a candidate who wants to protect access to abortion. This group includes nearly four in ten Democratic voters (37%), Democratic women voters (38%), and a quarter of women voters under age 50 (25%).

Far fewer voters (4%) say they are both more motivated to vote by the Supreme Court decision and would only support candidates who want to limit access to abortions.

Nearly two thirds (64%) of the public overall say they do not want the Supreme Court to overturn Roe, while a third (33%) say they would like to see this happen. There are partisan differences, with most (61%) Republicans wanting to see Roe overturned, while a large majority of Democrats (85%) and most independents (62%) do not.

Partisan differences also exist on whether abortion should be a personal choice or regulated by law. Those who say it should be a personal choice include large majorities of Democrats (90%) and independents (74%), and about half (52%) of Republicans. Among women under age 50, eight in ten (79%) say that getting an abortion should be a personal choice, including a majority (59%) of younger Republican women. Overall, three quarters (74%) of the public say abortion should be a personal choice, while a quarter (25%) say it should be a matter of law.

Majorities Oppose States Criminalizing Abortion, Even in States with Existing Trigger Laws or Pre-Roe Abortion Bans

If Roe were overturned, states would set their own abortion policies without any federal constitutional standards, and 17 states already have laws in place that would effectively outlaw abortion in their state.

Less than half (45%) of those living in those 17 states are aware that abortion would become illegal in their states in Roe were overturned, with the rest either unsure (42%) or incorrectly believing abortion would continue to be legal (13%).

The survey finds that large majorities of the public, including those living in states with such trigger laws, oppose a variety of laws that would penalize abortion with either fines or prison time, including making it a crime:

  • For a woman to get an abortion (79% of the public opposes, including 74% of those in states with trigger laws).
  • For a woman to cross state lines to get an abortion (80% opposes, including 76% of those in states with trigger laws).
  • For a doctor to perform an abortion (73% oppose, including 69% of those in states with trigger laws).

Similar majorities (80% of the public, including 78% of those residing in states with trigger laws) say they oppose a law that would allow private citizens to sue people who provide or assist women in getting an abortion. (Texas and Oklahoma already have laws in effect that allow such lawsuits.)

In contrast,  two thirds (67%) of the public, support laws that require women to wait at least 24 hours after meeting with a health care provider and getting an abortion.

The public is more closely divided on laws that would prohibit abortions once cardiac activity (sometimes called a fetal heartbeat) is detected around six weeks, with a narrow majority (54%) opposing such laws and large minority (44%) favoring them.

Nationally, a slim majority (51%) of adults say they would favor employers covering expenses for an employee who has to travel out of state to obtain an abortion if one is not available where they reside, while nearly as many (47%) would oppose such a law.

In 16 states and the District of Columbia, there is a right to abortion codified in state laws. Nearly two thirds (64%) of residents in these states say they favor a law to require employer health plans to cover an abortion. A narrow majority (56%) oppose using public funds to cover the cost of abortion for people coming from out-of-state to get an abortion in their state.

Abortion Misconceptions Persist, With Most Unaware of Medication Abortion

The poll also finds that the public, including women under age 50, have significant knowledge gaps around abortion and emergency contraception.

Medication abortion using a pill called mifepristone now accounts for more than half of all abortions nationally, yet just of a quarter (27%) of adults overall and four in ten (40%) women under age 50 say they have heard of it.

In contrast, the vast majority (92%) of adults have heard of emergency contraceptive pills , sometimes called the morning-after pill or “Plan B.”  However, a majority (73%) incorrectly believe emergency contraceptive pills can end pregnancy in its early stages. In reality, emergency contraceptive pills cannot end an established pregnancy.

The survey was conducted from May 10-19, 2022 among a nationally representative sample of 1,537 adults including 615 women between the ages of 18 and 49. Interviews were conducted in English and Spanish online (1,246) and by telephone (291). The margin of sampling error is plus or minus 3 percentage points for the full sample and 5 percentage points from the sample of women, 18-49. For results based on subgroups, the margin of sampling error may be higher.

Ahead of the final decision on the pending Supreme Court case on abortion access, you can find related KFF resources.

How Many Are Not Up to Date with Vaccination in Counties with Elevated COVID-19 Community Levels?

Authors: Anna Rouw, Krutika Amin, Cynthia Cox, and Jennifer Kates
Published: Jun 8, 2022

NOTE: A more recent version of this analysis is available here.

With the recent Omicron wave causing increased cases and hospitalizations, the Centers for Disease Control and Prevention (CDC) has warned that more than a half of the U.S. population lives in a county with a medium to high COVID-19 community level – that is, with relatively high numbers of new COVID-19 cases per 100,000, new COVID-19 hospital admissions, and strains on hospital capacity due to COVID-19. In addition to recommending vaccination and boosters for everyone age 5 or older, CDC also recommends wearing masks in public indoor settings in counties with high COVID-19 community levels; in medium-level counties, CDC says masking should be considered based on personal risk.

An individual’s vulnerability to the virus that causes COVID-19 may depend on a number of factors including, but not limited to, their vaccination status, history of prior infection, age, health status, and amount of exposure. CDC data indicate the risk of hospitalization or death due to COVID-19 is significantly higher among those who are unvaccinated compared to those vaccinated with at least a primary series and especially compared to those who also received a booster dose.

We sought to better understand how many people might be particularly vulnerable in the current context because they are either unvaccinated, including those who are not yet eligible for vaccination (children under 5 years old), or not up to date on vaccines and live in counties with elevated (“medium” or “high”) COVID-19 community levels in the U.S.—areas where the CDC recommends masking in at least some circumstances. We define being “up to date” on vaccines as having received a primary series and at least one booster dose. Although CDC now recommends second booster shots for people ages 50 and over or those who are immunocompromised, there are currently no county-level data available on the number of booster doses people have received. We used CDC’s COVID-19 community levels and vaccination data by county as of June 2, 2022 (see Methods for more detail).

Findings

  • There are 120 million people living in counties with elevated COVID-19 community levels who are not up to date on their COVID-19 vaccines. These include those who are unvaccinated, partially vaccinated, and those who are vaccinated but not yet boosted, putting them at higher risk of severe illness and death. Together, they represent about half of all those in the U.S. who are not up to date on vaccines.
100 Million People Who Are Not Up To Date On COVID-19 Vaccines And Live In Counties With Elevated COVID-19 Community Levels
  • Of these, 36 million people in these counties are unvaccinated including 14 million living in counties with high COVID-19 community levels. In total, we estimate that 41% of unvaccinated people (those who did not receive any COVID-19 vaccine doses) in the U.S. live in a county with medium or high COVID-19 community levels.
  • There are another 20 million people in these counties who are partially vaccinated including 8 million living in counties with high COVID-19 community levels. In total, we estimate that 61% of all partially vaccinated people (those who received at least one COVID-19 vaccine dose but did not complete the primary series) in the U.S. live in a county with medium or high COVID-19 community levels.
  • Additionally, there are 64 million people who are vaccinated but not yet boosted and live in counties with elevated community levels, including 25 million who live in high-level counties. In total, we estimate 58% of people in the U.S. who are vaccinated with a primary series but remain un-boosted live in medium or high COVID-19 community level counties.
Share Of State Population Not Up To Date With COVID-19 Vaccines

Implications

CDC recommends that all people mask indoors in areas that have high COVID-19 community levels, and that people living in medium-level counties mask based on their personal risk. People who live in these areas who are not up to date on vaccines are among those who are particularly vulnerable during a surge. This is especially the case for the 14 million people who are unvaccinated and live in high COVID-19 community level counties; for these individuals, their risk of hospitalization and death from COVID-19 is significantly higher than if they were vaccinated. In addition, people who received their primary COVID-19 vaccine series but have not yet received a booster also face greater risks than those who have been boosted, since immunity can wane over time and new viral variants and subvariants make breakthrough infections more likely. Although we do not include them in this total, there are others who are at risk even if they have received a booster shot, for example those who are immune compromised or who are recommended to receive a second booster but have not yet done so. Finally, even individuals who live in counties deemed to be at low COVID-19 community levels, particularly those who have an underlying health condition or are older, may face risk and even serious health outcomes if they were to get COVID, especially if they remain unvaccinated or unboosted. As such, masking would offer significant protection to them as well.

These data underscore the significant vulnerability to COVID-19 illness that still exists at this time, more than a year since vaccines became widely available in the U.S. to most people. As such, they point to the importance of employing other public health measures, such as masking and testing, in addition to vaccination, in many parts of the country.

Methods

COVID-19 Community Level: COVID-19 community level data were sourced from the Centers for Disease Control and Prevention (CDC) “United States COVID-19 Community Levels by County,” using data released on June 2, 2022. Counties lacking a COVID-19 community level were excluded.

COVID-19 Vaccinations: County-level data on COVID-19 vaccinations were sourced from the CDC “COVID-19 Vaccinations in the United States, County” using data reported as June 2, 2022. Only data from the 50 states and District of Columbia were included (data from territories were excluded as territories are not included in the COVID-19 community level dataset). Counties lacking any vaccination data were also excluded from this analysis. In some cases, the residence county is unknown, and therefore these vaccination data cannot be attributed to a specific county. However, for states where only one COVID-19 community level was possible as of June 2, 2022, namely, Arkansas (Low), Delaware (High), the District of Columbia (Medium), and Rhode Island (Medium), vaccination data with unknown county information but attributed to these states were coded as the corresponding COVID-19 community level. Other vaccination data without county information and not attributed to these states were excluded from the analysis. For this reason, we are potentially overestimating the number of people not up to date on vaccination. We define up to date on COVID-19 vaccination as people who have completed a primary series and received a booster. We calculate the number not up to date on COVID-19 vaccination as population in each county minus people who received primary series and booster. We calculate the number of unvaccinated people as the difference between the county population and the number of people who have received at least a first dose of a COVID-19 vaccine. In few counties where the population estimate exceeds the number of people who have received a first dose of the COVID-19 vaccine, the number of unvaccinated individuals is assumed to be 0. We calculate people who are partially vaccinated as the number of people who completed primary series minus those who received at least one dose. We calculate the number of people that have completed a primary series but not received a booster as the difference between the number of people who have completed a primary series and the number of people who have received a booster dose. Although the CDC now recommends that all immunocompromised individuals and people over the age of 50 receive a second booster dose, there are currently no county-level data available on the number of booster doses received. Therefore, we are unable to capture how many individuals are fully up to date on COVID-19 vaccines. (An earlier version of this analysis stated there were 100 million people who were not up-to-date on vaccines in counties with elevated risk. We have updated this analysis to include 20 million partially vaccinated people for a total of 120 million people.)

Demographics and Health Insurance Coverage of Nonelderly Adults With Mental Illness and Substance Use Disorders in 2020

Published: Jun 6, 2022

The pandemic has worsened underlying mental illness and substance use disorders, particularly for some subgroups, and challenges accessing treatment may have increased. In this issue brief, we use 2020 data from the National Survey on Drug Use and Health (NSDUH) to examine key characteristics, coverage and health status of nonelderly adults with mental illness or substance use disorders to help inform ongoing federal and state efforts to improve quality and expand access.

This analysis relies on the NSDUH definitions of mild, moderate, or serious mental illness using DSM-IV criteria. Those with serious mental illness (SMI) often have difficulties with daily living activities, comorbid conditions like substance use disorders and physical conditions, and in general, people with mental illness die earlier than those without. NSDUH uses DSM-V diagnostic criteria to assess the presence of substance use disorders. These disorders are categorized into mild, moderate, and severe groups depending on symptom severity. In addition to legal substances such as alcohol and sometimes marijuana, substance use disorders can also involve illicit substances such as opioids and cocaine. Due to the pandemic, NSDUH data is limited to the first and fourth quarter of 2020, with survey data collection shifting from in-person interviews to web-based surveys, so data cannot be compared to other years. Small sample sizes prevent subgroup analyses among the uninsured population.

Key findings include the following:

  • Mental illness and substance use disorders affects one-third (64.5 million) of all nonelderly adults in 2020 and are most prevalent among young adults and White people. Other data and research point to worsening mental health for young adults and people of color during the pandemic. The lower rates among people of color may reflect underdiagnosis among these groups. Data show that women have higher rates of mental illness, while men have higher rates of substance use disorder.
  • Most nonelderly adults with mental illness or substance use disorder are covered by private insurance (58%), but Medicaid enrollees are more likely to experience those conditions. Medicaid enrollees also have the highest overall prevalence of moderate to severe mental illness or substance use disorders.
  • Among nonelderly adults with a moderate to severe mental illness or substance use disorder, Medicaid enrollees are more likely than those with private insurance to have chronic health conditions and to report fair or poor health.

What is the prevalence of mental illness and substance use disorders and what are the characteristics of people with these conditions?  

One-third (33%) of all nonelderly adults have a mental illness or substance use disorder.  Mental illness affects 23% (45.3 million) of nonelderly adults, with 11% having mild conditions, 6% moderate, and 6% severe conditions. Approximately 18% (34.7 million) of nonelderly adults experience some form of substance use disorder, with milder disorders (10%) accounting for the majority. People with severe mental illness and substance use disorders often have complex health needs including multiple comorbidities, more difficulties with daily living, and a higher likelihood of premature death. An estimated 8% (15.5 million) have both and a mental illness and a substance use disorder and combined, 33% (64.5 million) of nonelderly adults have a mild, moderate, or severe mental illness or substance use disorder (Figure 1).

Share of Nonelderly Adults with Mental Illness or Substance Use Disorder in 2020

Mental illness or substance use disorder is most common in young adults and nonelderly White people. Mental illness is most common in young adults aged 18 to 25 (30%) and lowest in adults 50 to 64 (17%). Among young adults aged 18 to 25, the rate of substance use disorders is 24%, twice as high as that of adults aged 50 to 64 (12%). More than one-quarter (26%) of White people experience mental illness; this is the highest rate of any race or ethnicity. White people are more likely to report substance use disorders (19%) compared to Hispanic people (14%) and Black people (16%). These findings for higher rates hold true for mild, moderate and severe mental illness and substance use disorder and for concurrent mental illness and substance use disorder (Figure 2). Other data and research point to worsening mental health for young adults and people of color during the pandemic. A lack of culturally sensitive screening tools that accurately detect mental illness, coupled with structural barriers, may lead to underdiagnosis of  mental illness among people of color.

Women have higher rates of mental illness, while men have higher rates of substance use disorder. Compared to men, women are more likely to experience mental illness (29% versus 17%). However, in contrast to mental illness, substance use disorders are more common in males than females (20% versus 15%) (Figure 2).

Prevalence of Mental Illness and Substance Use Disorder in Nonelderly Adults by Demographic Characteristics

How are nonelderly adults with mental illness and substance use disorders covered and how does prevalence vary by coverage?  

Private insurance covers most nonelderly adults with mental illnesses and substance use disorders. Private insurance covers the majority of nonelderly adults with any mental illness (58%) and any substance use disorder (57%); combined, this represents over 37 million people with either condition covered by private insurance. Despite only covering 18% of the nonelderly adult population, Medicaid covers 23% of those with any mental illness and 21% of those with any substance use disorder, or an estimated 13.9 million people (Figure 3).

Distribution of Mental Illness and Substance Use Disorder in Nonelderly Adults, by Coverage Type

Mental illness and substance use disorders are most prevalent among nonelderly adults with Medicaid. As of 2020, an estimated 29% of Medicaid enrollees have a mental illness, relative to 21% of privately insured and 20% of uninsured people. About one in five (21%) Medicaid beneficiaries have a substance use disorder, similar to uninsured people (19%), but higher than privately insured people (16%). Further, Medicaid enrollees have the highest overall prevalence of moderate to severe mental illness or substance use disorders. Combined, 39% of Medicaid enrollees have a mental illness and/or substance use disorder, relative to 31% of privately covered and uninsured people. An estimated 11% of adults with Medicaid have both and a mental illness and a substance use disorder, relative to 7% of privately covered and 8% of uninsured people (Figure 4).

Share of Nonelderly Adults with Mental Illness or Substance Use Disorders in 2020, by Coverage Type

Among nonelderly adults with a moderate or severe mental illness or substance use disorder, Medicaid enrollees are more likely than those with private insurance to have chronic health conditions and to report fair or poor health. There is a high comorbidity between mental conditions and chronic physical conditions, which increases with severity of symptoms. The relationship is bidirectional, with physical conditions sometimes increasing the risk for mental conditions, and vice versa. Medicaid enrollees with moderate to severe mental illness or substance use disorders are more likely to report chronic conditions than those with private coverage, and a higher share reports two or more chronic conditions. Further, Medicaid enrollees with severe/moderate mental illness or substance use disorders report fair to poor health over twice as often as privately insured (36% and 13%, respectively) (Figure 5).

Health Status of Nonelderly Adults with Moderate or Severe Mental Illness or Substance Use Disorder in 2020

What are key issues to watch looking ahead?

As policy makers attempt to structure policy responses to address mental health and substance disorder needs, it is important to understand the coverage and characteristics of people experiencing these issues.  At the state level, states are implementing an array of policies to address mental illness and substance use disorders including policies to expand access through Medicaid. States will also be largely responsible for implementing the new ‘988’ hotline, including how to sustainably fund it. At the federal level, bipartisan efforts have formed to address the mental health crisis, including mental health packages and a legislative agenda from the Addiction and Mental Health Task Force, as well as federal monitoring of insurer mental health parity violations. The Biden administration announced its National Drug Control Strategy to combat addiction and the opioid epidemic and the Unity Agenda proposes improving behavioral health workforce capacity, improving access to care in integrated settings, and expanding insurer coverage requirements. Gaps in the delivery of behavioral health care are longstanding and complex, but emerging initiatives seek to improve access to and quality of services.

News Release

Community Health Centers Have Experienced Increased Demand for Social Services During the Pandemic and Have Added Capacity for Mental Health

Published: Jun 3, 2022

Community health centers have seen a rise in patients seeking non-medical services such as housing, food, nutrition, and transportation during the pandemic and have added new mental health and substance use disorder (SUD) services in response to growing need, according to a new KFF survey.

Over half of the health centers that responded to the survey said that, amid the economic disruption of the pandemic, more patients are seeking social and supportive services that complement primary care. A majority of centers reported providing on-site health literacy (71%) and transportation services (63%), while at least 4 in 10 report providing SNAP, WIC, or other nutritional services (44%) and healthy food options, such as an on-site food pantry or meal delivery (42%).

Nearly two-thirds of health centers said they added new in-person or virtual mental health services, including individual and group therapy services. And roughly half of health centers (48%) saw an increase in patients with opioid use disorder during the pandemic, with a rising share of health centers providing medication-assisted treatment services. These services were added at a time when health centers were also rolling out vaccination campaigns and other pandemic-related services in underserved communities.

The survey of community health centers, conducted in late 2021, probed the pandemic’s effect on services, the challenges health centers face and their preparedness for the unwinding of the public health emergency declaration.

Other key survey findings include:

  • While health centers ramped up telehealth services during the pandemic, nearly all cited patients’ lack of internet access (97%) and lack of comfort using telehealth technology (93%) as major or minor challenges.
  • Eighty-five percent of responding health centers cited staffing shortages as a challenge in providing social and supportive services. The vast majority also cited staffing issues as a barrier to providing mental health and substance use disorder services.
  • Eighty-one percent of responding health centers reported that it was very or somewhat difficult to schedule a specialist appointment for uninsured patients. Sixty-three percent reported difficulties scheduling such appointments for Medicaid fee-for-service patients, and 58 percent reported difficulties for Medicaid managed care patients.

In a separate policy watch, KFF analysts explain what steps community health centers are taking to prepare for the end of the federal public health emergency, during which states have been required to provide continuous coverage for Medicaid enrollees in order to receive enhanced federal funding during the pandemic. As of late 2021, roughly two-thirds of health centers were planning or taking actions to help their patients retain coverage, including reaching out to patients directly, increasing staff time on enrollment activities, and coordinating with legal services organizations.

Community Health Centers Are Taking Actions to Prepare for the Unwinding of the Public Health Emergency

Authors: Jennifer Tolbert, Lina Stolyar, and Bradley Corallo
Published: Jun 3, 2022

Community health centers, a national network of safety-net primary care providers serving low-income, medically underserved communities, also assist their patients and low-income community members with applying for and enrolling in health coverage, including Medicaid, the Children’s Health Insurance Program (CHIP), and Marketplace plans. Given this dual role, health centers are poised to be on the front lines of the unwinding of the Medicaid continuous enrollment requirement when the public health emergency (PHE) ends.

Provisions in the Families First Coronavirus Response Act (FFCRA) require states to provide continuous coverage for Medicaid enrollees until the end of the month in which the PHE ends in order to receive enhanced federal funding. The current PHE runs through July 15, 2022; however, it is expected to be extended for at least another three months. The Biden Administration has said that it will give states a 60-day notice before the PHE expires. When the PHE ends, states will begin processing redeterminations, and recent estimates indicate that between 5.3 million and 14.2 million Medicaid enrollees could lose coverage if they are no longer eligible or face administrative barriers despite remaining eligible.

Nearly half of health center patients are covered by Medicaid, meaning large coverage losses could have significant effects for health centers and their patients. Throughout the pandemic, health centers have provided a broad range of services to their Medicaid and other patients, including COVID-19 testing, treatment and vaccinations, mental health and opioid use disorder services, as well as social and supportive services. In 2020, health centers served over 13 million Medicaid patients who comprised 46% of total health center patients that year. The number and share of Medicaid patients served by health centers have likely increased since then as total Medicaid enrollment has continued to grow over the past year. As such, health centers have the ability to reach about one in six Medicaid enrollees through their patients alone and can reach even more by providing outreach and assistance to community members who are not patients.

With funding for enrollment activities included in their federal grants, health centers are able to employ staff and provide outreach and enrollment assistance throughout the year. In 2020, health centers employed over 4,200 enrollment assisters and provided over 3.5 million assists to individuals seeking help in applying for or renewing coverage. Those numbers are down slightly from 2019 when health centers employed over 4,400 enrollment assistance staff and provided about five million assists. Both staffing and enrollment assistance visits will likely need to increase in the coming year If health centers hope to meet expected demand for assistance.

Anticipating the end of the PHE, health centers are taking steps to prepare, including by contacting patients and bolstering enrollment staff. According to findings from a survey of health centers conducted in late 2021, roughly two-thirds (66%) of health centers were planning or taking actions to help their patients retain coverage when the PHE expires (Figure 1). Overall, just under half of health centers had already begun reaching out or planned to reach out to patients to assist them with renewing coverage:

  • 47% said they would schedule or were planning to schedule advance appointments to assist patients with coverage renewals;
  • 47% planned to send reminders to patients regarding the need to renew coverage; and
  • 46% said they would identify all patients at risk of losing coverage and flag their charts for reminders.

Health centers also reported plans to boost enrollment assistance staff capacity:

  • 43% planned to increase staff time on enrollment activities (23% said they were already increasing staff time) and
  • 41% had hired or planned to hire new staff.
Share of Health Centers Taking or Planning Select Actions in Preparation for the Unwinding of Continuous Enrollment Requirement

Health centers can be effective in raising awareness about Medicaid renewal requirements and in providing the help needed for enrollees to maintain Medicaid or transition to other coverage. The Centers for Medicare and Medicaid Services (CMS) encourages states to reach out to key stakeholders as they develop their plans for resuming normal operations. As of late 2021, about one in five health centers said they had received information from their state or primary care association regarding their state’s plan. That number is expected to increase as states finalize their plans and once there is greater clarity on when the PHE will end. Until then, health centers appear to be moving forward with their own plans for providing outreach and assistance to underserved and medically vulnerable Medicaid enrollees.