Headed Back to School: A Look at the Ongoing Effects of COVID-19 on Children’s Health and Well-Being

Authors: Elizabeth Williams and Patrick Drake
Published: Aug 5, 2022

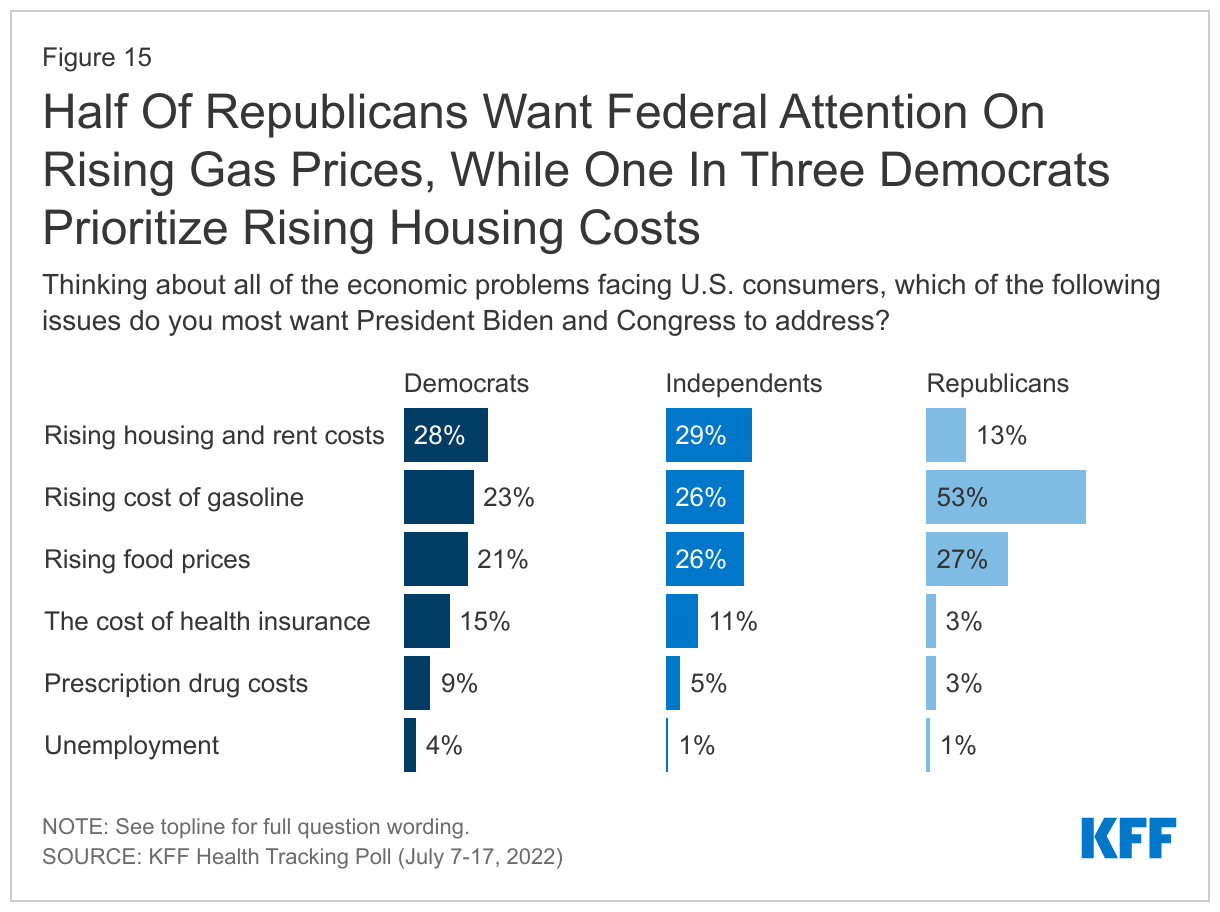
Children are now preparing to head back to school for the third time since the onset of the COVID-19 pandemic. Schools are expected to return in-person this fall, with most experts now agreeing the benefits of in-person learning outweigh the risks of contracting COVID-19 for children. Though children are less likely than adults to develop severe illness, the risk of contracting COVID-19 remains, with some children developing symptoms of long COVID following diagnosis. COVID-19 vaccines provide protection, and all children older than 6 months are now eligible to be vaccinated. However, vaccination rates have stalled and remain low for younger children. At this time, only a few states have vaccine mandates for school staff or students, and no states have school mask mandates, though practices can vary by school district. Emerging COVID-19 variants, like the Omicron subvariant BA.5 that has recently caused a surge in cases, may pose new risks to children and create challenges for the back-to-school season.

Children may also continue to face challenges due to the ongoing health, economic, and social consequences of the pandemic. Children have been uniquely impacted by the pandemic, having experienced this crisis during important periods of physical, social, and emotional development, with some experiencing the loss of loved ones. While many children have gained health coverage due to federal policies passed during the pandemic, public health measures to reduce the spread of the disease also led to disruptions or changes in service utilization and increased mental health challenges for children.

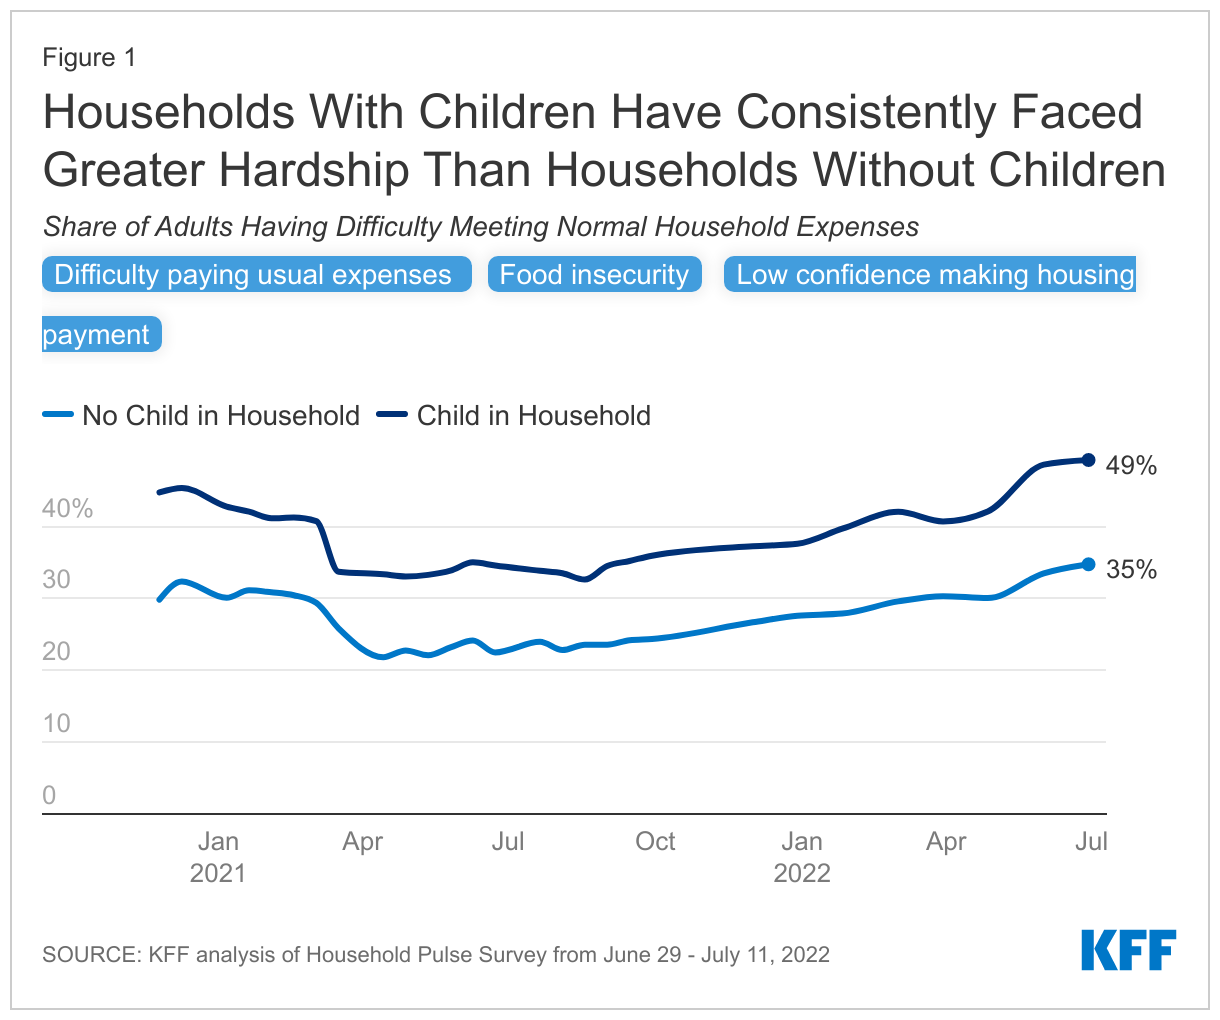
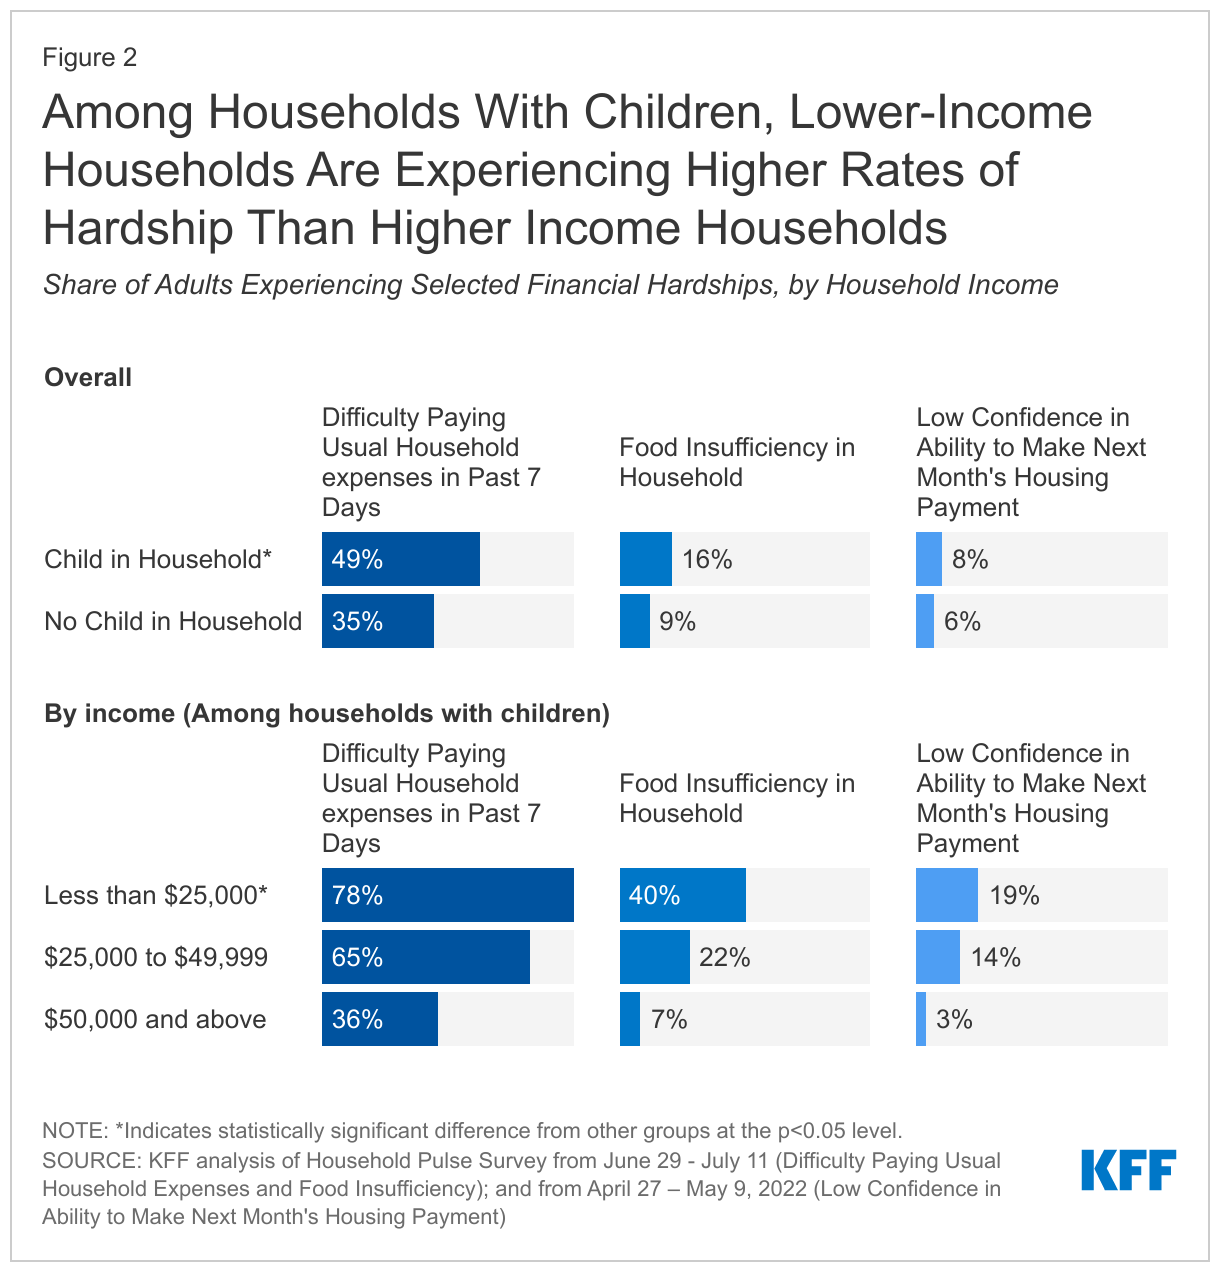
This brief examines how the COVID-19 pandemic continues to affect children’s physical and mental health, considers what the findings mean for the upcoming back-to-school season, and explores recent policy responses. A companion KFF brief explores economic effects of the pandemic and recent rising costs on households with children. We find households with children have been particularly hard hit by loss of income and food and housing insecurity, which all affect children’s health and well-being.

Children’s Health Care Coverage and Utilization

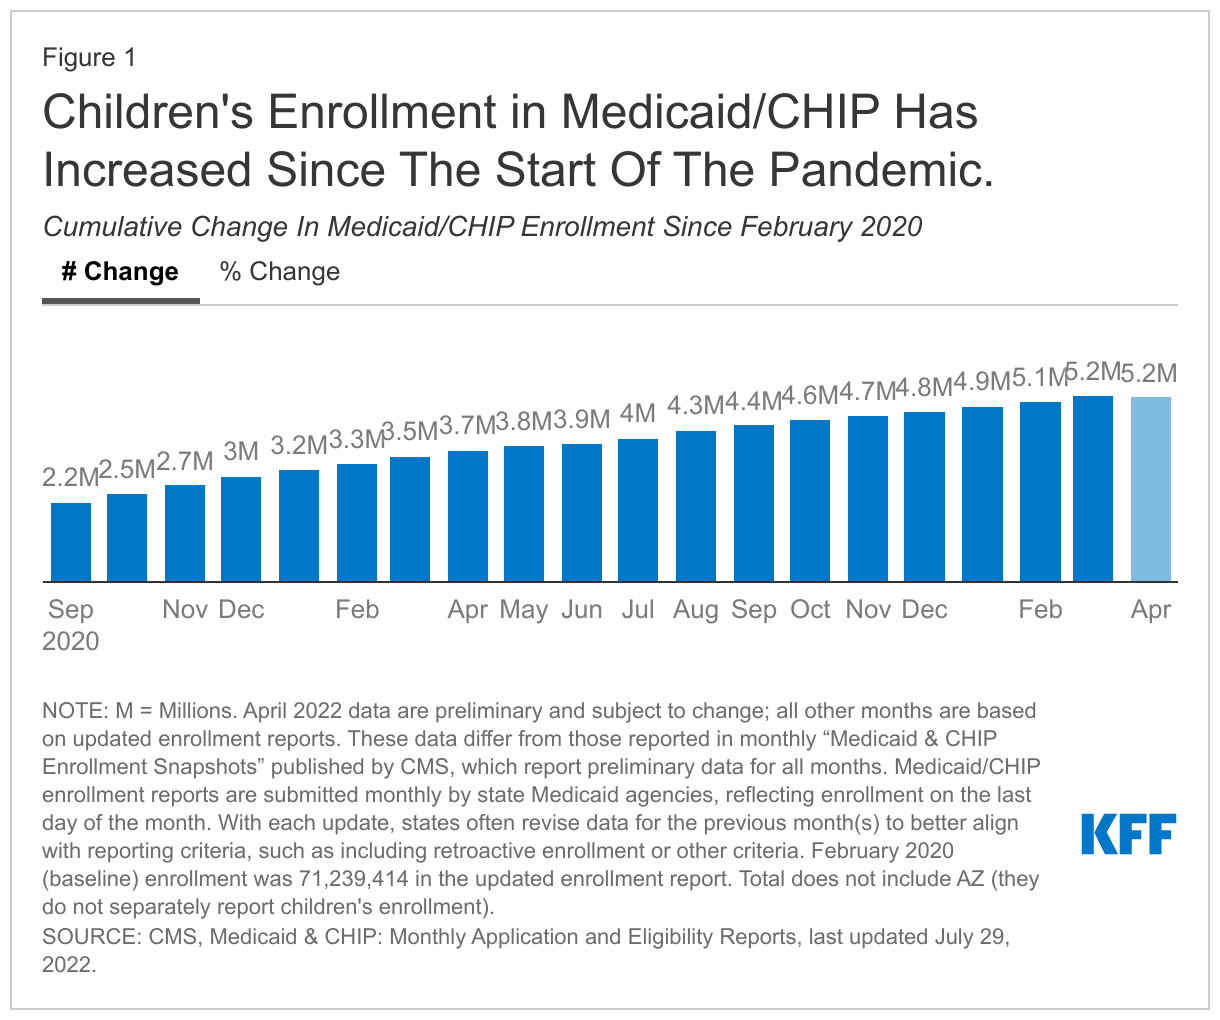
Despite job losses that threatened employer-sponsored insurance coverage early in the pandemic, uninsured rates have declined likely due to federal policies passed during in the pandemic and the safety net Medicaid and CHIP provided. Following growth in the children’s uninsured rate from 2017 to 2019, data from the National Health Interview Survey (NHIS) show that the children’s uninsured rate held steady from 2019 to 2020 and then fell from 5.1% in 2020 to 4.1% in 2021. Just released quarterly NHIS data show the children’s uninsured rate was 3.7% in the first quarter of 2022, which was below the rate in the first quarter of 2021 (4.6%) but a slight uptick from the fourth quarter of 2021 (3.5%), though none of these differences are statistically significant. Administrative data show that children’s enrollment in Medicaid and CHIP increased by 5.2 million enrollees, or 14.7%, between February 2020 and April 2022 (Figure 1). Provisions in the Families First Coronavirus Response Act (FFCRA) require states to provide continuous coverage for Medicaid enrollees until the end of the month in which the public health emergency (PHE) ends in order to receive enhanced federal funding.

Children's Enrollment in Medicaid/CHIP Has Increased Since The Start Of The Pandemic

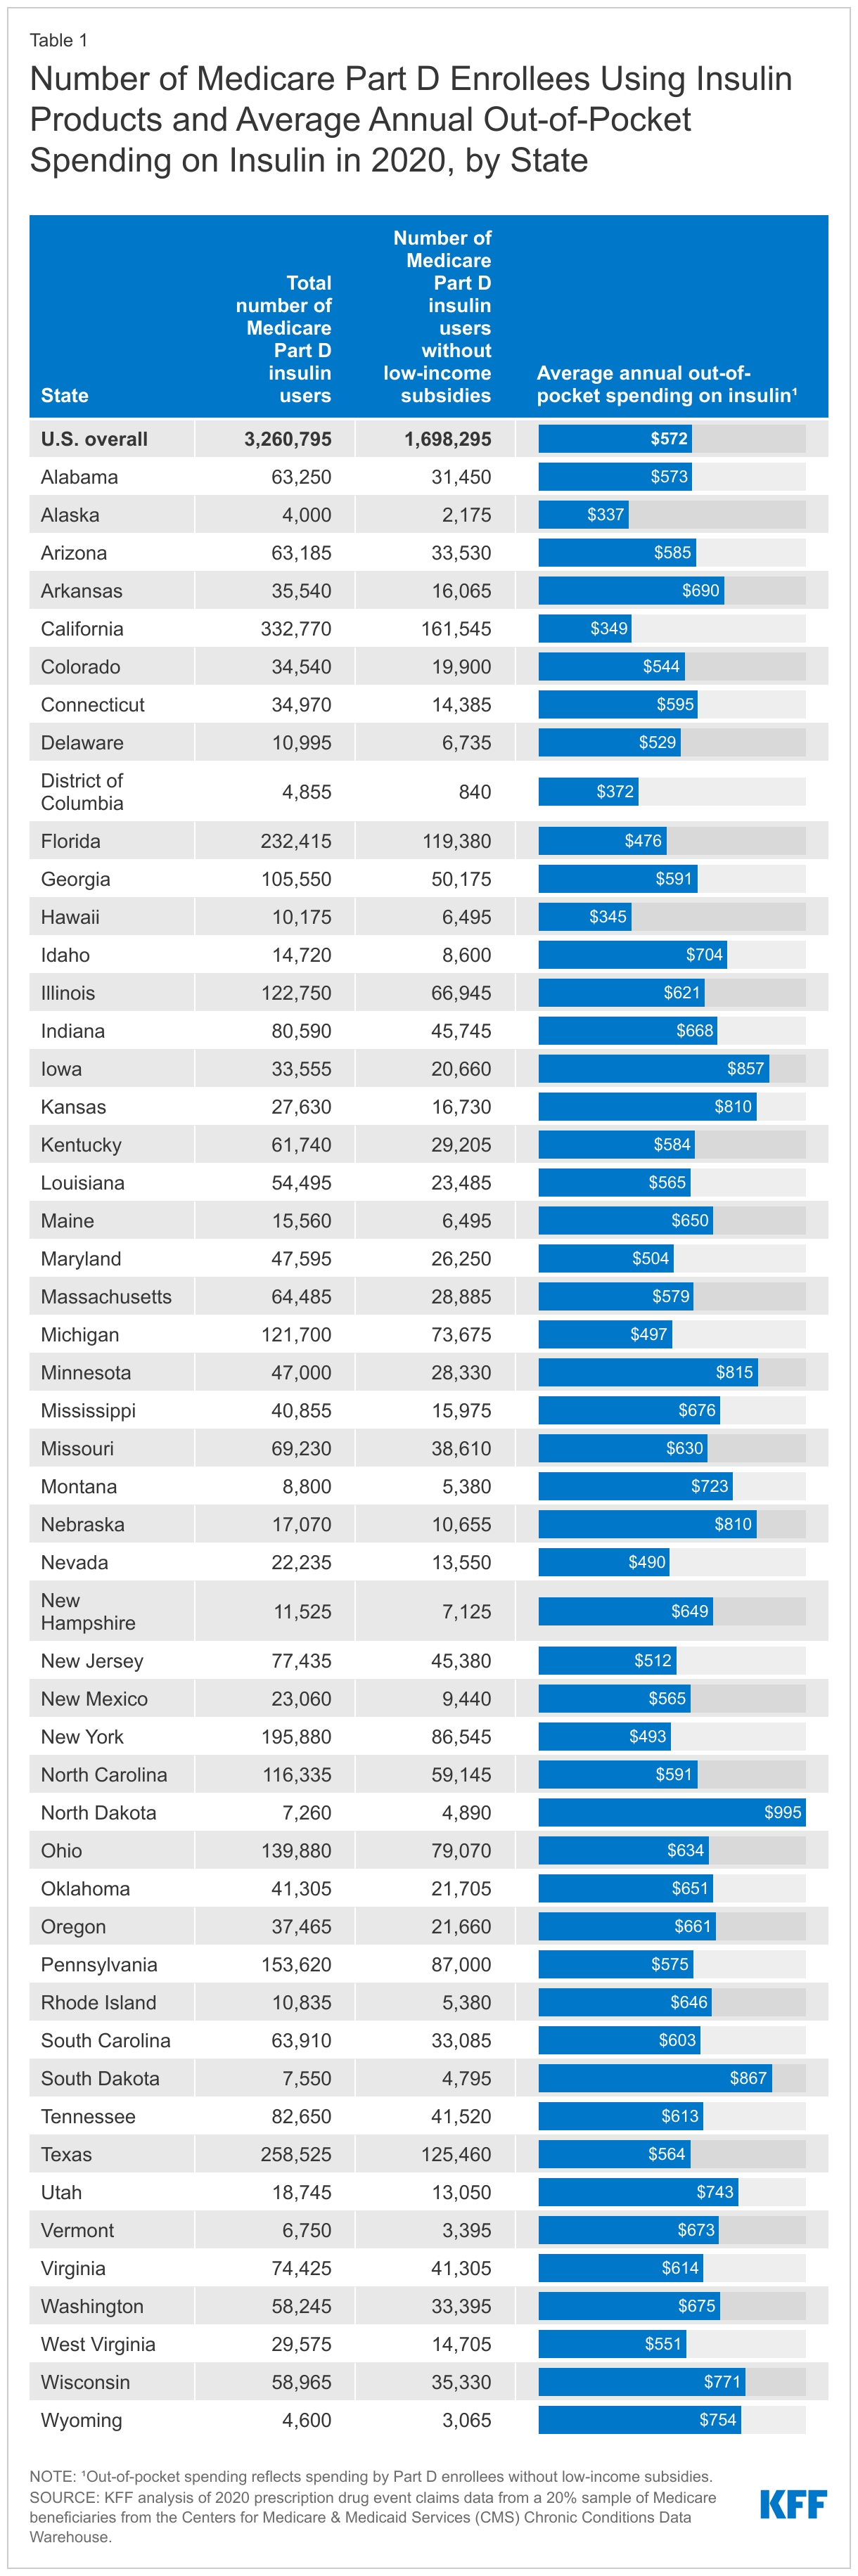
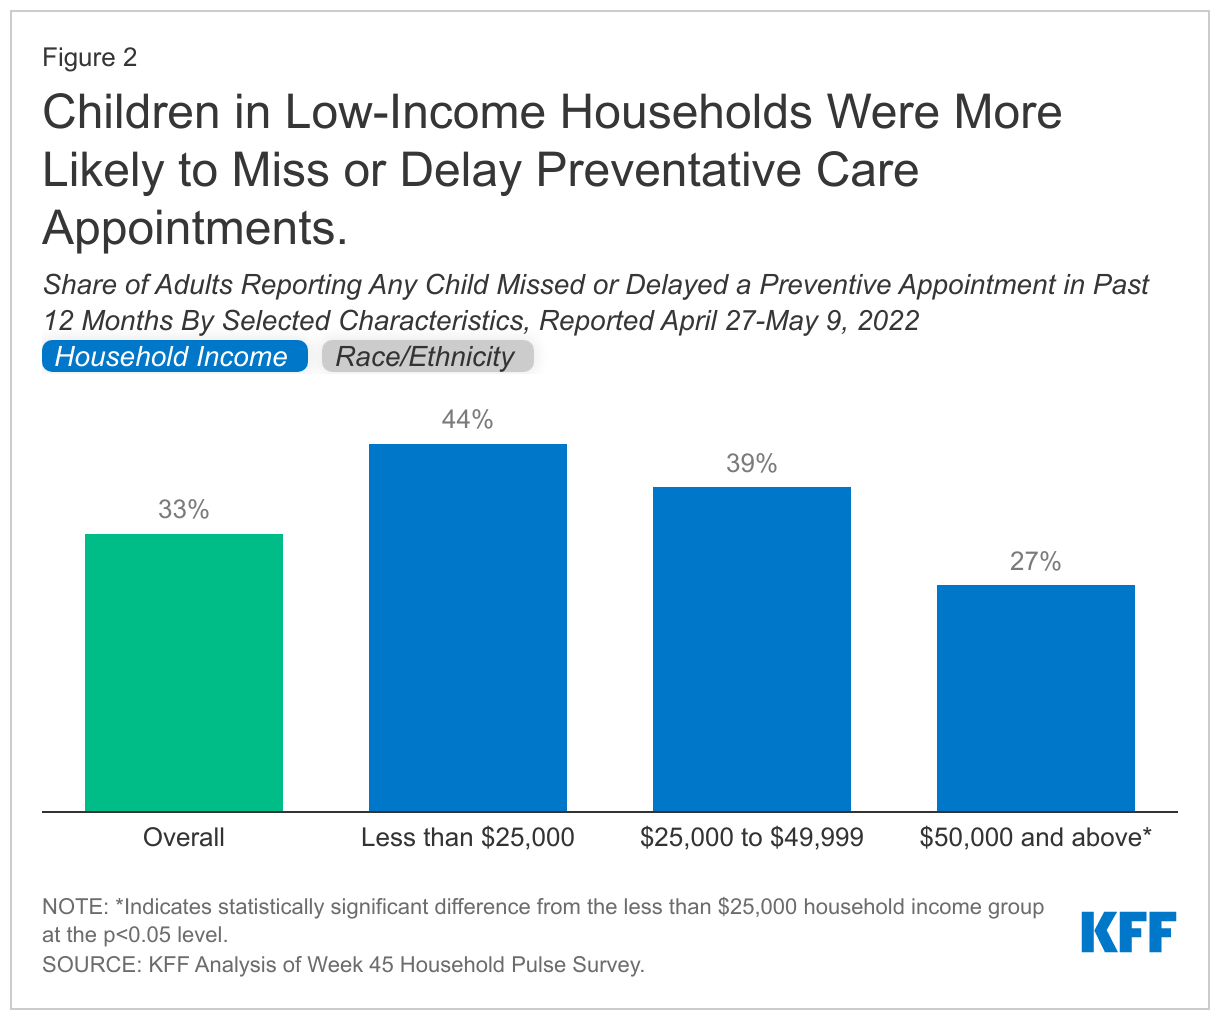
Children have missed or delayed preventive care during the pandemic, with a third of adults still reporting one or more children missed or delayed a preventative check-up in the past 12 months (Figure 2). However, the share missing or delaying care is slowly declining, with the share from April 27 – May 9, 2022 (33%) down 3% from almost a year earlier (July 21 – August 2, 2021) according to KFF analysis of the Household Pulse Survey. Adults in households with income less than $25,000 were significantly more likely to have a child that missed, delayed, or skipped a preventive appointment in the past 12 months compared to households with income over $50,000. These data are in line with findings from another study that found households reporting financial hardship were significantly more likely to report missing or delaying children’s preventive visits compared to those not reporting hardships. Hispanic households and households of other racial/ethnic groups were also significantly more likely to have a child that missed, delayed, or skipped a preventive appointment in the past 12 months compared to White households (based on race of the adult respondent).

Children in Low-Income Households Were More Likely to Miss or Delay Preventative Care Appointments

Telehealth helped to provide access to care, but children with special health care needs and those in rural areas continued to face barriers. Overall, telehealth utilization soared early in the pandemic, but has since declined and has not offset the decreases in service utilization overall. While preventative care rates have increased since early in the pandemic, many children likely still need to catch up on missed routine medical care. One study found almost a quarter of parents reported not catching-up after missing a routine medical visit during the first year of the pandemic. The pandemic may have also exacerbated existing challenges accessing needed care and services for children with special health care needs, and low-income patients or patients in rural areas may have experienced barriers to accessing health care via telehealth.

The pandemic has also led to declines in children’s routine vaccinations, blood lead screenings, and vision screenings. The CDC reported vaccination coverage of all state-required vaccines declined by 1% in the 2020-2021 school year compared to the previous year, and some public health leaders note COVID-19 vaccine hesitancy may be spilling over to routine child immunizations. The CDC also reported 34% fewer U.S. children had blood lead level testing from January-May 2020 compared to the same period in 2019. Further, data suggest declines in lead screenings during the pandemic may have exacerbated underlying gaps and disparities in early identification and intervention for lower-income households and children of color. Additionally, many children rely on in-school vision screenings to identity vision impairments, and some children went without vision checks while schools managed COVID-19 and turned to remote learning. These screenings are important for children in order to identify problems early; without treatment some conditions can worsen or lead to more serious health complications.

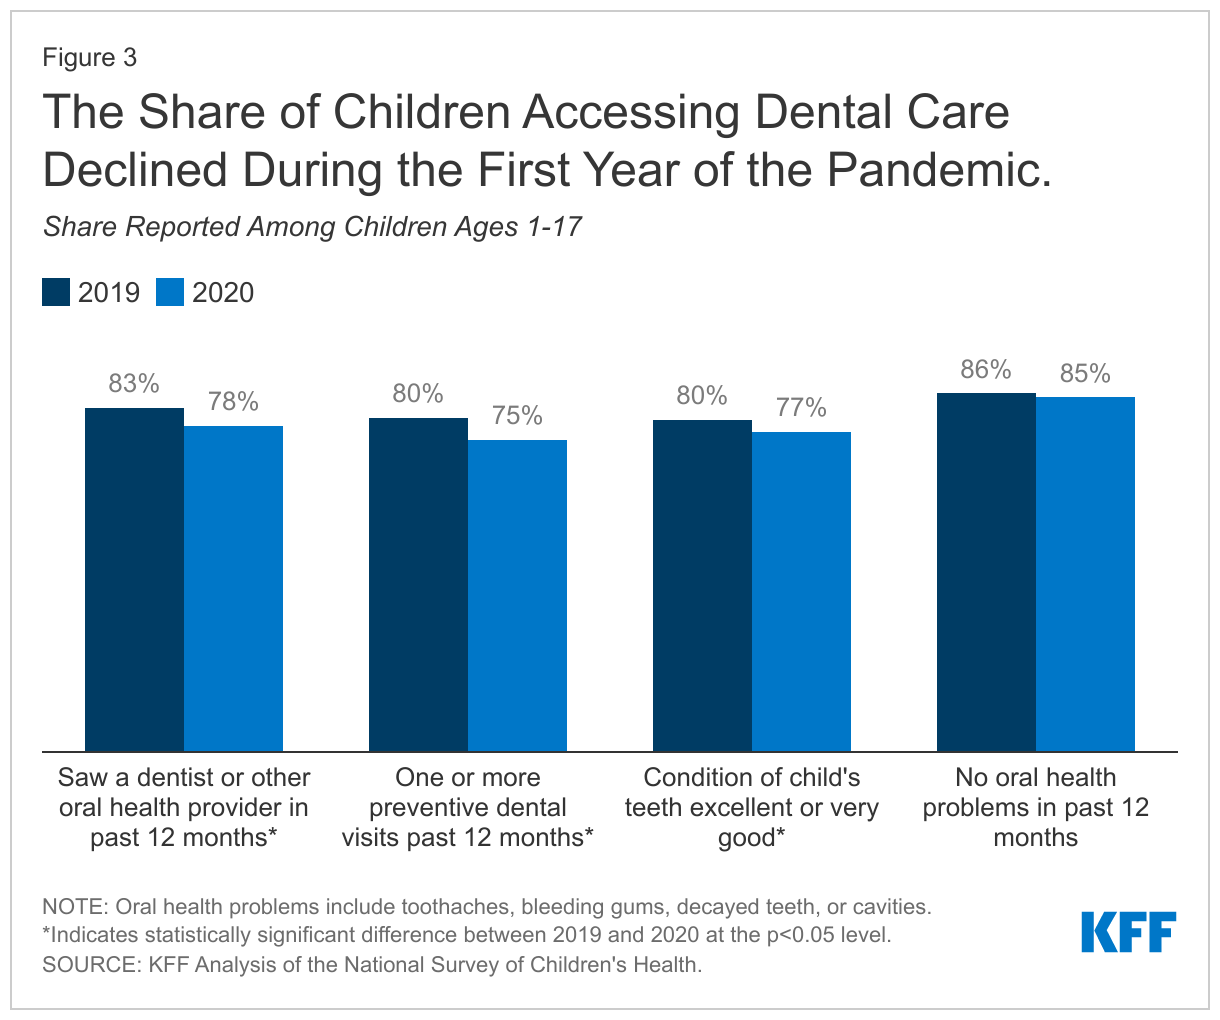
The pandemic has also led to difficulty accessing and disruptions in dental care. Data from the National Survey of Children’s Health (NSCH) show the share of children reporting seeing a dentist or other oral health provider or having a preventive dental visit in the past 12 months declined from 2019 to 2020, the first year of the pandemic (Figure 3). The share of children reporting their teeth are in excellent or very good conditions also declined from 2019 (80%) to 2020 (77%); the share of children reporting no oral health problems also declined but the change was not statistically significant.

The Share of Children Accessing Dental Care Declined During the First Year of the Pandemic

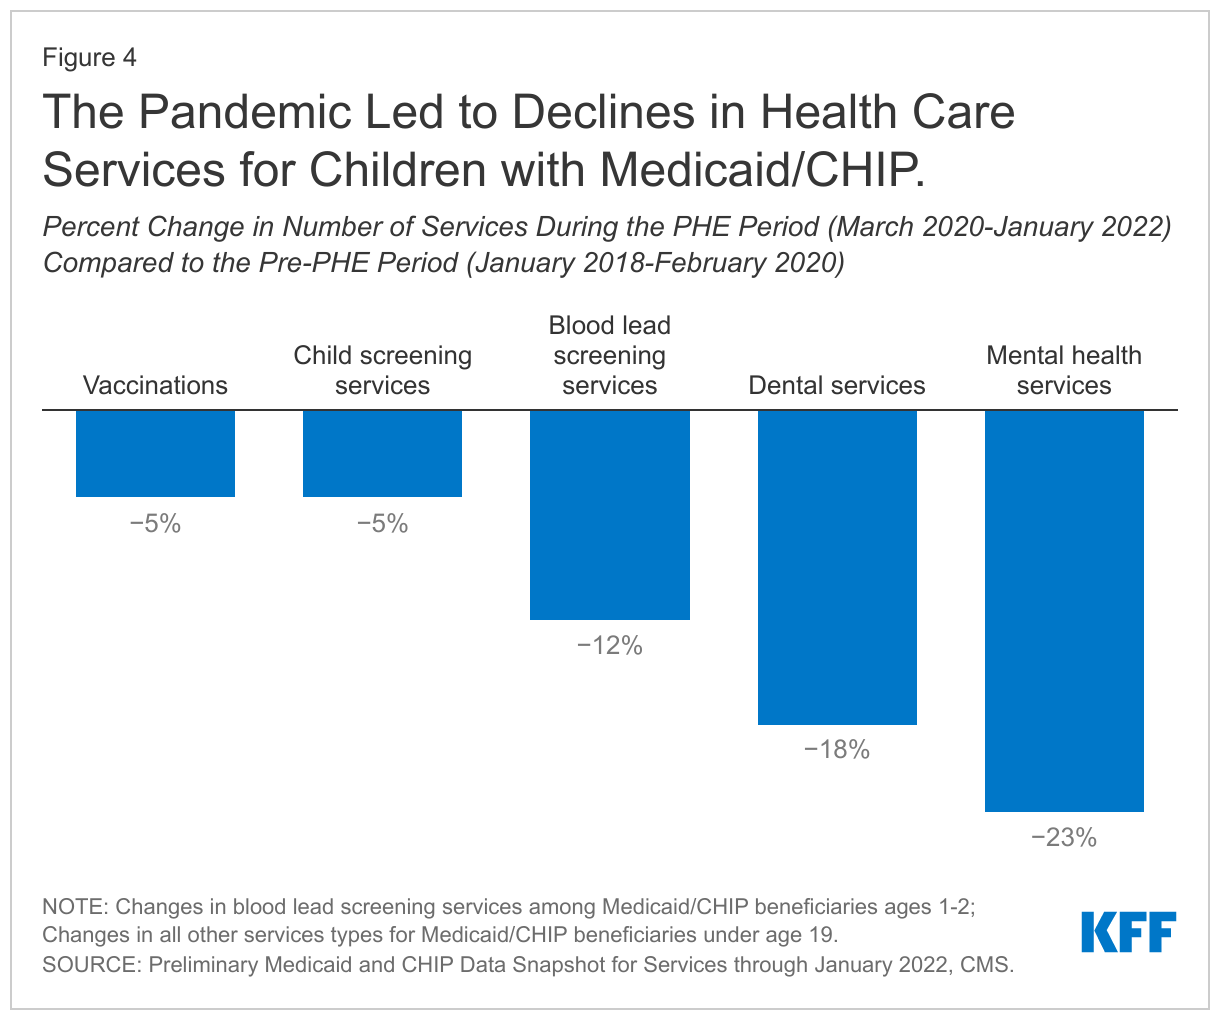
Recently released preliminary data for Medicaid/CHIP beneficiaries under age 19 shows steep declines in service utilization early in the pandemic, with utilization then rebounding to a varying degree depending on the service type. Child screening services have rebounded to pre-PHE levels while blood lead screenings and dental services rates remain below per-PHE levels. Telehealth utilization mirrors national trends, increasing rapidly in April 2020 and then beginning to decline in 2021. When comparing the PHE period (March 2020 – January 2022) to the pre-PHE period (January 2018 – February 2020) overall, the data show child screening services and vaccination rates declined by 5% (Figure 4). Blood lead screening services and dental services saw larger declines when comparing the PHE period to before the PHE, declining by 12% and 18% respectively among Medicaid/CHIP children.

The Pandemic Led to Declines in Health Care Services for Children with Medicaid/CHIP

Children’s Mental Health Challenges

Children’s mental health challenges were on the rise even before the onset of the COVID-19 pandemic. A recent KFF analysis found the share of adolescents experiencing anxiety and/or depression has increased by one-third from 2016 (12%) to 2020 (16%), although rates in 2020 were similar to 2019.  Rates of anxiety and/or depression were more pronounced among adolescent females and White and Hispanic adolescents. A separate survey of high school students in 2021 found that lesbian, gay, or bisexual (LGB) students were more likely to report persistent feelings of sadness and hopelessness than their heterosexual peers. In the past few years, adolescents have experienced worsened emotional health, increased stress, and a lack of peer connection along with increasing rates of drug overdose deaths, self-harm, and eating disorders. Prior to the pandemic, there was also an increase in suicidal thoughts from 14% in 2009 to 19% in 2019.

The pandemic may have worsened children’s mental health or exacerbated existing mental health issues among children. The pandemic caused disruptions in routines and social isolation for children, which can be associated with anxiety and depression and can have implications for mental health later in life. A number of studies show an increase in children’s mental health needs following social isolation due to the pandemic, especially among children who experience adverse childhood experiences (ACEs). KFF analysis found the share of parents responding that adolescents were experiencing anxiety and/or depression held relatively steady from 2019 (15%) to 2020 (16%), the first year of the pandemic. However, the KFF COVID-19 Vaccine Monitor on perspectives of the pandemic at two years found six in ten parents say the pandemic has negatively affected their children’s schooling and over half saying the same about their children’s mental health. Researchers also note it is still too early to fully understand the impact of the pandemic on children’s mental health. The past two years have also seen much economic turmoil, and research has shown that as economic conditions worsen, children’s mental health is negatively impacted. Further, gun violence continues to rise and may lead to negative mental health impacts among children and adolescents. Research suggests that children and adolescents may experience negative mental health impacts, including symptoms of anxiety, in response to school shootings and gun-related deaths in their communities.

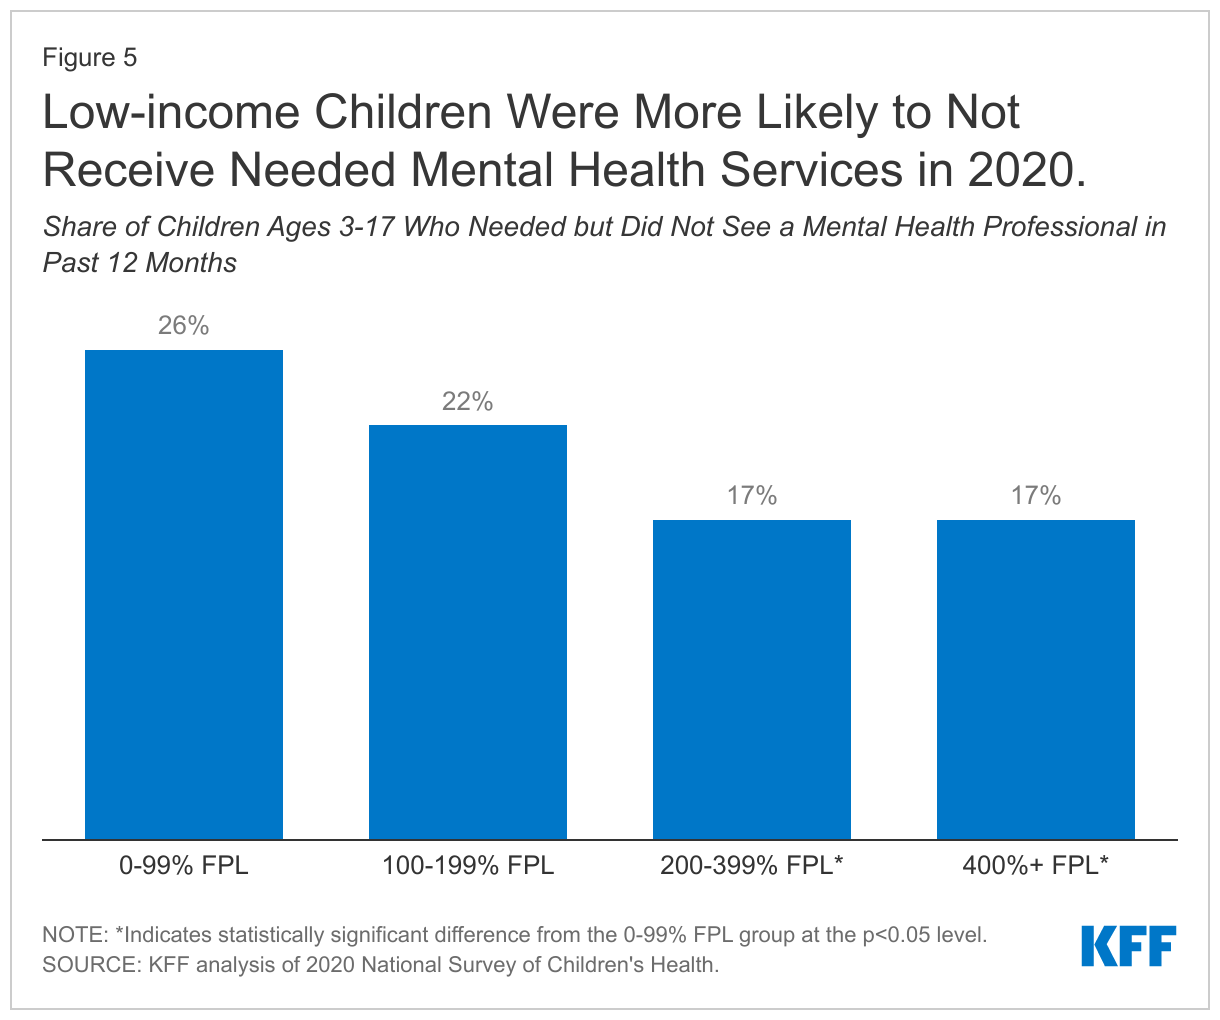
Access and utilization of mental health care may have also worsened during the pandemic. Preliminary data for Medicaid/CHIP beneficiaries under age 19 finds utilization of mental health services during the PHE declined by 23% when compared to prior to the pandemic (Figure 4); utilization of substance use disorder services declined by 24% for beneficiaries ages 15-18 for the same time period. The data show utilization of mental health services remains below pre-PHE levels and has seen the smallest improvement compared to other services utilized by Medicaid/CHIP children. Telehealth has played a significant role in providing mental health and substance use services to children early in the pandemic, but has started to decline. The pandemic may have widened existing disparities in access to mental health care for children of color and children in low-income households. NSCH data show 20% of children with mental health needs were not receiving needed care in 2020, with the lowest income children less likely to receive needed mental health services when compared to higher income groups (Figure 5).

Low-income Children Were More Likely to Not Receive Needed Mental Health Services in 2020

Children’s Health and COVID-19

While less likely than adults to develop severe illness, children can contract and spread COVID-19 and children with underlying health conditions are at an increased risk of developing severe illnessData through July 28, 2022 show there have been over 14 million child COVID-19 cases, accounting for 19% of all cases. Among Medicaid/CHIP enrollees under age 19, 6.4% have received a COVID-19 diagnosis through January 2022. Pediatric hospitalizations peaked during the Omicron surge in January 2022, and children under age 5, who were not yet eligible for vaccination, were hospitalized for COVID-19 at five times the rate during the Delta surge.

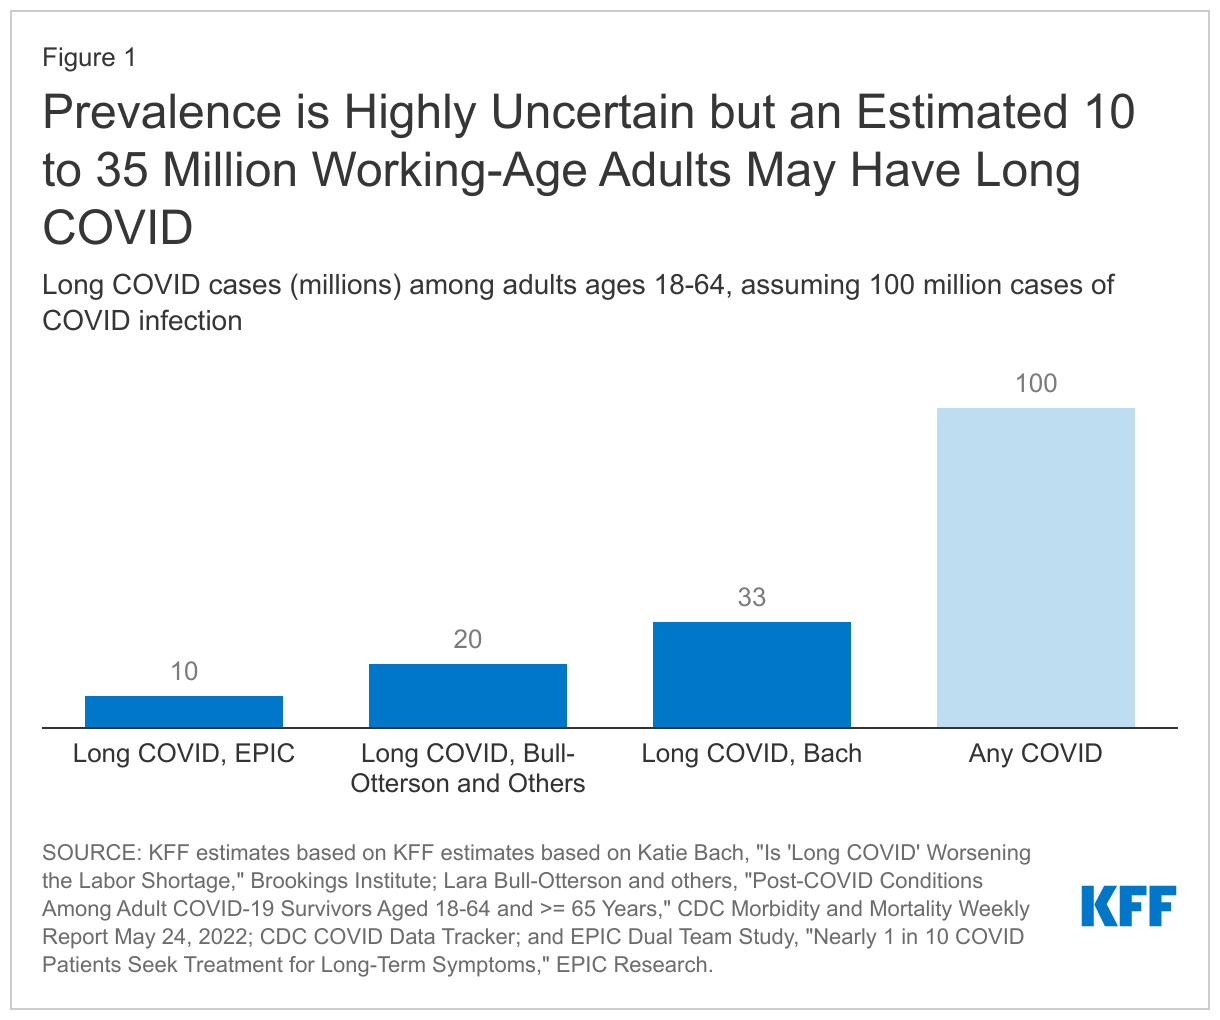
Some children who tested positive for the virus are now facing long COVID. A recent meta-analysis found 25% of children and adolescents had ongoing symptoms following COVID-19 infection, and finds the most common symptoms for children were fatigue, shortness of breath, and headaches, with other long COVID symptoms including cognitive difficulties, loss of smell, sore throat, and sore eyes. Another report found a larger share of children with a confirmed COVID-19 case experienced a new or recurring mental health diagnosis compared to children who did not have a confirmed COVID-19 case. However, researchers have noted it can be difficult to distinguish long COVID symptoms to general pandemic-associated symptoms. In addition, a small share of children are experiencing multisystem inflammatory syndrome in children (MIS-C), a serious condition associated with COVID-19 that has impacted almost 9,000 children. A lot of unknowns still surround long COVID in children; it is unclear how long symptoms will last and what impact they will have on children’s long-term health.

COVID-19 vaccines were recently authorized for children between the ages of 6 months and 5 years, making all children 6 months and older eligible to be vaccinated against COVID-19. Vaccination has already peaked for children under the age of 5, and is far below where 5-11 year-olds were at the same point in their eligibility. As of July 20, approximately 544,000 children under the age of 5 (or approximately 2.8%) had received at least one COVID-19 vaccine dose. Vaccinations for children ages 5-11 have stalled, with just 30.3% have been fully vaccinated as of July 27 compared to 60.2% of those ages 12-17.  Schools have been important sites for providing access as well as information to help expand vaccination take-up among children, though children under 5 are not yet enrolled in school, limiting this option for younger kids. A recent KFF survey finds most parents of young children newly eligible for a COVID-19 vaccine are reluctant to get them vaccinated, including 43% who say they will “definitely not” do so.

Some children have experienced COVID-19 through the loss of one or more family members due to the virus. A study estimates that, as of June 2022, over 200,000 children in the US have lost one or both parents to COVID-19. Another study found children of color were more likely to experience the loss of a parent or grandparent caregiver when compared to non-Hispanic White children. Losing a parent can have long term impacts on a child’s health, increasing their risk of substance abuse, mental health challenges, poor educational outcomes, and early death. There have been over 1 million COVID-19 deaths in the US, and estimates indicate a 17.5% to 20% increase in bereaved children due to COVID-19, indicating an increased number of grieving children who may need additional supports as they head back to school.

Looking Ahead

Children will be back in the classroom this fall but may continue to face health risks due to their or their teacher’s vaccination status and increasing transmission due to COVID-19 variants. New, more transmissible COVID-19 variants continue to emerge, with the most recent Omicron subvariant BA.5 driving a new wave of infections and reinfections among those who have already had COVID-19. This could lead to challenges for the back-to-school season, especially among young children whose vaccination rates have stalled.

Schools, parents, and children will likely continue to catch up on missed services and loss of instructional time in the upcoming school year. Schools are likely still working to address the loss of instructional time and drops in student achievement due to pandemic-related school disruptions. Further, many children with special education plans experienced missed or delayed services and loss of instructional time during the pandemic. Students with special education plans may be entitled to compensatory services to make up for lost skills due to pandemic related service disruptions, and some children, such as those with disabilities related to long COVID, may be newly eligible for special education services.

To address worsening mental health and barriers to care for children, several measures have been taken or proposed at the state and federal level. Many states have recently enacted legislation to strengthen school based mental health systems, including initiatives such as from hiring more school-based providers to allowing students excused absences for mental health reasons. In July 2022, 988 – a federally mandated crisis number – launched, providing a single three-digit number for individuals in need to access local and state funded crisis centers, and the Biden Administration released a strategy to address the national mental health crisis in May 2022, building on prior actions. Most recently, in response to gun violence, the Bipartisan Safer Communities Act was signed into law and allocates funds towards mental health, including trauma care for school children.

The unwinding of the PHE and expiring federal relief may have implications for children’s health coverage and access to care. The American Rescue Plan Act (ARPA) extended eligibility to ACA health insurance subsides for people with incomes over 400% of poverty and increased the amount of assistance for people with lower incomes. However, these subsidies are set to expire at the end of this year without further action from Congress, which would increase premium payments for 13 million Marketplace enrollees. In addition, provisions in the FFCRA providing continuous coverage for Medicaid enrollees will expire with the end of the PHE. Millions of people, including children, could lose coverage when the continuous enrollment requirement ends if they are no longer eligible or face administrative barriers during the process despite remaining eligible. There will likely be variation across states in how many people are able to maintain Medicaid coverage, transition to other coverage, or become uninsured. Lastly, there have also been several policies passed throughout the pandemic to provide financial relief for families with children, but some benefits, like the expanded Child Tax Credit, have expired and the cost of household items is rising, increasing food insecurity and reducing the utility of benefits like SNAP.


A Look at the Economic Effects of the Pandemic for Children

Authors: Patrick Drake and Elizabeth Williams
Published: Aug 5, 2022

American families have reported struggling throughout the COVID pandemic on a variety of economic indicators. Recent trends in inflation reported by the Bureau of Labor Statistics in June threaten to further reduce the buying power of American families and to exacerbate existing financial hardship and disparities. Prior to this period of inflation levels not seen for decades, many families had already been struggling to pay their normal household expenses, pay for rent or mortgage payments, and to obtain sufficient food to feed their family. These challenges have consistently been more acute for families with a child in the household compared to households without children, and especially so for lower-income families.

Federal policymakers have taken several actions to mitigate the economic impact of the pandemic on families and children by providing state fiscal relief, increased nutrition assistance, Medicaid funding, and the Child Tax Credit (CTC) and Earned Income Tax Credit (EITC); however, some of this assistance has or will expire. This brief examines hardship across three metrics—difficulty paying for normal household expenses, food sufficiency, and uncertainty in paying for rent or mortgage payments for households with children and by income.

How does household income affect children’s health and well-being?

Household income has been historically linked to children’s health and education outcomes. Even before the pandemic, families with children living near or below the federal poverty line have historically had higher rates of food insufficiency, worse infant health outcomes, and worse academic achievement, than higher income peers. In 2020, 33.7% of households with children with incomes below 185% of the poverty threshold were food insecure, more than double the national average of 14.8%. Evidence also shows that household income affects children’s health as well as their cognitive and social development. A 2020 report from the U.S. Department of Education found that students considered economically disadvantaged were almost one and a half times as likely to not graduate high school within four years of entering the 9th grade. Financial instability can also lead to stress and mental health challenges for parents that can negatively affect children’s emotional and mental health.

Economic stability is also a social determinant of health and addressing social determinants of health is important for improving health outcomes and reducing health disparities. For this reason, recent policies, like the CTC, have targeted financial relief to families with children. Addressing child poverty is associated with improved child health outcomes such as healthier birthweights, lower maternal stress, better nutrition, and lower use of drugs and alcohol. Cash transfers have been associated with improved health outcomes, and a recent study found increased brain activity in babies of low-income workers provided cash assistance.

How have households with children fared throughout the pandemic?

Households with children have consistently fared worse than households without children throughout the pandemic.  Challenges for all households peaked early in the pandemic and then improved by summer 2021; however, adults living with children have consistently reported more difficulty paying daily household expenses, providing adequate food for their family, and have been less secure in their housing payments compared to other households (Figure 1).

Share of Families With Difficulty Paying Usual Household Expenses

Improvements in measures of hardship in 2021 were likely related to improving economic conditions and several federal policies implemented during the pandemic that provided financial relief for individuals and families.  Following the onset of the pandemic, national employment indicators quickly worsened, creating one of the deepest recessions on record. While this recession was deep, it was also the shortest on record at two months.  Federal fiscal relief for individuals and families, including direct stimulus payments, expanded unemployment benefits, the Emergency Rental Assistance Program, and enhanced Supplemental Nutrition Assistance Program (SNAP) benefits as well as the availability of COVID vaccines led to improvements in employment indicators and measures of hardship in 2021.  Federal support was likely the driving force behind a decrease in overall poverty rates in 2020, and the expanded Child Tax Credit (CTC) included in the American Rescue Plan Act (ARPA) is expected to further contribute to lower rates of child poverty in 2021.  Early data show the monthly child poverty rate declined by almost 30% following the beginning of the advance payments of the CTC in July 2021. A recent report also found food insufficiency declined by 26% in households with children who received advance CTC payments. The expanded CTC applied to families previously too poor to qualify and gave families in the lowest quintile an average income boost of $4,470.

However, recent data signal measures of hardship are again on the rise, particularly for households with children. All households have reported their highest rates of difficulty paying usual household expenses and food insufficiency since the earlier in the pandemic, with households with children experiencing more challenges across measures. In latest data, food security has also increased among households with children, a trend not seen in households without children. Despite worsening rates of hardship in other metrics, the shares of both households with and without children report having no confidence in their ability to pay their rent or mortgage has remained stable in recent months.

Recent increases in hardship are likely due to rising inflation and the costs of goods as well as the expiration of the Child Tax Credit. The U.S. Bureau of Labor Statistics reported inflation accelerated to 9.1% in June 2022, with the largest contributors being gasoline, and food. In the absence of school provided low-cost and free lunches to children through the National School Lunch Program, the summer months can be a difficult time for families to meet their food needs. Recent high inflation increasing food costs can lead to increased food insecurity for children. Increased costs reduce a family’s purchasing power and limits how much benefits like SNAP can cover, which can make it more difficult to purchase food, and pay bills. The recent baby formula shortage increased the costs of formula, and some WIC recipients have reported paying out of pocket to obtain the formula they need. Further, the expanded Child Tax Credit benefits expired at the end of 2021, and a recent report found a 12% increase in food insufficiency following expiration of the advance CTC payments.

Are lower-income families with children facing disproportion levels of hardship over other households?

Overall, families with children are experiencing higher rates of economic hardship than families without children. 49% of adults with children in the household reported difficultly paying for expenses in the past week, 16% reported food insufficiency in their household, and 8% reported not having confidence in their ability to make their next month’s housing payment (Figure 2). Families with a child were significantly more likely to report difficulty paying for their usual expenses, food insufficiency and low confidence in their ability to make next month’s housing payment than those families without a child.

Share of Adults Experiencing Selected Financial Hardships, by Household Income

Among all households with children, families with an income less than $25,000 are more likely to report economic hardship than higher earning households. Among the lowest-income adults living with one or more children, 78% (roughly 7.2 million adults)1  reported having difficulty paying their usual household expenses, 40% (roughly 3.6 million adults) reported having food insufficiency, and 19% (roughly 1.4 million adults) reported having no confidence to make next month’s housing payment (Figure 2). Despite higher earnings, over 1 in 3 adults making $50,000 and above have reported having difficulty paying their usual household expenses as well.

Looking Ahead

As financial hardships for families are rising, some fiscal relief provided to families throughout the pandemic has expired or is expected to expire soon. The expanded Child Tax Credit expired at the end of 2021. When the Public Health Emergency (PHE) expires, several expanded SNAP benefits will also expire. Recent inflationary pressures may magnify the effects of the expiring federal assistance as well as other economic and health issues stemming from COVID-19 as children transition back to school in the fall.

  1. KFF analysis of data from the Census Household PULSE Survey from June 29–July 11 (Difficulty paying usual household expenses, and food insufficiency), and from April 27 – May 9, 2022 (No Confidence in paying next months rent/mortgage payment). 95% confidence intervals for these estimates are as follows: “Difficulty paying usual household expenses” (6,423,727–7,919,960), “Food insufficiency” (3,113,361–4,149,963), and “No confidence in paying next month’s rent/mortgage payment” (1,083,440–1,772,036) ↩︎

PEPFAR and Sustained Epidemic Control

Published: Aug 5, 2022

Issue Brief

Overview

While PEPFAR was designed at the outset as an emergency program, the importance of building sustainable capacity was recognized early on, and over time, this emphasis has increased and evolved. Most recently, PEPFAR has elevated its focus on sustainability even further, placing it “at the same level of priority as epidemic control.” To better understand how PEPFAR is defining and approaching sustained epidemic control, we examined PEPFAR’s most recent Country and Regional Operational Plan (COP) Guidance and country planning level letters (PLLs) for the 25 countries required to prepare COPs in 2022. We assessed country progress across several dimensions of sustainability as follows: the status of epidemic control and global HIV targets; progress toward meeting PEPFAR’s 16 minimum program requirements (MPRs); the HIV funding landscape; the status of health systems strengthening efforts; progress toward addressing gaps for key and other vulnerable populations; and community and civil society inclusion and engagement. Among our findings:

  • Most COP countries (16 of 25) are at, or near, epidemic control, as defined by PEPFAR, including 12 that have reached epidemic control. Eight have reached the global viral suppression target (73% of people with HIV virally suppressed) set for 2020.
  • While progress toward meeting the 16 PEPFAR MPRs is underway, no COP country has completed all of them; the average number completed is five and completion rates range from 6% to 75% in COP countries. Certain MPRs have higher completion rates, with implementation of test & start and elimination of user fees at the top, while increased domestic funding from partner governments is at the bottom.
  • National HIV budgets in COP countries vary significantly in size and in terms of funding per person living with HIV. PEPFAR accounts for the largest share of national HIV budgets (46%), and most COP countries are dependent on external financing for their HIV response.
  • Country PLLs identify a number of issues and challenges related to health systems strengthening in the following areas: supply chains and stockouts (10 countries); laboratory networks and systems (8); data systems, such as the lack of population-based estimates (7); and rightsizing the health care workforce, including using human resources for health (HRH) data to optimize staffing levels (7).
  • Nearly all country PLLs (22) highlight the importance of bolstering prevention, testing, and treatment to reach children and adolescent girls and young women (AGYW), though gender-based violence is only mentioned in four countries. More than half (13) identify addressing gaps for key populations, and nearly all (23) have a technical directive focused on improving and expanding data in this area. Few however specifically mention stigma and discrimination or human rights as priority areas, despite the fact that many have legal and policy barriers that may present challenges to reaching and supporting key populations in accessing HIV services.
  • Finally, the importance of engaging community partners in order to improve PEPFAR programming, with particular emphasis on the role of community-led monitoring (CLM), is mentioned in all PLLs.

This analysis provides an initial look at how PEPFAR is currently defining and approaching sustained epidemic control at the country level. As it finds, the picture is multi-layered, and there is significant variation across countries and across dimensions. Going forward, better understanding how these markers of sustainability, such as epidemic control status, financial dependency, and MPR status, fit together may help to paint a clearer narrative of country progress. Some of this information may be forthcoming, as PEPFAR is expected to release a new five-year strategy and sustainability roadmaps for some countries.

Introduction

While PEPFAR was designed at the outset as an emergency program, the importance of building sustainable capacity was recognized early on, including in its authorizing legislation. Over time, this emphasis has increased and evolved, and in 2014, PEPFAR characterized its next phase as one of achieving “Sustainable Control of the Epidemic” and introduced an “epidemic control” target. Epidemic control is defined by PEPFAR as the point at which the total number of new HIV infections falls below the total number of deaths from all causes among HIV-infected individuals, with both new infections and deaths among people living with HIV low and declining. As part of its next strategy, now under development, and through recent guidance to countries, PEPFAR has elevated its focus on sustainability even further, placing it “at the same level of priority as epidemic control” and identifying several programmatic and management characteristics necessary for achieving sustainability (see Box 1).

Box 1:  Defining “Sustained Epidemic Control”

PEPFAR’s 2022 COP/ROP Guidance defines and describes the process for achieving sustained epidemic control as follows:

  • Places sustainability at the same level of priority as epidemic control
  • Includes a focus on both functional (e.g., enabling environment, locally-led HIV services and systems, etc.) and financial (e.g., adequate resource mobilization, understanding and managing cost, etc.) responsibilities and capacity
  • Includes the following program and management characteristics:

Program Characteristics

    • maintain the total number of new HIV infections below the total number of deaths from all causes among people with HIV
    • reach viral load suppression of 85% for all ages, genders, and population groups
    • have a robust public health capacity to monitor and track HIV outbreaks as well as other existing and emerging health threats
    • have an environment that fights stigma and discrimination, and promotes human rights and equity in the HIV response

Management Characteristics

    • ensure an enabling/nimble policy is in place to support sustained HIV outcomes
    • possess sufficient technical and human capacity to manage and maintain the scale of key programs, services, systems, and resources stewarded by local institutions, communities, and other local actors
    • possess technical and human capacity to introduce and adapt effective and efficient models and programs
    • invest sufficient domestic financial resources that are used efficiently and effectively to sustain essential HIV services and meet emerging needs
    • possess management and monitoring capacities to deliver quality assured HIV services and commodities

SOURCE: PEPFAR, PEPFAR 2022 Country and Regional Operational Plan (COP/ROP) Guidance for all PEPFAR-Supported Countries, Jan. 2022.

To better understand how PEPFAR is defining and approaching sustained epidemic control and progress in PEPFAR countries, we examined PEPFAR’s most recent Country and Regional Operational Plan (COP) Guidance and associated planning level letters (PLLs) sent to country teams. COP guidance describes program investments, requirements, activities, and targets and, as such, is one of the main vehicles for interpreting how PEPFAR seeks to operationalize its goals and objectives in the coming year. PLLs provide specific input to each country team, including notional funding levels and country-specific challenges and objectives to be addressed in their annual COPs. In our analysis of the PLLs, we categorized issues as key challenges only if they were specifically identified in the “challenges” or “priority changes” sections of the PLLs. Based on these documents, and analysis of a range of supplemental data, we assessed country progress toward sustained epidemic control across several dimensions as follows:

  • The status of PEPFAR’s epidemic control target and other global HIV targets in PEPFAR countries;
  • Progress toward meeting PEPFAR’s 16 minimum program requirements (MPRs), the policies and practices that countries are expected to have place to ensure success;
  • The HIV funding landscape, including the size of national HIV budgets and funding composition;
  • The status of health system strengthening efforts, including supply chains, laboratory networks, data systems, and the health workforce;
  • Progress toward addressing gaps for key and other vulnerable populations and an assessment of the larger political and legal environment that could affect access; and
  • Community and civil society inclusion and engagement.

This list is not intended to be exhaustive but, rather, to capture some of the main elements that are key to sustained epidemic control, as identified by PEPFAR and other global stakeholders. We focused our analysis on the 25 countries required to prepare COPs in 2022.1 

Findings

Status of Epidemic Control and Global HIV Targets in COP Countries

Epidemiologic measures, including PEPFAR’s epidemic control target, are key elements of sustained control. We looked across COP countries to describe their HIV epidemics and assess their status toward epidemic control and other global HIV targets.

  • The 25 COP countries are home to almost two-thirds (65% or 24.5 million) of all people living with HIV globally and include some of the highest prevalence countries in the world. Most are in sub-Saharan Africa (21 of 25); the others are in Latin America and the Caribbean (2), Asia (1), and Eastern Europe and Eurasia (1). Adult HIV prevalence in these countries ranges from 0.3% (in Vietnam) to 27.1% (in Eswatini), with four countries having prevalence rates exceeding 15% (South Africa, Botswana, Lesotho, and Eswatini). See Figure 1.
  • The majority of COP countries (16 of 25) are at, or near, epidemic control, as defined by PEPFAR. Twelve COP countries have reached epidemic control (new infections and deaths are low and declining, and new HIV infections are below the total number of deaths from all causes among HIV-infected individuals), while four countries are near that point (new infections and deaths are low and declining, but new infections are not yet lower than deaths). The remaining nine countries are not yet near epidemic control (infections and deaths remain high, and new infections are not lower than deaths).2  See Figure 1.
  • COP countries range on their progress toward global viral suppression targets, with a third having reached the global target set for 2020. Across COP countries, the share of people with HIV who are virally suppressed ranges from 16% (in South Sudan) to 93% in Eswatini. In twelve countries, two-thirds or more are virally suppressed, including eight that have reached or exceeded the UNAIDS 73% viral load suppression target originally set for achievement by 2020. One country (Eswatini) has already surpassed the UNAIDS 86% viral load suppression target for achievement by 2025. See Figure 1.
PEPFAR COP Countries - Epidemic Control Status, HIV Prevalence, and Viral Suppression Indicators

Progress Toward Minimum Program Requirements

Minimum program requirements (MPRs) set by PEPFAR are considered essential policies and practices that must be in place in order to ensure the success of the program, including progress toward reaching and sustaining epidemic control. As stated in the current COP guidance, “evidence demonstrates that lack of any one of these policies/practices significantly undermines progress toward reaching and sustaining epidemic control and results in inefficient and ineffective programs.” There are currently 16 MPRs, including one that was added this year (see Box 2).

Box 2: PEPFAR’s Minimum Program Requirements (MPRs)

Care and Treatment (5 MPRs):

1. Adoption and implementation of Test and Start, with immediate >95% linkage to treatment

2. Rapid optimization of antiretroviral therapy (ART) for adults and children

3. Adoption and implementation of differentiated service delivery models (DSD) for all clients with HIV, including six-month multi-month dispensing (MMD)

4. All eligible PLHIV, including children and adolescents, should complete tuberculosis (TB) preventive treatment (TPT)

5. Completion of Diagnostic Network Optimization (DNO) activities for viral load and early infant diagnosis, TB, and other coinfections, and ongoing monitoring to ensure reductions in morbidity and mortality

Case Finding (1 MPR):

6. Scale-up of index testing and self-testing, ensuring consent procedures and confidentiality are protected and assessment of intimate partner violence (IPV) is established

Prevention and Orphans and Vulnerable Children (OVC) (2 MPRs):

7. Direct and immediate assessment for and offer of prevention services, including pre-exposure prophylaxis (PrEP), to HIV-negative clients found through testing in populations at elevated risk of HIV acquisition

8. Alignment of OVC packages of services and enrollment to provide comprehensive prevention and treatment services to OVC ages 0-17

Policy & Public Health Systems Support (8 MPRs):

9. Demonstrate evidence of progress toward advancement of equity, reduction of stigma and discrimination, and promotion of human rights to improve HIV prevention and treatment outcomes for key populations, adolescent girls and young women, and other vulnerable groups (new target added this year)

10. Elimination of all formal and informal user fees in the public sector for access to all direct HIV services and medications, and related services

11. Assure program and site standards, including infection prevention & control interventions and site safety standards, are met by integrating effective Quality Assurance (QA) and Continuous Quality Improvement (CQI) practices into site and program management

12. Evidence of treatment literacy and viral load literacy activities supported by Ministries of Health, National AIDS Councils and other partner country leadership offices with the general population and health care providers regarding Undetectable = Untransmittable (U=U) and other updated HIV messaging to reduce stigma and encourage HIV treatment and prevention

13. Clear evidence of agency progress toward local partner direct funding, including increased funding to key populations-led and women-led organizations

14. Evidence of partner government assuming greater responsibility of the HIV response including demonstrable evidence of year after year increased resources expended

15. Monitoring and reporting of morbidity and mortality outcomes including infectious and non-infectious morbidity

16. Scale-up of case surveillance and unique identifiers for patients across all sites

SOURCE: PEPFAR, PEPFAR 2022 Country and Regional Operational Plan (COP/ROP) Guidance for all PEPFAR-Supported Countries, Jan. 2022.

We looked at the status of progress toward the 16 MPRs in PEPFAR COP countries, based on what was reported by countries in the PLLs (although specific criteria used for measuring progress were not provided in these documents).

  • While progress toward meeting MPRs is underway, no COP country has completed all 16. Only four countries (Zambia, Malawi, Zimbabwe, and Kenya) have completed more than half of the MPRs, with Kenya having completed the most (12). The average number completed is five. Eleven countries have completed a quarter or less. Completion rates ranges from 6% to 75%. See Figure 2.
  • Certain MPRs have higher completion rates, with implementation of test & start and elimination of user fees at the top, while increased domestic funding from partner governments is at the bottom. Most countries (19, or 76%) have adopted and implemented test & start efforts,3  sixteen (64%) have eliminated user fees,4  and fourteen (61%) have aligned their services for orphans and vulnerable children (OVC) with PEPFAR standards.5  On the other end of the spectrum, only three countries have met the MPR to scale up case surveillance and unique patient identifiers, and no country has yet met the requirement to demonstrate that it is assuming greater responsibility for its HIV response including “demonstrable evidence of year after year” increased domestic resources. For the new MPR introduced this year, focused on demonstrating that there is progress toward advancing equity, reducing stigma and discrimination, and promoting human rights, three countries reported that they have completed this measure. See Figure 3.

See Appendix for more detail.

PEPFAR COP Countries - Share of Minimum Program Requirements (MPRs) Completed
Status of PEPFAR Minimum Program Requirements (MPRs) Across PEPFAR COP Countries

HIV Funding Landscapes & Sustainable Financing

Financing will be a central component of sustained epidemic control. To that end, we examined the funding landscapes in COP countries, looking at the size of national HIV budgets, funding sources (including the extent to which COP countries rely on external financing), the share of resources provided to local partners, and the larger economic environment.

  • National HIV budgets in COP countries vary significantly in size and in funding per person living with HIV. National HIV budgets, from all sources, range from $35.0 million in Burundi to $2.4 billion in South Africa in 2020. HIV funding per person living with HIV ranges from $147 in Angola to $1,003 in Haiti (the average is $446). See Figures 4 and 5.
  • Across COP countries, PEPFAR accounts for the largest share of national HIV budgets (46%). The next largest share is domestic governments (29%), followed by the Global Fund to Fight AIDS, Tuberculosis and Malaria (22%). PEPFAR funding ranges from less than a fifth of the HIV budget in Angola (13%) to three-quarters in Zambia (75%). See Figure 4.
  • Most COP countries are dependent on external financing for their HIV response. In 19 countries, donors provided the majority of HIV funding in 2020, including 10 in which PEPFAR alone provided most funding. Only six countries (Angola, Botswana, Dominican Republic, Namibia, South Africa, and Vietnam) financed the majority of their own HIV response. In 17 COP countries, the country government contribution accounts for less than a quarter of the national HIV budget. As mentioned above, no COP country has yet met the MPR to demonstrate increased domestic resources for HIV from the country government. See Figure 4.
  • In FY 2022, only six COP countries have met or exceeded PEPFAR’s goal to channel 70% of new PEPFAR funding to local partners, a goal intended to support country ownership and local capacity building. The six are Botswana and Uganda (75%), South Africa (76%), Nigeria (77%), and Kenya and Rwanda (90%). The majority of COP countries (14) have directed less than half of new funding to local partners. Overall, 55% of new funding across COP countries is being channeled to local partners, ranging from 2% in South Sudan to 90% in Kenya and Rwanda. See Figure 6.
HIV Funding Landscape in PEPFAR COP Countries, by Funder (%), 2020
PEPFAR COP Countries - Average HIV Funding Per Person Living with HIV, 2020
Progress Toward PEPFAR Goal of Directing 70% of Funding to Local Partners by PEPFAR COP Country, FY 2022

Health Systems Strengthening

One of the main goals of the COP process this year is to “build enduring capabilities” including “resilient and capacitated country health systems.” While standardized country-level data on health systems are not readily available, we looked at how the PLLs address and assess health system strengthening in COP countries, focusing specifically on key challenges or strategic priorities raised regarding supply chains, laboratory networks, data systems, and the health workforce. We also looked at how the PLLs address sustainability planning.

  • Supply Chains: In half of COP countries, PLLs identify supply chain issues as key challenges, ranging from challenges with data systems to commodity stockouts. In ten countries,6  including Cameroon, Kenya, and Zimbabwe, persistent stockouts and commodity shortages, often influenced by the COVID-19 pandemic and inadequate funding for supply chain systems, are raised as key challenges.7  Additionally, in other countries, such as for Uganda and Namibia, the governments are called upon to take greater ownership of their supply chain systems and reduce their dependency on PEPFAR as either key challenges or elsewhere in the PLLs. Other issues identified broadly in the PLLs are allocating sufficient resources for procurement and planning for safe collection and disposal of pharmaceutical waste.
  • Laboratory Networks: Building stronger laboratory networks and systems is raised in eight countries as a key challenge.8  Equipment breakdowns and delays in testing results were also mentioned in seven countries as key challenges.9  Another key challenge cited is limited laboratory capacity, especially as testing networks were utilized to address the COVID-19 pandemic. For example, the Burundi PLL notes that laboratory reagents were used for both HIV and COVID-19 testing, constraining the country’s testing capacity. For the related MPR, diagnostic network optimization, seven countries report completion, and 17 report it as “in process.”
  • Data Systems: Improving data systems, such as to strengthen the ability of country governments to monitor epidemiological data and assess patient-level outcomes, was mentioned in nearly all COP countries as a key challenge. Various data quality and availability issues were identified in country PLLs, including interoperability - the ability to exchange and use information - between facilities (seven countries);10  directives to implement or improve electronic medical records (six countries);11  and improved population-based estimates (seven countries).12  For example, the Burundi PLL identifies the lack of interoperability between data systems as well as delays in data availability as a key challenge. The Kenya PLL identifies the lack of unique identifiers for patient-level data as a key challenge that may result in Kenya’s program having high levels of patient transfers and re-tests. Only three countries report completing the related MPR, which addresses implementing unique patient identifiers and scale-up of case surveillance.
  • Health Workforce: Most countries’ PLLs highlight rightsizing, aligning, or integrating human resources for health (HRH) in coordination with country governments and other stakeholders as a key challenge. For example, the Malawi PLL recommends “prioritizing the judicious allocation of HRH with” the country government and directs the country team to “identify HRH requirements based on expected future adjustments to maintain HIV service delivery and utilize this to inform transition or absorption of PEPFAR-supported staff.” Likewise, the Eswatini PLL recommends aligning and merging PEPFAR human resources support with the country government’s health care workforce architecture. There are also recommendations in many PLLs, especially for countries at or nearing epidemic control (such as the Kenya and Zimbabwe PLLs), to review data to ensure optimal and efficient staffing, to plan for lesser reliance on a PEPFAR-supported health workforce in the future, and to facilitate discussion of the workforce with the government or alignment of support with the Global Fund. Other PLLs highlight HRH challenges related to limited capacity. For example, the South Sudan PLL discusses human resource capacity limitations as a key challenge, while the Ethiopia PLL identifies the displacement and loss of health care workers due to conflict in certain regions of the country as a key challenge. OGAC reports that PEPFAR teams have collected data through a new HRH inventory for each country, which may help inform these efforts going forward, and PLLs for seven countries13  specifically mention this inventory in a technical directive and direct country teams to review these data to ensure optimal staffing levels.
  • In six COP countries,14  the PLLs specifically call for the development of sustainability or transformation plans. For instance, Rwanda’s PLL asks for the program, along with the country government, to begin developing a framework for local entities to assume greater responsibility for its HIV services, while the Botswana PLL says the country team should “develop a plan with the GoB [Government of Botswana], multilaterals, and local partners that establishes milestones and a path for a staged shift in responsibilities.” Similarly, the Eswatini PLL directs the country team to “begin formal discussions and mapping of [the] pathway to sustainability of the national HIV response” and to “disarticulate technical and programmatic sustainability from financial.”
  • Other PLLs address sustainability issues and planning in a broader manner. For example, the Dominican Republic PLL identifies building political will, removing barriers to services, and prioritizing HIV services as among its key challenges, while the Kenya PLL says, “Now that Kenya overall is at epidemic control, the program approach should be examined to: 1) center the strategy around sustainability in every aspect of the program and 2) tailor the strategy to reach the last mile at the county-level and for all populations.” Likewise, the Zambia PLL recommends that the country team “work with the Government of Zambia to ensure alignment in the vision to jointly sustain impact on the HIV epidemic” and it also suggests that the country team should “support Zambia’s public health approach and platform to strengthen primary care.”

Key and Other Vulnerable Populations & Stigma and Discrimination

PEPFAR has placed increasing emphasis on the importance of addressing structural barriers (including in the legal and policy environment), focusing on equity and human rights challenges for key populations (sex workers, gay men and other men who have sex with men, transgender people, people who inject drugs, and people in prisons), and closing the gaps for other vulnerable populations (including women and girls, and young people). These are major themes in this year’s COP guidance, including a new gender equality section and a new MPR. We analyzed the PLLs to assess key challenges identified in countries and also looked at the legal and policy environments in COP countries.

  • The PLLs frequently identify addressing gaps for children and adolescent girls and young women (AGYW) as a key challenge, with nearly all (22)15  highlighting prevention, testing, and treatment to reach these groups. For example, the Botswana PLL identifies “persistent gaps in case-finding, linkage, treatment, and viral load coverage/suppression for pediatric and adolescent people living with HIV,” the Malawi PLL identifies maintaining enrollment in DREAMS as well as case finding and treatment efforts for adolescents, and the Mozambique PLL identifies similar challenges for children and youth treatment as well as prevention efforts for AGYW. Gender-based violence is mentioned in 4 PLLs,16  and it is highlighted as an important component of DREAMS programming in some cases. Though less of a focus, some PLLs highlight other groups of women, including pregnant and breastfeeding women (e.g., Cameroon, Ethiopia, and Tanzania) and adult women (e.g., the Democratic Republic of the Congo, Haiti, and Mozambique).
  • More than half of the PLLs highlight addressing gaps for key populations as a key issue, and nearly all have a technical directive focused on improving and expanding data in this area. For example, Uganda’s PLL specifically calls for addressing barriers to HIV prevention and treatment services among key populations, such as through community-based medication distribution and support services at drop-in centers. Additionally, nearly all (23)17  of the PLLs identify the lack of robust data on key populations and services provided to them as a barrier, impeding the ability to improve and scale up key population programming. These countries are directed to describe during the COP planning meetings how they will improve their approach to strengthening key population data systems and analyses and addressing structural and other barriers to accelerating services focused on key populations.
  • As the MPR related to equity, reducing stigma and discrimination, and promoting human rights is new this year, most countries (20) report it is still “in process,” and only a few specifically mention stigma and discrimination or human rights as key issues. Among the few that do are Uganda’s PLL, which flags increasing concern about stigma, discrimination, and human rights violations and addressing these barriers. Similarly, Cote d’Ivoire’s PLL mentions stigma remains high and that barriers must be addressed in order for vulnerable populations to access key services. The PLLs of three COP countries (Cote d’Ivoire, Mozambique, and South Africa) report they have been selected for participation in a stigma and discrimination pilot effort, known as the focal countries’ collaboration, that involves the Global Fund, UNAIDS, and PEPFAR. The collaboration is intended to help countries to address stigma and discrimination over three to five years and will support these countries to “focus on removal of societal, including legal barriers (specifically stigma, discrimination, punitive policy environments, and violence) that limit access to or utilization of HIV services.”
  • Many COP countries have legal and policy barriers that may present challenges to reaching and supporting key populations in accessing HIV services. This is particularly notable in the case of sex work, which is criminalized in most COP countries (21). HIV transmission is criminalized in more than half (14), and drug use and possession as well as same-sex sexual acts are criminalized in almost half of the COP countries (11 each). See Figure 7.
Number of PEPFAR COP Countries by Status of Criminalization Policies

Community and Civil Society

PEPFAR’s inclusion of community and civil society has a long history and sets it apart from most other bilateral health programs. This year’s COP guidance calls on countries to include community and civil society in every stage of programming and planning to help promote sustainability as well as accountability. We examined how the COP PLLs addressed engagement of civil society and also looked at the legal and policy environment in COP countries regarding civil society participation.

  • The importance of engaging CSOs in order to improve PEPFAR programming, with particular emphasis on the role of community-led monitoring (CLM), is mentioned in all PLLs. This includes engaging with CSOs throughout the PEPFAR planning process (both during and outside the COP) and implementation. For example, some countries’ PLLs, such as for the Dominican Republic, emphasize the importance of defining the role of CSOs (as well as other stakeholders) in national strategic plans or other efforts, while others, such as for Cote d’Ivoire, direct PEPFAR programs to engage with CSOs to ensure sharing of best practices to improve alignment of health service delivery. Further, several PLLs, encourage programs to utilize CSOs to improve treatment continuity among patients as they help track and return them to care, like that of South Sudan, or to track and improve accountability for outcomes among pediatric patients, like that of Angola. As required, all PLLs include a section focused on CLM that calls for, among other things, the PEPFAR country program to support CLM funding.
  • The legal and policy landscape for civil society inclusion varies in COP countries, and there are limits in some cases. Fifteen COP countries allow for one or both of the following: 1) CSOs may freely register, seek funding, and operate, and 2) there is a mechanism for the government to finance them to provide health services.18  Of these 15 countries, only three – Botswana, the Dominican Republic, and South Africa – have adopted both policies, while 12 have adopted one policy only. The remaining nine have not adopted either policy. See Figure 8.
Number of PEPFAR COP Countries by Alignment Status of Civil Society Policies with International Standards

Conclusion

This analysis examines PEPFAR’s current vision for achieving sustained epidemic control, a priority focus for the program, by providing an initial look at how PEPFAR is currently defining and approaching sustained epidemic control at the country level. As it finds, the picture is multi-layered, and there is significant variation across countries and across several dimensions that are important for sustainability, including epidemiological (PEPFAR’s epidemic control target) but also financial and structural. It finds that all countries are making progress toward sustainability, with 12 having reached epidemic control and four making significant progress on the MPRs, reporting they completed at least half. Still, progress varies, and there are some areas, such as increasing domestic funding from partner governments, where progress is particularly lagging. In that area specifically, there may be new challenges ahead, as many PEPFAR countries continue to experience the economic effects of COVID-19, and there are rising inflationary pressures, which may limit their ability to provide additional domestic resources. Moreover, in many PEPFAR countries, there are structural barriers affecting access for key populations, which, while identified by PEPFAR as important for countries to address, may be especially hard to ameliorate. Going forward, better understanding how these markers of sustainability, such as epidemic control status, financial dependency, and MPR status, fit together may help to paint a clearer narrative of country progress. Some additional information about PEPFAR’s approach and progress toward sustained epidemic control may be forthcoming, as PEPFAR is expected to release the country team-prepared COPs, PEPFAR’s next five-year strategy, and multiyear sustainability roadmaps for many PEPFAR countries.19  In addition, discussions about PEPFAR’s next reauthorization are likely to begin later this year.

Appendix

PEPFAR COP Countries - Progress Towards Minimum Program Requirements (MPRs)
PEPFAR Minimum Program Requirements (MPR) Dashboard: Status as Reported in 2022 PEPFAR Planning Level Letters

Endnotes

  1. Although PEPFAR supports activities in more than 50 countries, the other countries fall under Regional Operational Plans (ROPs), which were not included in this analysis. ↩︎
  2. We simplified PEPFAR’s five category approach for epidemic control status used in this year’s COP guidance into three categories by classifying countries “at epidemic control with at least 73% viral load suppression” and countries “at epidemic control without at least 73% viral load suppression” as “at epidemic control”; maintaining PEPFAR’s “near epidemic control” category; and classifying countries “not at epidemic control but declining infections/mortality” and countries “not at epidemic control with increasing infections/mortality as “not at epidemic control.” ↩︎
  3. Test and start is a policy in which at least 95% of those who are identified as HIV positive are linked to antiretroviral treatment immediately upon testing. ↩︎
  4. This MPR relates to countries’ adoption and implementation of policies that eliminate fees at the point of care for direct HIV services and related services, such as antenatal care, TB, and cervical cancer in the public sector. ↩︎
  5. PEPFAR standards for the OVC program include facilitating testing for all children at risk for HIV, linking children living with HIV to treatment and case management, and reducing risk of sexual violence. The share of COP countries does not include COP countries where this OVC MPR is not applicable, namely, Angola and Vietnam. ↩︎
  6. These include Angola, Burundi, Cameroon, Cote d’Ivoire, the Dominican Republic, Kenya, Malawi, Tanzania, Ukraine, and Zimbabwe. ↩︎
  7. Additional COP countries may not cite commodity stockout or shortages issues as challenges or priority changes but may mention it elsewhere such as in explanations for not completing certain MPRs (e.g., Eswatini cites stockouts of antiretrovirals as a barrier to completing the MPR related to differentiated service delivery). ↩︎
  8. These include Burundi, Democratic Republic of the Congo, Eswatini, Haiti, Angola, Mozambique, Nigeria, and Tanzania. ↩︎
  9. These include Burundi, Cote d’Ivoire, Mozambique, Nigeria, Tanzania, Zambia, and Zimbabwe. Additional COP countries may not cite laboratory equipment breakdowns or delays in testing results as major challenges or key issues but rather as explanations for not completing certain MPRs. For example, in Haiti, equipment failures and increased turnaround times for viral load samples, among other issues, are cited as barriers to completing the MPR related to diagnostic network optimization. ↩︎
  10. These include Botswana, Burundi, Cote d’Ivoire, Lesotho, Mozambique, Uganda, and Vietnam. Additional countries, such as Eswatini and South Africa, mention interoperability in their MPR explanations. ↩︎
  11. These include Botswana, Dominican Republic, Lesotho, Malawi, Uganda, and Zambia. Additional countries, such as Cameroon and Uganda, mention this in their MPR explanations. ↩︎
  12. These include the Democratic Republic of the Congo, the Dominican Republic, Lesotho, Mozambique, Nigeria, South Africa, and Uganda. ↩︎
  13. These include those of Cote d’Ivoire, Lesotho, Malawi, Namibia, South Africa, Uganda, and Zimbabwe. ↩︎
  14. These include those of Botswana, Eswatini, Lesotho, Rwanda, Tanzania, and Uganda. ↩︎
  15. These include Angola, Botswana, Burundi, Cameroon, Cote d’Ivoire, the Democratic Republic of the Congo, the Dominican Republic, Eswatini, Ethiopia, Haiti, Kenya, Lesotho, Malawi, Mozambique, Nigeria, Rwanda, South Africa, South Sudan, Tanzania, Uganda, Zambia, and Zimbabwe. ↩︎
  16. These include the Cote d’Ivoire, Eswatini, Ethiopia, and Haiti PLLs. ↩︎
  17. These include Botswana, Burundi, Cameroon, Cote d’Ivoire, the Democratic Republic of the Congo, Eswatini, Ethiopia, Haiti, Kenya, Lesotho, Malawi, Mozambique, Namibia, Nigeria, Rwanda, South Africa, South Sudan, Tanzania, Uganda, Ukraine, Vietnam, Zambia, and Zimbabwe. In the case of the Dominican Republic, its PLL discusses the lack of robust data on focus clients (“FC”) services, which refers to “migrants of Haitian origin living in the Dominican Republic and their descendants.” ↩︎
  18. KFF analysis of data from the HIV Policy Lab, “S10 - Civil society,” accessed April 25, 2022, https://www.hivpolicylab.org/policy/S10. ↩︎
  19. Key among these will be six COP countries (Botswana, Eswatini, Kenya, Lesotho, Namibia, and Uganda) identified as “Sustaining Impact Operating Units (OUs)” during the 2022 COP planning process that are expected to release sustainability roadmaps later this year. ↩︎
News Release

Abortion Access Rises as a Voting Issue and Motivator, Especially Among Democrats and Reproductive-Age Women, But Inflation Continues to Dominate as Americans Worry About Bills

Large Majorities of Democrats, Independents and Women of Reproductive Age Want Their State to Guarantee Access to Abortion, while a Slim Majority of Republicans Want Their State to Ban It

Published: Aug 2, 2022

Following the Supreme Court’s decision to end the constitutional right to an abortion, most voters (55%) now say access to abortion is “very important” to their vote in November’s midterm elections, up 9 percentage points since February prior to the decision, a new KFF Health Tracking Poll finds.

This heightened interest is greatest among key voter groups who largely want to guarantee access to abortion, including Democratic voters (77% now say abortion access is very important, up from 50% in February), Democratic women voters (82%, up from 55%), and women voters under 50 years old (73%, up from 59%).

At the same time, fewer Republican women voters say access to abortion is very important to their vote now than in February (44%, down from 60%), perhaps a sign that the Supreme Court’s recent decision made the issue less salient for a group who largely want to restrict abortion.

While abortion has become a more salient issue for certain voting groups, and while economic issues dominate, the poll suggests that the Supreme Court decision’s impact on the 2022 midterm elections could have an impact at the margins.

“Lower-turnout midterm elections can be a game of inches, and abortion could make a difference, especially if gas prices continue to fall,” KFF President and CEO Drew Altman said. “It’s motivating a lot of younger women to vote, and most Democrats, half of independents and even some Republicans plan to vote for candidates who support abortion access.”

For example, just over half of voters (54%) say the decision in the Dobbs v. Jackson Women’s Health Center overturning Roe v. Wade has made them “more likely” to consider a candidate’s position on abortion when deciding whom to vote for, while few (3%) say it has made them “less likely” to do so.

This includes large majorities of Democratic voters (72%), Democratic women voters (72%), and women voters under 50 (64%) who say the overturn of Roe has made them “more likely” to consider a candidate’s position on abortion.

In addition, when asked about the decision’s impact on their motivation to vote, 43% of all voters say it has made them “more motivated,” a slight uptick compared to a similar question in May (37%) before the Court’s ruling but after the draft opinion leaked. This includes nearly two thirds of Democrats (64%), four in 10 independents (41%), and a fifth of Republicans (20%). The vast majority (82%) of those who are more motivated say they plan to vote for candidates who will protect abortion access.

Some groups saw a larger boost in motivation, including reproductive-age women. Now 61% of this group says the decision makes them more motivated to vote, up 19 percentage points from May (42%). Again, the vast majority (88%) of the motivated group plans to vote for candidates who will protect access.

While some of these findings suggest abortion could play a larger role in this year’s midterms, voters overall continue to prioritize inflation, including gas prices, as their top voting issue.

Three-quarters (74%) of voters say inflation, including rising gas prices, will be “very important” to their vote. Abortion access (55%) ranks in a second tier with gun violence (57%) and health care costs, including prescription drug costs (55%).

One reason inflation and gas prices may sit atop voters’ priorities is because most people are worried about their ability to afford routine household expenses.

This includes three quarters (76%) who say they are at least somewhat worried about paying for gasoline or other transportation costs. Somewhat smaller majorities say they worry about affording unexpected medical bills (64%), their monthly utilities like electricity and heat (62%), and food (61%).

Post-Roe, Most Adults Want Their State to Guarantee Abortion Access Rather than Ban It

The Supreme Court’s decision in Dobbs allows states to make laws about abortion in their state. The new survey finds that most (61%) of the public says they want their state to guarantee access to abortion, while a quarter (25%) want their states to ban it.

Those who favor state action to protect abortion access includes large majorities of Democrats (83%), independents (65%), and women of reproductive age (68%). In contrast, just over half (54%) of Republicans want their states to ban abortion.

There are 17 states that already have laws on the books that ban abortion, either from before Roe or from more recent “trigger” laws anticipating Roe’s end. About half (51%) of those living in states that have or are anticipated to ban abortion soon say they want their states to protect access to abortion, compared to a third (32%) that want their state to ban it.

About two thirds (68%) of women under 50 want their state to guarantee access to abortion. This includes large majorities of Democratic (82%) and independent (74%) women in that age group, though about half (48%) of Republican women in that age range want their states to ban abortion.

Other findings include:

  • Two thirds (65%) of the public disapprove of the Supreme Court decision overturning Roe. Most Democrats (90%) and independents (72%) disapprove of the decision, while most Republicans (71%) approve of it.
  • Most (83%) Democratic voters say they plan on voting for a candidate who wants to protect access to abortion, as do a narrower majority (56%) of independent voters. Half of Republicans voters (51%) plan on voting for a candidate who wants to limit abortion access, though one in five (20%) plan to vote for a candidate who wants to protect access.
  • While most Republican women share their party’s views on abortion, a third (34%) disapprove of the Court’s decision overturning Roe. A quarter (25%) of Republican women voters say they plan to vote for a candidate who wants to protect access to abortion.
  • In the 17 states that have abortion bans on the books, nearly three quarters (73%) of residents are aware that abortion has or will soon be banned. In 16 states and the District of Columbia that have laws protecting the right to abortion, a similar share (72%) is aware that abortion will remain legal in their states.

Designed and analyzed by public opinion researchers at KFF, the Health Tracking Poll was conducted from July 7-17, 2022, online and by telephone among a nationally representative sample of 1,847 U.S. adults in English and Spanish. The margin of sampling error is plus or minus 4 percentage points for the full sample. For results based on subgroups, the margin of sampling error may be higher.

Poll Finding

KFF Health Tracking Poll July 2022: Inflation Tops Voters’ Priorities, But Abortion Access Resonates For Key Voting Blocs

Authors: Ashley Kirzinger, Shannon Schumacher, Mayesha Quasem, Mellisha Stokes, and Mollyann Brodie
Published: Aug 2, 2022

Findings

Key Findings:

  • In the wake of the Supreme Court decision on Dobbs v. Jackson Women’s Health Center to overturn Roe, abortion access has become salient among key voting groups, including the population most impacted by abortion restrictions – women between the ages of 18 and 49. Among this population, there has been a fourteen percentage point increase in the share who say abortion will be “very important” to their 2022 midterm vote (59% in February to 73% in July). In addition, six in ten women voters between 18 and 49 now say they are “more motivated” to vote because of the Supreme Court’s decision (up 19 percentage points from May when the question was asked about a scenario in which Roe was overturned based on a leaked draft opinion). The vast majority (88%) of the more motivated group of women voters between 18 and 49 say they plan on voting for candidates who will protect access to abortions.
  • While abortion is a motivating issue for some groups of voters, the issue still trails inflation and gas prices (74%) as the top voting issue overall. Abortion ranks alongside other top tier issues include gun control (57%), an issue on which Congress just recently passed legislation, and health care and prescription drug costs (55%), an issue that has been debated for the past several months and has gotten recent attention by Democratic lawmakers. With inflation and gas prices as the top issue overall, and for most voting groups, it is perhaps unsurprising that the share of adults who are worried about affording household expenses has increased since the beginning of the pandemic and over the past four months in particular, with the largest increases in affording basic living expenses like food (up 14 percentage points), utilities (up 12 percentage points), and mortgage or rent (up 8 percentage points). In the past two years, the share who are worried about being able to afford gas or other transportation costs has nearly doubled, growing from 40% in February 2020 to 76% in July 2022.
  • Two-thirds of the public (65%) disapprove of the Supreme Court decision on Dobbs v. Jackson Women’s Health Center that overturned Roe and allows individual states to decide the legality of abortion access within each state. In addition, most adults (61%) – including majorities of Democrats, independents, women between the ages of 18 and 49, and about half of those living in states with pre-Roe abortion bans or trigger laws – say want the laws in their state to guarantee access to abortion. About a quarter of the public, including more than half of Republicans (54%) say they want the laws in their states to ban abortions.

In Wake Of Supreme Court Decision, Looming Uncertainty About The Legality of Abortion Access In States

Less than one month after the U.S. Supreme Court overturned Roe v. Wade, nearly eight in ten (78%) U.S. adults are aware of the decision and only a small share (5%) incorrectly say that Roe v. Wade is still law. Still, about one in five (18%) U.S. adults say they are not sure whether the 1973 ruling that established a woman’s constitutional right to an abortion is still the law of the land, including 18% of women ages 18-49, the group most directly affected by the ruling. Awareness of the Dobbs decision is high among Democrats, Republicans, and independents but there is a difference by age. Young adults ages 18-29, who have lived their whole lives until recently with a constitutional right to abortion, are the group most likely to say they are “not sure” whether abortion access is still guaranteed: about three in ten (27%) say they are not sure, and a small share (6%) from this group also incorrectly say Roe is still in effect.

Groups previous KFF research has identified as disproportionately impacted by the overturning of Roe are the most likely to say they are not sure if a woman still has a constitutional right to an abortion. Nearly four in ten Hispanic adults (38%) and nearly three in ten (27%) Black adults say they are not sure about the status of Roe, compared to about one in ten (11%) White adults. Similarly, adults with incomes of less than $40,000 a year are more likely to say they are not sure (32%) that Roe v. Wade has been overturned by the Supreme Court than those with higher household incomes (8%), There is a similar gap between those with (5%) and without a college degree (24%) who say they are not sure. When it comes to incorrectly stating that Roe is still the law of the land, there are no significant differences among income and education groups.

One In Five Unsure If Roe Overturned

While a large majority of the public is aware that Roe v. Wade has been overturned, the confusion over the ruling is further reflected in people’s lack of certainty over whether abortion is currently or will soon be banned in their state. About one-fifth of people living in states with trigger laws or pre-abortion bans say they are “not sure” whether abortion is currently or will be banned, or not, in their state. This is similar to the share of those living in states with abortion protections who also say they are “not sure” about whether abortion will be allowed in their states. At least seven in ten are aware that either abortion is or currently will be banned in their state (73%) or that abortion will not be banned in their state (72%).

One-Fifth Of Adults, Regardless Of Their States' Current Abortion Laws, Are Not Sure Whether It Will Be Allowed

Most Disapprove Of Supreme Court Decision, Want States To pAss Laws Guaranteeing Access To Abortions

Two-thirds of the public disapprove of the Supreme Court decision overturning Roe v. Wade and giving states the ability to determine the legality of abortion within each state. Partisanship plays a strong role in attitudes, with nine in ten Democrats and seven in ten (72%) independents saying they disapprove of the Supreme Court’s decision, while seven in ten (71%) Republicans approve. Majorities across gender and racial and ethnic groups also disapprove of the Supreme Court’s decision.

Two-Thirds Disapprove Of Supreme Court Decision Overturning Roe, Including Large Majorities Of Women 18-49

Now that abortion access is up to state law, six in ten (61%) U.S. adults say they want the laws in their state to guarantee abortion access. This is more than twice the share who say they want the laws in their state to ban abortion (25%). Large majorities of Democrats (83%), independents (65%), and women ages 18-49 (68%) say they want their state to pass laws guaranteeing access to abortions. On the other hand, more than half of Republicans (54%) say they want the laws in their state to ban abortion, while about a third (37%) say they want the laws in their state to guarantee access.

Half (51%) of those living in states with abortion bans or trigger laws in place say they want their state to guarantee abortion access, while one-third (32%) say they want abortions to be banned. In states where abortion access is protected, seven in ten (68%) support laws guaranteeing abortion access and one in five (22%) want the laws in their state to ban abortion. Overall, about one in eight (13%) say they don’t want their state to pass laws banning abortion nor do they want their state to pass laws guaranteeing abortion access.

Most Want Their States To Pass Laws Guaranteeing Abortion Access, Half Of Republicans Want Their State To Pass Laws Banning Abortion

Voting Issues In the Midterm Election

Inflation and rising gas prices take the top spot for voters when thinking about their midterm vote this fall, with three-quarters (74%) of registered voters saying inflation and gas prices are “very important” to their midterm vote. Abortion access (55%) is clustered with two other issues making up a second tier, including gun violence (57%) and health care and prescription drug costs (55%). Less than half of voters rank the other issues as “very important,” including the federal budget deficit (46%), climate change (39%), the COVID-19 pandemic (33%), and the war in Ukraine (28%).

Nearly All Voters Say Inflation And Rising Gas Prices Are Important To Their Midterm Vote, Other Issues Also Seen As Important By Majorities

Among all the issues polled, gun violence and abortion access rank highest among Democratic voters, with about eight in ten saying each is “very important” to their vote. Nearly nine in ten (89%) Republican voters say inflation and gas prices are “very important” when considering who to vote for this November, 29 percentage points higher than Democrats. Inflation and gas prices are also the top issue for independents, with more than three-fourths (77%) saying it is “very important” to their vote.

Partisans Disagree On Top Issues For Midterms, With Democrats Prioritizing Gun Violence And Abortion Access, While Republicans And Independents Prioritize Inflation

Abortion Access As A Voting Issue

Following the release of the Dobbs decision, the importance of abortion access as a midterm voting issue has increased somewhat for voters. In a shift from polling before the Roe decision, a slight majority (55%) say abortion access is important to their vote, up from 46% in February. This increase is especially prevalent among key constituencies: Democrats, Democratic women, and all women voters ages 18 to 49 –  groups that largely want states to guarantee access rather than ban access. In February, half (50%) of Democrats said it was a top issue, but now, about three in four (77%) say so. Similarly, back in February, 55% of Democratic women voters said it was an important issue compared to 82% now. Three in four women of reproductive age also now cite abortion access as a very important issue to their vote, compared to 59% in February before the Dobbs decision.

Although abortion is now a more salient issue among women voters 18-49, like many other groups surveyed, inflation and gas prices also top the list of concerns for this group heading into the midterms, with 76% saying it is very important to their vote. On the other hand, six in ten Republican women voters of all ages said abortion was a “very important” voting issue for them in February, and now 44% say the same about abortion access. This change may reflect that the overturn of Roe makes “abortion” no longer a pressing issue for this group of voters, or that this group may not view “abortion access” as a very important issue.

As Abortion Becomes More Important For Democratic Voters, Democratic Women Voters, and Women 18-49; The Issue Drops In Salience For Republican Women Voters

Majorities of women of reproductive age, across partisans, say abortion is important to their vote with at least half saying it is “very important.” More than eight in ten (84%) Democratic women between the ages of 18 and 49 say abortion access is “very important” in deciding who they will vote in the fall, as do nearly three-fourths of independent women voters of the same age group. Access to abortion ranks lower for Republican women under 50, but still half say the issue is “very important.” While the issue certainly resonates more with women, majorities of all voters 18-49 across partisans say abortion access will be at least somewhat important to their midterm vote.

Large Majorities Of Women Ages 18-49 Across Partisans Say Abortion Access Is Important To Fall Vote

Overall, about half of voters (54%) say the Supreme Court decision overturning Roe v. Wade has made them “more likely” to consider a candidate’s position on abortion when deciding which candidate to vote for while 3% say it has made them “less likely” and four in ten (42%) say it has not made a difference. Large majorities of Democratic voters (72%), Democratic women voters (72%), and women voters between the ages of 18 and 49 (64%) – all groups of which large majorities disapprove of the Supreme Court’s decision – say the decision has made them “more likely” to consider a candidate’s position on abortion.

Majorities of Democratic Voters, Women Voters 18-49, And Black And Hispanic Voters Say Supreme Court Decision Makes Them More Likely To Consider Candidate's Position On Abortion When Voting

The latest KFF poll finds a slight uptick in the share of voters who say the decision has made them “more motivated” to vote, compared to a similar question asked prior to the final decision (but after a draft was leaked) that asked whether they would be more motivated if Roe was overturned. Forty-three percent of voters now say the Supreme Court decision overturning Roe v. Wade has made them “more motivated” to vote (compared to 37% back in May). About half (53%) continue to say the decision has “not made a difference” in their motivation to vote. There are large upticks are among Democratic voters (64% compared to 55%), and there is a nearly twenty percentage point increase among women voters ages 18-49. Six in ten (61%) women voters 18-49 say the decision has made them “more motivated” to vote, compared to four in ten (42%) back in May.

Six In Ten Women Voters 18-49, Say They Are Now More Motivated To Vote After Roe Overturn

The Supreme Court decision did not have a significant impact on voters’ preference on candidates they plan to vote for in the midterm elections. Eight in ten Democratic voters (83%) say they plan on voting for a candidate who wants to protect access to abortion (similar to 79% in May) as do 56% of independent voters (54% in May), while half of Republicans voters (51%) say they plan on voting for a candidate who wants to limit abortion access (56% in May). The vast majority of all voters who say they are more motivated to vote (82%) as well as women voters 18-49 who are more motivated (88%) say they plan to vote for candidates who will protect abortion access. The share of women 18-49 who say they plan on voting for a candidate who wants to protect abortion access increased 10 percentage points, from 60% to 70%.

Large Majority Of Democratic Voters And More Than Half Of Independent Voters Say They Plan On Voting For Candidates Who Want to Protect Abortion Access; Republican Voters More Divided On How Candidate's Abortion Views May Impact Vote

How Do Republican Women Feel About Supreme Court Decision And Abortion Access?

The recent Supreme Court decision and state actions on abortion restrictions have split Republican women into two groups: a larger group who support the Court’s decision and want abortion to be restricted, and a smaller, yet substantial, share who disapprove of the decision to overturn Roe and want their states to guarantee access to abortion.

Two-thirds of Republican women approve of the Supreme Court’s decision overturning Roe and about half of Republican women (51%) say they want laws in their states to ban abortion. On the other hand, one-third of Republican women disapprove of the Court’s decision and four in ten (41%) say they want the laws in their states to guarantee access to abortion.

About one in four (23%) Republican women voters say they are now more motivated to vote in the 2022 midterm election which is similar to the share (25%) who say they plan on voting for a candidate who wants to protect access to abortion. More than half (56%) of Republican women voters say they plan on voting for a candidate who wants to limit access to abortions and 17% say a candidate’s position on abortion does not make a difference in their vote.


Cost Of Gasoline Tops Public’s Economic Worries, Areas For Desired Government Action

As concerns about inflation and gas prices top voters’ priorities for the 2022 midterm election, the majority of adults in the U.S. say they are at least somewhat worried about affording a variety of household expenses. Three in four adults (76%) say they are either “very worried” or “somewhat worried” about being able to afford gas and other transportation costs. More than six in ten adults also say they are “very worried” or “somewhat worried” about affording unexpected medical bills (64%), their monthly utilities like electricity and heat (62%), and food (61%). Half say they are worried about affording their mortgage or rent (51%), and four in ten or more are worried about affording health care expenses like their health insurance deductibles (48%), prescription drugs (46%), and health insurance premiums (40%).

Most Adults Worried About Affording Household Expenses Like Gas, Utilities, and Food

The share of adults who are worried about affording household expenses has increased since the beginning of the pandemic and over the past four months in particular, with the largest increases in affording basic living expenses like food (up 14 percentage points), utilities (up 12 percentage points), and mortgage or rent (up 8 percentage points). In the past two years, the share who are worried about being able to afford gas or other transportation costs has nearly doubled, growing from 40% in February 2020 to 76% in July 2022.

Concerns About Affording Household Expenses Have Grown Over Time, While Worries About Health Care Costs Remain Steady

When asked to choose the area of the economy where they most want President Biden and Congress to take action, one in three adults (33%) say they want government action to address the rising cost of gas, while one in four prioritize addressing the rising cost of housing and rent (25%), and a similar share want federal attention on rising food prices (23%). Although gasoline costs are a top priority for adults across income groups, housing and food costs are more likely to be prioritized by lower-income households than those with higher incomes. More than a quarter of adults from households with less than a $40,000 annual income, as well as those in households earning between $40,000 and $89,999, say they want the federal government to address housing costs (31% and 28%), and at least one in five want federal attention on the cost of food (27% and 21%).

Rising Gas Costs Top Issue, But Similar Shares Of Lower Income Households Also Want Government To Address Housing And Food Costs

Republicans are about twice as likely as Democrats to say that the federal government should address the rising cost of gas (53% of Republicans vs. 23% of Democrats), while Democrats are twice as likely as Republicans to want Biden and Congress to focus on rising housing and rent costs (28% of Democrats vs. 13% of Republicans) and five times as likely to prioritize lowering the cost of health insurance (15% vs. 3%).

Half Of Republicans Want Federal Attention On Rising Gas Prices, While One In Three Democrats Prioritize Rising Housing Costs

Methodology

This KFF Health Tracking Poll/COVID-19 Vaccine Monitor Poll was designed and analyzed by public opinion researchers at the Kaiser Family Foundation (KFF). The survey was conducted July 7 - 17, 2022, online and by telephone among a nationally representative sample of 1,847 U.S. adults. Interviews were conducted in English (n=1760) and in Spanish (n=87). The sample includes 1,585 adults reached through the SSRS Opinion Panel either online (n=1545) or over the phone (n=40), including an oversample of parents with a child under age 5 (n=471) and parents with a child in another age group (n=757). The SSRS Opinion Panel is a nationally representative probability-based panel where panel members are recruited randomly in one of two ways: (a) Through invitations mailed to respondents randomly sampled from an Address-Based Sample (ABS) provided by Marketing Systems Groups (MSG) through the U.S. Postal Service’s Computerized Delivery Sequence (CDS); (b) from a dual-frame random digit dial (RDD) sample provided by MSG. For the online panel component, invitations were sent to panel members by email followed by up to 4 reminder emails.

Another 250 interviews were conducted from a random digit dial telephone sample of prepaid cell phone numbers obtained through MSG. Phone numbers used for the prepaid cell phone component were randomly generated from a cell phone sampling frame with disproportionate stratification aimed at reaching Hispanic and non-Hispanic Black respondents. Stratification was based on incidence of the race/ethnicity groups within each frame. The sample also included 12 respondents reached by calling back respondents that had previously completed an interview on the KFF Tracking poll.

The combined cell phone and panel samples were weighted to match the sample’s demographics to the national U.S. adult population using data from the Census Bureau’s 2021 Current Population Survey (CPS). Weighting parameters included sex, age, education, race/ethnicity, region, and education. The sample was also weighted to match patterns of civic engagement from the September 2017 Volunteering and Civic Life Supplement data from the CPS. The sample was also weighted to match frequency of internet use from the National Public Opinion Reference Survey (NPORS) for Pew Research Center.  The weights take into account differences in the probability of selection for each sample type (prepaid cell phone and panel). This includes adjustment for the sample design and geographic stratification of the cell phone sample, within household probability of selection, and the design of the panel-recruitment procedure.

The margin of sampling error including the design effect for the full sample is plus or minus 4 percentage points. Numbers of respondents and margins of sampling error for key subgroups are shown in the table below. Sample sizes and margins of sampling error for other subgroups may be higher and are available by request. Sampling error is only one of many potential sources of error and there may be other unmeasured error in this or any other public opinion poll. KFF public opinion and survey research is a charter member of the Transparency Initiative of the American Association for Public Opinion Research.

GroupN (unweighted)M.O.S.E.
Total1,847± 4 percentage points
Gender
Total women1,164± 5 percentage points
Total men672± 5 percentage points
Women, 18-49796± 6 percentage points
Parents
Parent with a child between 6 months and 4 years416± 8 percentage points
Parent with a child under age 5471± 8 percentage points
Parent with a child ages 5-11518± 7 percentage points
Parent with a child ages 12-17446± 8 percentage points
Race/Ethnicity
White, non-Hispanic774± 5 percentage points
Black, non-Hispanic485± 7 percentage points
Hispanic485± 7 percentage points
Party identification
Democrat713± 6 percentage points
Republican344± 8 percentage points
Independent485± 7 percentage points
Registered voters
Total voters1,544± 4 percentage points
Democratic voters648± 6 percentage points
Republican voters311± 8 percentage points
Independent voters384± 8 percentage points

What are the Implications of Long COVID for Employment and Health Coverage?

Author: Alice Burns
Published: Aug 1, 2022

Long COVID has been described as our “next national health disaster” and the “pandemic after the pandemic,” but we know little about how many people are affected, how long it will last for those affected, and how it could change employment and health coverage landscapes. This policy watch reviews what we know and outlines key questions to watch for regarding employment and coverage outcomes. We continue to follow the research on who is most at risk of long COVID and whether there are interventions that can reduce its incidence, length, or severity. The numbers are already daunting and infections continue to rise. The newest subvariant—BA.5— readily infects the vaccinated and people with prior immunity. Vaccines and prior immunity protect against severe illness and death, but it is unclear whether they protect against long COVID. One study of the VA health system found that the risks of long COVID increased with each subsequent reinfection.

Long COVID involves a range of potentially disabling symptoms and may affect 10 to 33 million working-age adults in the United States (Figure 1). Long COVID is not a single condition but rather “a wide range of new, returning, or ongoing health problems that people experience after first being infected with the virus that causes COVID-19,” according to the CDC. Patients report a wide range of physical and mental health conditions including malaise, fatigue, breathing challenges, cardiovascular abnormalities, migraines, and mental health impairments. There is no standard presentation of or treatment for long COVID. It is a new phenomenon and the ICD-10 code to identify medical claims only became available in October 2021. Also unknown is how long people with long COVID will remain ill, although one study reported that 29 percent of long COVID patients had self-reported symptoms for more than one year. The prevalence of long COVID is equally uncertain with studies finding that the percentage of working age adults with COVID who develop long COVID could be 10 percent, 20 percent, or 33 percent. If we conservatively assume 100 million working age adults have been infected, that implies 10 to 33 million may have long COVID.

Prevalence is Highly Uncertain but an  Estimated 10 to 35 Million Working-Age Adults May Have Long COVID

Preliminary evidence suggests there may be significant implications for employment: Surveys show that among adults with long COVID who worked prior to infection, over half are out of work or working fewer hours (Figure 2). Many conditions associated with long COVID—such as malaise, fatigue, or the inability to concentrate—limit people’s ability to work, even if they have jobs that allow for remote work and other accommodations. Two surveys of people with long COVID who had worked prior to infection showed that between 22% and 27% of those workers were out of work after getting long COVID. In comparison, among all working-age adults in 2019, only 7% were out of work. Given the sheer number of working age adults with long COVID, the employment implications may be profound and are likely to affect more people over time. One study estimates that long COVID already accounts for 15 percent of unfilled jobs.

Less than Half of Working Age Adults with Long COVID Who Worked Prior to Infection Work Full-Time After Infection

It is too early to have comprehensive data or a clear picture of employment outcomes but there are reports that claims associated with long COVID are rising for disability insurance, workers compensation, and group health insurance. Those higher claims could increase costs for insurers and eventually, employers. It is unclear how long-term these challenges will be and whether health insurance spending will rise because of long COVID. It is also unclear how employment consequences will be spread across industries, but some industries are likely to be disproportionately affected—particularly those with higher rates of initial infection, such as health care.

There may be significant changes in health coverage associated with long COVID. Over 60% of working-age adults have their health insurance coverage through an employer. Changes in employment would therefore have significant effects on people’s sources of health insurance. People who are no longer able to work could eventually lose their existing coverage and would also experience loss of income. Some could newly qualify for help paying for private health insurance through the ACA marketplaces. Others could newly qualify for Medicaid – though eligibility is more limited in the dozen states that have not expanded the program under the ACA. Those with high medical spending could qualify for Medicaid through medically needy programs.

An important question for the future is whether federal disability programs will count long COVID as a disability. The Office of Civil Rights within the U.S. Department of Health and Human Services determined that long COVID can be a disability under the Americans with Disabilities Act if an individual assessment determines that it substantially limits one or more major life activities. Despite the recognition that long COVID can be a disability, to qualify for federal programs, Social Security Disability Insurance (SSDI) and Supplemental Security Income (SSI), applicants must be unable to work and have health conditions that last for at least one year or result in death. At this point, it is unclear how many people with long COVID will qualify for disability benefits under this definition. If people with long COVID quality for federal disability programs, more people will have publicly funded health insurance through Medicare and Medicaid. People who are eligible for SSDI become eligible for Medicare after a 2-year waiting period and people who are eligible for SSI are generally eligible for Medicaid. If people with long COVID are unable to work, federal disability programs could play a key role helping those patients access the health care they need to recover.

Monkeypox Vaccine Roll-out in the U.S. – Are Jurisdictions Requesting All Their Doses?

Published: Jul 29, 2022

The recent monkeypox outbreak continues to surge in the U.S., as it does in many countries across the globe. Confirmed cases have climbed from just 40 on June 8, 2022 to 4,639 on July 27, 2022, distributed across almost all states. There is a significant risk that the current outbreak could become endemic in the U.S., if not further contained. One of the best tools available to help mitigate the outbreak is vaccination. However, there is a limited supply of vaccines and widespread reports that demand is outstripping supply, particularly in some jurisdictions.

Among the many factors that may be influencing supply at the local level is whether jurisdictions are requesting the vaccines allocated to them. Here, we explore jurisdictional request rates for JYNNEOS, the preferred monkeypox vaccine, based on publicly available data in all 50 states, Washington D.C., and 5 cities (allocations are also made to territories and tribal entities not described in this analysis) as of July 22, 2022. (Data as of July 22, 2022 are available here; current federal data are available here.) Overall, we find that while most jurisdictions have requested their full supply, some are well below that mark, raising questions about how quickly their at-risk populations can get protected.

There are currently two vaccines that can be used in the U.S. to prevent monkeypox: JYNNEOS and ACAM2000. JYNNEOS is FDA-approved for both monkeypox and smallpox, while ACAM2000 is approved for smallpox but has been granted an expanded access Investigational New Drug (EA-IND) protocol to allow its use for monkeypox. While both vaccines are effective, JYNNEOS is preferred because it has a lower risk profile for both the patient and provider, is less invasive to administer, and is not contraindicated for people with conditions associated with being immunocompromised, including people with HIV, who are pregnant, or have other select conditions, as is the case with ACAM2000. As such, JYNNEOS is being prioritized in the U.S. roll-out.

The federal government uses an evolving algorithm to determine allocation levels to jurisdictions based on current and projected monkeypox case burden in a jurisdiction and the size of the jurisdiction’s at-risk population, defined as men who have sex with men with HIV or who have an indication for HIV pre-exposure prophylaxis (PrEP). Jurisdictions must then request vaccine supply from the Centers for Disease Control and Prevention (CDC).

As of July 22, 2022, almost all (97%) of the allocated JYNNEOS vaccine supply has been requested by jurisdictions across the country. However, this varies significantly, and while most jurisdictions have requested their full allocation, a subset have requested well below:

  • The request rate – the number of vaccine doses requested as a share of the jurisdiction’s allocation — ranges from a low of just 3% in Arkansas to a high of 115% in Maine.
  • The majority of jurisdictions (37) have requested their full allocation of vaccine. This includes 11 that have requested 100% and 26 that have requested even more than their allocated amount (See Figure 1).
  • The remaining 19 jurisdictions have requested less than their share, including 10 that have requested 50% or less (WA, MO, KS, GA, NV, MT, SD, OK, KY, and AR).
  • Of the 10 that have requested 50% or less, some have relatively small numbers of confirmed cases, or no confirmed cases at all, and smaller at-risk populations. However, this is not the case for all. For example, Georgia has 312 cases and Washington state has 103 cases (both as of  July 27, 2022) and they have large or moderate size populations of men who have sex with men with HIV (with Georgia ranking 5th among all states and Washington ranking 18th), but they have requested 43% and 50% of their allocated doses, respectively. This may be temporary or an issue of timing – a recent media report notes that Georgia plans to request their full allocation soon.

Overall, there are not enough vaccine doses to meet demand right now and most jurisdictions are maxing out or exceeding their allocation and, in some cases, still unable to meet demand. However, this is not the case everywhere and jurisdictions likely have different reasons for not requesting the full allocation. In some cases, states with no or low reported cases may not see an immediate need for the full vaccine allocation. In others there may be separate challenges at play. In the case of Georgia for example, the state indicated that its initially low request rate was due to concerns around storage and wanting more time to prepare and connect with community partners. While in some cases this may reflect an initial timing and/or preparedness issue, it is important to note that speed still plays a key role in curbing a growing outbreak.

Jurisdictions were notified of their 3rd round of vaccine allocation on July 28, 2022, which means more supply but also that they will likely now be grappling again with how much to request to respond to local need. Beyond the number of doses each jurisdiction accesses, there are other factors that could enhance or complicate vaccine uptake, including where vaccine access points are located, which community partners are included, how public officials educate those at risk about vaccination, the impact of stigma, and vaccine communication strategies, among others. Ultimately, and as we have written elsewhere, variation in jurisdictional decisions about how to address the monkeypox outbreak, including their vaccination strategy, will likely have an impact on local and national success in curbing it.

Percent of Allocated JYNNEOS Vaccine Requested, by Jurisdiction

Senate Appropriations Committee Releases FY23 State and Foreign Operations (SFOPs) and Labor, Health and Human Services (Labor HHS) Appropriations Bills

Published: Jul 29, 2022

The Senate Committee on Appropriations released its FY 2023 State, Foreign Operations, and Related Programs (SFOPs) (links to bill and report) and Labor, Health and Human Services, Education, and Related Agencies (Labor HHS) (links to bill and report) appropriations bills and accompanying reports on July 28, 2022. The SFOPs bill includes funding for U.S. global health programs at the State Department and the U.S. Agency for International Development (USAID), while the Labor HHS bill includes funding for global health programs at the Centers for Disease Control and Prevention (CDC) and the National Institutes of Health (NIH). Funding provided to the State Department and USAID under the SFOPs bill and through the Global Health Programs (GHP) account, which represents the bulk of global health assistance, totals $10.5 billion, an increase of $680 million above the FY 2022 enacted level, but $67 million below the FY 2023 request and $467 million below the FY 2023 House level. The bill provides higher levels of funding for almost all program areas compared to the FY 2022 enacted level, with the Global Fund to Fight AIDS, Tuberculosis and Malaria (Global Fund) and family planning and reproductive health (FP/RH) receiving the largest increases. The bill also codifies the prohibition of the Mexico City Policy (see KFF explainer here). In addition to regular appropriations for global health, the SFOPs bill provides $950 million in emergency global health security supplemental funding and $5 billion in emergency coronavirus response supplemental funding. Total global health funding at CDC and NIH through the Labor HHS bill is not yet known, as funding for some programs at NIH is determined at the agency level rather than specified by Congress in annual appropriations bills. Of the known amounts, the Senate bill totals $850 million, which is $117 million above the FY 2022 enacted level, $7 million above the FY 2023 request, but $7 million below FY 2023 House level. Funding for all global health programs at CDC and NIH in the Senate bill either increased or remained flat compared to the FY 2022 enacted level. See Table 1 below for additional detail on global health funding and Tables 2 and 3 for additional detail on emergency global health security and emergency coronavirus response supplemental funding (Downloadable tables here). See the KFF budget tracker for details on historical annual appropriations for global health programs.

Table 1: KFF Analysis of Global Health Funding in the FY23 Senate Appropriations Bill
Department / Agency / AreaFY22Omnibusi(millions)FY23 Request (millions)FY23 Housei(millions)FY23 Senate(millions)Difference: FY23 Senate – FY22 OmnibusDifference: FY23 Senate – FY23 RequestDifference: FY23 Senate – FY23 House
State, Foreign Operations, and Related Programs (SFOPs) – Global Health
HIV/AIDSii –$4,700.0 – – – – –
State Department$4,390.0$4,370.0$4,395.0$4,370.0$-20(-0.5%)$0(0%)$-25(-0.6%)
USAID$330.0$330.0$330.0$330.0$0(0%)$0(0%)$0(0%)
of which Microbicides$45.0$45.0$45.0$45.0$0(0%)$0(0%)$0(0%)
ESF AccountNot specified$0.5Not specifiedNot specified – – –
Global Fund$1,560.0$2,000.0$2,000.0$2,000.0$440 (28.2%)$0 (0%)$0 (0%)
Tuberculosisii$352.0 – – – – –
Global Health Programs (GHP) account$371.1$350.0$469.0$400.0$29(7.8%)$50(14.3%)$-69(-14.7%)
Economic Support Fund (ESF) accountNot specified$2.0Not specifiedNot specified – – –
Malaria$775.0$780.0$820.0$800.0$25 (3.2%)$20 (2.6%)$-20 (-2.4%)
Maternal & Child Health (MCH)ii$1,044.0 – – – – –
GHP account$890.0$879.5$890.0$900.0$10(1.1%)$20.5(2.3%)$10(1.1%)
of which Gavi$290.0$290.0$290.0$290.0$0(0%)$0(0%)$0(0%)
of which Polio$75.0Not specified$75.0$85.0$10(13.3%) –$10(13.3%)
UNICEFiii$139.0$135.5$145.0$139.0$0(0%)$3.5(2.6%)$-6(-4.1%)
ESF accountNot specified$29.0Not specifiedNot specified – – –
of which PolioNot specified$0.0Not specifiedNot specified – – –
Nutritionii$161.0 – – – – –
GHP account$155.0$150.0$160.0$160.0$5(3.2%)$10(6.7%)$0(0%)
ESF accountNot specified$10.3Not specifiedNot specified – – –
AEECA accountNot specified$0.8Not specifiedNot specified – – –
Family Planning & Reproductive Health (FP/RH)iv$607.5$653.0$830.0iv$710.0iv$102.5 (16.9%)$57 (8.7%)$-120 (-14.5%)
Bilateral FP/RHiv$575.0$597.0$760.0iv$650.0iv$75(13%)$53(8.9%)$-110(-14.5%)
GHP accountiv$524.0$572.0$760.0iv$650.0iv$126.1(24.1%)$78(13.6%)$-110(-14.5%)
ESF accountiv$51.1$25.0Not specifiedivNot specifiediv – – –
UNFPAv$32.5$56.0$70.0$60.0$27.5(84.6%)$4(7.1%)$-10(-14.3%)
Vulnerable Children$27.5$25.0$30.0$30.0$2.5 (9.1%)$5 (20%)$0 (0%)
Neglected Tropical Diseases (NTDs)$107.5$114.5$112.5$114.5$7 (6.5%)$0 (0%)$2 (1.8%)
Global Health Security –$1,003.8 – – – – –
USAID GHP accountvi$700.0$745.0$1,000.0$745.0$45(6.4%)$0(0%)$-255(-25.5%)
State GHP accountvii$250.0Not specifiedNot specified – – –
ESF accountNot specified$6.0Not specifiedNot specified – – –
AEECA accountNot specified$2.8Not specifiedNot specified – – –
Emergency Reserve Fundviiiixxx – – –
Health Resilience Fundxi$10.0$10.0$10.0 –$0 (0%)$0 (0%)
SFOPs Total (GHP account only)xii$9,830.0$10,576.0$10,976.5$10,509.5$679.5 (6.9%)$-66.5 (-0.6%)$-467 (-4.3%)
Labor Health & Human Services (Labor HHS)
Centers for Disease Control & Prevention (CDC) – Total Global Health$646.8$747.8$757.8$760.8$114 (17.6%)$13 (1.7%)$3 (0.4%)
Global HIV/AIDS$128.9$128.4$128.9$128.9$0(0%)$0.5(0.4%)$0(0%)
Global Tuberculosis$9.7$9.2$14.7$14.7$5(51.4%)$5.5(59.6%)$0(0%)
Global Immunization$228.0$226.0$230.0$233.0$5(2.2%)$7(3.1%)$3(1.3%)
Polio$178.0$176.0$180.0$183.0$5(2.8%)$7(4%)$3(1.7%)
Other Global Vaccines/Measles$50.0$50.0$50.0$50.0$0(0%)$0(0%)$0(0%)
Parasitic Diseases$27.0$31.0$31.0$31.0$4(14.8%)$0(0%)$0(0%)
Global Public Health Protection$253.2$353.2$353.2$353.2$100(39.5%)$0(0%)$0(0%)
Global Disease Detection and Emergency ResponseNot specifiedNot specifiedNot specifiedNot specified – – –
of which Global Health Security (GHS)Not specifiedNot specifiedNot specifiedNot specified – – –
Global Public Health Capacity DevelopmentNot specifiedNot specifiedNot specifiedNot specified – – –
National Institutes of Health (NIH) – Total Global Health – – – – –
HIV/AIDSNot specified$614.8Not specifiedNot specified – – –
MalariaNot specifiedNot specifiedNot specifiedNot specified – – –
Fogarty International Center (FIC)$86.9$95.8$99.6$89.6$2.7(3.1%)$-6.2(-6.5%)$-10(-10.1%)
Labor HHS TotalNot yet knownNot yet knownNot yet knownNot yet known –
Notes:
i – The FY22 Omnibus, FY23 House, and FY23 Senate bills include a provision giving the Secretary of State the ability to transfer up to $200,000,000 from the ‘Global Health Programs’, ‘Development Assistance’, ‘International Disaster Assistance’, ‘Complex Crises Fund’, ‘Economic Support Fund’, ‘Democracy Fund’, ‘Assistance for Europe, Eurasia and Central Asia’, ‘Migration and Refugee Assistance’, and ‘Millennium Challenge Corporation’ accounts “to respond to a Public Health Emergency of International Concern.”
ii – Some HIV, tuberculosis, MCH, nutrition funding, and global health security funding is provided under the ESF and AEECA accounts, which is not earmarked by Congress in the annual appropriations bills and is determined at the agency level.
iii – UNICEF funding in the FY22 Omnibus and FY22 House bill includes an earmark of $5 million for programs addressing female genital mutilation.
iv – The FY22 Omnibus states that “not less than $575,000,000 should be made available for family planning/reproductive health.” The FY23 House bill states that “not less than $760,000,000 shall be made available for family planning/reproductive health.” According to the House bill report, $760 million is provided through the GHP account; however, it is possible that the administration could provide additional funding for FPRH activities through the ESF account. The FY23 Senate bill states that “not less than $650,000,000 shall be made available for family planning/reproductive health.” According to the bill report, $650 million is provided through the GHP account; however, it is possible that the administration could provide additional funding for FPRH activities through the ESF account.
v – The FY22 Omnibus, FY23 House bill, and FY23 Senate bill state that if this funding is not provided to UNFPA it “shall be transferred to the ‘Global Health Programs’ account and shall be made available for family planning, maternal, and reproductive health activities.”
vi – According to the Department of State, Foreign Operations, and Related Programs FY23 Congressional Budget Justification, $250 million of this funding is “for contributions to support multilateral initiatives leading the global COVID response through the Act-Accelerator platform.” The FY23 Senate report includes $100,000,000 for a U.S. contribution to the Coalition for Epidemic Preparedness Innovations.
vii – According to the Department of State, Foreign Operations, and Related Programs FY23 Congressional Budget Justification, this funding is “to support a new health security financing mechanism, being developed alongside U.S. partners and allies, to ensure global readiness to respond to the next outbreak.”
viii – The FY22 Omnibus states that “up to $100,000,000 of the funds made available under the heading ‘Global Health Programs’ may be made available for the Emergency Reserve Fund.”
ix – The FY23 Request states that “this request includes $90.0 million in non-expiring funds to replenish the Emergency Reserve Fund to ensure that USAID can quickly and effectively respond to emerging infectious disease outbreaks posing severe threats to human health.”
x – The House and Senate FY23 bills state that “Up to $90,000,000 of the funds made available under the heading ‘Global Health Programs’ may be made available for the Emergency Reserve Fund.”
xi – The FY23 Request states that the Health Resilience Fund (HRF) “will support cross-cutting health systems strengthening in challenging environments or countries emerging from crisis.” The FY23 House SFOPs report states that the HRF will “support cross-cutting global health activities including health service delivery, health workforce, health information systems, access to essential medicines, health systems financing, and governance, in challenging environments and countries in crisis.” The FY23 Senate SFOPs report calls this the Health Reserve Fund and states that the HRF will “support cross-cutting health activities, including health service delivery, the health workforce, health information systems, access to essential medicines, health systems financing, and governance, in challenging environments and countries in crisis.”
xii – The FY22 Omnibus “includes $100,000,000 for a U.S. contribution to support a multilateral vaccine development partnership for epidemic preparedness innovations.” The FY23 House bill states that “funds appropriated by this Act under the heading ‘Global Health Programs’ may be made available for a contribution to an international financing mechanism for pandemic preparedness.”
Table 2: KFF Analysis of Emergency Global Health Security Supplemental Funding in the FY23 Senate SFOPs Bill
Department/Agency/AreaFY23 Senate(in millions)
Global Health Programsi$950
Department of State$550
Financial Intermediary Fund (FIF) for pandemic preparedness and global health security$550
USAIDii$400
Of which to strengthen the global health workforce and related health systems capacity$200
Notes:
i – The FY23 Senate bill states that “$100,000,000 shall be made available for a contribution to the Coalition for Epidemic Preparedness Innovations” but does not specify whether that funding is provided through USAID or State. The FY23 Senate bill states that “not less than $100,000,000 shall be made available for the Emergency Reserve Fund” but does not specify whether that funding is provided through USAID or State.
ii – The FY23 Senate bill states that “not less than $400,000,000 shall be apportioned directly to the United States Agency for International Development.”
Table 3: KFF Analysis of Coronavirus Response Supplemental Funding in the FY23 Senate SFOPs Bill
Department/Agency/AreaFY23 Senate(in millions)
Total Funding$5,000
Department of State$90
Diplomatic Programs$15
Migration and Refugee Assistance$75
USAID$4,910
Operating Expenses$35
Global Health Programs$4,875
Notes:
i – The FY23 Senate bill states that these “funds may be made available as contributions, including to the Global Fund to Fight AIDS, Tuberculosis, and Malaria, and to The GAVI Alliance.”

Insulin Out-of-Pocket Costs in Medicare Part D

Authors: Juliette Cubanski and Anthony Damico
Published: Jul 28, 2022

Addressing the cost of insulin continues to be at the forefront of policy discussions around prescription drugs. Legislation has been introduced in Congress that would cap monthly copayments for insulin products at $35 for people with Medicare and private insurance, require the federal government to negotiate insulin prices, and encourage insulin manufacturers to lower list prices. To inform discussions about these proposals, this analysis updates prior work from KFF on out-of-pocket spending on insulin products by Medicare beneficiaries enrolled in Part D drug plans, along with state-level use and spending data, based on prescription drug event claims data through 2020 from the Centers for Medicare & Medicaid Services (CMS) Chronic Conditions Data Warehouse. Available claims data predate the 2021 introduction of the CMS Part D Senior Savings Model in which enhanced Part D drug plans charge a monthly copayment of no more than $35 for selected insulin products. Therefore, this analysis does not reflect any potential cost savings for Part D enrollees who have enrolled in these plans since 2021.

In the aggregate, Part D enrollees spent $1 billion out of pocket on insulin in 2020, more than four times the amount spent in 2007

Aggregate out-of-pocket spending by people with Medicare Part D for insulin products quadrupled between 2007 to 2020, increasing from $236 million to $1.03 billion (Figure 1). The number of Medicare Part D enrollees using insulin doubled over these years, from 1.6 million to 3.3 million beneficiaries, which indicates that the increase in aggregate out-of-pocket spending was not solely a function of more Medicare beneficiaries using insulin.

Medicare Part D enrollees spent $1 billion on insulin in 2020

Average out-of-pocket spending per insulin prescription was $54 in 2020 – over 50% more than the proposed $35 monthly copay cap for insulin – but spending on many insulin products was higher

Among Medicare Part D insulin users who do not receive low-income subsidies, average out-of-pocket costs per prescription across all insulin products was $54 in 2020 – over 50% more than the proposed $35 monthly copay cap for insulin. The $54 per-prescription average in 2020 is an increase of 39% since 2007.

Among all insulin products available in 2020, out-of-pocket spending per prescription by non-LIS Part D enrollees ranged from $16 for Humulin N, an intermediate-acting insulin used by 74,000 non-LIS enrollees in 2020, to $116 for Humulin R U-500, a short-acting concentrated insulin used by 3,600 non-LIS enrollees in 2020 (Figure 2). Some of the more commonly used insulin products with above-average per prescription costs in 2020 include Novolog Mix 70-30 Flexpen ($77 per prescription; used by 32,900 non-LIS enrollees); Tresiba Flextouch U-200 ($70 per prescription; used by 93,700 non-LIS enrollees); and Levemir ($67 per prescription; used by 43,000 non-LIS enrollees).

Average out-of-pocket spending by Medicare Part D enrollees per insulin prescription was $54 in 2020, but spending on many insulin products was higher

Among insulin users, Part D enrollees without low-income subsidies spent $572 per person for insulin in 2020, on average, but a small share of insulin users spent considerably more

Among insulin users without Part D low-income subsidies (LIS), average annual out-of-pocket spending on insulin per user increased by 76% between 2007 and 2020, from $324 to $572 (Figure 3; see Table 1 for 2020 insulin use and spending by state). Average annual growth in out-of-pocket costs between 2007 and 2020 was 4.5%, which exceeded the 1.7% average annual rate of growth in inflation over these same years.

Among Medicare Part D insulin users without low-income subsidies, average annual out-of-pocket spending per person on insulin was $572 in 2020, and $54 per insulin prescription

Some Part D insulin users spent considerably more than the average in 2020. For example, 10% of non-LIS insulin users spent more than $1,300 on insulin in 2020 and 1% spent more than $2,300 (Figure 4). Higher-than-average out-of-pocket spending is due to a greater number of prescription fills for insulin products and higher out-of-pocket costs per insulin prescription. In other words, taking more than one insulin product and taking more expensive formulations leads to higher out-of-pocket costs.

For some Medicare Part D enrollees, annual out-of-pocket spending on insulin products in 2020 was substantially higher than the average

If insulin copays were capped at $35, Part D enrollees would save 35% on average, based on spending of $54 per prescription in 2020

Policymakers have introduced proposals to cap monthly copayments for insulin products, building on the Part D insulin model. If a $35 monthly copay cap for all insulin products had been in place in 2020, Part D enrollees without low-income subsidies would have saved $19 per insulin prescription, on average—a reduction of 35% based on average out-of-pocket costs of $54 per insulin prescription in 2020.

Under the current Part D insulin model, participating plans are not required to cover all insulin products at the $35 monthly copayment amount, just one of each dosage form (vial, pen) and insulin type (rapid-acting, short-acting, intermediate-acting, and long-acting). Absent a requirement to cover all insulin products at no more than a $35 copay, insulin users might need to switch from one insulin product to another to save on their out-of-pocket costs, or switch to a plan that covers their insulin product at the $35 copayment.

This work was supported in part by Arnold Ventures. KFF maintains full editorial control over all of its policy analysis, polling, and journalism activities.

Juliette Cubanski is with KFF. Anthony Damico is an independent consultant.

Number of Medicare Part D Enrollees Using Insulin Products and Average Annual Out-of-Pocket Spending on Insulin in 2020, by State

Update: The Number of People Not Up to Date on Vaccination in Counties with Elevated COVID-19 Community Levels is Growing

Authors: Anna Rouw, Krutika Amin, Cynthia Cox, and Jennifer Kates
Published: Jul 28, 2022

With the Omicron wave of COVID-19 sweeping the country, we previously calculated the number of people who were not up to date with vaccination in vulnerable areas as of June 2, 2022. Specifically, we looked at counties classified by the Centers for Disease Control and Prevention (CDC) has having “medium” or “high” COVID-19 community levels, signifying not only that new COVID cases were on the rise but also strains on hospital capacity. Since then, the BA.5 Omicron variant, which appears to be even more contagious and is able to evade prior immunity, has become dominant, driving up cases and hospitalizations even further.

Now, less than two months later, the share of the population living in medium or high community level counties and the number of people in those counties who are not up to date on vaccination have grown significantly; in addition, most who are not up to date are now living in counties with high community levels. We provide an update here, as of July 21, 2022.

Findings

  • The share of the U.S. population living in counties with medium or high COVID-19 community levels is 87% or 283 million people. This is up from 55% of the population (180 million people) in early June. Also, in contrast to early June, most people are living in high community level counties (61% of the total population now compared to 21% in early June).
  • The number of people not up to date on vaccination in vulnerable counties has jumped to 198 million, up from 120 million. This represents a 65% increase since June 2. Most of these individuals (139 million) live in counties with high community levels, representing an increase from just 46 million people in such counties in early June. The share of those not up to date on vaccination living in high level counties has also grown, from 20% in early June to 70% now.
198 Million People Are Not Up To Date On COVID-19 Vaccines And Live In Counties With Elevated COVID-19 Community Levels
  • Of the 198 million not up to date on vaccination in medium and high community level counties:
    • 73 million are unvaccinated, including 50.4 million living in counties with high COVID-19 community levels (up from 14 million in high level counties in early June).
    • 29.8 million are partially vaccinated, including 20.9 million who are in high level counties (up from 8 million).
    • 95.4 million are vaccinated but not yet boosted, including 67.7 million in high level counties (up from 25 million).

Most Americans are not up to date with their COVID-19 vaccines. As of July 21, 2022, 227.8 million Americans (70%) were unvaccinated, had not completed their primary series, or had not gotten a booster dose. In each state, at least half the population is not up to date on COVID-19 vaccines. In Alabama, North Carolina, and Virginia, over 80% of people are not yet up to date on COVID-19 vaccines.

228 Million People (70%) Are Not Up To Date With COVID-19 Vaccines

Implications

In just a short time, with the spread of the latest COVID-19 Omicron variant, the number of people in the U.S. who are particularly vulnerable to the impacts of COVID-19, because they are not up to date on vaccination and live in vulnerable counties, has grown considerably, rising from 120 million in early June to 198 million now. Moreover, an even greater share of people now live in counties with high community levels. The most vulnerable among them – those who remain unvaccinated and live in counties with high community levels – has grown from 14 million to 50.4 million.

CDC recommends that all people mask indoors in areas that have high COVID-19 community levels, and that people living in medium-level counties mask based on their personal risk, but most jurisdictions and facilities do not require masking. These updated data illustrate how quickly the current wave is spreading and increasing risk across the country. These data underscore the significant vulnerability to COVID-19 illness that still exists at this time, more than a year since vaccines became widely available in the U.S. to most people. As such, they point to the importance of other public health measures, such as masking and testing, in addition to vaccination, in many parts of the country.

Methods

COVID-19 Community Level: COVID-19 community level data were sourced from the Centers for Disease Control and Prevention (CDC) “United States COVID-19 Community Levels by County,” using data released on July 21, 2022. Counties lacking a COVID-19 community level were excluded.

COVID-19 Vaccinations: County-level data on COVID-19 vaccinations were sourced from the CDC “COVID-19 Vaccinations in the United States, County” using data reported as July 20, 2022. Only data from the 50 states and District of Columbia were included (data from territories were excluded as territories are not included in the COVID-19 community level dataset). Counties lacking any vaccination data were also excluded from this analysis. In some cases, the residence county is unknown, and therefore these vaccination data cannot be attributed to a specific county. However, for states where only one COVID-19 community level was possible as of July 20, 2022, namely, the District of Columbia (Medium), Maine (Low), and Rhode Island (Low), vaccination data with unknown county information but attributed to these states were coded as the corresponding COVID-19 community level. Other vaccination data without county information and not attributed to these states were excluded from the analysis (accounting for about 13 million people). For this reason, we are potentially overestimating the number of people not up to date on vaccination. We define up to date on COVID-19 vaccination as people who have completed a primary series and received a booster (except for children under age 5 who are considered to be up to date with primary series COVID-19 vaccination). We calculate the number not up to date on COVID-19 vaccination as population in each county minus people who received primary series and booster. We calculate the number of unvaccinated people as the difference between the county population and the number of people who have received at least a first dose of a COVID-19 vaccine. In a few counties where the population estimate exceeds the number of people who have received a first dose of the COVID-19 vaccine, the number of unvaccinated individuals is assumed to be 0. We calculate people who are partially vaccinated as the difference between the number of people who completed a primary series and those who received at least one dose. We calculate the number of people that have completed a primary series but not received a booster as the difference between the number of people who have completed a primary series and the number of people who have received a booster dose. Although the CDC now recommends that all immunocompromised individuals and people over the age of 50 receive a second booster dose, there are currently no county-level data available on the number of booster doses received. Therefore, we are unable to capture how many individuals are fully up to date on COVID-19 vaccines. Furthermore, children under 5 years of age have recently become eligible to receive COVID-19 vaccination. Children in this age group that have received a first dose are considered to be partially vaccinated.