ACA’s Maximum Out-of-Pocket Limit Is Growing Faster Than Wages

Authors: Matthew Rae, Krutika Amin, and Cynthia Cox
Published: Jul 20, 2022

An important component of most private insurance plans is the out-of-pocket (OOP) limit. These limits place an annual cap on the amount of cost-sharing (deductibles, copayments, and coinsurance) an enrollee can face for in-network covered services each year. By doing so, OOP limits provide significant financial protection for individuals who face substantial health care use in a year. Even so, these limits are typically several thousand dollars for covered workers enrolled in single coverage; families in which multiple people have health spending may face significant cost-sharing before reaching the limit.

This analysis uses economic projections to look at how the maximum allowable OOP limits may change for different types of private health insurance plans over the next decade. It finds that the ACA’s maximum out-of-pocket limit is likely to grow faster than wages and salaries, and is also expected to grow faster than the maximum out-of-pocket limit for HSA-qualified health plans.

The analysis is available on the Peterson-KFF Health System Tracker, an online information hub dedicated to monitoring and assessing the performance of the U.S. health system.

Do States with Easier Access to Guns have More Suicide Deaths by Firearm?

Published: Jul 18, 2022

Nearly half a million lives (480,622) were lost to suicide from 2010 to 2020. During the same period, the suicide death rate increased by 12%, and as of 2009, the number of suicides outnumbered those caused by motor vehicle accidents. Suicides are most prevalent among people who live in rural areas, males, American Indian or Alaska Natives, and White people, but they are rising fastest in some people of color, younger individuals, and people who live in rural areas. On July 16, 2022, the federally mandated crisis number, 988, will be available to all landline and cell phone users, providing a single three-digit number to access a network of over 200 local and state-funded crisis centers. While the overall number of suicide deaths decreased slightly from 47,511 to 45,979 between 2019 to 2020, the suicides involving firearms increased over the same period (from 23,941 to 24,292). The recent mass shootings in Uvalde and Buffalo have catalyzed discussion around mental health and gun policy. In the same week that the federal Bipartisan Safer Communities Act was signed strengthening background checks for young adults, adding incentives for red flag laws, and reducing access to guns for individuals with a domestic violence history, the Supreme Court struck down New York’s “proper cause” requirement for concealed carry allowances. In this issue brief, we use the Center for Disease Control and Prevention (CDC) Wonder database and the State Firearm Law Database to examine the association between suicide deaths by firearm and the number of state-level firearm law provisions.

Suicides account for over half of all firearm deaths (54%), and over half of all suicides involve a firearm (53%). Though mass shootings are more widely covered, data reveal that suicides are a more common cause of firearm-related deaths than homicide. In 2020, a little more than half (54%) of all firearm-related deaths were suicides, 43% were homicides, and 2% were accidental discharges or undetermined causes. This represents a slight decrease from 2018 and 2019, where suicides by firearms accounted for over 60% of all firearm deaths in that period. Looking at suicides, we find that guns were involved in 53% of suicides in 2020, representing the majority of all suicides.

Share of Deaths Involving Firearms, 2020

Variation in state-level suicide rates is largely driven by rates of suicide by firearm. Suicides involving firearms vary from the lowest rate of 1.8 per 100,000 in New Jersey and Massachusetts to a high of 20.9 per 100,000 in Wyoming, representing an absolute difference of 19.1. In contrast, the rate of suicide by other means is more stable across states, ranging from a low of 4.6 in Mississippi to a high of 11.4 in South Dakota, representing an absolute difference of 6.8.

Suicide Death Rate per 100,000 in 2020, by Type

There is a wide range of firearm law provisions across states, with Idaho having the fewest at just one and California having the most at 111. Because there is no comprehensive national firearm registry and very few state registries, it is difficult to track gun ownership in the US, so estimates of gun ownership rely on survey data or measures closely related to gun ownership--such as the number of firearm laws. The State Firearm Law Database is a catalog of the presence or absence of 134 firearm law provisions across all 50 states; this analysis uses firearm laws present in 2019. Even though state laws vary widely in detail and number, there are some common themes across states. Many states restrict firearm access to those considered high-risk, including people with felony convictions (37 states), domestic violence misdemeanors (31 states), or those deemed by the court to be a danger (28 states). A number of states regulate concealed carry permits--for example, 37 require background checks for applicants and 28 require authorities to revoke concealed carry permits under certain conditions, though some concealed carry laws may be subject to change given the recent Supreme Court decision.  Other major categories of gun laws include dealer regulations, ammunition regulations and child access prevention, among others. In 2019, the average number of firearm law provisions per state was 29 and ranged from one provision in Idaho to 111 in California (Appendix Table 1).

More than twice as many suicides by firearm occur in states with the fewest gun laws, relative to states with the most laws. We grouped states into three categories according to the number of firearm law provisions. States with the lowest number of gun law provisions (17 states) had an average of six provisions and were placed in the “least” category; states with a moderate number of laws (16 states) had an average of 19 provisions and were placed in the “moderate” category; and states with the most firearm laws (17 states) had an average of 61 provisions and were placed in the “most” firearm provisions category. Using CDC WONDER underlying cause of death data, we calculated the age-adjusted rate of suicide by firearm for each category of states. We find that suicide by firearm is highest in states with the fewest gun laws (10.8 per 100,000), lower in states with moderate gun laws (8.4 per 100,000), and the lowest in states with the most gun laws (4.9 per 100,000) (Figure 3). The analysis is not designed to necessarily demonstrate a causal relationship between gun laws and suicides by firearm, and it is possible that there are other factors that explain the relationship.

Firearm Suicide Rate in 2020, by Firearm Law Provisions

Firearms are the most lethal method of suicide attempts, and about half of suicide attempts take place within 10 minutes of the current suicide thought, so having access to firearms is a suicide risk factor. The availability of firearms has been linked to suicides in a number of peer-reviewed studies. In one such study, researchers examined the association between firearm availability and suicide while also accounting for the potential confounding influence of state-level suicidal behaviors (as measured by suicide attempts). Researchers found that higher rates of gun ownership were associated with increased suicide by firearm deaths, but not with other types of suicide. Taking a look at suicide deaths starting from the date of a handgun purchase and comparing them to people who did not purchase handguns, another study found that people who purchased handguns were more likely to die from suicide by firearm than those who did not--with men 8 times more likely and women 35 times more likely compared to non-owners.

Non-firearm suicides rates are relatively stable across states suggesting that other types of suicides are not more likely in areas where guns are harder to access. To examine whether non-firearm suicides are higher in states where guns are more difficult to access, we used the state-level firearm law provision groups described above and calculated the age-adjusted rate for each group (states with the least, moderate, and the most firearm law provisions). The results of this analysis provide insight into whether there are other factors that may be contributing to the relationship between gun laws and firearm suicides, such as whether people in states that lack easy access to firearms have higher suicide rates by other means. The rate of non-firearm suicides is relatively stable across all groups, ranging from a low rate of 6.5 in states with the most firearm laws to a high of 6.9 in states with the lowest number of firearm laws. The absolute difference of 0.4 is statistically significant, but small. Non-firearm suicides remain relatively stable across groups, suggesting that other types of suicides are not more likely in areas where guns are harder to get (Figure 3). Though we do not observe an increase of suicide death by other means in states with less access to guns, there may still be differences across states that could explain these findings.

If the suicide rate by firearm in all states was similar to the rate in the states with the most gun laws, approximately 6,800 lives may have been saved in 2020, a reduction of about 15% of all suicide-related deaths. Applying the crude rate of 5.3 per 100,000 to the total population in 2020, we estimate that nearly 6,800 suicide deaths may have been averted if rates of suicide by firearm were similar to states with the most gun control laws.

Recent federal legislation strengthens some gun control measures, but it may take several years to impact firearm mortality. In the recently passed federal legislation, the Bipartisan Safer Communities Act, there is an emphasis on strengthening some measures of gun control including background checks for young adults and reducing gun access for those who have a history of domestic violence, among other provisions. Also included in the legislation are additional funds for mental health services in schools and for child and family mental health services. Despite federal movement toward strengthening gun control, a recent Supreme Court decision struck down state legislation that placed additional restrictions on concealed carry permits. It is not known how the Supreme Court's decision will impact the frequency of concealed carry firearms and the rate of firearm mortality. More firearm regulations are associated with fewer homicides and suicides, but the newly passed federal gun laws may take several years to reduce firearm mortality.

If you or someone you know is considering suicide, contact the National Suicide Prevention Lifeline at the new three-digit dialing code 988 or 1-800-273-8255 (En Español: 1-888-628-9454; Deaf and Hard of Hearing: 1-800-799-4889).

This work was supported in part by Well Being Trust. KFF maintains full editorial control over all of its policy analysis, polling, and journalism activities.

Appendix

Firearm Law Provisions and Age-Adjusted Suicide Rates, by State

After Roe: Options to Address Medicaid Coverage Policy Related to Maternal and Child Health

Published: Jul 15, 2022

The Supreme Court decision overturning Roe v. Wade turned the spotlight on state abortion policies and the health and economic wellbeing of women and children across states. With Medicaid covering 42% of births in the U.S., it’s a key part of the equation when it comes to maternal and child health.

While there has been federal legislation enacted to encourage states to improve maternal and child health, address health disparities and expand Medicaid coverage, there has been variation in state uptake of these options. For example, while the American Rescue Plan Act (ARPA) included a new option for states to adopt 12-month postpartum coverage and new incentives for states to newly adopt the Medicaid expansion, a number of states have not yet taken up these options. The Build Back Better Act (BBBA), adopted by the House of Representatives in November 2021, included a number of provisions to expand coverage for Medicaid by closing the Medicaid coverage gap and requiring states to extend postpartum coverage to 12 months and to provide 12-month continuous coverage for children, along with other maternal health provisions. There are active discussions in the Senate about the shape of a budget reconciliation bill, which is expected to include very limited health spending provisions.

The outcome of the recent court decision overturning Roe v. Wade re-elevates the implications and importance of coverage policies that affect low-income women and children. While extending Medicaid coverage to low-income parents and stabilizing coverage for their children is not a replacement for abortion access, a pathway to stable coverage could expand access to care to those who could be impacted by the abortion bans. This policy watch examines the intersection of these Medicaid coverage policies with state actions to ban abortion.

Medicaid is the primary source of coverage for low-income pregnant people and children. In 2020, Medicaid covered 16% of nonelderly adult women in the United States, but Medicaid coverage rates were higher among certain groups, including women in fair or poor health, women of color, single mothers, low-income women, and women who have not completed a high school education. These are also similar to the demographics for women who get abortions in the US: 75% have household incomes below 200% of the federal poverty level, 61% are women of color, 72% are under age 30, and 59% already have had a prior birth. Medicaid currently finances the cost of 42% of births in the U.S. and in a number of states the share is 50% or greater. With abortion bans in place in a number of states, this share could increase, as low-income women are less likely to have the ability to travel to another states to access an abortion because they can’t afford to travel, or have jobs with limited flexibility or time off, and limited options for child care.

Research has shown that Medicaid expansion has helped to improve maternal and infant health, postpartum insurance coverage, and access to contraception. In addition, research shows that Medicaid expansion was associated with narrowed disparities in health outcomes for Black and Hispanic individuals, particularly for measures of maternal and infant health. Under current law, the federal government pays for 90% of the costs of expansion, but the American Rescue Plan Act (ARPA) included an additional temporary fiscal incentive for states that newly adopt the Medicaid expansion. The House-passed budget reconciliation bill would create a federal provision to close the coverage gap by allowing people living in states that have not expanded Medicaid to temporarily purchase subsidized coverage on the ACA Marketplace. Of the 12 states that have not adopted the Medicaid expansion, seven have abortion bans in place (AL, MS, SD, TN, TX, WI and WY) (Figure 1). Most of these states have eligibility levels for parents in Medicaid below 50% of the federal poverty level ($11,515 annually for a family of three in 2022), so many could become uninsured at the end of the 60-day postpartum coverage period. In Texas and Alabama, the eligibility threshold for parents is below 20% of the poverty level.

12 states have not adopted the ACA Medicaid Expansion

Adopting the Medicaid postpartum coverage extension can help to improve maternal health and coverage stability and help address racial disparities in maternal health. A provision in ARPA gives states a new option to extend Medicaid postpartum coverage to 12 months, with the federal government and states sharing in the cost. While this new option took effect on April 1, 2022 and is available to states for five years, 17 states have not adopted (or have plans) the 12-month postpartum coverage extension. Texas and Wisconsin have proposed limited postpartum coverage extensions, and Missouri has indicated to CMS that it will not implement its approved but limited six-month postpartum extension – these states are included in the 17 states. Eleven of those 17 states have passed abortion bans (Figure 1). The House-passed budget reconciliation bill would require 12 months of postpartum coverage in all states, at a federal cost of $1.2 billion over a decade.

While states have the option to provide 12-month continuous coverage for children in Medicaid and CHIP, many have not done so. As of January 2022, 32 states have opted to provide 12-month continuous eligibility for all children in Medicaid and/or CHIP. The continuous coverage policy for children is more common in CHIP, with 24 of 34 separate CHIP programs providing a full year of coverage compared to 24 of the 51 Medicaid programs that have adopted the option. Continuous eligibility eliminates coverage gaps due to income fluctuations, which are often temporary, and is referenced in recent CMS guidance as a strategy for promoting continuous coverage for eligible individuals and reducing churn, when individuals go on and off the program. Of the 18 states and DC that have not adopted 12-month continuous coverage for children, six have abortion bans in place (Figure 1). The House-passed budget reconciliation bill did not have a separate cost estimate for the provision to require 12-month continuous coverage for children.

The state bans will further limit abortion access or even make it effectively impossible for low-income women who live in most states in the South and Midwest. Many of the very states that have banned abortion have not taken advantage of current federal options to strengthen health coverage for their state residents, most notably for women who give birth and children. The recent court decision to overturn Roe v. Wade renews the focus and attention on maternal and child health as states implement abortion bans.

Latest Data on COVID-19 Vaccinations by Race/Ethnicity

Authors: Nambi Ndugga, Latoya Hill, Samantha Artiga, and Sweta Haldar
Published: Jul 14, 2022

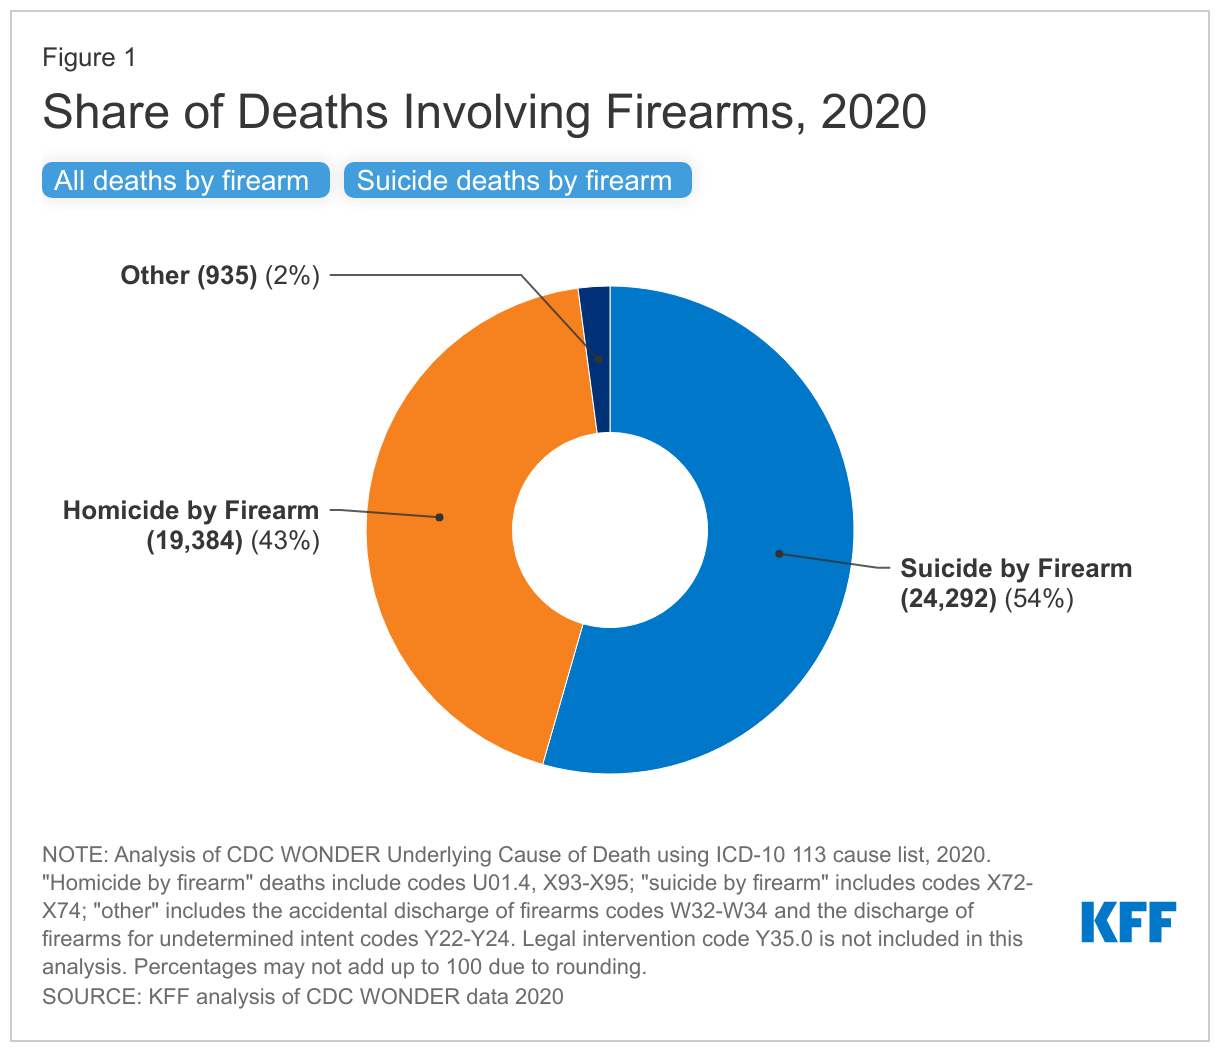
As of this week, federal data from the Centers for Disease Control and Prevention (CDC) show that 78% of the total population in the United States have received at least one dose of a COVID-19 vaccine. While vaccination coverage increased in the first half of 2022, vaccination and booster uptake has leveled off and remains uneven across the country. As the United States navigates another Omicron wave, individuals who have not received any booster dose are at higher risk of infection from the virus, and people who remain unvaccinated continue to be at particularly high risk for infection, severe illness, and death. Over the course of the vaccination rollout, Black and Hispanic people have been less likely than their White counterparts to receive a vaccine, but these disparities have narrowed over time and reversed for Hispanic people. With first booster shot eligibility expanded to all individuals, and vaccinations authorized for people ages 6 months and older, ensuring equity in the uptake of booster shots and vaccinations among children is also important. However, to date, limited data are available to examine racial disparities among booster shot recipients and children. Moreover, some states have reduced the frequency of their reporting of vaccinations by race/ethnicity or stopped reporting these data, further limiting data available to understand vaccination patterns.

This data note presents federal data on COVID-19 vaccinations and booster doses by race/ethnicity and state reported data on COVID-19 vaccinations, COVID-19 vaccinations among children, and booster shot recipients by race/ethnicity, where available.

Federal Data on COVID-19 Vaccinations by Race/Ethnicity

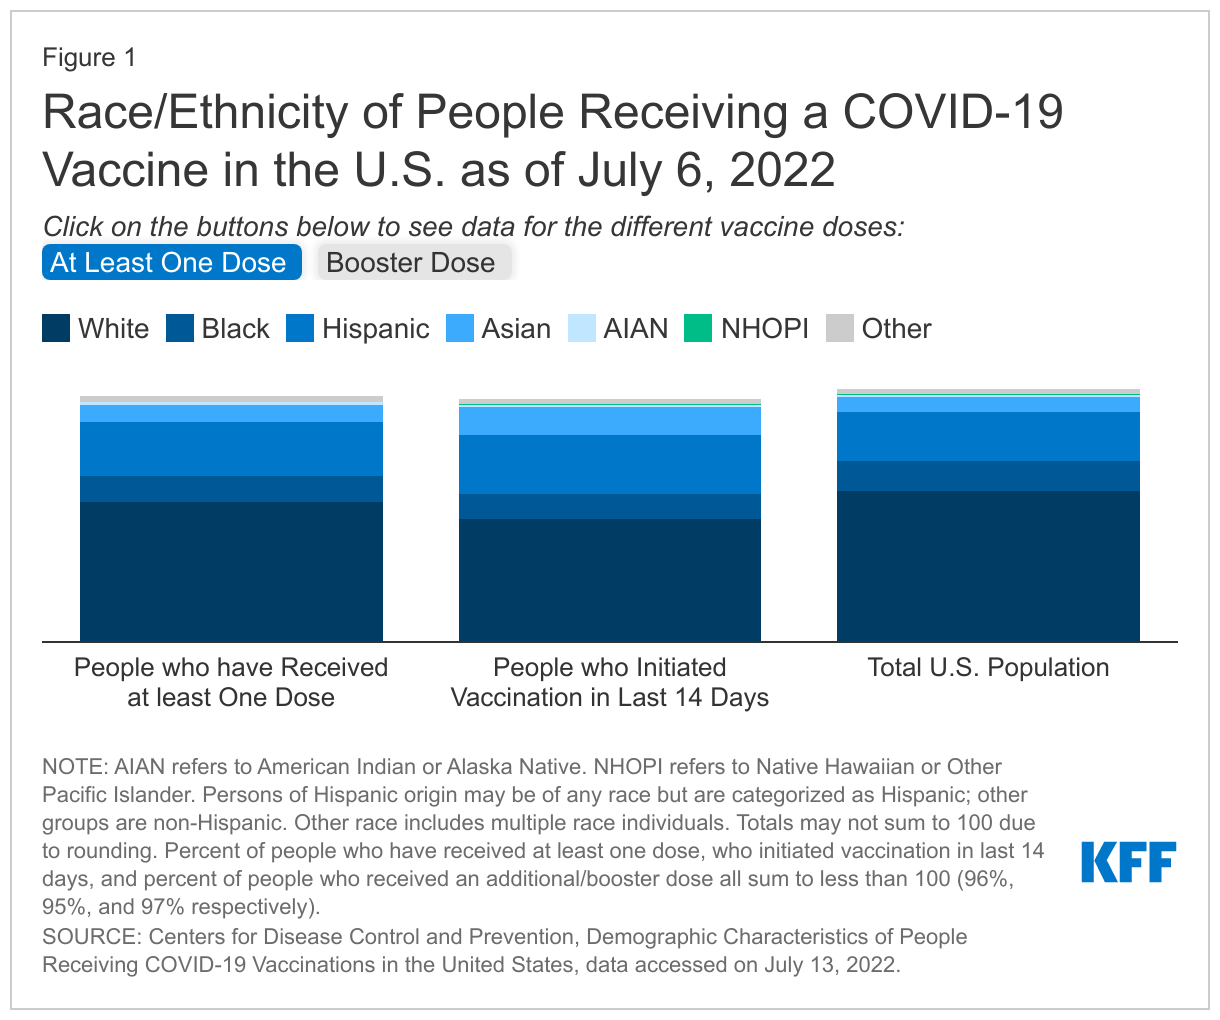
The CDC reports demographic characteristics, including race/ethnicity, of people receiving COVID-19 vaccinations at the national level, including both people who have received one dose and people who have been recently vaccinated (initiated within the last 14 days). CDC reports that as of July 6, 2022, race/ethnicity was known for 75% of people who had received at least one dose of the vaccine. White people make up a smaller share of people who have received at least one dose (55%) and people who have recently received a vaccination (48%) compared to their share of the total population (59%). Black people make up 10% of people who recently received a vaccination, which is the same as their share of people who have received at least one dose (10%), and smaller than their share of the total population (12%), Hispanic people make up a larger share of vaccinated people (21%) and people who recently received a vaccination (23%) compared to their share of the total population (19%). The overall share of vaccinated people who are Asian is similar to their share of total population (7% and 6%, respectively), while they make up a larger share of people who recently got vaccinated (11%) (Figure 1).

For children, CDC reports that as of July 6, 2022, 37% of children ages 5-11 and 70% of children ages 12-17 have received at least one COVID-19 vaccine dose. However, CDC does not currently report race/ethnicity of vaccinated children. Children ages 6 months to 5 years old became eligible for vaccination on June 18, 2022, but CDC had not yet begun reporting vaccination data for this group as of the time of this update.

The CDC also reports the race/ethnicity of people who have received an additional/booster vaccine dose at the federal level. Race/ethnicity data was available for 89% of people who have received their first booster dose as of July 6, 2022. Among this group, 61% of booster recipients were White, 8% were Black, 8% were Asian, 15% were Hispanic, and AIAN and NHOPI people made up less than 1% of recipients (0.7% and 0.3%, respectively). The shares of booster dose recipients who are Black (8%) and Hispanic (15%) are smaller than their shares of fully vaccinated people ages 5 and older (10% and 20%, respectively). However, Black, and Hispanic people made up larger shares of people receiving a booster dose in the past 14 days (11% and 23%, respectively). Overall, Asian (62%) and White (56%) people had the highest shares of eligible people who had received a booster dose as of July 6, 2022, while less than half of NHOPI (49%), AIAN (47%), Black (44%) and Hispanic (41%) people had received a booster shot.

While these data provide helpful insights at the national level, significant gaps in data remain to help understand who is and is not getting vaccinated. To date, CDC is not publicly reporting state-level data on the racial/ethnic composition of people vaccinated or receiving booster doses. Moreover, CDC is not reporting racial and ethnic data for vaccinations among children.

Race/ Ethnicity of People Receiving a COVID-19 Vaccine in the U.S. as of July 6, 2022

State Data on COVID-19 Vaccinations by Race/Ethnicity

To provide greater insight into who is receiving the vaccine and racial/ethnic disparities in vaccinations, KFF is collecting and analyzing state-reported data on COVID-19 vaccinations by race/ethnicity, as well as data on race/ethnicity of vaccinations among children and booster dose recipients where available.

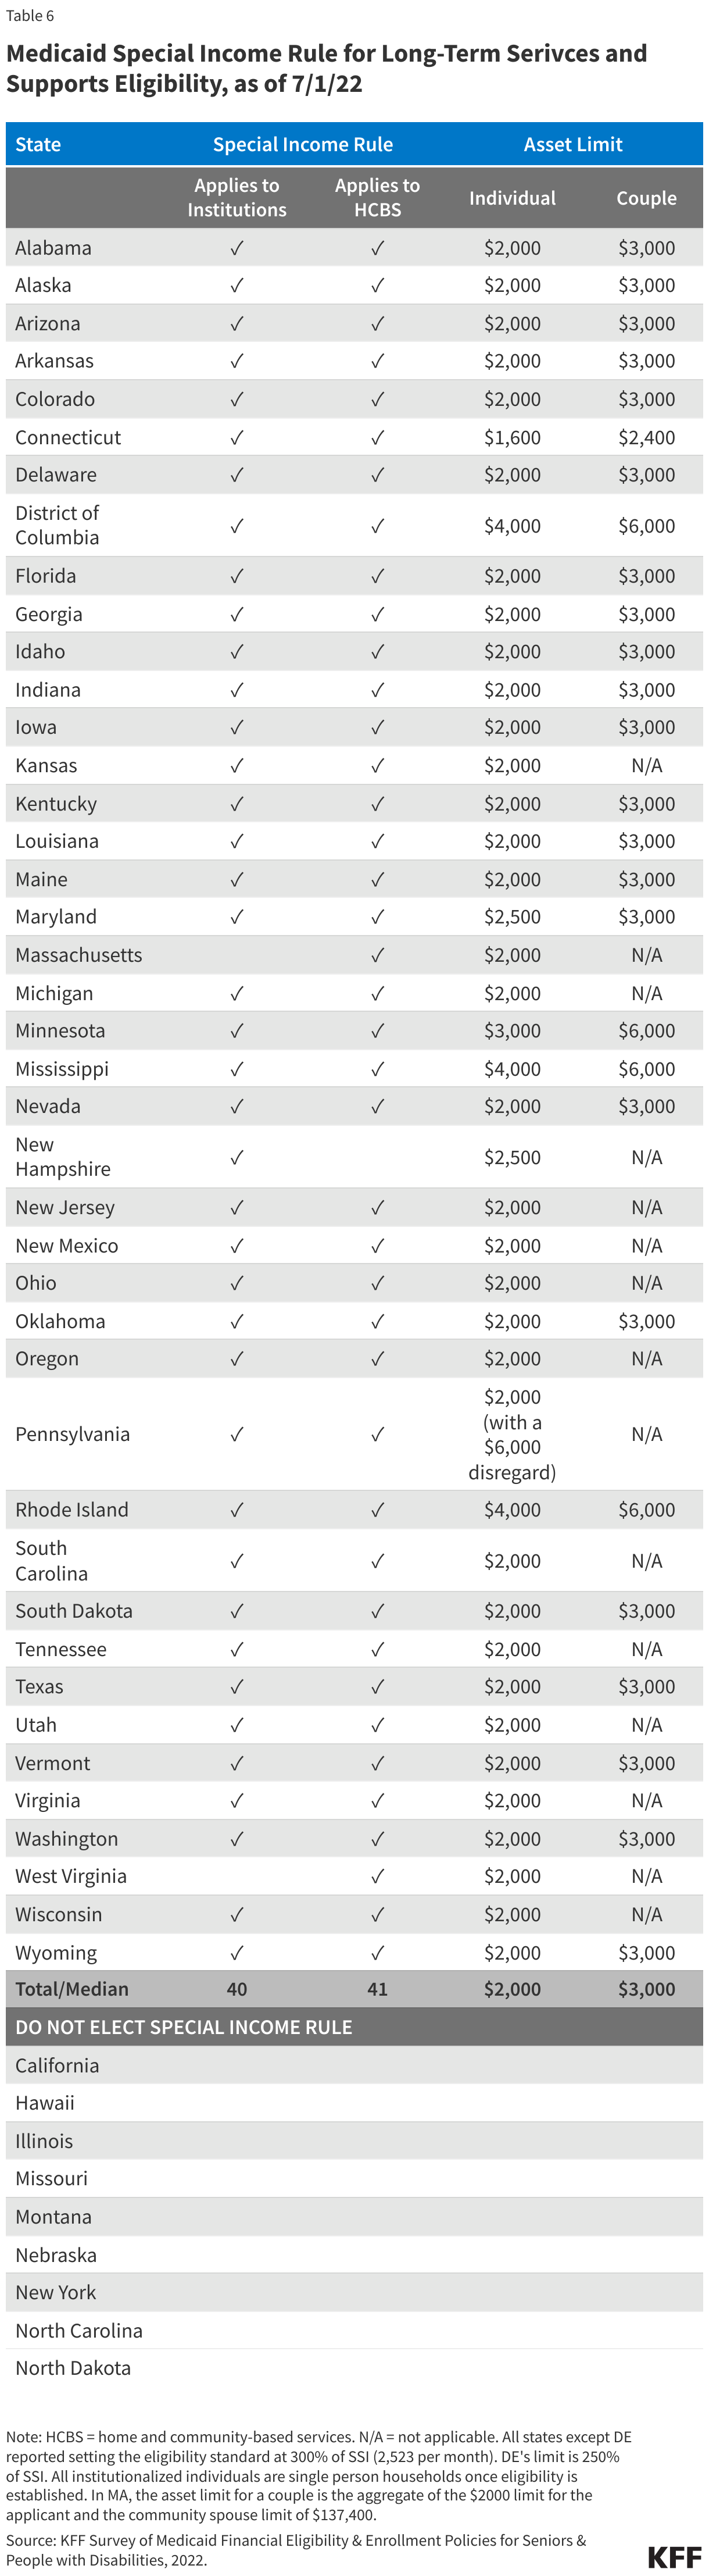
Percent Who Have Received At least One Dose

As of July 11, 2022, 41 states and Washington D.C. were reporting vaccination data by race/ethnicity, including 39 that reported race/ethnicity of people who received at least one dose of the vaccine.1  Table 1 shows the percent of the total population who have been vaccinated by race/ethnicity in each of these 42 states and the total across 36 of these states. (Idaho, Minnesota, New Mexico, North Dakota, and Oregon are excluded from the total due to differences in their reporting of data.) It also shows the percentage point difference between vaccination rates for White people and the rates for Black, Hispanic, and Asian people. These data will differ from survey estimates of vaccination rates that are limited to adults. More than two years into the pandemic, some states have either reduced or stopped reporting their vaccination data. For example, since our last data update, Arizona, Florida, Kansas, and Michigan have all reduced the frequency of their vaccination data updates, while Kentucky, Missouri, Nebraska, and South Carolina stopped reporting vaccination data by race/ethnicity.

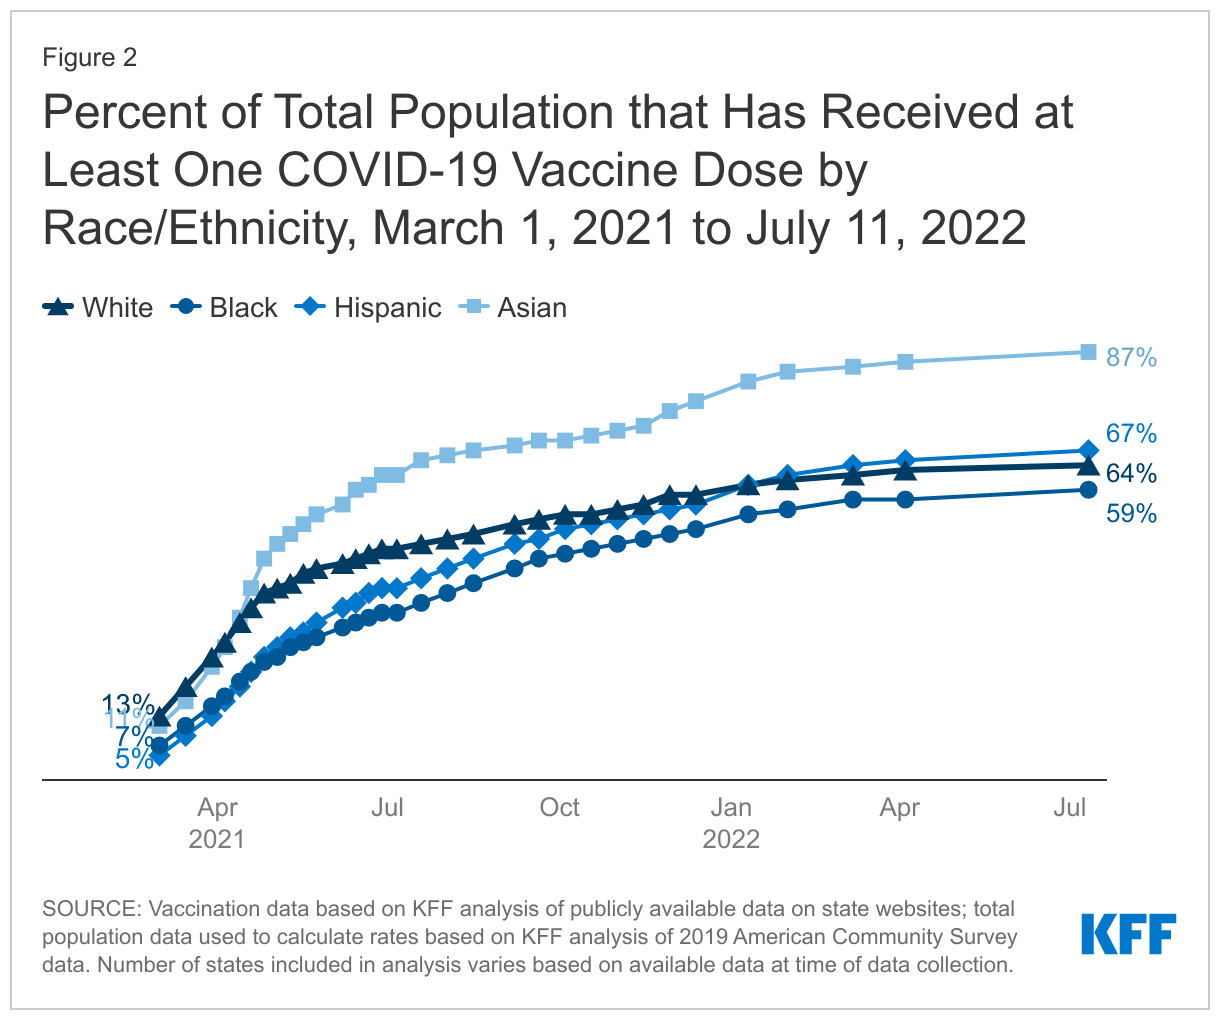
Across the 36 states for which a total vaccination rate could be calculated by race/ethnicity as of July 11, 2022, 87% of Asian, 67% of Hispanic, and 64%of White people had received at least one COVID-19 vaccine dose, higher than the rate for Black people (59%). Hispanic people had a similar or higher vaccination rate than White people in 22 states. White people had a higher rate than Black people in most reporting states, except for Alabama, Mississippi, Louisiana, Alaska, West Virginia, Utah, Idaho, and Washington. The size of these differences varied widely across states, and they have been narrowing over time. The overall vaccination rate across states for Asian people was higher compared to White people (87% vs. 64%), which was reflected across all reporting states except for North Dakota, South Dakota, and Colorado.

Percent of Total Population that has Received a COVID-19 Vaccine Dose by Race/Ethnicity, Selected States, July 11, 2022

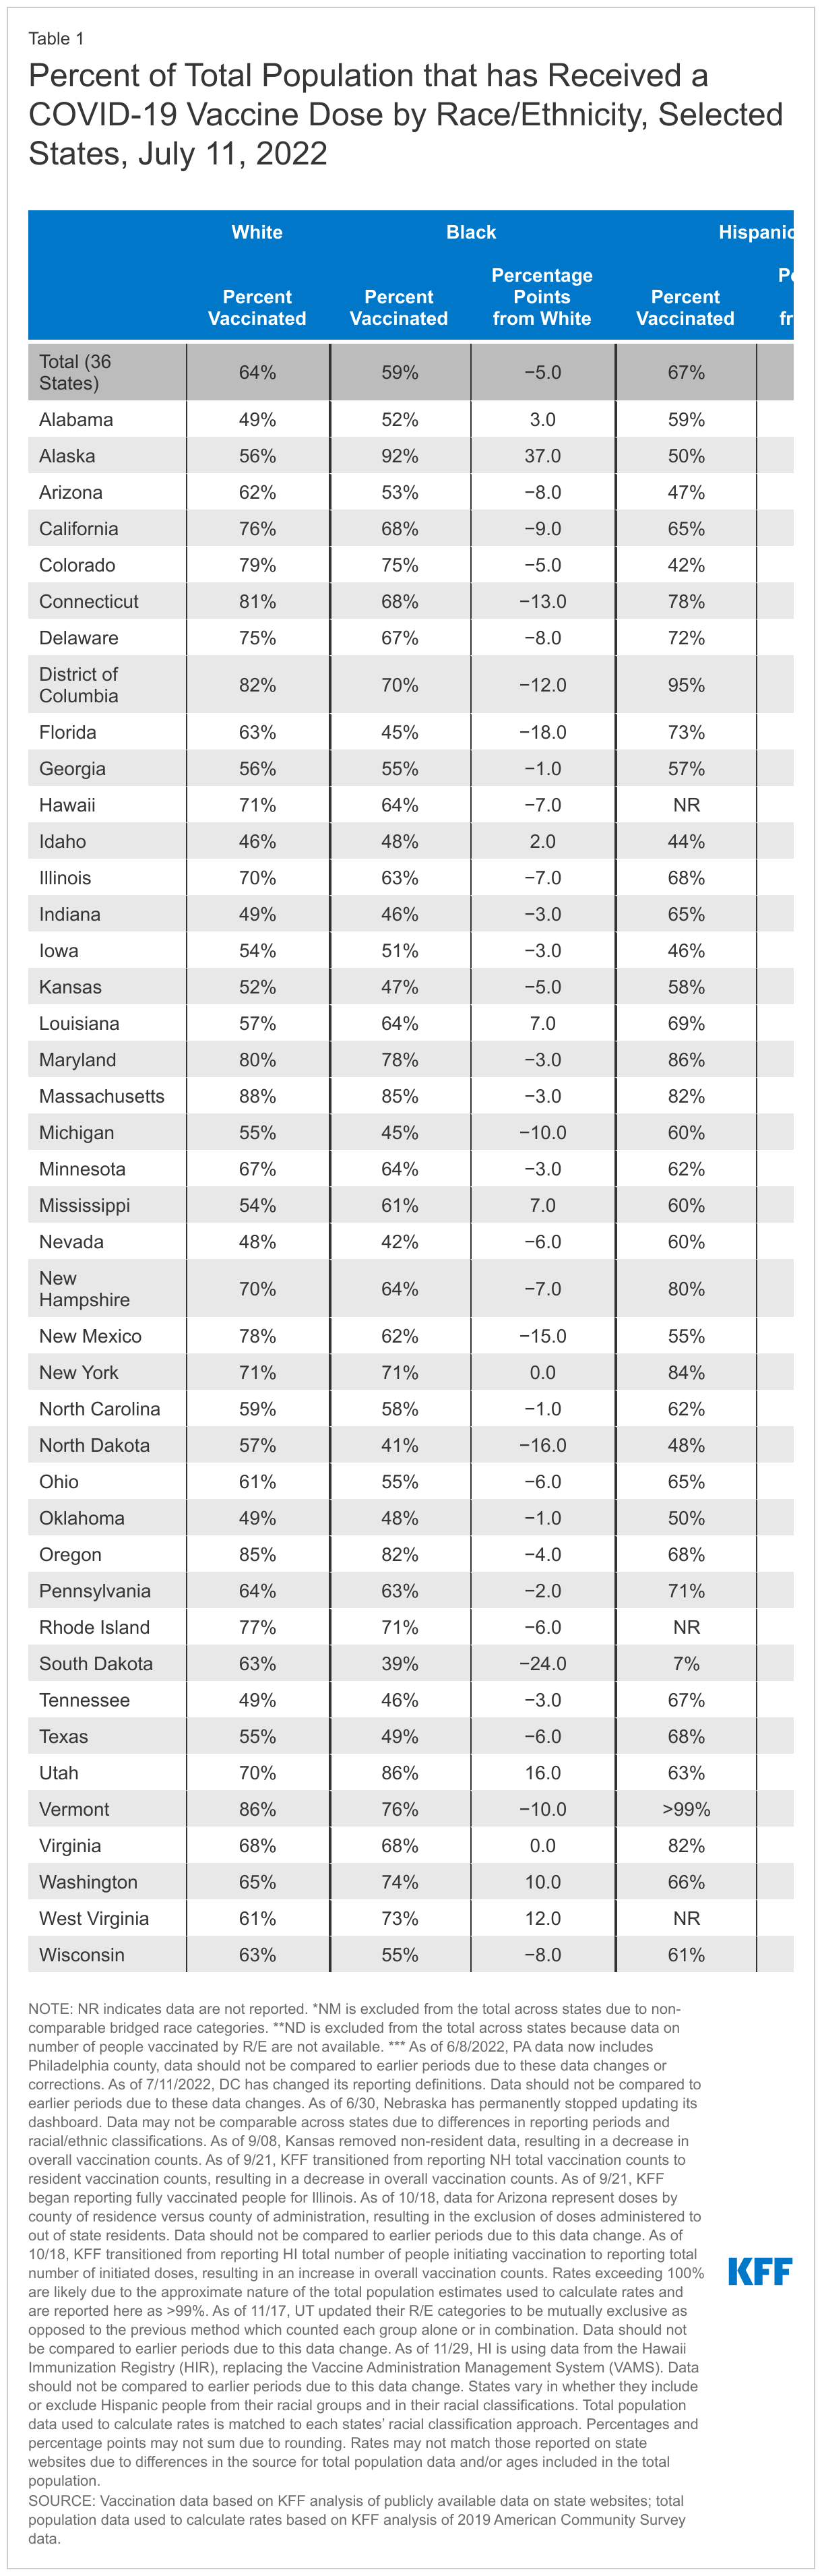
Vaccination rates across racial and ethnic groups experienced a small two percentage-point increase between our last data update on April 4 and July 11, 2022. Over the course of the vaccination rollout, differences between vaccination rates for Black, Hispanic, and White people have narrowed, and the disparity for Hispanic people has reversed. Between late April 2021, when most adults became eligible for vaccines across states, and July 11, 2022, the gap in vaccination rates between White and Black people fell from 14 percentage points (38% vs. 24%) to 5 percentage points (64% vs. 59%) while the 13% percentage point difference (38% vs. 25%) between White and Hispanic vaccination rates was eliminated, with Hispanic people having a slightly higher rate than White people since early 2022.

Percent of Total Population that has Received at least One COVID-19 Vaccine Dose by Race/Ethnicity, March 7, 2021 to July 11, 2022

Vaccinations Among Children

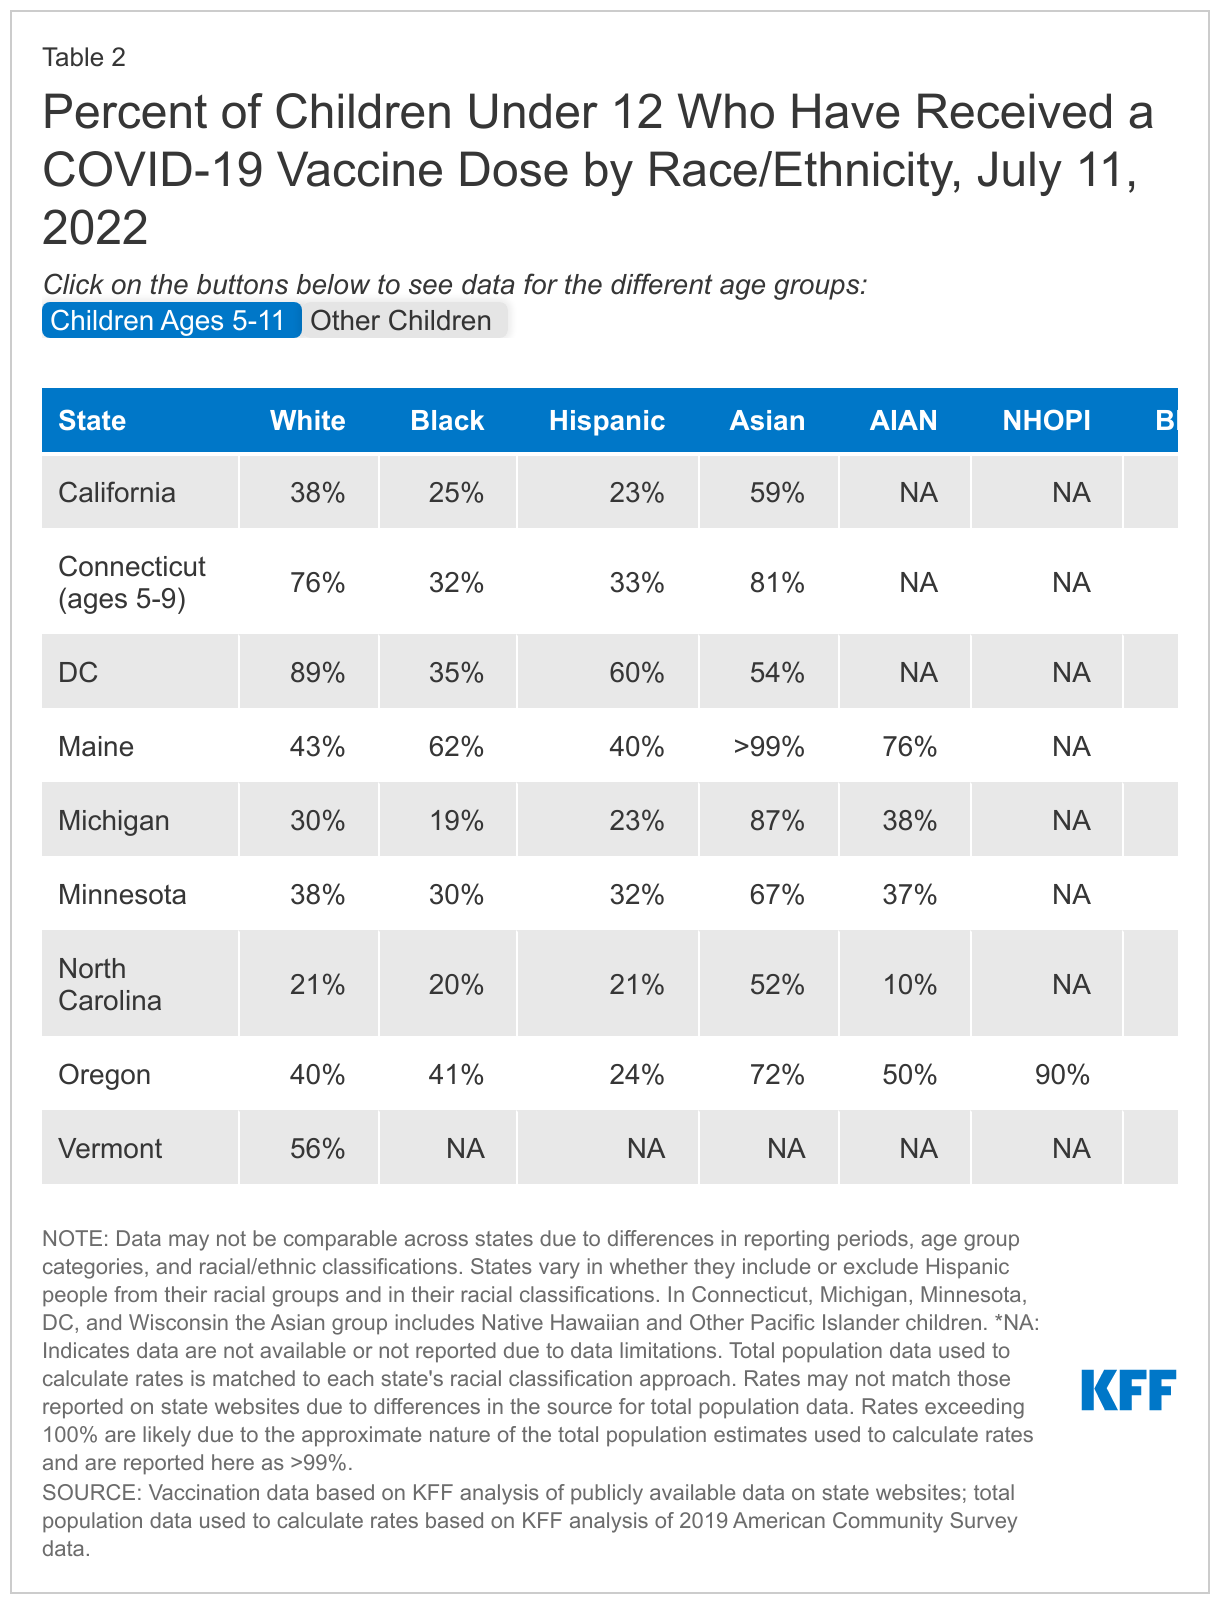
As of the week of July 11th, ten states (California, Connecticut, Kansas, Maine, Michigan, Minnesota, North Carolina, Oregon, Vermont, and Wisconsin) and Washington D.C. reported COVID-19 vaccination data by race/ethnicity for children (Table 2). While these states report race/ethnicity of vaccinated children, they vary in their racial/ethnic categorizations and age groups, making it challenging to compare vaccination data across states. Seven states (California, Maine, Michigan, Minnesota, North Carolina, Oregon and Vermont) and Washington D.C. reported race/ethnicity data separately for children ages 5-11. As of June 18th, children between ages six months and 5 years old were the most recent group to become eligible for the vaccine. As of this update, five states have begun reporting data for this age group by race/ ethnicity, but they were excluded from the analysis due to limited data.

The data from these states have mixed findings regarding vaccinations by race/ethnicity among children. Black children had lower vaccination rates than White children in most but not all reporting states. Asian children had the highest vaccination rate in most reporting states. Rates for Hispanic children were lower than rates for White children in most states among those in the age 5-11 age group. However, among children 12 and older or children overall (in states that do not include separate age breaks among children), their rates were mostly higher or similar to the rates for White children. Overall, it remains challenging to draw strong conclusions about racial equity in COVID-19 vaccinations among children due to the dearth of comprehensive data, inconsistency in reporting, and the lack of disaggregated data for smaller racial/ethnic groups, particularly NHOPI children.

Percent of Children Who Have Received at least One COVID-19 Vaccine Dose by Race/ Ethnicity, July 11, 2022

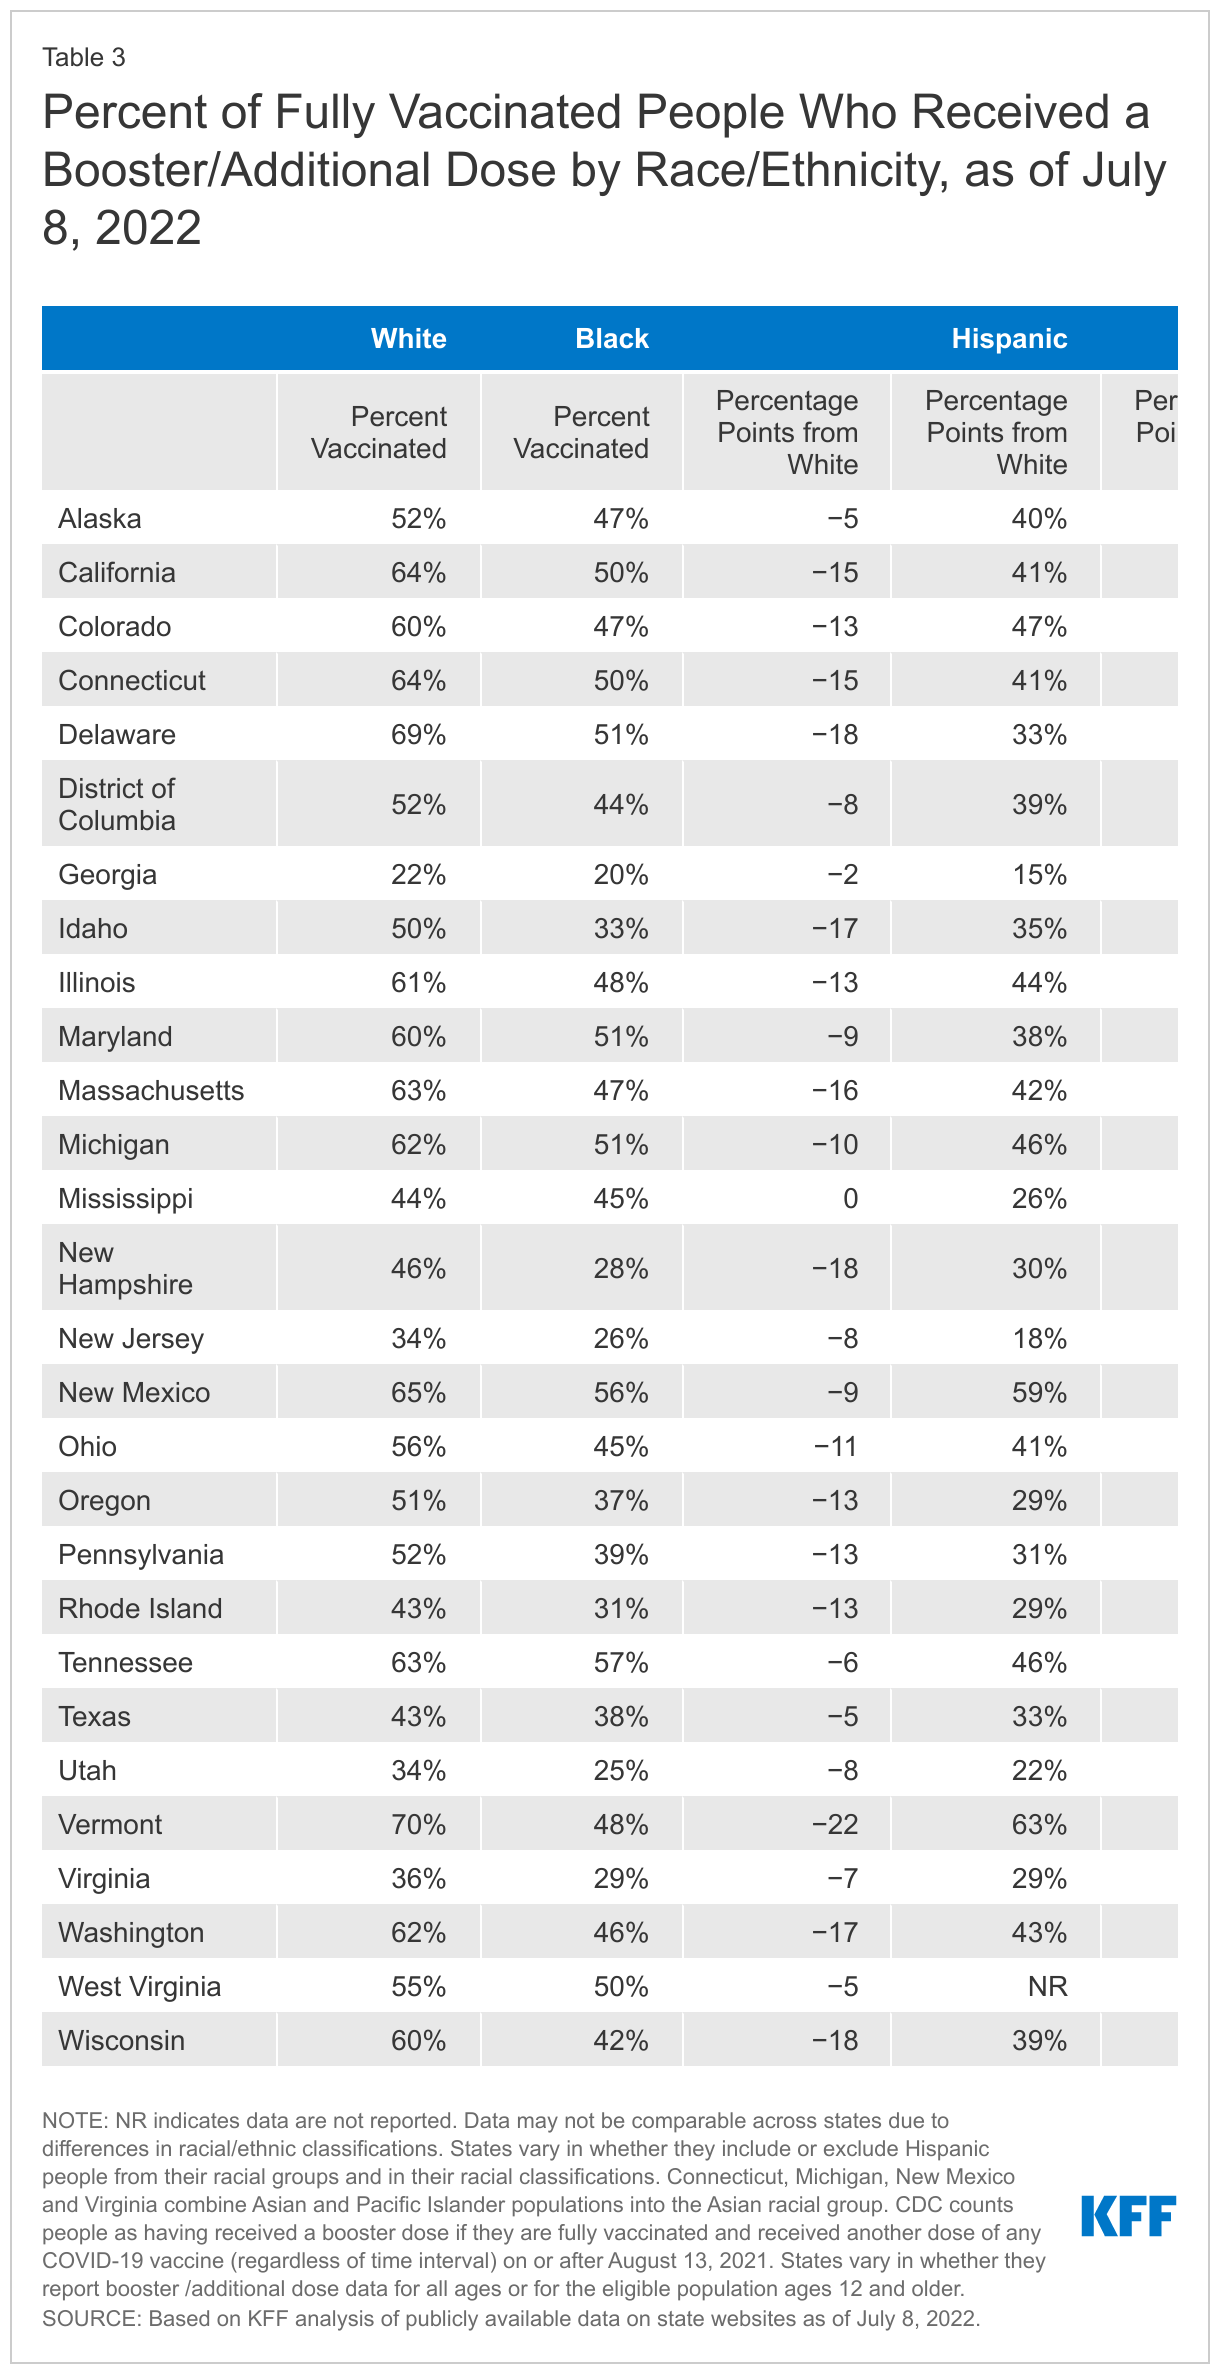
Booster Dose Recipients

As of July 8, 2022, 27 states and Washington DC were reporting vaccination booster data by race/ethnicity, a small increase from the 25 states reporting these data as of April 1, 2022. Among these states, the share of Black and Hispanic people who had received a booster shot was lower compared to White people. Findings for Asian people were more mixed, with rates similar or higher than White people in about half the states, but lower in the others (Table 3). However, like the data for children, it is difficult to make strong conclusions about disparities in booster shots due to the lack of data and inconsistency across data where it is available.

Percent of Fully Vaccinated People Who Received a Booster Dose as of July 8, 2022

Discussion

Data point to significantly increased risks of COVID-19 illness and death for people who remain unvaccinated. White people account for the largest share of people who remain unvaccinated. Black and Hispanic people have been less likely than their White counterparts to have received a vaccine over the course of the vaccination rollout, but these disparities have narrowed over time and reversed for Hispanic people.

The increasing equity in vaccination rates likely reflects a combination of efforts focused on increasing vaccination rates among people of color through outreach and education and reducing access and logistical barriers to vaccination. It may also reflect increased interest in getting the vaccine in response to variants and increases in vaccinations among younger adults and adolescents who include higher shares of people of color compared to other adults.

Despite this progress, the ongoing disparities in rates highlight the importance of continued efforts to increase vaccination rates and to address gaps in vaccination both geographically and across racial/ethnic groups. Moreover, it will be important to prevent disparities in the uptake of booster shots, and among children, among whom vaccination rates are lagging overall. At the same time, ensuring equity in access to treatments will be important, particularly as other analysis suggests potential disparities in access to oral antiviral pills.

While the data provide useful insights, they remain subject to gaps, limitations, and inconsistencies that limit the ability to get a complete picture of who is and who is not getting vaccinated. As noted, at the federal level, race/ethnicity remains unknown for about a quarter of vaccinations. Moreover, CDC does not report state level vaccination data, including booster doses, by race/ethnicity nor racial/ethnic data for vaccinations among children.

At the state level, the completeness of race/ethnicity data has improved in most states over time. However, some states still have relatively high shares of vaccinations among people classified with “unknown” race/ethnicity. Further, seven states do not report vaccination data by race/ethnicity, and some states have recently halted or reduced the frequency of their reporting of these data. Inconsistences in racial/ethnic classifications across states, as well as separate reporting of data for federally administered vaccinations, including those provided through the Indian Health Service and federal long-term care partnership program, limit the ability to interpret the data. Only a handful of states report data in a way that allows for analysis of vaccination rates by race/ethnicity among children. Similarly, state data are available on race/ethnicity of COVID-19 booster shot recipients in only half of the states.

In addition, ongoing changes and updates to the data may make it challenging to interpret the data and trend it over time. For example, some states have reported declines in cumulative vaccinations for some racial/ethnic groups over time. These declines reflect a variety of factors, including changes in state reporting methods and recoding of individuals’ racial/ethnic classifications over time. For example, several states have indicated that an individual’s self-reported race/ethnicity may change if they record a different classification when receiving a subsequent COVID-19 vaccine dose or another vaccination, such as the flu shot.

Overall, comprehensive standardized data are vital to monitor and ensure equitable access to and uptake of the vaccine. For example, without improvements in data reporting, it will not be possible to identify disparities in vaccination uptake among children.

Complete data on the distribution of vaccinations by race/ethnicity as well as the percent of the total population that have received at least one COVID-19 vaccine dose are available and downloadable through our State Health Facts Online tables. Moving forward, KFF will update these data on a periodic basis.

  1. Two states report race/ethnicity based on total doses administered and one state reports people fully vaccinated. ↩︎
News Release

Medicaid’s New Option to Extend Postpartum Coverage for 12 Months Could Prevent Hundreds of Thousands of Enrollees from Losing Coverage in the Months After Delivery

The Option, Adopted by 33 States So Far, Is Receiving Renewed Attention As Some States Ban or Curtail Abortion Access Following the Supreme Court’s Overturning of Roe v. Wade

Published: Jul 14, 2022

A new KFF analysis finds that hundreds of thousands of people are disenrolled from Medicaid each year after giving birth, which could be prevented if all states were to take up a new option to extend Medicaid postpartum coverage to 12 months.

The estimate – based on analysis of Medicaid claims data from 2018 – finds that 610,000 postpartum women were disenrolled within a year of giving birth, accounting for about 40 percent of the 1.5 million Medicaid enrollees with live births that year. A new federally funded state option to extend postpartum care was created by a provision in the American Rescue Plan Act of 2021. The new option took effect on April 1, 2022 and is available to states for five years. 

The option – adopted by 33 states so far and the focus of pending legislation in one other – is receiving renewed attention amid rising maternal mortality rates and following the Supreme Court’s decision to overturn Roe v. Wade. State policy decisions about Medicaid postpartum coverage could be especially impactful in states set to restrict abortion access, since the high court’s ruling could affect the number of births in the U.S. covered by Medicaid. Federal law only requires states to provide pregnancy-related Medicaid coverage through 60 days following childbirth, after which some enrollees may lose coverage if their income is too high to qualify for Medicaid through some other eligibility pathway.

KFF researchers find that among Medicaid enrollees with a live birth in 2018, 31 percent were disenrolled within six months after delivery and 40 percent were disenrolled within a year. Among those who were disenrolled within a year, 1 in 4 (26%) subsequently re-enrolled in Medicaid during that same 12-month period following delivery. This phenomenon, known as “churn,” can sometimes indicate that administrative barriers, rather than ineligibility, were behind the coverage loss.

There were big differences in disenrollment rates across states in 2018, due to the wide variation in states’ income eligibility limits and administrative requirements. For instance, 89 percent of Medicaid enrollees in Texas with a live birth that year were disenrolled within the 12 months following delivery, compared to 9 percent of enrollees in Washington D.C.

KFF analysts also found that disenrollment rates were twice as high in states that had not implemented the Affordable Care Act’s Medicaid expansion. Sixty-one percent of postpartum Medicaid enrollees lost coverage within a year after delivery in non-expansion states, compared to 29 percent in expansion states.

The effects of the new option to extend Medicaid postpartum coverage for 12 months will not be felt until the end of the pandemic-era continuous enrollment requirement in Medicaid. It requires states to provide continuous coverage for Medicaid enrollees until the end of the month in which the public health emergency (PHE) ends in exchange for enhanced federal Medicaid funding for states during the COVID-19 emergency. The continuous enrollment requirement has helped prevent coverage loss and churn among enrollees, including postpartum enrollees, during the pandemic.

For more data and analyses about Medicaid postpartum coverage and women’s health, visit kff.org.

Medicaid Enrollment Patterns During the Postpartum Year

Authors: Bradley Corallo, Jennifer Tolbert, Heather Saunders, and Brittni Frederiksen
Published: Jul 14, 2022

Executive Summary

The Medicaid program finances about 4 in 10 births in the U.S. each year and a majority of births in some states. Federal law requires states to provide pregnancy-related Medicaid coverage through 60 days postpartum. After the 60-day postpartum period, however, some enrollees lose coverage if their income is too high to continue qualifying for Medicaid through another eligibility pathway. Rising maternal mortality rates, along with the recent Supreme Court decision to overturn Roe v Wade, have increased attention on Medicaid coverage for pregnant people. A provision in the American Rescue Plan Act (ARPA) of 2021 gives states a new option to extend Medicaid postpartum coverage to 12 months via a state plan amendment (SPA). This new option took effect on April 1, 2022 and is available to states for five years. Using Medicaid claims data from 2018, this brief examines enrollment patterns in the year following childbirth. Key findings include:

  • Among Medicaid enrollees with a live birth in 2018, 31% were disenrolled from Medicaid coverage within six months and 40% disenrolled within a year after delivery.
  • In the states that had not implemented the Affordable Care Act’s (ACA) Medicaid expansion as of 2018, 61% of postpartum enrollees were disenrolled within a year after delivery – double the rate of 29% found in Medicaid expansion states.
  • Among those who were disenrolled from Medicaid coverage in the postpartum year, roughly 1 in 4 (26%) experienced “churn,” meaning that they disenrolled and then subsequently re-enrolled within 12 months of delivery.
  • In 2018, we estimate 610,000 enrollees with a live birth would have been able to retain continuous Medicaid coverage had a 12-month postpartum coverage extension been in place. These are among the roughly 1.5 million enrollees with a live birth who potentially could have benefited from a 12-month postpartum coverage extension by providing continuous eligibility for a full year after childbirth and reducing administrative hurdles for enrollees to maintain coverage.

Although a majority of states have extended postpartum Medicaid coverage under ARPA, the effects of the extension will not be felt until the end of the continuous enrollment requirement in Medicaid, which is in place until the end of the month in which the national public health emergency ends. However, state policy decisions about Medicaid postpartum coverage could be especially impactful in states set to restrict abortion access following the Supreme Court’s decision to overturn Roe v Wade, which could affect the number of births covered by Medicaid.

Introduction

The Medicaid program finances about 4 in 10 births in the U.S. each year and a majority of births in some states. Federal law requires states to provide pregnancy-related Medicaid coverage through 60 days postpartum. After the 60-day postpartum period, however, some enrollees lose coverage if their income is too high to qualify for Medicaid through another pathway, such as a low-income parent or through the Medicaid expansion. Maintaining consistent coverage during the postpartum period is important for monitoring individuals’ health following pregnancy, including pregnancy-related chronic and mental health conditions that often require attention far beyond 60 days postpartum. Rising maternal mortality rates, along with the recent Supreme Court decision to overturn Roe v Wade, have increased attention on Medicaid coverage for pregnant people.

To improve maternal health and coverage stability, a provision in the American Rescue Plan Act (ARPA) of 2021 gives states a new option to extend Medicaid postpartum coverage to 12 months via a state plan amendment (SPA). This new option took effect on April 1, 2022 and is available to states for five years. To date, 34 states (including DC) have implemented or plan to implement 12-month continuous eligibility for postpartum people. The Biden-Harris Administration recently included continuous Medicaid coverage for 12 months postpartum as a key element in its Blueprint for Addressing the Maternal Health Crisis. Notably, Congress included a 12-month postpartum coverage extension in Medicaid as a requirement for states in the Build Back Better Act that passed the House, and there are ongoing discussions in the Senate about the scope of a potential budget reconciliation package that could include a postpartum coverage extension in Medicaid.

Using Medicaid claims data for enrollees with a live birth in 2018, this brief examines enrollment patterns in the 12 months after delivery. We also estimate the number of enrollees who would benefit from the 12-month continuous eligibility policy for postpartum people if adopted by all states. See the methods section for more details about the data source and how we conducted the analysis.

Who Qualifies for Pregnancy and Postpartum Medicaid Coverage?

The federal government requires states to provide Medicaid coverage for pregnant individuals through 60 days postpartum and establishes a minimum income threshold of 138% of the federal poverty level (FPL).1  However, most states have set income eligibility for pregnant individuals above the federal minimum of 138% FPL, thus eligibility levels for pregnant people are higher than for low-income parents and expansion adults. The gap between states’ eligibility income limits for pregnancy and parents/other adults is generally larger in states that have not implemented the Medicaid expansion because these states have income limits for parents that are lower than 138% FPL (Figure 1). For example, income limits for parents in non-expansion states ranged from 18% FPL in Texas and Alabama to 105% FPL in Maine, although Maine would later implement the ACA expansion in 2019. In contrast, the median state income limit for pregnant individuals in 2018 was 200% FPL, ranging from 138% FPL in four states (ID, LA, OK, SD) to 380% FPL in Iowa. In that year, all but one state (LA) set eligibility limits for pregnant individuals that were higher than the limits for parents or expansion adults.

Upper Income Limits For Medicaid Enrollees Qualifying Through A Pregnancy Pathway Vs. Other Pathways For Adults, As of January 2018.

How Many Enrollees Lose Coverage During the Postpartum Year?

Among Medicaid enrollees with a live birth in 2018, 31% were disenrolled within six months and 40% disenrolled within a year after delivery (Figure 2). Many Medicaid enrollees are disenrolled after their 60-day postpartum coverage ends because their income is too high to qualify through another eligibility pathway, such as low-income parents or the Medicaid expansion. Additionally, some enrollees who continue to be eligible for Medicaid through another pathway may be disenrolled because of administrative barriers during eligibility redeterminations at the end of the postpartum coverage period. Due to wide variation in states’ income eligibility limits and administrative requirements for renewing coverage, there is considerable variation in disenrollment rates across states. The share of enrollees disenrolled within the postpartum year ranged from 9% in DC to 89% in Texas.

Share Of Medicaid Enrollees With A Live Birth In 2018 Who Were Disenrolled At Selected Periods Following Delivery

In the states that had not implemented the Affordable Care Act’s (ACA) Medicaid expansion in 2018, 61% of postpartum enrollees were disenrolled within a year after delivery, which is double the rate of 29% found in Medicaid expansion states (Figure 3). Notably, the five states (DC, CA, LA, WA, AZ) with the lowest 12-month disenrollment rates were all Medicaid expansion states, and all had disenrollment rates less than 20% (approximately half the national rate). Conversely, the five states (KS, MO, ID, SD, TX) with the highest 12-month disenrollment rates were all non-expansion states as of 2018, and all had rates exceeding 60% (roughly 1.5 times the national rate). Idaho and Missouri implemented the Medicaid expansion in in 2020 and 2021, respectively, and, as a result, their disenrollment rates are likely different today than what they were in 2018. The difference in disenrollment rates between Medicaid expansion and non-expansion states is expected, given higher income limits for adults in expansion states. In non-expansion states, postpartum people who are disenrolled may end up in the coverage gap if their income is above their state’s Medicaid eligibility limit for parents but below the poverty level, making them ineligible for premium subsidies in the ACA Marketplace. Without access to affordable Marketplace coverage, individuals in the coverage gap are more likely to end up uninsured. Expansion states cover adults up to 138% FPL, and postpartum enrollees in these states with incomes above this level who no longer qualify for Medicaid should be able to access premium subsidies in the Marketplace. Prior research suggests that those in non-expansion states are more likely than those in expansion states to become uninsured after the postpartum coverage ends.

Share Of Medicaid Enrollees With A Live Birth In 2018 Who Were Disenrolled At Selected Periods Following Delivery, Medicaid Expansion Vs. Non-Expansion States

Among postpartum enrollees who were disenrolled from Medicaid coverage in the postpartum year, roughly 1 in 4 (26%) experienced “churn,” meaning that they disenrolled and then subsequently re-enrolled within 12 months of delivery. For postpartum individuals, the most likely cause of churn is that they are unable to complete the renewal process when their postpartum coverage ends despite remaining eligible; however, short-term income fluctuations that cause enrollees to become temporarily ineligible can also cause churn. Churning on and off coverage can disrupt the continuity and quality of care for postpartum enrollees as well as causing additional administrative costs to state Medicaid agencies.2 

How Many Medicaid Enrollees Would Benefit from Extending Postpartum Coverage to 12 Months?

We estimate that there were roughly 1.5 million enrollees with a live birth covered by Medicaid in 2018 who potentially could have benefited from a 12-month postpartum coverage extension and, of these, approximately 610,000 individuals who were disenrolled in the postpartum year and would have otherwise retained coverage throughout the year. Extending postpartum coverage to 12 months would push back coverage redeterminations for all postpartum individuals to a full year after the pregnancy ends, reducing administrative hurdles for enrollees to maintain coverage. However, the 12-month continuous eligibility policy would directly benefit those postpartum individuals who lost coverage during the postpartum year. A 12-month postpartum coverage extension would be particularly impactful in non-expansion states because these states have higher disenrollment rates during the postpartum year compared to expansion states. Our findings are based on estimates for the 50 states and DC and are similar to another national study using other data sources that found 720,000 enrollees would have otherwise stayed continuously eligible through postpartum year had all states implemented the coverage extension in 2021.

Thousands of people experiencing a pregnancy loss could also benefit from a 12-month postpartum coverage. We estimate that at least 50,000 enrollees with a pregnancy loss3  in 2018 were disenrolled in the postpartum year but would have otherwise stayed continuously enrolled if all states had implemented a 12-month coverage extension. Our estimate is likely an undercount because individuals who did not seek medical attention for a miscarriage would not be identifiable in the claims data used in this analysis and because we limited our estimate to individuals who had pregnancy as their primary eligibility pathway when their pregnancy loss occurred.4  Overall, if we include both enrollees with a live birth as well as those with a pregnancy loss, we estimate that roughly 660,000 individuals lost coverage during the postpartum year and would have otherwise remained continuously enrolled had all states implemented 12-month continuous eligibility for postpartum coverage.

Looking Ahead

The recent Supreme Court decision to overturn Roe v Wade and eliminate the constitutional right to abortion could increase the role Medicaid plays in covering pregnant and postpartum individuals. A number of states currently have laws in place that are intended to severely restrict or ban abortions. Most of the states that have not extended postpartum Medicaid coverage have laws in place to restrict or ban access to abortions. These laws restricting access to abortions will have a more significant impact on low-income individuals who do not have the money or means to travel to another state to obtain an abortion, which could affect the number of births covered by Medicaid and the need for postpartum coverage.

Although a majority of states have extended postpartum Medicaid coverage under ARPA, the effects of the extension will not be felt until the end of the continuous enrollment requirement in Medicaid. Provisions in the Families First Coronavirus Response Act (FFCRA) require states to provide continuous coverage for Medicaid enrollees until the end of the month in which the public health emergency (PHE) ends in order to receive enhanced federal funding. The PHE is in effect through mid-July 2022, although it is expected that the PHE will be extended for at least another three months (because the Biden administration did not provide a 60-day notice to states as of May 2022). The continuous enrollment requirement has helped prevent coverage loss and churn among enrollees, including postpartum enrollees, during the pandemic. However, in states that have not extended postpartum Medicaid coverage, we expect disenrollment and churn rates among enrollees in the postpartum year to return to levels that are comparable to those found in this analysis when the PHE ends.

Methods

Data Source

Our analysis uses the Transformed Medicaid Statistical Information System (T-MSIS) Analytic Files (TAF) Research Identifiable Files (RIF). We drew from the 2018 Inpatient and Other Services claims files (Release 1) linked with the 2018-2019 Demographic Eligibility (DE) Base File and DE Dates File (Release 1 for 2018, Preliminary for 2019). We used BENE_ID to link files when available and, when BENE_ID was missing, we used MSIS_ID to link files (see the TMSIS User Guide for information on linking variables). We identified Medicaid enrollees with a live birth or pregnancy loss (including miscarriage, still birth, or termination) from the claims and then used the eligibility files to estimate enrollment patterns and eligibility pathways at various periods postpartum.

State Exclusion Criteria

We use 39 states in our analysis. We exclude 12 states (AL, FL, KY, MD, NE, NH, NM, OK, RI, TN, UT, and WY) due to missing or inconsistent data based on state-level information available from the DQ Atlas as well as our own analysis of the CDC Wonder Natality Files. We used several measures from the DQ Atlas to assess states’ data quality, shown in Appendix Table 1. We further excluded states whose final sample in this analysis had a difference of 20% or more from the number of Medicaid-covered births in the CDC Wonder Natality Files. In total, our final sample included 1,286,000 deduplicated enrollees with a live birth, while CDC Wonder reported 1,301,000 newborns covered by Medicaid (a difference of -1.1% from CDC Wonder).

State Exclusions from Analysis

Enrollee Sample Selection

To identify Medicaid enrollees with a live birth or pregnancy loss in 2018, we followed the methods and all reference codes provided by Calkins et al. in their technical specifications for “Maternal and Infant Health (MIH): Identifying Pregnant and Postpartum Beneficiaries in Administrative Data,” available on the CMS website. We did not utilize “unknown” pregnancy outcomes in our analysis (an optional approach provided by Calkins et al.). In addition to flagging individuals with a live birth or pregnancy loss, we also captured the procedure or service start date for each claim that we flagged. Then, we rolled up the claim level data to the individual level, keeping the earliest date of service for live births and still births. About 2% of enrollees with a pregnancy loss had multiple claims that were more than 180 days apart and likely represented multiple pregnancy losses in the year. In a small number of cases where women had both a pregnancy loss and a live birth, we prioritized the live birth data and dropped all information on pregnancy loss to make the categories mutually exclusive. Our final sample included 1,616,000 unduplicated Medicaid enrollees with live birth or pregnancy loss. This included 1,286,000 unduplicated enrollees with a live birth and 329,000 unduplicated enrollees with a pregnancy loss.

Calculating Disenrollment and Churn During the Postpartum Period

To estimate postpartum disenrollment, we used the DE Dates File’s start and end dates on enrollment spans. In cases where people disenrolled and then re-enrolled the next day, we merged the two enrollment spells into one. Then, we calculated the disenrollment rates as the difference in days from the pregnancy end date to the next disenrollment date. To calculate “churn,” we counted the number of individuals who disenrolled and then re-enrolled within 365 days of their pregnancy end date.

Extrapolating Findings from 39 States to 50 and DC

We extrapolate our 39-state findings to a 50-state and DC estimate to provide a national number that illustrates the impact that a 12-month postpartum extension would have if all states implemented the policy in 2018. Our extrapolation simply applies a national level multiplier without any adjustments. Our analysis of 39 states’ data identified 1,286,000 individuals with a live birth; 511,000 enrollees with a live birth who disenrolled in the postpartum year; 329,000 enrollees with a pregnancy loss; 101,000 people with a pregnancy loss who disenrolled in the postpartum year; and 40,000 individuals with a pregnancy loss who disenrolled in the postpartum year and who had pregnancy as their primary eligibility pathway at the time of lost pregnancy. Based on annual Medicaid enrollment available on the CMS website, we found that the 39 states in our analysis represent approximately 84% of all Medicaid enrollees nationally. We assume that our findings also represent 84% of the enrollees who would benefit from a postpartum coverage extension, and so we divided our estimates by 0.84 to create a national estimate and rounded to the nearest 10,000.

These extrapolations may underestimate the impact of a 12-month postpartum extension because our sample of 39 states had a larger proportion of enrollees that lived in ACA expansion states (78%) compared to the national annual enrollment in 2018 reported by CMS (70% living in expansion states). Because expansion states have lower disenrollment rates, the higher representation of those states among our sample likely underestimates the number of individuals who would have stayed continuously enrolled under a postpartum coverage extension when we extrapolate our findings to the full 2018 Medicaid population.

  1. In 2018, the federal poverty level (100% FPL) was $12,140 for an individual and $20,780 for a family of three (these amounts are not adjusted for inflation). ↩︎
  2. While another KFF analysis on churn in the overall Medicaid/CHIP population also uses 2018 TMSIS data, the findings are not comparable due to important differences in the definition of “churn.” The previous KFF study defined churn as anyone with a coverage gap of 365 days or less, with the gap starting or ending at any point in the reference year (2018). However, this analysis on postpartum enrollees defines churn as a coverage gap that started and ended within the postpartum year (or within 365 days of childbirth). ↩︎
  3. As described in the methods section, we used reference codes from Calkins et al. (available on the CMS website) to identify enrollees with a live birth, miscarriage, still birth, or termination. As noted by Calkins et al., terminations are unlikely to appear in the TAF RIF claims data because, with limited exceptions, states are prohibited from using federal Medicaid funding to pay for abortions. ↩︎
  4. We limited the estimates for pregnancy to those that were disenrolled and had pregnancy as their primary eligibility pathway to be conservative in our approach. According to federal guidance, all pregnant individuals qualify for postpartum coverage if their pregnancy is known to the state Medicaid agency – e.g., because the pregnancy is reported by the enrollee or identified by the state through claims – regardless of their primary eligibility pathway. If we assume that having a Medicaid-covered medical visit for pregnancy loss would qualify the enrollee for postpartum coverage (because the visit would be identifiable in claims), then we would increase our original 51-state estimate from 50,000 to 120,000 enrollees with a pregnancy loss would have otherwise stayed continuously enrolled through the postpartum year. ↩︎

Could Consumer Assistance be Helpful to People Facing Medical Debt?

Authors: Karen Pollitz and Kaye Pestaina
Published: Jul 14, 2022

A recent KFF Health Care Debt Survey finds that most adults (57%) have experienced owing money due to medical or dental bills at some point in the past 5 years. Among insured adults under age 65, the figure is 61%. Serious health consequences may result from health care debt as many in debt are denied services or skip care to avoid further bills; and financial consequences can also be severe, including depletion of savings, going without other household needs, and damage to credit scores.  Many adults with health care debt say they received a medical or dental bill that they thought contained an error and most say a state consumer assistance program would be helpful to them.

Billing Errors Confound Consumers and Cause Debt

The KFF Survey found that a majority (53%) of adults with health care debt, and 43% of all adults, say they have received a medical or dental bill they thought contained an error. (Figure 1) About two-thirds of these adults say the error involved being billed for something that should have been covered by their health insurance.  Other provider errors were also reported, including being billed for services never received or for bills that had already been paid.

Many, Including About One-Third Without Health Care Debt, Report Receiving Erroneous Medical Bills

The vast majority (79%) of adults with health care debt who say they received a bill that contained an error took some action to dispute the mistake with their insurer or provider, and in many cases they succeeded in resolving the mistake.  However, 51% of all adults with health care debt who received an erroneous bill either could not successfully fix the disputed bill or did not even try to dispute it in the first place. (Figure 2) In addition, about a third (32%) of adults with health care debt who received a bill they thought had an error say they have had a disputed bill sent to collections, which can have a significant impact on their credit score and their future access to credit, loans and financing.

Half Of Those With Debt Who Had A Medical Bill Error Successfully Resolved The Dispute While Three In Ten Were Unable To Resolve The Dispute

Consumers Want Help With Billing and Claims Errors

The KFF survey asked adults about policy interventions to address or assist those with health care debt, including State-Consumer Assistance Programs (CAPs).  CAPs were established in 2010 to help individuals, including those with employer coverage, resolve problems with insurance providers and disputed medical bills. By law, CAPs not only help consumers file appeals and resolve billing disputes, they report data to regulators on consumer experiences to inform oversight.  However, Congress has not provided funding for CAPs since the initial appropriation of $30 million in 2010. As a result, a few programs have since closed their doors; most others operate on state funding and other outside resources, though they could help more people if federal funding resumed.

The KFF survey finds that seven in ten adults with health care debt say they think a CAP could be helpful to them personally.  Black (76%) and Hispanic (80%) adults with debt were more likely than their White counterparts to think these programs could have helped. (Figure 3)

A report on the first year operations of CAPs found they saved consumers millions of dollars by resolving health coverage disputes.  Subsequent reports by several state CAPs show programs still in operation continue to help consumers save millions in medical bills each year; for some CAPs, assisting consumers with medical debt has become a major focus.

Most Adults With Health Care Debt Think State Consumer Assistance Programs Would Be Helpful To Them

In recent years Congress has taken other steps – including the No Surprises Act – to strengthen health insurance protection and limit patients’ exposure to out-of-pocket medical bills.  However, protections may effectively be limited if consumers aren’t aware of their new rights or how to pursue them – for example, another recent KFF poll found nearly 8 in 10 adults know little or nothing about this new law.  CAPs were established to educate consumers about health insurance and their protections and to provide expert help resolving problems that arise.  Such help would be welcomed by most consumers, though funding for it continues to compete against other priorities.

News Release

Women who Give Birth Incur Nearly $19,000 in Additional Health Costs, Including $2,854 More that They Pay Out of Pocket

Analysis Estimates Costs Associated with Pregnancy, Childbirth and Postpartum Care Based on Claims Data from Large Employer Health Plans

Published: Jul 13, 2022

The health care costs associated with pregnancy and childbirth average almost $19,000, including $2,854 paid out-of-pocket, a new KFF analysis of large employers’ insurance claims finds.

Unlike other analyses that examine costs of specific pregnancy-related services, such as a vaginal or cesarean delivery, this new analysis compares three years of health care claims for reproductive-aged women who gave birth to claims for women who had not given birth.

The analysis finds women who give birth incur an extra $18,865 in total health care spending over three years than other women. This includes an average of an additional $19,906 spent on inpatient and outpatient costs, which is partially offset by a $1,040 reduction in prescription drug spending. The lower drug costs likely reflect that pregnant women do not take birth control pills, which is one of the most common prescriptions for women of reproductive age, and that some other drugs are considered unsafe to take during pregnancy.

Differences in health spending vary by delivery type. Women who give birth via cesarean section spend an average of $26,280 more on health care than those who do not give birth, including an average of $3,214 out of pocket. Those with a vaginal delivery spend an average of $14,768 more, including $2,655 out of pocket.

The analysis examines claims for women of reproductive age (15-49) from 2018 through 2020 in the IBM MarketScan Encounter Database, comparing total spending for women of similar ages who did and did not give birth. It does not include health spending for newborn babies. The analysis is available through the Peterson-KFF Health System Tracker, an online information hub dedicated to monitoring and assessing the performance of the U.S. health system.

Abortion Decision Renews Questions About Employer Access to Health Information

Author: Kaye Pestaina
Published: Jul 12, 2022

The U.S. Supreme Court’s ruling overturning Roe v. Wade has led to new questions about privacy protections for health information about an individual’s use of reproductive services such as abortion. Employer plans that cover these services, and that are now adding a travel benefit for employees to access this care, might create a paper trail of claims information or reimbursement records. Some states with laws to ban or criminalize abortion may seek this information to bring actions against any entity involved in assisting to obtain an abortion, which could include employers as well as providers. Federal privacy protections have long restricted the use and disclosure of personal health information to and by employer-sponsored plans, but these protections are not fool proof and will likely be tested going forward by states looking to implement abortion bans and related restrictions.

Employer plan access to employee abortion information

HIPAA privacy regulations, effective since 2003, place restrictions on the ability of employer-sponsored plans to access, use and disclose health information without specific written authorization from the individual who is the subject of the information. HIPAA – which stands for the Health Insurance Portability and Accountability Act of 1996 — applies to employer-sponsored health plans as well as most health care providers, and health care clearinghouses.  An employer’s major medical plan, a health reimbursement arrangement (HRA) and a flexible spending account (FSA) are all considered group health plans that must meet HIPAA’s privacy protections.

Plans can use and disclose information needed for plan administration without individual authorization. HIPAA rules allow employer plans to use protected health information to administer benefits. This includes the review and payment of claims as well as for “health care operations,” such as quality assessment and population-based activities related to reducing benefit costs. Employers who self-insure their benefits typically contract with outside entities to administer parts of their health program. Typically, a third-party administrator (TPA) handles the processing of medical claims, a different entity (such as a pharmacy benefit manager (PBM)) administers prescription drug benefits, and yet another entity might handle reimbursements under an employer’s flexible spending account. The HIPAA rules require employer plans to enter into a business associate agreement with each of these outside vendors so that they agree to abide by the same HIPAA requirements as the employer plan.

Only the “minimum necessary” needed to perform the administrative function is allowed. Depending on the design of the plan, human resource (HR) personnel for an employer might have access to information about health care services provided to employees even though outside vendors perform most plan administration functions. For example, HR personnel might use health information to administer eligibility, assist employees with claims questions or review benefit utilization and costs.  HIPAA rules require that plans only access the minimum necessary information to perform these functions. Generally, employer personnel would not need individually identifiable claims information about abortion and could instead rely on aggregated information to administer the plan. However, HR personnel for smaller employers might still be able to deduce individual names associated with claims.  To the extent that a travel reimbursement benefit is administered in house, some HR personnel will have this information.

Employers must have a firewall between “plan” and “employer” Information.  Concern about the confidentiality of employee medical information by an employer who sponsors a group health plan is not a new issue. HR personnel might have sensitive health information that they, in theory, could use to take detrimental and discriminatory employment actions. While HIPAA applies to group health plans, it does not apply to the employer itself. This creates a confusing framework for compliance, since a group health plan is not usually a separate physical entity.  HIPAA regulations nevertheless create a distinction between the plan and employer and provide that a plan cannot disclose health information to an employer plan sponsor unless the employer certifies in writing that it will, among other things, not use the information for employment related actions such as fitness for duty and related actions. The employer must also ensure that there is “adequate separation” between the group health plan functions and the employer functions through policies and procedures such as walling off employees who use health information to administer the health plan from those that perform other HR functions. Practically, many HR professionals wear two hats, both benefits and HR functions, and are expected to safeguard the information under HIPAA and other federal laws such as the confidentiality provisions of the Americans with Disabilities Act. They also cannot use this health information to discriminate or retaliate against an employee under federal statutes such as the Pregnancy Nondiscrimination law and some state laws.

Looking forward

Recent guidance from the Office for Civil Rights at the U.S. Department of Health and Human Services (HHS), while stating the protections under the HIPAA privacy law for reproductive healthcare service, puts a spotlight on HIPAA’s limits. In explaining how HIPAA protects the privacy of reproductive health information, HHS acknowledges that current regulations do allow plans to disclose this information in certain instances, such as when disclosure is required by another law or in response to a law enforcement request accompanied by a court ordered warrant or subpoena.

Some states might use these tools to try to compel employers, plans and providers to disclose information about an individual’s abortion.  In addition, the clinicians that provided the service could be targeted or criminalized depending on where they practice.  At the same time, states friendlier to abortion access may look to enact stronger privacy protections, since the federal HIPAA standards represent a floor rather than a ceiling. This new environment will put these employers and health plans on the front line of protecting access to sensitive health information in ways they may have never anticipated. Litigation battles are expected.

The focus is now on how longstanding HIPAA protections on employer health plan information work in practice. Enforcement of HIPAA’s current protection rests largely with a single office within HHS. There is no ability for an individual or entity to privately bring actions to protect their health information. Enforcement activity over the past 20 years has rarely involved employer plans. In addition, cybersecurity threats to information held by employer plans and their service providers is currently under scrutiny, and HHS has acknowledged in new guidance that HIPAA requirements do not extend to health information held or stored on personal cell phones and other devices.

These confidentiality issues may be among the reasons many women with access to coverage for abortion services nonetheless pay for abortions out-of-pocket. For lower income women, paying for these services is often not an option—making confidential access to employer coverage that can legally cover and pay for it that much more significant.

President Biden’s recent executive order will require federal agencies to evaluate additional privacy protections. One issue is whether HIPAA provisions allowing disclosure to law enforcement can include added protections for reproductive services information. States implementing abortion bans will likely use law enforcement tools to get information from and about providers, this includes seeking information from employer plans about employee provider encounters. States where abortion is legal are already starting to add restrictions on the subpoena of reproductive services information. Harder questions arise in those states with abortion bans, where local providers (including pharmacists) and local employers may be the focus of law enforcement.

Medicaid Financial Eligibility in Pathways Based on Old Age or Disability in 2022: Findings from a 50-State Survey

Authors: MaryBeth Musumeci, Molly O'Malley Watts, Meghana Ammula, and Alice Burns
Published: Jul 11, 2022

Key Takeaways

Medicaid is an important source of health and long-term care coverage for seniors and people with disabilities. The Medicaid pathways in which eligibility is based on old age or disability are known as “non-MAGI” pathways because they do not use the Modified Adjusted Gross Income (MAGI) financial methodology that applies to pathways for pregnant people, parents, and children with low incomes. In addition to considering old age/disability status and income, many non-MAGI pathways also have asset limits.

Nearly all non-MAGI pathways are optional, resulting in substantial state variation (Figure 1).  Each group has different rules about income and assets, making eligibility complex. The Appendix provides details about the major non-MAGI pathways included in this survey, including pathways available to seniors and people with disabilities generally and pathways limited to people using long-term services and supports (LTSS) in nursing homes or other institutions or in the community. This issue brief presents state-level data on Medicaid financial eligibility criteria and adoption of the major non-MAGI pathways as of July 2022. The data were collected from March through May 2022 in KFF’s survey of Medicaid state eligibility officials. Overall, 50 states and the District of Columbia responded to the survey, though response rates to specific questions varied. Responses were supplemented with publicly available information where available. The Appendix tables contain detailed state-level data.

Interactive DataWrapper Embed

At least five states have adopted new financial eligibility expansions in non-MAGI pathways that take effect after July 2022. In January 2023, New York will join increase the income limit for seniors and people with disabilities to 138% FPL ($1,563 per month for an individual in 2022), the same limit as for MAGI populations. New York’s non-MAGI asset limits also will increase by about 50% in January 2023 (from $16,800 to $28,134 for an individual and from $24,600 to $37,908 for a couple). Between July 2022 and January 2024, California will phase in the elimination of asset limits in its pathway for seniors and people with disabilities up to 138% FPL and its working people with disabilities buy-in, placing access to coverage on the same financial terms as MAGI pathways which do not have an asset limit. Three other states are adopting changes that take effect July 1, 2022:  Connecticut is increasing its income limit for seniors and people with disabilities up to 100% FPL; Maryland is eliminating its income limit for the working people with disabilities buy-in; and Minnesota is increasing its income limit for medically needy seniors and people with disabilities to 100% FPL.

Though many states adopted policies to expand Medicaid eligibility for non-MAGI groups using emergency authorities during the PHE, very few states reported plans to continue these policies after the PHE ends. The only policy that some states plan to continue is reducing or eliminating premiums. Of the 20 states that reported adopting that policy, only 3 states (CA, IL, NH) reported plans to continue reducing or eliminating premiums.

Looking ahead, Medicaid remains an essential, and often the sole, source of medical and LTSS coverage for many seniors and nonelderly adults and children with disabilities. While the income limits associated with the non-MAGI pathways vary among states, they generally remain low. However, a notable minority of states are adopting non-MAGI financial eligibility expansions, including some that adopt the same financial eligibility limits that apply to MAGI populations (138% FPL and no asset test). States’ choices about which pathways to cover are an important baseline from which to monitor seniors and people with disabilities’ access to coverage, including LTSS.


Issue Brief

Medicaid is an important source of health and long-term care coverage for seniors and people with disabilities. As of 2019, there were 8.5 million Medicaid enrollees ages 65 or older and another 10.0 million enrollees for whom eligibility is based on disability. Other people with disabilities qualify for Medicaid solely based on their low income. The Medicaid pathways in which eligibility is based on old age or disability are known as “non-MAGI” pathways because they do not use the Modified Adjusted Gross Income (MAGI) financial methodology that applies to pathways for pregnant people, parents, and children with low incomes. In addition to considering old age/disability status and income, many non-MAGI pathways also have asset limits. The fact that most non-MAGI pathways are optional results in substantial state variation.

The non-MAGI pathways include people receiving Supplemental Security Income (SSI) benefits, which all states that choose to participate in Medicaid must cover, and an array of additional groups that can be covered at state option (Figure 1 and Appendix Table 1). In addition to SSI enrollees, the main non-MAGI pathways to full Medicaid eligibility include state options to expand coverage to working people with disabilities; Katie Beckett children with significant disabilities living at home; medically needy seniors and people with disabilities who “spend down” by deducting incurred medical expenses from their income; seniors and people with disabilities up to 100 percent of the federal poverty level (FPL, $1,133/month for an individual in 2022); the Family Opportunity Act buy-in for children with significant disabilities; and Section 1915 (i) which allows states to provide an independent eligibility pathway for people with functional needs that are less than an institutional level of care. Each group has different rules about income and assets, making eligibility complex. The Appendix provides detailed information about each of these pathways as well as pathways available to people who need LTSS. Some Medicaid enrollees also may have Medicare as their primary source of coverage, but there is no pathway to full Medicaid eligibility dedicated to Medicare enrollees.

This issue brief presents state-level data on Medicaid financial eligibility criteria and adoption of the major non-MAGI pathways as of July 2022. It includes mandatory and optional pathways to full Medicaid eligibility as well as state options to expand Medicaid financial eligibility for people who need long-term services and supports (LTSS) in nursing homes or other institutions or in the community. It also highlights state actions to expand non-MAGI financial eligibility that have been adopted and take effect after July 2022. The data were collected from March through May 2022 in KFF’s survey of Medicaid state eligibility officials. Overall, 50 states and the District of Columbia responded to the survey, though response rates to specific questions varied. Responses were supplemented with publicly available information where available. The Appendix tables contain detailed state-level data. A related brief presents a snapshot of non-MAGI enrollment during the COVID-19 public health emergency (PHE) and anticipated changes after the PHE ends as well as key state enrollment and renewal policies as of July 2022 and state plans for resuming normal eligibility and enrollment operations after the PHE ends.

Medicaid Eligibility Based on Old Age or Disability

SSI enrollees are the only non-MAGI pathway that states must cover in their Medicaid programs. Not all people with disabilities qualify for SSI due to the program’s low income and asset limits and stringent definition of disability. The SSI federal benefit rate is equivalent to 74% FPL ($841/month for an individual and $1,261/month for a couple in 2022), and assets are limited to $2,000 for an individual and $3,000 for a couple. (Appendix Table 2).

Among the optional non-MAGI pathways, nearly all states (49 of 51) adopt the buy-in for working people with disabilities (Figure 2 and Appendix Table 3). The median income limit for this pathway is 250% FPL ($2,832/month for an individual in 2022), and the median asset limit is $10,000 for an individual. Two states (MA, WA) cover working people with disabilities without an income or asset limit. One other state (MN) does not apply an income limit, and five other states (AZ, AR, CO, DC, WY) do not apply an asset limit. Additionally, 12 states have income limits above 250% FPL, ranging from 275% FPL in Delaware to 552% FPL in Connecticut, and a dozen states have asset limits above $10,000, ranging from $12,000 in Iowa to $25,000 in Illinois. Medicaid is an important source of coverage for services that support the ability of people with disabilities to work, such as personal care, prescription drugs, and assistive technology. Eliminating or increasing income and asset limits enables people with disabilities to retain access to these services while also accepting pay raises as they advance in their careers and accruing savings for retirement.

Medicaid Eligibility for Working People with Disabilities, as of 1/1/22

Forty-four states adopt the Katie Beckett state plan option to cover children with significant disabilities living in the community or provide coverage through a comparable waiver (Figure 3 and Appendix Table 1). Eighteen of these states adopt the Katie Beckett state plan option, 22 states offer a waiver that covers a comparable population, and four states cover some children through the state plan option and others through a waiver. Waivers allow states to restrict coverage compared to what is available through the state plan option, such as by capping enrollment.

Medicaid Eligibility for Katie Beckett Children with Significant Disabilities, as of 1/1/22

More than three in five states (34 of 51) adopt the medically needy pathway (Figure 4 and Appendix Table 4). Two of these states (TN, TX) offer medically needy coverage only for pregnant people and children and do not extend this coverage to seniors and people with disabilities. The median income limit (after deducting incurred medical expenses) medically needy seniors and people with disabilities is tied to cash assistance limits and is less than 50% FPL,1  and the median asset limit is $2,000 for an individual. As of June 2022, five states cover medically needy seniors and people with disabilities up to or above 100% FPL (DC, IL, UT, VT, WI). A dozen states have medically needy asset limits above the SSI limit, ranging from $2,400 in PA to $16,800 in NY. Over 80% of the states that cover medically needy seniors and people with disabilities (27 of 32) opt to include nursing home services in the benefit package offered to these enrollees, making this pathway another means of accessing long-term institutional care.

Medicaid Eligibility for Medically Needy Populations, as of 1/1/22

Less than half of states (22 of 51) opt to expand coverage for seniors and people with disabilities beyond federal SSI limits, up to the federal poverty level (Figure 5 and Appendix Table 2). Nearly all states electing this pathway adopt the federal maximum of 100% FPL. Notably, California is the first state to increase the income limit in this pathway to 138% FPL (($1,563 per month) for an individual in 2022, by using income disregards, effective December 2020), at the same level as ACA expansion adults. Most states apply the SSI asset limit of $2,000 for an individual. As of June 2022, AZ has no asset limit for this pathway, and 11 other states set the asset limit above the SSI level, ranging from $3000 in MN to $16,800 in NY.

Medicaid Eligibility for SSI Enrollees and Optional Seniors & People with Disabilities Up To 100% FPL, as of 1/1/22

Eight states adopt the Family Opportunity Act (FOA) state plan option to provide buy-in coverage to children with significant disabilities or provide comparable coverage through a waiver (Appendix Table 1). Four of these states elect the state plan option, three offer a waiver, and one offers both the state plan option and a waiver. Three states (CO, IA, KY) provide coverage up to the federal maximum of 300% FPL, while four states (LA, NJ, ND, TX) adopt a lower income limit for this pathway. Notably, unlike Katie Beckett waivers which typically involve enrollment caps or other limitations compared to coverage available under the state plan option, Massachusetts’ FOA-like waiver does not have an enrollment cap or an income limit and therefore expands coverage beyond what the state plan option would provide.2  Most (5 of 8) states with the FOA option or a comparable waiver choose to charge premiums. The exceptions are Iowa, Kentucky, and New Jersey. Colorado charges premiums of $70 per month beginning at 134% FPL, Texas charges $50 per month beginning at 151% FPL, North Dakota charges 5% of gross family income beginning at 200% FPL, and Louisiana charges $15 per month beginning at 201% FPL. In Massachusetts’ FOA-like waiver, sliding scale premiums apply to children in families with income over 150% FPL, beginning at $12 per month.

Five states adopt the Section 1915 (i) state plan option to expand eligibility to people with functional needs that are less than an institutional level of care (Appendix Table 5).3  Indiana was the first state to use Section 1915 (i) as an independent pathway to Medicaid eligibility. It began doing so in 2014 for adults with behavioral health conditions up to 150% FPL ($1,699 per month for an individual in 2022), and in 2019, it adopted another Section 1915 (i) eligibility pathway for adults with certain mental health diagnoses up to 150% FPL.4  Since 2017, Ohio has used Section 1915 (i) to provide Medicaid eligibility to adults with certain mental health or physical disabilities up to 150% FPL.5  In 2019, Maryland began using Section 1915 (i) to provide Medicaid eligibility to children with mental illness up to 150% FPL.6  Beginning in 2021, Alabama uses Section 1915 (i) to provide Medicaid eligibility to adults with intellectual disabilities up to 150% FPL,7  and Connecticut uses Section 1915 (i) to provide Medicaid eligibility for adults with complex health conditions and risk factors who have been homeless and would otherwise be eligible for an HCBS waiver, up to 300% SSI ($2,523 per month for an individual in 2022).8  There is no asset limit for Section 1915 (i) eligibility, similar to the MAGI pathways.

States Expanding Financial Eligibility after July 2022

At least five states have new financial eligibility expansions in non-MAGI pathways that take effect after July 2022. These changes include the following:

  • As of January 2023, New York will join California (noted above) as the second state to increase the income limit for seniors and people with disabilities to 138% FPL, the same limit as for MAGI populations. New York’s non-MAGI asset limits also will increase by about 50% as of January 2023 (from $16,800 to $28,134 for an individual and from $24,600 to $37,908 for a couple).
  • California is eliminating asset limits in its pathway for seniors and people with disabilities up to 138% FPL (joining AZ) as well as its working people with disabilities buy-in pathway (joining AZ, AR, CO, DE, DC, MA, WA, WY), placing access to coverage on the same financial terms as MAGI pathways which do not have an asset limit. This change will be phased in by increasing the asset limit to $130,000 for an individual, and an additional $65,000 for each additional family member up to 10 people, as of July 1, 2022. The asset limit will be entirely eliminated as of January 1, 2024.

Three other states are adopting changes that take effect July 1, 2022:

  • Connecticut is increasing its income limit for seniors and people with disabilities up to about 100% FPL.9 
  • Maryland is eliminating the income limit for the working people with disabilities buy-in. With this change, Maryland is establishing premiums up to 7.5% of monthly income for those with income over 600% FPL.
  • Minnesota is increasing its income limit for medically needy seniors and people with disabilities to 100% FPL.

State Options to Expand Medicaid LTSS Eligibility

Most states adopt the special income rule to expand financial eligibility for people who need Medicaid LTSS up to 300% SSI ($2,523 per month for an individual in 2022, Appendix Table 6). Specifically, 40 states adopt the special income rule for institutional LTSS, while 41 states do so for HCBS. Two states (MA, WV) adopt the special income rule only for HCBS, while one state (NH) does so only for institutional LTSS. All states electing the special income rule set financial eligibility at 300% SSI, except Delaware, which uses 250% SSI. Most states electing the special income rule apply the SSI asset limit of $2,000. A minority of states adopt an asset limit above the SSI level, ranging from $2,500 in Maryland and New Hampshire to $4,000 in the District of Columbia, Mississippi, and Rhode Island.  Additionally, Pennsylvania applies a $6,000 disregard to the $2,000 asset limit, making the effective asset limit $8,000.

Most states allow individuals to establish eligibility for Medicaid LTSS by using certain types of trusts (Appendix Table 7). Specifically, 46 states allow individuals with certain types of trusts to qualify for institutional LTSS, while 47 states do so for HCBS waiver eligibility. North Dakota allows trusts only for institutional LTSS eligibility, while the District of Columbia and New York do so only for HCBS eligibility.

Nearly three-quarters of states (37 of 51) limit home equity to the federal minimum of $636,000 for individuals seeking Medicaid LTSS eligibility (Appendix Table 7). Eleven other states adopt the federal maximum of $955,000, while two states use $750,000 (ID, WI). California is the only state that does not place a limit on home equity for an individual’s principal residence. Effective July 9, 2022, Washington increased its home equity limit from the federal minimum of $636,000 to the federal maximum of $955,000.

Medicaid LTSS Post-Eligibility Treatment of Income

The median personal needs allowance for a Medicaid enrollee residing in an institution is $50 per month (Appendix Table 8). This amount ranges from $30/month, the federal minimum, in three states (AL, NC, SC) to $200/month in Alaska.

The median maintenance needs allowance for a Medicaid enrollee receiving HCBS is $2,523 per month (Appendix Table 8). This amount ranges from $72/month in Washington, to $2,523 (the amount reported by most states). Nine states reported amounts that vary by waiver program, while six states do not have a maintenance needs allowance.

Spousal Impoverishment Rules

The median monthly community spouse needs allowance is $3,435 (Appendix Table 8). Thirteen states adopt the federal minimum ($2,178), while 21 states adopt the federal maximum ($3,435).

The median community spouse asset limit is $137,400 (Appendix Table 8). Two states adopt the federal minimum ($27,480), while 28 states adopt the federal maximum ($137,400).

State Plans to Retain Emergency Authorities Post-PHE

Though many states adopted policies to expand or streamline Medicaid eligibility and enrollment for non-MAGI groups using emergency authorities, very few reported plans to continue these policies after the PHE ends. A variety of Medicaid emergency authorities are available to states during the COVID-19 public health emergency (PHE), and states have used these authorities to adopt temporary policy changes that expand Medicaid financial eligibility in non-MAGI pathways, such as expanding income and/or asset limits and reducing or eliminating premiums. States have the option to continue many policies adopted under when they return to normal operations, and CMS guidance encourages states to consider retaining policy changes that expand access to HCBS.

The only policy change adopted using emergency authorities that a few states are planning to or may retain after the PHE ends is reducing or eliminating premiums. These include three states (CA, IL, NH) out of the 20 that reported adopting this policy. California waived premiums during the PHE and passed legislation to eliminate premiums for the working people with disabilities pathway effective July 1, 2022. New Hampshire also eliminated premiums during the PHE, pursuant to a governor’s emergency order, and has legislation pending that would continue this policy change.

Looking Ahead

Medicaid remains an essential, and often the sole, source of medical and LTSS coverage for many seniors and nonelderly adults and children with disabilities. Aside from the core group of SSI enrollees, pathways to full Medicaid eligibility based on old age or disability are provided at state option, which results in substantial variation among states. Additionally, the income limits associated with the non-MAGI pathways vary among states but generally remain low. However, a notable minority of states are adopting non-MAGI financial eligibility expansions, including some that adopt the same financial eligibility limits that apply to MAGI populations (138% FPL and no asset test). States’ choices about which pathways to cover are an important baseline from which to monitor seniors and people with disabilities’ access to coverage, including LTSS.

Appendix

Description of Pathways to Full Medicaid Eligibility Based on Old Age or Disability

MANDATORY PATHWAY

Supplemental Security Income (SSI) Enrollees

States generally must provide Medicaid to people who receive federal Supplemental Security Income (SSI) benefits.10  This is the only pathway where eligibility is based on old age or disability that states must include in their Medicaid programs. To be eligible for SSI, people must have low incomes, limited assets, and an impaired ability to work at a substantial gainful level as a result of old age or significant disability. The maximum SSI federal benefit rate is $841 per month for an individual and $1,261 for a couple11  in 2022, which is 74 percent of the federal poverty level (FPL). The effective SSI income limit may be somewhat higher than 74% FPL in some states, due to state supplemental payments and/or additional income disregards.12  SSI enrollees also are subject to an asset limit of $2,000 for an individual and $3,000 for a couple.13 

SSI eligibility is determined by the Social Security Administration (SSA). If states do not want to accept SSA’s determination of an SSI enrollee’s income, assets, and/or disability status when determining Medicaid eligibility, states can use different rules under Section 209 (b). Specifically, states can use financial and/or functional eligibility criteria that are more restrictive than the federal SSI rules, as long as the state’s rules are no more restrictive than the rules it had in place in 1972, when the SSI program was established.14 

OPTIONAL PATHWAYS

Working People WIth Disabilities

States can choose to cover working people with disabilities whose income and/or assets exceed the limits for other eligibility pathways.15  This option enables people with disabilities to retain access to the medical and LTSS they need as their income increases. Medicaid often is especially important to working people with disabilities because private insurance typically does not cover all of the services and supports they need to live independently and to work.16  States can choose to apply an asset limit to this pathway. Eliminating asset limits, or increasing them beyond the SSI limit of $2,000 for an individual and $3,000 for a couple, recognizes that enrollees are likely to incur expenses related to work or community living and enables them to accrue some savings to meet future expenses. States also can choose to charge monthly premiums, usually on a sliding scale based on income.

Katie Beckett Children With Disabilities

States can choose to elect the “Katie Beckett” option to extend coverage to children up to age 19 with significant disabilities living at home, without regard to household income. These children must meet SSI medical disability criteria and otherwise qualify for an institutional level of care according to functional eligibility criteria set by the state. States can target different populations based on the type of institutional care (hospital, skilled nursing facility, intermediate care facility, intermediate care facility for individuals with “mental disease,”17  intermediate care facility for individuals with intellectual or developmental disabilities) that would be required if the child was not receiving Medicaid services in the community.

Katie Beckett income limits are generally 300% of SSI ($2,523 per month in 2022), with a $2,000 asset limit, considering only the child’s own income and assets. Under the Katie Beckett pathway, parental income and assets are disregarded when determining Medicaid eligibility for children with disabilities living at home, just as they are for children with disabilities residing in an institution. This option makes it possible for children to receive necessary care while remaining at home with their families.

Katie Beckett children can be covered through the optional state plan pathway or through a home and community-based services (HCBS) waiver.18  These waivers allow states to expand financial eligibility and offer HCBS to seniors and people with disabilities who would otherwise qualify for an institutional level of care and can be targeted to a specific population. Providing coverage through a waiver also allows states to cap enrollment, which can result in waiting lists and is not permitted under state plan authority.

Medically Needy Populations

States can choose to adopt the medically needy option to extend Medicaid to people with high medical expenses who would be eligible in a categorically needy pathway, except that their income and/or assets exceed the maximum limit for that pathway.19  See Box 1 below for an explanation of how medically needy pathways differ from categorically needy pathways. All states electing medically needy coverage must include pregnant people and children. States also can choose to extend medically needy coverage to other groups such as seniors, people with disabilities, and/or low-income parents. Medically needy income limits are typically very low.20  States also can choose to apply an asset limit to medically needy pathways. The asset limit is typically the SSI amount of $2,000 for an individual and $3,000 for a couple, though it can be higher at state option.

Box 1:  Categorically Needy vs. Medically Needy Pathways

Before the Affordable Care Act (ACA), Medicaid eligibility was limited to certain categories of people.21  These “categorically needy” groups include children, pregnant people, low-income parents, seniors, and people with disabilities. The ACA eliminated the need to fit into one of these categories by expanding Medicaid to nearly all adults with incomes up to 138% FPL ($1,563 per month for an individual in 2022). In states that have not adopted the ACA Medicaid expansion, people still must fit into one of the specified categories to qualify for coverage today. In addition, these categories remain relevant to determining Medicaid eligibility under the “medically needy” option because people who qualify as “medically needy” must fit into one of the traditional categories. States cannot use the medically needy option to cover people who do not fit into one of the traditional categories, such as childless adults, regardless of how poor they are or how extensive their medical needs are.

There are two ways that individuals can qualify for Medicaid through a medically needy pathway.22  First, people with income above the categorically needy income limit associated with a certain population but below the state’s medically needy income limit may be eligible as medically needy. Second, people who “spend down” to the state’s medically needy income limit by subtracting incurred medical or long-term services and supports (LTSS) expenses from their income may qualify. States select a budget period between one and six months during which an individual must incur enough expenses to decrease their income below the medically needy limit. Using a longer budget period may be administratively simpler for states and enrollees and provide continuity of coverage.

States have the option to provide a more limited benefit package to people who qualify for Medicaid in a medically needy, as opposed to categorically needy, pathway. Under federal law, states must include nursing facility services in the benefit package for categorically needy populations but can choose whether to include these services in their medically needy benefit package. In states electing this option, the medically needy pathway can be an important means of expanding coverage for those with overwhelming medical and/or LTSS expenses.

Seniors and People with Disabilities up to 100% FPL

States can chose to expand Medicaid to seniors and people with disabilities whose income exceeds the SSI limit but is below the federal poverty level ($1,133 per month for an individual in 2022).23  The federal maximum income limit for this pathway is 100% FPL.24  States also can choose to apply an asset limit to this pathway. The asset limit is typically the SSI amount of $2,000 for an individual and $3,000 for a couple, though it can be higher at state option.

Family Opportunity ACt Children with Disabilities

The Family Opportunity Act (FOA) pathway provides another option for states to cover children with significant disabilities living at home. These children must meet SSI medical disability criteria and can have family income up to 300% FPL ($5,758 per month for a family of three in 2022).25  Assets are not considered when determining a child’s FOA eligibility. Unlike the Katie Becket pathway which only considers the child’s own income, the FOA option considers household income. The FOA pathway only requires SSI medical disability criteria, while the Katie Beckett option also requires an institutional level of care. Under the FOA option, states are permitted to charge premiums equal to no more than 5 percent of the family’s monthly gross countable income (up to $288 per month in premiums for a family of 3 with income at 300% FPL, $5,758 per month in 2022). FOA children can be covered through the state plan option or through a waiver that covers a similar population while deviating from state plan eligibility rules.

Section 1915 (i) HCBS for people at risk of institutional care

States can elect the Section 1915 (i) pathway to provide Medicaid eligibility to people at risk of institutional care. The ACA amended Section 1915 (i) to create an independent pathway to Medicaid eligibility.26  This allows states to provide full Medicaid benefits to people who are not eligible through another pathway and who meet the Section 1915 (i) financial and functional eligibility criteria.27  Specifically, states can cover (1) people with income up to 150% FPL ($1,699 per month for an individual in 2022) with no asset limit who meet functional eligibility criteria; and/or (2) people with income up to 300% SSI who would be eligible for Medicaid under an existing HCBS waiver. Section 1915 (i) functional eligibility requires people to have needs that are less than what is required to qualify for an institutional level of care, which enables states to offer HCBS as preventive services in efforts to delay or foreclose the need for costlier future care or institutionalization. Like HCBS waivers, states can target Section 1915 (i) services to a particular population. Unlike HCBS waivers, states are not permitted to cap enrollment or maintain a waiting list for Section 1915 (i) Medicaid eligibility. However, states can manage enrollment under Section 1915 (i) by restricting functional eligibility criteria if the state will exceed the number of beneficiaries that it anticipated serving

State Options to Expand Medicaid LTSS Financial Eligibility

Medicaid LTSS include nursing home and other institutional services as well as home and community-based services (HCBS). Medicaid remains the primary payer for LTSS, as Medicare does not cover long-term care, private insurance coverage is limited, and out-of-pocket costs often are unaffordable. Medicaid also is an important source of federal funds to support states in meeting their community integration obligations under the Americans with Disabilities Act and the Olmstead decision.28 

Special income rule

States can elect the “special income rule” option to allow people with functional needs who require an institutional level of care to qualify for Medicaid LTSS with incomes up to 300% SSI ($2,523 per month for an individual in 2022).29  States also can apply an asset limit under the special income rule, usually the SSI amount of $2,000 for an individual and $3,000 for a couple.

States using the special income rule can apply it to people in institutions, such as nursing homes, and/or people receiving LTSS in the community.30  Aligning financial eligibility rules across long-term care settings is important to eliminating programmatic bias toward institutional care. If people can qualify for institutional services at higher incomes than required to qualify for community-based services, they may choose to enter a nursing facility when they need care instead of going without necessary care while spending down to the lower HCBS income limit.

Trusts

Qualified Income or “Miller” Trusts

States can choose to allow individuals residing in an institution to qualify for Medicaid LTSS with income higher than 300% of SSI if their excess income is administered through a special type of trust, known as a qualified income or “Miller” trust.31  States can choose whether to cap the amount of money that can be put into a Miller trust when establishing eligibility for LTSS. States allowing Miller trusts for institutional care can also allow individuals to use Miller trusts to qualify for Medicaid HCBS. As noted above, using the same financial eligibility rules for institutional care and HCBS helps alleviate bias toward institutional care.

Income from a Miller trust can be used to fund the Medicaid enrollee’s personal needs allowance as well as a monthly allowance for the beneficiary’s spouse who remains in the community under the spousal impoverishment rules (both discussed below). Any additional income from the trust goes toward the enrollee’s cost of care, and states can recover funds remaining in the trust after the individual’s death to reimburse the cost of care.

Supplemental Needs and Pooled Income Trusts

States can allow individuals to qualify for Medicaid LTSS using supplemental needs32  and pooled income33  trusts. Both of these types of trusts contain assets for the benefit of non-elderly people with disabilities, which are excluded from Medicaid financial eligibility determinations. States can choose whether to cap the amount of money that can be put into these trusts. The trust beneficiary must have a disability based on SSI criteria. Both types of trusts can be established by the individual’s parent, grandparent, legal guardian or a court and must provide that the state can receive any amount remaining in the trust upon the beneficiary’s death to cover the cost of Medicaid services provided. Pooled income trusts are established and managed by a non-profit association, with a separate account for each beneficiary, but assets are combined for purposes of fund investment and management. This option can enable individuals with relatively small trust amounts to benefit from economies of scale by being part of a larger pool of funds for investment and management purposes.

Home Equity Limits

States can choose the amount of home equity that people seeking Medicaid LTSS can have as an allowable asset.34  The federal minimum home equity limit is $636,000 in 2022, and the upper limit is $955,000.

Personal/Maintenance Needs Allowance

Once eligible for Medicaid, individuals in institutions, such as nursing homes, generally must contribute most of their monthly income to the cost of their care, with the exception of a small allowance used to pay for personal needs that are not covered by Medicaid, such as clothing.35  The federal minimum personal needs allowance is $30 per month, though states can choose to adopt a higher amount.

Certain Medicaid enrollees receiving HCBS must contribute a portion of their income to their cost of care, though states generally allow them to retain a monthly maintenance needs allowance.36  The maintenance needs allowance generally exceeds the institutional personal needs allowance described above, recognizing that, unlike those in nursing homes, individuals living in the community must pay for room and board. There is no federal minimum HCBS maintenance needs allowance; instead, states may use any amount as long as it is based on a “reasonable assessment of need” and subject to a maximum that applies to all enrollees under the HCBS waiver.37  The maintenance needs allowances established by states play a critical role in determining whether individuals can afford to remain in the community and avoid or forestall institutional placement.

Spousal Impoverishment Rules

Congress created the Medicaid spousal impoverishment rules in 1988 to protect a portion of a married couple’s income and assets and ensure that the “community spouse” is able to meet their living expenses when the other spouse seeks Medicaid LTSS. The spousal impoverishment rules supersede rules that would otherwise require Medicaid financial eligibility determinations to account for a spouse’s financial responsibility for a Medicaid applicant or enrollee by contributing to their cost of care.38  The protected income is called the spouse’s “monthly maintenance needs allowance.” The federal minimum monthly maintenance needs allowance is 150% FPL for a household of two ($2,178 as of July 1, 2021), and the federal maximum is $3,435 as of January 1, 2022.39  The protected assets are known as the “community spouse resource allocation.” The federal minimum community spouse resource allocation is $27,480 as of 2022, and the federal maximum is $137,400. States also can choose to apply a formula that allows the community spouse to retain an amount of protected assets that is the greater of either the federal minimum or one-half of the couple’s total combined assets but not to exceed the federal maximum.

States must apply the spousal impoverishment rules when a married Medicaid enrollee is receiving nursing home or other institutional care, but prior to 2014, states could choose whether to apply the spousal impoverishment rules when a married individual sought home and-community based waiver services.40  Beginning on January 1, 2014, ACA Section 2404 requires states to apply the spousal impoverishment rules to HCBS waivers.41  The ACA provision originally was set to expire at the end of 2018, but Congress subsequently adopted several short-term authorizations. The provision currently expires on September 30, 2023.42 

Appendix Tables

Appendix Table 1: State Adoption of Major Optional Pathways to Full Medicaid Eligibility Based on Old Age or Disability, as of 7/1/22

Appendix Table 2: Medicaid Eligibility for SSI Beneficiaries and Optional Pathway for Seniors and People with Disabilities Up to 100% FPL, as of 7/1/22

Appendix Table 3: Medicaid Eligibility for Working People with Disabilities, as of 7/1/22

Appendix Table 4: Medicaid Eligibility Through the Medically Needy Pathway, as of 7/1/22

Appendix Table 5: Medicaid Section 1915 (i) HCBS Option as an Independent Pathway to Medicaid Eligibility, as of 7/1/22

Appendix Table 6: Medicaid Special Income Rule for Long-Term Services and Supports Eligibility, as of 7/1/22

Appendix Table 7: Medicaid Long-Term Services and Supports Trusts and Home Equity Limits, as of 7/1/22

Appendix Table 8: Medicaid Long-Term Services and Supports Post-Eligibility Treatment of Income and Spousal Impoverishment Standards, as of 7/1/22

State Adoption of Major Optional Pathways to Full Medicaid Eligibility Based on Old Age or Disability, as of 1/1/22

Medicaid Eligibility for SSI Beneficiaries and Optional Pathway for Seniors and People with Disabilities up to 100% FPL, as of 1/1/22

Medicaid Eligibility for Working People with Disabilities, as of 1/1/22

Medicaid Eligibility Through the Medically Needy Pathway, as of 1/1/22

Medicaid Section 1915 (i) HCBS Option as an Independent Pathway to Medicaid Eligibility, as of 1/1/22

Medicaid Special Income Rule for Long-Term Serivces and Supports Eligibility, as of 1/1/22

Medicaid Long-Term Services and Supports Trusts and Home Equity Limits, as of 1/1/22

Medicaid Long-Term Services and Supports Post-Eligiblity Treatment of Income and Spousal Impoverishment Standards, as of 1/1/22

Endnotes

  1. % FPL equivalent is presented for comparison purposes only; several states reported that income limits are tied to AFDC limits and not based on a percentage of poverty. ↩︎
  2. Under Massachusetts’ waiver, state plan “base populations” include all infants under age one (based solely on income) through 200% FPL and children with disabilities under age 19 through 150% FPL. Waiver expansion populations include “higher income children with disabilities” with no income limit. CMS Special Terms and Conditions, MassHealth Medicaid Section 1115 Demonstration, #11-W-00030/1,Table A, p. 10, 16, 21 (approved July 1, 2017-Sept. 30, 2022, amended June 27, 2018), https://www.medicaid.gov/Medicaid-CHIP-Program-Information/By-Topics/Waivers/1115/downloads/ma/ma-masshealth-ca.pdf. ↩︎
  3. States’ survey responses in this section were supplemented with the state plan amendments posted on Medicaid.gov. ↩︎
  4.  The effective income limit in IN is 300% FPL, because the state disregards income in the amount of the difference between 150% FPL and 300% FPL. IN SPA #18-011, § 1915 (i) HCBS, Attachment 2.2-A, page 23g (approved 5/16/19, effective 6/1/19); IN SPA #13-013, § 1915 (i) HCBS, Attachment 2.2-A, page 23g (approved 5/30/14, effective 6/1/14). ↩︎
  5. The effective income limit in OH is higher because the state disregards income in the amount of the difference between 150% FPL and 300% SSI. Physical health diagnoses include HIV/AIDS, cancer, sickle cell anemia, hemophilia, immune deficiency, cystic fibrosis, end state renal disease, and previous transplant. OH #17-017, § 1915 (i) HCBS, Attachment 3.1-I, page 6-7 (approved 8/23/17, effective 7/1/17). ↩︎
  6. The effective income limit in MD is higher because the state disregards income in the amount of the difference between 150% FPL and 300% FPL. MD #19-0004, Individuals Receiving State Plan Home and Community-Based Services, (approved 9/5/19, effective 10/1/19) (p. 14 of pdf). ↩︎
  7. AL SPA #21-0005-A, Eligibility (approved 6/14/21, effective 4/1/21). ↩︎
  8. CT#21-0001-A, Eligibility (approved and effective 8/16/21). ↩︎
  9. CT’s increase reflects changes to the underlying financial methodology which will tie cash assistance payments to a percentage of the federal poverty level and in turn set the Medicaid income limit for seniors and people with disabilities at 143% of the cash assistance payment, along with a $409/month unearned income disregard. ↩︎
  10. 42 U.S.C. § 1396a (a)(10)(A)(i)(II); but see 42 U.S.C. § 1396a (f). ↩︎
  11. The couple rate applies when both individuals qualify for SSI. ↩︎
  12. Under federal SSI rules, there is a general income disregard of $20 per month. Earned income is subject to an additional disregard of $65 plus half of the remaining amount. ↩︎
  13. Certain assets, such as an individual’s home, one car used for household transportation, and a certain amount of funds for prepaid burial expenses, are excluded from the SSI asset limit. ↩︎
  14. Section 209 (b) states must allow SSI beneficiaries to establish Medicaid eligibility through a spend-down by deducting unreimbursed out-of-pocket medical expenses from their countable income (described later in this Appendix). Section 209 (b) states also must provide Medicaid to children who receive SSI and who meet the financial eligibility rules for the state’s Aid to Families with Dependent Children program as of July 16, 1996. 42 U.S.C. § 1396a (f); see also 42 U.S.C. § 1396a (a)(10)(C)(i)(III) and (ii); 42 C.F.R. § 435.121 (d). ↩︎
  15. 42 U.S.C. § § 1396a (a)(10)(A)(ii)(XV), (XVI); 1396o (g). ↩︎
  16. See, e.g., KFF, Benefits and Cost-sharing for People with Disabilities in Medicaid and the Marketplace (Oct. 2014). ↩︎
  17. An antiquated term in the statute. ↩︎
  18. For more about HCBS waivers, see KFF, Medicaid Home and Community-Based Services:  People Served and Spending During COVID-19 (March 2022), ; KFF, State Policy Choices About Medicaid Home and Community-Based Services Amid the Pandemic (March 2022). ↩︎
  19. 42 U.S.C. § § 1396a (a)(10)(C); 1396d (a)(iii), (iv), (v). ↩︎
  20. States’ medically needy income limits are so low because they are tied to the Aid to Families with Dependent Children (AFDC) payment levels that were in place in 1996. Federal rules require medically needy income levels to be no higher than 133 1/3% of the state’s maximum AFDC payment level for a family of two without any income or assets as of July 16, 1996. States can raise their medically needy income limits if they increase their TANF income standards, but few states have done so (TANF replaced AFDC in 1996). 42 U.S.C. § § 1396b (f)(1)(B)(i); 1396u-1 (b), (f)(3). ↩︎
  21. Unless the state had a Section 1115 waiver that used cost savings to expand coverage. ↩︎
  22. For more information on medically needy eligibility and how to calculate spend down, see KFF, The Medically Needy Program: Spending and Enrollment Update (Dec. 2012), ↩︎
  23. 100% FPL for an individual in Hawaii is $1,303/month in 2022. ↩︎
  24. 42 U.S.C. § § 1396a (a)(10)(A)(ii)(X); 1396a (m). ↩︎
  25. 42 U.S.C. § § 1396a (a)(10)(A)(ii)(XIX); 1396a (cc)(1). ↩︎
  26. Section 1915 (i) also allows states to provide an HCBS benefit package, as a state plan option instead of a waiver, to people who are eligible for Medicaid through another eligibility pathway. ↩︎
  27. 42 U.S.C. § 1396a (a)(10)(A)(ii)(XXII). ↩︎
  28. In Olmstead, the Supreme Court held that the unjustified institutionalization of people with disabilities violates the Americans with Disabilities Act. KFF, Olmstead’s Role in Community Integration for People with Disabilities Under Medicaid: 15 Years After the Supreme Court’s Olmstead Decision (June 2014). ↩︎
  29. Those in institutions must have resided there for at least 30 days. 42 U.S.C. § 1396a (a)(10)(ii)(V) and (VI). ↩︎
  30. States also use § 1915 (c) and § 1115 waivers to expand financial eligibility for HCBS. See generally KFF, Medicaid Home and Community-Based Services:  People Served and Spending (March 2022); KFF, State Policy Choices About Medicaid Home and Community-Based Services Amid the Pandemic (March 2022). ↩︎
  31. See Miller v. Ibarra, 746 F. Supp. 19 (D. Colo. 1990). This option is not available in medically needy states unless they do not offer nursing facility services to medically needy populations. 42 U.S.C. § 1396p (d)(4)(B). ↩︎
  32. 42 U.S.C. § 1396p (d)(4)(A). ↩︎
  33. 42 U.S.C. § 1396p (d)(4)(C). ↩︎
  34. 42 U.S.C. § 1396p (f). ↩︎
  35. 42 U.S.C. § 1396a (q). ↩︎
  36. These individuals are eligible for Medicaid via a Section 1915 (c) HCBS waiver because they would be eligible under the Medicaid state plan if institutionalized, meet an institutional level of care, and would be institutionalized if not receiving waiver services. 42 U.S.C. § 1396a (a)(10)(A)(ii)(VI). They sometimes are referred to as the “217-group,” because they are described in 42 C.F.R. § 435.217. 42 C.F.R. § 435.726. ↩︎
  37. 42 C.F.R. § 435.726 (c). States use different methodologies to determine the monthly maintenance needs allowances for HCBS enrollees. Most states allow individuals to deduct their uncovered medical bills from income. ↩︎
  38. 42 U.S.C. § 1396r-5 (a)(1). The rules permit (and sometimes require) that a married individual seeking Medicaid LTSS whose spouse is not institutionalized is treated differently for financial eligibility purposes from other individuals seeking Medicaid LTSS. 42 U.S.C. § 1396r-5 (a)(2). For more information, see KFF, Potential Changes to Medicaid Long-Term Care Spousal Impoverishment Rules: States’ Plans and Implications for Community Integration (Feb. 2019). ↩︎
  39. While the community spouse maximum income maintenance allowance and minimum and maximum asset allowances are adjusted each January, the community spouse minimum monthly maintenance needs allowance is adjusted as of July 1st. CMCS Informational Bulletin, 2022 SSI and Spousal Impoverishment Standards (Nov. 23, 2021). ↩︎
  40. Specifically, states could opt to apply the rules to individuals who are eligible for Medicaid by reason of a Section 1915 (c) HCBS waiver, under 42 U.S.C. § 1396a (a)(10)(A)(ii)(VI) (describing individuals who would be eligible under the Medicaid state plan if institutionalized, meet an institutional level of care, and would be institutionalized if not receiving waiver services, sometimes referred to as the “217-group,” because they also are described in 42 C.F.R. § 435.217). 42 U.S.C. § 1396r-5 (h)(1)(A). ↩︎
  41. Section 2404 also expanded the spousal impoverishment rules to the Section 1915 (i) HCBS state plan option, Community First Choice (CFC) attendant care services and supports, and individuals eligible through a medically needy spend down. ↩︎
  42. The spousal impoverishment rules were extended through March 31, 2019 in the Medicaid Extenders Act of 2019, § 3, Pub. L. No. 116-3 (Jan. 24, 2019); through September 30, 209 in the Medicaid Services Investment and Accountability Act of 2019, § 2, Pub. L. No. 116-16 (April 18, 2019); through December 31, 2019 in the Sustaining Excellence in Medicaid Act of 2019, Pub. L. No. 116-39 (Aug. 8, 2019); through May 22, 2020 in the Further Consolidated Appropriations Act, Pub. L. No. 116-94 (Dec. 20, 2019); and through September 30, 2023 in the Consolidated Appropriations Act of 2021, Pub. L. No. 116-260 (Dec. 27, 2020). ↩︎