KFF/theGrio Survey of Black Voters

Authors: Liz Hamel, Shannon Schumacher, Grace Sparks, Mellisha Stokes, and Mollyann Brodie
Published: Oct 18, 2022

Overview

The Survey of Black Voters, the first under a new partnership between KFF and theGrio, examines the mood and opinions of Black voters as the 2022 midterm election approaches. For this project, we interviewed 1,000 Black registered voters, allowing for analysis that goes beyond the topline findings and paints a richer picture of the diversity of attitudes within the Black voting population.

The survey explores Black voters’ voting intentions, motivations, and views on key electoral issues for the upcoming midterm. It also examines Black voters’ attitudes toward the Democratic and Republican Parties, views on electoral integrity, and past experiences with voter suppression. In addition to these election-related topics, the survey sheds light on how Black voters feel about timely topics including recent Supreme Court decisions, policies affecting LGBT individuals, and policies aimed at improving health for Black people in the United States.

Read theGrio’s coverage:

Black voters’ mood ahead of midterms tempered by age, economy and racism, TheGrio/KFF Survey finds, published Oct. 18, 2022.

Black voters name inflation, economic issues as biggest concern ahead of midterm elections, published Oct. 18, 2022.

Black voters solidly approve of Biden and Harris, less firm on the president’s reelection in 2024, published Oct. 18, 2022.

Majority of Black voters say Trump should be criminally charged for Jan. 6 insurrection in TheGrio/KFF survey, published Oct. 19, 2022.

As Republicans still scream fraud in 2020 election, Black voters surveyed by theGrio/KFF still believe their votes count, published Oct. 20, 2022.

Black voters surveyed by theGrio/KFF want Biden to address inflation; only 12% named student debt as top economic issue, published Oct. 24, 2022.

Most Black voters tell theGrio/KFF survey they support funding or increased funding for police, published Oct. 25, 2022.

Black voters surveyed by theGrio/KFF think the Supreme Court is politicized and see this as a bad sign for Black people, published Oct. 26, 2022.

Why Black voters don’t want to defund the police, explained, published Oct. 27, 2022.

Young Black voters could be essential in future elections, analysis of theGrio/KFF survey shows, published Oct. 29, 2022.

Black voters say recent Supreme Court decisions are a step backward, hurt Black people: theGrio/KFF survey, published Oct. 30, 2022.

TheGrio/KFF survey shows that Black voters are concerned with voter suppression tactics, published Nov. 1, 2022.

Majority of Black voters support LGBT rights, more divided on the issue of trans student-athletes: theGrio/KFF survey, published Nov. 5, 2022.

Findings

Introduction

The Survey of Black Voters, the first under a new partnership between KFF and theGrio, examines the mood and opinions of an important group of voters as the 2022 midterm election approaches. A group that has historically been a solid voting bloc for Democrats, the views of Black voters are often examined as one monolithic group or even sometimes overlooked in midterm election polling. This survey goes beyond the insights that can be gleaned about Black voters from polls of the general public by collecting data from a large enough sample of Black voters to examine variations within the Black electorate by factors such as age, education, political affiliation, and ideology. The survey explores Black voters’ voting intentions, motivations, and views on key electoral issues for the upcoming midterm. It also examines Black voters’ attitudes toward the Democratic and Republican Parties, views on electoral integrity, and past experiences with voter suppression. In addition to these election-related topics, the survey sheds light on how Black voters feel about timely topics including recent Supreme Court decisions, policies affecting LGBT individuals, and policies aimed at improving health for Black people in the United States.

The survey sample is comprised of 1,000 Black adults who identify as Black or African American (including those who identify as Hispanic and/or multi-racial) and who say they are registered to vote.

Executive Summary

The survey reveals a Black electorate that is greatly concerned about the economy and the rising cost of living, but one that is weighing a variety of economic and non-economic issues in deciding how to vote in November. In addition to inflation and the affordability of health care and housing, voting rights, gun violence, and criminal justice emerge as top issues for Black voters.

About half of Black voters say they are more motivated to vote this year compared to previous elections, with those who are more motivated largely driven by a desire to vote for Democrats or keep Republicans out of office or a general desire for change. While substantial shares across groups express increased motivation this year, the shares are higher among older voters, those who approve of President Joe Biden, and those who lean toward one of the major parties, suggesting that larger shares of younger voters, unaffiliated Black voters, and those who disapprove of the president’s job performance may choose to stay home in November.

Black voters are also concerned about electoral integrity. While a large majority are at least somewhat confident that their own vote will be accurately counted in November, seven in ten are concerned about voter suppression interfering with a fair and accurate election in their state. Half say they have experienced waiting in long lines at their polling place in the past, and one in five have experienced potential voter suppression such as having their registration or identification questioned. Younger Black voters and those who have experienced potential voter suppression in the past are less confident that their vote will be accurately counted this November.

Black voters also express negative views of the Supreme Court. Eight in ten disapprove of the decision to overturn Roe v. Wade (higher than the share of White voters who say the same in other recent surveys), and most say the Court’s recent decisions have been a step backward when it comes to women’s rights, racial equity, climate change, and voting rights. Seven in ten believe the Court’s justices make their decisions mainly based on politics and ideology rather than the law.

The survey also finds that while Black voters continue to solidly identify with the Democratic party, there are some signs of disillusionment with the Democratic establishment. Black voters express a clear preference for the Democratic party over the Republican party when it comes to representing their interests, the parties’ commitment to electoral integrity, and views of racism in the parties. Still, less than a quarter of Black voters say the Democratic party represents their interests very well, and eight in ten say racism is at least a minor problem in the party.

In addition to these topics, the survey also explores more nuances in the attitudes of Black voters. While most Black voters identify as Democrat and hold largely liberal views, they are not a monolith. About one in four Black voters identify as independent, and 11% identify as or lean Republican. These groups express vastly different views from the majority who identify with or lean Democrat, especially on recent Supreme Court decisions, and gender and sexual identity issues. Views on other topics also differ among Black voters by factors such as age, gender, and education, as detailed in this report.

Who Are Black Voters?

Partisan identity: A large majority of Black registered voters either identify as Democrats (61%) or say they lean toward the Democratic Party (13%). About one in ten say they are Republicans (7%) or lean that way (4%). A further 13% of Black voters identify as independents or something else and say they don’t lean toward either the Democratic or Republican Party.

Ideology: About half of Black voters say their views in most political matters are moderate (54%), while 28% say they are liberal and 17% say conservative.

Age: Black voters are older on average than the Black adult population overall. About 1 in 5 (21%) Black voters are under the age of 30, slightly more than a third (36%) are between 30 and 49, a quarter (26%) are 50-64 and 18% are 65 or older.

Gender: Black voters are disproportionately women. A majority of Black voters (57%) are women, compared to about four in ten (42%) men.

Race and ethnicity: Nine in ten Black voters identify as Non-Hispanic Black, while 5% say they are Black and Hispanic or Latino, and a further 5% identify as non-Hispanic Black in addition to at least one other race.

How Do Black Voters View Biden, Harris, and Trump?

Approval of President Joe Biden: About seven in ten (69%) approve of the way Joe Biden is handling his job as president, while 30% disapprove. Biden’s approval rating is 59% among Black voters under age 50 compared to 82% among those ages 50 and older.

Approval of Vice President Kamala Harris: About two-thirds (65%) of Black voters approve of Kamala Harris’s handling of her job as vice president, while 33% disapprove. Harris’s approval rating differs by age as well (56% of those under age 50 approve vs. 77% of those ages 50 and older).

Views of Donald Trump: More than eight in ten (84%) Black voters have unfavorable views of former President Donald Trump, compared to just 15% who view him favorably. Black voters under age 50 are somewhat more likely than their older counterparts to have a favorable view of Trump (21% vs. 7%), though a large majority of both age groups (79% of those ages 18-49 and 91% of those ages 50 and over) view him unfavorably.

Half Of Black Voters Say They Are More Motivated to Vote This Year

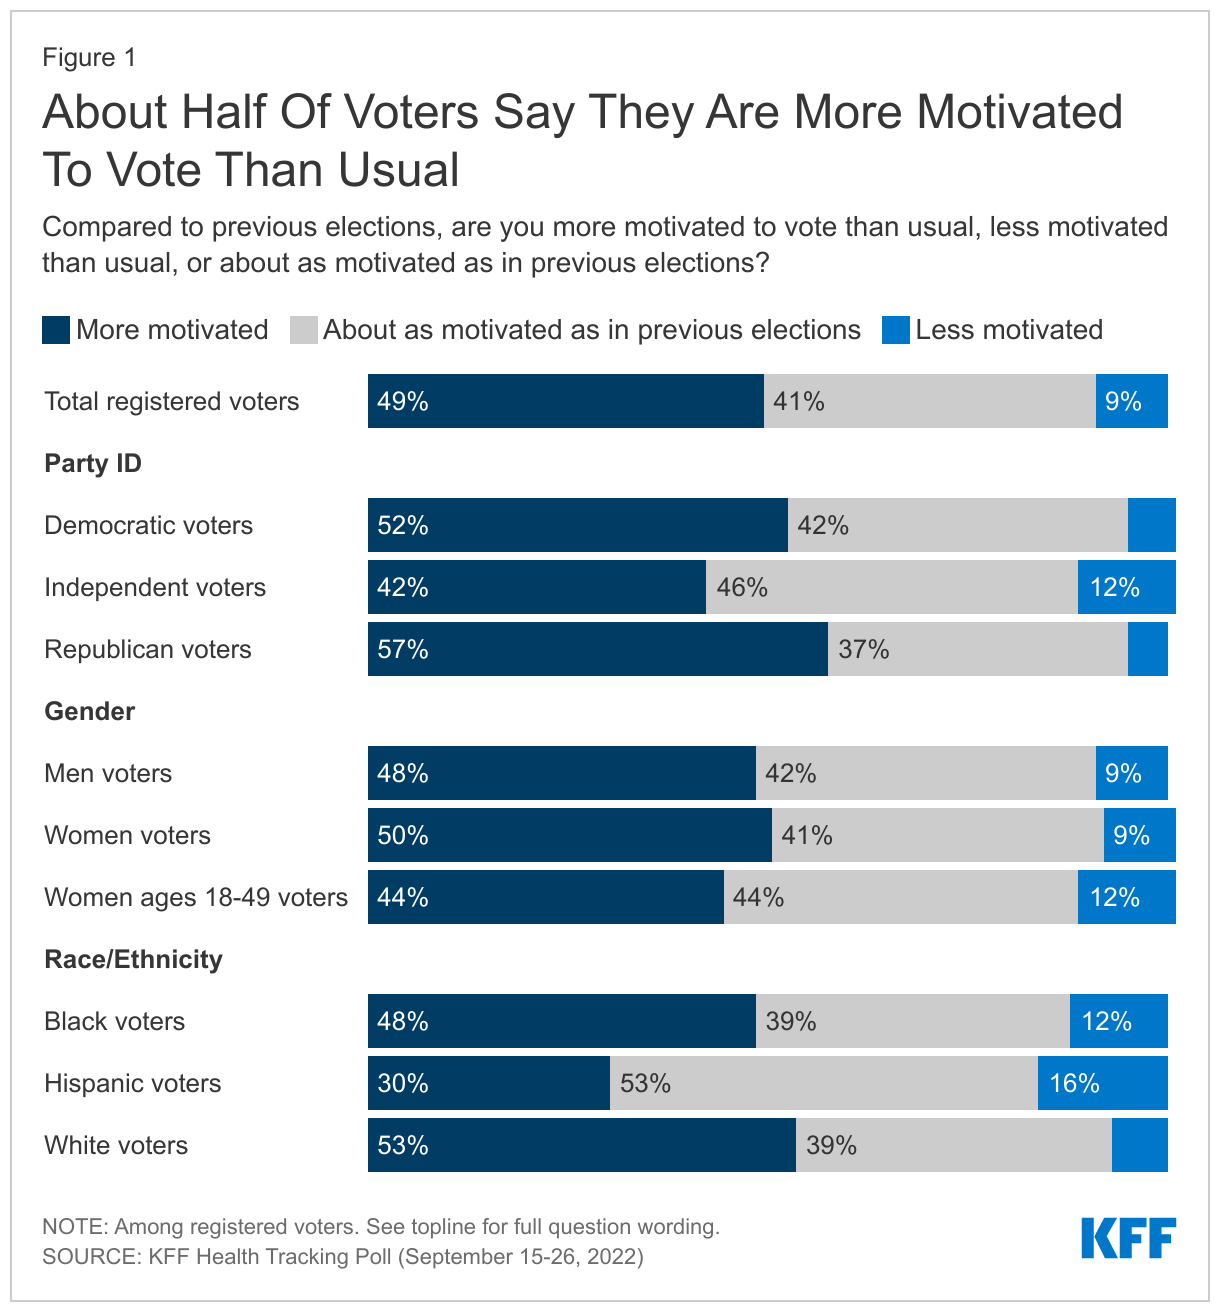
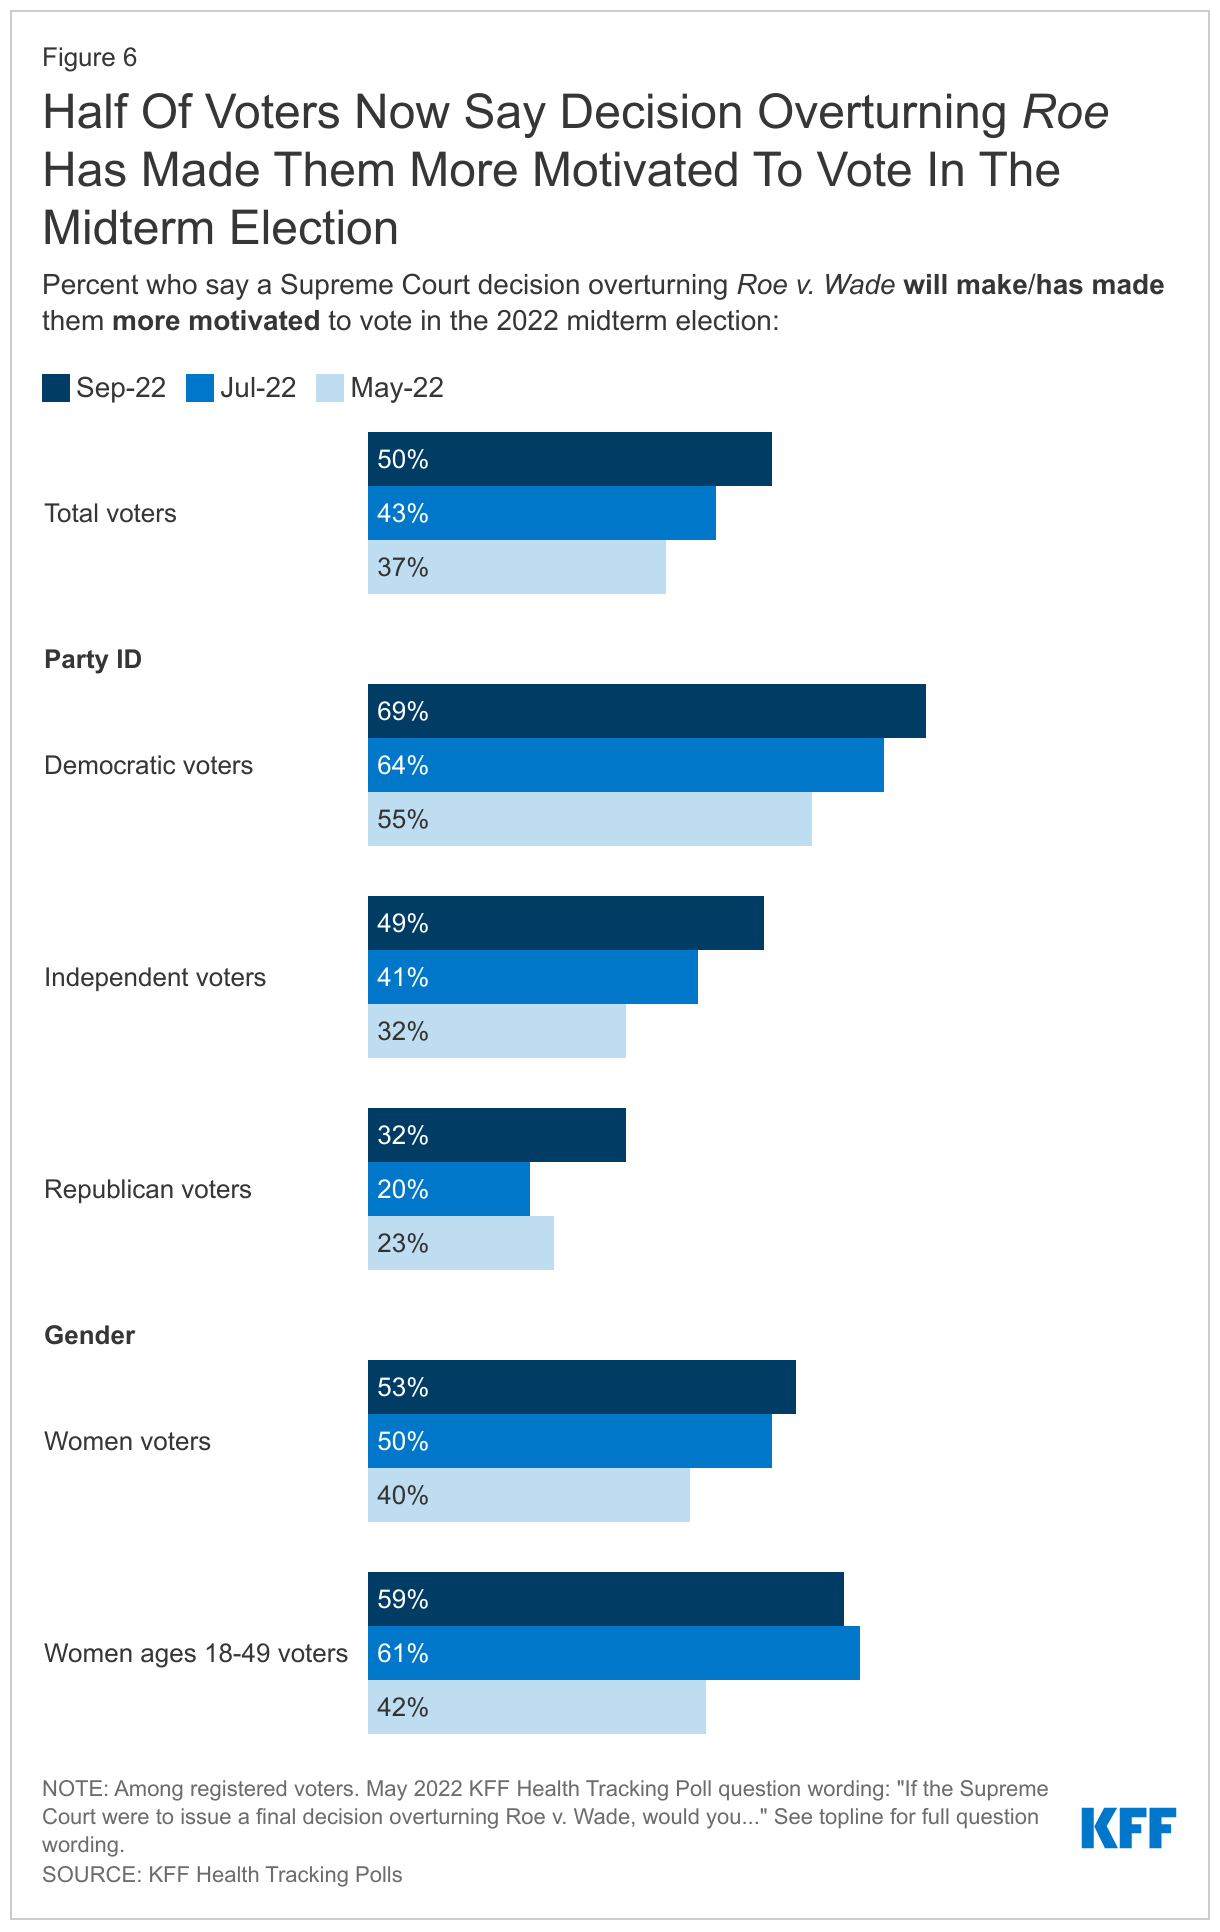
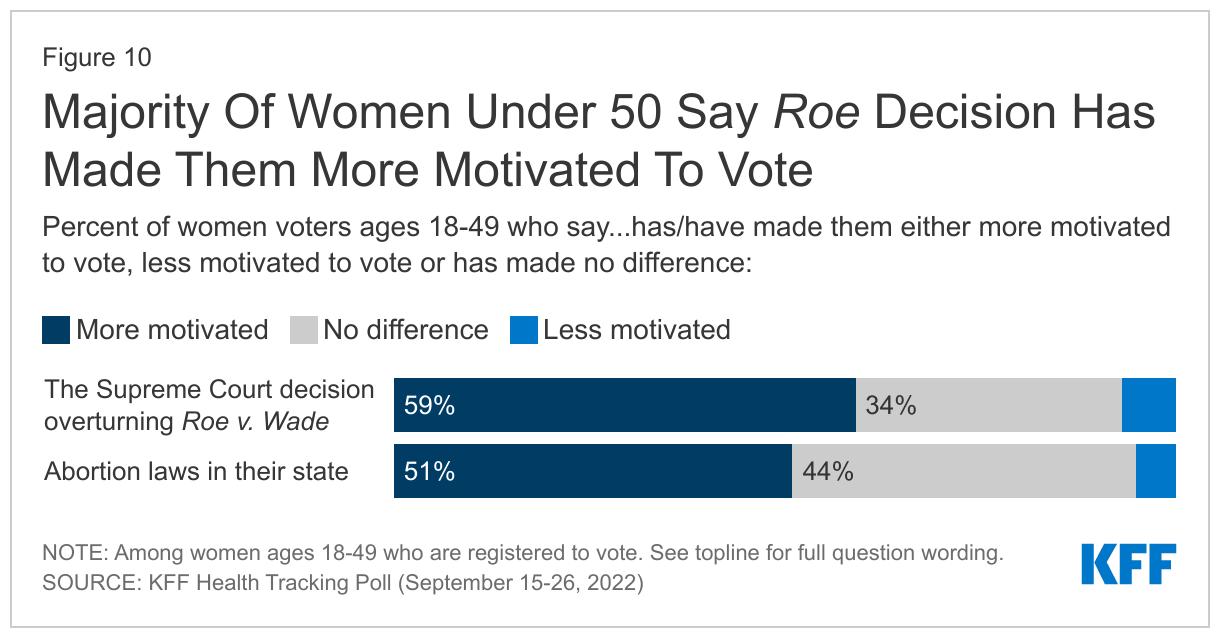
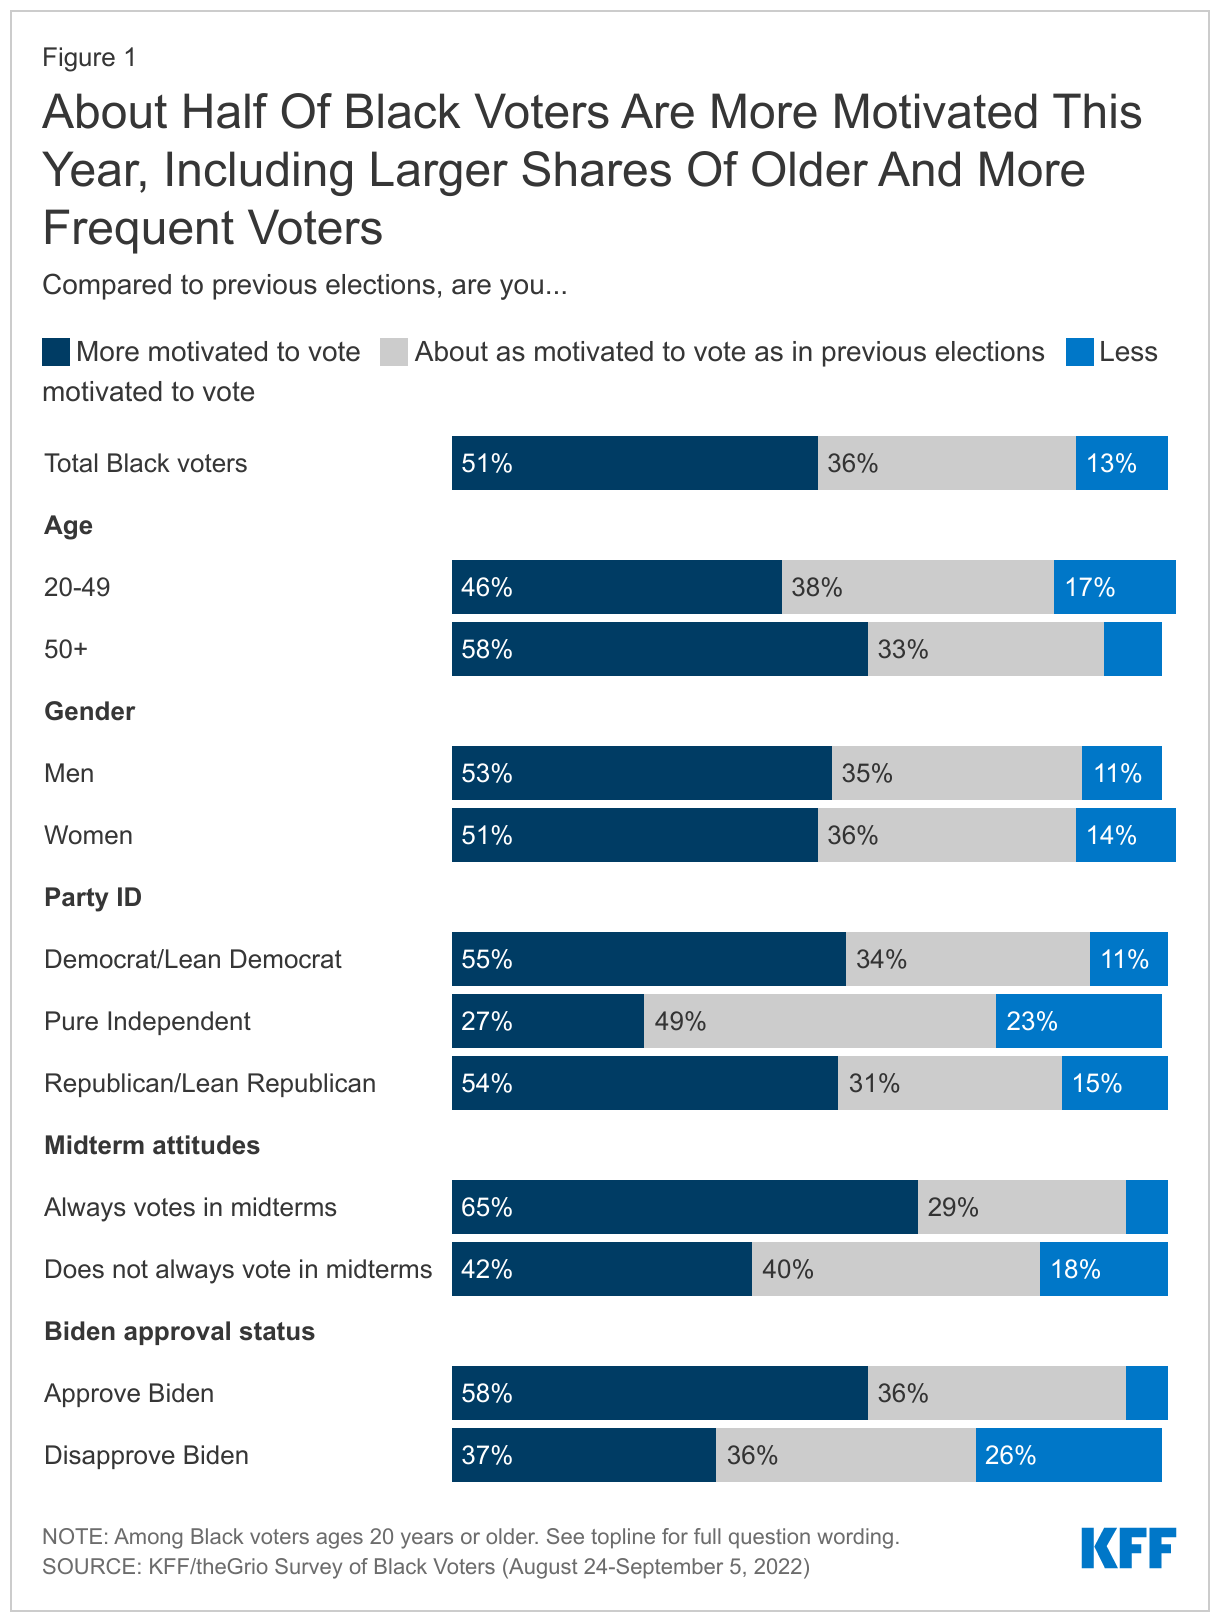
Half (51%) of Black voters say they are more motivated to vote this year compared to previous elections, while 36% say they are about as motivated and 13% say they are less motivated to vote this year. The share of Black voters who say they are more motivated is similar to the share of White voters (53%) who said the same in another KFF survey fielded in September. Substantial shares of Black voters across groups say they are more motivated this year, but motivation is somewhat higher among older vs. younger Black voters (58% vs. 46%), among those who say they always vote in midterms vs. those who vote less often (65% vs. 42%), and among those who approve of Biden’s job performance vs. those who disapprove (58% vs. 37%). About half of both Black men voters and Black women voters say they are more motivated to vote this year, as do similar shares of those who identify as or lean Democrat and those who identify as or lean Republican. A much smaller share (27%) of those who say they are independent and don’t lean toward either party say they are more motivated to vote this year.

About Half Of Black Voters Are More Motivated This Year, Including Larger Shares Of Older And More Frequent Voters

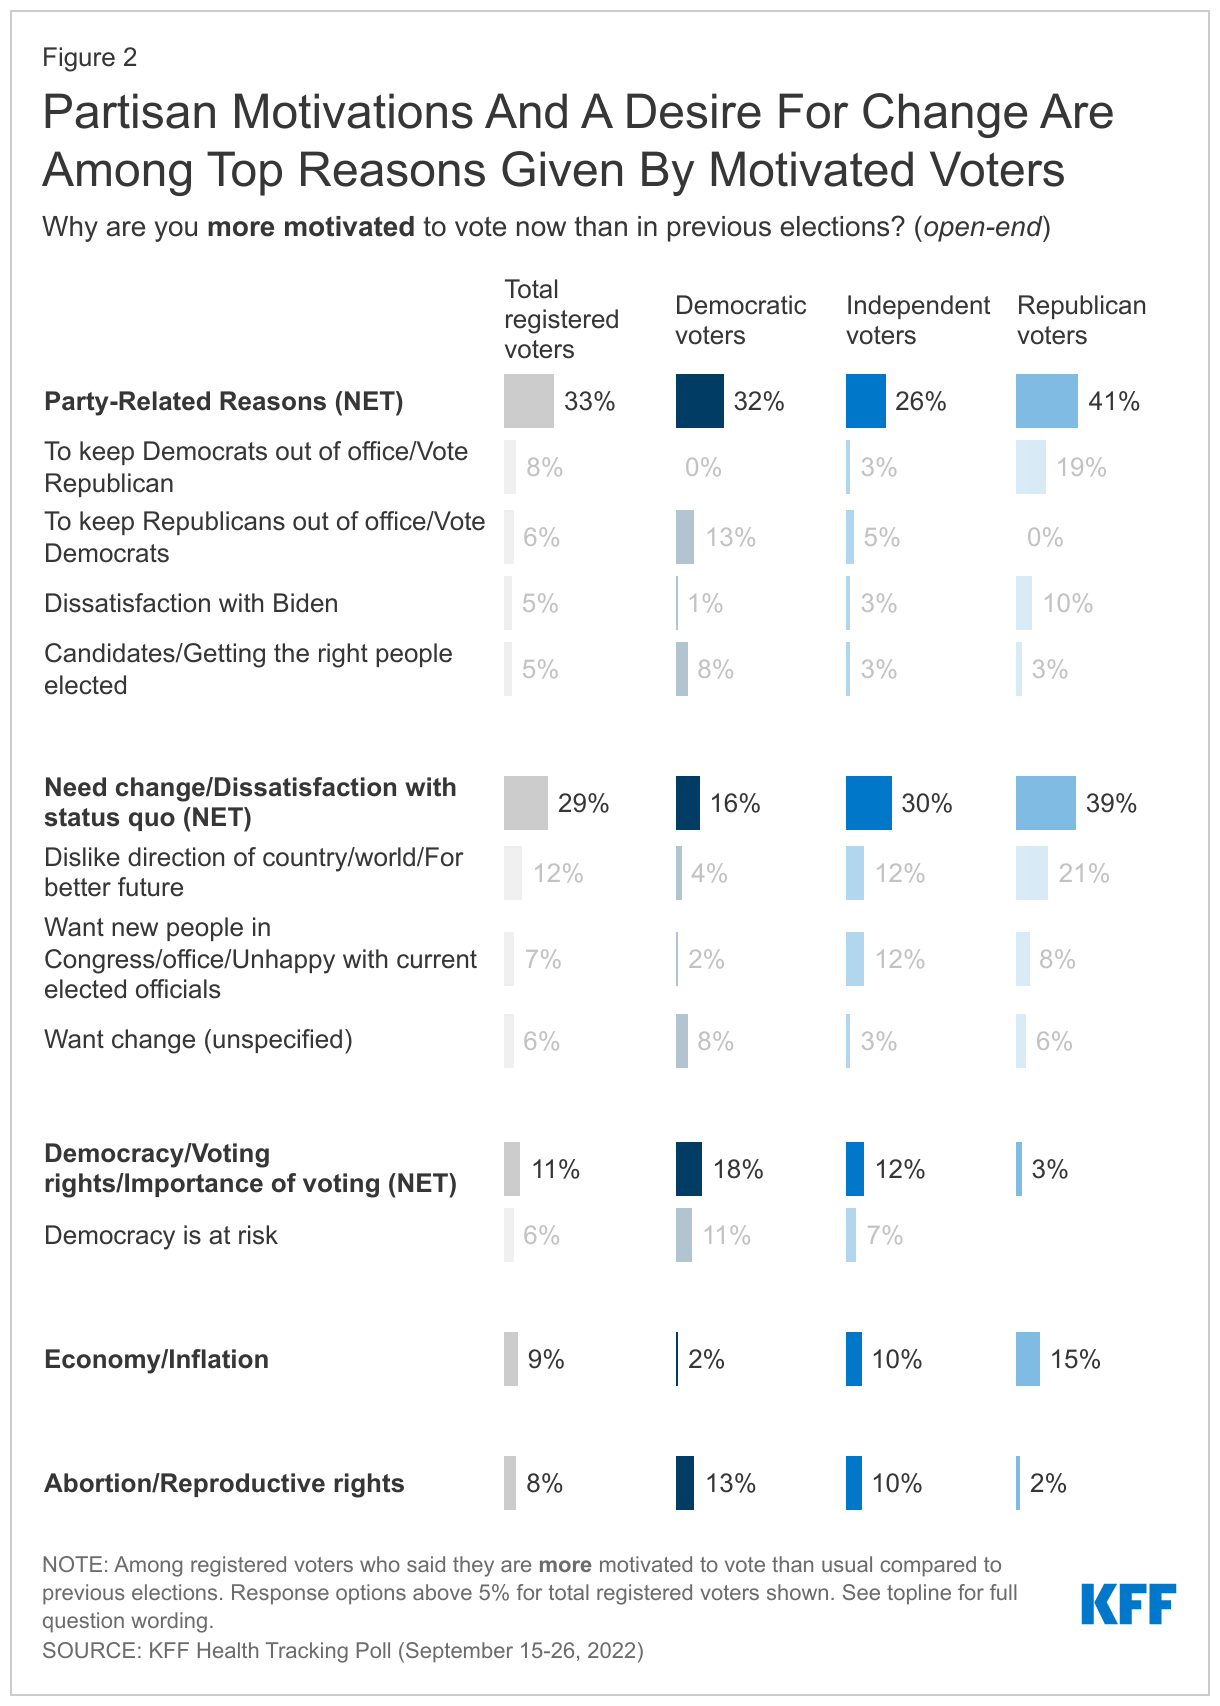
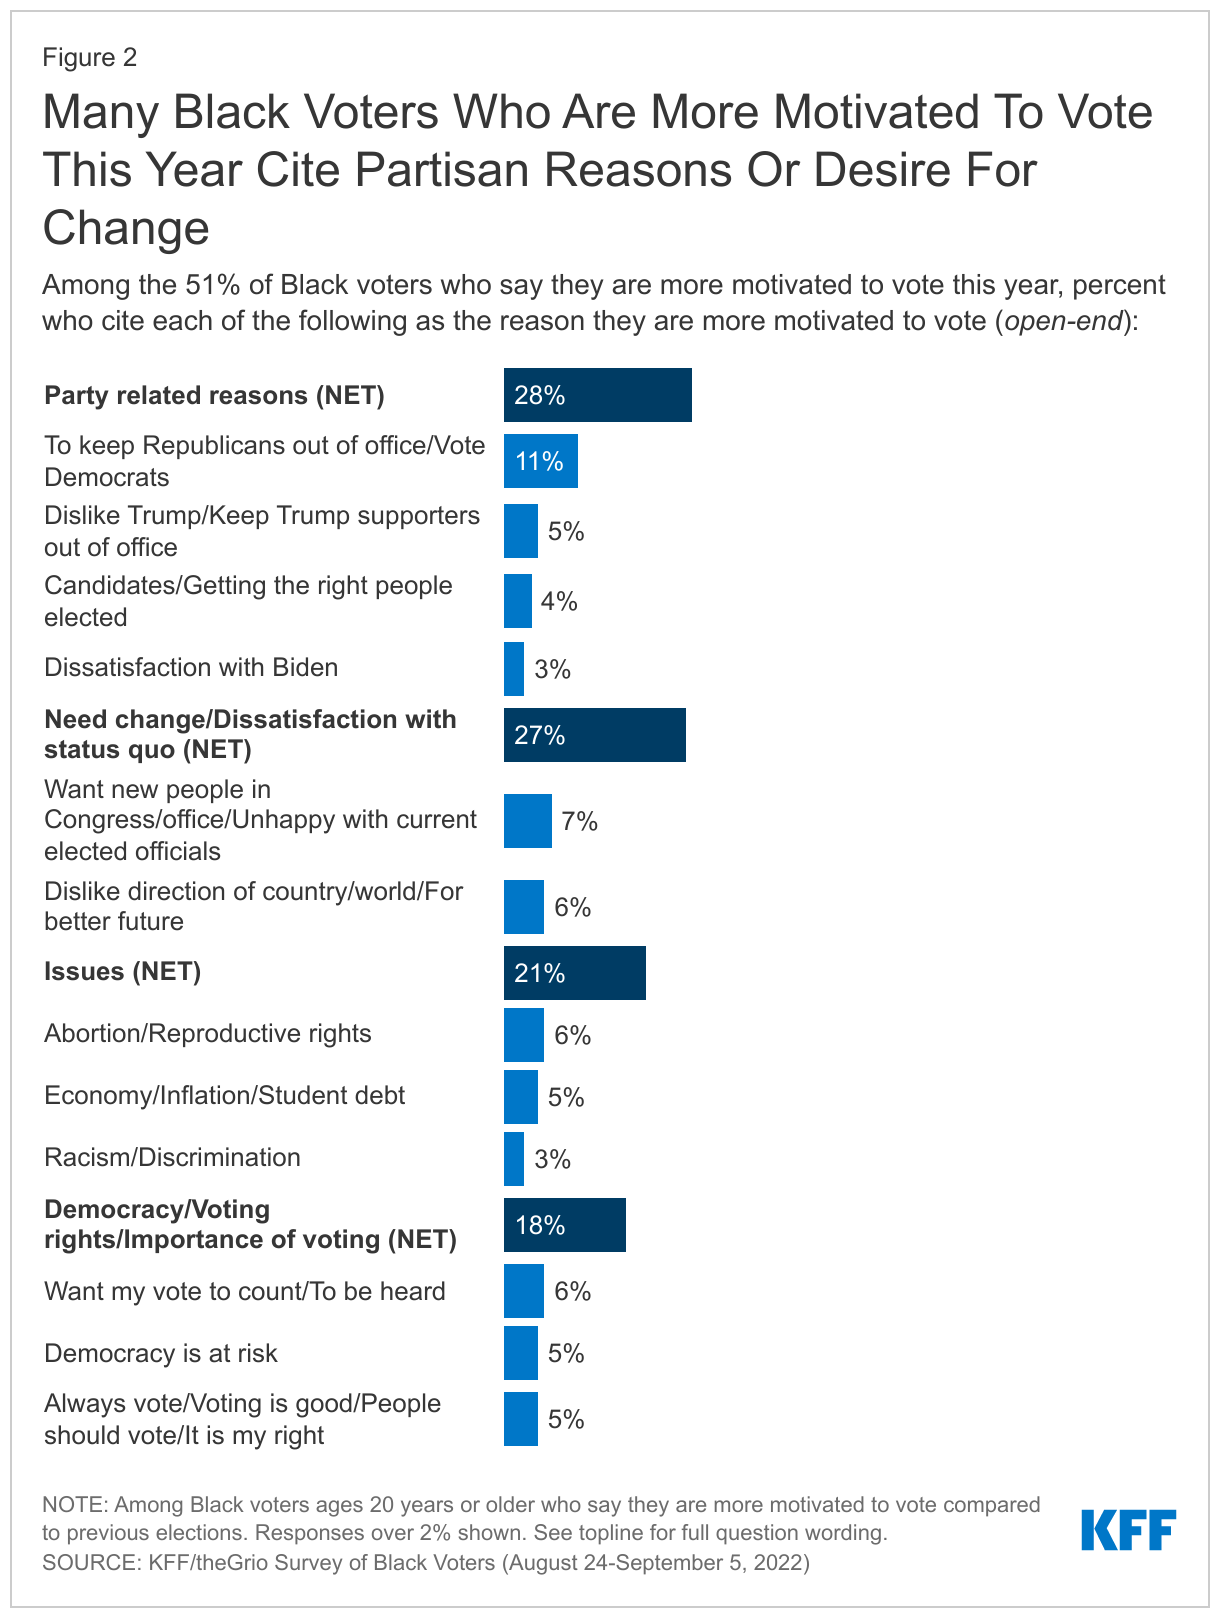
Black voters who are more motivated this year are largely driven by a desire to vote for Democrats or keep Republicans out of office or a general desire for change. Among the 51% of Black voters who say they are more motivated to vote this year compared to previous elections, 28% cite party-related reasons, such as a desire to elect Democrats or to keep Republicans and Trump supporters out of office, and 27% cite a desire for change or dissatisfaction with the status quo. About one in five cite specific issues (21%) or reasons related to democracy, voting rights, and the importance of voting (18%) for their greater motivation. Among the specific issues mentioned, 6% cite abortion rights and 5% cite economic issues as the source of their motivation.

Those who are less motivated largely say that they don’t think their vote will make a difference (22%), that they dislike the candidates (16%), or that they feel all politicians are dishonest (10%).

Many Black Voters Who Are More Motivated To Vote This Year Cite Partisan Reasons Or Desire For Change

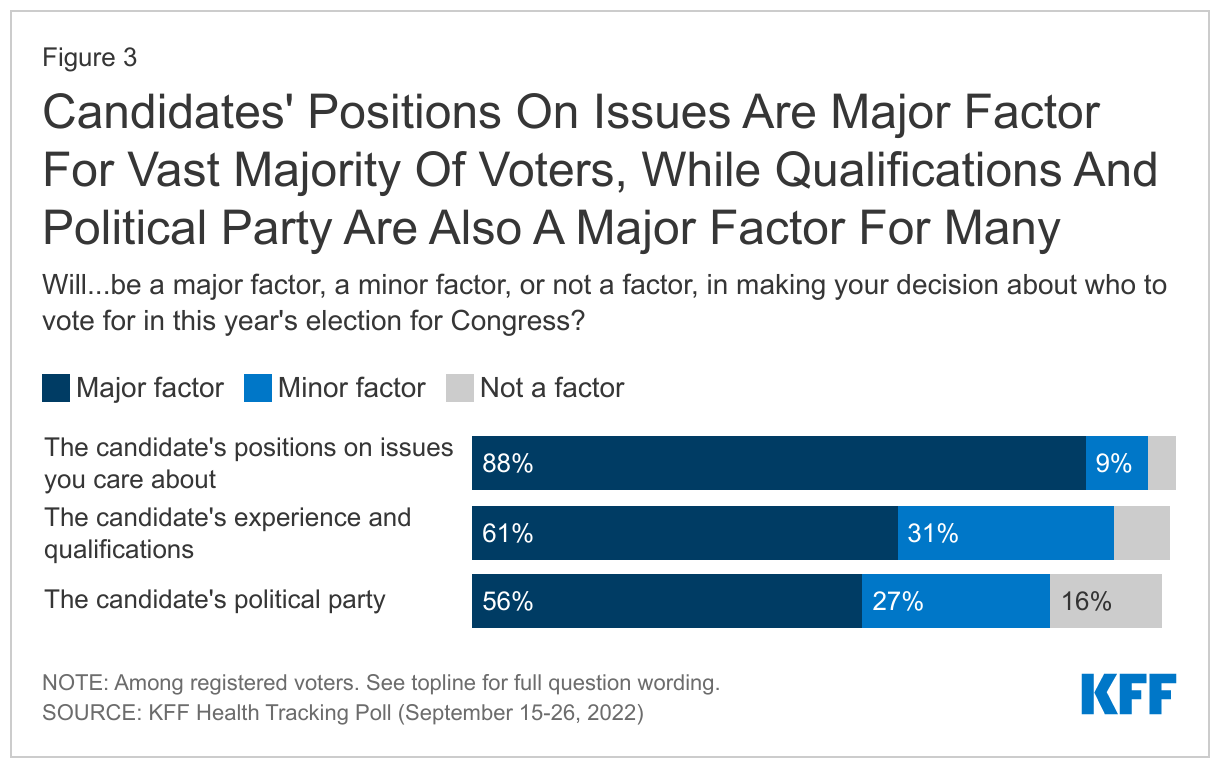
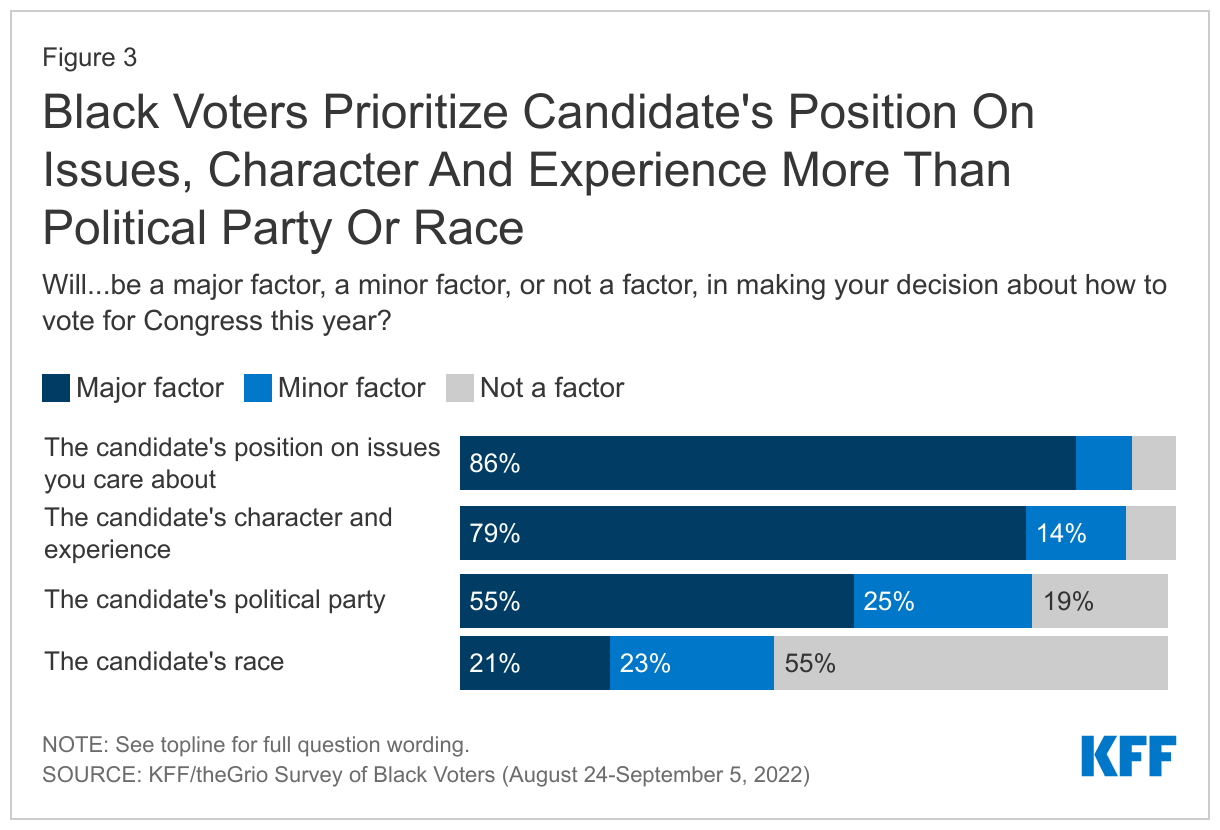
Majorities of Black voters say they consider candidate’s issue positions, character and experience, and political party when deciding how to vote, but fewer say a candidate’s race is a major factor. Large majorities of Black voters say that a candidate’s position on issues (86%) and character and experience (79%) are major factors in making their decision about how to vote for Congress this year, and a smaller majority (55%) say the same about the candidate’s political party. A much smaller share (21%) say a candidate’s race is a major factor in their decision.

Despite reporting they will consider many things beyond the candidate’s party, three-quarters (77%) of Black voters say that if the election were held at the time of the survey, they would be most likely to vote for the Democratic candidate for Congress in their district, while 11% say they would be more likely to vote for a Republican and another 11% for a candidate from another party.

Black Voters Prioritize Candidate's Position On Issues, Character And Experience More Than Political Party Or Race

Black Voters Generally Confident Their Vote Will Be Counted, But Concerned About Voter Suppression

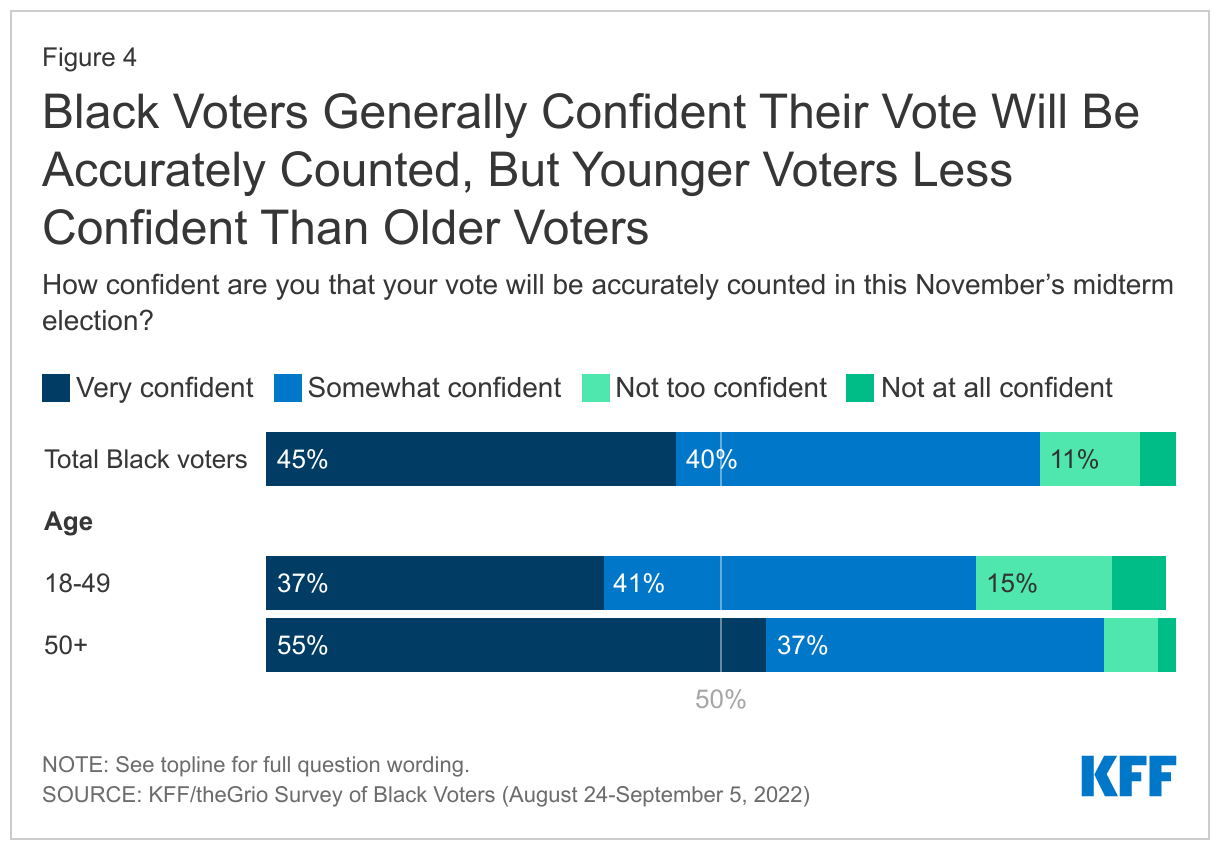
Black voters are generally confident that their vote will be accurately counted this November. A large majority (84%) of Black voters say they are at least “somewhat” confident their vote will be accurately counted in this November’s election, including more than four in ten (45%) who say they are very confident. However, younger voters under age 50 are less likely to feel very confident compared to their older counterparts (37% vs. 55%), and about one in five younger Black voters (22%) say they are “not too confident” or “not at all confident” that their vote will be counted accurately.

Black Voters Generally Confident Their Vote Will Be Accurately Counted, But Younger Voters Less Confident


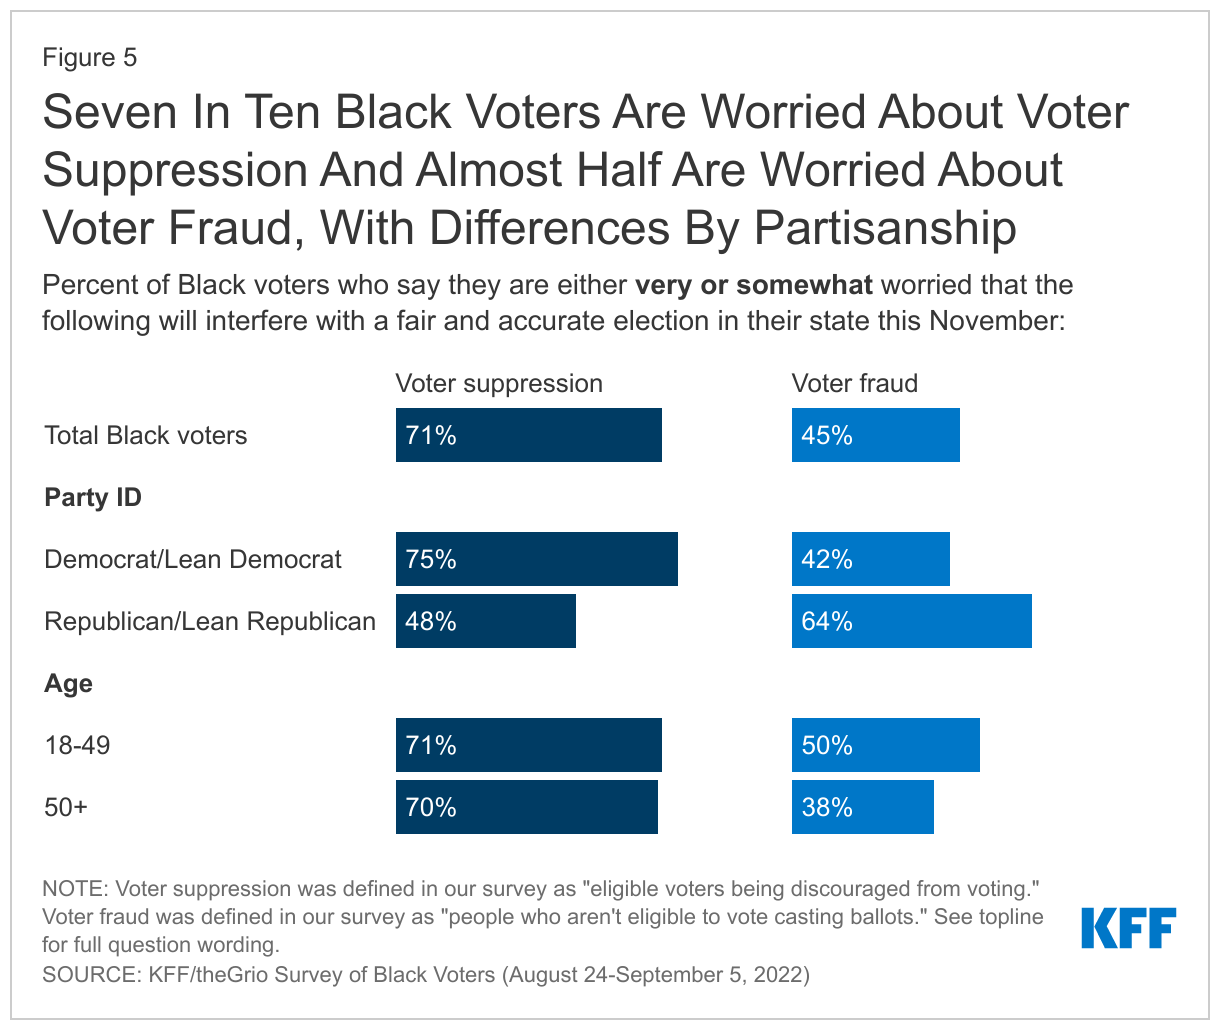
Seven in ten Black voters are worried about voter suppression and almost half are worried about voter fraud interfering with a fair and accurate election in their state this November. Three in four Black voters who are Democrat or lean Democrat say they are worried about voter suppression, compared to about half (48%) of their Republican counterparts. Conversely, Black voters who are Republican or lean toward the party (64%) are more likely than Black Democrats/leaners (42%) to say they are worried about voter fraud. Black voters of all ages are equally likely to express worry about voter suppression, but there is an age gap on concerns about fraud. Half of Black voters under age 50 say they are very or somewhat worried about voter fraud, compared to 38% of voters over 50.

Seven In Ten Black Voters Are Worried About Voter Suppression And Almost Half Are Worried About Voter Fraud, With Differences By Partisanship

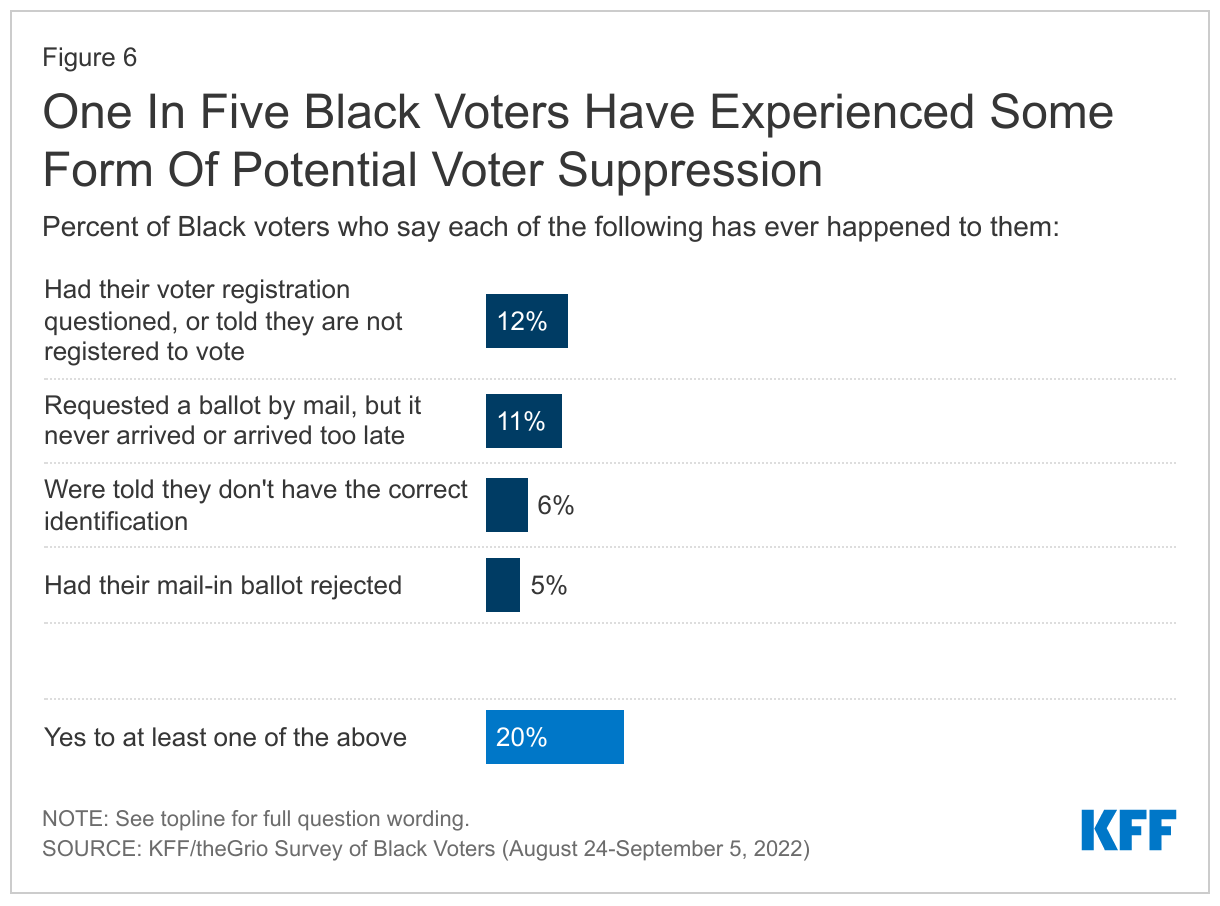
About half of Black voters say they have experienced waiting in long lines at their polling place, while one in five report experiencing acts of potential voter suppression, such as having their voter registration questioned. Nearly half (46%) of Black voters say they have experienced waiting in long lines at their polling place in the past. In addition, small but important shares report experiencing forms of potential voter suppression, including 12% who say they had their voter registration questioned, 11% who say they requested a mail-in ballot but it never arrived or arrived too late, 6% who were told they didn’t have the correct identification, and 5% who say they had their mail-in ballot rejected. Overall, one in five Black voters say they have experienced at least one of these things.

One in Five Black Voters Have Experienced Some Form Of Potential Voter Suppression

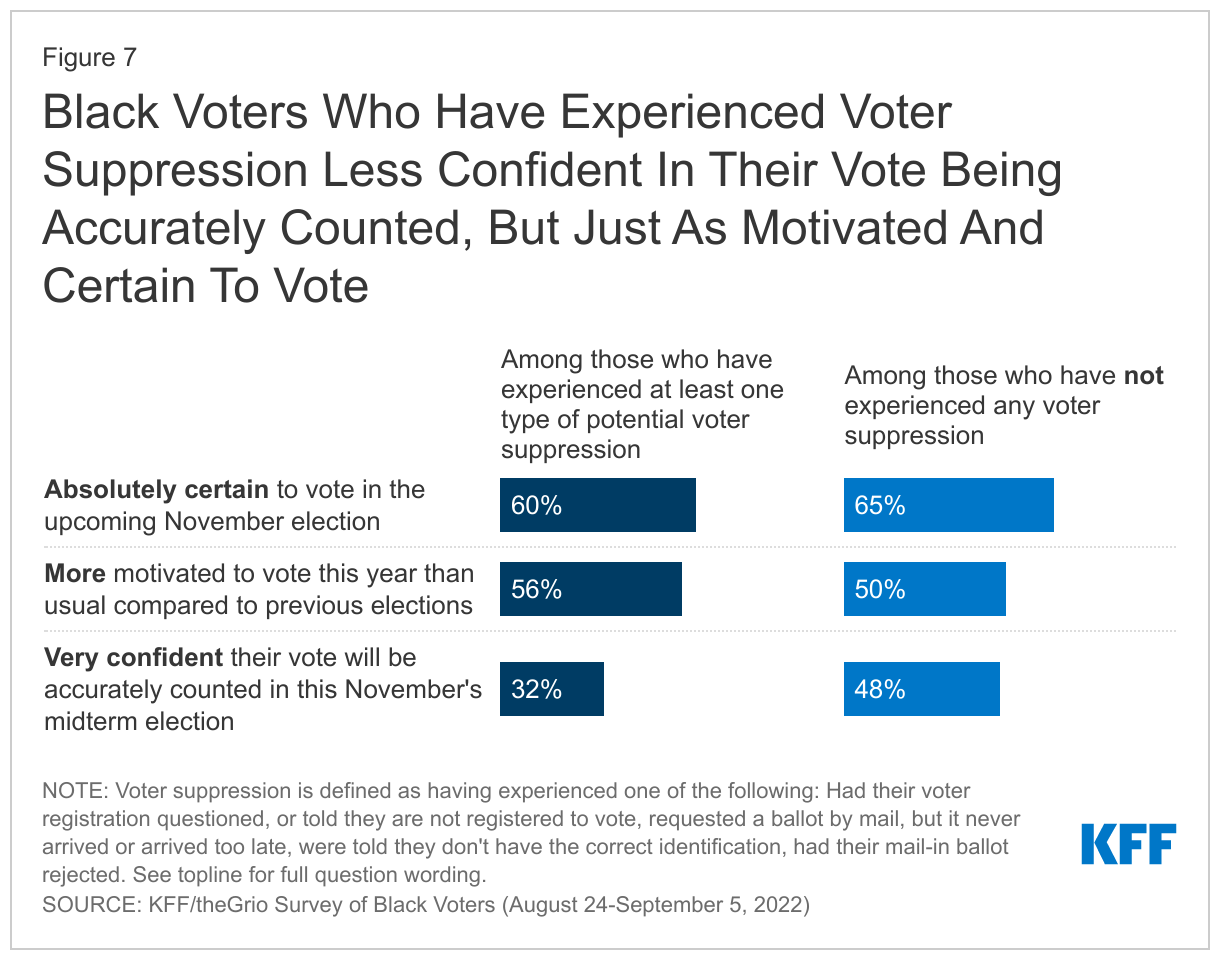
Experiences with potential voter suppression may impact Black voters’ confidence in the electoral process overall, though the survey does not suggest that it will decrease turnout this November. About a third (32%) of Black voters who have experienced potential voter suppression in the past say they are “very confident” their vote will be accurately counted this fall, compared to a larger share of those who have not experienced voter suppression (48%). However, at this point there is no evidence in the survey that these experiences will suppress turnout in November: these two groups are about equally likely to say they are absolutely certain to vote in the upcoming midterm (60% and 65%, respectively) and that they are more motivated to vote this year compared to previous elections (56% and 50%, respectively).

Black Voters Who Have Experienced Voter Suppression Less Confident In Their Vote Being Accurately Counted, But Just As Motivated And Certain To Vote


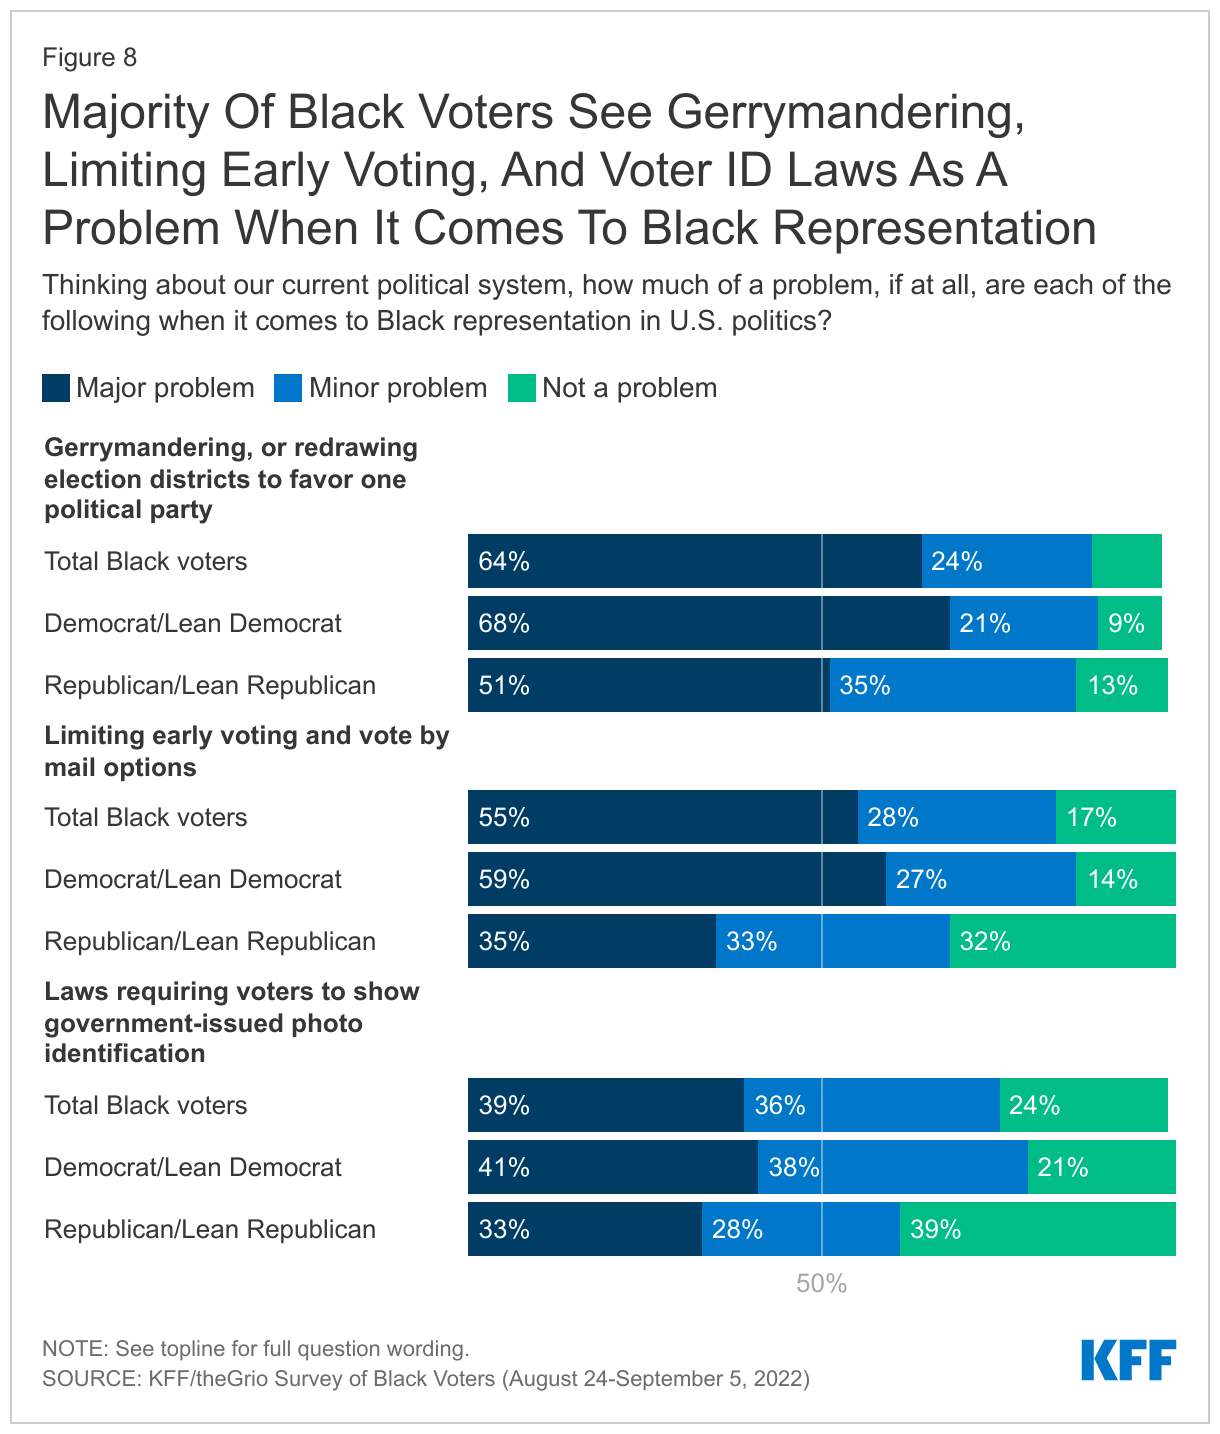
Majorities of Black voters say gerrymandering, limiting early voting, and voter ID laws are problems for Black representation in U.S. politics, with larger shares identifying gerrymandering and limiting early voting as major problems. Majorities of Black voters say these things are at least minor problems for Black representation in U.S. politics, with the largest share identifying gerrymandering as a major problem (64%), followed by limiting early voting (55%) and voter ID laws (39%). On all three issues polled, Black Democrats and those who lean Democratic are more likely to say these are problems than Republicans and those who lean toward the Republican party.

Majority Of Black Voters See Gerrymandering, Limiting Early Voting, And Voter ID Laws As A Problem When It Comes To Black Representation

Economic Concerns Top Of Mind For Black Voters, But Non-Economic Issues Also Seen As Important In Voting Decisions

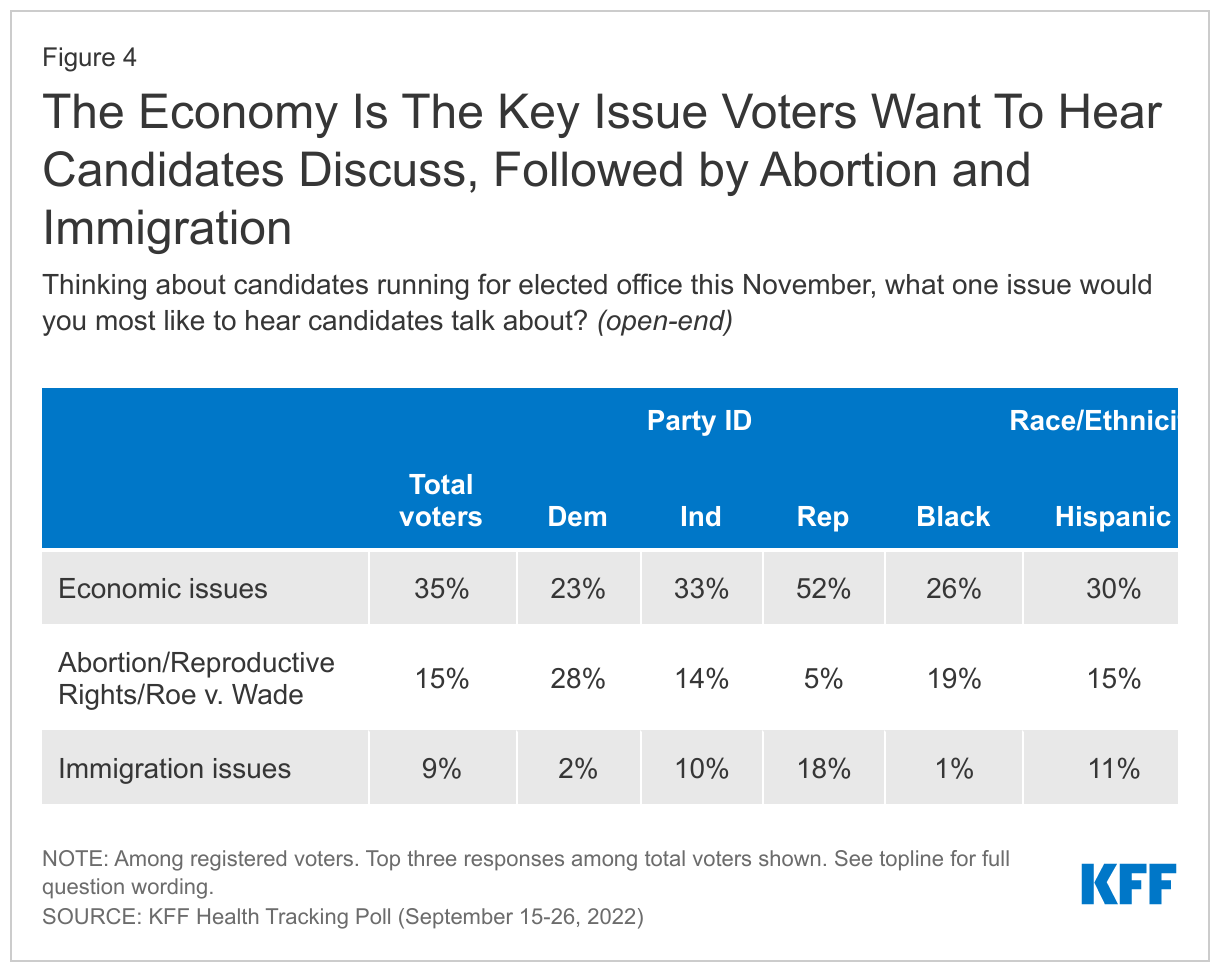
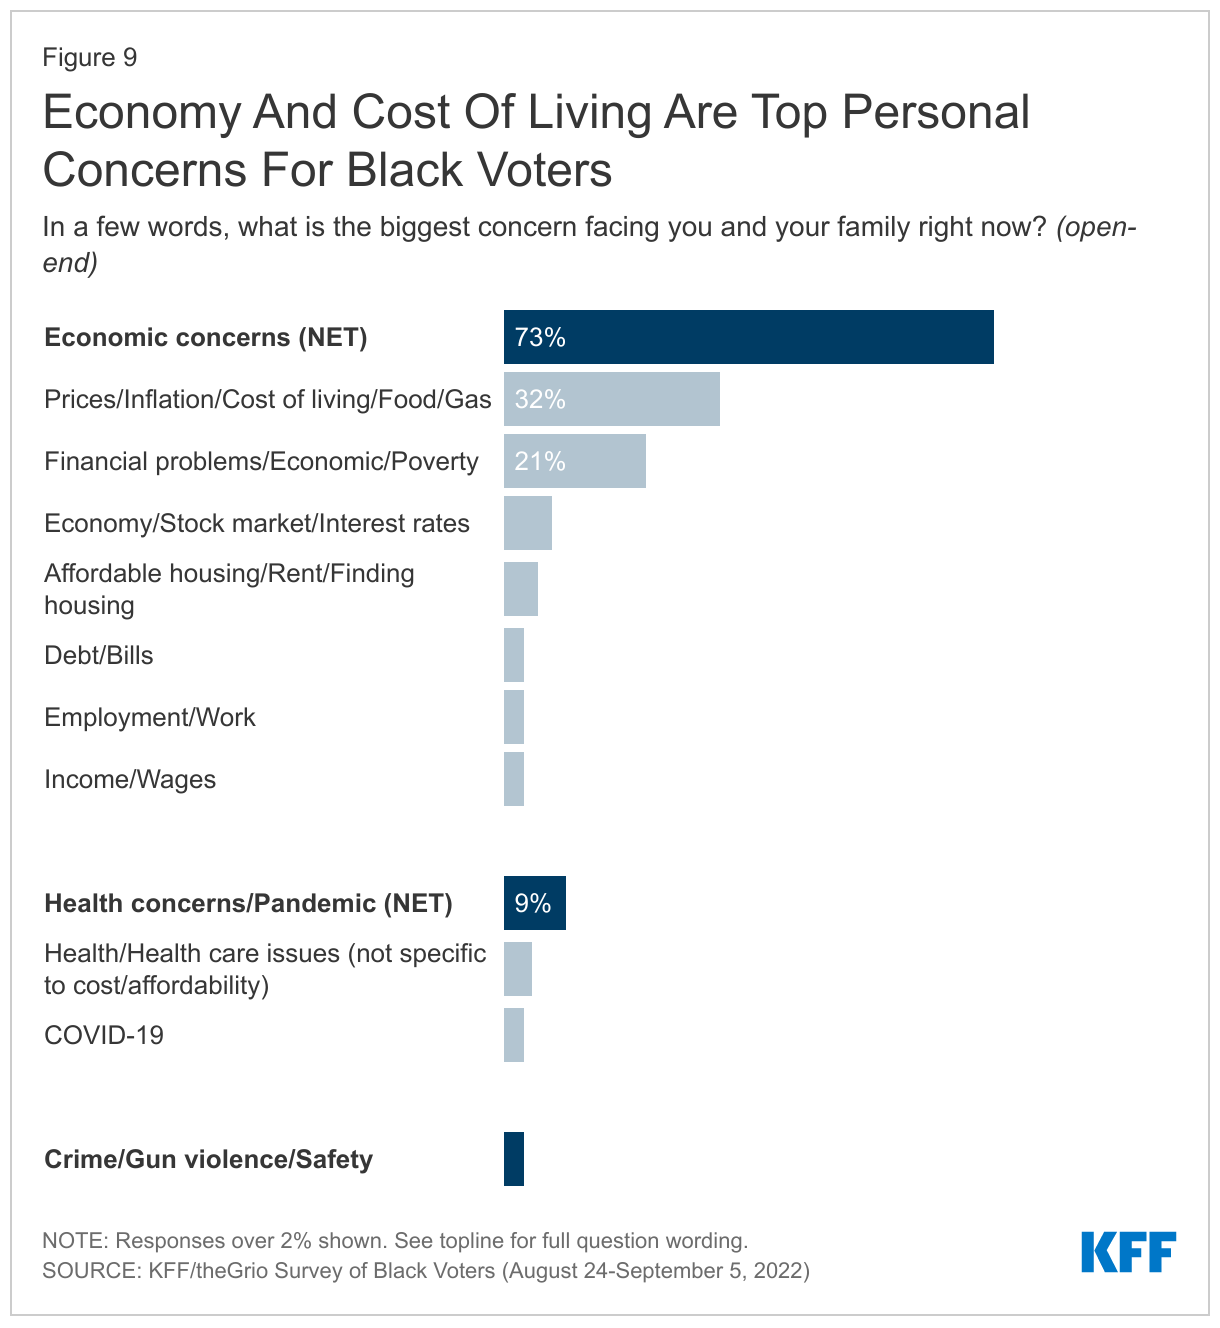
As the election approaches, economic issues loom large for Black voters and their families. When asked to state in their own words the top concern facing them and their families, about three in four (73%) Black voters point to economic concerns, including 32% who mention inflation and the cost of living and 21% who mention financial problems such as loss of income and making ends meet. Voters under age 65 are particularly likely to mention economic concerns (78% vs. 53% of those ages 65 and older), while a larger share of those ages 65 and older mention health concerns (17% vs. 7% of those under age 65). Crime, gun violence, and safety were raised by 3% of Black voters, while 2% named racism and racial disparities.

More broadly, at least six in ten Black voters say it’s a bad time to be a Black man (67%), a Black woman (62%), or a Black child (67%) in the US. Further, around eight in ten (81%) feel the economic system in the U.S. is stacked against people like them and a similar share say the same about the U.S. political system (79%).

Economy And Cost Of Living Are Top Personal Concerns For Black Voters

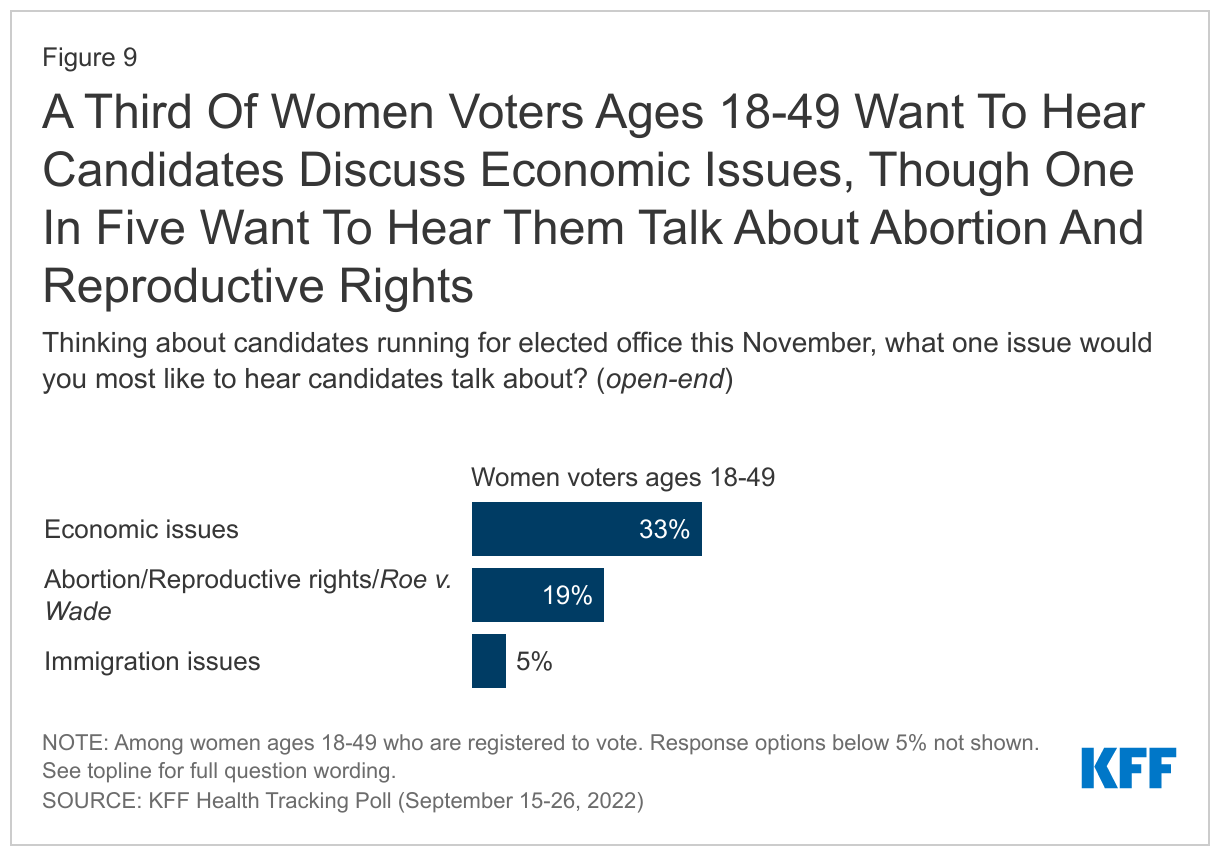
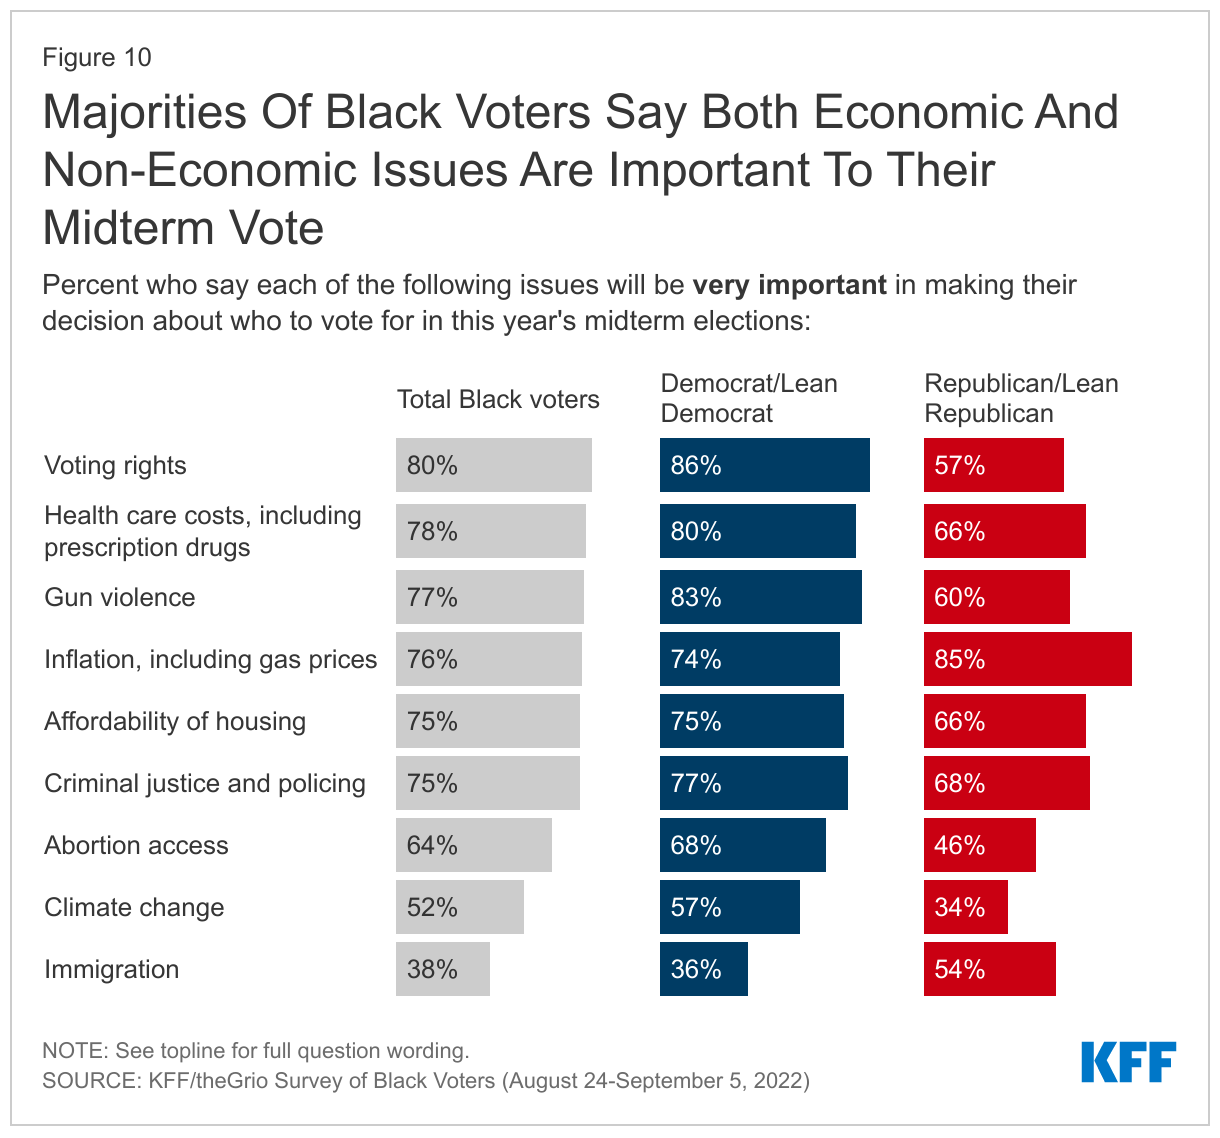
Black voters prioritize a variety of issues as very important to their midterm vote, including economic as well as non-economic issues. Black voters cite an array of issues as very important when considering who to vote for this fall, with no one issue taking the top spot. In a top tier, six issues are clustered together, each with three in four or more Black voters who say the following are very important to their midterm vote: voting rights (80%), health care costs (78%), gun violence (77%), inflation, including gas prices (76%), criminal justice and policing (75%), and the affordability of housing (75%). Ranking somewhat lower is abortion access (64%), followed by climate change (52%), and immigration (38%). Mirroring broader partisan differences in the population as a whole, Black voters who identify as Democrats or lean toward the Democratic party are more likely to cite voting rights, health care costs, gun violence, abortion access, and climate change as important issues in their vote; those who identify or lean Republican are more likely to prioritize inflation and immigration.

Black Voters Say Both Economic And Non-Economic Issues Are Important To Their Midterm Vote

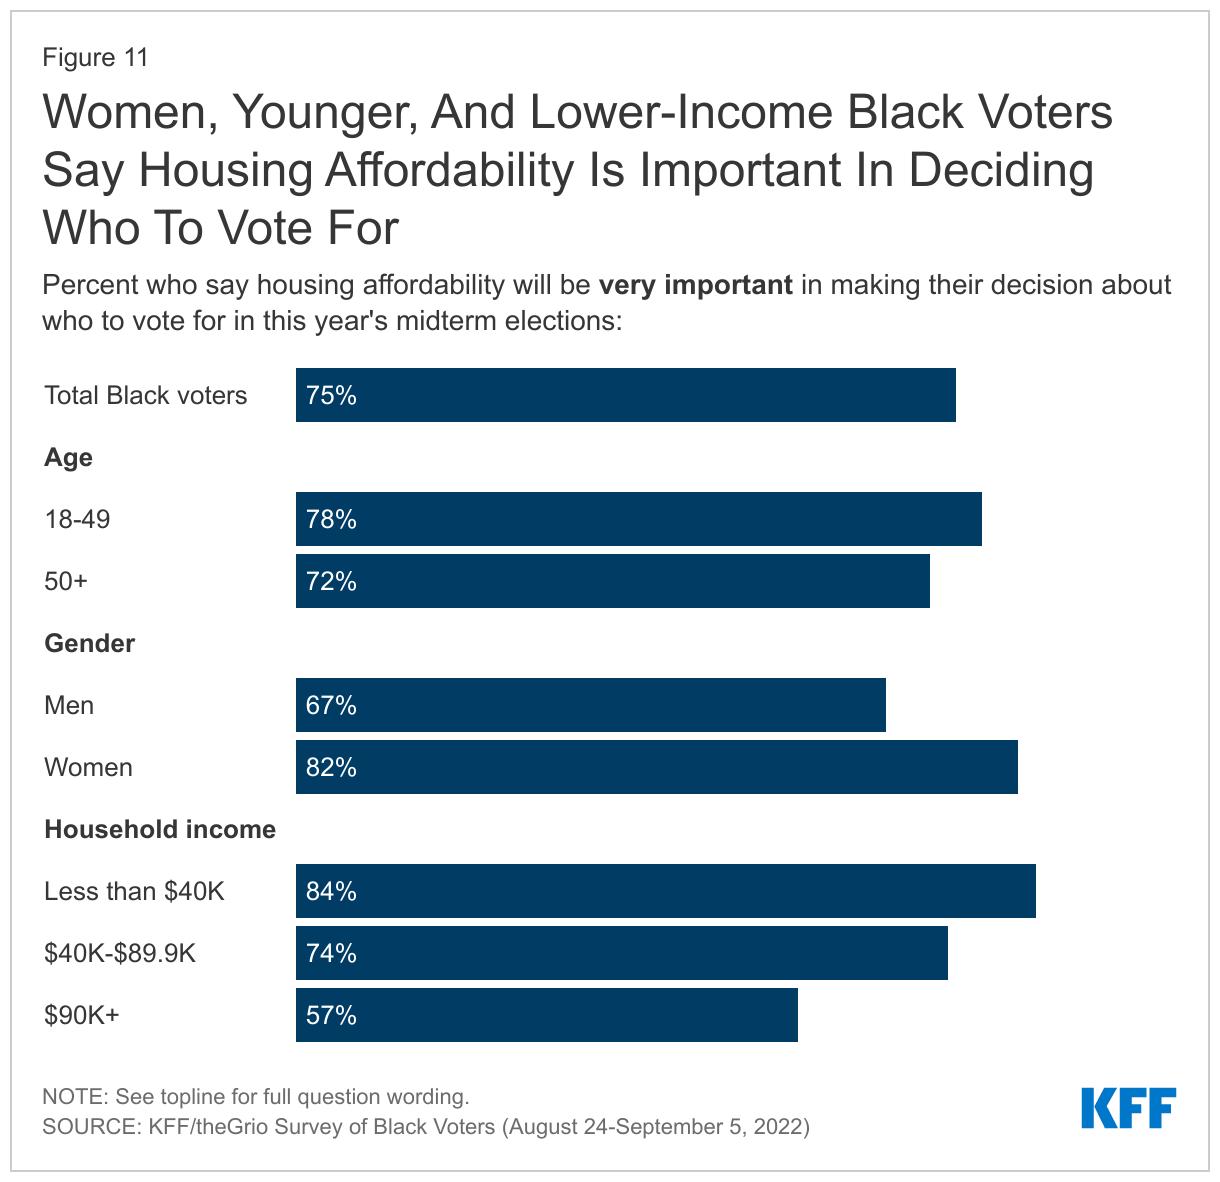
Housing affordability ranks higher as a voting issue for certain groups of Black voters, including women, younger voters, and those with lower incomes. Housing affordability is a top issue for lower-income Black voters, with 84% of voters with incomes under $40,000 saying it is very important to their vote, compared to 57% of those with incomes of $90,000 or more. The cost of housing is also named as an important voting issue by a larger share of younger voters compared to older Black voters (78% of those under age 50 vs. 72% of those 50 and older) and for Black women compared to men (82% vs. 67%).

Gender is an important divide on other issues as well. Beyond housing affordability, Black women voters are more likely than Black men voters to say certain issues are very important to their vote, including health care costs (83% vs. 73%), gun violence (84% vs. 69%), inflation (79% vs. 71%), and abortion access (68% vs. 58%).

Women, Younger, And Lower-Income Black Voters Prioritize Housing Affordability In Making Decision About Who To Vote For


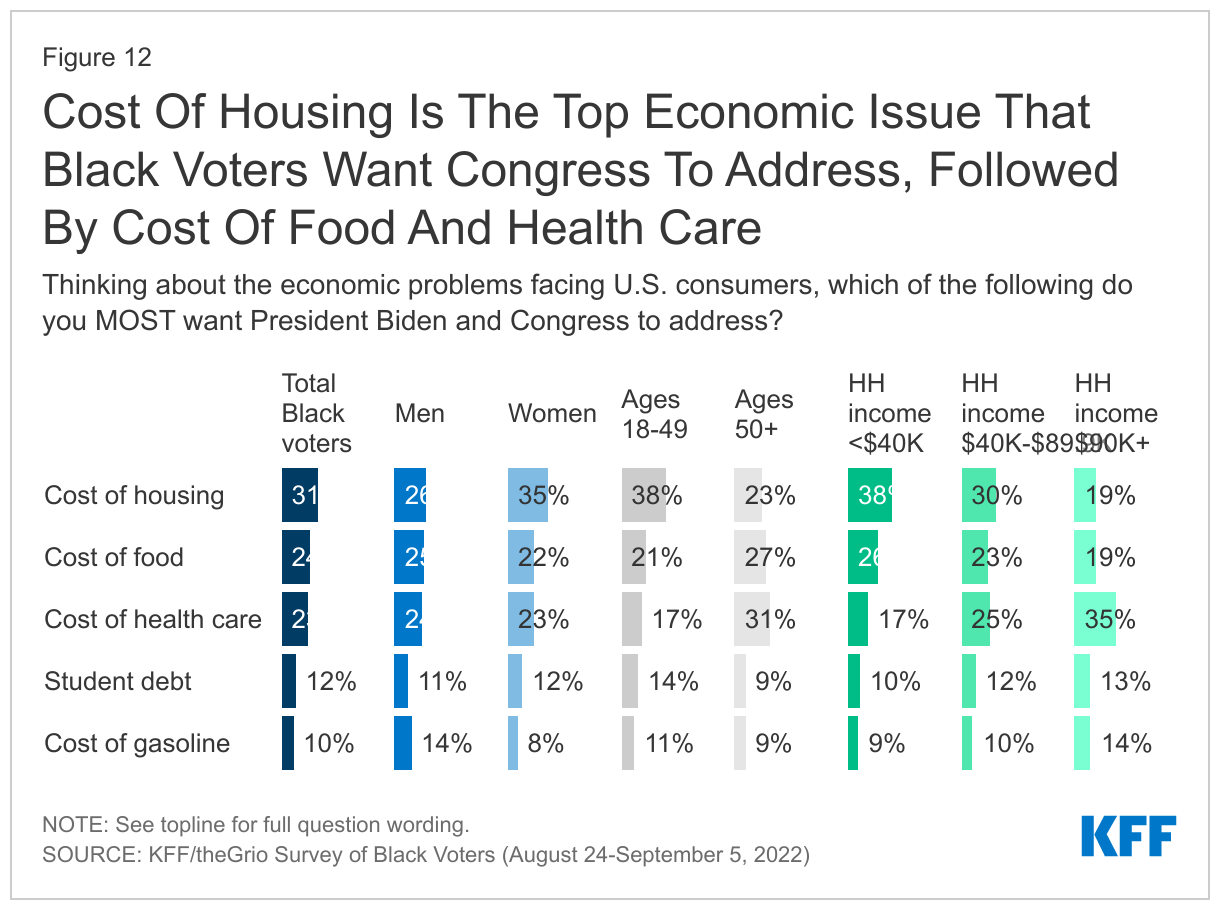
When asked about economic issues they would most like Biden and Congress to address, Black voters focus on basics like food and housing as well as the cost of health care. Of the issues polled, the cost of housing is a top concern for Black voters, with about three in ten (31%) saying it is the economic issue facing U.S. consumers they most want the President and Congress to address, including higher shares of women, younger voters, and those with lower incomes. About a quarter cite other necessities like the cost of food and health care, respectively.

In a sharp turnaround from early this summer, when gas prices were at their peak and the cost of gasoline took the top spot in a KFF poll of all adults, the cost of gas now ranks lower as a priority among Black voters.1  One in ten Black voters now cite the cost of gasoline as the economic problem they most want the President and Congress to address, while a similar share (12%) cites student debt.2 

Cost Of Housing Top Economic Issue Black Voters Want President And Congress To Address, Followed By Cost Of Food And Healthcare

Black Voters Express Negative Views Of The Supreme Court

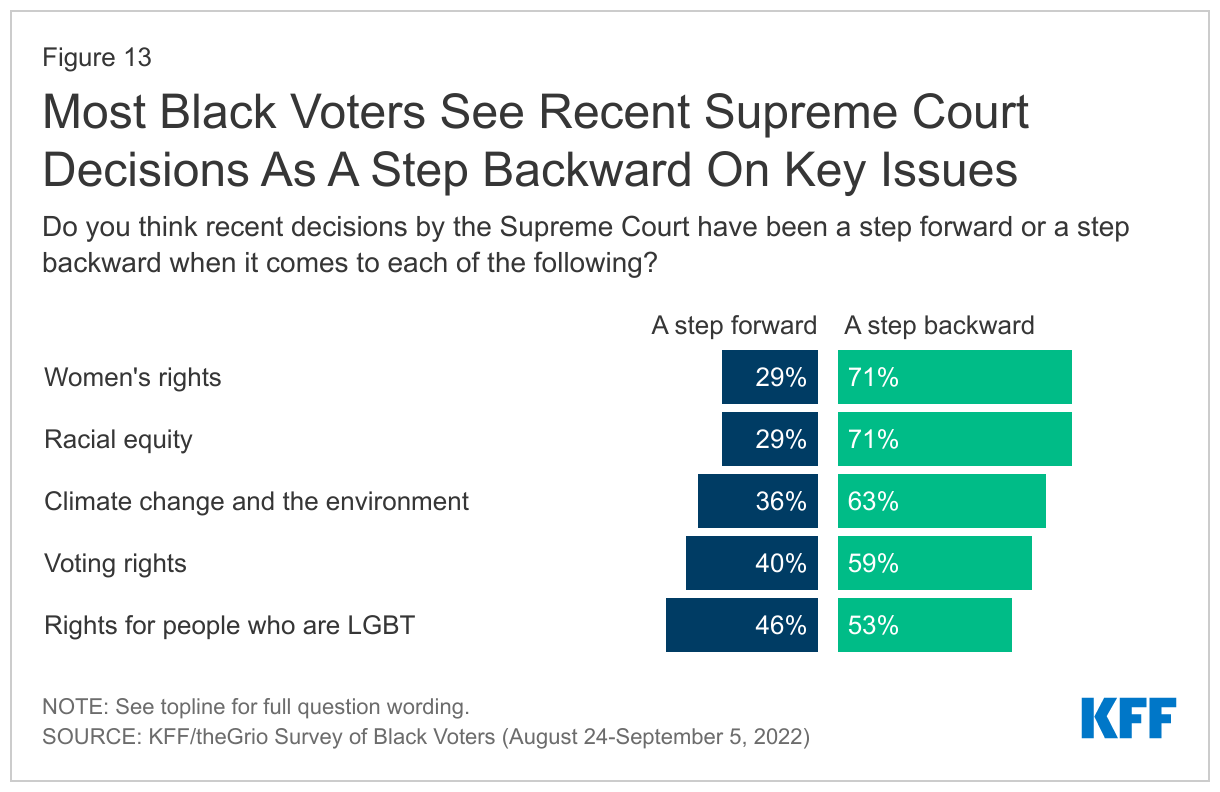
Most Black voters say recent Supreme Court decisions are a step backward when it comes to women’s rights, racial equality, climate change, and voting rights. About seven in ten Black voters say recent Supreme Court decisions have been a step backward on women’s rights (71%) and racial equity (71%), while about six in ten say the same about climate change (63%) and voting rights (59%). Black voters are more divided on the impact of recent Court decisions on LGBT rights, about half (53%) see the decisions as a step backward and nearly as many (46%) seeing a step forward.

Most Black Voters See Recent Supreme Court Decisions As A Step Backward On Key Issues

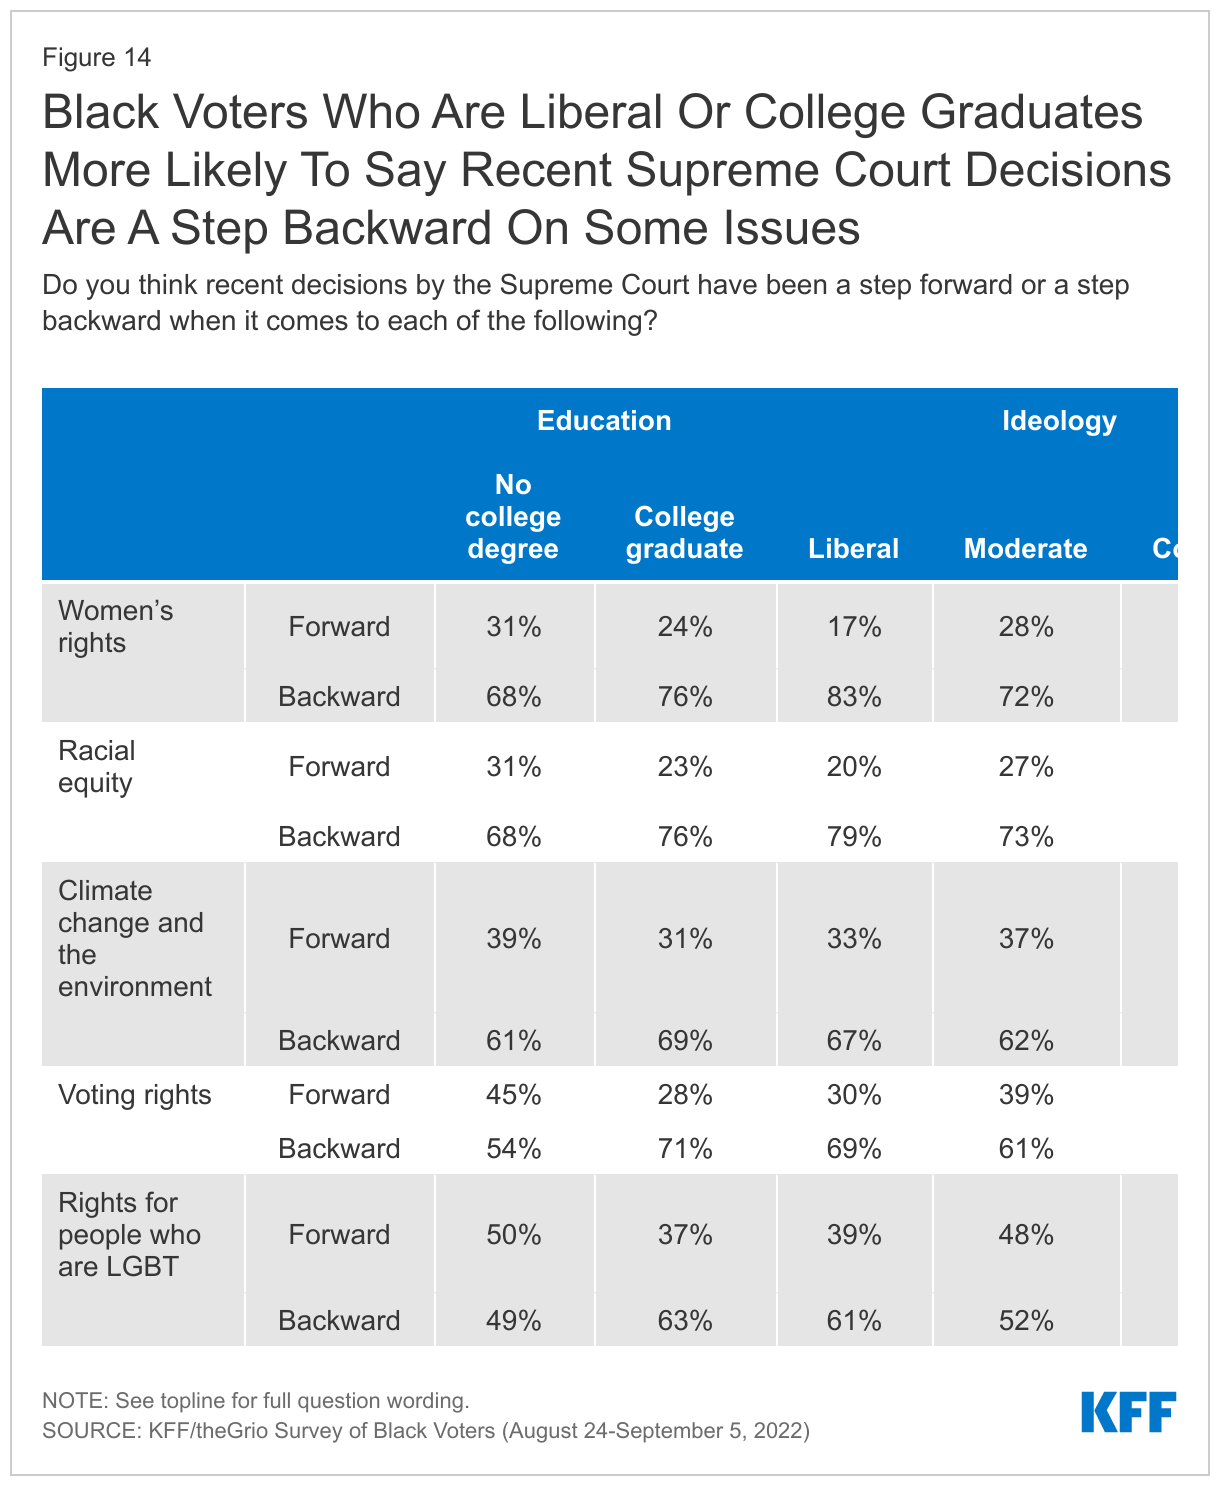
Black voters who identify as Evangelical Christians, conservatives, and those who are Republican or lean toward the Republican party are more likely to say the recent decisions are a step forward on most of the issues asked. And Black voters who are college graduates are more likely than non-graduates to see recent decisions as a step backward on each of the topics polled.

Black Voters Who Are Liberal, College Graduates More Likely To Say Recent Supreme Court Decisions Are A Step Backward

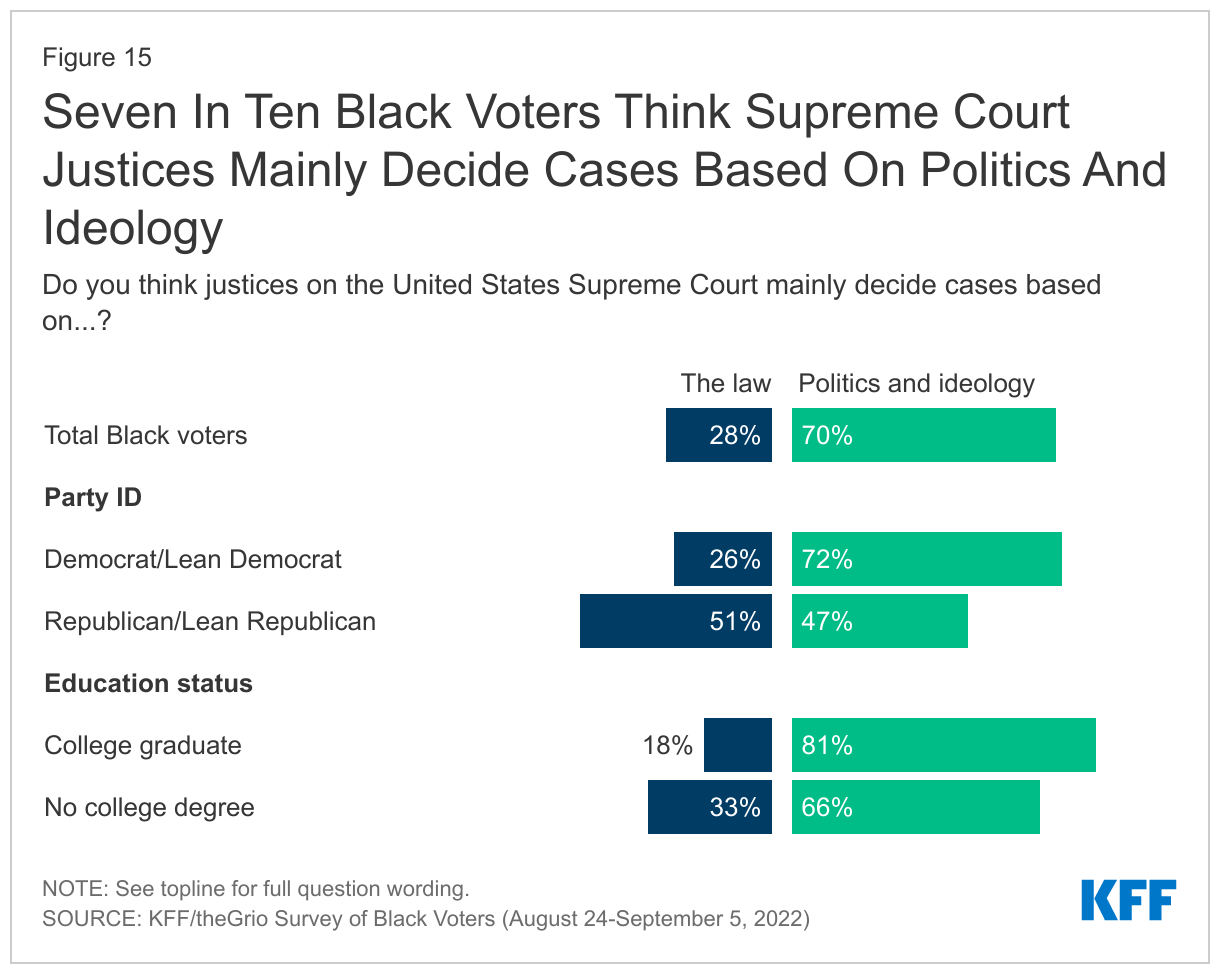
A large majority of Black voters believe that Supreme Court justices decide cases based on politics and ideology rather than the law, and about half of Black voters say recent Court decisions will directly hurt Black people. Seven in ten Black voters believe Supreme Court justices decide cases mainly based on politics and ideology rather than the law. The majority of Black Democrats and those who lean Democrat (72%) think decisions are based on politics and ideology, but Republicans and Republican leaners are more split: 51% say decisions are made on the law, while 47% say they are made on politics and ideology.

Seven In Ten Black Voters Think Supreme Court Justices Mainly Decide Cases Based On Politics And Ideology

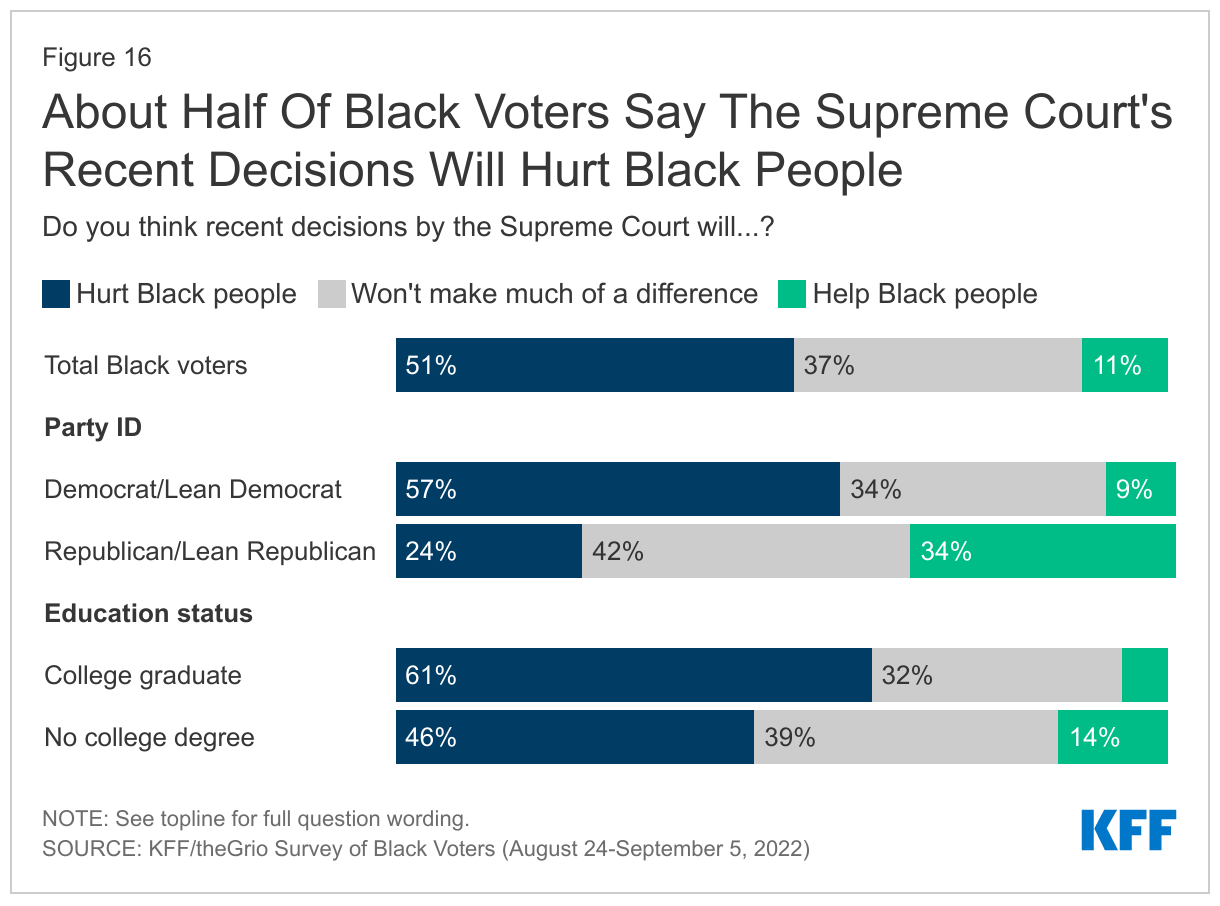
When asked more directly about the impact of recent Court decisions on Black people, 51% of Black voters say recent decisions will hurt Black people, 11% say they will help, and 37% say they won’t make much of a difference.

About Half Of Black Voters Say The Supreme Court's Recent Decisions Will Hurt Black People

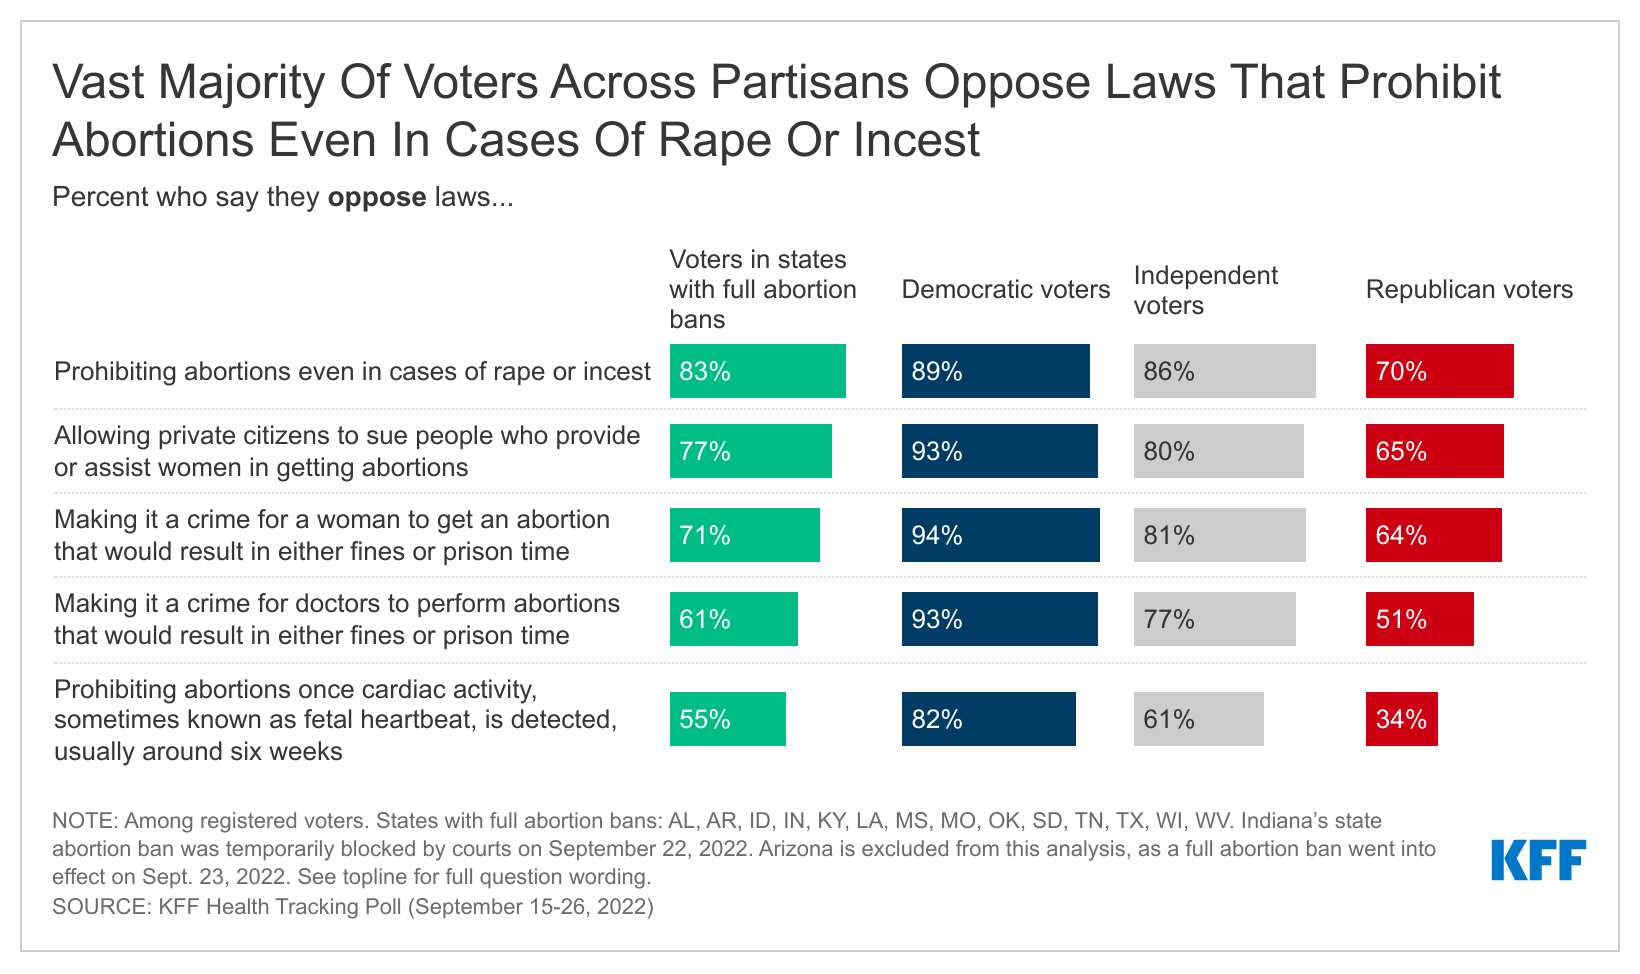
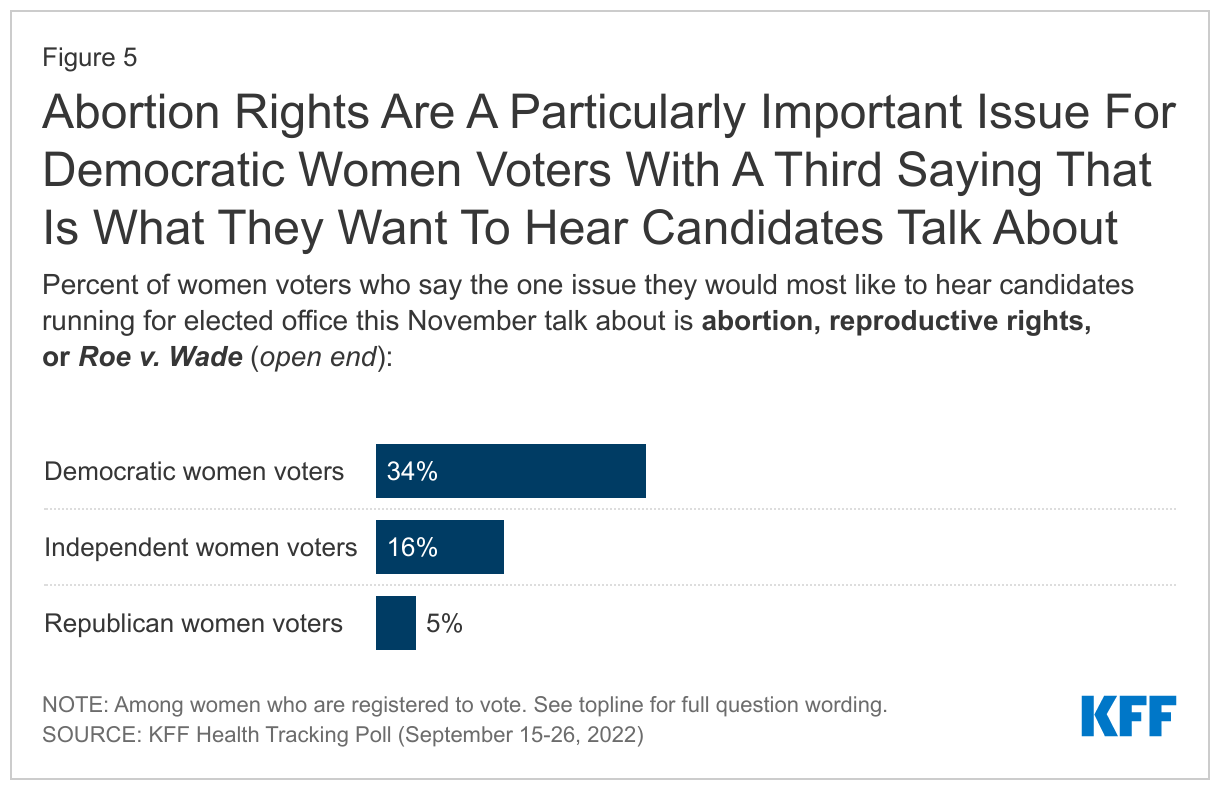
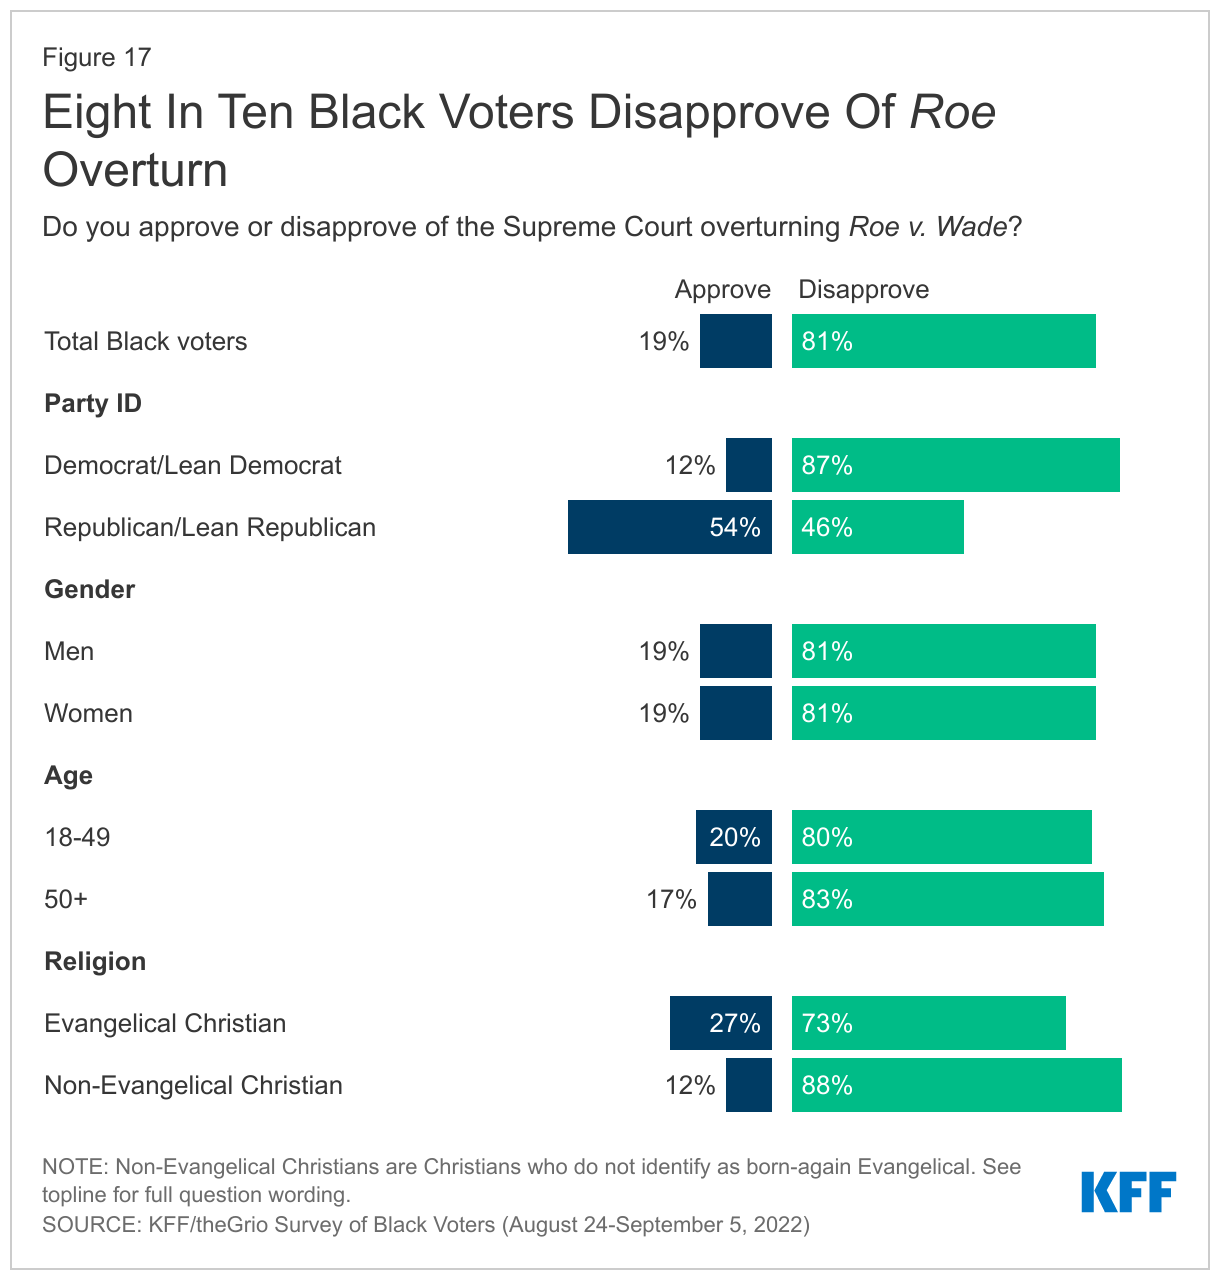
Eight in ten Black voters disapprove of the Supreme Court’s decision to overturn Roe v. Wade (81%). This share is similar across gender, age, education, and income groups. Black voters who identify as Republicans or lean toward the party are the only group that is more split on the decision, with about half (54%) approving and the other half disapproving (46%). About a quarter (27%) of Black voters who identify as Evangelical Christians approve of the overturn of Roe, far fewer compared to White Evangelicals (72%) as measured in a KFF survey of all adults in September. The same survey also found that Black voters are more likely to disapprove of the Roe overturn than are Hispanic voters (67%) and White voters (57%).

Eight In Ten Black Voters Disapprove Of Roe Overturn

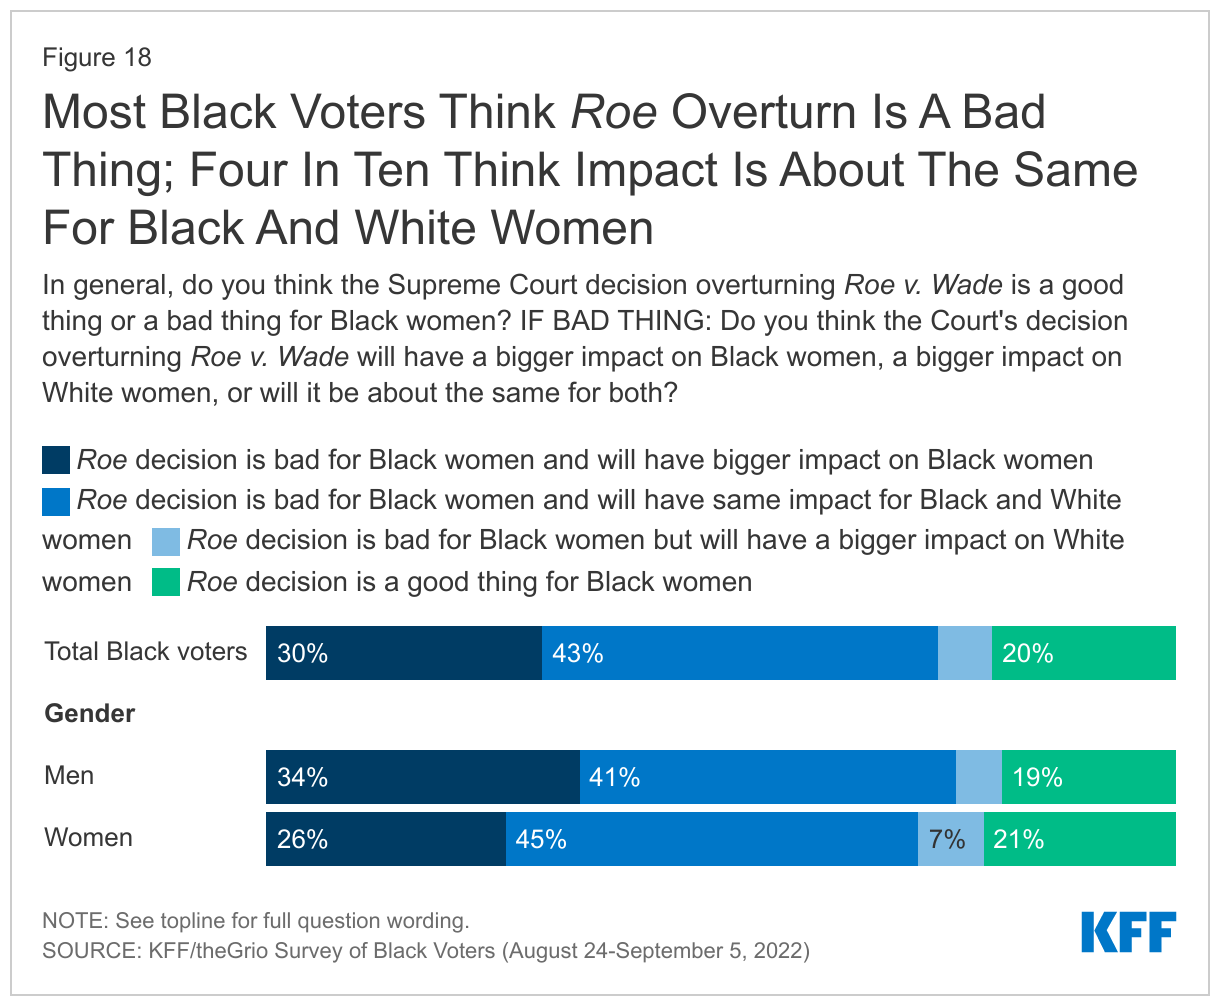
Most Black voters see the Court’s overturn as a bad thing for Black women, but a smaller share believes the Roe overturn will have a disproportionate impact on Black women compared to White women. Nearly eight in ten (79%) of Black voters say the decision to overturn Roe is a bad thing for Black women. However, most don’t see the decision disproportionately impacting Black women: 30% say the decision will have a bigger negative impact on Black women compared to White women, while 43% say the negative impact will be about the same for both groups. Black men are slightly more likely than Black women to say the decision will have a bigger negative impact on Black women than White women (34% vs. 26%), while almost half (45%) of Black women say the negative impact will be the same for both Black and White women.

Most Black Voters Think Roe Overturn Is A Bad Thing; Four In Ten Think Impact Of Overturn Is About The Same For Black And White Women


Six In Ten Black Voters Say Congress Should Prioritize Policies To Improve Health Care For Black People

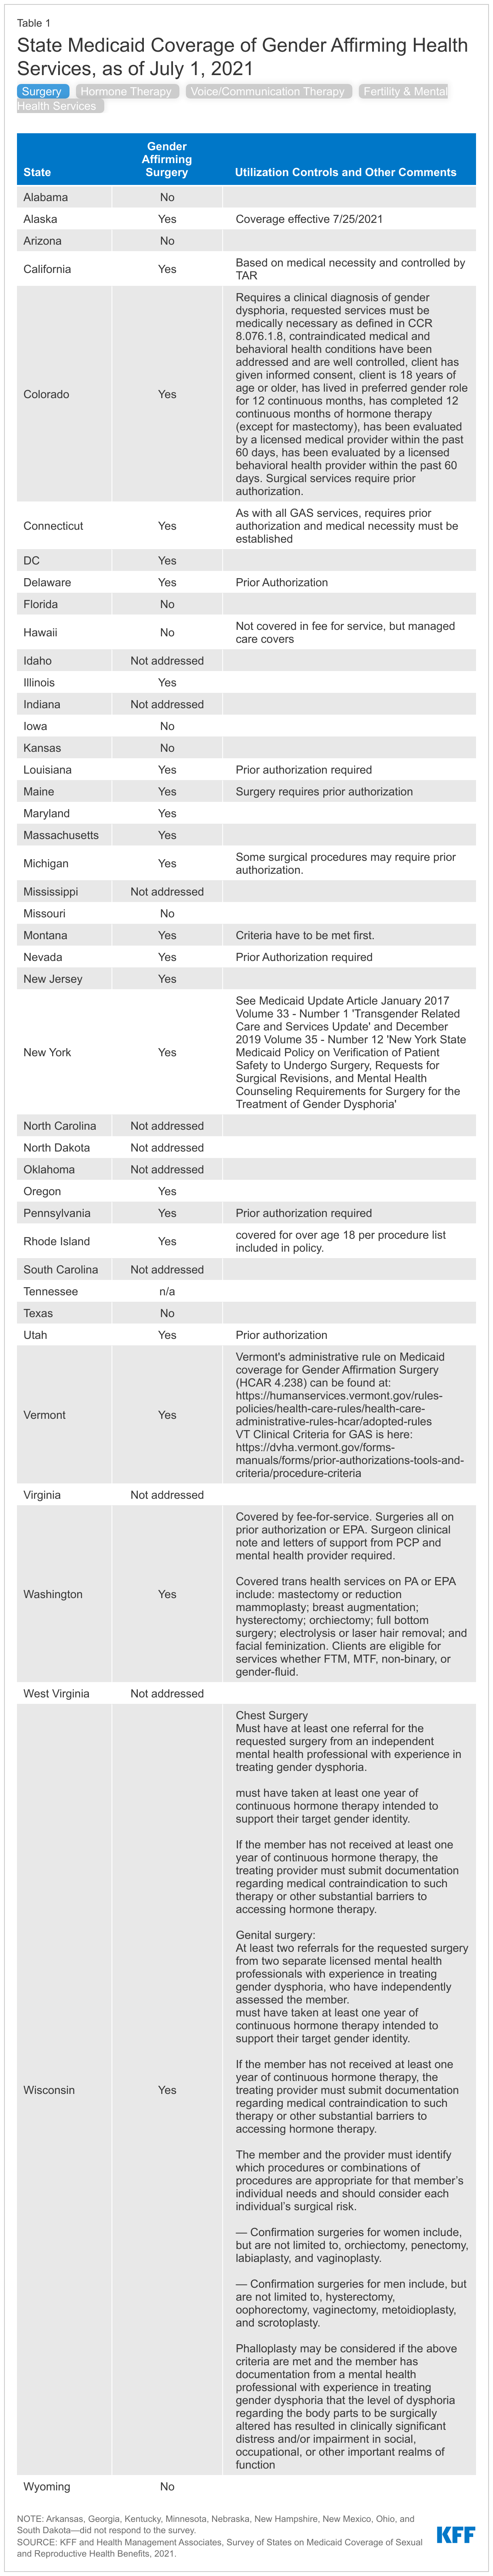
When asked about various things Congress could do to help improve health care for Black people in the US, Black voters prioritize many potential policies, with about six in ten saying each option polled should be a top priority. Nearly two-thirds (64%) of Black voters say increasing funding for services that would improve health care for Black mothers and babies is a top priority. About six in ten prioritize expanding government health insurance for lower-income people in states that have not expanded their Medicaid programs (62%) as well as increasing funding for treating health problems like heart disease and diabetes that disproportionately affect Black people (60%). A similar share (57%) also say it should be a top priority for Congress to increase funding to train medical professionals on anti-racism and how to provide culturally appropriate health care to Black people.

A Majority of Black Voters Prioritize Policies to Improve Black Health Care For Black People

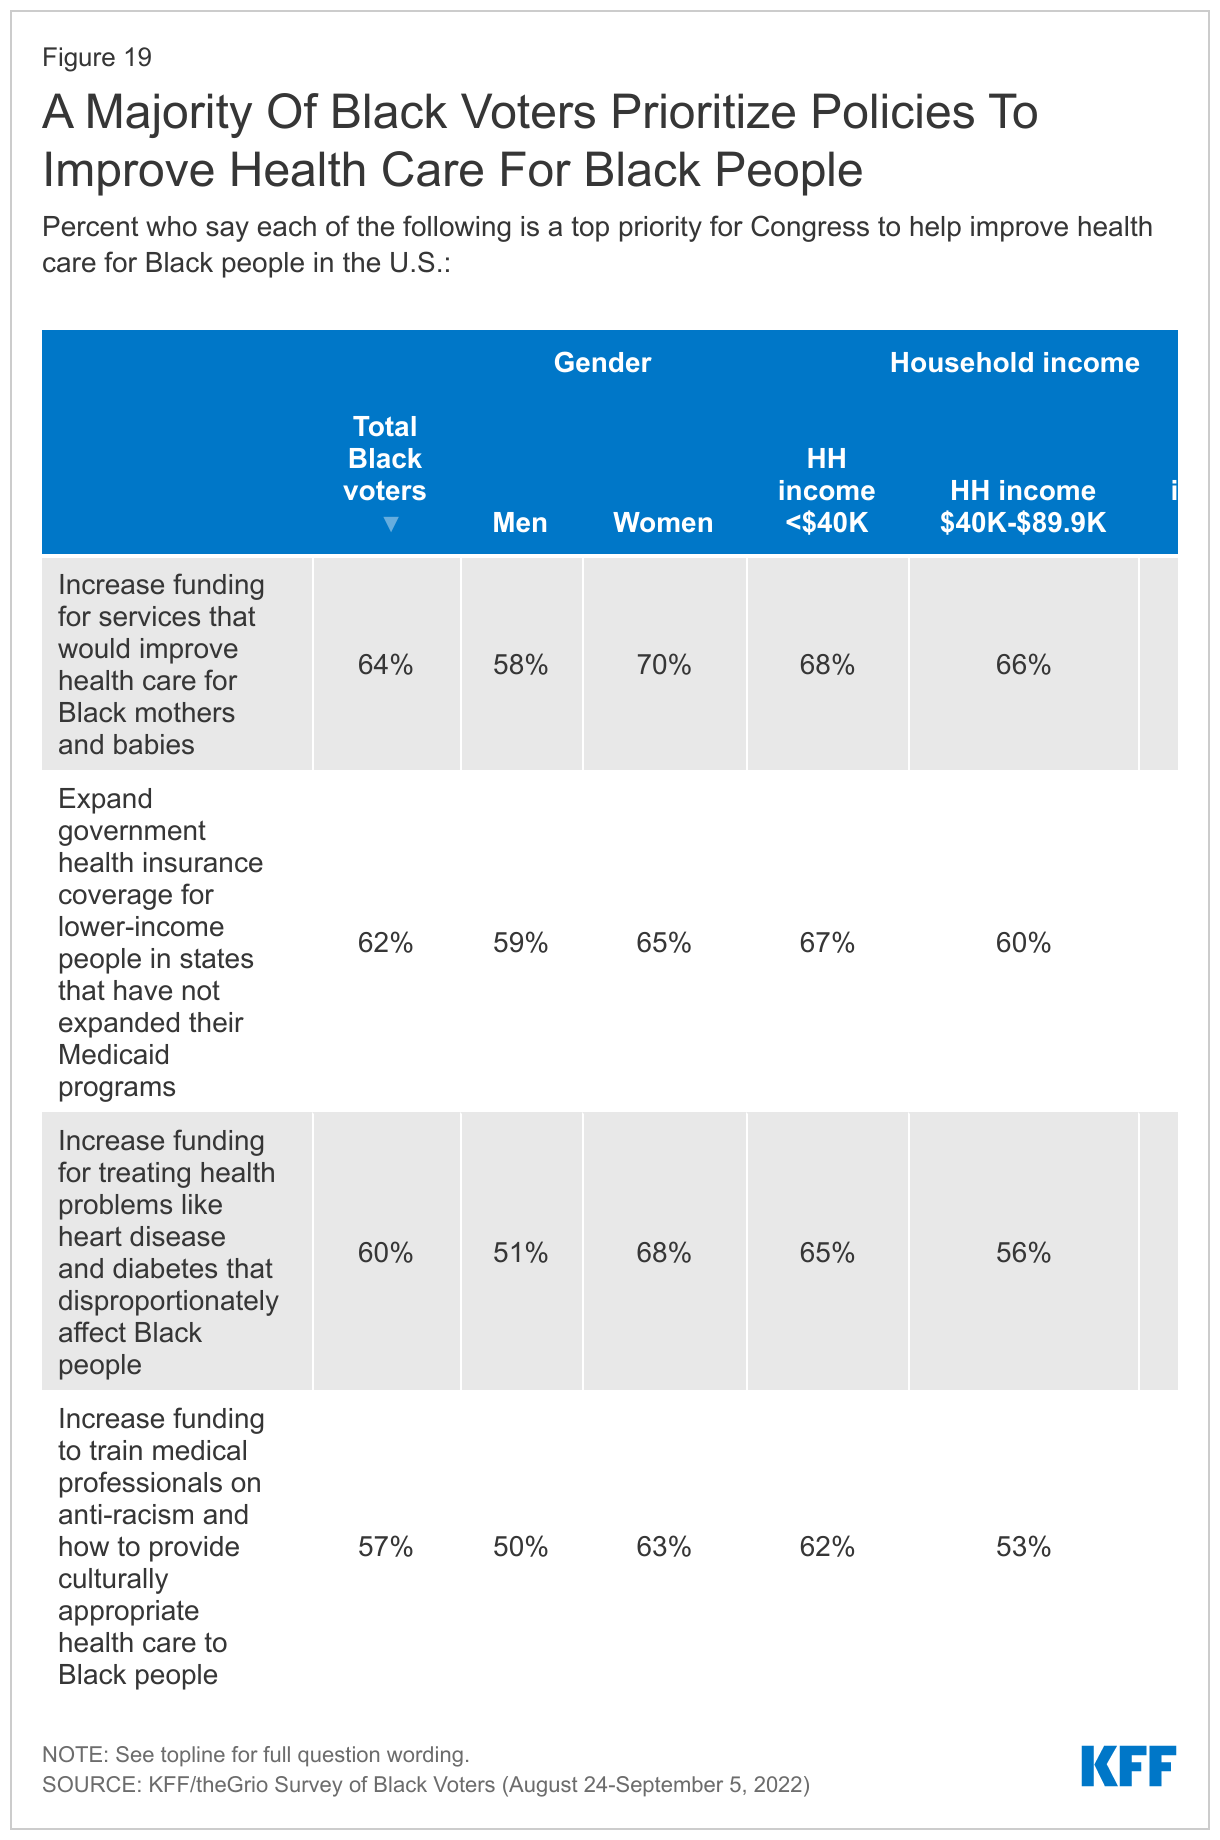
On many of these issues, Black women voters and those with lower incomes are particularly likely to see each of these as top priorities for Congress. Larger shares of Black women than Black men voters say increasing funding for services that would improve health care for Black mothers and babies (70% vs. 58%), increasing funding for health problems that disproportionately affect Black people (68% vs. 51%), and training medical professionals on anti-racism and culturally appropriate care (63% vs. 50%) should be top priorities for Congress.

Black voters with household incomes of less than $40,000 a year are more likely than those with incomes of $90,000 or more to say Congress should prioritize increasing funding for services to improve health care for Black mothers and babies (68% vs. 52%). There is a similar gap in the share of lower-income and higher-income Black voters who say it should be a top priority for Congress to expand government health insurance coverage for lower-income people in states that have not expanded their Medicaid programs (67% vs. 54%).

Views On Gender And Sexual Identity Issues

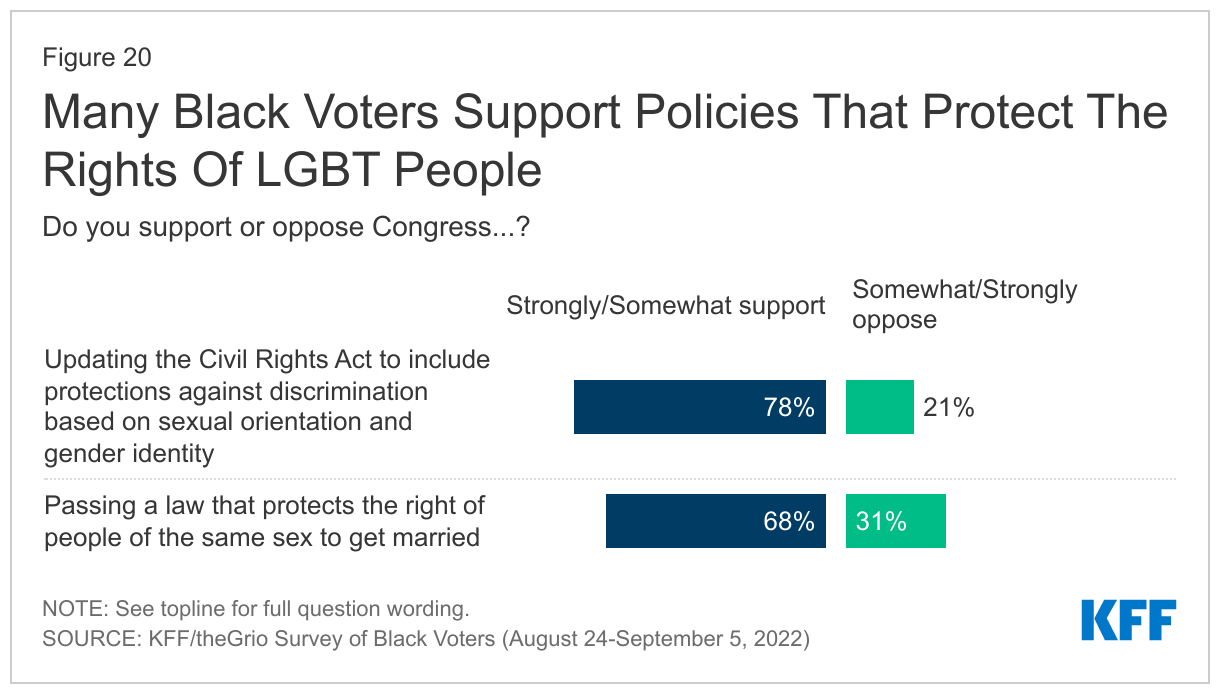
In general, Black voters are supportive of policies that protect the rights of LGBT individuals, with more support among younger voters, those who identify as liberal, and those who themselves identify as LGBT. A large majority (78%) of Black voters support Congress updating the Civil Rights Act to include protections against discrimination based on sexual orientation and gender identity, including large majorities across age groups, and 93% of Black voters who identify as LGBT. Nine in ten liberal Black voters support updating the Civil Rights Act in this way (89%), but a majority (58%) of those who identify as conservatives do as well.

Same sex marriage also garners solid support among Black voters, with more than two in three (68%) saying they support Congress passing a law to protect same sex marriage (including 44% who say they strongly support this measure). About nine in ten (93%) Black voters who identify as LGBT support protecting same sex marriage. Support differs by age among all Black voters, with nearly eight in ten (78%) Black voters ages 18-29 saying they support this compared to a narrower majority (55%) of those ages 65 and older. On this topic, about eight in ten (83%) liberal Black voters are in support, but conservative Black voters are split: 49% support it, while 51% oppose.

Many Black Voters Support Policies That Protect The Rights Of LGBT People

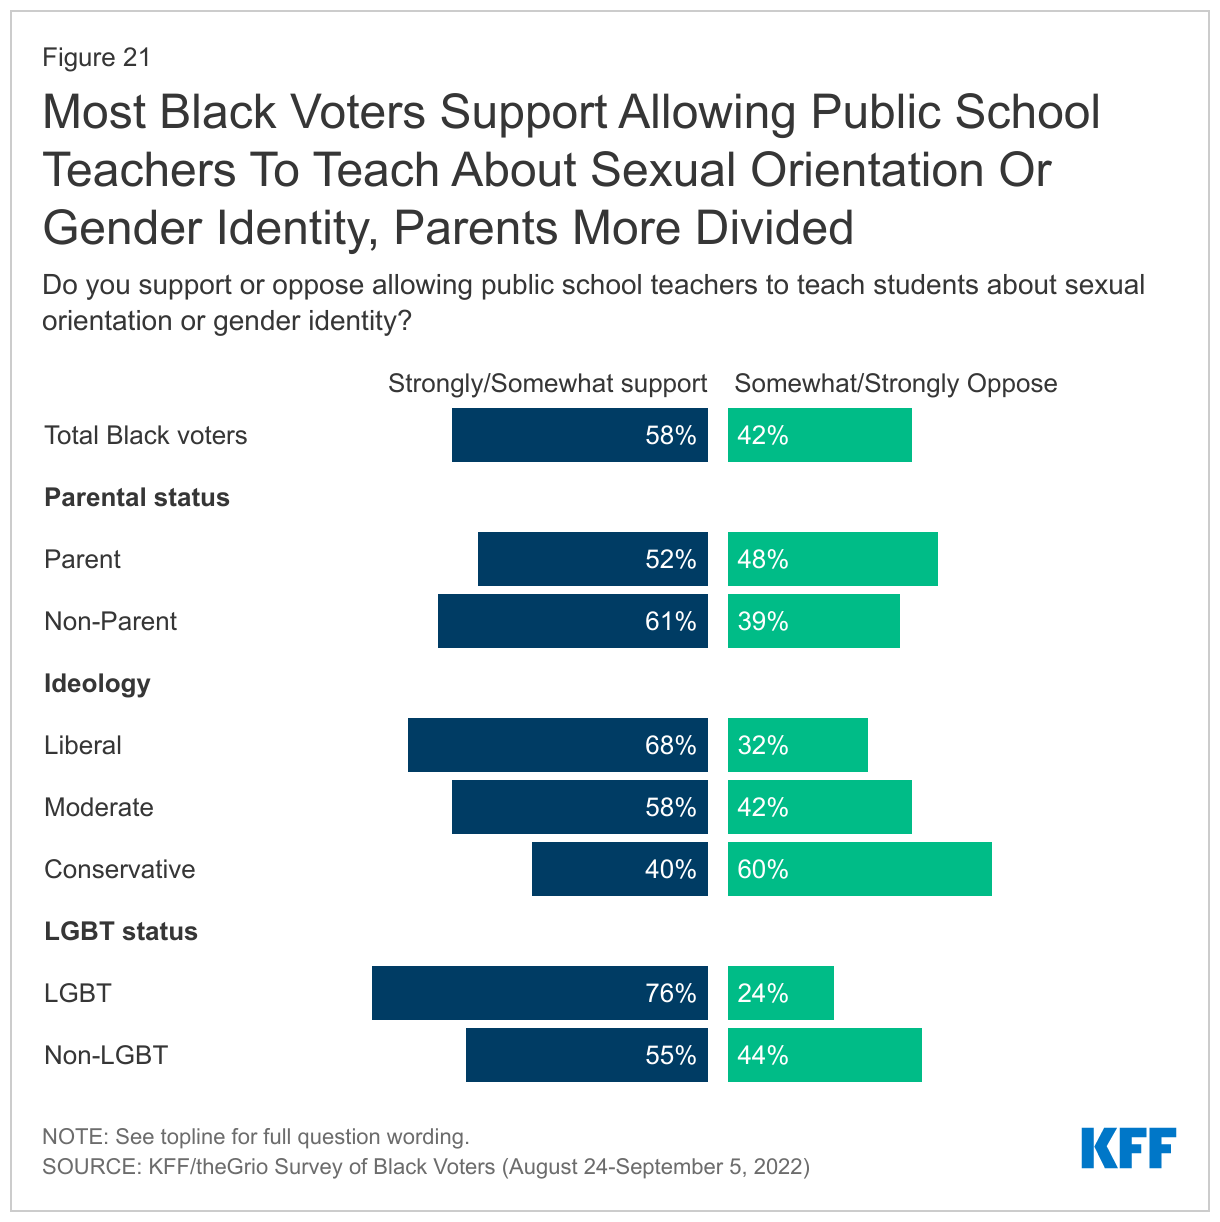
Most Black voters support allowing public schools to teach students about sexual orientation and gender identity, but those who are parents are more divided. Nearly six in ten (58%) Black voters support allowing public school teachers to teach students about sexual orientation and gender identity. However, while a clear majority (61%) of Black voters who are not parents support this, Black voters who are parents of children under 18 are more divided (52% support and 48% oppose).

Most Black Voters Support Allowing Public School Teachers To Teach About Sexual Orientation Or Gender Identity, Parents More Divided

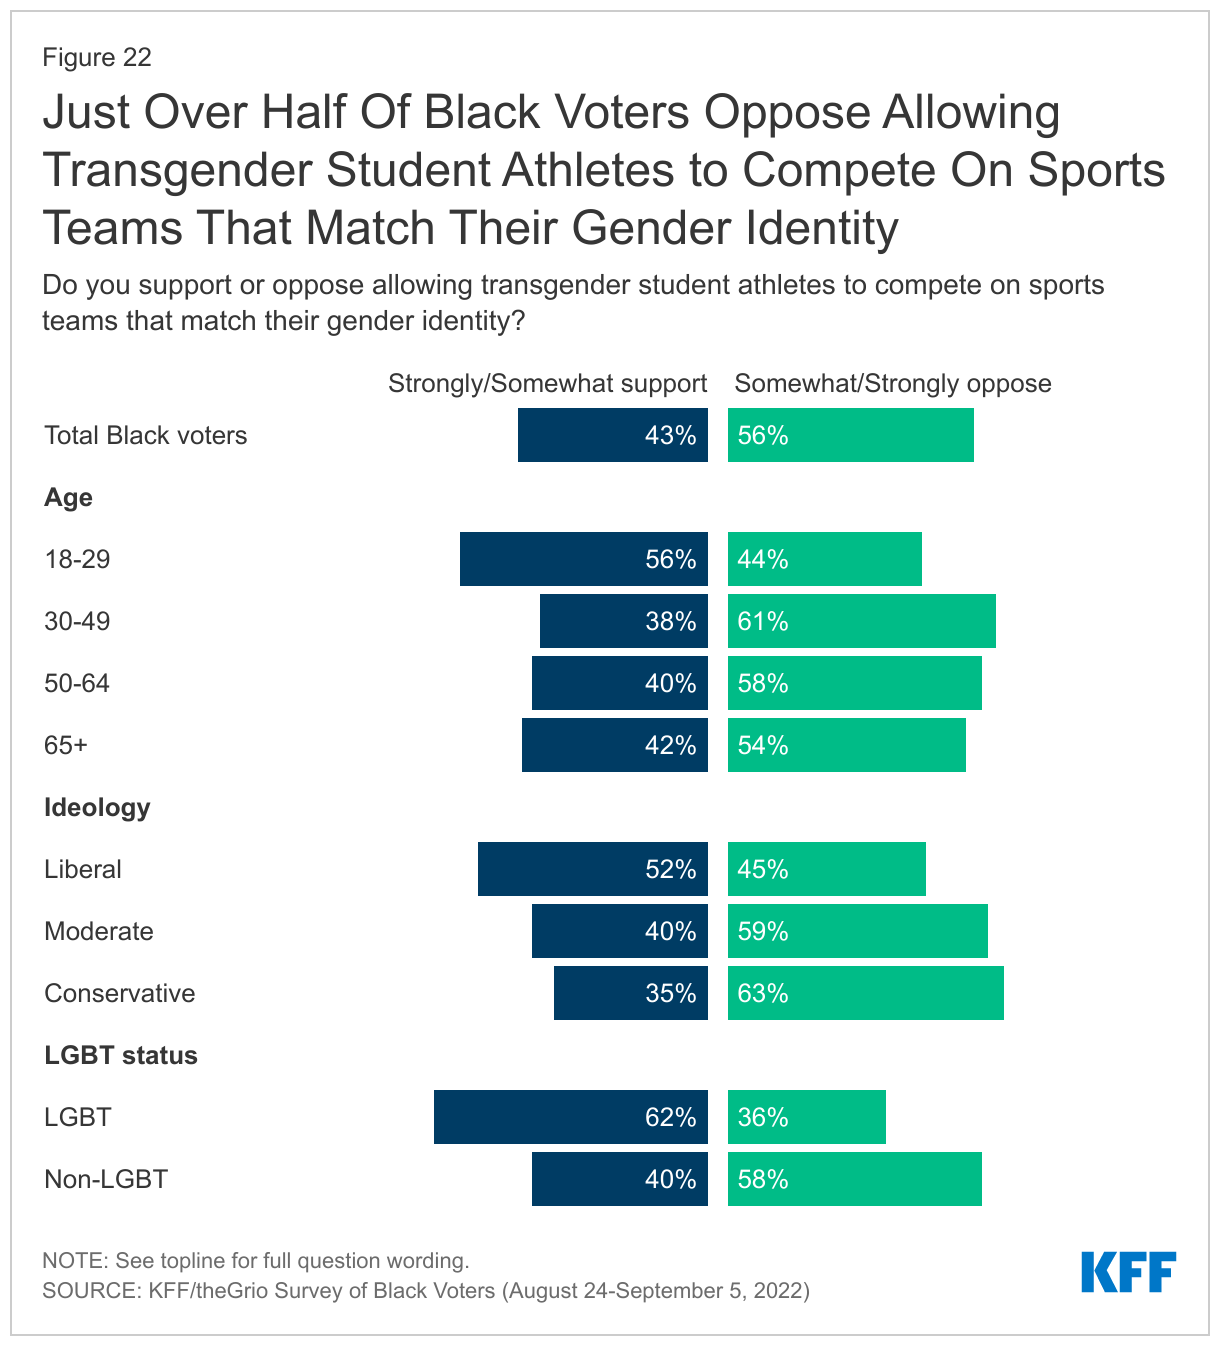
More Black voters oppose rather than support allowing transgender student athletes to compete on sports teams that match their gender identity, though majorities of younger Black voters and those who identify as LGBT are in support. Fewer than half of Black voters (43%) support allowing transgender student athletes to compete on sports teams that match their gender identity, while 56% oppose. However, a majority (56%) of young Black voters aged 18-29 are in support, as are six in ten Black voters who identify as LGBT (62%) and about half (52%) of liberal Black voters.

More Than Half Of Black Voters Oppose Allowing Transgender Student Athletes to Compete On Sports Teams That Match Their Gender Identity


Black Voters And The Democratic And Republican Parties

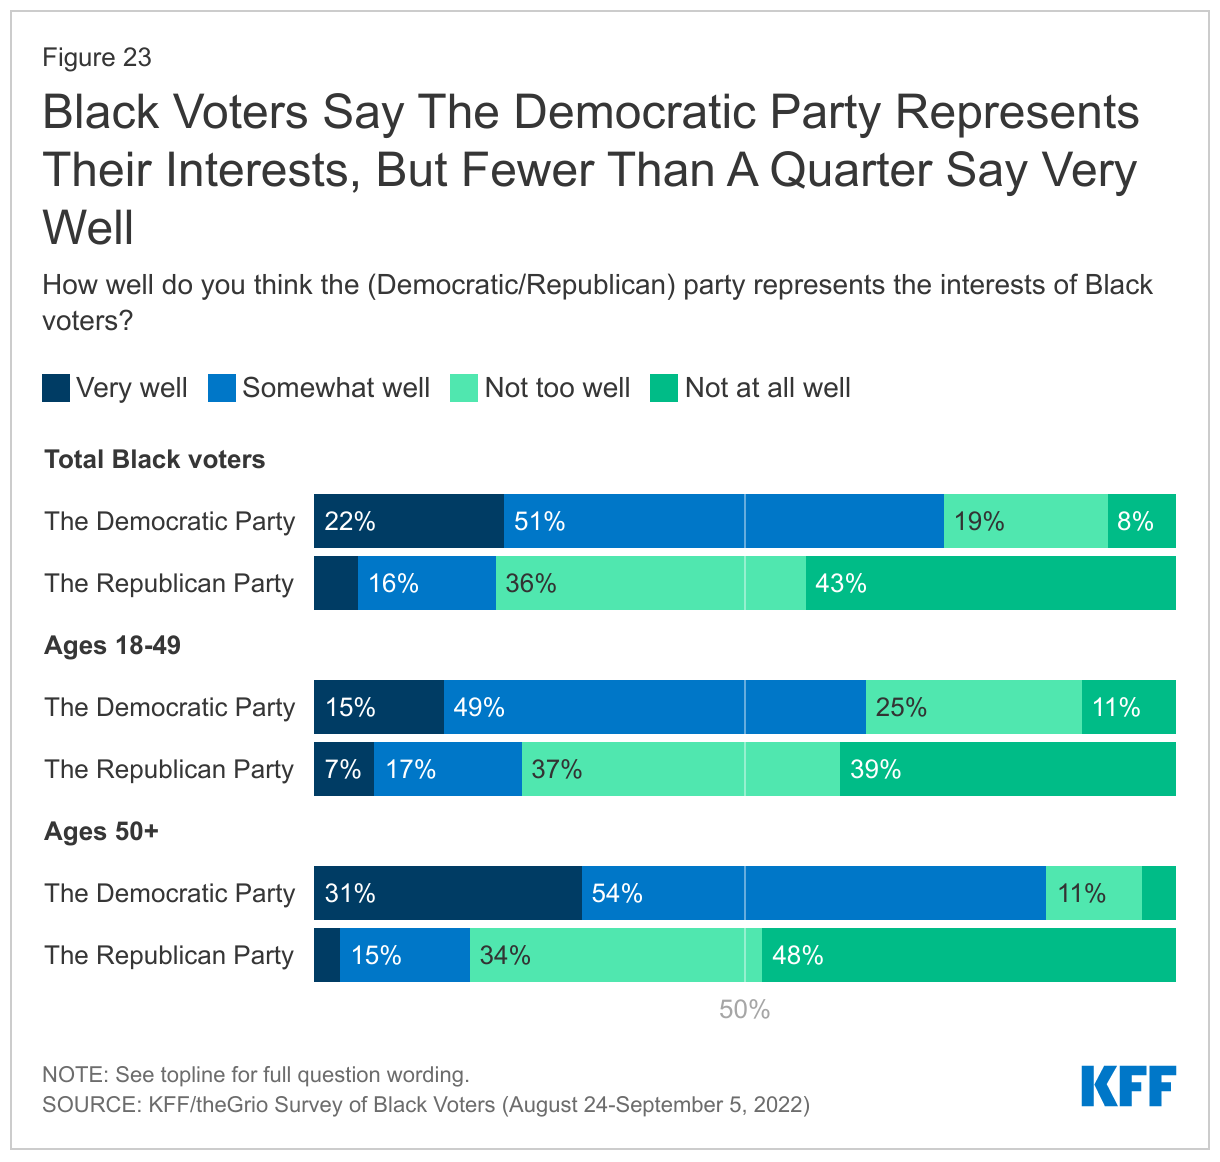
A much larger share of Black voters say the Democratic party does a good job of representing Black voters than say the same about the Republican party, but less than a quarter say the Democratic party represents the interests of Black voters very well. About three in four (73%) Black voters say the Democratic party represents the interests of Black voters “very” or “somewhat” well, which is more than three times the share who say the same about the Republican party (21%). However, this comparison masks a lackluster response about the Democrats: just 22% of Black voters say the Democratic Party represents Black voter interests “very” well. This is only slightly higher – 27% – if the sample is limited to Black voters who identify as Democrats or lean that way. And, in a sign that the Democratic party may have a tenuous hold on younger Black voters, there is large gap between Black voters under age 50 (64%) and those ages 50 and older (85%) who say the Democrats represent Black voters’ interests at least somewhat well.

Black Voters Say The Democratic Party Represents Their Interests, But Fewer Than A Quarter Say Very Well

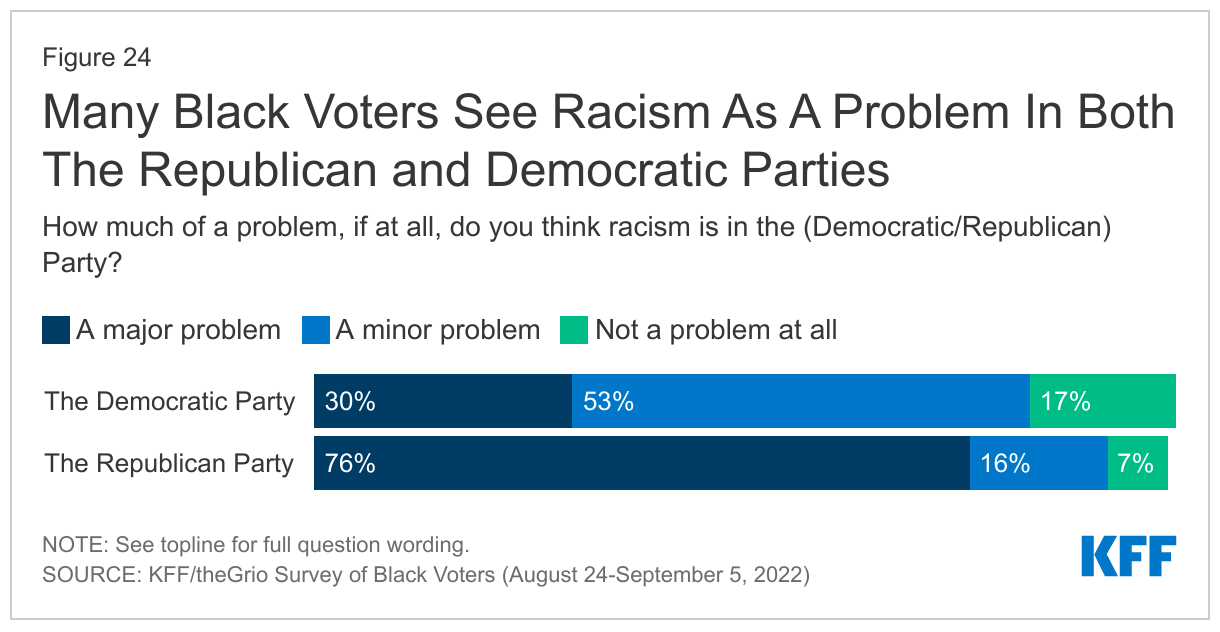
A large majority of Black voters see racism as a major problem in the Republican Party, and most believe racism is at least a minor problem in the Democratic Party as well. Black voters draw a distinction between the two major parties when it comes to racism, with about three in four saying racism is a major problem in the Republican party (76%), compared to three in ten who say the same of the Democratic party. However, about half (53%) see racism as a minor problem in the Democratic Party, and fewer than one in five (17%) say racism is not a problem at all in the Democratic party.

Many Black Voters See Racism As A Problem In Both The Republican and Democratic Parties

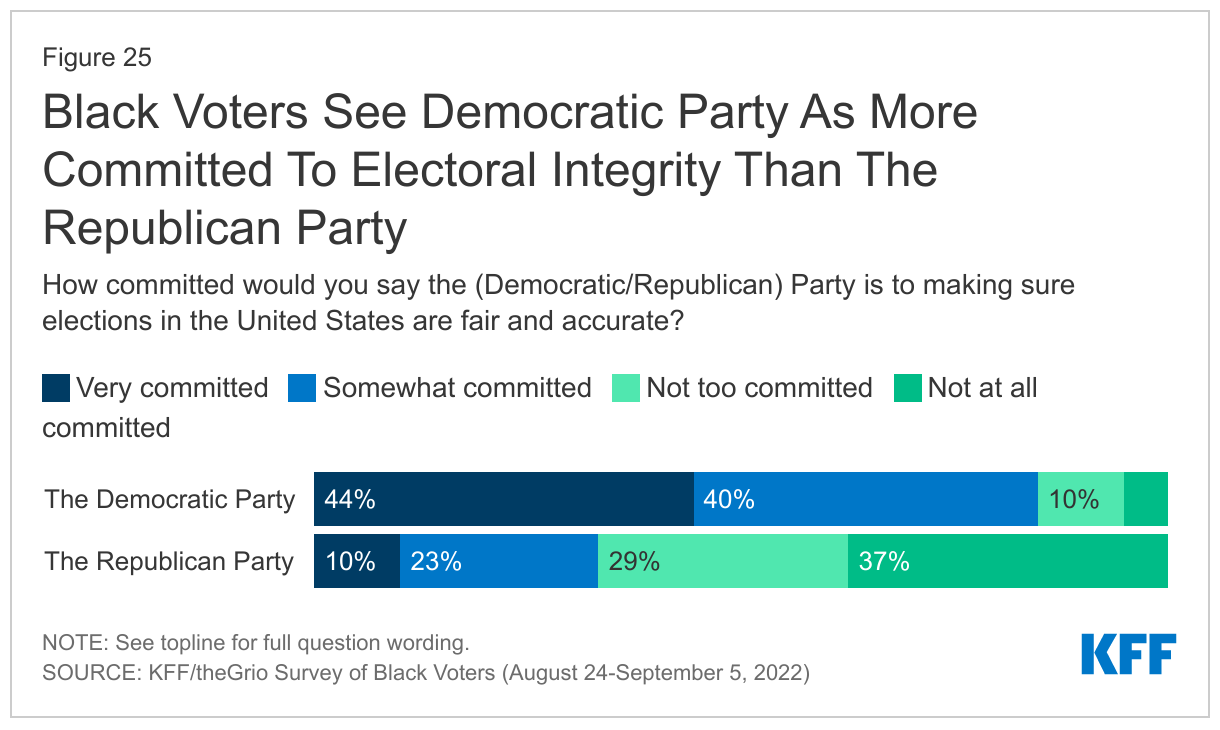
The Democratic party has a clear advantage among Black voters on the perception of electoral integrity. A large majority (85%) of Black voters say the Democrats are very or somewhat committed to making sure US elections are fair and accurate, compared to about one third (34%) who say the same about the Republican party.

Democratic Party Seen As More Committed to Electoral Integrity Than Republican Party By Black Voters

Most Black voters are aware that they are a key voting bloc for the Democrats. About eight in ten (83%) say that Black voters are important for the Democratic party to win elections, including half (50%) who say they are “absolutely essential” to the party’s electoral success, and a third (33%) who say they are “very important.”

Joe Biden and Kamala Harris in 2024 and Beyond

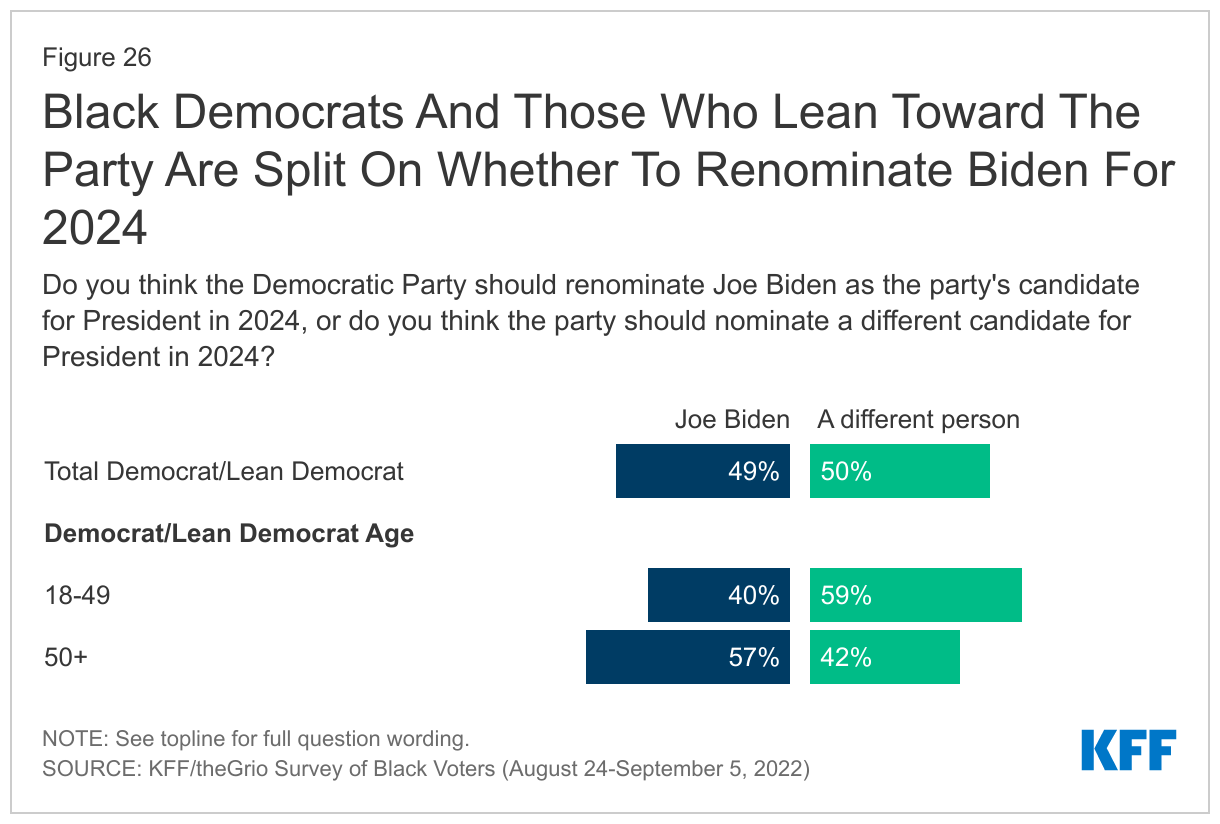
Black Democratic voters and those who lean toward the party are split on whether the Democratic Party should renominate Joe Biden for 2024. Among Black voters who identify as Democrats or lean that way, about half (49%) say the party should renominate Biden for President in 2024, while the other half (50%) say the party should nominate someone else. There is an age divide on Joe Biden’s future in office, with Black Democrats and Democratic leaners under 50 more likely to say they want someone else in 2024 than those older 50. About six in ten (59%) younger Black Democrats and leaners say they want someone else, while four in ten want Biden to be renominated. Among Black Democrats and leaners 50 and older, nearly six in ten (57%) say they want Biden to be renominated, and 42% say they want the Democratic Party to nominate someone else for President. Black voters who voted for Biden for president in 2020 are also divided on his future prospects (48% say renominate Biden and 51% say someone else).

Black Democrats And Those Who Lean Toward The Party Are Split On Whether To Renominate Biden For 2024

Black Democratic voters who disapprove of Biden’s job performance are much more likely to say they want a different candidate in 2024. Among Black Democrats and Democratic leaning voters who disapprove of Biden’s job performance, nine in ten (91%) want a different Democratic nominee in 2024. It is notable that even among Black Democrats and leaners who approve of his job performance, about four in ten (41%) want the party to nominate someone else in 2024.

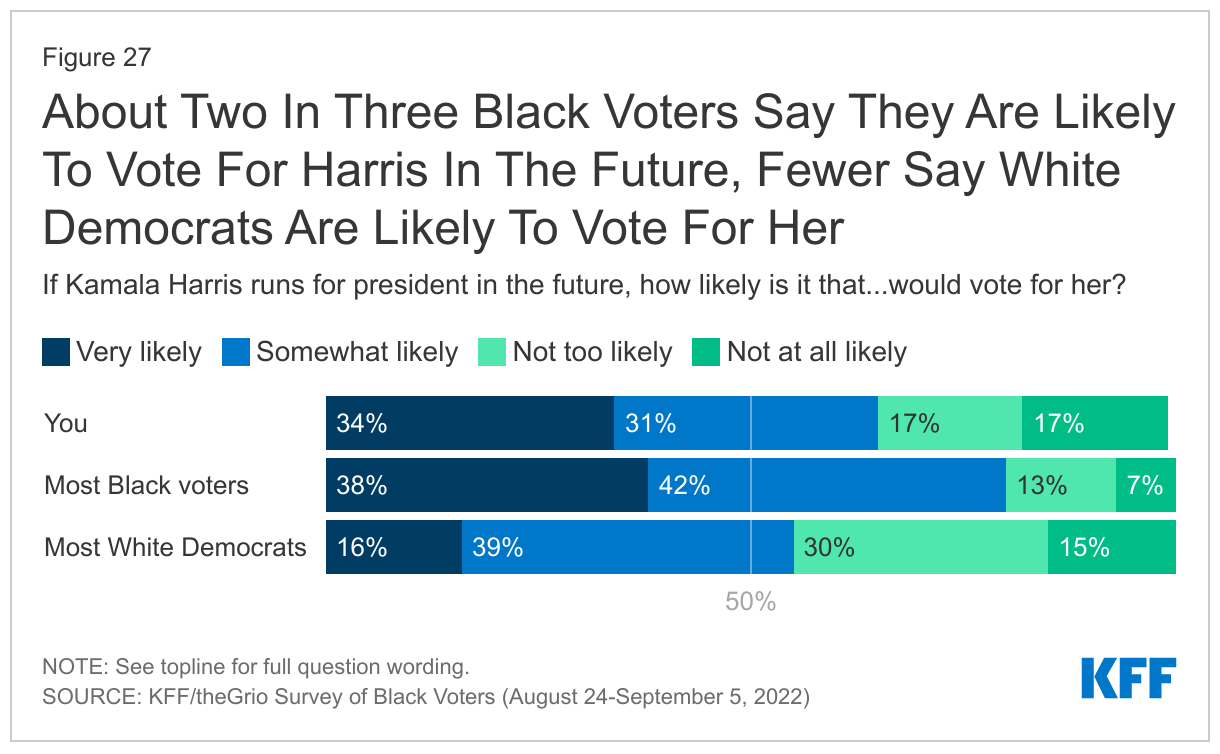
Most Black voters support a future Presidential bid by Kamala Harris, but her support is weakest among young voters. About two-thirds of Black voters say they would be very or somewhat likely to vote for Kamala Harris if she runs for president in the future, with about a third saying they would be “very likely.” Though most say they would be at least somewhat likely vote for her in the future, support for a future Harris presidential run is lower among Black voters under age 50 (57%) than among voters 50 and older (76%). Harris also gets higher support from women (69% vs. 60% of men), particularly women ages 50 and over (78%).

Majorities of Black voters say most Black voters would vote for Harris in the future, but fewer say they think White Democrats would. Eight in ten Black voters say they think most Black voters are at least somewhat likely to vote for Harris in the future. A much smaller share, though still a majority (55%) of Black voters say that White Democrats would be somewhat or very likely to vote for Harris, with 16% who say White Democrats would be “very likely”.

About Two-Thirds Of Black Voters Say They Are Likely To Vote For Harris In The Future, Fewer Believe Most White Democrats Are Likely To Do The Same

Methodology

The KFF/theGrio Survey of Black Voters was conducted August 24-September 5, 2022, online and by telephone among a nationally representative sample of 1,000 U.S. adults in English who identify as Black or African American and are registered to vote. The sample includes 800 Black adults registered to vote reached online through the SSRS Opinion Panel. An additional 100 respondents were reached online through the Ipsos KnowledgePanel. To reach Black voters who do not use the Internet, another 100 interviews were conducted by calling back respondents who previously participated in an SSRS Omnibus poll and identified as Black and said they did not use the Internet. Sampling, data collection, weighting, and tabulation were managed by SSRS in close collaboration with KFF researchers. Teams from KFF and theGrio worked together to develop the questionnaire and analyze the data, and KFF financed the survey. Each organization is solely responsible for its content.

The SSRS Opinion Panel is a nationally representative probability-based panel where panel members are recruited randomly in one of two ways: (a) through invitations mailed to respondents randomly sampled from an Address-Based Sample (ABS) provided by Marketing Systems Groups (MSG) through the U.S. Postal Service’s Computerized Delivery Sequence (CDS); (b) from a dual-frame random digit dial (RDD) sample provided by MSG. The SSRS Omnibus survey is a nationally representative bilingual telephone survey designed to meet standards of quality associated with custom research studies. Sample for the SSRS Omnibus was obtained through Marketing System Groups (MSG). The Ipsos KnowledgePanel is a nationally representative probability-based panel where members are recruited randomly using ABS based on a stratified sample from the CDS. For the online panel components, invitations were first sent by email to panel members who previously identified as Black or African American, followed by up to three reminder emails. Respondents in the phone samples received a $10 incentive.

Both phone and web samples were asked to confirm their race and voter registration status in order to be eligible. Respondents were considered eligible if they identified as Black or African American even if they also identified as Hispanic or another race group.

The combined cell phone and panel samples were weighted to match the sample’s demographics to the national U.S. population of Black or African American adults (including Hispanic Black and multi-racial Black adults) who are registered to vote using data from the Census Bureau’s 2020 Current Population Survey (CPS) Voting and Registration supplement. Weighting parameters included sex, age, education, race/ethnicity, region, and education. The weights take into account differences in the probability of selection for each sample type (callback sample and panels). This includes adjustment for the sample design, within household probability of selection, and the design of the panel-recruitment procedure.

The online questionnaire included two questions designed to establish that respondents were paying attention. Surveys with a length less than one quarter of the mean length by mode were flagged and reviewed. Cases that failed two quality control questions (i.e. trap questions) were also flagged and reviewed. One case was removed due to a short survey length and failure of the two quality control questions.

The margin of sampling error including the design effect for the full sample is plus or minus 4 percentage points. Numbers of respondents and margins of sampling error for key subgroups are shown in the table below. Sample sizes and margins of sampling error for other subgroups may be higher and are available by request. Sampling error is only one of many potential sources of error and there may be other unmeasured error in this or any other public opinion poll. KFF public opinion and survey research is a charter member of the Transparency Initiative of the American Association for Public Opinion Research.

GroupN (unweighted)M.O.S.E.
Total Black voters1,000± 4 percentage points
Age
18-49567± 5 percentage points
50+433± 6 percentage points
Party identification
Democrats/Democratic-leaning independents758± 4 percentage points
Republicans/Republican-leaning independents103± 11 percentage points


Endnotes

  1. The survey was completed before gas prices started to rise again in September after falling in the prior months. ↩︎
  2. The survey was launched the day after President Biden’s August 24, 2022 student debt relief announcement. ↩︎

2022 Survey of ACA Marketplace Assister Programs and Brokers

Authors: Karen Pollitz, Jennifer Tolbert, Kaye Pestaina, and Salem Mengistu
Published: Oct 17, 2022

Executive Summary

The Affordable Care Act (ACA) expanded affordable health coverage options in the U.S., helping to reduce the number of uninsured individuals. Even so, KFF has found that most people who remain uninsured are nonetheless eligible for coverage and financial assistance through the Marketplace or Medicaid. Many consumers – including most uninsured – have limited awareness of affordable coverage options available to them under the ACA. And the steps people must take to get and keep coverage can sometimes be complex. Accordingly, the ACA required federal and state Marketplaces to establish and invest in consumer assistance to conduct outreach and public education and to help connect people to affordable coverage.

KFF conducted a national, online survey of Marketplace Assister Programs and brokers in 2022. To build the sample for the survey, contact information for Assister Programs and brokers was collected from State Marketplaces (SBM), the Center on Medicare and Medicaid Services (CMS) which administers the Federal Marketplace (FFM), and the Health Resources and Services Administration (HRSA) which oversees enrollment assistance by Federally Qualified Health Clinics (FQHCs). A total of 3,496 Assister Programs were invited by email to participate in the survey, and 258 Programs responded and were included (for a response rate of 7.4%). We also contacted 68,705 brokers certified to sell Marketplace coverage and 1,424 responded and were included (for a response rate of 2.1%). Additional description of survey methods is included in the Topline accompanying this report.

Our survey asked Assister Program directors and brokers about the help they provided consumers before, during and after the 2022 Open Enrollment Period, reasons people sought help, factors affecting the enrollment process, and other issues. Key findings include:

Assister Programs and brokers report that the need for consumer assistance is high among people they serve. Overwhelmingly, Assister Programs (76%) and brokers (69%) said most or nearly all of the consumers they helped during this ninth ACA Open Enrollment lacked confidence to apply on their own; about two-thirds of Assister Programs (64%) and brokers (66%) said most to nearly all the people they helped had limited understanding of ACA requirements and benefits. Most Assister Programs and brokers (54% each) also said the majority of consumers they helped had difficulty understanding basic health insurance terms and concepts. Consumers also needed help answering questions about their household income and composition, and help comparing a large number of plan choices. Some consumers present with complex cases or need language assistance – challenges that Assister Programs say require more resources and technical help than is available from the Marketplace.

Most Assister Programs and brokers said the average time needed to help people newly applying through the Marketplace continued to be between 1 and 2 hours; for consumers returning to renew or change coverage, it was up to 1 hour. This is similar to findings in previous KFF surveys in 2016, 2015, and 2014.

Consumer awareness about Marketplace subsidies and rules is still limited. Nearly all Assister Programs (89%) and brokers (80%) this year also helped consumers last year to sign up for coverage or update subsidies during the 2021 COVID-19 enrollment period. Newly enhanced Marketplace subsidies became effective during the 2021 COVID enrollment period, though our respondents observed that consumer awareness about the enhanced subsidies was low; 71% of Assister Programs and 75% of brokers said most to nearly all consumers they helped during the 2021 COVID enrollment period were unaware of the new, improved subsidies when they first came in for help.

Assister Programs report that some consumers eligible for Medicaid experience delays in getting a final eligibility determination. In 17 states the Marketplace determines Medicaid eligibility, while in the rest, the Marketplace transfers files to Medicaid for a final eligibility determination, which can cause delays. As a result, Assister Programs report the time it takes for consumers to receive an eligibility determination varies widely. Forty-three percent of Programs said eligibility determinations were determined in real time or Medicaid enrollment was automatic, while an equal share of Programs said the process takes longer – 11% said Medicaid determinations were provided in up to 7 days, 21% said determinations took from 8 days to one month, and 11% said it took longer than a month.

Help from Brokers and Assister Programs is similar in many respects but not interchangeable. We also surveyed brokers certified by the Marketplace to sell qualified health plans. The type of help brokers reported providing and people they reported helping resembled that of Assister Programs, though there were important differences, likely reflecting differences in the clients served. In particular, brokers – who rely on commissions – were far less likely to help consumers sign up for Medicaid or CHIP (39% of brokers vs 88% of Assister Programs) and far less likely to conduct outreach activities (27% vs 62% of Assister Programs). Compared to Assisters, Brokers who responded to the survey reported that a smaller share of the consumers they helped were Hispanic, needed language assistance or help with immigration-related problems, or were uninsured.

Brokers rely on private web sites over Marketplace sites. Most brokers (72%) surveyed report using private websites instead of the Marketplace to enroll consumers in QHPs at least some of the time. In most states brokers can use so-called direct enrollment (DE) sites, for example hosted by insurance companies, where consumers can sign up for Marketplace QHPs, though consumers generally are re-directed to the Marketplace site if they also need subsidies. The federal government also promotes use of Enhanced Direct Enrollment (EDE) sites – only available in federal marketplace states – where consumers can apply for both QHPs and marketplace subsidies without ever visiting HealthCare.gov. A majority of brokers in federal marketplace states (55%) said they never initiate QHP applications on HealthCare.gov. When asked why they prefer these alternate enrollment channels, many brokers cited technological features which HealthCare.gov does not offer, such as dashboards that enable them to more easily track client accounts and communicate with clients. Sixty percent of brokers surveyed who use private sites said they would use the Marketplace website more often if offered similar functionality.

Brokers also continue to sell non-ACA-compliant policies. Most brokers (75%) said they also sold non-ACA-compliant policies – such as short-term plans — during Open Enrollment as an alternative or supplement to QHPs, though the volume of these sales was lower compared to QHP sales. For example, most brokers (54%) said they sold more than 50 QHPs during the 2022 Open Enrollment period, while most who also sold non-ACA-compliant policies (67%) said they sold 10 or fewer of these policies.

Most Assister Programs expect to play a role helping consumers through the public health emergency (PHE) unwinding. It is anticipated that the COVID-19 Public Health Emergency may end sometime in 2023, at which point, state Medicaid agencies will resume eligibility redeterminations and will disenroll people who are no longer eligible or who are unable to complete the renewal process even if they remain eligible. As a result, between 5 and 14 million people are estimated to lose Medicaid coverage. Many who lose Medicaid may be eligible to buy subsidized QHPs, if they can navigate that transition. About half of Assister Programs (53%) said they have good working relationships with their state Medicaid agency and nearly 6 in 10 said they have contacted Medicaid to find out how they can help educate consumers about the need to renew their coverage. Half of all Assister Programs reported they are planning outreach activities to educate the public about the PHE unwinding and most (58%) said they will try to re-contact consumers whom they helped apply for Medicaid coverage in the past two years to collect updated contact information.

Report

Section 1: Help From Assister Programs During Open Enrollment

Types of Assister Programs

In all, based on administrative data, 3,490 Marketplace Assister Programs provided outreach and enrollment help to consumers during the ninth Affordable Care Act (ACA) Open Enrollment period, referred to in this report as the 2022 Open Enrollment. This is a smaller number of Programs (5,094) than operated in 2016. The Appendix to this report provides more detail on different types of Assister Programs. We surveyed Programs that fall into three main types:

  • Navigator Programs, by law, must be established and funded in every federal and state Marketplace to provide free, objective outreach and enrollment assistance. Staff must have expertise in eligibility and enrollment rules, the range of qualified health plan (QHP) options, financial help – both QHP subsidies and Medicaid/CHIP – and the needs of underserved and vulnerable populations, including individuals with limited English proficiency.
  • Certified Application Counselor (CAC) Programs must be certified by every Marketplace but not funded by the Marketplace. Most CAC Programs are sponsored by community non-profit organizations that voluntarily support outreach and enrollment assistance.
  • Federally Qualified Health Center (FQHC) Programs are operated by the network of clinics that receive federal funding to provide health care to low-income and underserved populations. The federal government provides additional funding to FQHCs to also provide eligibility and enrollment assistance in their communities. Most FQHCs (1,249 in 2022) are certified by Marketplaces as CAC Programs, but 85 centers are also certified as Marketplace Navigator Programs. (Figure 1)
Types of Assister Programs, 2022

Assister Programs tend to serve local communities. About three-fourths (77%) of Assister Programs served consumers in a limited geographic within a state. However, about four-in-ten (41%) Navigator Programs had state-wide service areas.

Nearly all Assister Programs (93%) have been providing enrollment assistance for a number of years. Eighty-two percent of Assister Programs this year provided help to consumers during 5 or more Marketplace Enrollment Periods. Only 7% of Assister Programs said they provided enrollment assistance to consumers for the first time during the 2022 Open Enrollment period.

Consumer Assistance Needs

Navigator Programs tended to operate at a larger scale, helping more consumers compared to other types of Programs. During the 2022 Open Enrollment, most Navigator Programs (54%) helped at least 500 consumers and 34% of Navigator Programs helped more than 1,000 consumers. By contrast, among the other types of Assister Programs (CAC and FQHC), 40% said they helped no more than 100 consumers and 14% said they helped more than 1,000 people. (Figure 2)

Number of Consumers Helped By Assister Programs During 2022 Open Enrollment

Assister Programs also reported helping consumers eligible for Marketplace special enrollment periods (SEP). Outside of Open Enrollment, consumers can sign up for Marketplace coverage if they have a qualifying event, such as loss of other coverage, that makes them eligible for a SEP. Again, Navigator Programs tended to help more consumers with SEPs than did other Assister Programs. (Figure 3)

Number of Consumers Helped with SEP Enrollments in 2022

The reasons consumers seek help from Assister Programs has not changed much since 2016. About three-quarters of Assister Programs (76%) said most-to-nearly-all consumers sought help this year because they lacked confidence to apply for coverage and financial help on their own, and 64% said most or nearly all clients had limited understanding of the ACA. These findings are similar to what Programs reported in 2016. This year, fewer Assister Programs said most or all clients lacked Internet at home (16% vs 31% in 2016); but more Programs said most or nearly all clients needed language assistance (24% vs 17%) (Figure 4)

Reasons Consumers Sought Help, 2016 and 2022

The need for help, as reported by Assister Programs, continues even though most consumers now come to the Marketplace to renew coverage. This year, 48% of Assister Programs reported that most or nearly all consumers they helped were returning to the Marketplace to renew or change coverage.

Insurance literacy limitations remain a challenge. Most Assister Programs (69%) said half or more of their clients needed help understanding basic insurance terms such as “deductible” and “in-network service,” (Figure 5)

Consumers Need Help Understanding Basic Insurance Concepts

A substantial share of consumers helped by Assister Programs were eligible for Medicaid. Nationwide, 43% of Assister Programs reported that most or nearly all consumers they helped were determined eligible for Medicaid or CHIP. More Programs in State-based marketplaces (SBM) said this was the case compared to those in federal-marketplace (FFM) states (58% vs 22%). All 21 SBM states have implemented the ACA Medicaid eligibility expansion while 12 of the FFM states have not. (Table 1)

Eligibility Determinations of Consumers Helped by Assister Programs

Assister Programs report serving consumers of diverse racial/ethnic backgrounds. A majority (56%) of Assister Programs estimate that half or more consumers they helped were non-white; with 32% of Programs reporting that at least three-quarters of their clients were non-white. One in five Programs (22%) reported half or more of the clients they served were Hispanic. Data about race and ethnicity, is key to understanding how the ACA is affecting access to coverage for people of color. All Marketplaces ask consumers to volunteer information about their race/ethnicity, but many do not answer. Most Assister Programs (63%) said they tell their clients why reporting this information can be useful.

Section 2: Help Applying for Financial Assistance

A primary role of Assister Programs is to educate the public about the availability of financial assistance – either through Marketplace subsidies or Medicaid – and to help people apply.

Marketplace subsidy enhancements

Through the American Rescue Plan Act (ARPA) Congress temporarily strengthened QHP subsidies, effective in 2021, and recently extended this subsidy enhancement through the end of 2025. QHP subsidy improvements were substantial, particularly for the lowest income individuals, making it possible for people with income up to 150% FPL ($19,320 for a single person in 2022, $32,940 for a family of 3) to apply for zero-premium plans with comprehensive cost sharing reductions (CSR). Previously, the poorest individuals were required to contribute at least 2.07% of income toward the premium for CSR plans. People with incomes above 400% of the poverty level ($51,520 for a single person, $87,840 for a family of 3 in 2022) also became eligible for premium assistance for the first time.

Nearly all Assister Programs (89%) provided help to consumers during the extended COVID Enrollment period in 2021. As the new ARPA subsidies taking effect in 2021, the federal government required all Marketplaces to reopen for a special COVID-19 enrollment period that lasted seven months in HealthCare.gov states, and even longer in some state-based marketplaces. This special enrollment period gave Marketplace enrollees a chance to claim the newly enhanced subsidies and gave uninsured individuals a second chance to sign up for affordable plans. More than 2.5 million consumers signed up for new coverage during the 2021 COVID-19 enrollment period, and more than 2.6 million already-enrolled consumers came back to claim the enhanced subsidies.

Overwhelmingly, Assister Programs said most consumers they helped during the COVID Enrollment period were unaware of the ARPA subsidy enhancements. 71% of Programs reported that most to nearly all clients first learned about the extra financial help from Assister Programs. (Figure 6)

Awareness of Enhanced Subsidies Among Consumers Helped During the 2021 COVID-19 Enrollment Period

Despite enhanced subsidies, assisters report that consumers still face tradeoffs between lower premiums and higher cost sharing. While new ARPA subsidies give consumers with the lowest income (up to 150% FPL) access to zero-premium silver plans with very low deductibles, those earning between 150&-250% FPL must pay at least a portion of the premium for CSR silver plans. For these consumers, cheaper (even zero-premium) bronze plans are also often available, but with very high deductibles, usually in excess of $7,000 per year. We asked Assister Programs to estimate the share of their clients overall who were eligible for CSR silver plans and who nonetheless elected cheaper bronze plans. Just 18% of Assister Programs estimated that none of their clients made this choice, while 27% of Programs estimated that 10% or more of their clients in this situation chose a cheaper bronze plan; 26% were not sure.

Marketplace coordination with Medicaid

In all FFM states and in some SBM states, Marketplace and Medicaid eligibility systems are not integrated, requiring consumer files to be transferred between the systems. The ACA creates a “no wrong door” approach to applying for coverage and requires a single streamlined application for financial assistance that can be used to determine eligibility for QHP subsidies and Medicaid or the Children’s Health Insurance Program (CHIP). That means that people must be able to apply for Medicaid or CHIP through the Marketplace. While SBM states can choose to integrate Medicaid and CHIP into their Marketplace eligibility system to facilitate enrollment into each program and transitions of coverage among Medicaid, CHIP, and the Marketplaces, not all states have done so. In ten SBM states, the Marketplace eligibility system also determines eligibility for the expansion Medicaid population, but in eight SBM states, files must be transferred to the Medicaid agency for an eligibility determination. Of the 33 states that use HealthCare.gov, seven states allow HealthCare.gov to determine Medicaid eligibility, though files are then transferred to state Medicaid agencies to complete enrollment. In the remaining states, HealthCare.gov makes an initial assessment of Medicaid eligibility, then transfers the consumer’s file to the state Medicaid agency for a final eligibility determination and to complete enrollment.

Assister Programs report that some consumers face delays in getting a final Medicaid eligibility determination. Programs reported that over four in ten (43%) clients who were determined eligible for Medicaid were either automatically enrolled into Medicaid or the eligibility determination was made in real time. However, an equal share of Programs reported that the final Medicaid determination took longer, including 11% that said determinations were provided in up to 7 days, 21% that said determinations took from 8 days to one month, and 11% that said it took longer than a month (Figure 7). Federal rules require states to complete Medicaid eligibility determinations in 45 days for MAGI populations. A report on Medicaid application processing times for January 2022 indicated that 48% of applications took from 1 day to more than 45 days. Some Assister Programs said they refer clients who are assessed as eligible for Medicaid or CHIP to other Assister Program (5%) or to the Medicaid/CHIP agency (4%) to complete the application and enrollment process.

Length of Time to Receive a Final Medicaid Eligibility Determination

Despite delays in Medicaid eligibility determinations, in most cases, Assister Programs learned whether the client ultimately enrolled in Medicaid. Three-quarters of Assister Programs reported they knew clients’ final Medicaid enrollment status all or most of the time, while 8% said they knew clients’ status about half of the time. The remaining 17% of Assister Programs said they knew the outcome in less than half of the cases, including 6% of Programs that reported knowing the Medicaid enrollment status rarely or never.

Section 3: Factors Affecting the Enrollment Process

Most Assister Programs report sufficient capacity to meet demand, but some had to turn people away. The vast majority of Assister Programs said they had capacity to serve all consumers who sought help during the last Open Enrollment period; however, 17% said they had to turn at least some consumers away – similar to the share who said demand exceeded capacity for the 2016 Open Enrollment Period. (Figure 8)

Capacity of Assister Programs to Meet Consumer Demand for Assistance

Assister Programs’ reliance on remote assistance developed during the COVID-19 pandemic. Before the pandemic, as a matter of policy, Marketplaces generally encouraged face-to-face enrollment assistance whenever possible. For the 2022 Open Enrollment period, however, 40% of Assister Programs said they provided remote assistance to half or more of their clients. 20% of Programs said they helped most consumers face-to-face, and 39% of Programs said all or nearly all consumers they helped received face-to-face assistance.

Assister Programs reported mixed experience with remote assistance. Among those who provided both in-person and remote assistance, one-third of Programs said remote assistance appointments generally took less time; 41% said remote appointments took about the same time and 27% said remote appointments generally took longer. Two-thirds of Programs who provide both types of assistance thought the quality of help they could provide was about the same compared to in-person appointments, while 26% said the quality of was not as high. (Figure 9)

Comparing Remote and In-Person Consumer Assistance

Most assisters believe the number of plan choices is about right, but comparing Marketplace plan options posed challenges for some. In many states this year consumers faced a choice of more than 100 QHP options. While most Assister Programs (55%) said they thought the number of QHP choices offered their clients was about right, 34% of Programs said they often found it challenging to identify meaningful differences in QHP benefits and costs that their clients cared about.

Most Assister Programs say they provided language assistance to their clients who needed it. Consumers with limited English proficiency require language assistance – help translating the Marketplace application and plan information into another language, or interpreter services to verbally communicate in another language, or both. Ninety percent of Assister Programs said they helped at least some consumers who needed language assistance. When we asked these Programs about the share of clients who required language assistance during the first half of 2022, 53% of Programs that provide language assistance estimated it was needed by up to 10% of their clients while 20% of Programs said more than half of their clients needed language assistance. (Figure 10)

Assister Program Clients Who Need Language Assistance

Nearly three-quarters of Programs that help customers who need language assistance said they have bilingual or multilingual staff or volunteers. Most Programs that provided this help (61%) said they were able to meet clients’ language needs all or nearly all of the time, while 35% of Programs said they could do so most of the time. Even so, more than one-third of Programs that provided language assistance (39%) said it is at least somewhat difficult for their clients to access written information and materials translated into the language they need.

Some consumers need more complex help. Nearly all Assister programs (97%) reported helping at least some consumers with complex cases, i.e., those that either took longer-than-average to help or presented with problems that challenged Programs’ ability to help. Examples of complex cases could include families with mixed eligibility status for coverage and subsidies, consumers with volatile work status who have trouble estimating annual income, or consumers who need help providing extra documentation to verify their income, immigration, or eligibility status. Many (41%) Assister Programs said fewer than 10% of their clients presented with complex cases. But 10% said more than one-in-five clients presented with complex cases.

Assister Programs can access outside help with complex cases, though the effectiveness of help varies. For example, 85% of Assister Programs that helped people with complex cases said they sought help from the Marketplace call center’s first tier of customer service, including 51% who said the call center was helpful most or nearly all of the time and one quarter (24%) who said it was helpful rarely or less than half of the time.

HealthCare.gov offers help with complex cases that Assister Programs can access through a “complex case web form.” It is unclear how many Assister Programs may be aware of this help; 65% of FFM Assister Programs said they did not use this resource at all.

Nearly all Assister Programs (92%) said that if their Marketplace offered additional training in complex case topics in order to receive advanced certification, they would be interested to have one or more of their staff complete such advanced training.

For these and other reasons, eligibility and enrollment assistance remains time intensive. As has been the case every year we conducted this survey, most Assister Programs (65%) reported that on average it took between 1 and 2 hours to help consumers who were applying to the Marketplace for the first time. For consumers returning to renew or change coverage, most Programs (63%) said n average appointments took less than 1 hour. (Figure 11)

Average Time Assister Programs Spent Helping New and Renewing Consumers

Section 4: Consumer Assistance by Agents and Brokers

In addition to Marketplace Assister Programs, private health insurance agents and brokers (referred to as “brokers” in this report) also help consumers shop for health coverage. To be certified to sell Marketplace coverage, brokers must be licensed by a state to sell health insurance, register with the Marketplace, and complete the Marketplace required training. Brokers are not paid by the Marketplace, rather they earn commissions from insurers for each consumer they help enroll in a QHP. Distinct from Assister Programs, brokers are permitted to recommend specific plans to consumers. Marketplaces require brokers to provide consumers with correct information and prohibit marketing practices that are misleading, coercive or discriminatory. A 2020 report by the federal government estimated that nearly half of QHP enrollments through HealthCare.gov were broker-assisted, and the Federal marketplace continues to promote broker assistance on its Find Local Help page.

Most brokers who responded to the survey are licensed to sell health insurance in more than one state. Just over 1/3 of brokers certified to sell Marketplace coverage (37%) reported being licensed in a single state; 35% said they were licensed in 2-4 states, and 28% were licensed in five or more states. For survey questions about state-specific issues, we asked brokers to answer with respect to the state where they sell the most coverage.

Most brokers (65%) helped up to 100 consumers with eligibility and enrollment through the Marketplace during the 2022 Open Enrollment period. However, one in five brokers helped more than 200 consumers. Brokers also continued to sell ACA-compliant policies offered outside of the Marketplace during 2022 Open Enrollment; such policies are not eligible for subsidies, and the volume sold was much lower. Most brokers (53%) said they sold no more than 10 ACA compliant-policies outside of the Marketplace during 2022 Open Enrollment. (Figure 12) This may be because the extension of premium subsidies to people with incomes above 400% of the poverty level created a strong incentive for these enrollees to switch to the marketplace.

Number of Consumers Helped by Brokers to Buy ACA-Compliant Plans Inside and Outside of the Marketplace, 2022

Brokers also reported helping consumers with SEP applications this year and during the COVID-19 SEP. In the 6-month period after OE 2022 ended, 37% of brokers helped 10 or fewer consumers with SEPs, while 16% of brokers helped more than 50. In addition, 80% of brokers said they helped consumers helped apply for 2021 coverage during the special extended COVID Enrollment Period. Like Assister Programs, 75% of brokers reported that most or nearly all consumers they helped during this time were unaware of newly available ARPA subsidy enhancements and instead learned of them first from the broker.

Broker assisted sale of non-ACA-compliant coverage

During the 2022 Open Enrollment period, most brokers (75%) reported they also helped consumers enroll in at least some types of non-ACA compliant plans sold outside of the Marketplace. Sixty-two percent of brokers who responded to the survey reported selling short-term policies (which exclude coverage of pre-existing conditions); 40% sold hospital indemnity policies (that pay a flat dollar per day in hospital benefits), 34% sold dread-disease policies (e.g. that only cover cancer), 34% sold accident-only coverage, 11% sold sharing ministry products and 2% sold Farm Bureau policies (neither of which are licensed as health insurance). (Figure 13)

Share of Brokers Who Sold Non-ACA-Compliant Plans During Open Enrollment

However, brokers reported selling a much lower volume of non-ACA compliant policies than QHPs during Open Enrollment. Two-thirds of brokers who responded to the survey said that during the 2022 Open Enrollment, they sold 10 or fewer non-ACA compliant policies instead of or as a supplement to QHPs. Eight percent of brokers said they sold more than 50 such policies.

Comparing consumer assistance from brokers and Assister Programs

Help provided by brokers is similar in many respects to that provided by Assister Programs. As with Assister Programs, most brokers also report helping consumers apply for financial assistance, compare plan options, and understand how to use their insurance. The time involved in providing enrollment reported by brokers help mirrors that reported by Assister Programs. In other respects, though, the kinds of activities brokers report engaging in and the types of people they report helping are different compared to Assister Programs. (Figure 14)

Comparing Help from Brokers and Assister Programs
  • 39% of brokers said they help consumers apply for or renew coverage under Medicaid/CHIP, compared to 88% of Assister Programs. Among consumers they did help, most brokers (52%) said few or none of their clients were determined eligible for Medicaid or CHIP compared to 17% of Assister programs who answered the same. Brokers are not paid commissions by Medicaid.
  • 27% of brokers said they conduct outreach activities to inform the public about the Marketplace, compared to 62% of Assister Programs.
  • Brokers were less likely to report helping uninsured consumers; 42% of brokers who responded said most/nearly all new Marketplace applicants they helped were uninsured, compared to 57% of Assister Programs.
  • Brokers were less likely to provide language assistance; 6% of brokers said most to nearly all people they helped during 2022 Open enrollment needed language assistance, vs. 24% of Assister Programs.
  • Brokers were also less likely to report helping Hispanic consumers; 8% of brokers said at least half the people they helped during 2022 Open Enrollment were Hispanic, compared to 22% of Assister Programs. Brokers were also far less likely to say they advise their clients about the importance of reporting information about their race/ethnicity to the Marketplace; 37% of brokers said they do this, compared to 63% of Assister Programs who say they do.
  • 4% of brokers said most or nearly all their clients needed help with immigration issues, and 4% said most/nearly all of their clients lacked Internet at home, compared to 12% and 16% of Assister Programs, respectively.

Broker use of alternatives to Marketplace web sites

For years, ACA-compliant policies have also been sold directly by insurers outside of the marketplace; but consumers who needed subsidies were re-directed from these “direct enrollment” (DE) sites back to the Marketplace to apply, then redirected back to the DE site to complete their enrollment. Starting in 2018, however, the federal government opened a new pathway for the sale of subsidized QHPs as an alternative to HealthCare.gov. These so-called enhanced direct enrollment (EDE) sites are privately operated, for example, by web-brokers. They coordinate with HealthCare.gov in the background, transmitting the consumer’s application and receiving the Marketplace’s eligibility determination for subsidies so that consumers can complete their application and select a plan entirely on the EDE site. EDEs offer an alternative to HealthCare.gov, but so far are not permitted in state-based marketplaces.

EDE sites generally are required display all QHP information shown on HealthCare.gov shows, though sites are permitted to not display information on QHPs they are not authorized to sell. In such cases, EDEs must display a notice that consumers can see additional plan information on HealthCare.gov. EDEs also can display QHP information in a different order, but cannot favorably display QHPs based on the web-broker’s commission.

CMS has promoted development of EDEs in recent years and reports that enrollment in QHPs through DE and EDE channels is increasing, accounting for 37% of QHP plan selections during the 2021 Open Enrollment period.

Only 28% of brokers initiate all QHP applications on the Marketplace web site. Most brokers (55%) selling QHPs in FFM states in 2022 said they never initiate applications on HealthCare.gov. In SBM states where DEs are an option but EDEs are not, 42% of brokers said they initiate all QHP applications on the Marketplace web site. (Figure 15)

Most Brokers Use Private Websites to Sell Marketplace QHPs

When asked why they rely on private sites over the Marketplace, brokers named several key reasons. Sixty-two percent of brokers who did not always use the marketplace site said it generally takes less time to complete a QHP application on a private site. Sixty-one percent said private sites offer a dashboard or other tools they can use to track the status of their client applications and accounts. Many also cited tools on private sites that that let them track client notices from the Marketplace (48%), or communication tools to help them contact clients (43%). A smaller share said they use private sites because there they can also show consumers other lines of insurance, such as life insurance policies (15%), or non-ACA compliant policies (10%). Federal rules require that such products must be displayed at separate tabs.

Finally, we asked brokers who use alternative enrollment sites if they would use the Marketplace site more often if it offered a secure broker portal that gave them direct access to client accounts and tools to facilitate tracking and communication with clients; 60% said they would, 11% said they would not, and 30% were not sure.

Section 5: The Public Health Emergency Unwinding

Provisions in the Families First Coronavirus Response Act (FFCRA), enacted at the start of the pandemic, prohibit states from disenrolling people from Medicaid until the month after the COVID-19 public health emergency (PHE) ends. This Medicaid continuous enrollment requirement has prompted a substantial increase in Medicaid enrollment during the pandemic. However, once the PHE ends, which is expected sometime in 2023, states will resume Medicaid redeterminations and will disenroll people who are no longer eligible or who are unable to complete the renewal process even if they remain eligible. As a result, KFF estimates that between 5 and 14 million people could lose Medicaid coverage.

Consumers enrolled in Medicaid today may need more help to remain covered next year. As states resume eligibility redetermination millions of current enrollees may no longer be eligible for Medicaid because of changes in income or other circumstances or may be disenrolled, despite remaining eligible, if they are unable to complete the redetermination process. Medicaid enrollees may need help completing the renewal process and, to avoid becoming uninsured, those who are no longer eligible for Medicaid may need help transitioning to other coverage. Many consumers who are disenrolled due to higher incomes will likely be eligible for subsidized Marketplace coverage, and the extension of enhanced subsidies in the Inflation Reduction Act (IRA) will make the transition easier. However, the 2021 special COVID enrollment experience showed that many such consumers may not be aware of this affordable coverage alternative. Further complicating the situation, the termination of the PHE will occur after the end of the Marketplace Open Enrollment Period and while individuals will qualify for 60-day SEP when they lose Medicaid coverage, that may not be enough time to enroll in Marketplace coverage, especially if they are not aware of the option or how to apply.

About half of Assister Programs (53%) said they have a good working relationship with their state Medicaid agency and are regularly in touch about matters affecting consumer eligibility and enrollment. But 36% of Programs said they have only limited contact, and 12% said they do not interact with their state Medicaid agency much if at all. In part because of these working relationships with Medicaid agencies, two-thirds of Assister Programs reported being familiar with their state’s plan for resuming routine operations once the PHE ends.

Most Assister Programs reported proactively reaching out to their states to explore ways to help consumers. Nearly six in ten Assister Programs (58%) said they had contacted their state to explore ways to educate consumers about the need to renew their Medicaid coverage. Given their broader scope of responsibilities, Navigator Programs were more likely than other Programs to report contacting their state (73% vs. 55%). Conducting outreach to consumers to inform them of steps they will need to take to complete the renewal process, and to provide assistance when needed, could help reduce the likelihood that eligible individuals will lose coverage because they could not complete the process.

Most Assister Programs reported planning outreach activities to raise consumer awareness about the end of the PHE. About half of Assister Programs said they were planning public education events, targeted outreach to consumers in low-income communities, or to partner with local agencies or non-profits to refer consumers who need additional information (Figure 16). A smaller share (17%) of Assister Programs reported adopting other outreach strategies, including social media outreach campaigns, engaging local media to educate the public through stories on the PHE unwinding, and partnering with other community groups that serve low-income people. Fewer Programs (13%) said they planned to hire more staff or recruit more volunteers.

Assister Program Outreach Strategies to Inform Consumers of Need to Renew Medicaid Coverage

Assister Programs expressed support for additional actions states could take that would enable them to help consumers retain Medicaid or transition to other coverage. More than six in ten Assister Programs (65%) said they thought the state or Marketplace should provide an extended SEP for people losing Medicaid coverage to enroll in Marketplace coverage. while 59% supported the state sharing contact information on individuals who need to renew their Medicaid coverage. Nearly half of Assister Programs also supported having the state provide additional resources to conduct outreach and/or hire more staff and provide additional training on the Medicaid application process or Marketplace Special Enrollment Periods (Figure 17).

Assister Program Support for State or Marketplace Actions to Help Consumers Who May Lose Medicaid Coverage

Both Assister Programs and brokers indicated they will try to re-contact Medicaid clients to update contact information, and most were confident they could reach their clients. About six in ten (58%) Assister Programs and about four in ten (38%) brokers surveyed said they would try to collect updated contact information from Medicaid clients they had helped in the past two years. Providing updated mailing addresses and other contact information to the Medicaid agency can help ensure enrollees receive renewal and other notices and any requests for information. If enrollees do not respond to these requests for information or documentation, even if they do not receive the request, their Medicaid coverage can be terminated. Among Assister Programs and brokers indicating they would re-contact Medicaid clients, eight in ten (83% of Assister Programs and 80% of brokers) said they were very or somewhat confident they would be able to reach those clients.

Few Assister Programs (29%) and brokers (9%) expect the Medicaid agency to provide them with information on consumers who may be eligible for Marketplace coverage, although nearly half were unsure of their state’s plans. Under certain circumstances], states can share information with trusted partners, including information on consumers who are disenrolled from Medicaid and likely eligible for subsidized coverage in the Marketplace. These consumers will need to complete a Marketplace application to obtain coverage. Assister Programs can educate consumers about the process and assist them with completing the application.

Although the number of people needing assistance with Medicaid renewals and other issues is expected to increase, most Assister Programs and brokers said they could serve all consumers who seek help. Nearly 60% of Assister Programs and brokers reported having enough resources to serve the all the clients who will need help renewing their coverage or applying for Marketplace coverage after being disenrolled from Medicaid. 17% of Assister Programs and 16% of brokers said they did not have adequate resources while about a quarter were unsure.

Appendix

Appendix: Characteristics of Assister Programs

Three types of Marketplace Assister Programs were surveyed for this report.

Navigator Programs – The ACA requires all Marketplaces to establish and fund Navigator Programs to provide outreach and enrollment assistance to all consumers. Navigators are required to have expertise in eligibility and enrollment rules, the range of qualified health plan (QHP) options, affordability programs – both QHP subsidies and Medicaid/CHIP – the needs of underserved and vulnerable populations, including individuals with limited English proficiency, and privacy and security standards. Navigators must offer objective advice to consumers. They must not be operated by insurance companies nor receive compensation from insurers; and they may not help with enrollment in any private health coverage offered outside of the Marketplace. At least one Navigator grantee in each state should be a community-based non-profit organization. Navigator Programs tend to be the consumer assistance workhorse – compared to other Assister Programs, they are more likely to operate statewide service areas, serve a higher number of clients, and operate with larger budgets; although some Navigator Programs are small, local, and have more limited resources. For the 2022 coverage year, state and federal Marketplaces provided a combined $162.2 million in funding for Navigator Programs. (Total does not reflect spending for New Mexico or Washington state.) Of this total, the federal Marketplace awarded $90.2 million and SBMs together awarded $72 million.

Certified Application Counselor Programs (CACs) – Marketplaces are also required to recognize, certify, and provide training for CAC Programs sponsored by non-profits and provider organizations. This Assister Program designation was created prior to the first Open Enrollment – when funding for Navigators, at least in the FFM, was still uncertain – to ensure that willing volunteer Programs would also be available to help. Under federal rules, CAC Programs are not required to engage in all activities required of Navigators, and do not undergo training as extensive as that required for Navigators. CAC Programs generally do not receive funding support from the Marketplace; they are primarily supported by their own sponsoring organizations and other outside sources such as foundations. For the 2022 coverage year, a total of 1,756 CAC Programs served Marketplace consumers.

Federally Qualified Health Centers (FQHCs) – The federal government supports a network of nonprofit health clinics in the US to provide health care to uninsured, low-income, and other underserved populations. Starting in 2014, the federal government required FQHCs to also provide outreach and enrollment assistance to consumers seeking coverage through the Marketplace and provided additional funding for this purpose. Of the 1,334 FQHCs surveyed, 85 are also certified as Navigators and shown as Navigator Programs in this report. The other 1,249 must complete CAC training to be Marketplace certified and are shown as FQHC Programs in this report. For the 2022 coverage year, the federal government provided FQHCs $150 million to support enrollment assistance.

While the size of Assister Programs varies, most had a relatively small number of full-time equivalent staff during the 2022 Open Enrollment. Most Assister Programs (73%) indicated that they had five or fewer FTEs during the 2022 Open Enrollment, while 15% had between 6 and 10 FTEs. Navigator Programs had somewhat larger staff compared to the other Program types. (Appendix Table 1) Assister Programs report nearly all FTE staff were paid, not volunteer. Most Assister Programs (66%) indicated that the number of FTEs in 2022 was about same as in prior year; 13% say FTE staff grew from 2021 while 21% of Programs said staff size is smaller than in the year before.

Assister Program Staff Size, 2022

Staff continuity in Assister Programs is high. 77% of Programs say most or almost all staff this year worked for them during the previous year’s Open Enrollment. Program staff typically work year-round, not just during Open Enrollment; 71% of Programs say staff size held steady since the 2022 Open Enrollment Period ended; while 21% of Programs say the number of FTEs has since declined.

Assister Programs were confident that the current level of funding will be available for 2023.Seventy-eight percent of all Assister Programs are very or somewhat confident current funding will continue for 2023. The highest rate of confidence is among Navigator Programs (93%), followed by FQHC (76%) and CAC Programs (68%). Following years of funding cuts, Federal marketplace Navigator funding was significantly increased for the 2022 Open Enrollment to $80 million, with a supplemental $10.2 million awarded shortly thereafter. For 2023, CMS has announced Federal Marketplace Navigator grants of $98.9 million (grants were announced after this survey closed.) Currently CMS cooperative agreements with Navigator Programs are for a 3-year period, through August 2024, though annual funding amounts are determined each year and not guaranteed.

News Release

Implementation of the 988 Number Brought More Calls and Texts to the National Suicide Prevention and Crisis Hotline This Summer – And Early Data Show Answer Rates Improved or Held Steady

Published: Oct 17, 2022

A new KFF analysis finds that more people contacted the new 988 number for the national suicide prevention and crisis hotline following its launch in July, that callers waited less time on hold, and that callers connected with crisis counselors at higher rates than before the 988 number came online through a combination of calls, chats and texts.

The easy-to-remember three-digit number steers callers who are suicidal or experiencing a behavioral health crisis to the recently renamed 988 Suicide & Crisis Lifeline, where they can be connected to a local Lifeline counselor and may receive crisis counseling, resources, and referrals.

Before 988, the Lifeline crisis hotline–established in 2005–was typically accessed through a 10-digit number, which was difficult for callers experiencing a mental health crisis to recall. The new phone number was expected to increase outreach, but there was concern that the Lifeline service might not be able to accommodate the increased demand, potentially resulting in higher rates of unanswered calls.

Early federal data show that combined call, text, and chat volume to Lifeline increased substantially after the 988 number went live. The combined number of calls, texts, and chats rose by more than 112,000 in August 2022 compared to a year earlier (a 45% increase); however, the overall answer rate actually improved, rising from 67 percent to 88 percent over the same time frame. People who reached out to 988 spent less time waiting on hold for a counselor, with the average wait time for all methods (combined) decreasing from 2 minutes and 30 seconds in August 2021 to 42 seconds in August 2022.

Lifeline’s 988 calling code became nationally available on July 16, 2022. Despite some early reports of public hesitancy, a recent KFF/CNN poll finds that among those that knew about 988, 85 percent say they would be at least somewhat likely to call the hotline if they or a loved one were experiencing a mental health crisis. However, less than half of people know about 988. Nearly half a million lives (480,622) were lost to suicide between 2010 to 2020 and an additional 47,646 lives were lost in 2021, reflecting a recent rise in suicide rates.

Additional state and national crisis center metrics may help inform the 988 implementation and future program improvements. Publicly available Lifeline data only capture a small slice of metrics needed to understand implementation, identify gaps, and identify policies and interventions to address shortfalls.

News Release

Firearm Deaths of Children and Adolescents Continued to Rise in 2021, Especially Among Black Youth

About Seven Children Die Each Day Due to Firearms

Published: Oct 14, 2022

Gun deaths among children and adolescents continued to rise in 2021, particularly among Black youth, a new KFF analysis of federal injury and mortality data finds.

The analysis finds that the rate of firearm-related deaths for children ages 17 and younger reached 3.6 per 100,000 children in 2021, a 50% increase from before the COVID-19 pandemic began. This represents about seven children dying each day due to firearms.

The rate of firearm-related deaths among Black youth was 12.0 per 100,000 – six times higher than White youth and substantially higher than any other racial and ethnic group. Although Black children made up 14% of the nation’s children in 2021, they accounted for 46% of youth firearm deaths.

While most child firearm deaths stem from assaults, the number of firearms-related deaths by suicide is on the rise, climbing from 657 in 2019 to 827 in 2021. At the same time, youth suicide deaths by other means have declined in recent years. As a result, nearly half (47%) of all youth suicides now involve firearms, the analysis finds.

The analysis also examines the negative mental health consequences for children and youth stemming from exposure to gun violence and describes recent policy changes aimed at addressing them.

Half of Adults Say Their Family Has Experienced a Severe Mental Health Crisis

Published: Oct 13, 2022

The latest partnership survey between KFF and CNN finds half of adults have experienced a severe mental health crisis in their family, including one in four adults who say they have had a family member receive in-person treatment because they were thought to be a threat to themselves or others, or had a family member engaged in cutting or other self-harming behaviors. The Mental Health in America survey was conducted July 28-August 9, 2022, online and by telephone among a nationally representative sample of 2,004 U.S. adults in order to provide insights into the current state of mental health and mental health care among U.S. adults, including their experiences during the COVID-19 pandemic.

News Release

Abortion Grows as a Motivator for Midterm Voters, Particularly for Democrats and in States Where It Has Become Illegal Since the Supreme Court Overturned Roe v. Wade

Voters, Including Most Republicans and Most Living in States with Abortion Bans, Oppose Prohibiting It in Cases of Rape or Incest, or Criminalizing Women and Doctors

Published: Oct 12, 2022

Few Voters Know About the Medicare Drug Provisions in the Inflation Reduction Act, Though Seniors are More Aware and Would Be Likely to Vote for Candidates Who Support Them

About a month ahead of the 2022 midterm election, abortion continues to grow as a motivating issue for voters, especially among Democrats and those living in states where abortion is now illegal, the latest KFF Health Tracking Poll finds.

Half (50%) of voters now say the Supreme Court’s decision overturning Roe v. Wade has made them more motivated to vote in this year’s elections, up from 43% in July shortly after the Court’s decision and from 37% in a similar question in May, prior to the decision. About two thirds of Democrats (69%), and half of independents (49%), cite the Court’s decision as a motivator, as do a third of Republicans (32%).

Many races in the midterms will be decided by marginal changes in turnout, with a few voters making a difference. The new survey reveals how abortion access and reproductive health is motivating majorities of Democratic women, women of reproductive age, and Democratic and Democratic-leaning voters in states where abortion is currently illegal.

Among those who say the Supreme Court decision is making them more motivated to vote, three-quarters (76%) say they plan to vote for candidates who want to protect abortion access, compared to 17% who say they plan to vote for candidates who want to limit access.

With states now determining whether and when abortion is legal for their residents, four in ten (40%) voters say their state’s abortion laws are making them more motivated to vote this year.

In states with abortion bans in place following the Supreme Court’s decision, half (51%) of voters say their state’s abortion laws are making them more motivated to vote this year. This includes three quarters of Democratic and Democratic-leaning voters (74%) and a third of Republican and Republican-leaning voters (35%) in those states.

Nationally, 82% of voters oppose laws that would prohibit abortion in cases of rape and incest, as is now in place in some states such as Texas, Tennessee, South Dakota, Missouri, Louisiana and Kentucky. About six in ten (59%) oppose prohibiting abortions after a fetal heartbeat is detected, which is usually at around six weeks.

In addition, large majorities of voters oppose punitive abortion laws, such making it a crime for doctors to perform them (74%) or for women to get them (79%), and allowing private citizens to sue people who provide or assist in abortions (81%).

Most Democratic and independent voters oppose each of these five laws, and most Republican voters oppose a prohibition even in cases of rape or incest (70%), allowing private citizens to sue those involved in abortions (65%), or making it a crime for a woman to get one (64%). Half (51%) of Republican voters oppose making it a crime for a doctor to provide one, while a third (34%) oppose a prohibition once a fetal heartbeat is detected.

Most voters living in states with abortion bans oppose each of these restrictions, often by large margins.

“With a Democrat in the White House, Republicans start with an advantage in this year’s midterm, especially on issues such as gas prices and crime, but their efforts to ban and criminalize abortion are backfiring on them politically, even in red states,” KFF President and CEO Drew Altman said. “Whether this motivates enough voters to hit the polls and change the outcome remains to be seen.”

Awareness of IRA’s Medicare Provisions is Low, Though Most Older Voters Like Them

The survey also probes the public’s knowledge and views about the Inflation Reduction Act (IRA), which President Biden signed into law in August. The law includes provisions related to health care and drug prices, as well as climate change and tax policy.

The provisions are popular, with majorities of voters supporting some of the new law’s Medicare provisions, suggesting that Democrats can campaign on them with positive results.

However, relatively few people are aware of the law’s Medicare provisions, including allowing Medicare to negotiate some drug prices (36% are aware the law does this), capping monthly out-of-pocket insulin costs for people on Medicare (29%), and limiting overall out-of-pocket prescription costs for those on Medicare (29%).

Older adults at least 65 years old, who are most directly affected by Medicare changes, are twice as likely as younger adults to say they’ve heard “a lot” about the IRA (25% vs. 12%). They are also more likely than younger adults to know about the Medicare drug negotiations and insulin provisions.

Most Democratic and independent voters say they would be more likely to vote for candidate who supports each of the IRA’s Medicare drug provisions. Nearly half of Republican voters say the same about candidates who support limiting out-of-pocket drug costs (48%) and insulin costs (47%) for people with Medicare, though somewhat fewer say so about candidates who support Medicare drug price negotiations (38%).

In addition, large majorities of older voters say they would be more likely to vote for candidates who support each of the IRA’s Medicare drug provisions, including limiting out-of-pocket prescription costs (73%), allowing Medicare drug price negotiations (65%), and capping monthly insulin costs (64%).

Designed and analyzed by public opinion researchers at KFF, the survey was conducted from Sept 15-26, 2022, online and by telephone among a nationally representative sample of 1,534 U.S. adults, in English and in Spanish. The survey included an oversample of 599 women between the ages of 18 and 49. The margin of sampling error is plus or minus 3 percentage points for the full sample. For results based on other subgroups, the margin of sampling error may be higher.

Poll Finding

KFF Health Tracking Poll October 2022: The Issues Motivating Voters One Month Before The Midterm Elections

Published: Oct 12, 2022

Findings

Key Findings

  • In the upcoming midterm elections, many races will be decided by marginal changes in turnout with a few voters making a difference. The latest KFF Health Tracking Poll examines what health care issues may be motivating small groups of voters that could shift some key races. Abortion access and reproductive health is motivating majorities of Democratic women, women of reproductive age, and Democratic and Democratic-leaning voters in states where abortion is currently illegal. This is also the issue that these voters want to hear candidates talk about during the next month of the campaign. Moreover, state action on abortion seems to be a particularly motivating issue for Democrats in states that have a full abortion ban. The other health care issue that is resonating with a group of voters – older voters – is reducing the cost of prescription drugs for people with Medicare. Majorities of voters ages 65 and older say they are more likely to vote for a candidate who supports the Inflation Reduction Act provisions aimed at capping costs and allowing the federal government to negotiate prices for people with Medicare. These provisions were also motivating, to a lesser extent, Republican voters.
  • With about a month before the 2022 midterm election, half of registered voters say they are more motivated to vote in this upcoming election compared with past elections. A single party doesn’t hold a distinct advantage – with more than half of both Republican and Democratic voters saying they are more motivated – but the issues motivating each group of voters differ. When asked to say in their own words why they are more motivated to vote now, the top issue provided by Republicans is the economy, while Democratic voters are more likely to offer abortion as their motivation for being more eager to vote. Independent voters are divided between the two issues. Large shares of voters also offer partisan reasons like keeping the other party out of office for the main reason why they are motivated to vote.
  • The Supreme Court’s decision overturning Roe v. Wade is continuing to motivate some voters as half of voters (50%) now say the Court’s decision has made them more motivated to vote, up from 43% who said the same in July and an increase of 13 percentage points from a similar question in May. In addition, state actions on abortion are also motivating voters, particularly in the states where full abortion bans are now in place. Overall, four in ten voters say their state’s abortion laws have made them more motivated to vote, but this increases to 51% among voters living in states with full abortion bans. In addition, three in four Democratic or Democratic leaning independent voters (74%) living in states with full abortion bans in place say their state abortion laws have made them more motivated to vote.
  • The legality of abortion in the wake of the Dobbs decision also continues to resonate with women voters, ages 18 to 49. More than four in ten (44%) women voters, ages 18-49, say they are more motivated to vote this year compared to previous elections, and most of them (59%) say the Supreme Court decision overturning Roe v. Wade has made them more motivated to vote. In addition, when asked to say in their own words why they are more motivated to vote, one in seven of this group offers reasons related to the Supreme Court decision, such as the issue of abortion and reproductive rights (9%) and protecting women’s rights (4%).
  • With abortion dominating the issue of health care so far in the 2022 midterm election, the KFF Health Tracking Poll also examines whether the health care provisions in the Inflation Reduction Act are resonating with certain groups of voters. While adults are aware of some of the key health provisions that are included in the law, some of the provisions aimed at lowering the cost of prescription drugs for people with Medicare are resonating with some voters, including those ages 65 and older. About two-thirds of voters ages 65 and older say they are more likely to vote for a candidate who supports capping out-of-pocket costs for insulin for people with Medicare (64%) or authorizing the federal government to negotiate the price of some prescription drugs for people with Medicare (65%), and three-fourths of older voters (73%) say they are more likely to vote for a candidate who supports placing a limit on out-of-pocket drug costs for people with Medicare.

What Is Motivating Voters Ahead of the Midterm Elections?

With the upcoming midterm election only a month away, about half of registered voters (49%) say they are more motivated to vote compared to previous elections. About four in ten (41%) say they are about as motivated as they have been in past elections and one in ten (9%) say they are less motivated to vote. No party holds a motivation advantage at this point in the election with similar shares of Republican voters (57%) and Democratic voters (52%) saying they are motivated to vote. Older voters have historically had higher rates of voter turnout than younger voters and the 2022 midterm election looks to be no exception with nearly six in ten adults ages 65 and older say they are more motivated to vote, compared to slightly less than half of their younger counterparts.

Across racial and ethnic groups, Hispanic voters seem to have more tepid levels of motivation to vote in the 2022 midterm election. While about half of White voters (53%) and Black voters (48%) say they are more motivated to vote, just three in ten Hispanic voters (30%) say the same. Indeed, about one in six Hispanic voters (16%) say that compared to previous elections, they are less motivated to vote.

About Half Of Voters Say They Are More Motivated To Vote Than Usual

When motivated voters are asked to say in their own words why they are more motivated to vote now than in previous elections, about one in ten say they are more motivated to vote due to the economy and inflation (9%) and a similar share say their increased motivation is due to the issue abortion and reproductive rights (8%). However, reflecting the polarized state of politics in the nation, significant shares of more motivated voters give partisan reasons (33%) for their increased motivation to vote. About three in ten cite the desire for change (29%) and about one in ten motivated voters mention democracy, voting rights, and the importance of voting as a reason why they are more motivated to vote now than in previous elections.

The top issue provided by motivated Republican voters for their increased motivation is the economy (15%), while Democratic voters are more likely to offer abortion (13%) than the economy (2%) as the issue making them more eager to vote. Independent voters are divided between the two issues with similar shares offering the economy (10%) and abortion (10%) as their motivating issue. Unsurprisingly, partisanship also seems to be a key driver for both Republican and Democratic voters, with large shares of motivated voters from both parties citing party-related reasons for their increased motivation. Four in ten motivated Republicans (41%) give partisan reasons for their increased motivation including 19% who say they are more motivated to vote to either to keep Democrats out of office or to vote for Republicans, and an additional 10% mention dissatisfaction with President Biden. Among motivated Democratic voters, about a third (32%) name party-related reasons for their increased motivation, including 13% who mention wanting to keep Republicans out of office or wanting to vote for Democrats.

In Their Own Words: Why are you more motivated to vote now than in previous elections?

“We all need to vote blue. Abortion needs to be legal in all states.” – 72-year-old Democratic woman in Oregon

“Because women's rights are being threatened now more than ever and I'll be damned if I stand by and let it happen.” – 29-year-old Democratic woman in Alabama

“Personal Investments have plummeted, my grocery bill is astronomical, fuel cost is out of control, bail reform in NYS and criminals across the country are not being punished!” – 48-year-old Republican man in New York

“To vote out them Dems that are destroying the country.” – 58-year-old Republican woman in Connecticut

“To help protect women's rights.” – 40-year-old Democratic man in Georgia

Partisan Motivations And A Desire For Change Are Among Top Reasons Given By Motivated Voters

Among voters who say they are less motivated to vote now compared to previous elections, 16% cite not believing in the election process as a reason why they are less motivated and similar shares mention disliking the candidates (15%) and not thinking their vote matters or will count (12%).

In Their Own Words: Why are you less motivated to vote now than in previous elections?

“Voting really does not matter. It is all rigged.” – 55-year-old Republican woman in Minnesota

“Because I don't believe in the promises that the candidates are making.” – 44-year-old Democratic woman in New York

“The candidates are all disappointing. No matter who is in office they all work for the same government. Things are getting worse and worse”. – 49-year-old Democratic woman in Texas

“I don't believe in either side anymore. I am through with politics.” – 61-year-old independent man in California

“Because our votes don't matter.” – 37-year-old Republican man in Kansas

“I would never vote republican but I'm not always happy to vote democrat.” – 24-year-old Democratic man in Texas

The Top Issues For Voters

An overwhelming majority (88%) of voters say that a candidate’s positions on issues they care about will be a “major factor” in deciding how they vote for Congress this year, highlighting the importance of how candidates talk about the top issues for voters over the next few weeks. Most voters also say the candidate’s experience (61%) and political party (56%) is a “major factor” in their voting decision.

Candidates' Positions On Issues Are Major Factor For Vast Majority Of Voters, While Qualifications And Political Party Are Also A Major Factor For Many

Given the overwhelming majority of voters who say a candidate’s positions on issues will be major factor in their vote, the latest KFF Health Tracking poll asked voters to name in their own words the one issue they would most like to hear candidates talk about. Economic issues, including inflation, emerge as the key issue ahead of the November midterm election with 35% of voters saying that is what they want to hear candidates talk about. Beyond economic issues, notable shares of voters say they would like to hear candidates talk about abortion, Roe v. Wade, and reproductive rights (15%), and about immigration (9%).

Across partisans, the economy is clearly the top issue for Republicans and for independents. Half of Republican voters (52%) and one-third of independent voters say they want to hear candidates talk about economic issues, including inflation. Immigration is the second most mentioned issue by Republican voters (18%) whereas among independent voters, 14% say they want candidates to discuss abortion and reproductive rights, while one in ten (10%) want to hear about immigration. Democratic voters are somewhat divided on what they want to hear candidates discuss, with nearly three in ten (28%) who say they want to hear about abortion and reproductive rights, while a quarter of Democratic voters (23%) want to hear about candidates talk about the economy.

The economy also stands as the most prominent issue across racial and ethnic groups with nearly four in ten White voters (39%), three in ten Hispanic voters (30%), and a quarter of Black voters (26%) saying they want to hear candidates talk about economic issues ahead of the election. However, abortion also emerges as a key issue, particularly for Black voters as nearly one in five say they want to hear candidates talk about it.

The Economy Is The Key Issue Voters Want To Hear Candidates Discuss, Followed by Abortion and Immigration

Women voters are more likely than men to say they want to hear the candidates discuss abortion, reproductive rights and Roe v. Wade (19% vs. 11%), though the economy is the top issue for both groups (34% and 37% respectively). Abortion rights are particulalrly important among Democratic women – a third of Democratic women (34%) say they want to hear candidates talk about abortion, more than twice the share of independent women (16%) and nearly seven times the share of Republican women (5%) who say the same.

Abortion Rights Are A Particularly Important Issue For Democratic Women Voters With A Third Saying That Is What They Want To Hear Candidates Talk About

How Changes In Abortion Policies Are Motivating Midterm Voters

In the wake of the Dobbs decision overturning Roe v. Wade and a number of states taking legislative action to restrict abortion, the latest KFF poll finds that half of voters (50%) say the Supreme Court’s decision has made them more motivated to vote, up from 43% who said the same in July and an increase of 13 percentage points from a similar question in May, before the Court had issued its decision but after a draft of the forthcoming decision was leaked. A majority of women voters, ages 18 to 49, (59%) continue to say the Supreme Court decision overturning Roe v. Wade has made them more motivated to vote, relatively unchanged from the July KFF poll.

Half Of Voters Now Say Decision Overturning Roe Has Made Them More Motivated To Vote In The Midterm Election

The Dobbs decision seems to be motivating voters who want to vote for candidates who support abortion access more than those voters who want candidates to limit access. Voters who say they are more motivated to vote in this election compared to previous ones are about twice as likely to say they plan on voting for candidates who want to protect access to abortion (58%) than for candidate who want to limit abortion access (27%).

In addition, among those who say the Supreme Court decision itself has made them more motivated, three in four (76%) say they plan on voting for candidates who want to protect access to abortion compared to 17% who say they plan on voting for candidates who want to limit abortion access.

Similarly, with abortion laws being determined at the state level, many voters (40%) say their state’s abortion laws have made them more motivated to vote in the 2022 midterm election. Notably, voters in states with an abortion ban1  in place (51%) are more likely than those in states with protections for abortion access (32%) to say their state abortion laws have made them more motivated to vote. State abortion bans appear to be particularly motivating for Democrats as three in four Democratic or Democratic-leaning voters in states that have full abortion bans say their state abortion laws have made them more motivated to vote in the midterm election.

Half Of Voters In States With Full Abortion Bans, Including Three In Four Democratic Or Democratic Leaning Voters Say Their State Abortion Laws Have Made Them More Motivated To Vote

On both, the Supreme Court decision and recent state actions, larger shares of Democratic voters say each has made them more motivated to vote than Republican voters. Similarly, Black voters are more likely than their White counterparts to say both Supreme Court’s decision and their state abortion laws have made them more motivated to vote. About half of women voters say the Court’s decision overturning Roe (53%) and their state abortion laws (46%) have increased their motivation to vote. Notably, Republican women voters are somewhat more likely than their Republican male counterparts to say the abortion laws in their state have made them more motivated to vote (36% vs. 24%), though half of both Republican women (50%) and men (50%) say they plan to vote for candidates who want to limit access to abortion.

Half Of Voters, Including Nearly Six In Ten Women Under 50, Say Supreme Court Decision Has Made Them More Motivated To Vote; Four In Ten Voters Are Motivated By Their State Abortion Laws

How The Dobbs Decision Is Motivating Women Voters Of Reproductive Age

KFF polling from July 2022 found that more than seven in ten women voters under the age of 50 said the issue of abortion access would be very important in making their decision about who to vote for in the midterm election. The latest KFF Health Tracking poll finds that large shares of women voters under 50 remain more motivated to vote due to the Supreme Court’s decision overturning Roe v. Wade, and that most are planning to vote for candidates who will protect abortion access.

Several months since the Supreme Court overturned Roe, the issue of reproductive rights remains salient for women voters ages 18 to 49, the group most directly impacted by the Court’s decision. While a third of women voters under age 50 say they want to hear candidates discuss economic issues, one in five (19%) say the issues they most want to hear them talk about are abortion, reproductive rights, and Roe v. Wade.

A Third Of Women Voters Ages 18-49 Want To Hear Candidates Discuss Economic Issues, Though One In Five Want To Hear Them Talk About Abortion And Reproductive Rights

Overall, 44% of women voters under age 50 say, compared to previous elections, they are more motivated to vote in November. The issue of abortion and reproductive rights resonated with these younger women voters as about six in ten women voters ages 18 to 49 (59%) say the Supreme Court decision overturning Roe v. Wade has made them more motivated to vote, and half (51%) say their state abortion laws have increased their motivation to go to the polls.

Majority Of Women  Under 50 Say Roe Decision Has Made Them More Motivated To Vote

Similar to overall voters who say they are motivated by the Dobbs decision, women voters 18 to 49 who are now more motivated to vote also are more likely to vote for candidates who support abortion access. Eight in ten women voters 18-49 who say they are more motivated to vote because of the Supreme Court decision on Roe say they will vote for a candidate who wants to support abortion access (79%).

State Abortion Restrictions

Following the Dobbs decision, fourteen states now have full bans on abortion. For the latest breakdown of key facts about abortion access in the U.S., see the KFF Abortion in The U.S. Dashboard.

Most voters remain opposed to punitive abortion restrictions, with more than seven in ten voters opposed to making it a crime for doctors to perform abortions (74%) or for women to get abortions (79%) or allowing private citizens to sue people who provide or assist in abortions (81%). Six in ten voters (59%) oppose prohibiting abortions after a fetal heartbeat is detected and eight in ten (82%) oppose prohibiting abortion even in cases of rape or incest – a restriction that is currently in-place in states such as Texas, Tennessee, South Dakota, Missouri, Louisiana and Kentucky among others.

At Least Three In Four Voters Oppose Laws That Criminalize Women Or Doctors For Abortions, 8 In 10 Oppose Prohibiting Abortions Even In Cases Of Rape Or Incest

Though a majority of Republican voters (70%) approve of the Supreme Court’s decision overturning Roe v. Wade, majorities across partisan voters – including most Republicans – are opposed to laws prohibiting abortion even in cases of rape or incest, laws making it a crime for women to get an abortion that would result in either fines or prison, and laws allowing private citizens to sue people who provide or assist women in getting abortions.

Majorities Across Partisan Voters Oppose Prohibiting Abortion Even In Cases Of Rape And Incest And Making It A Crime For A Woman To Get An Abortion

Large shares of voters living in states with abortion bans oppose many of the restrictions surveyed. More than eight in ten voters (83%) in states with full abortion bans say they oppose laws prohibiting abortion even in cases of rape and incest – which is currently the case in most of these states with full abortion bans. However, there is some support for prohibiting abortions once cardiac activity is detected among voters in states with full bans (45% support vs. 55% oppose).

Interactive DataWrapper Embed

Inflation Reduction Act Health Care Provisions And Student Loan Cancellation As Voting Issues

In the months leading up to the midterm election, which is historically viewed as a referendum on the president and their party, President Biden signed into effect the Inflation Reduction Act (IRA), a new law containing provisions related to health care and prescription drug costs, climate, and tax policy. In addition, he announced student loan debt forgiveness for many adults in the U.S. The KFF Health Tracking Poll examined how these recent Biden actions may be impacting voters ahead of the midterm elections.

The Inflation Reduction Act

Just over one month after President Biden signed the IRA into law, most of the public (77%) say they have heard or read at least a little about the new law, including majorities of adults across partisans, age groups, and racial and ethnic groups. About eight in ten adults ages 65 and older (82%), many of whom may be affected by the new law’s Medicare provisions, say they have heard at least a little about the new law and they are twice as likely as adults under age 65 to say they have heard “a lot” about it (25% vs. 12%).

Yet, despite the fact that three in four adults have heard at least a little about the new law, few know what the law does. In fact, most adults are unaware of the law’s key health provisions. Most say they are unsure if the law extends financial subsidies for people who purchase health coverage through the Affordable Care Act marketplace (66%), places a limit on out-of-pocket prescription drug costs for people with Medicare (63%), caps monthly out-of-pocket costs for insulin for people with Medicare (60%) or authorizes the federal government to negotiate the price of some prescription drugs for people with Medicare (55%).

Awareness of the climate provisions in the new law, however, is higher compared to some of the health care elements of the law. While about half of adults (48%) say they are “not sure” if the new law makes big, new investments in climate and clean energy programs and in tax credits for renewable energy, about four in ten adults (42%) are aware the IRA does this.

Adults who say they have heard or read “a lot” or “some” about the Inflation Reduction Act are more likely than those who have only heard or read a little to know that each of the IRA provisions asked about in the survey were indeed part of the new law.

Majorities Are Not Aware Of Many Provisions In The Inflation Reduction Act, With Awareness Highest For Climate Provisions

Adults ages 65 and over, a group that largely benefits from the Medicare prescription drug provisions of the law, are more likely than their younger counterparts to know that the IRA authorizes the federal government to negotiate the prices of some prescription drugs for people with Medicare (45% vs. 33% of adults 18 to 64) and to know that the bill caps monthly costs for insulin for people with Medicare (38% vs. 26% of adults 18 to 64).

Older Adults Are More Likely Than Those Under 50 To Know IRA Authorizes Government To Negotiate Some  Drug Costs For People With Medicare

Though few adults are aware of the specific provisions included in the Inflation Reduction Act, many of these provisions are popular among voters. Majorities of voters say they would be more likely to vote for a candidate who supports placing a limit on out-of-pocket prescription drug costs for people on Medicare (66%), capping monthly out-of-pocket insulin costs for people with Medicare (65%) and authorizing the federal government to negotiate the price of some prescription drugs for people on Medicare (59%).

Voters are more divided on provisions related to climate and clean energy and extending subsidies under the Affordable Care Act. About half of voters (51%) say they would be more likely to vote for a candidate who supports making big, new investments in climate and clean energy programs and provide tax breaks for renewable energy, while less than half (43%) say they would be more likely to vote for a candidate who supports extending financial subsidies for people who purchase coverage through the Affordable Care Act marketplace.

Additionally, just a week after the passage of the IRA, the Biden Administration announced a plan to cancel up to $10,000 in federal student loans for most borrowers with incomes under $125,000. Notably, student loan cancellation appears to be particularly polarizing with four in ten voters (40%) saying they are more likely to vote for a candidate who supports cancelling some federal student loan debt for most borrowers who make under $125,000 while a similar share (38%) say they would be less likely to vote for a candidate who supports this.

Majorities Of Voters Say They Are More Likely To Vote For A Candidate That Supports Medicare Prescription Drug Costs Provisions In The Inflation Reduction Act

These new policies could motivate different segments of voters. Majorities of voters ages 65 and older say they are more likely to vote for a candidate who supports the Medicare provisions in the Inflation Reduction Act, though fewer say the same about a candidate who supports clean energy investment, the extending ACA subsides, or cancelling some student loans. On the other hand, student loan cancellation may resonate among younger voters as those ages 18 to 29 are more than twice as likely as voters over 65 to say they are more likely to vote for a candidate who supports cancelling some student loans.

Voters Ages 18-29 Are More Likely Than Older Voters To Back Candidates Who Support Climate Investment, ACA Subsidies, And Student Debt Cancellation

At least six in ten Democratic voters say they are more likely to vote for a candidate who supports each of the policies asked about, with the policies aimed at addressing prescription drug costs for people with Medicare being among the most popular. At least six in ten independent voters say they are more likely to vote for candidates who support these Medicare prescription drug provisions, though these policies are less popular among Republican voters. Eight in ten Democratic voters and half (51%) of independent voters also are motivated to vote for candidates who support climate investments, compared to just one in five Republicans (19%) who say the same.

Majorities Of Democratic And Independent Voters Say They Are More Likely To Vote For A Candidate Who Supports Medicare Prescription Drug Provisions In The Inflation Reduction Act

Methodology

This KFF Health Tracking Poll/COVID-19 Vaccine Monitor Poll was designed and analyzed by public opinion researchers at the Kaiser Family Foundation (KFF). The survey was conducted September 15-26, 2022, online and by telephone among a nationally representative sample of 1,534 U.S. adults including 599 women aged 18 to 49, conducted in English (1,475) and in Spanish (59). The sample includes 1,282 adults reached through the SSRS Opinion Panel either online or over the phone (n=36 in Spanish). The SSRS Opinion Panel is a nationally representative probability-based panel where panel members are recruited randomly in one of two ways: (a) Through invitations mailed to respondents randomly sampled from an Address-Based Sample (ABS) provided by Marketing Systems Groups (MSG) through the U.S. Postal Service’s Computerized Delivery Sequence (CDS); (b) from a dual-frame random digit dial (RDD) sample provided by MSG. For the online panel component, invitations were sent to panel members by email followed by up to three reminder emails. 1,241 panel members completed the survey online and panel members who do not use the internet were reached by phone (41).

Another 252 (n=23 in Spanish) interviews were conducted from a random digit dial telephone sample of prepaid cell phone numbers obtained through MSG. Phone numbers used for the prepaid cell phone component were randomly generated from a cell phone sampling frame with disproportionate stratification aimed at reaching Hispanic and non-Hispanic Black respondents. Stratification was based on incidence of the race/ethnicity groups within each frame. Respondents in the phone samples received a $10 incentive via a check received by mail, and web respondents received a $10 electronic gift card incentive.

The combined cell phone and panel samples were weighted to match the sample’s demographics to the national U.S. adult population using data from the Census Bureau’s 2021 Current Population Survey (CPS). Weighting parameters included gender, age, education, race/ethnicity, region, and household tenure. The sample was weighted to match patterns of civic engagement from the September 2017 Volunteering and Civic Life Supplement data from the CPS and to match frequency of internet use from the National Public Opinion Reference Survey (NPORS) for Pew Research Center. Finally, the sample was weighted to match patterns of political party identification based on a parameter derived from recent multi-mode benchmarking polls conducted by SSRS. The weights take into account differences in the probability of selection for each sample type (prepaid cell phone and panel). This includes adjustment for the sample design and geographic stratification of the cell phone sample, within household probability of selection, and the design of the panel-recruitment procedure.

The online questionnaire included two questions designed to establish that respondents were paying attention. Cases with over 40% item non-response, and cases with a length less than one quarter of the mean length by mode were flagged and reviewed. Cases were removed from the data if they failed two or more of the above quality checks. Based on this criterion, no cases were removed.

The margin of sampling error including the design effect for the full sample is plus or minus 3 percentage points. Numbers of respondents and margins of sampling error for key subgroups are shown in the table below. For results based on other subgroups, the margin of sampling error may be higher. Sample sizes and margins of sampling error for other subgroups are available by request. Sampling error is only one of many potential sources of error and there may be other unmeasured error in this or any other public opinion poll. Kaiser Family Foundation public opinion and survey research is a charter member of the Transparency Initiative of the American Association for Public Opinion Research.

GroupN (unweighted)M.O.S.E.
Total1,534± 3 percentage points
Women
Women ages 18-49599± 5 percentage points
Women ages 50 and older332± 7 percentage points
Race/Ethnicity
White, non-Hispanic864± 4 percentage points
Black, non-Hispanic260± 9 percentage points
Hispanic283± 8 percentage points
Party identification
Democrat622± 6 percentage points
Republican342± 7 percentage points
Independent378± 7 percentage points
Registered voters
Total voters1,291± 4 percentage points
Democratic voters561± 6 percentage points
Republican voters309± 7 percentage points
Independent voters308± 8 percentage points
Parents
Parent with a child ages 6 months through 4 years old179± 10  percentage points
Parent with a child ages 5-11251± 8  percentage points
Parent with a child ages 12-17235± 9  percentage points

Endnotes

  1. The following states had an abortion ban in place during the majority of the survey fieldwork (September 15-26, 2022) and are included in the “States with abortion bans” category: AL, AR, ID, IN, KY, LA, MS, MO, OK, SD, TN, TX, WI, WV. Indiana’s state abortion ban was temporarily blocked by courts on September 22, 2022. Arizona, which is not included in category of “states with an abortion ban” in this report had an abortion ban go into effect on September 23, 2022. For more information on the current status of abortion access in the U.S. please see the KFF Abortion in the U.S. Dashboard. ↩︎
News Release

Few State Medicaid Programs Report Covering a Broad Range of Gender-Affirming Health Services for Adults

Published: Oct 11, 2022

While many state Medicaid programs cover aspects of gender-affirming health services for adults, only Maine and Illinois reported covering five standard gender-affirming services in 2021: hormone therapy, gender-affirming surgery, mental health counseling related to gender-affirming care, voice and communication therapy, and fertility assistance for adult transgender enrollees, according to a KFF survey. Nine states, including Michigan, Connecticut, and Colorado, reported covering four of the five services. Alabama and Texas reported not covering any of these services under Medicaid.

The survey of states on coverage of sexual and reproductive health services for adult enrollees was conducted in Summer 2021. Forty-one states and the District of Columbia responded to the survey.

Despite protections implemented by the Biden administration, several states have recently moved to implement bans or consider actions limiting access to gender-affirming health care, particularly for youth. Coverage of specific services for adults varies and policies like requiring prior authorization can limit access. Additionally, some states do not have policies addressing coverage in their state Medicaid programs, potentially leaving many low-income transgender and nonbinary individuals without a clear path to coverage for medically necessary health services.

Read the brief on the full survey findings

Update on Medicaid Coverage of Gender-Affirming Health Services

Authors: Ivette Gomez, Usha Ranji, Alina Salganicoff, Lindsey Dawson, Carrie Rosenzweig, Rebecca Kellenberg, and Kathy Gifford
Published: Oct 11, 2022

Issue Brief

Transgender and nonbinary adults often face challenges and barriers to accessing needed health services and face worse health outcomes than their cisgender peers. Transgender adults are more likely than cisgender adults to be uninsured, report poor health, have lower household incomes, and face barriers to care due to cost. Given their lower incomes, Medicaid plays an important role in health coverage for transgender people. A 2019 report by the Williams Institute estimated that among the 1.4 million transgender adults living in the United States, approximately 152,000 had Medicaid coverage.

Medicaid is the country’s health coverage program for low-income people and is jointly funded by the federal government and states. Under Medicaid, states must cover certain mandatory benefits, such as inpatient and outpatient services, home health services, and family planning services. While there are no specific federal requirements regarding coverage or exclusion of gender-affirming health care services as a category of Medicaid benefits, there are rules regarding comparability requiring that services must be equal in amount, duration, and scope for all beneficiaries within an eligibility group.

Medicaid benefits are subject to Section 1557 of the Affordable Care Act (ACA), the law’s major non-discrimination provisions, which prohibit discrimination based on sex. The Biden Administration recently proposed a new rule on Section 1557 that explicitly states that it interprets, and will enforce, sex-based protections to include sexual orientation and gender identity. The administration had already asserted this position in guidance stating that under 1557 protections, “categorically refusing to provide treatment to an individual based on their gender identity is prohibited discrimination” and it returns to a position more closely aligned to that under the Obama administration but walked back under the Trump administration.

Despite these protections, some states have recently moved to implement or consider actions aimed at limiting access to gender-affirming health care, particularly for youth. This has included restrictions on coverage of benefits as well as bans on the provision of gender-affirming care by health care providers. A number of lawsuits are pending.

Definitions of Gender Identity
Gender Identity: One’s deeply held, internal sense of self as masculine, feminine, a blend of both, neither, or something else. Identity also includes the name used to convey one’s gender. Gender identity can correspond to or differ from the sex assigned at birth.
Transgender: Somebody who is transgender has a gender identity different from that traditionally associated with sex assigned at birth.
Non-binary: An umbrella term for gender identities that are not exclusively masculine or feminine.
Cisgender: Refers to people whose gender identity aligns with their assigned sex at birth
Gender dysphoria: “A concept [and clinical diagnosis] designated in the DSM-5 as clinically significant distress or impairment related to a strong desire to be of another gender, which may include desire to change primary and/or secondary sex characteristics. Not all transgender or gender diverse people experience dysphoria.”
Gender-affirming care: Gender-affirming care is a model of care which includes a spectrum of “social, psychological, behavioral or medical (including hormonal treatment or surgery) interventions designed to support and affirm an individual’s gender identity.”
SOURCES: Gender Spectrum, The Language of Gender, Accessed October 3, 2022; American Psychiatric Association, What is Gender Dysphoria?, August 2022; OASH Office of Population Affairs, Gender-Affirming Care and Young People, Accessed October 3, 2022.

What gender affirming services do states report covering through Medicaid?

The standards of care for gender-affirming health services set by the World Professional Association for Transgender Health include hormone therapy, surgeries, fertility assistance, voice and communication therapy, primary care, and behavioral health interventions. Additionally, the Endocrine Society supports gender-affirming care in their clinical practice guidelines. Together, these guidelines form the standard of care for treatment of gender dysphoria. Gender-affirming care is highly individualized, and while not all transgender and nonbinary individuals will want or seek any or all of these medically necessary services, limiting access to them can lead to negative and life threating outcomes. Major U.S. medical associations, such as the American Medical Association, the American College of Obstetricians and Gynecologists, the American Academy of Nursing, the American Psychiatric Association, among others, have issued statements underscoring the medical necessity of gender-affirming care.

In a survey of states on coverage of sexual and reproductive health services conducted in Summer 2021, KFF and Health Management Associates (HMA) asked states about coverage of five gender-affirming care services: gender-affirming counseling, hormones, surgery, voice and communication therapy, and fertility assistance for transgender enrollees (Questions presented in Appendix Table 1). Because the survey focused on adult access, states were not asked about puberty blocking hormones. States were asked if a service was covered, excluded from coverage, or whether coverage was not addressed in state policy or statute for adults over the age of 21, as of July 1, 2021. Services that are not addressed in state policy or statute may or may not be covered by the state, or coverage may vary by case. The survey instrument was distributed via email to state Medicaid directors and where applicable, Medicaid agency staff working on women’s health and reproductive health issues. Forty-one states and the District of Columbia responded to the survey. Tennessee responded to the survey but did not answer questions related to gender-affirming services. Survey findings are summarized in Figure 1 and Table 1 and highlights are presented below.

Overall coverage of gender-affirming care:

As detailed below, many state Medicaid programs cover aspects of gender-affirming health services. However, only two of the 41 states responding to this survey, Maine and Illinois, reported covering all five services. Two states, Alabama and Texas, reported they do not cover any of these services under Medicaid.

Gender-Affirming Hormone Therapy:

Gender-affirming hormone drugs include estrogen, anti-androgens, and progestins (feminizing hormones), as well as testosterone and other agents (masculinizing hormones). Under federal law, and subject to exceptions for a few drugs or drug classes, state Medicaid programs are required to cover all drugs from manufacturers that have entered into a rebate agreement with the Secretary of Health and Human services under the federal Medicaid Drug Rebate program. Twenty-five states reported covering gender-affirming hormones, and 10 of these states require prior authorization. Thirteen states said coverage was not addressed in state statute or policy, and three states—Alabama, Hawaii, and Texas —exclude coverage of gender-affirming hormone therapy.

Gender Affirming Surgery:

Gender-affirming surgery can include chest surgery, genital surgery, facial surgery, and other surgical procedures aimed at helping a transgender or nonbinary person transition to their self-identified gender. Not all transgender or nonbinary individuals seek or want surgical treatments. Twenty-three of the 41 responding states reported covering gender-affirming surgery for adults through their state Medicaid programs. Nine states reported coverage was not addressed in state statute or policy, and nine states reported that they excluded gender-affirming surgery from coverage. This survey did not ask states to specify what surgical procedures they cover, but some states provided additional details, which can be found in Appendix Table 2.

Ten of 23 covering states require prior authorization. For example, Colorado requires a clinical diagnosis of gender dysphoria and that the patient has lived in their preferred gender for 12 continuous months. Colorado and Wisconsin also require that the patient has completed 12 continuous months of hormone therapy.

Voice and Communication Therapy

Some transgender people have challenges with developing a voice that matches their gender identity. Voice therapy services can encompass a range of treatments that address pitch, intonation, articulation, pragmatic speech and other aspects of communication.

Thirteen of the 41 responding survey states report that they cover gender-affirming speech or voice therapy services, some requiring prior authorization. Ten of the survey states reported that they exclude coverage for gender-affirming voice therapy services, and 18 states responded that they have not addressed this coverage in their state policy.

Fertility Services:

A broad array of diagnostic and treatment services are available to assist with achieving a pregnancy. Diagnostics typically include lab tests, semen analysis and imaging studies, or procedures of the reproductive organs. Treatment services include medications, reproductive system procedures to allow for pregnancy, and an array of other interventions to help an individual achieve pregnancy, such as intrauterine insemination (IUI) and in-vitro fertilization (IVF). While federal rules require states to cover most prescription medications under Medicaid, there is an exception that allows states to exclude coverage for fertility medications.

Fertility services can be unaffordable without insurance coverage but few states (11) cover services for any beneficiaries, regardless of gender identity. In this survey, just three states (Illinois, Maryland, and Maine) reported covering fertility services as part of gender-affirming care. Of these three states, Illinois is the only one that reported covering services for beneficiaries without exceptions. More than half of states (29) reported that they exclude coverage for fertility services for transgender individuals, and nine states responded that they have not addressed this coverage in their state policy (Table 1).

Mental Health Counseling:

Transgender and nonbinary individuals may seek mental health services to address issues related to their gender identity and transition but may also seek care to address issues that are not related to their gender transitions. As noted, in some cases a diagnosis of gender dysphoria is required before gender-affirming services can be accessed.

Twenty-seven states reported covering mental health counseling and services specifically related to gender affirming health services, 11 states reported coverage was not addressed in their state statute or policy, and three states, Alabama, Kansas, and Texas, reported that they exclude this benefit.

Some states reported requiring that transgender and non-binary Medicaid enrollees receive mental health assessments prior to receiving hormone therapy or having gender-affirming surgeries. For example, Delaware requires prior authorization for mental health counseling related to gender-affirming care, and Connecticut reported that depending on the type of service, prior authorization may be required.

Conclusion

The need for coverage of and access to medically necessary gender-affirming care has been recognized by leading medical and health professional organizations. However, some states have enacted laws banning the provision of gender-affirming health services to youth, and coverage for gender-affirming health services is uneven in state Medicaid programs. In most states, there is variation in coverage for specific services and some states do not have policies addressing coverage in their state Medicaid programs, potentially leaving many low-income transgender and nonbinary individuals without access to medically necessary health services.

Since this survey was conducted, the Biden Administration has proposed a new rule on Section 1557, which is consistent with their prior guidance, and proposes that excluding coverage for gender-affirming care constitutes sex discrimination. In addition, beyond what is stated in rulemaking by the current or previous administrations, some courts have found that the statue itself (i.e., sex non-discrimination provisions) protects against health care discrimination based on gender identity and sexual orientation. For example, a federal district court permanently enjoined the Wisconsin Medicaid program from categorically excluding gender-affirming services from coverage, relying on the statute. Similarly, in recent months, federal courts have ruled the Georgia and West Virginia must cover gender-affirming care in their Medicaid programs. Most recently, in June 2022, Florida’s Medicaid agency announced it would ban coverage of gender-affirming health services in the state. The policy went into effect in August and was challenged in court a few weeks later (with the case still pending). States that do not cover components of gender-affirming care may be in violation of Sec. 1557 of the ACA. However, there are a number of pending legal challenges to the Sec. 1557 rule as well as over specific Medicaid state policies related to coverage of gender-affirming services which will be important to watch moving forward to fully understand this evolving landscape.

Medicaid Coverage of Gender Affirming Health Services
State Medicaid Coverage of Gender-Affirming Health Services, as of July 1, 2021

Appendices

Appendix A: Survey Questionnaire

SECTION III: MEDICAID AND HEALTH SERVICES FOR TRANSGENDER PEOPLE In Table G, use the drop-down boxes in the table below to indicate whether, as of July 1, 2021, the various transgender health services were covered for adults aged 21 and older in the traditional Medicaid program, explicitly excluded from coverage, or whether coverage is not explicitly addressed in statute or administrative policy. Describe limits or utilization controls applied by entering text in the space provided and use the drop-down boxes to indicate if coverage policies are aligned across all eligibility groups (i.e., traditional Medicaid, ACA expansion adults, etc.). If not aligned, please describe coverage policy variations in the comment field at the bottom of the table. Please do NOT include services that are provided by managed care plans as value-added benefits (that is, are not a required state benefit).

Transgender Health ServicesTraditional Medicaid covers as of 7/1/2021?Describe limits or utilization controlsCoverage Policies Aligned all Elig. groups?
1. Gender-affirming surgery
2. Gender-affirming hormone therapy
3. Infertility services, such as fertility preservation or IVF, for transgender individuals
4. Mental health counseling and services related to gender-affirming care
5. Voice and Communication Therapy
Comments on Transgender Health Services coverage, including any coverage policy variations across different eligibility pathways (i.e., ACA expansion adults):

Appendix Table B: Detailed Tables

State Medicaid Coverage of Gender Affirming Health Services, as of July 1, 2021
News Release

Deaths From COVID-19 Spiked Over The Summer, Especially Among People 65 and Older, Before Dipping Again in September

While Overall COVID Deaths Remain Much Lower Than Earlier in the Pandemic, The Share Dying Who Are 65 Or Older (88%) Is The Highest Yet

Published: Oct 6, 2022

Although COVID-19 fatalities remain much lower than during the peak of last winter’s Omicron surge, deaths among people 65 and older spiked over the summer, more than doubling between April and July 2022, finds a new KFF analysis. The number of deaths topped more than 11,000 people 65 and older in both July and August.

For people younger than 65, deaths have increased more slowly since April, rising by 52 percent to about 1,900 in both July and August 2022. While COVID-19 deaths began declining again in September, they remained higher for those ages 65 and older compared to levels in April and May. For those younger than 65, deaths dropped below April levels.

The numbers illustrate that, despite the determination of many Americans to move on and resume normal activities, COVID-19 continues to exact a toll, especially among older adults. As of the week ending October 1, 2022, the United States had lost nearly 1.1 million lives to COVID-19, including about 790,000 people ages 65 and older. Although people 65 and older are 16 percent of the country’s population, they account for 75 percent of all COVID deaths to date.

In fact, since the summer of 2021, COVID deaths among people 65 and older have been growing as a share of all deaths. The nearly 7,100 deaths among this age group in September of 2022 accounted for 88 percent of all COVID deaths that month – the highest share since the pandemic began. (The absolute number of monthly COVID deaths in this age group peaked at more than 85,000 in January 2021.) The new analysis contains detailed data on the number and share of COVID-19 deaths by age in each month of the pandemic.

The recent rise in deaths is primarily a function of increasing cases due to the more transmissible Omicron variant. Other factors include relatively low booster uptake and waning vaccine immunity, underscoring the importance of staying up to date on vaccination, particularly for older adults. Last month public health authorities began encouraging eligible Americans to get new bivalent booster shots recently authorized by the Food and Drug Administration that target both the original strain of the virus and the more recent Omicron subvariants.

A second analysis released today examines COVID vaccination rates among residents and staff of nursing facilities, where the virus poses a particularly strong threat, and finds that although initial vaccination rates for both groups were quite high, take-up of earlier boosters has been lower. (Sufficient data on take-up of the bivalent boosters is not yet available, however.)

More than 85 percent of residents and staff had completed the primary vaccination series as of September 18, 2022. Only 74 percent of all residents and 51percent of all staff (including those who did not complete the primary series) had received one or more booster shots as of that date. Vaccination and booster rates in nursing facilities also varied considerably across the states, among both residents and staff. In 30 states, fewer than half of all staff had received one or more booster shots as of September 18, 2022.

Recent KFF polling shows that public awareness about the new boosters is modest, although older adults — who tend to be at greater risk of serious illness and death — are most likely to know about the new shots. About a third (32%) of all adults say that they’ve either gotten the new booster (5%) or intend to do so as soon as possible (27%). Among older adults (ages 65 and up), nearly half (45%) say they’ve already gotten the new booster (8%) or plan to get it as soon as possible (37%).

For more data and analyses about Medicare Advantage, visit kff.org