KFF designs, conducts and analyzes original public opinion and survey research on Americans’ attitudes, knowledge, and experiences with the health care system to help amplify the public’s voice in major national debates.
Supplemental KFF Questions Added to AP VoteCast Survey Provide Deeper Insight About the Impact of Abortion and Health Care Issues
Health Care Costs Were Among Economic Concerns for Voters Motivated by Inflation, and Abortion Was a Motivating Factor for Many Democratic Voters and Women
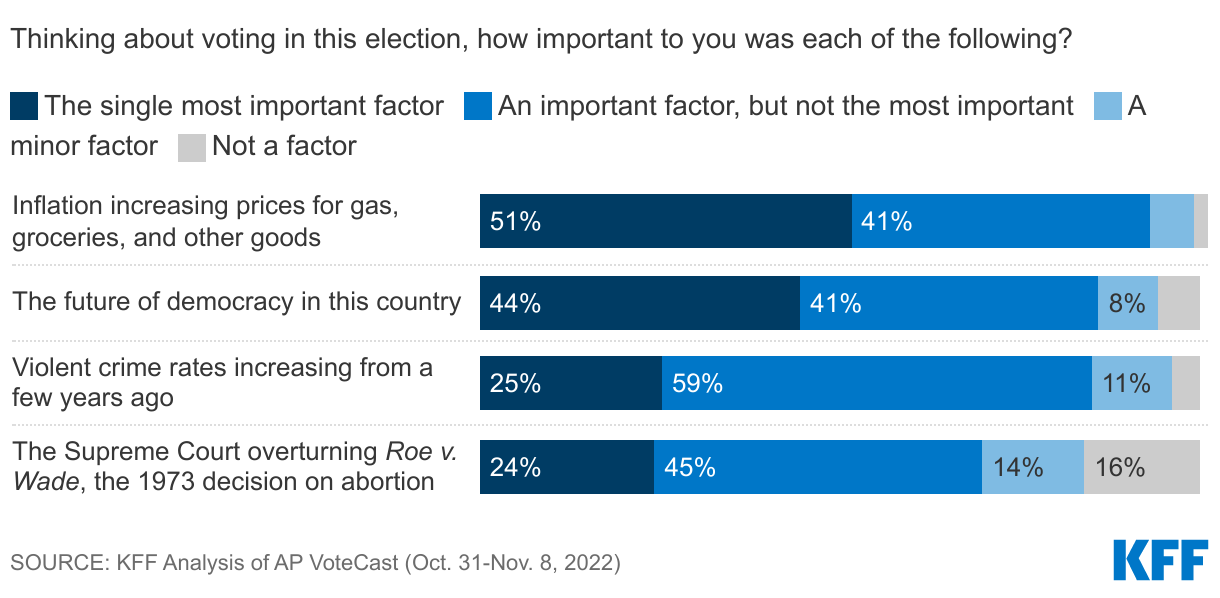
Inflation was widely expected to be the driving issue for voters on Election Day, and poll results bear this out. However, beyond inflation, seven in ten voters said the Supreme Court’s decision to overturn Roe was important to their vote, with one-quarter calling it the single most important factor, half as many as said the same about inflation.
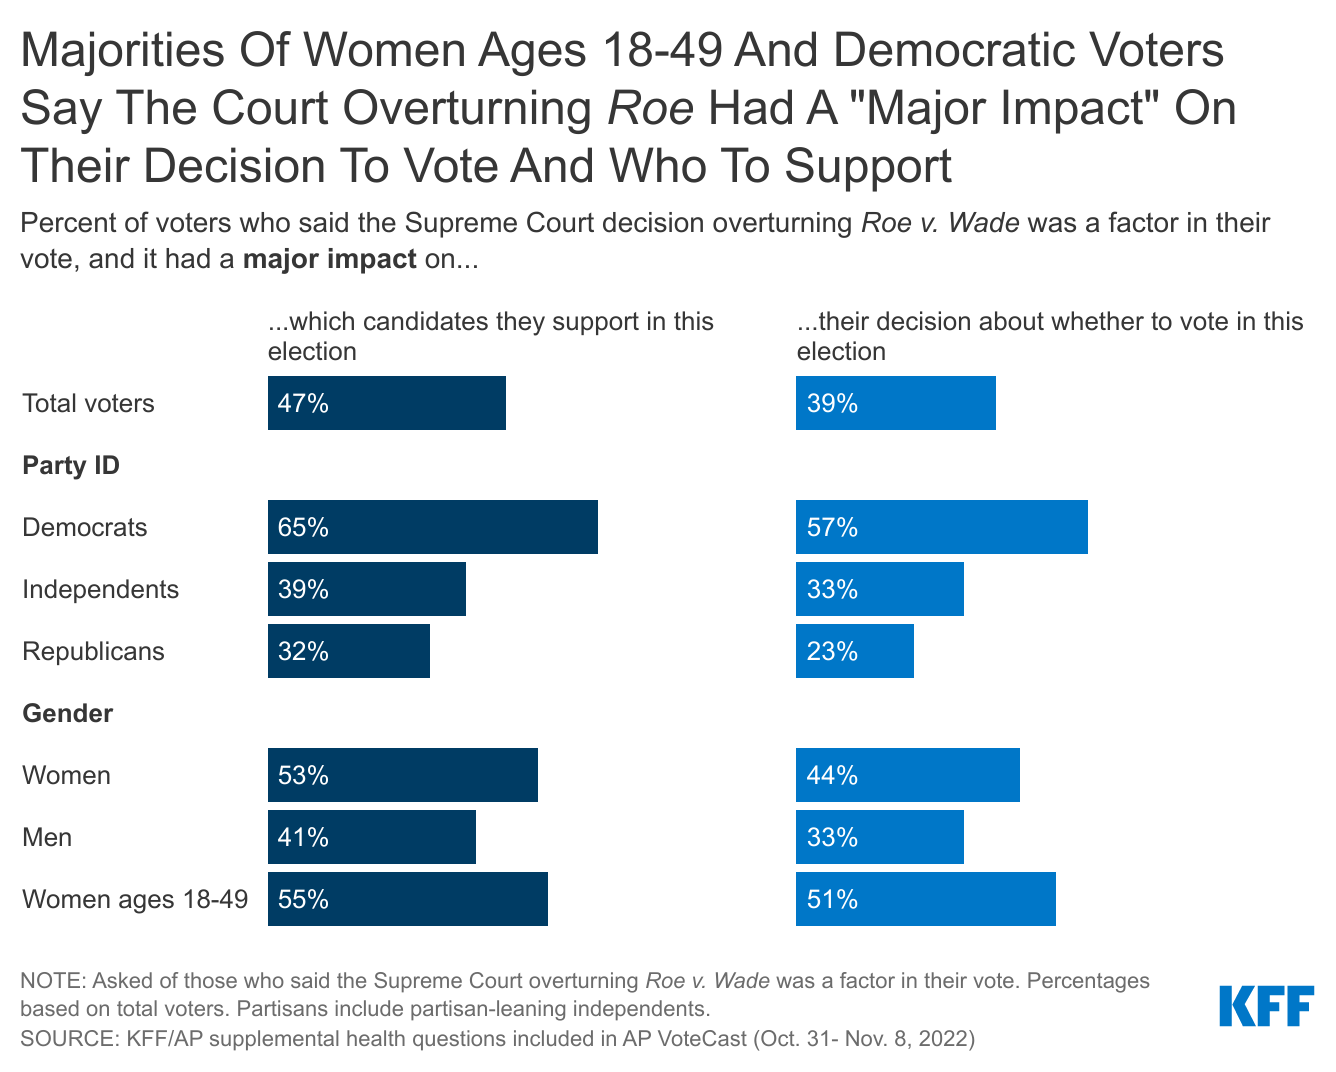
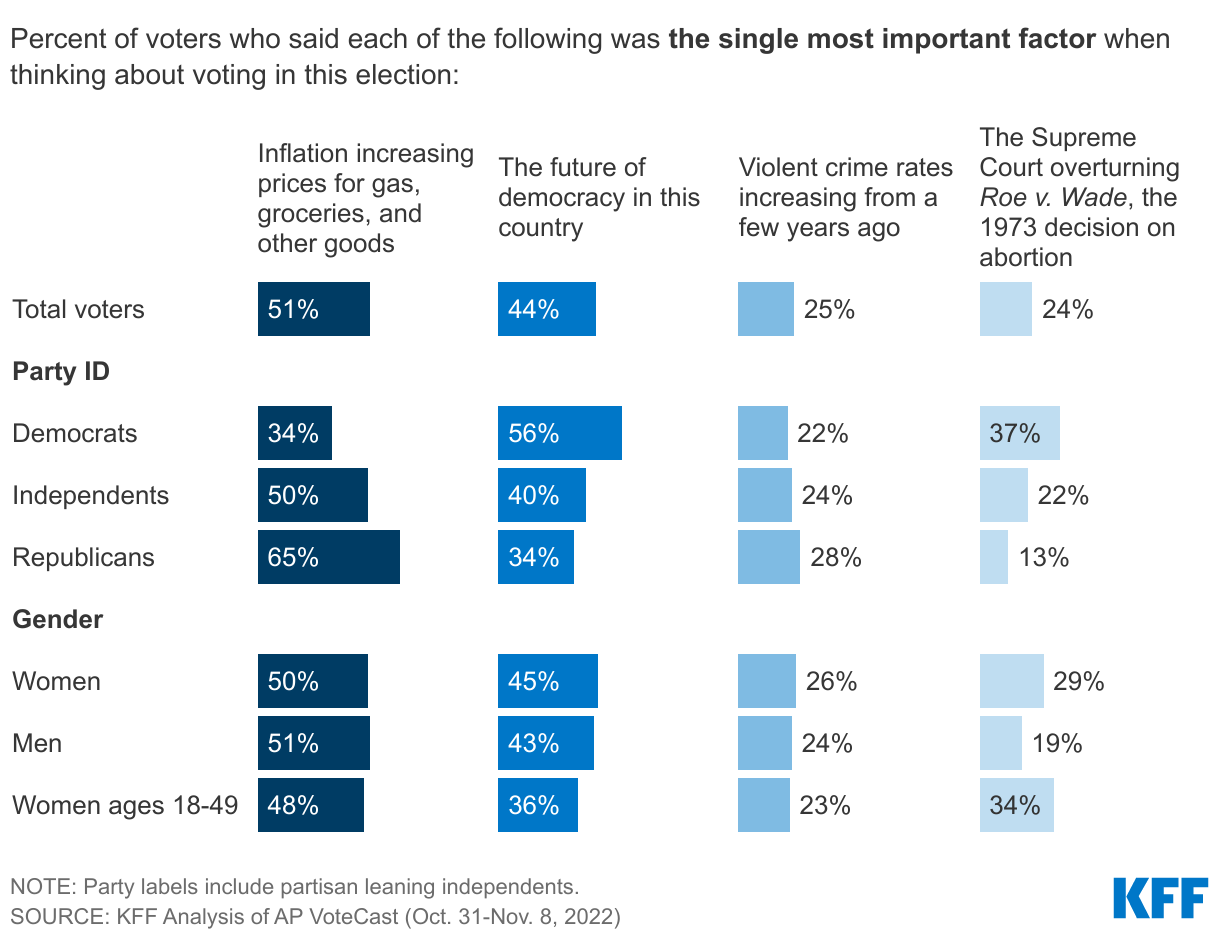
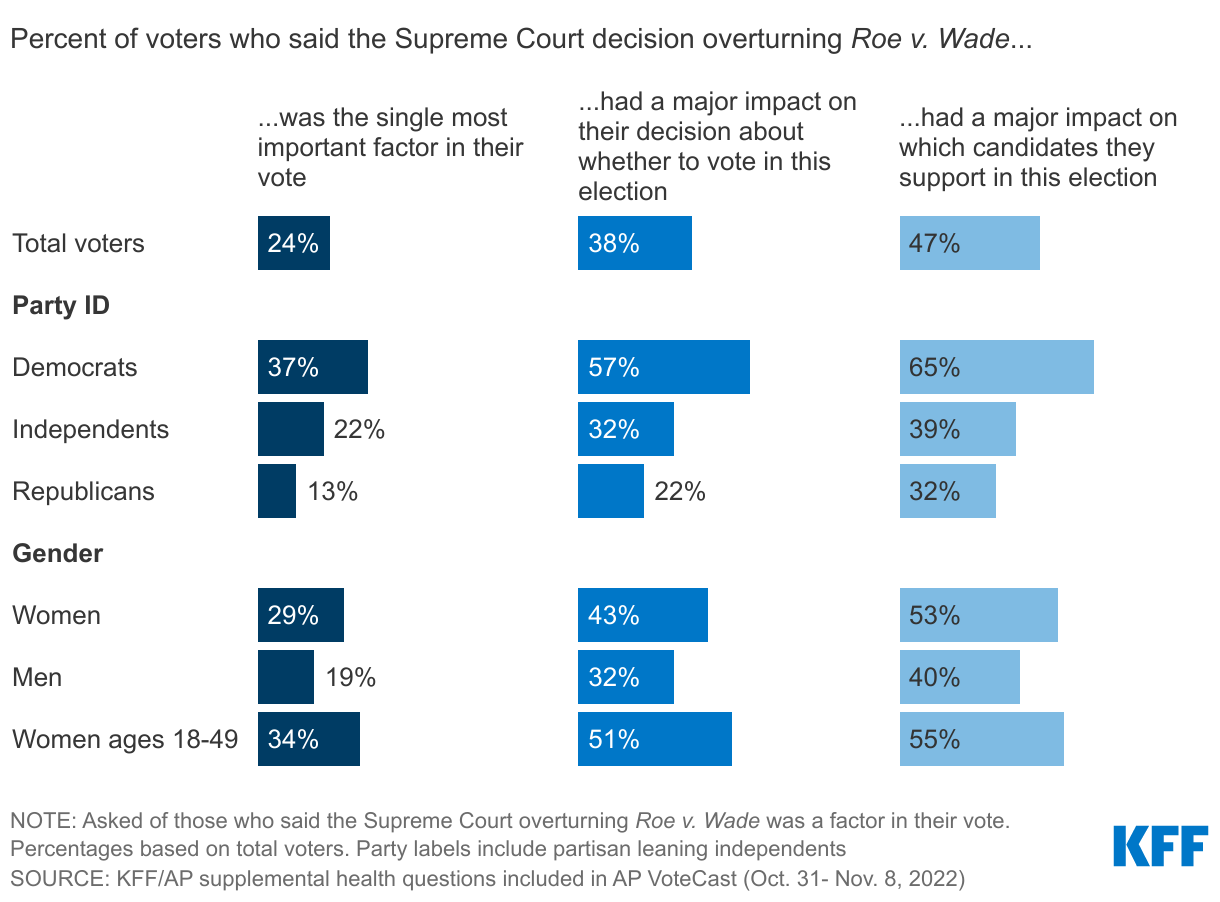
More than half of Democratic voters and women voters under age 50 said the Supreme Court overturning Roe had a “major impact” on which candidates they voted for in this election as well as their decision about whether to turn out to vote.
KFF, in partnership with the Associated Press (AP), examined the role that health care played in the 2022 midterm election by adding supplemental questions to the AP VoteCast survey of midterm voters. These questions and KFF’s analysis examine the role health care costs play in voters’ concerns around inflation as well as the impact that the Supreme Court decision overturning Roe had on their decision to vote and who to vote for.
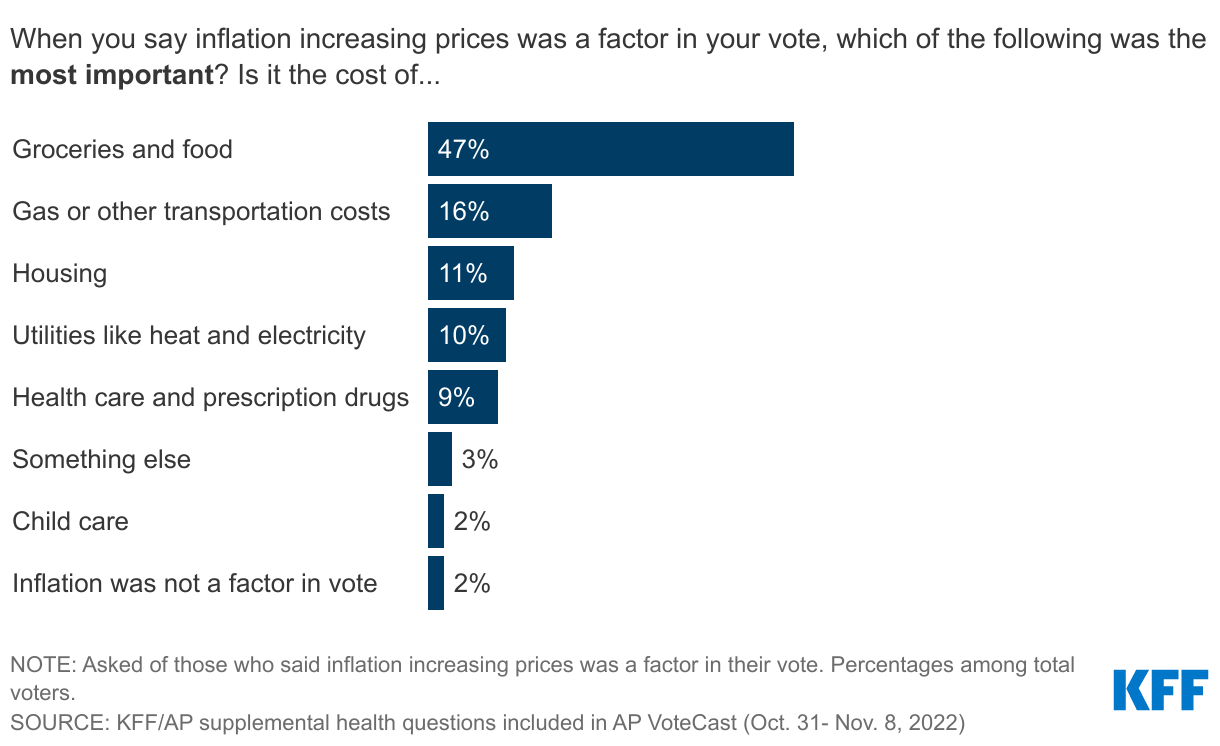
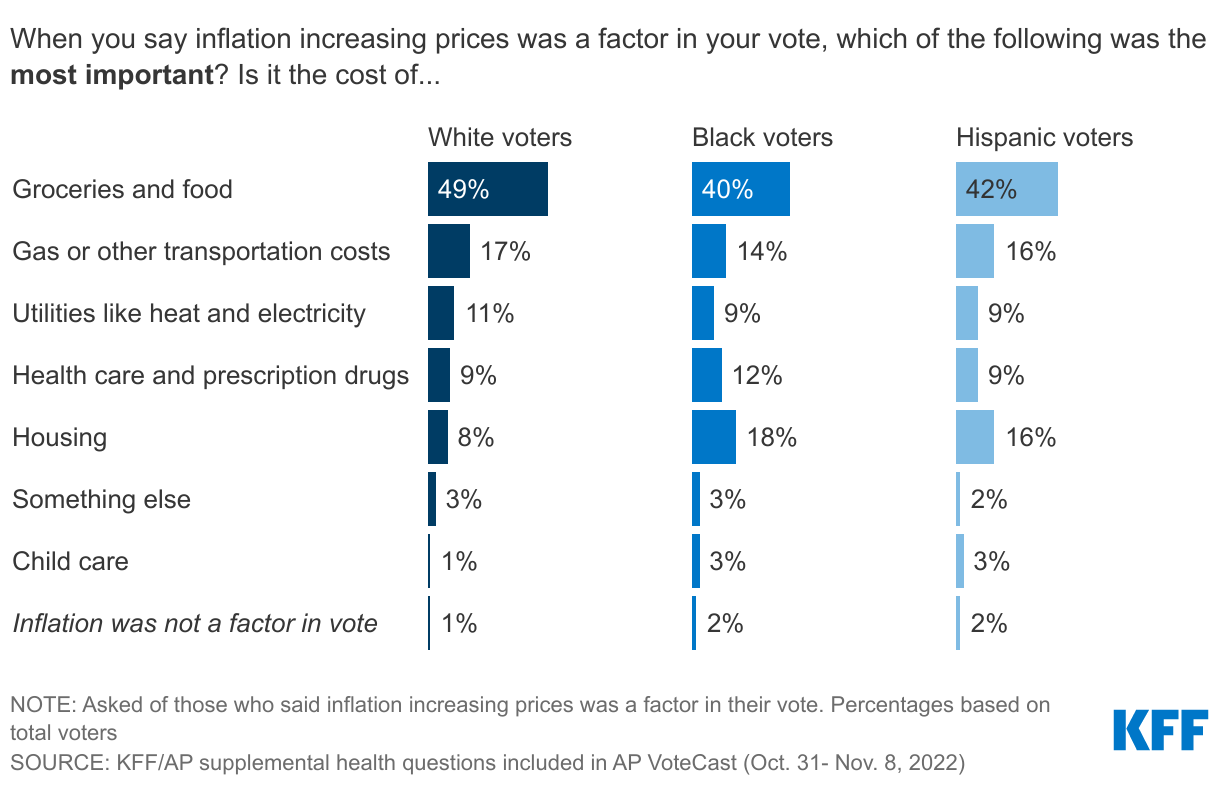
Despite the clamor about gas prices, the high cost of food was by far the top inflation-related concern that voters said was a factor in their vote. Health and prescription drug prices were also in the mix, just trailing gas prices and about the same as utilities and housing costs, underscoring that voters see health as a pocketbook issue.
Available through an online interactive dashboard, KFF provides data and analysis of the overall AP VoteCast survey and these supplemental questions at both the national and state level. The dashboard includes:
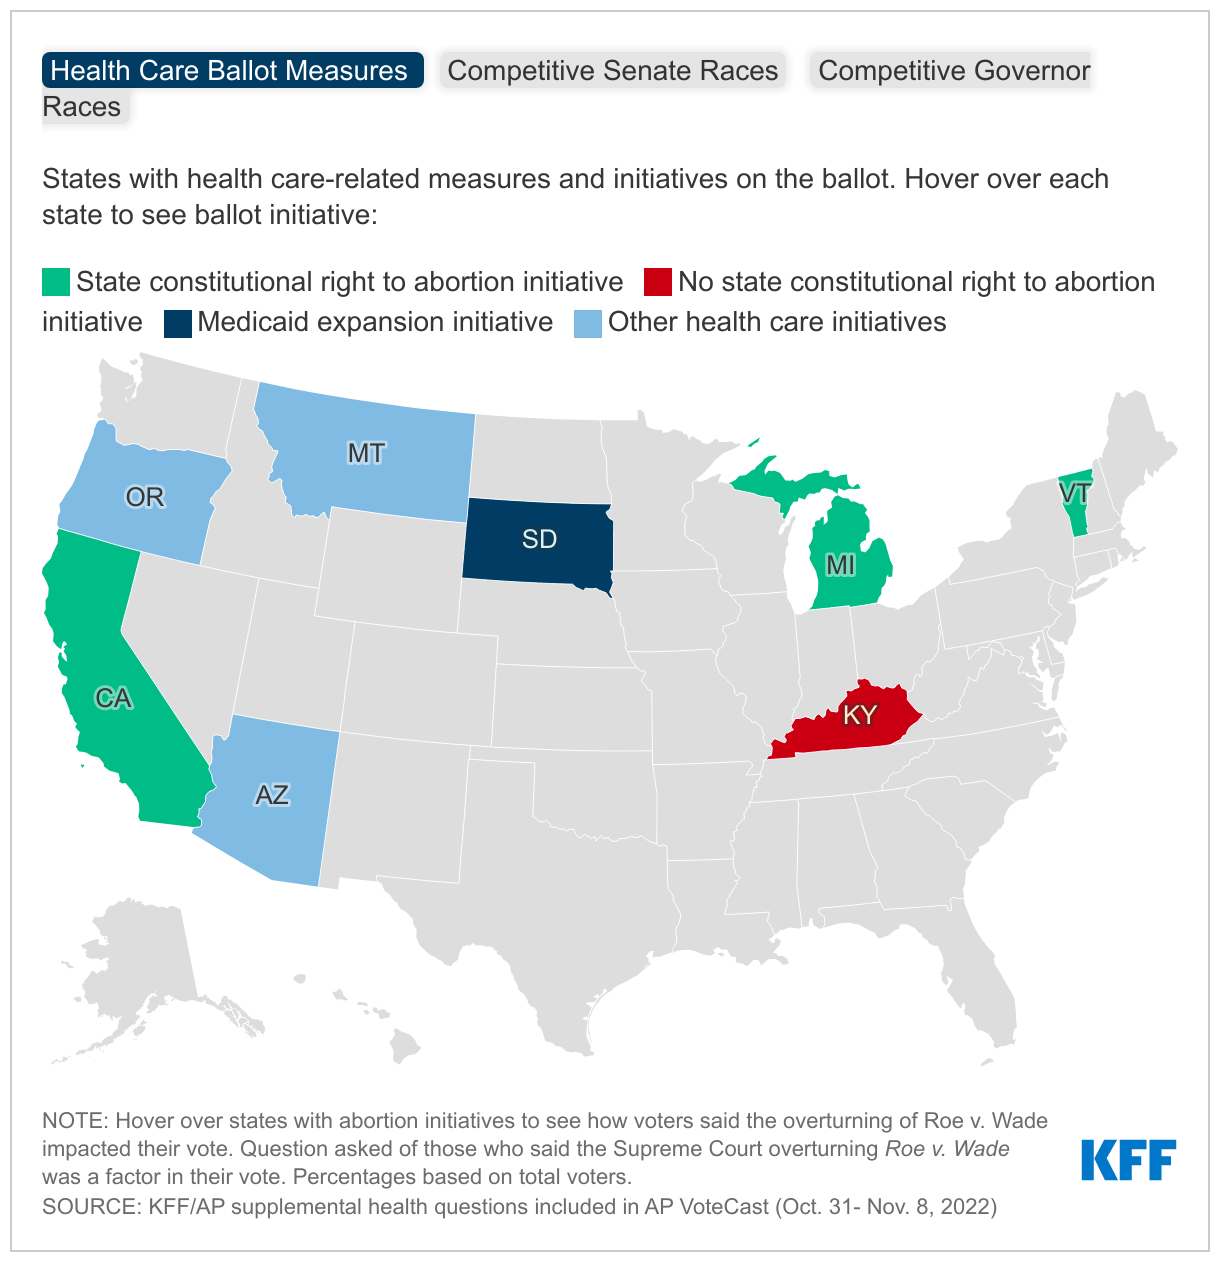
An interactive map for a closer look at states with health-related ballot measures and those with competitive Senate and governor races to examine the role of abortion in motivating voters in those states.
A block of charts looking at the motivations of voters and the impact of the Supreme Court decision on Roe in states which had abortion ballot initiatives on the ballot.
A curated set of charts providing key analysis among subgroups of voters on topics like abortion ballot measures, issues in competitive races, and voters’ views of the most important issues facing the U.S., including where health care ranks compared to other issues.
The AP VoteCast is a national survey and 48 state surveys of 2022 midterm voters conducted by NORC at the University of Chicago for the AP and Fox News beginning on Oct. 31 and concluding as polls closed on Nov. 8, 2022, in English and Spanish. The national survey was conducted using the NORC’s probability-based AmeriSpeak panel, while the individual state surveys were conducted from a random sample of state voter files and from self-identified registered voters selected from non-probability online panels. More details are available about AP VoteCast’s methodology.
In recent weeks, cases of respiratory syncytial virus (RSV) in younger children have surged, and the Centers for Disease Control and Prevention (CDC) has reported seeing early increases in seasonal flu cases. The CDC notes that the past two years have seen low flu activity, likely meaning reduced population immunity headed into this years’ flu season, especially among young children who have never been exposed to or vaccinated against the flu. Winter could also bring an increase in COVID-19 cases, as the weather gets colder and activities move indoors. While children’s cases of COVID-19 are usually mild, this is not always the case, and children are particularly vulnerable to flu and RSV. The combination of all three could have more serious ramifications for children and also has the potential to overwhelm hospitals. Vaccination against COVID-19 and flu can provide protection; however, COVID-19 vaccination rates have stalled and remain low for younger children and other routine vaccination rates may have been impacted by the pandemic. This policy watch describes recent trends in children’s COVID-19 and routine vaccinations and explores strategies to increase vaccination rates among children as we head into the winter season.
COVID-19 vaccine uptake among children has stalled and vaccination rates remain low for young children. As of November 2, 2022, 3.2% of children under age five and 31.8% of children ages 5-11 had completed their primary series, which is the initial doses of a COVID-19 vaccine, most commonly two shots of a mRNA vaccine but can vary by age, immune status, and vaccine product (Figure 1). Uptake is higher among those ages 12-17, at 61.1%. Some of this variation in uptake reflects the amount of time since COVID-19 vaccines were authorized by the FDA for different age groups. The vaccine was first authorized for 16 and 17 year-olds in December 2020 and for 12-15 year-olds in May 2021. It was authorized for 5-11 year-olds in November of 2021 and finally, for children under age five in June of 2022. However, some of it reflects parental views and concerns. KFF’s COVID-19 Vaccine Monitor from September 2022 reported that over half (53%) of parents of children under five and over a third (35%) of parents of children ages 5-11 said they will “definitely not” get their child vaccinated. KFF surveys from July 2022 found parents of young children were concerned about the newness of the vaccine and not enough testing or research, side effects, and worries over the overall safety of the vaccines.
Bivalent boosters were recently authorized for children ages five and older, but it is unclear how many children will get the new booster. Children’s vaccination rates for the first booster (no longer authorized) were low. As of November 2nd, 5.3% of children ages 5-11 and 18.2% of children ages 12-17 had received their first booster dose. Completion of the primary series at least two months earlier is required to receive the new bivalent booster; thus, low primary series rates, especially among children ages 5-11, means fewer children are eligible for the new booster. As of November 2nd, 0.5% of children ages 5-11 and 2.6% of children ages 12-17 have received an updated (bivalent) booster dose. While children usually have more mild COVID-19 cases, some children do develop severe illness and some have shown symptoms of long COVID following diagnosis. Boosters combat waning immunity and can help reduce the risk of infection and onward transmission.
The pandemic has also led to declines in children’s flu vaccinations, though the impact of the pandemic on other routine vaccinations remains uncertain. While children’s flu vaccination rates from last year’s flu season (2021-2022) were similar to the previous year (2020-2021), they were almost 6 percentage points lower than in 2019-2020, right before the pandemic began. Flu vaccination rates among children vary widely by state and appear to be correlated with COVID-19 vaccination, meaning states with higher uptake of flu vaccination last season also have higher uptake of COVID-19 vaccination, and vice versa (Figure 2). Some public health leaders have expressed concern that COVID-19 vaccine hesitancy may be spilling over to routine child immunizations, and one study found factors impacting COVID-19 vaccine uptake could be impacting flu vaccine uptake. In addition, vaccination rates for other routine childhood vaccines also declined early in the pandemic, and the CDC reports vaccination coverage of all state-required vaccines for children in kindergarten (MMR, DTaP, and varicella) declined slightly by 1% in the 2020-2021 school year (the first full-pandemic school year) compared to the previous school year. Somestates and local areas have more recently reported seeing reduced childhood immunization rates. However, CDC data for the most recent two school years are not yet available, and the overall impact on childhood routine vaccination rates remains unclear at this time.
There are specific policy considerations for vaccinating young children, and some states have developed successful strategies for increasing vaccination rates among children. States with the highest COVID-19 vaccination rates among children ages 5-11 used incentives, school-based vaccination clinics, parent-friendly websites, and the media to encourage parents to vaccinate their young child. School vaccine mandates can also be used as a tool to increase COVID-19 vaccine uptake among children, but at this time, only a few states have COVID-19 vaccine mandates for school staff or students. Preventive care appointments are also an important component when addressing routine vaccination rates, as some parents may not encounter an offer of a vaccine until they go in for a routine visit to a pediatrician and pediatricians are considered highly trusted sources of information by parents. Recently, the CDC’s Advisory Committee on Immunization Practices (ACIP) voted to add the COVID-19 vaccines to the recommended pediatric immunization schedule that includes the other routine vaccines for children depending on age. This is part of a regular, annual process in which ACIP meets to vote on adding newly recommended vaccines to the child and adult immunization schedules.
Because Medicaid covers four in ten children in the U.S., the program can play an important role in facilitating access to COVID-19 and other routine vaccines for children, especially those who are low-income. To increase COVID-19 vaccine uptake, state Medicaid programs and Medicaid managed care plans have undertaken various initiatives, including financial incentives for managed care plans that meet vaccination targets. Other recent federal actions can help increase routine vaccination rates more broadly. Data for children enrolled in Medicaid and CHIP showed a 9% decline in all routine vaccinations when comparing the COVID-19 public health emergency (PHE) period (March 2020 – April 2022) to a pre-PHE period (January 2018 – February 2020), with the largest declines for HPV, hepatitis A, and flu vaccines. Provisions included in recent legislation to bolster Medicaid’s Early and Periodic Screening, Diagnostic and Treatment (EPSDT) benefit can help more Medicaid-covered children receive all recommended screenings and services, which includes routine vaccinations. Further, the Child Core Set measures, designed to improve the quality of care for children in Medicaid and CHIP, will become mandatory to report in 2024 and track state-level immunization rates for children and adolescents.
Children will still be able to access needed COVID-19 vaccines for free following the end of the COVID-19 PHE and even when federal supplies of vaccines run out. While the end of the PHE as well as the depletion of federally-purchased supply could curtail access to some COVID-19 countermeasures like tests and treatments, COVID-19 vaccines, including boosters, will continue to be available for free to all children even when there is no longer any federally-purchased supply remaining or PHE protections in place. Once the supply of government-purchased vaccines runs out, the Vaccines for Children program (VFC) will provide access to COVID-19 vaccines for children who have Medicaid, who are uninsured or underinsured, or identify as American Indian or Alaska Native. While vaccines are free through the VFC program, participating health care providers can charge an administrative fee. Children who are uninsured may be eligible for free or reduced cost off vaccine administration through a community health center.
As we head into the winter season, RSV and other respiratory viral infections are surging in young children, flu infections are higher than usual for the time of year, and COVID-19 cases are also expected to rise. At same time, children’s COVID-19 vaccination rates have stalled and remain low, and other routine children’s vaccinations may have also declined since the pandemic began. While most children have mild COVID-19 cases, vaccines can offer protection for children and families as travelling and gatherings ramp up for the holiday season. Various tools, including incentives, outreach, and the media, can be used to increase children’s COVID-19 vaccination rates as well as routine vaccinations more broadly.
This interactive dashboard provides insights from AP VoteCast election polling of the 2022 midterm elections, taking a closer look at the role that health care issues may have played in voters’ decisions. Updated: 5pm ET on 11/14/2022.
Half Of Voters Say Inflation Was The Single Most Important Factor In Their Vote, While A Quarter Say Overturn Of Roe Was Most Important
Inflation Is The Top Issue For Most Voters, While A Third Of Women Under 50 Say The Supreme Court Overturning Roe Is Single Most Important Factor In Their Vote
More Than Half Of Democratic Voters And Younger Women Voters Say Supreme Court Decision Had Major Impact On Their Voting Decision
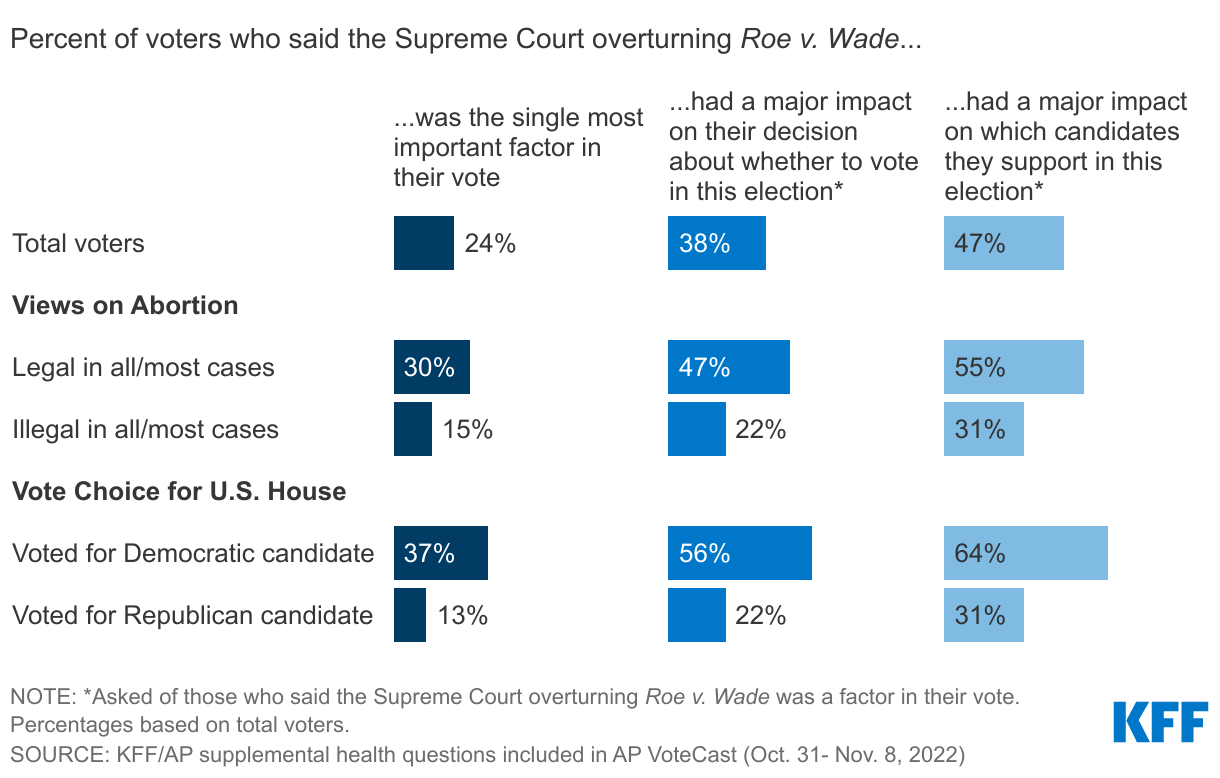
Voters Who Say Abortion Should Be Legal, Voted For Democratic House Candidates More Likely To Say Supreme Court Decision Mattered In Their Vote
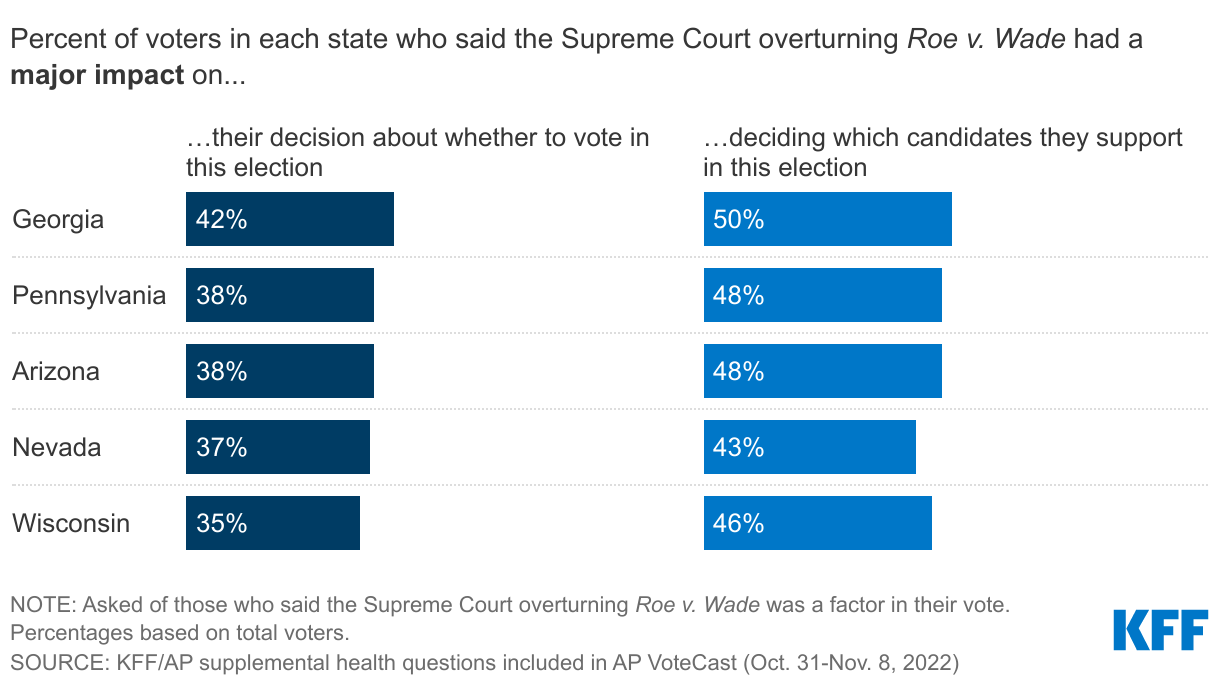
About Four In Ten Voters Across States With Abortion On Their Ballot Say Overturning Roe Had A Major Impact On their Decision To Turn Out To Vote
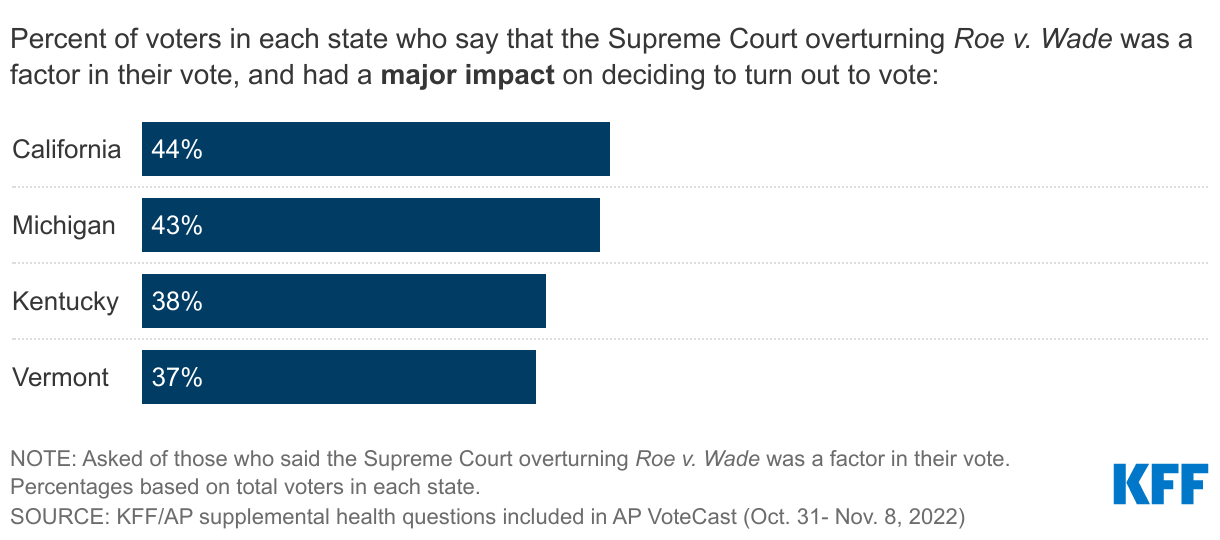
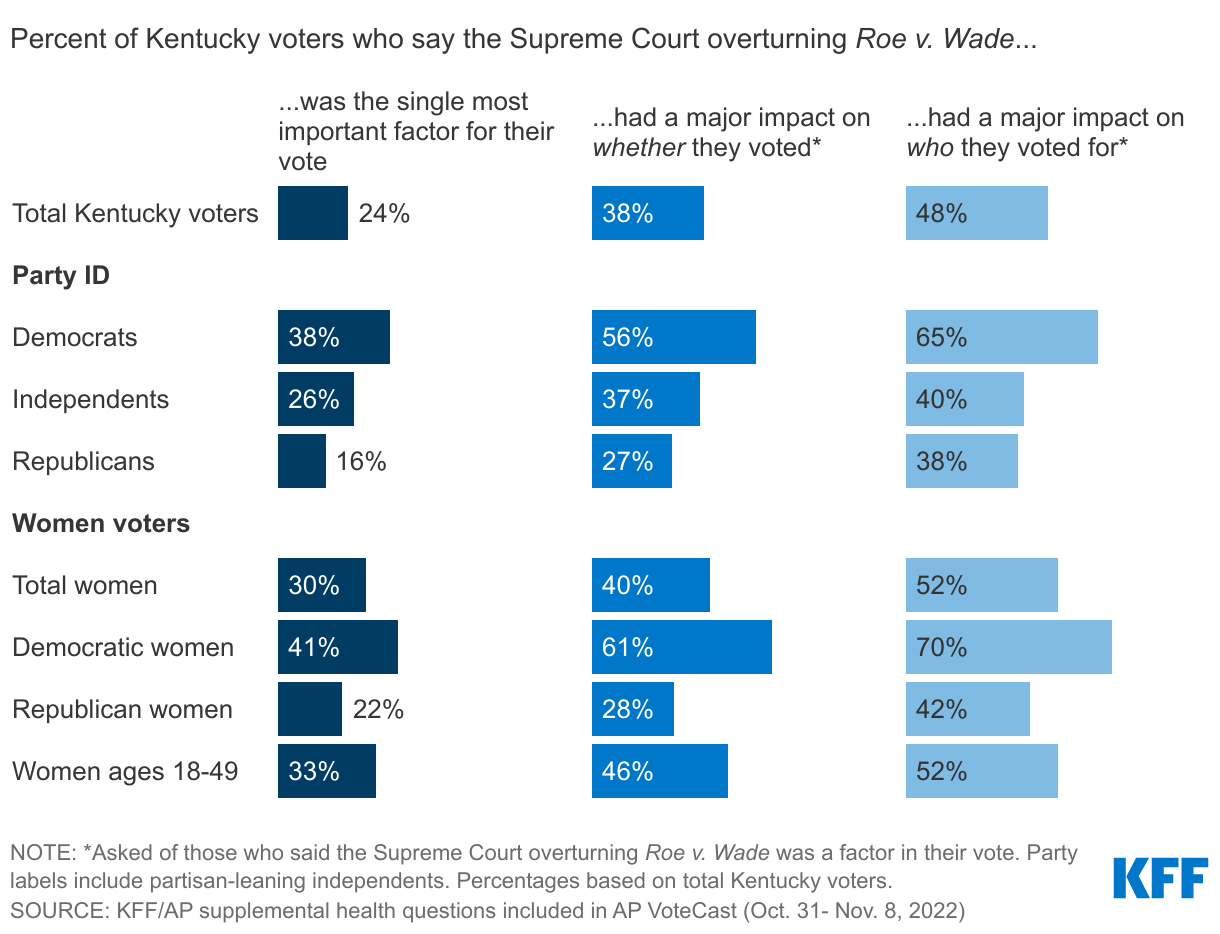
Four In Ten Kentucky Voters Say Supreme Court Decision Had Major Impact On Whether They Turned Out To Vote, Including Six In Ten Democratic Voters
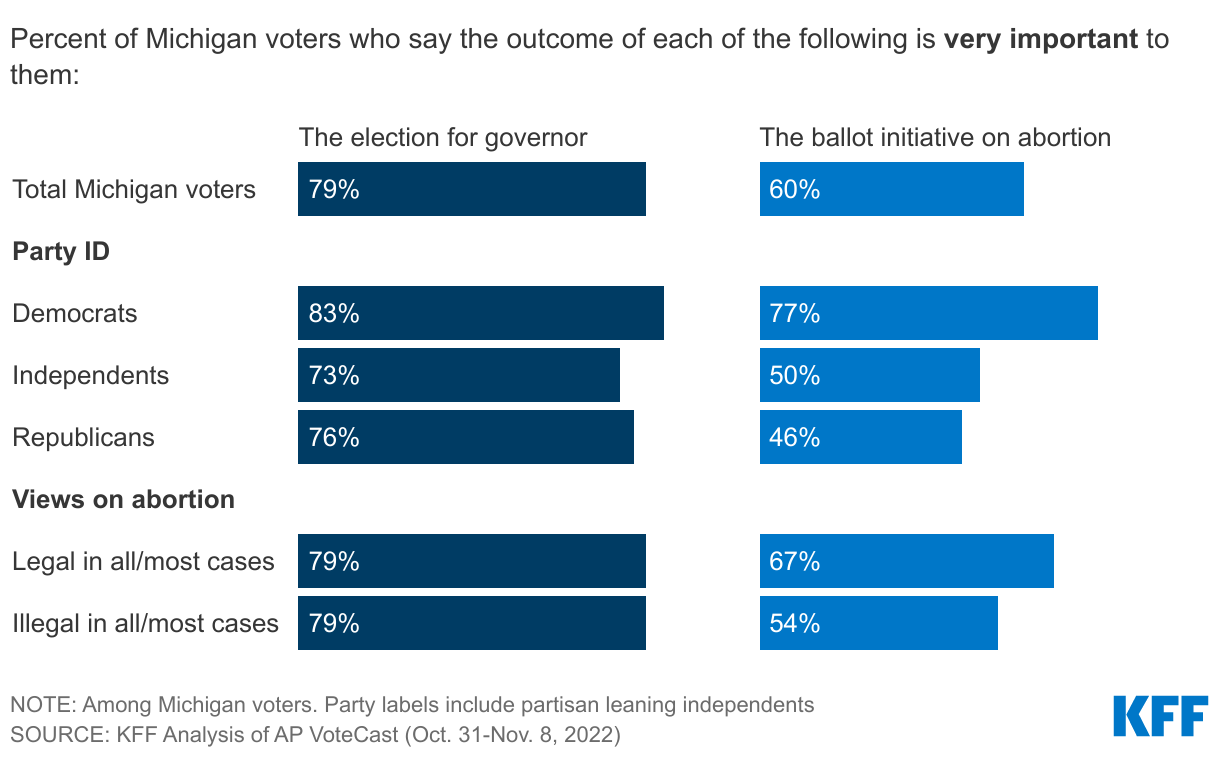
Majorities Of Michigan Voters Say Both Outcome Of Abortion Ballot Initiative And Governor Race Was Very Important
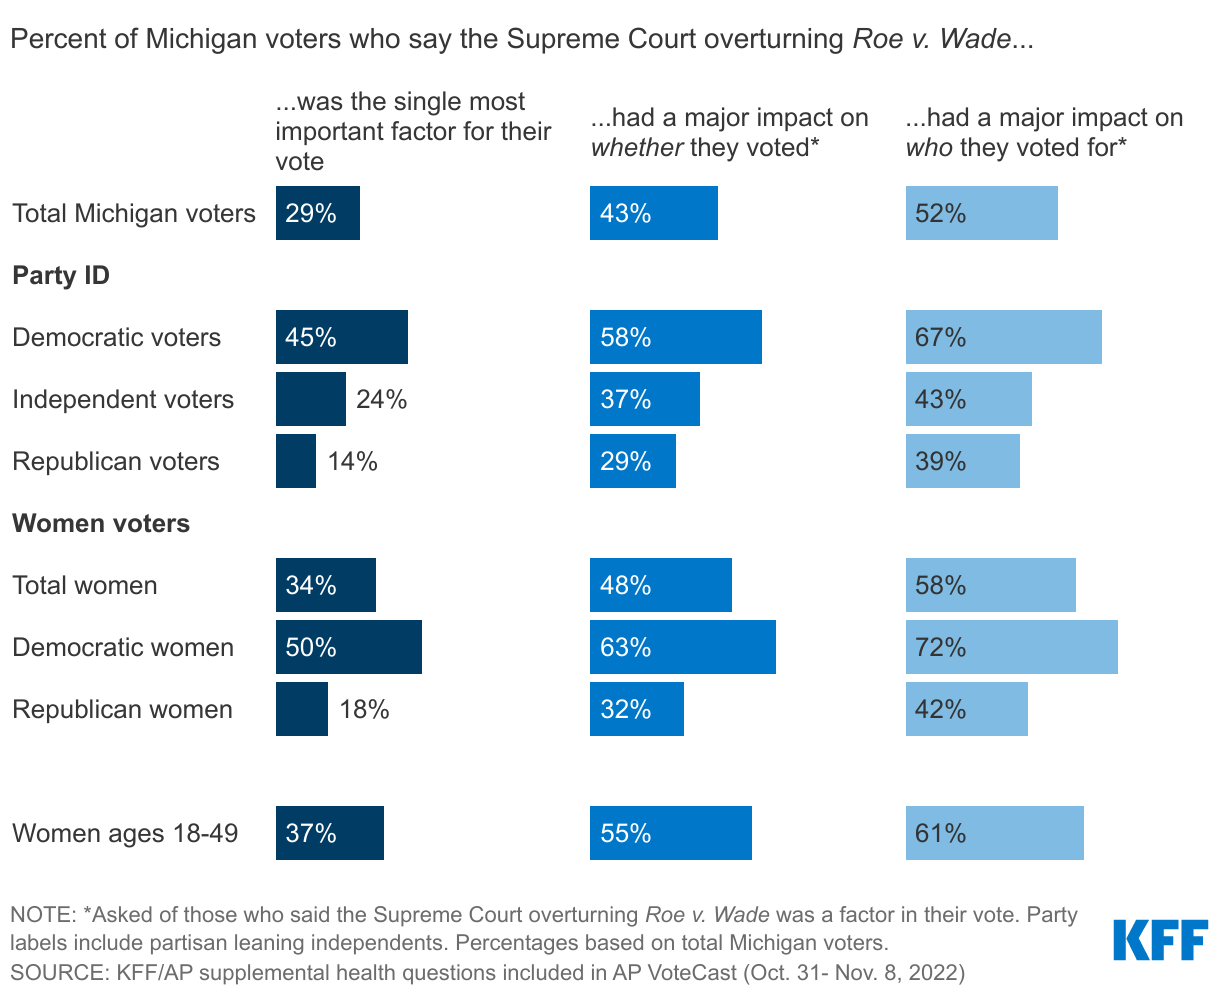
Large Shares Of Democratic Women Voters In Michigan Say The Supreme Court Overturning Roe Had A Major Impact On Their Vote
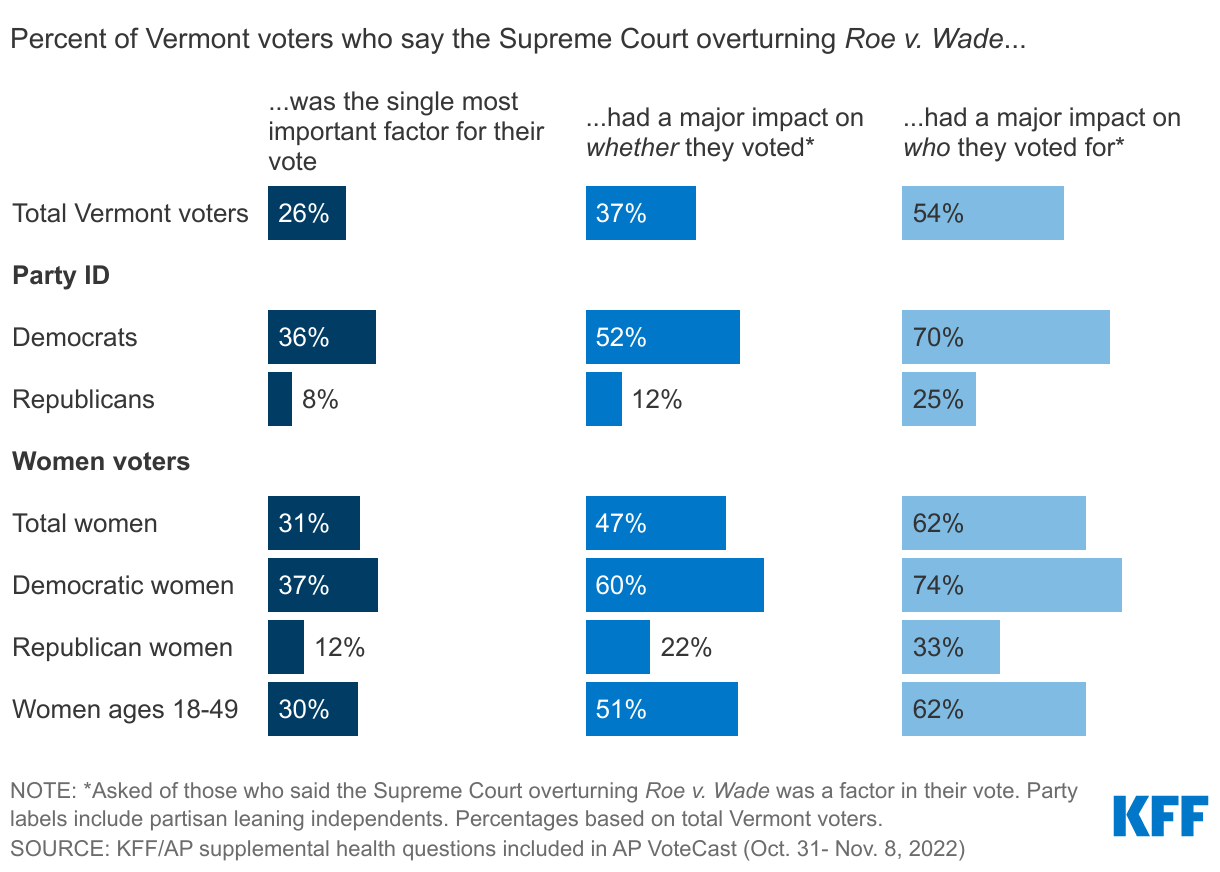
About One-Fourth Of Vermont Voters Say Supreme Court Overturning Roe Was Most Important Factor In Vote
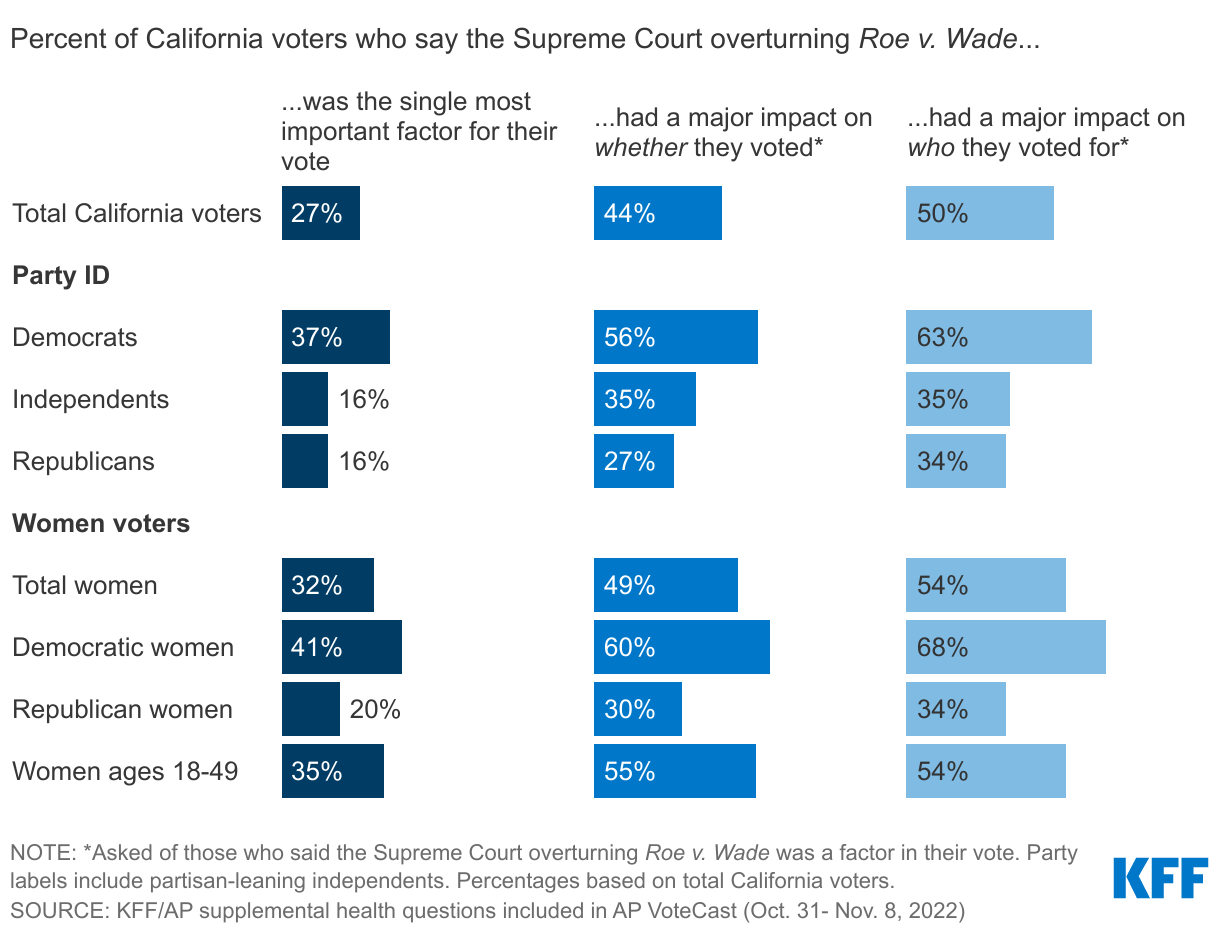
Nearly Three In Ten California Voters Say Supreme Court Overturning Roe Was Most Important Factor In Their Vote, More Than Half Of Democratic Voters In State Say It Had Major Impact
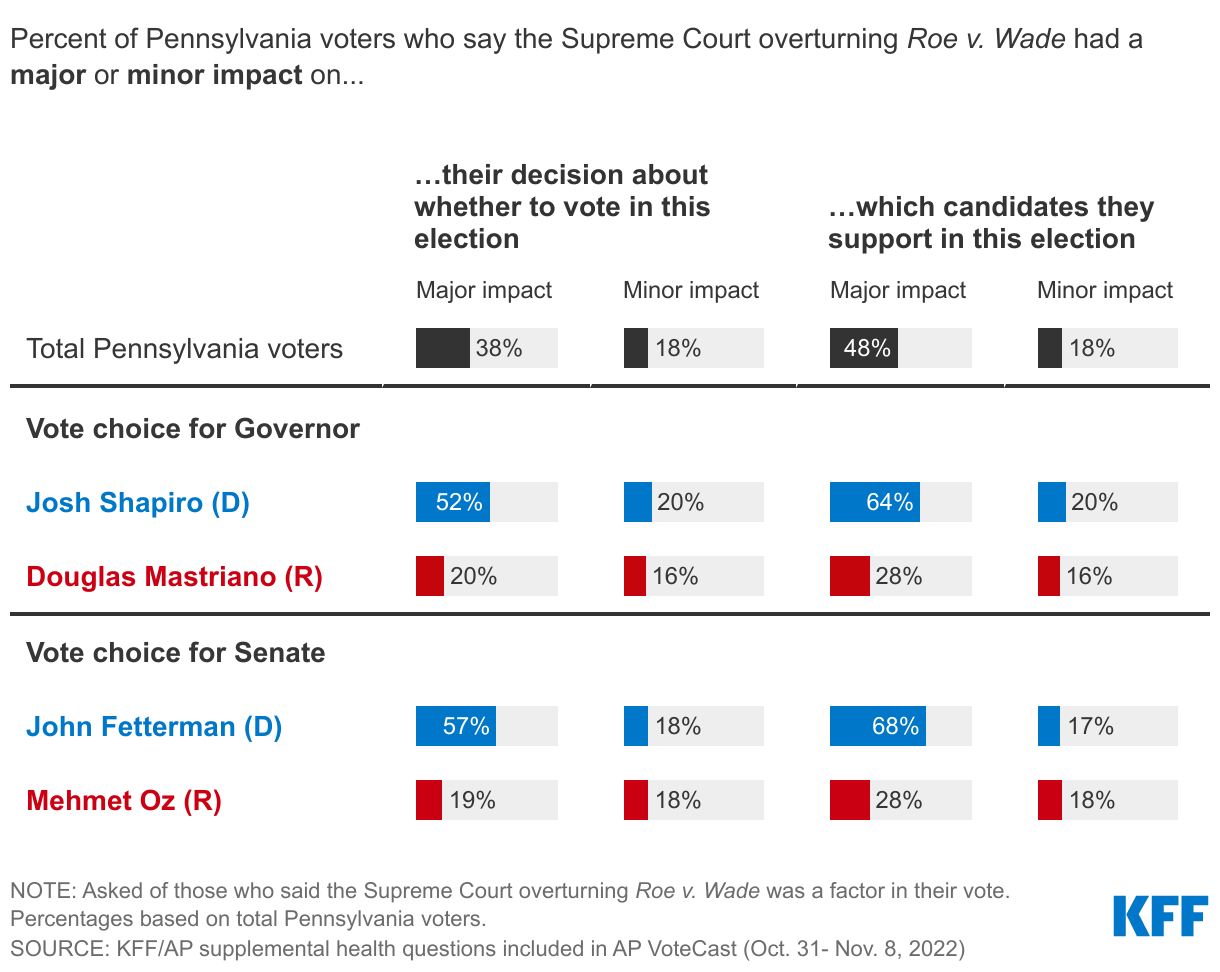
In Pennsylvania, Large Shares Of Voters Of The Democratic Candidates Say Their Decisions Were Majorly Impacted By The Supreme Court Decision On Roe v. Wade
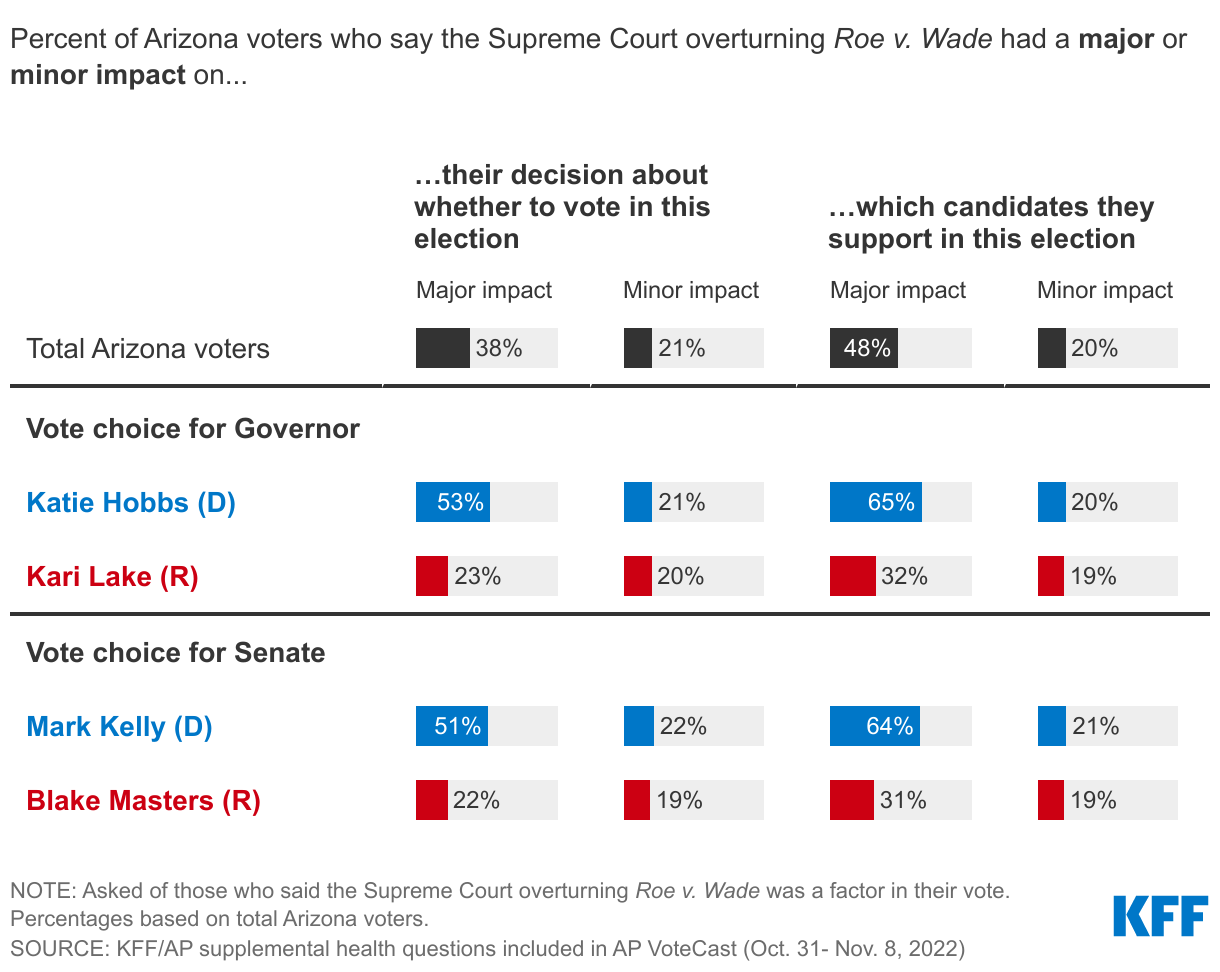
Nearly Half Of Arizona Voters Say Supreme Court Decision Had A Major Impact On Their Candidate Choice In This Election, Including Two-Thirds Who Voted For Democratic Candidates
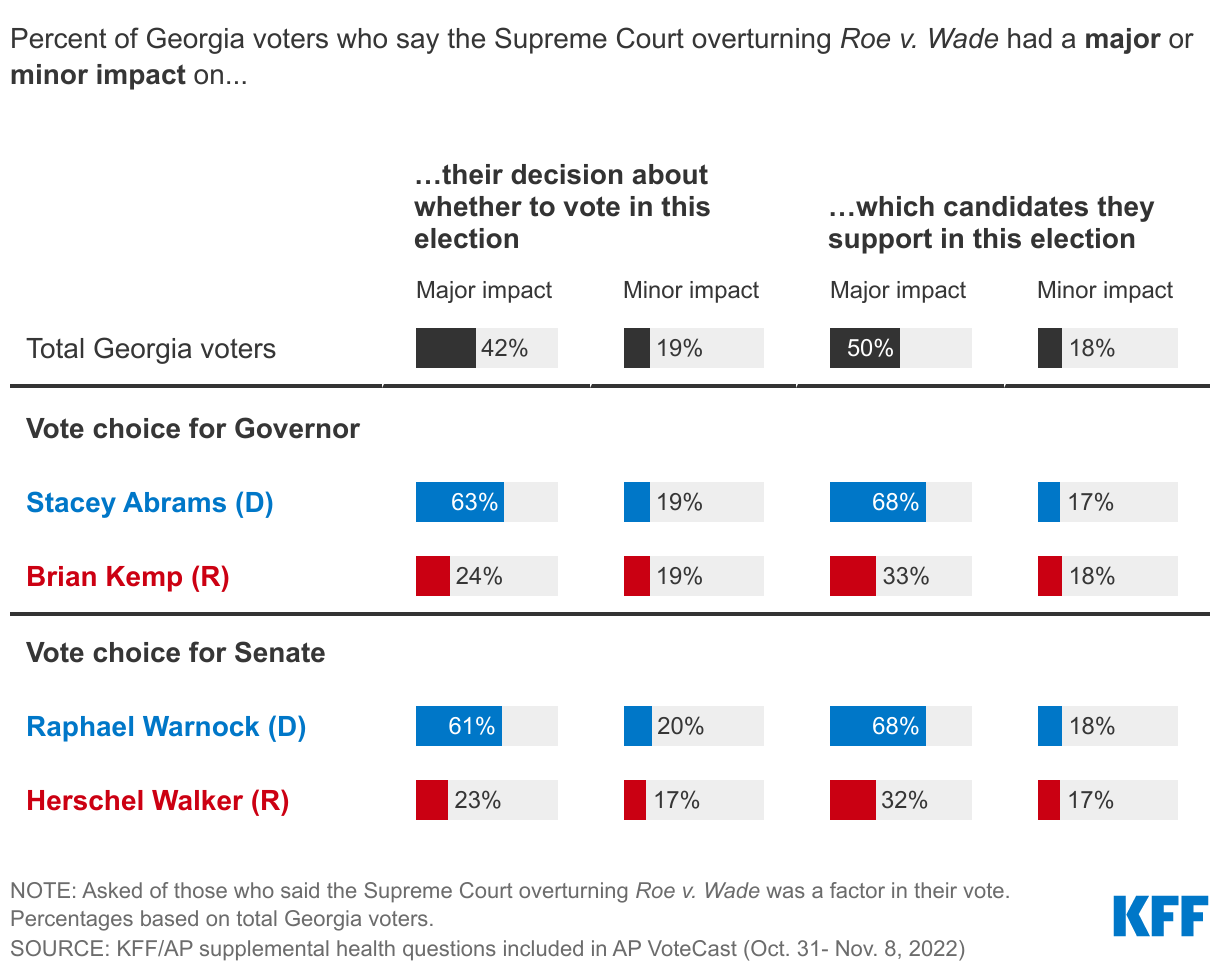
Two-Thirds Of Voters For Stacey Abrams (D) and Raphael Warnock (D) Say The Supreme Court Overturning Roe Was A Major Factor In Their Candidate Choice
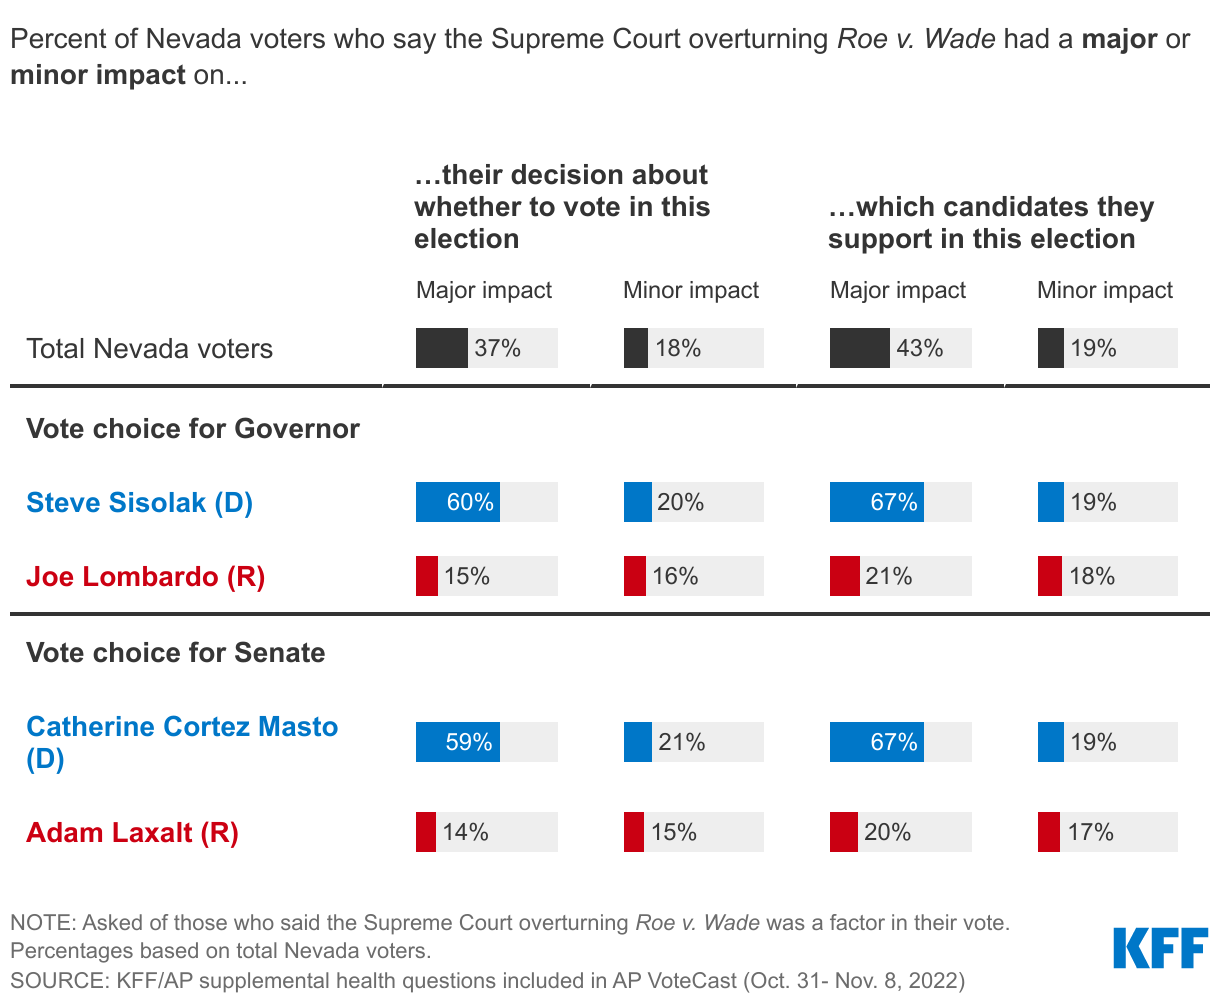
At Least Three Times As Many Voters For Democratic Candidates In The Nevada Midterms Say Roe Had A Major Impact On Their Decision To Turnout And Candidate Choice
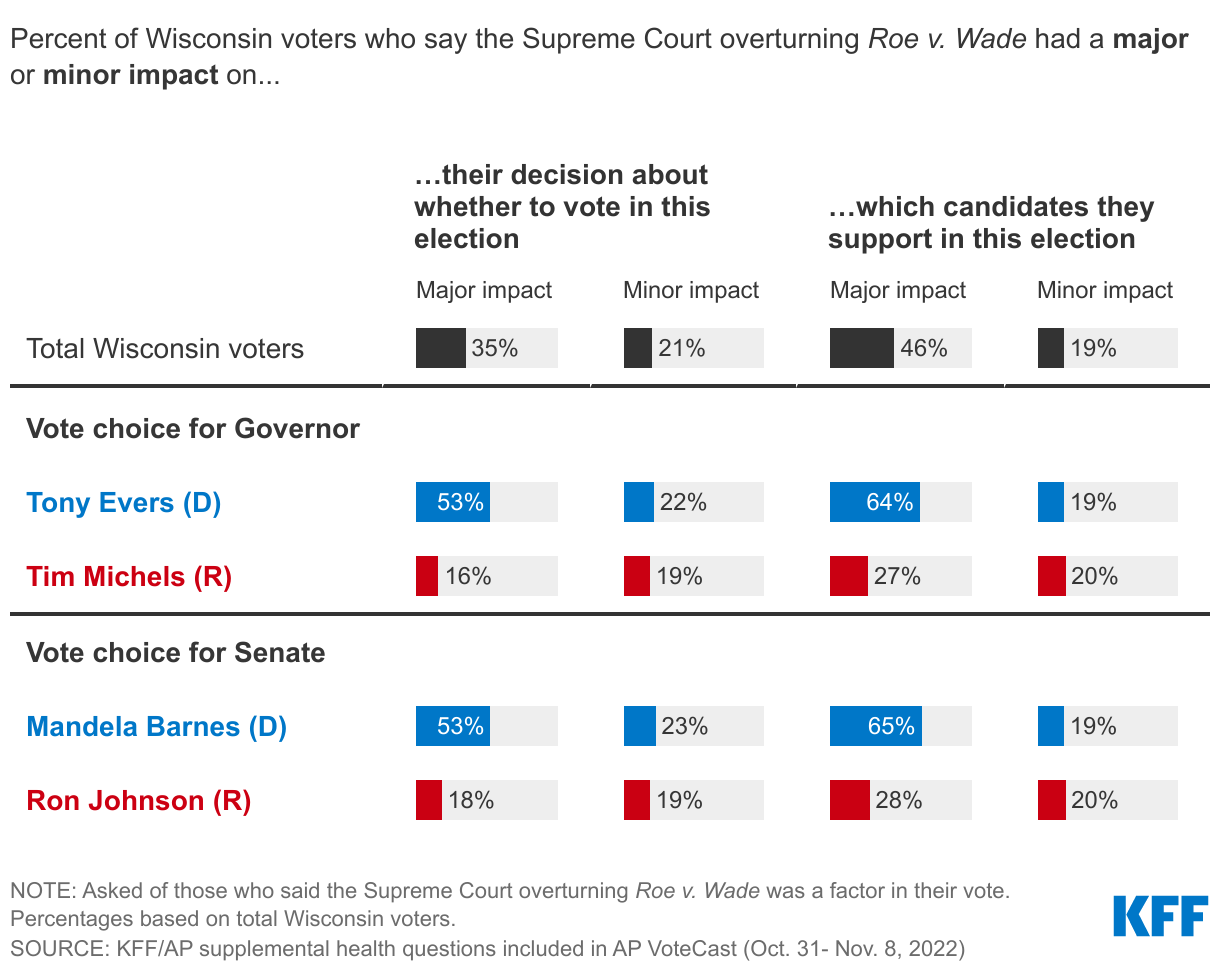
Large Shares Of Democratic Voters In The Wisconsin Midterms Say Overturning Roe Had A Major Impact On Their Decision To Vote, Who To Vote For
For Many Voters In Competitive Races, The SCOTUS Decision On Roe Had A Major Impact On Their Vote Choice And Turnout
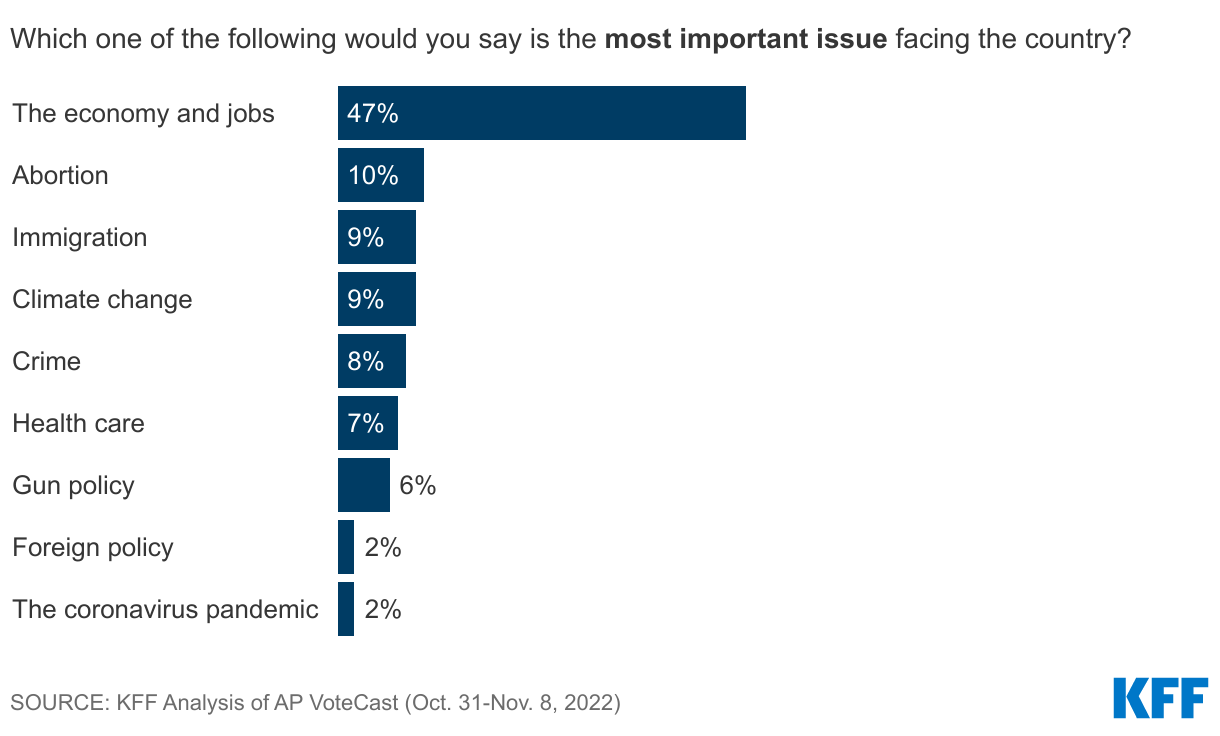
Half Of Voters Say The Economy Is Most Important Issue Facing The Country
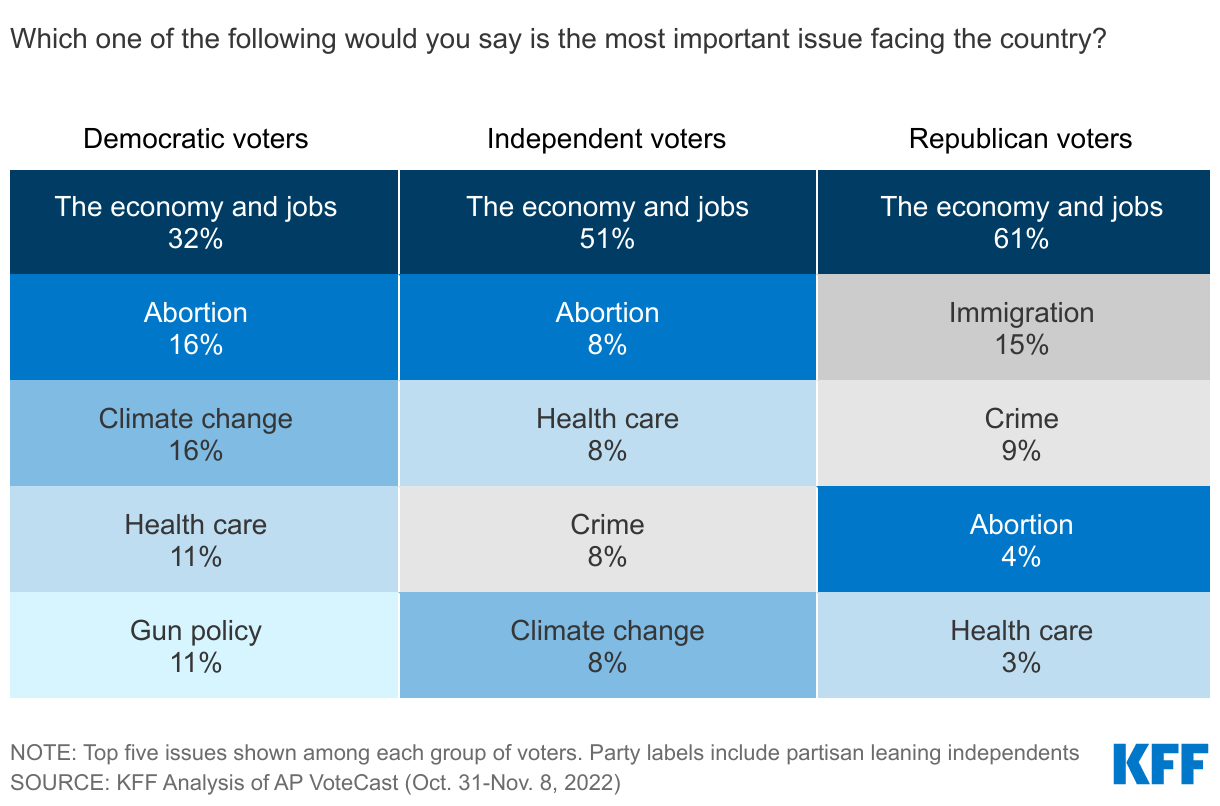
Voters, Regardless Of Partisanship, Identify Economy As Most Important Issue Facing The Country
The Cost Of Groceries Top Economic Concerns, Health Care Costs Ranks Alongside Other Expenses
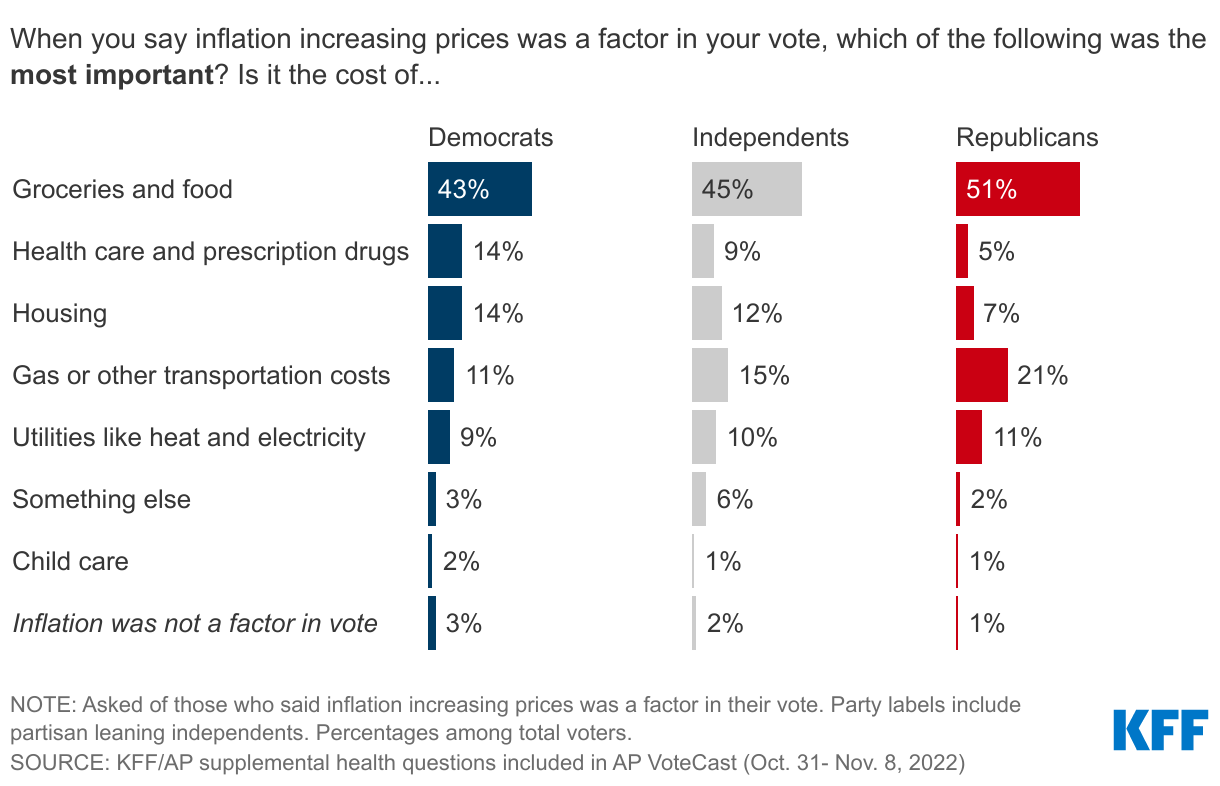
The Cost Of Groceries Is Top Economic Concern Across Partisans, Health Care Costs Rank Higher Among Democratic Voters
The Cost Of Groceries Is Top Economic Concern Among White, Black, And Hispanic Voters; One In Five Black Voters Say Housing Is Top Concern
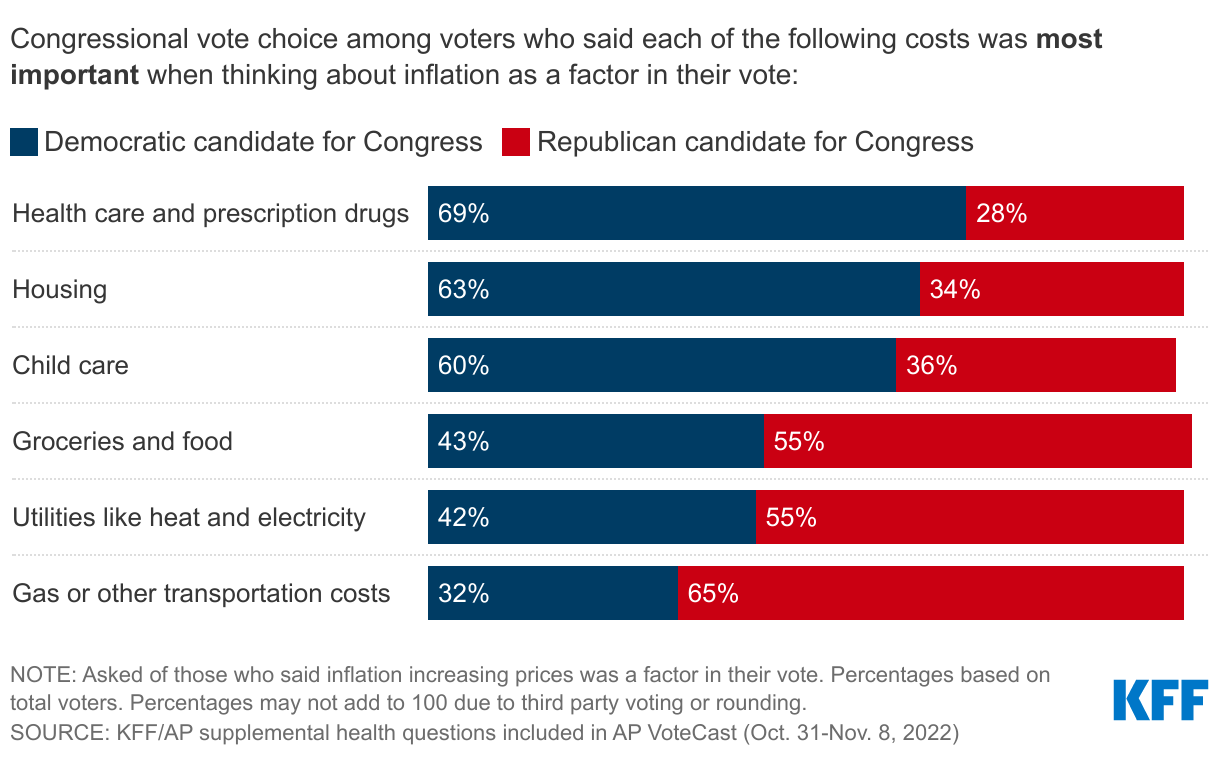
Democratic Candidates Had Advantage Among Voters Who Said Cost Of Health Care, Housing, And Child Care Were Most Important Economic Concern; Republicans Won Over Voters Concerned About Gas, Utilities, Groceries
Hospital Charity Care: How It Works and Why It Matters
About four in ten adults (41%) in the United States—and about six in ten (57%) of those with household incomes below $40,000—have some level of medical debt, owing an estimated $195 billion or more in total. Many adults who report medical debt cite costs associated with emergency care (50%) and hospitalizations (35%) as sources of unpaid bills. Affording this care may be especially challenging for the large number of adults who are uninsured or underinsured. The financial impact of unpaid bills from hospitals and other providers on patients and their families can be substantial and long lasting. Recent reporting indicates that hospitals are earning healthy margins in some regions where a large share of residents are burdened with medical debt. In response to concerns about medical debt and the affordability of care more generally, policymakers have explored options to strengthen the regulation of hospital charity care programs, which provide free or discounted services to eligible patients who are unable to afford their care.
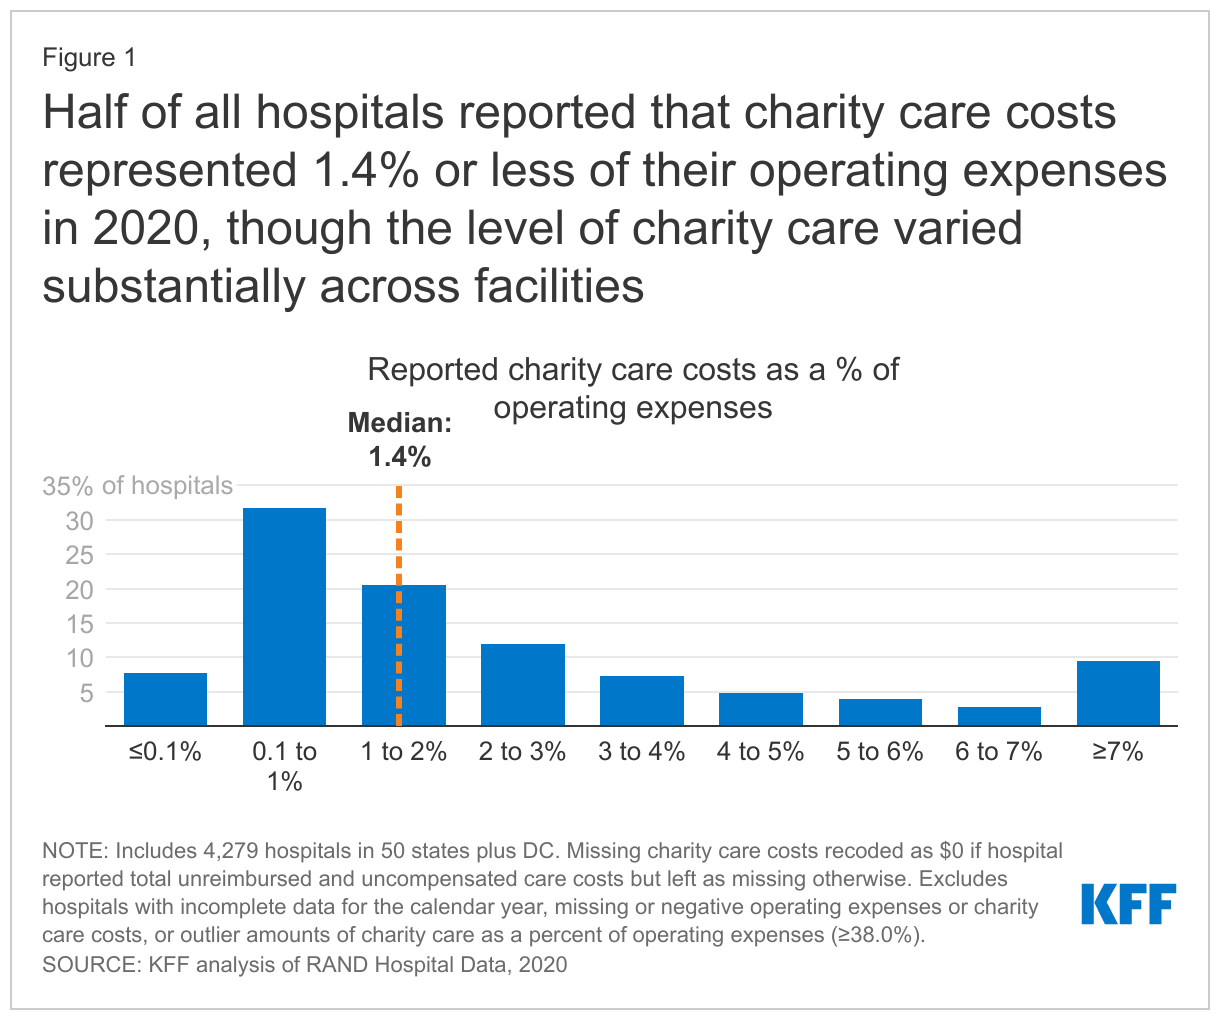
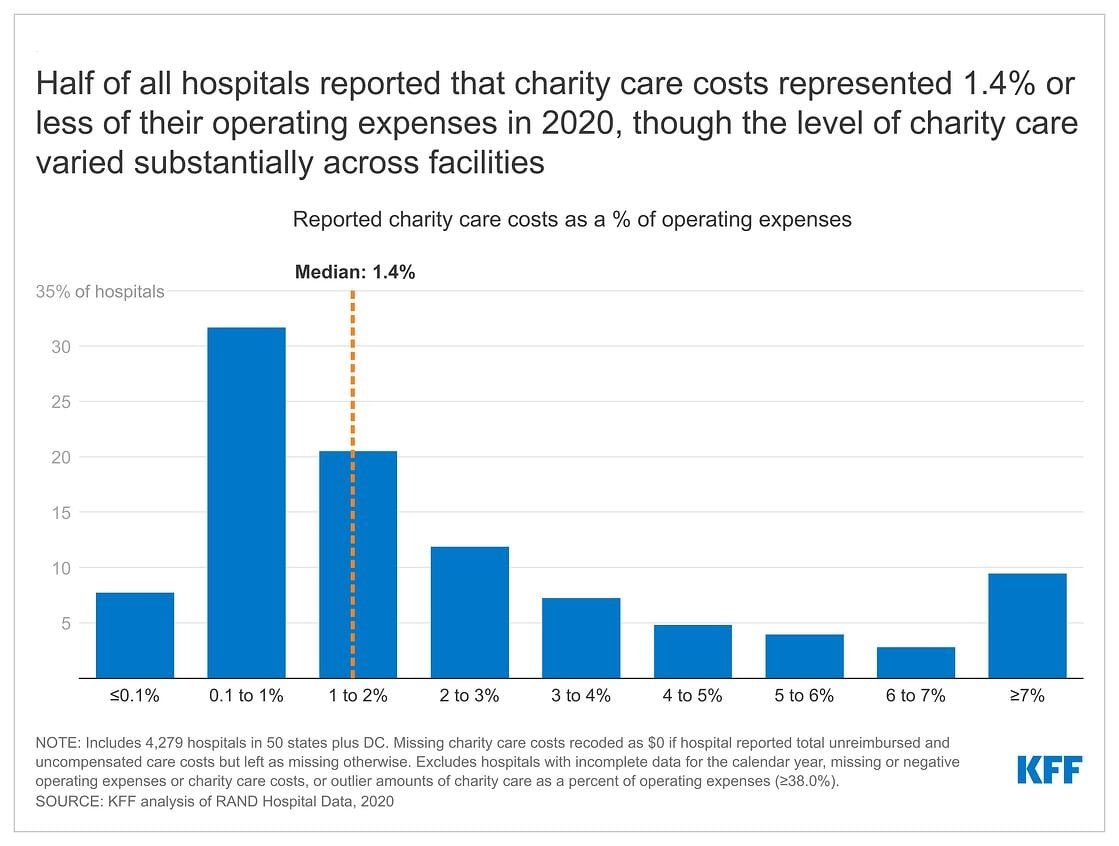
This issue brief addresses key questions about hospital charity care programs. According to our analysis of hospital cost reports, charity care costs represented 1.4 percent or less of operating expenses at half of all hospitals in 2020, though the level of charity care varied substantially across facilities (Figure 1) (see Methods for details about our calculations). For example, while charity care costs represented 0.1 percent of operating expenses or less on the lower end of the spectrum (for 8% of hospitals), they represented 7.0 percent of operating expenses or more among a similar share of hospitals (9%). The variation in charity care costs as a percent of operating expenses likely reflects differences in hospitals’ missions and business practices; the need for charity care among patients; and federal, state, and local policy and regulation. Federal, state, and local governments provide funding in a variety of ways—including through tax benefits for nonprofit hospitals—to support hospital charity care, which may in part motivate efforts to increase the regulation of these programs. Although charity care programs are an important source of relief for uninsured and underinsured patients, many Americans continue to have difficulty affording hospital care. In 2022, about one in seven adults (14%) reported delaying hospital services in the past year due to cost.
What is hospital charity care?
The Internal Revenue Service (IRS) defines “charity care”, also known as “financial assistance”, as “free or discounted health services provided to persons who meet the organization’s eligibility criteria for financial assistance and are unable to pay for all or a portion of the services.”1 Depending on their eligibility criteria, hospitals may provide charity care to both uninsured and insured patients. Among other government regulations, federal law requires that nonprofit hospitals—which account for nearly three-fifths (58%) of community hospitals—provide some level of charity care as a condition of receiving tax-exempt status, and many state governments require all or a subset of hospitals to extend eligibility for charity care to certain groups of patients. Within the broad parameters set by government regulation, hospitals establish their own charity care policies, which vary in terms of eligibility criteria, application procedures, and the levels of charity care provided. While hospitals bear the direct costs of providing charity care, support from donors and federal, state, and local governments may cover some or all of these expenses. Estimates from one recent study suggest that the value of the tax exemption alone covered about half (50%) of the cost of charity care and other community benefits provided by nonprofit hospitals from 2011 to 2018.2
The sum of charity care and bad debt is sometimes referred to as “uncompensated care”. “Bad debt” refers to instances where a hospital bills a patient but, after pursuing collection, determines that it is unlikely to collect payment. This stands in contrast to charity care, for which hospitals do not seek reimbursement. Hospitals accumulate bad debt when patients are unable or unwilling to pay for their care. Some of these patients may be eligible for charity care under the hospital’s charity care policy but do not know to apply, have difficulty doing so, have their application improperly denied, or choose not to apply.
Who is eligible for hospital charity care?
Hospitals have broad flexibility to establish their own eligibility criteria for charity care, and as a result, eligibility criteria vary across hospitals. For example, one analysis of a large sample of nonprofit hospitals that used the federal poverty level (FPL) to determine eligibility for free care in 2018 found that about one in three (32%) of the hospitals required patients to have incomes at or below 200 percent of the FPL ($50,200 for a family of four in that year) or imposed more restrictive eligibility criteria, while the remaining hospitals (68%) relied on higher income caps. For discounted care, about three-fifths (62%) of nonprofit hospitals in the study limited eligibility to patients with incomes at or below 400 percent of the FPL or used lower income levels, with the remaining nonprofit hospitals (38%) relying on higher income caps.
Hospitals may condition free or discounted care on other eligibility criteria in addition to or in lieu of income thresholds based on the FPL, such as by requiring that patients have limited assets or reside in the hospital service area or by extending eligibility to patients who are unable to afford large medical bills despite exceeding income or asset thresholds under standard eligibility pathways. For example, one analysis of charity care policies at 170 large nonprofit and government hospitals found that most policies (76%) identified a streamlined application process for some groups that are likely eligible for charity care, such as patients experiencing homelessness.
It is unclear what share of low-income patients are eligible for hospital charity care, let alone what share of eligible patients end up benefiting from these programs, or what share of their costs are covered. Eligible patients may not receive charity care because they are unaware that charity care is available, do not know that they are eligible, have difficulty completing an application, are improperly denied charity care by the hospital, or choose not to apply. Some evidence suggests that many eligible patients may not be benefiting from charity care. For example, nonprofit hospitals have estimated that, of the bad debt that they reported in 2019 (reflecting expenses in 2017 or an earlier year), about $2.7 billion came from patients who were likely eligible for charity care but did not receive it. This amount is a rough estimate, as it comes from unaudited hospital reports, is restricted to nonprofit facilities, and does not account for instances where eligible patients paid bills that would have been reduced under a given hospital’s charity care program.
How much charity care do hospitals provide?
According to the Medicaid and CHIP Payment and Access Commission (MACPAC), hospitals reported $28 billion in charity care costs in fiscal year (FY) 2019, the majority of which ($22 billion) was for uninsured individuals. Based on our analysis of hospital cost reports, charity care costs represented 1.4 percent or less of operating expenses at half of all hospitals in 2020, though the level of charity care varied substantially across facilities (Figure 1) (see Methods for details about our calculations). For example, while charity care costs represented 0.1 percent of operating expenses or less on the lower end of the spectrum (for 8% of hospitals), they represented 7.0 percent of operating expenses or more among a similar share of hospitals (9%). Charity care costs as a percent of operating expenses were 2.6% in 2020 on average, which is greater than the median given that a relatively small share of hospitals reported relatively large amounts of charity care. Variation in charity care levels across hospitals likely reflects differences in their missions and business practices; the need for charity care among patients; and federal, state, and local policies and regulations. The Medicare Payment Advisory Commission (MedPAC) has noted that the current method for calculating charity costs favors hospitals with higher markups, and it has recommended revisions that would put hospitals on more equal footing and reduce reported charity care costs on average.
Recentresearch has found that for-profit hospitals devote a similar share of their operating expenses to charity care as government hospitals on average and a larger or similar share as nonprofit hospitals. This may seem counterintuitive because, unlike for-profit hospitals, nonprofit hospitals receive large tax-breaks which are, in part, intended to subsidize the charity care that they provide. Among potential explanations for this result, for-profit hospitals may have a greater willingness to provide charity care in some scenarios because they can take a tax deduction for these expenses, and it is possible that some nonprofit hospitals may not expect significant oversight of their charity care practices from government regulators.
What role does charity care play for undocumented and lawfully present immigrants?
Hospital charity care may play an important role in protecting undocumented and lawfully present immigrants from high medical costs given that they are more likely than citizens to have low incomes and lack health insurance. In 2020, about four in ten undocumented and lawfully present nonelderly immigrants (44% and 39%, respectively) had incomes below 200 percent of the FPL compared to about a quarter (26%) of nonelderly citizens. Additionally, about four in ten (42%) nonelderly undocumented immigrants and a quarter (26%) of nonelderly lawfully present immigrants were uninsured compared to less than one in ten (8%) nonelderly citizens. This disparity reflects morelimited access to private coverage and eligibility restrictions based on immigration status in health insurance programs funded with public dollars. Even though charity care programs provide financial assistance for some immigrants, overall, research suggests that immigrants use less health care, including hospital care, than U.S.-born citizens, and it remains unclear to what extent they benefit from charity care programs and how their use of these programs compares to that of citizens.
What charity care rules must nonprofit hospitals comply with in exchange for receiving federal tax-exempt status?
Federal regulations require that nonprofit hospitals provide some level of charity care and other community benefits as a condition of receiving tax-exempt status. The IRS has defined different types of community benefits, including patient benefits (such as charity care), system benefits (such as unreimbursed medical education), and community building activities (such as addressing environmental hazards). According to one study, in 2017, unreimbursed Medicaid expenses accounted for the plurality (44%) of nonprofit hospitals’ community benefit expenses, followed by charity care (17%), unreimbursed health professions education (15%), subsidized health services that are not mean-tested (10%), community health improvement services and operations (4%), unfunded research (4%), cash and in-kind contributions for community benefit (3%), unreimbursed costs for means-tested programs aside from Medicaid (2%) and building activities (e.g., related to housing) (1%). “Unreimbursed expenses” for Medicaid—the nation’s public health insurance program for people with low incomes—and other means-tested programs refers to the extent to which costs related to patients enrolled in these programs exceed corresponding revenues for hospitals. Any unreimbursed expenses from other payers are generally not counted in hospital community benefit calculations.
Establish a financial assistance policy (FAP). The FAP must describe who is eligible for charity care, the level of assistance provided, and how patients can apply. A hospital must make its FAP easily accessible to patients and ensure that the FAP is translated into the languages commonly spoken in the community served by the hospital.
Cap charges to patients eligible for charity care based on amounts generally billed to other payers. Federal regulation defines approaches for calculating the amount generally billed based on fee-for-service Medicare rates, Medicaid rates, and/or commercial plan payment rates.
Conduct a community health needs assessment (CHNA) every three years and adopt an implementation strategy to address those needs. The CHNA must define the community that the hospital serves and evaluate the health needs of that community, integrating input from local stakeholders. Community health needs could include, for example, lowering financial barriers to health care or improving social determinants of health.
Make reasonable efforts to determine if a patient is eligible for charity care before engaging in certain debt collection practices, including selling the patient’s debt to third parties, reporting the debt to credit agencies, and taking legal action to control a patient’s financial assets. A “reasonable effort” could entail, for example, notifying the patient of the FAP and giving them at least four months to apply following their first bill after being discharged from the hospital.
However, gaps in federal regulation and weak oversight and enforcement may allow hospitals to provide low levels of charity care in some instances. Federal regulations do not currently define or set minimum standards for hospitals to determine who is eligible for charity care or the level of assistance to be provided. A 2020 Government Accountability Office (GAO) report also raised questions about whether requirements to provide sufficient community benefits, including charity care, are being adequately enforced. According to the report, the IRS had not revoked a hospital’s nonprofit status on the basis of providing inadequate community benefits over the prior ten years.
Do states impose additional charity care requirements for hospitals?
Slightly over half of all states (26 states and DC) require all or a subset of hospitals to extend eligibility for charity care to certain groups of patients, according to a 2021 report from the National Consumer Law Center. Among those that do so, 11 states (CA, CO, CT, IL, MD, ME, NJ, NV, NY, RI, and WA) broadly extend minimum standards to for-profit, nonprofit, and government hospitals alike. The 16 remaining state laws extend to narrower groups of hospitals, including nonprofit or government hospitals (3 states: LA, OR, and TX), hospitals that receive certain types of government funding to offset the cost of care for low-income patients (9 states: GA, KS, KY, MO, NM, OH, OK, PA, and TN), and hospitals seeking approval to expand or build new health care facilities (DC and 3 states: DE, NC, and VA). These state regulations also vary in terms of eligibility criteria and the level of assistance that must be provided. For example, Nevada requires a subset of hospitals to provide free care to uninsured patients with especially low incomes (38% or 39% of the FPL in 2022 depending on household size), while Maryland requires every acute and chronic care hospital to provide free care to both insured and uninsured patients at or below 200% of the FPL and to provide discounted care to patients with higher incomes.
In addition to setting minimum standards in terms of eligibility, several states have implemented regulations intended to increase the uptake of charity care among eligible patients and to protect potentially eligible patients from certain debt collection practices. For example, one analysis found that 13 states require hospitals to screen patients for eligibility, 16 states require hospitals to notify patients prior to collecting payment and/or in every notification about collections, and 8 states regulate procedures for patients to appeal denials of charity care.
There is little information about the effectiveness of these regulations or the extent to which they are enforced. One recent example of a state enforcement activity occurred in California, where the Attorney General sent letters to hospitals alleging that they were not providing descriptions of their charity care policies to patients in the patients’ spoken languages. Another recent example occurred in Washington, where the Attorney General filed a lawsuit against 14 hospitals for violating state charity care requirements, including by sending many patients’ bills to collections when the hospitals knew the patients were eligible for charity care.
What role do Medicaid, Medicare, and other government programs play in helping hospitals afford charity care expenses?
Medicaid provides health coverage for low-income patients and subsequently plays a significant role in reducing uncompensated care, including by lowering the demand for hospital charity care. This was especially evident in 2014, when many states adopted the Medicaid expansion under the Affordable Care Act (ACA) (and when enrollment in the ACA Marketplaces also began in all states). Among hospitals in states that expanded Medicaid, total uncompensated care costs decreased from $16.7 billion in 2013 to $11.0 billion in 2014 (a 34% decrease); in contrast, uncompensated care costs decreased by a much smaller amount (from $18.1 billion in 2013 to $17.9 billion in 2014, a 1% decrease) among hospitals in states that did expand Medicaid.
Medicaid and Medicare both provide supplemental payments to hospitals that are intended, at least in part, to offset the costs of charity care and other uncompensated care:
Medicare disproportionate share hospital (DSH) payments. Medicare provides additional payments to hospitals that care for a disproportionate share of low-income patients, which are known as “DSH hospitals”. The magnitude of Medicare DSH payments is based on hospitals’ Medicaid and Supplemental Security Income (SSI) populations and the amount of uncompensated care that they provide, among other factors. The Centers for Medicare and Medicaid Services (CMS) estimates that additional Medicare payments to DSH hospitals will total $14.0 billion in FY 2023.
Medicaid DSH payments. State Medicaid programs also provide additional payments to DSH hospitals. Federal regulations provide states with a substantial level of discretion in terms of which facilities to designate as DSH hospitals and how to distribute funding. Medicaid DSH payments totaled $19.5 billion in FY 2020.
Medicaid uncompensated care pool payments. In FY 2020, eight state Medicaid programs paid hospitals a total of $8.2 billion to help offset the costs of uncompensated care.
Other state and federal programs may provide additional support to hospitals, which in turn can reduce the amount of charity care hospitals have to absorb. For instance, some state and local governments operate programs beyond Medicaid that provide coverage to low-income patients or that offset uncompensated care costs. As another example, the 340B Drug Pricing Program provides substantial financial support primarily to hospitals that serve a large number of low-income patients. Under this program, the federal government requires drug manufacturers to offer discounts on outpatient drugs to certain hospitals as a condition of having their drugs covered by Medicaid. Sales of 340B drugs totaled an estimated $44 billion in 2021 and DSH hospitals account for the large majority (78%) of sales. These additional revenues help facilities cover their operating expenses, including costs related to the provision of charity care.
How has the provision of charity care changed during the pandemic?
Although the COVID-19 pandemic has led to significant and ongoing disruptions in hospital operations, hospital admissions bounced back after sharp initial declines, and large amounts of government relief have helped stabilized hospital finances and charity care spending. Most prominently, the federal Provider Relief Fund (PRF) program has distributed $134 billion to hospitals and other providers as of early October 2022 to cover health care expenses or lost revenues due to the pandemic. Although the PRF program initially distributed funds on the basis of total patient revenue, which favored hospitals that received a large share of their revenues from private insurance, it later included $16 billion that was earmarked for safety-net hospitals. Among other relief programs, the government also reimbursed providers, including hospitals, for treating uninsured patients for COVID-19, with payments totaling $5.8 billion by the time the program stopped reimbursing claims in March 2022 due to lack of funding.
One study found that average hospital operating margins decreased from -1.0% in 2019 to -7.4% in 2020 when excluding COVID-19 relief funds, but that total margins—which take relief funds into account—were relatively constant over time and were 6.7% in 2020. Similarly, average charity care costs as a percent of operating expenses remained relatively constant at 2.7% in 2019 and 2.6% in 2020 based on our analysis of hospital cost reports (see Methods for details about our calculations). One analysis of 151 large nonprofit and government hospitals found that about three in ten (31%) expanded their charity care policies from 2019 to 2021, while less than one in ten (8%) moved towards more restrictive policies; the remaining hospitals made minimal, indeterminate, or no change to their charity care policies.
Some reports suggest that the financial outlook for hospitals has deteriorated in recent months, which may make it harder for hospitals to maintain current levels of charity care. Further monitoring is needed to assess the extent to which hospitals are experiencing financial stress in response to ongoing effects of the pandemic such as labor shortages, decreases in government relief, rising drug costs, and broader economic trends that have led to rising prices and investment losses.
Looking ahead
In the context of ongoing concerns about the affordability of hospital care and the growing burden of medical debt, several policy ideas have been floated at the federal and state level to strengthen hospital charity care programs. These include changes that would strengthen the requirements for nonprofit hospitals to qualify for tax-exempt status, as well as broader reforms that would apply to all hospitals. Specific proposals include creating or expanding requirements that hospitals provide charity care to patients below a specified income threshold, mandating that nonprofit hospitals provide a minimum amount of community benefits, establishing a floor-and-trade system where hospitals would be required to either provide a minimum amount of charity care or subsidize other hospitals that do so, introducing policies to increase the uptake of charity care, expandingoversight and enforcement of community benefit requirements, and restructuring the tax exemption for nonprofit hospitals to more closely tie government subsidies to the value of charity care and other community benefits provided by a given facility. A related set of proposals are intended to better align community benefits with local or regional needs and may therefore also affect the provision of charity care.
Recent policy changes have been concentrated at the state level. For example, since 2021, California and Washington state have expanded their charity care mandates to cover more patients through higher income eligibility thresholds. Colorado has introduced a private right of action to enforce hospital compliance with charity care requirements, and Illinois has implemented new reporting requirements for charity care programs. State and federal policymakers have also considered several other options to reduce medical debt or increase affordability more generally, such as by expanding Medicaid in states that have not already done so, reducing health care prices through direct regulation or other means, and increasing consumer protections against medical debt.
Efforts to expand hospital charity care will inevitably involve tradeoffs, including the potential cost to hospitals from protecting patients who cannot afford their hospital bills.
Methods
Our analysis of reported charity care costs as a percent of operating expenses is based on 2019-2020 RAND Hospital Data, which is a cleaned and processed version of annual cost report data submitted by hospitals to the Healthcare Cost Report Information System (HCRIS). Every Medicare-certified hospital must submit a cost report, meaning that HCRIS data encompass all US hospitals except federal hospitals and some children’s hospitals. HCRIS instructions indicate that hospitals should report amounts related to both their charity care and uninsured discounts as part of their charity care costs. The Medicare Payment Advisory Commission (MedPAC) has noted that current HCRIS calculations favor hospitals with higher markups, and it has recommended revisions that would put hospitals on more equal footing and reduce reported charity care costs on average.
Our analysis relied on a calendar year version of the RAND Hospital Data, which apportions data from different cost reports for hospitals that do not use a calendar year reporting period. We focused on short-term general hospitals in all 50 states plus DC. We recoded missing charity care costs as $0 if the hospital reported total unreimbursed and uncompensated care costs (affecting about 3% of hospitals) but left as missing otherwise. There were no other instances of $0 charity care costs in our sample. We excluded hospitals with incomplete data for the calendar year, missing or negative operating expenses or charity care costs, or outlier amounts of charity care as a percent of operating expenses (greater than or equal to 38.0%, i.e., the top 0.1% of hospitals). Our final sample for 2020 included 4,279 of the 4,546 short-term general hospitals in the 2020 RAND Hospital Data. When comparing charity care costs in 2019 and 2020, we restricted the sample to the 4,236 hospitals that were in sample in both years.
We evaluated two adjustments to our analysis and found that neither substantially affected our primary findings. First, we found that dropping all hospitals with missing charity care costs, rather than recoding a subset as $0, would result in a similar median value for charity care costs as a percent of operating expenses (1.5% versus 1.4%) and the same mean value (2.6%), with somewhat less variation across hospitals than in our analysis. For example, under this alternative approach, charity care costs would represent 0.2 percent of operating expenses or less among eleven percent of hospitals and 7.0 percent of operating costs or more among nine percent of hospitals. Second, as with our analysis comparing 2019 and 2020, when further restricting the sample to the 1,628 hospitals that used a calendar year reporting period in both years, average charity care costs as a percent of operating expenses remained relatively constant over time (at 2.3% in 2019 and 2.2% in 2020).
This work was supported in part by Arnold Ventures. KFF maintains full editorial control over all of its policy analysis, polling, and journalism activities.
The IRS definition also indicates that charity care excludes “bad debt or uncollectible charges that the organization recorded as revenue but wrote off due to a patient’s failure to pay, or the cost of providing such care to such patients; the difference between the cost of care provided under Medicaid or other means-tested government programs or under Medicare and the revenue derived therefrom; self-pay or prompt pay discounts; or contractual adjustments with any third-party payors”. ↩︎
We derived this estimate from the study by dividing the estimated average value of tax exemption (4.26%) by the estimated average value of community benefits (8.47%). ↩︎
Half of hospitals reported that the cost of providing charity care to patients represented 1.4% or less of their operating expenses in 2020, though the rates vary widely from hospital to hospital, a new KFF analysis finds.
Based on a review of hospital cost report data, the analysis finds some hospitals provide little or no charity care (0.1% or less of operating expenses at 8% of hospitals), while others provide far more charity care (at least 7% of operating expenses at 9% of hospitals).
The variation in charity care rates may reflect differences in individual hospitals’ mission and business practices; the need for charity care among their patients; and federal, state, and local policies and regulations.
The analysis is part of a new brief that examines the role of hospital charity care programs in helping patients who cannot afford their care. The brief answers frequently asked questions, including:
How much charity care do hospitals provide?
Which patients are eligible for charity care?
What are the requirements related to charity care for nonprofit hospitals to receive federal tax-exempt status, and what additional requirements do states impose on hospitals?
How do Medicaid and Medicare help hospitals afford charity care expenses?
How did the COVID-19 pandemic affect charity care?
The brief also discusses policy proposals related to hospital charity care programs, such as creating or expanding requirements that hospitals provide charity care to patients below a specified income threshold, introducing requirements to increase the uptake of charity care, and strengthening oversight and enforcement of existing regulation. It is part of KFF’s expanding work examining the business practices of hospitals and other providers and their impact on costs and affordability.
In July 2022, Perrigo’s HRA Pharma submitted an application to the Food and Drug Administration (FDA) to make its progestin-only oral contraceptive (Opill) available over the counter (OTC). The typical review period is 10 months. If approved, it would be the first daily oral contraceptive pill approved for OTC use available in the U.S. Although it is farther behind in the process, another pharmaceutical company, Cadence, is working toward FDA approval of an OTC version of its combined oral contraceptive pill (Zena).
Oral contraceptives are the most commonly used method of reversible contraception in the U.S., and studies suggest that OTC access would increase use of contraception and facilitate continuity of use in addition to saving time spent on travel, at a doctor’s office, and off work. The American Medical Association and the American College of Obstetricians and Gynecologists support efforts to make an oral contraceptive pill available OTC, without age restrictions.
This brief presents data from the 2022 KFF Women’s Health Survey (WHS) about reproductive age (18-49) females’ preferences for an OTC contraceptive pill (N = 4,088). The KFF WHS is a nationally representative survey that includes 5,201 females1 , conducted primarily online from May 10, 2022, to June 7, 2022. The survey covers several topics related to reproductive health and well-being. See the Methodology section for details.
Findings
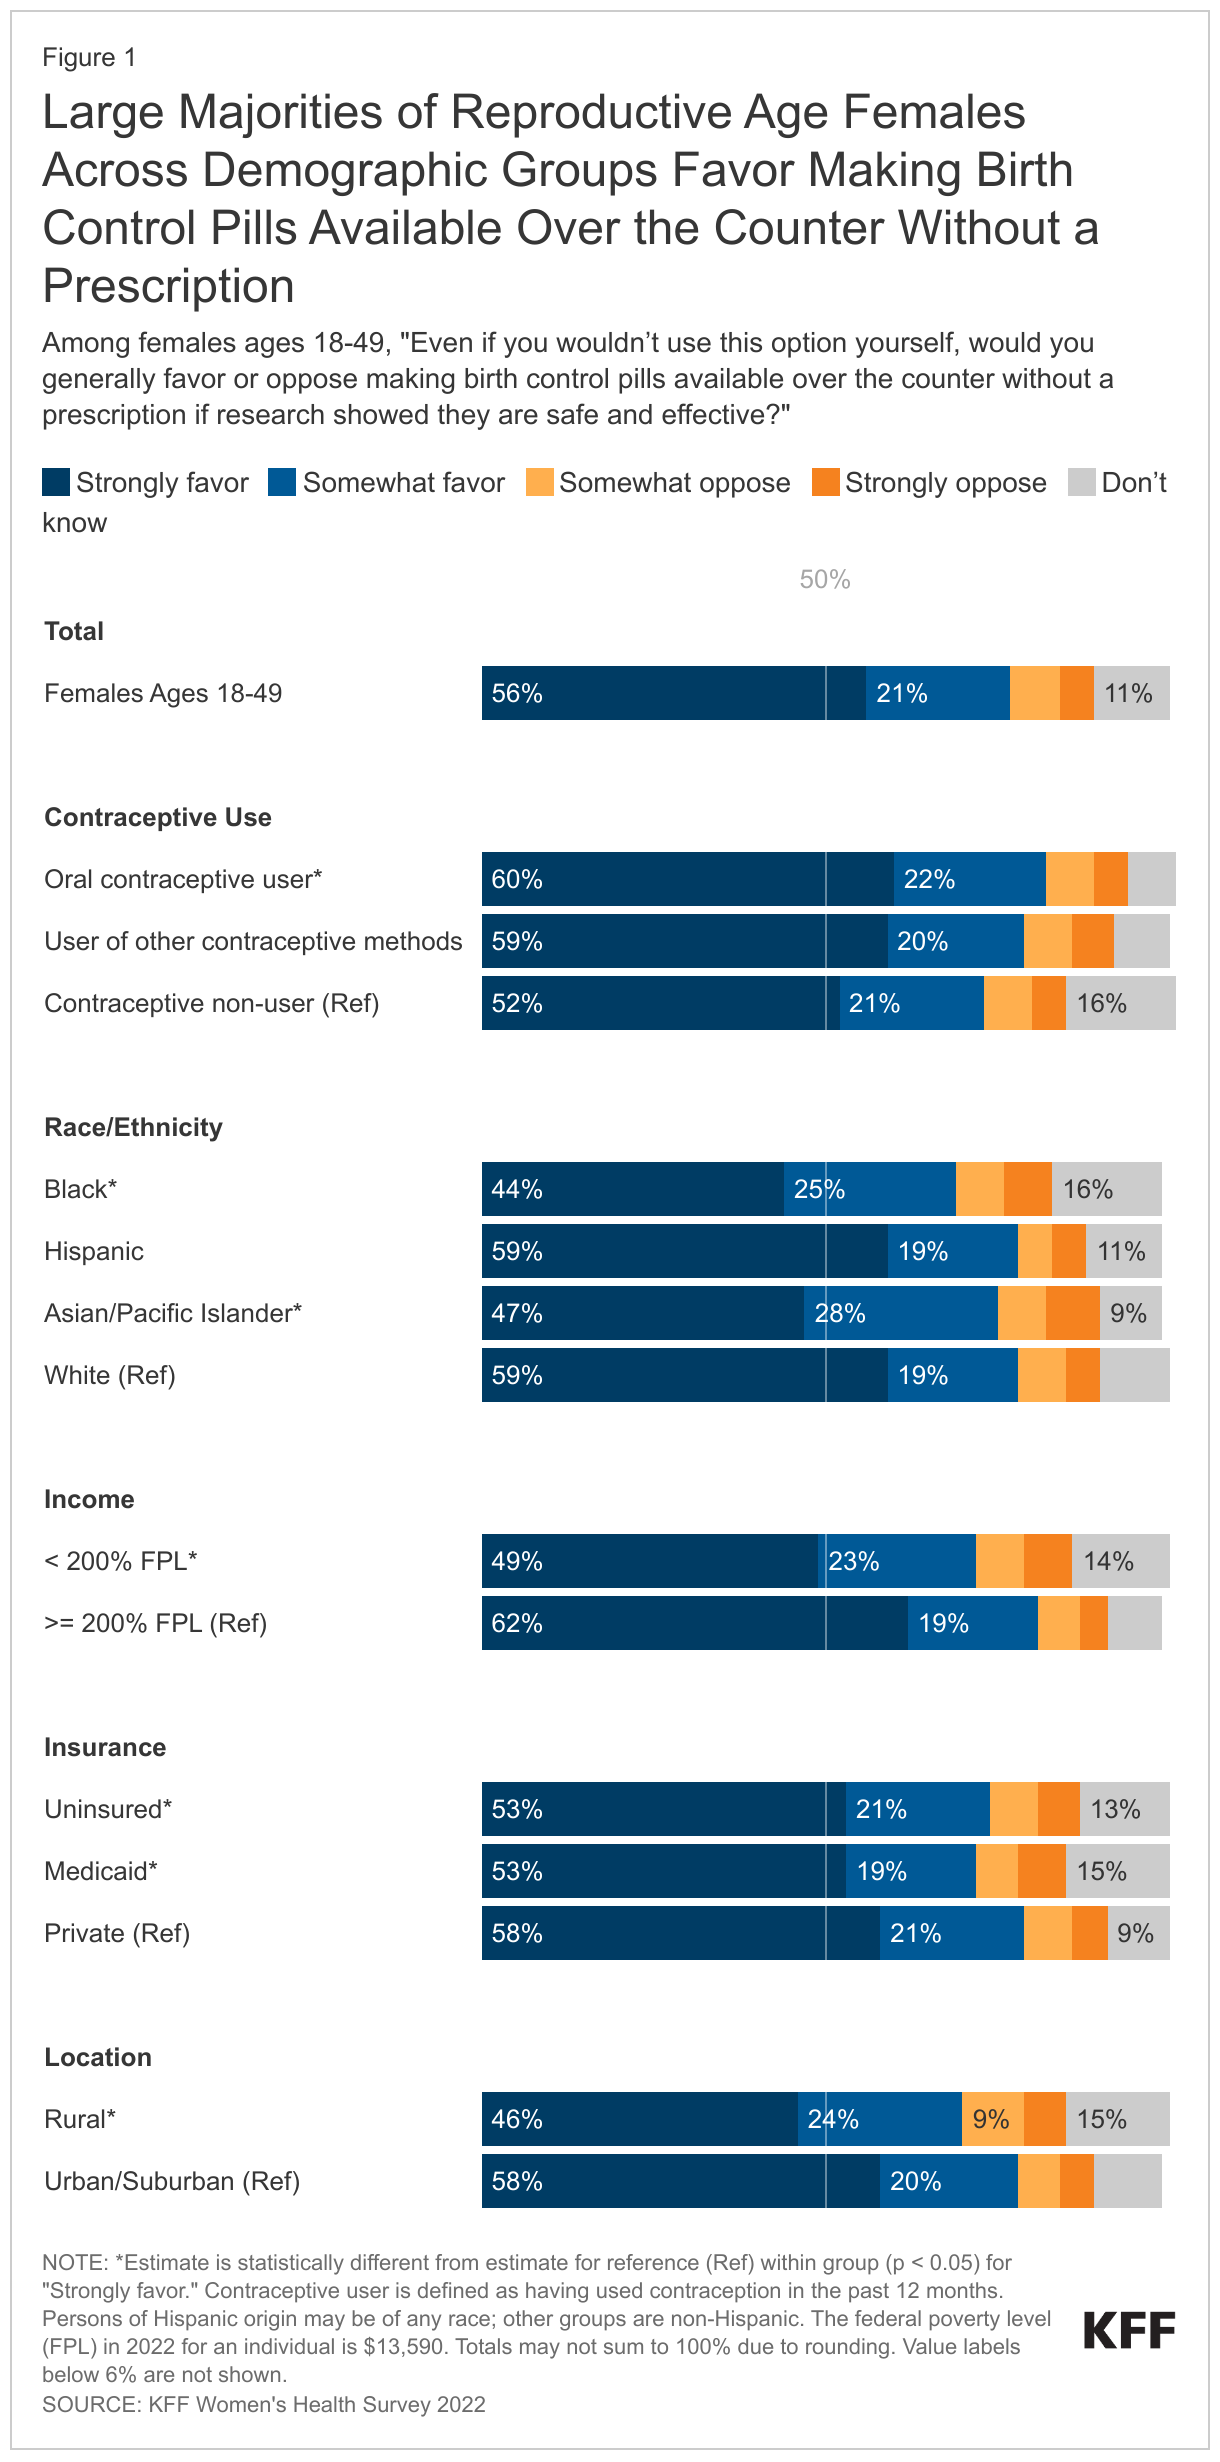
More than three-quarters (77%) of reproductive age females favor making birth control pills available over the counter without a prescription if research showed they are safe and effective (Figure 1). Fifty-six percent strongly favor this policy and 21% somewhat favor it, even if they would not use this option themselves. Twelve percent of females either somewhat or strongly oppose this policy and 11% did not know whether they favor or oppose it.
Larger shares of recent oral contraceptive users (60%) strongly favor making birth control pills available OTC compared to those who have not used contraception in the past 12 months (52%).
About six in ten (59%) White and Hispanic reproductive age females strongly favor making a birth control pill available OTC if research showed it is safe and effective compared to less than half of Black (44%) and Asian/Pacific Islander females (47%). Higher-income (>= 200% FPL) females (62%) are more likely than low-income (< 200% FPL) females (49%) to say that they strongly favor making birth control pills available OTC.2
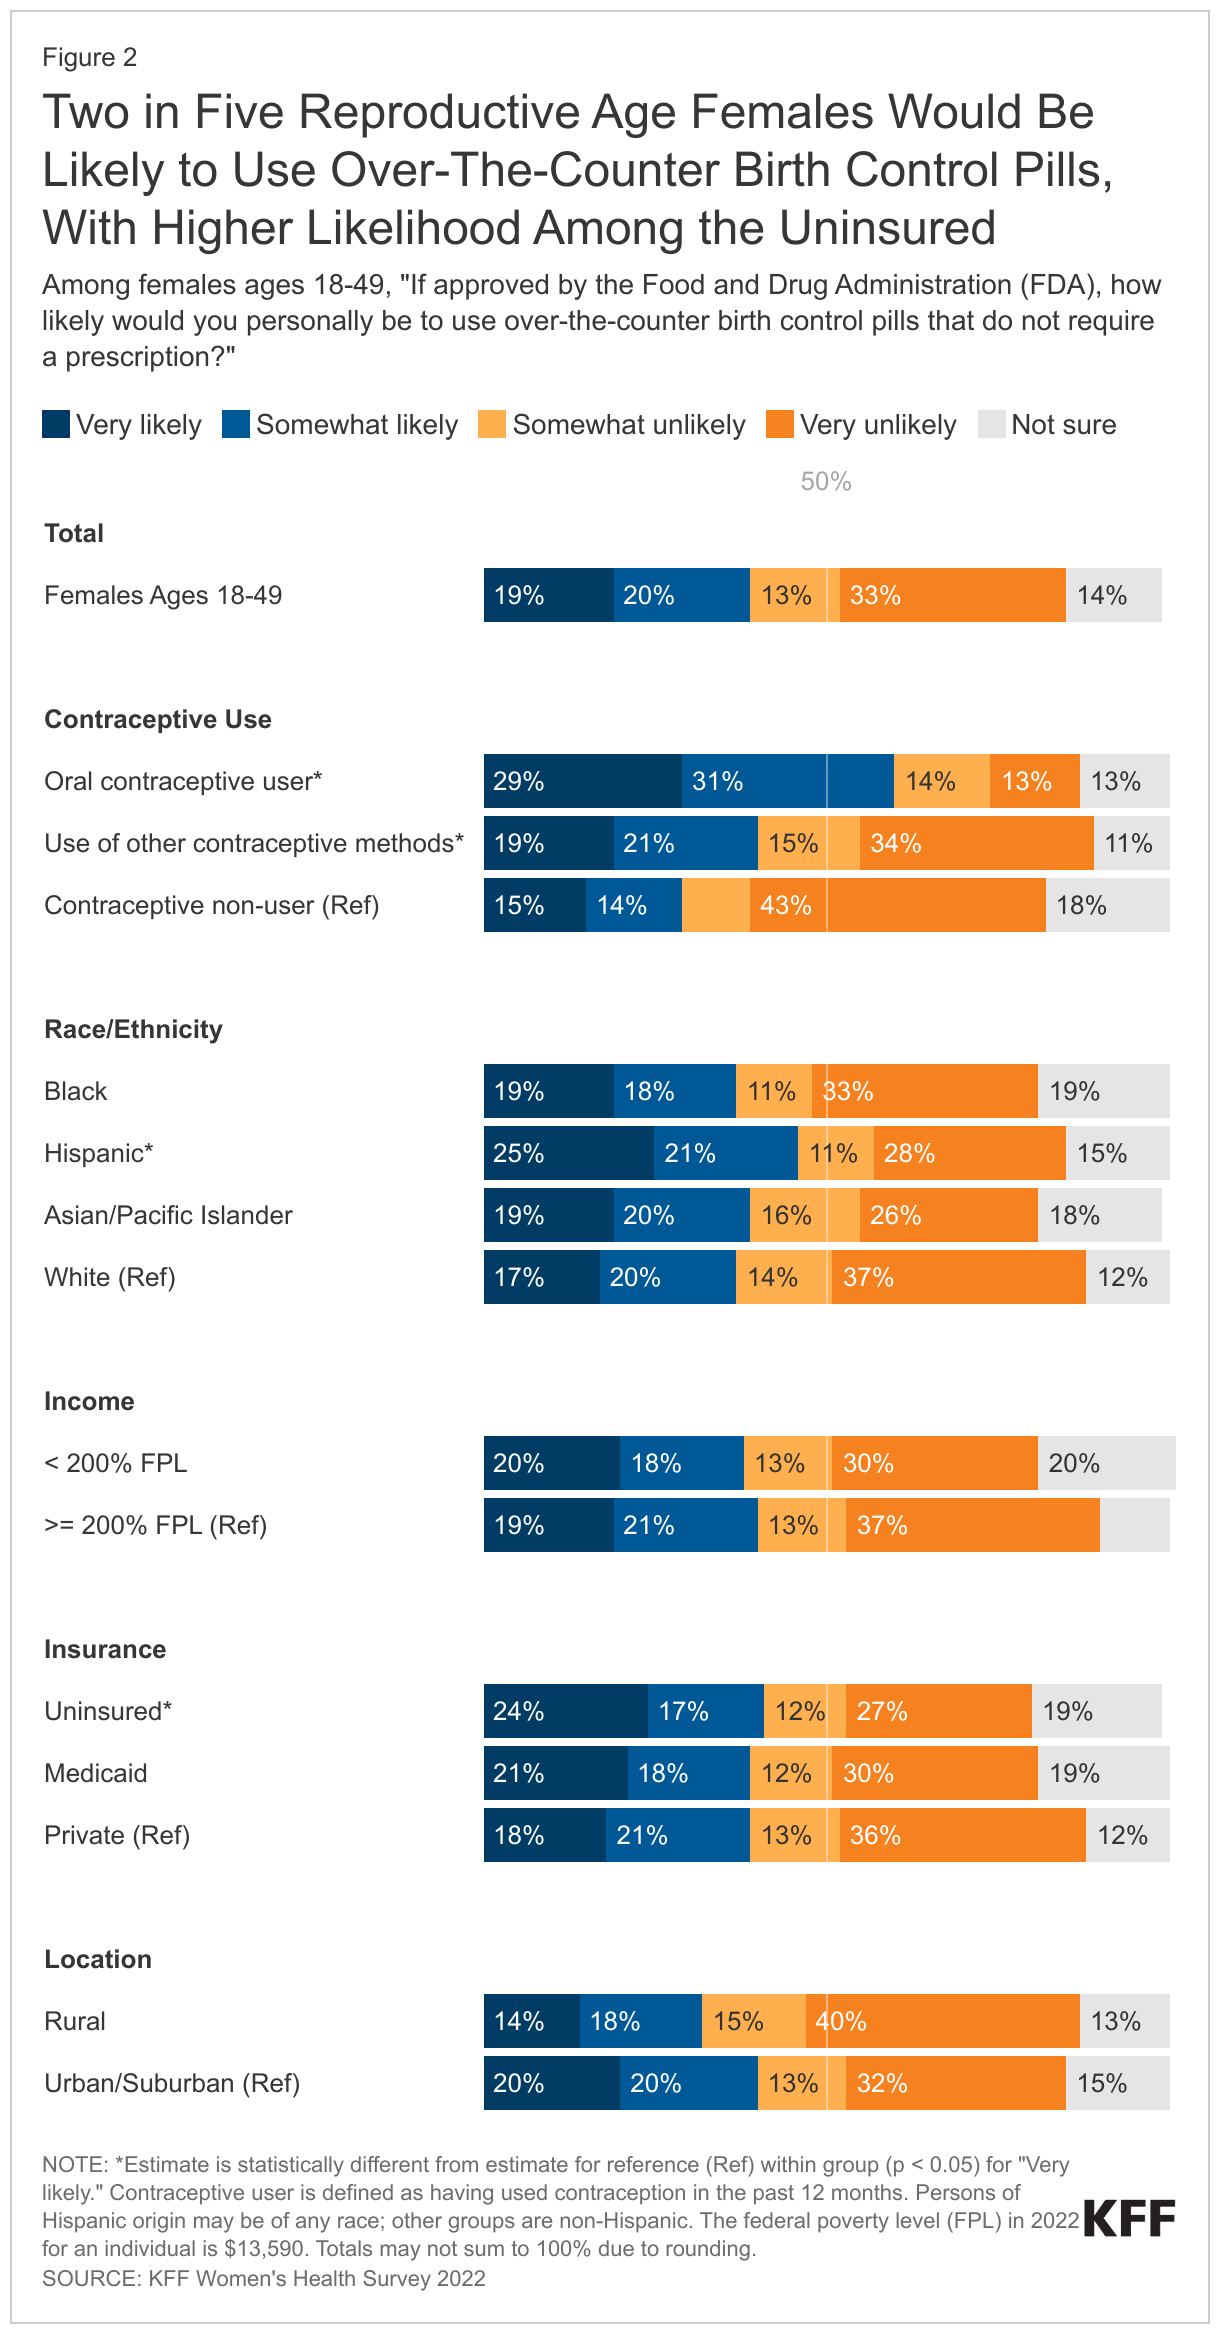
Two in five (39%) reproductive age females would be likely to use OTC birth control pills that do not require a prescription if approved by the FDA (Figure 2). One in five would be very likely (19%) or somewhat likely (20%) to use them. Almost half (46%) say they would be somewhat or very unlikely to use them and 14% do not know.
Interest is significantly higher among females who currently use oral contraceptives. Sixty percent of reproductive age females who have used birth control pills in the past 12 months said they would be likely or very likely to use OTC birth control pills compared to 40% of other contraceptive users and 29% of contraceptive non-users.
A higher share of reproductive age Hispanic females (25%) say they would be very likely to use OTC birth control pills if approved by the FDA than their White counterparts (17%). The share of low-income females who would be very likely to use OTC birth control pills is similar to the share of higher-income females (20% and 19%, respectively). One in four (24%) uninsured reproductive age females would be very likely to use them compared to about one in five (18%) of those with private health insurance. A higher share of females living in urban/suburban (20%) are very likely to use OTC birth control pills than rural females (13%).
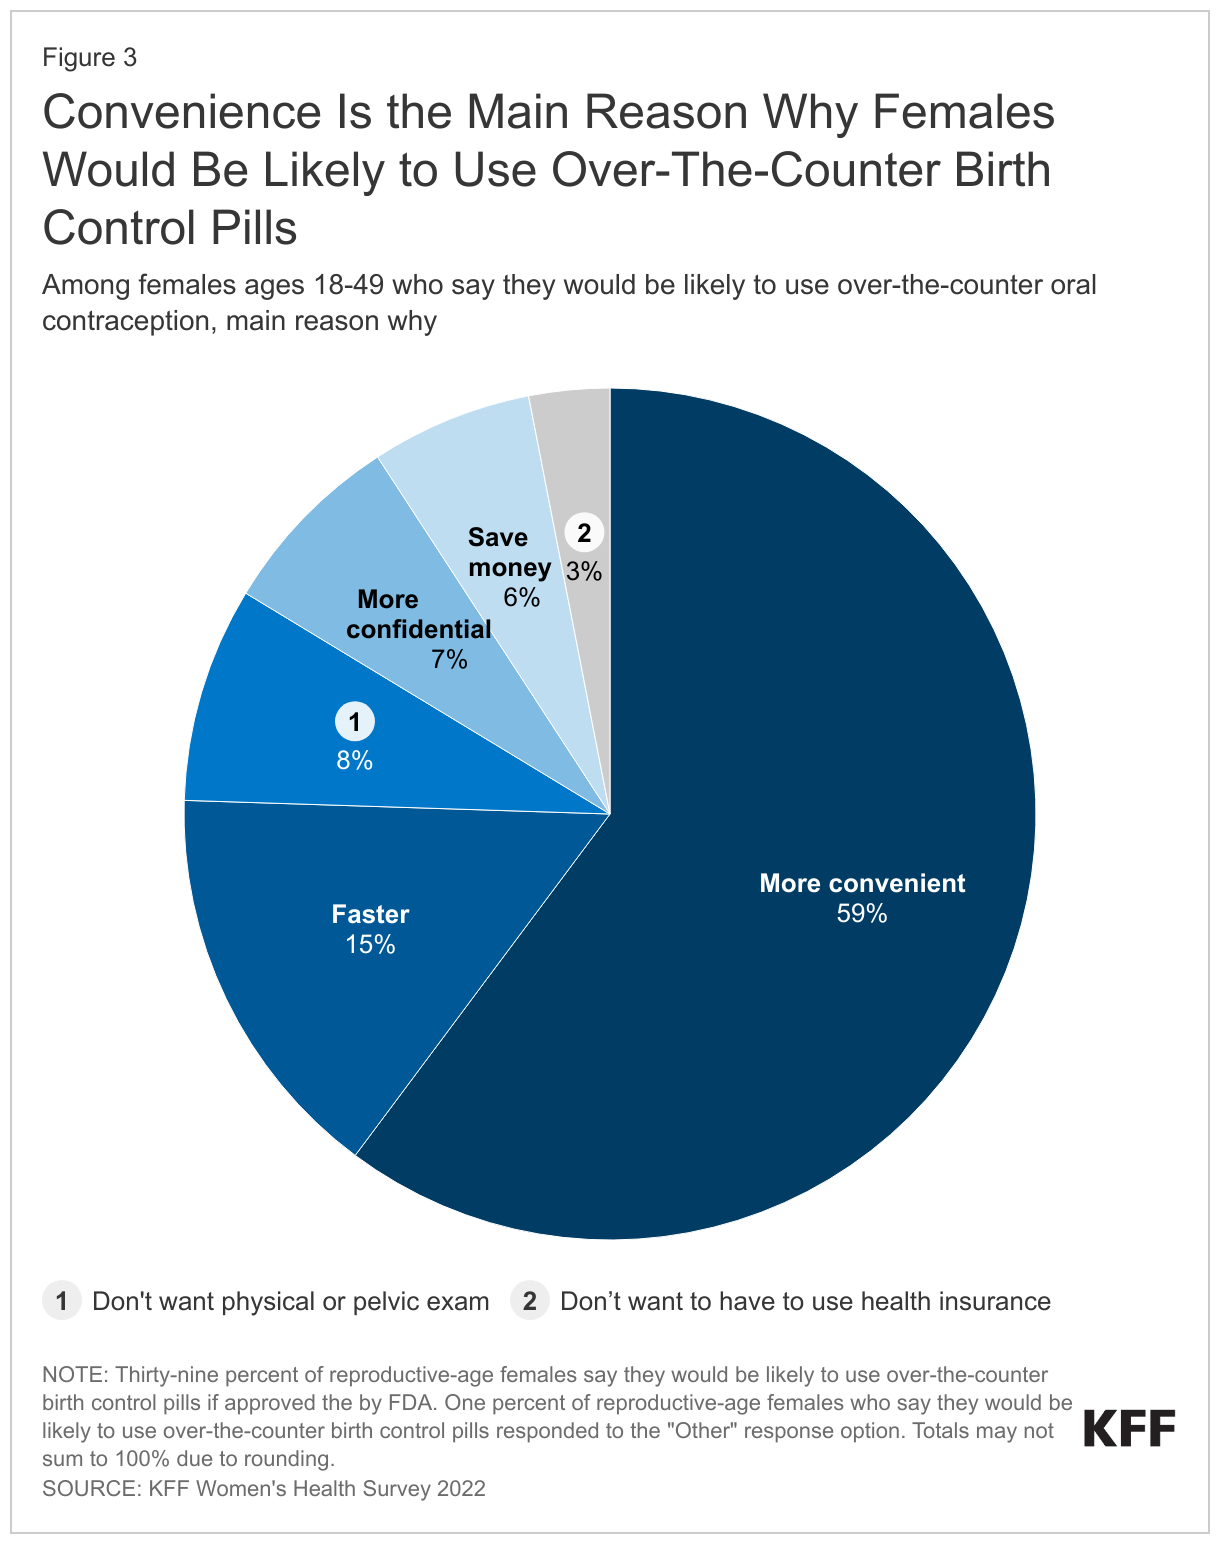
Convenience is the leading reason that reproductive age females say they would be somewhat or very likely to use OTC birth control pills (59%) (Figure 3). Fifteen percent believe it would be faster; 8% do not want to have to have a physical or pelvic exam; 7% say it would be more confidential; 6% think it would save money; and 3% do not want to use their health insurance to buy birth control pills.
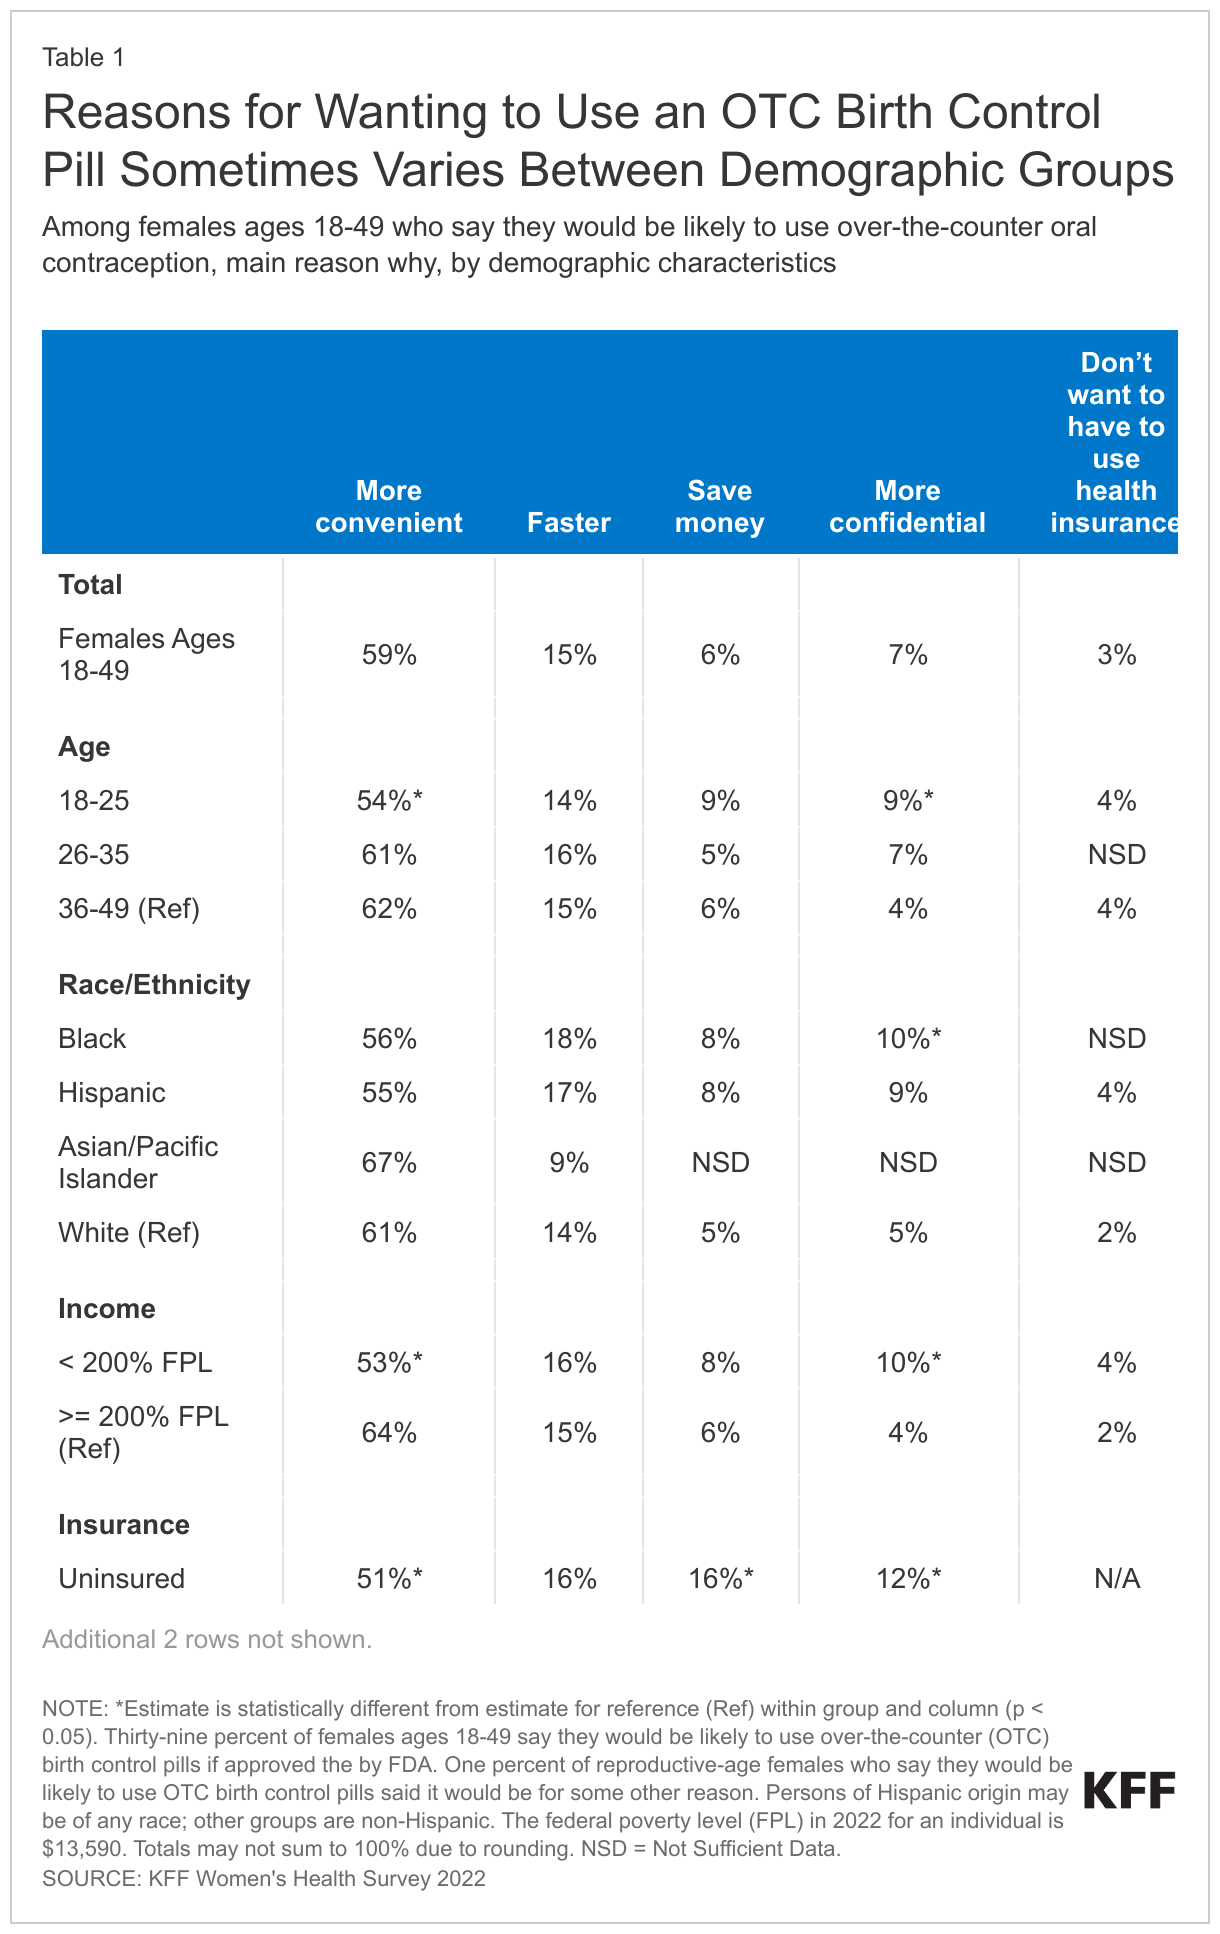
While convenience is the leading reason for wanting to use an OTC birth control pill across demographic groups, there are some differences within groups. Nearly two-thirds (64%) of higher-income (>= 200% FPL) reproductive age females who say they would be likely to use OTC birth control pills cite convenience as their main reason (Table 1). One in ten Black females (10%) and those ages 18 to 25 (9%) say their main reason is confidentiality, compared to 5% of White females and 4% of females ages 36-49. Sixteen percent of uninsured females say they would be likely to use OTC birth control pills mainly because they think it would save money, compared to 5% of those with private health insurance. Among reproductive age females likely to use OTC birth control pills, one in five (20%) with Medicaid say that it would be faster, compared to 13% of those with private insurance.
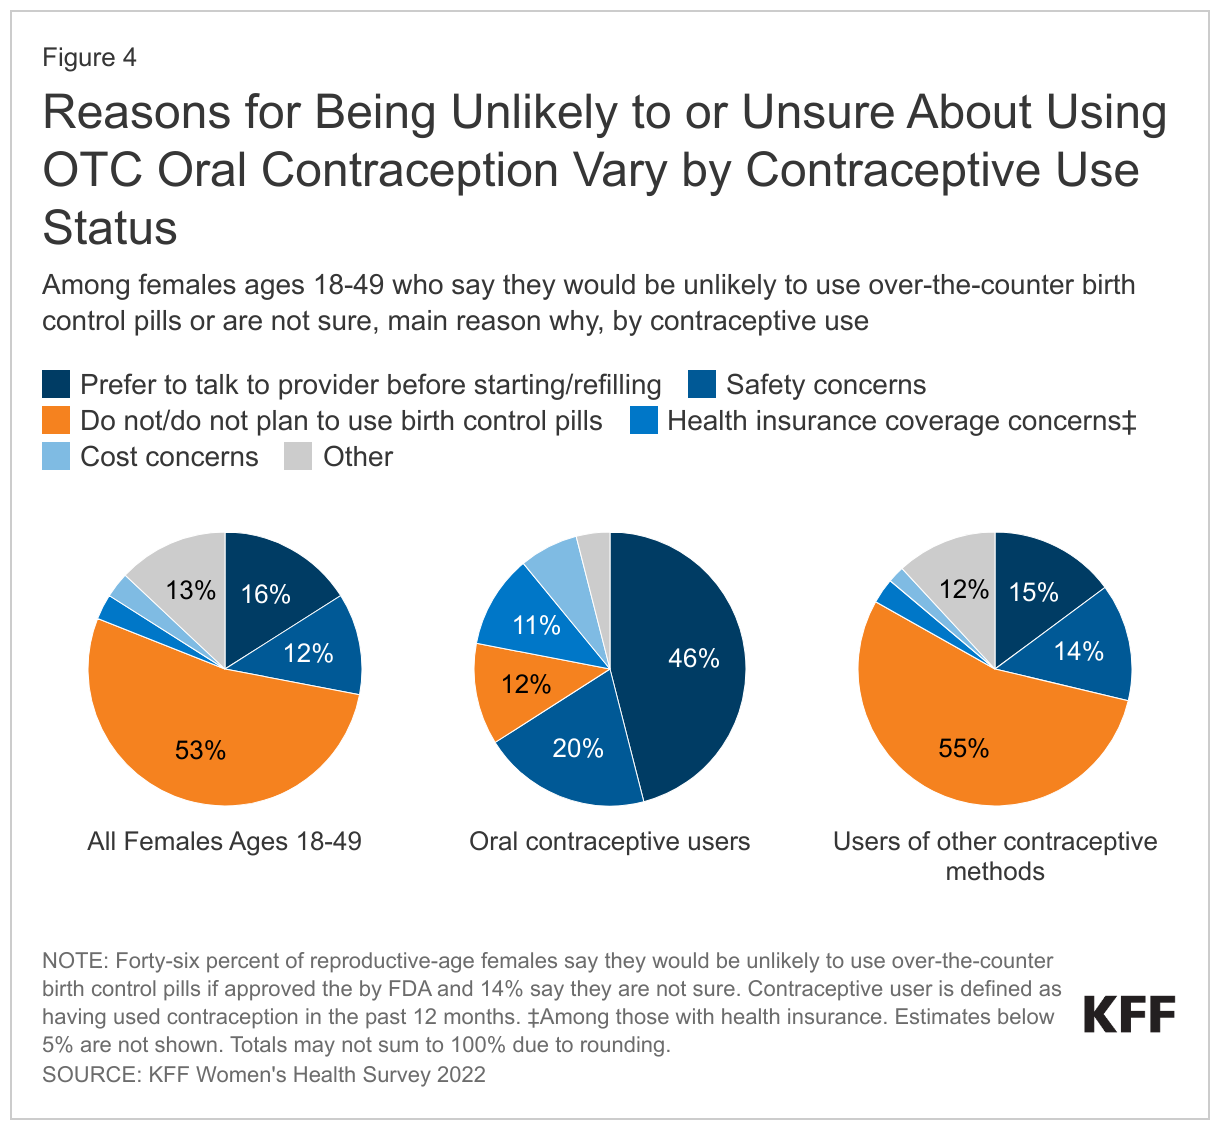
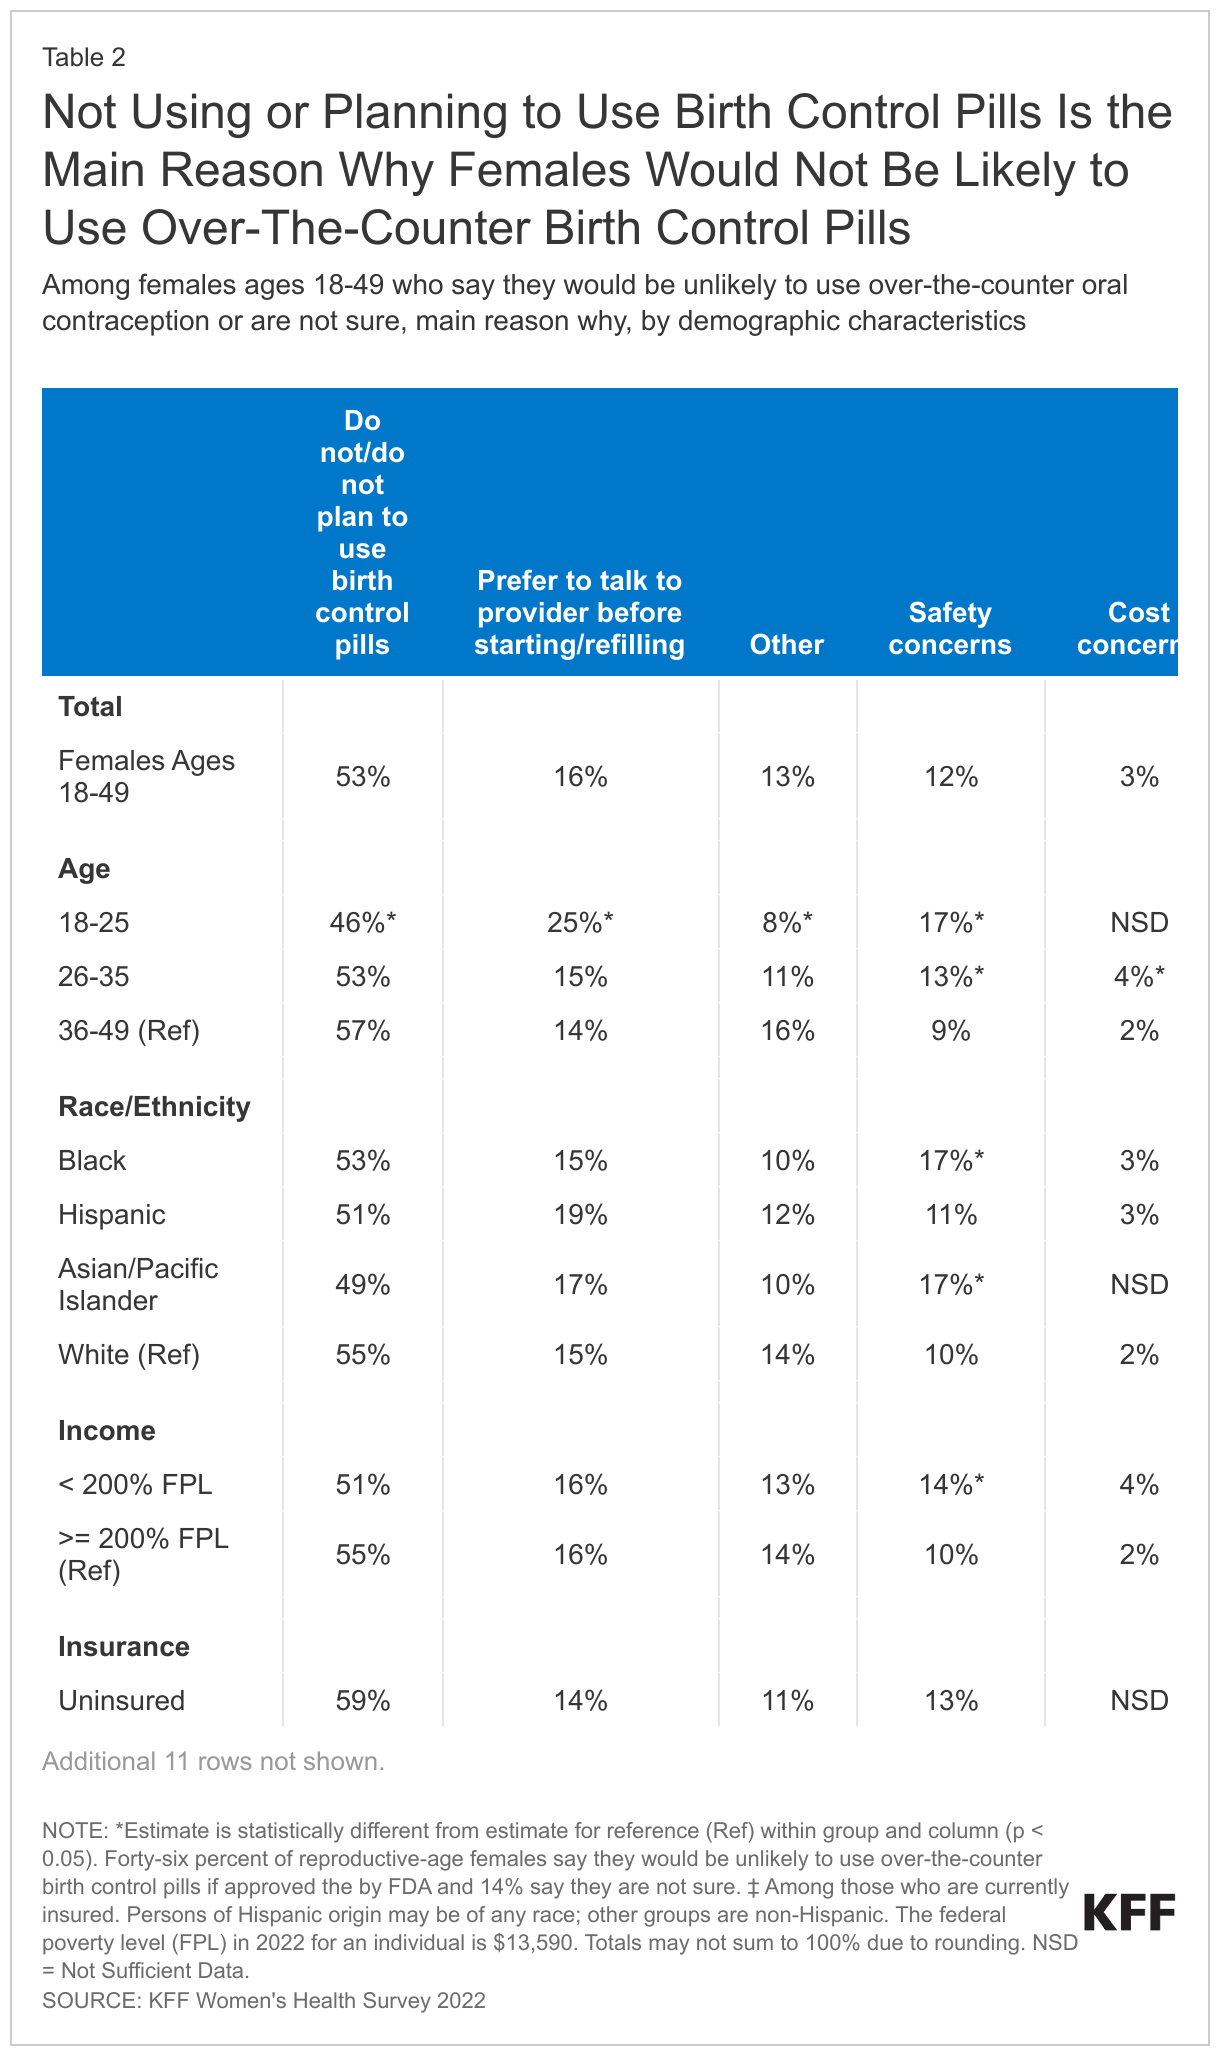
Among reproductive age females who say they would be somewhat or very unlikely to use OTC birth control pills without a prescription, or who are not sure, the majority (53%) say that the main reason is because they do not currently use birth control pills or do not plan to use them in the future (Figure 4). Sixteen percent say that they would prefer to talk to a health care provider before starting or refilling birth control pills; 12% cited safety concerns as the main reason they would be unlikely to use them; 3% said they would be concerned about the cost; and 3% would be concerned about whether their health insurance would cover them.
Thirteen percent of reproductive age females who are unlikely to or not sure if they would use OTC birth control pills without a prescription report that they are unlikely to use them for some other reason; common reasons include that they or their partner have had a sterilization procedure or that they prefer another method.
These estimates change, however, when looking at reproductive age females who have used oral contraceptives in the past 12 months and those who have used other methods of contraception. Among oral contraceptive users who say that they would be unlikely to use an OTC oral contraceptive or are not sure, the main reason is that they prefer to talk to a provider before starting or refilling birth control pills (46%), followed by safety concerns (20%). Among users of other contraceptive methods who say that they would be unlikely to use an OTC oral contraceptive or are not sure, the main reason is that they do not use or plan to use birth control pills (55%), followed by a preference for talking to a provider before starting or refilling birth control pills (15%).
Among reproductive age females who say they would be unlikely to use OTC birth control pills without a prescription, or who are not sure, 17% of those ages 18-25 cite safety concerns as the main reason compared to 9% of those ages 36-49 (Table 2). A larger share of those ages 18 to 25 (25%) cites a preference to talk to a health care provider before starting or refilling birth control than those ages 36-49 (14%). Seventeen percent of Black and Asian/Pacific Islander females say that they have safety concerns, higher than the share of White females (10%) who have the same concern.
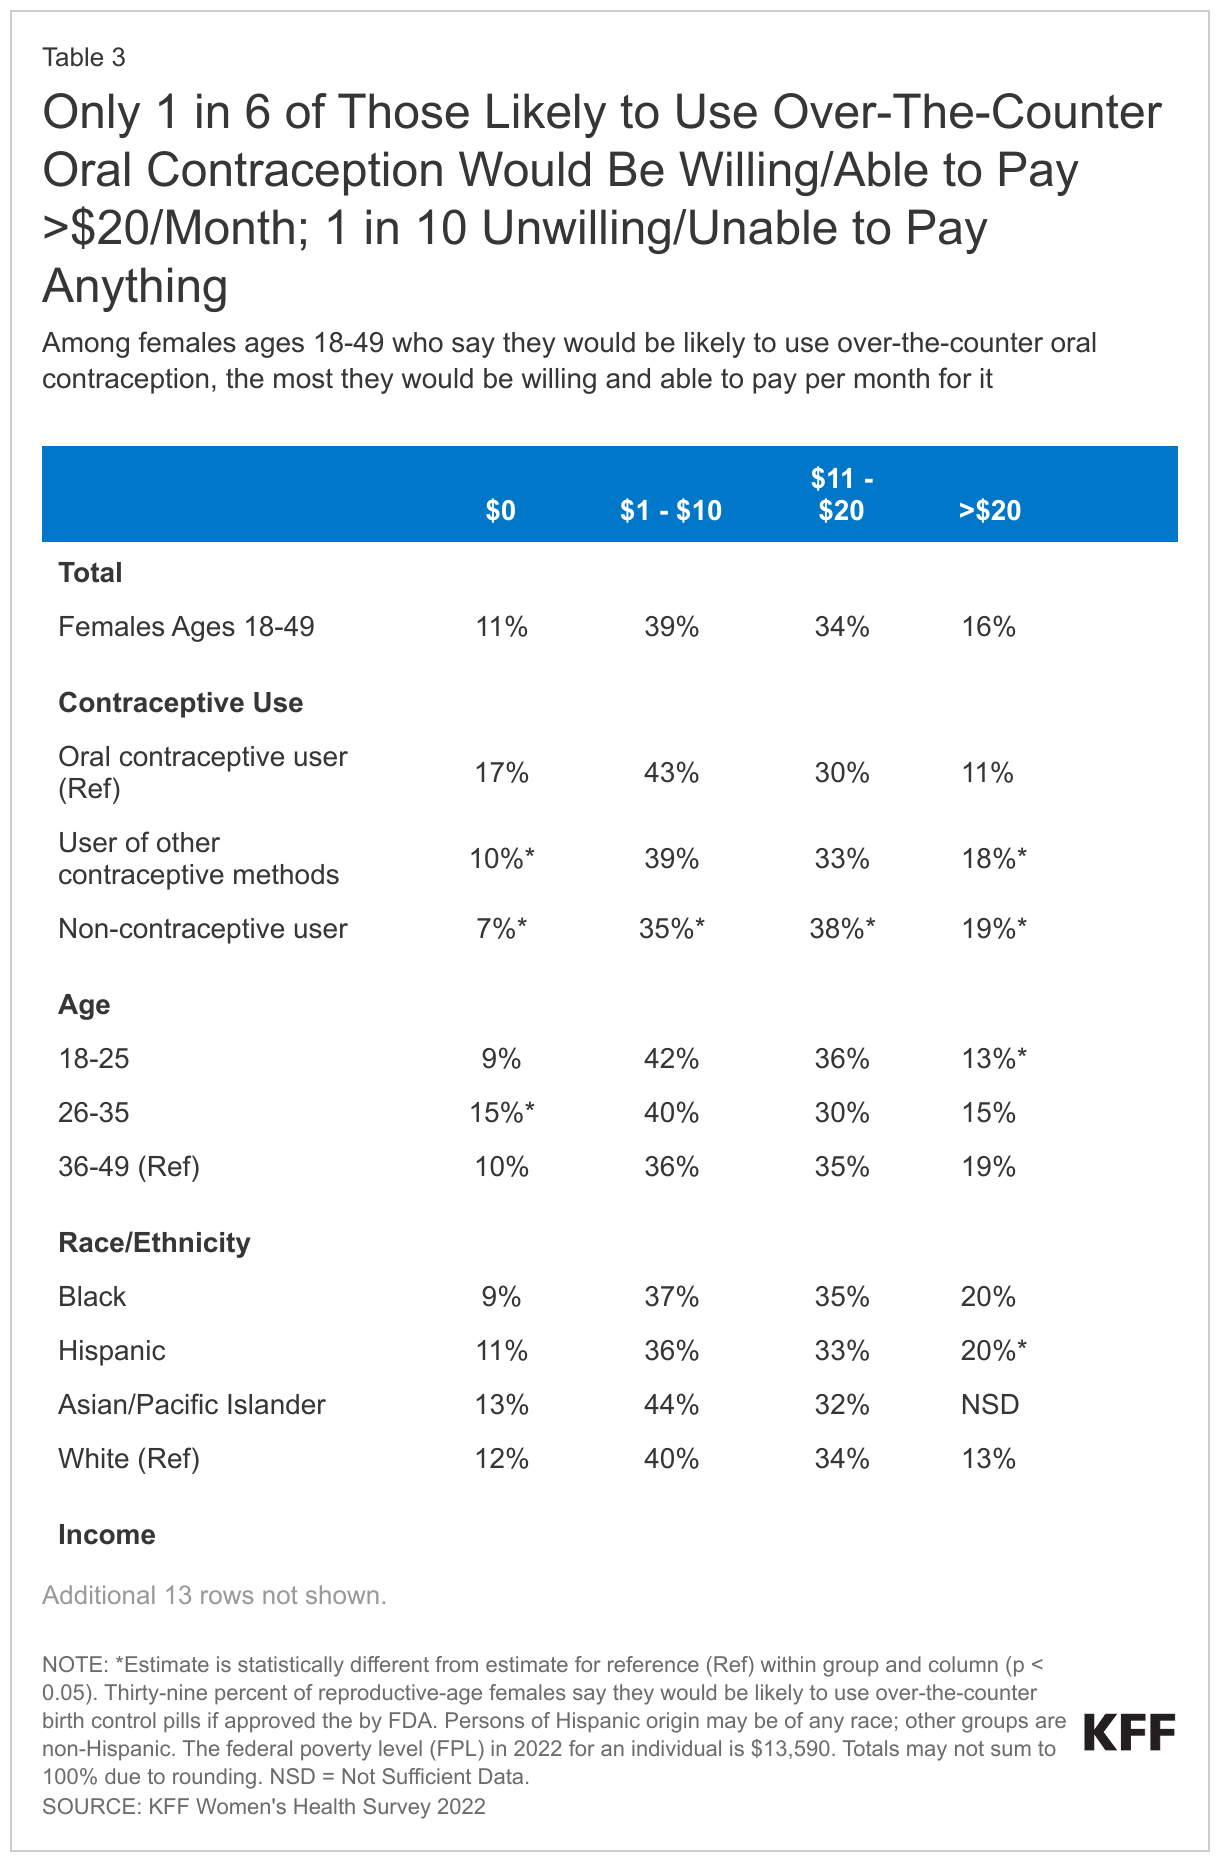
Among reproductive age females who report being likely to use OTC birth control pills, two in five (39%) would be willing and able to pay $1-$10 per month for them (Table 3). One-third (34%) would be willing and able to pay $11-$20 per month and 16% would pay more than $20. One in ten (11%) say they are unwilling or unable to pay anything for OTC birth control pills. Currently, most private insurance plans and Medicaid are required to cover the full cost of prescribed contraceptives.
Among those who say they are likely to use OTC birth control pills, 17% of oral contraceptive users say they would be unwilling or unable to pay anything for them, compared to 7% of contraceptive non-users. Nearly one in five (21%) uninsured females would pay more than $20 per month. Notably, there are no statistically significant differences by income level.
Looking Forward
There is broad support among females for an OTC oral contraceptive pill, and many are likely to use it. However, likely users are cost-sensitive, with only one in six willing and able to pay more than $20 per month for it and one in ten not willing or able to pay anything for it.
At the federal level, the Affordable Care Act requires most private health insurance plans to cover FDA-approved contraception for women; however, it must be prescribed in order for it to be covered. The most recent guidance about ACA implementation, issued by the Departments of Labor and Health and Human Services, and the Treasury in July 2022, states that plans and issuers are encouraged to cover OTC emergency contraceptive products with no cost sharing when they are purchased without a prescription, but the guidance does not currently require it.
At the state level, nine states currently require health plans regulated by the state, including fully-insured employer plans and individual plans, to cover OTC contraceptive medications without cost sharing, and without a prescription from a health care provider (three of those state laws apply to emergency contraception only). While no-cost coverage of prescription contraceptives has been required under Medicaid for decades, only six states and DC report covering OTC emergency contraception without a prescription in their Medicaid programs.
The pharmaceutical company that submitted an FDA application to switch from prescription-to-OTC status has not yet made price information publicly available. In addition to the retail cost, which will be an important consideration for those not using insurance, should a daily oral contraceptive pill become available OTC, accessibility and uptake will also depend on whether private health insurance and Medicaid cover it without a prescription.
Aside from the cost issues, many reproductive age women say they would still prefer to talk to a health care provider before starting or refilling birth control and others say they would still have safety concerns. These findings indicate that outreach and education will also play an important role in helping women understand their options in using an OTC oral contraceptive pill should the FDA approve the change in status.
This work was supported in part by Arnold Ventures. KFF maintains full editorial control over all of its policy analysis, polling, and journalism activities.
Methodology
Overview
The 2022 KFF Women’s Health Survey is a nationally representative survey of 6,442 people ages 18 to 64, including 5,201 females (self-reported sex at birth) and 1,241 males, conducted from May 10, 2022, to June 7, 2022. The objective of the survey is to help better understand respondents’ experiences with contraception, potential barriers to health care access, and other issues related to reproductive health. The survey was designed and analyzed by researchers at KFF (Kaiser Family Foundation) and fielded online and by telephone by SSRS using its Opinion Panel, supplemented with sample from IPSOS’s KnowledgePanel.
This work was supported in part by Arnold Ventures. KFF maintains full editorial control over all of its policy analysis, polling, and journalism activities.
Questionnaire design
KFF developed the survey instrument with SSRS feedback regarding question wording, order, clarity, and other issues pertaining to questionnaire quality. The survey was conducted in English and Spanish. The survey instrument is available upon request.
Sample design
The majority of respondents completed the survey using the SSRS Opinion Panel (n=5,202), a nationally representative probability-based panel where panel members are recruited in one of two ways: (1) through invitations mailed to respondents randomly sampled from an Address-Based Sample (ABS) provided by Marketing Systems Group through the U.S. Postal Service’s Computerized Delivery Sequence. (2) from a dual-framed random digit dial (RDD) sample provided by Marketing Systems Group.
In order to have large enough sample sizes for certain subgroups (females ages 18 to 35, particularly females in the following subgroups: lesbian/gay/bisexual; Asian; Black; Hispanic; Medicaid enrollees; low-income; and rural), an additional 1,240 surveys were conducted using the IPSOS KnowledgePanel, a nationally representative probability-based panel recruited using a stratified ABS design.
Data collection
Web Administration Procedures
The majority of surveys completed using the SSRS Opinion Panel (n=5,056) and all of the surveys completed using the KnowledgePanel (n=1,240) were self-administered web surveys. Panelists were emailed an invitation, which included a unique passcode-embedded link, to complete the survey online. In appreciation for their participation, panelists received a modest incentive in the form of a $5 or $10 electronic gift card. All respondents who did not respond to their first invitation received up to five reminder emails and panelists who had opted into receiving text messages from the SSRS Opinion Panel received text message reminders.
Overall, the median length of the web surveys was 13 minutes.
Phone Administration Procedures
In addition to the self-administered web survey, n=146 surveys were completed by telephone with SSRS Opinion Panelists who are web reluctant. Overall, the median length of the phone surveys was 28 minutes.
Data processing and integration
SSRS implemented several quality assurance procedures in data file preparation and processing. Prior to launching data collection, extensive testing of the survey was completed to ensure it was working as anticipated. After the soft launch, survey data were carefully checked for accuracy, completeness, and non-response to specific questions so that any issues could be identified and resolved prior to the full launch.
The data file programmer implemented a “data cleaning” procedure in which web survey skip patterns were created in order to ensure that all questions had the appropriate numbers of cases. This procedure involved a check of raw data by a program that consisted of instructions derived from the skip patterns designated on the questionnaire. The program confirmed that data were consistent with the definitions of codes and ranges and matched the appropriate bases of all questions. The SSRS team also reviewed preliminary SPSS files and conducted an independent check of all created variables to ensure that all variables were accurately constructed.
As a standard practice, quality checks were incorporated into the survey. Quality control checks for this study included a review of “speeders,” reviewing the internal response rate (number of questions answered divided by the number of questions asked) and open-ended questions. Among all respondents, the vast majority (97%) answered 96% or more of the survey questions they received, with no one completing less than 91% of the administered survey (respondents were informed at the start of the survey that they could skip any question).
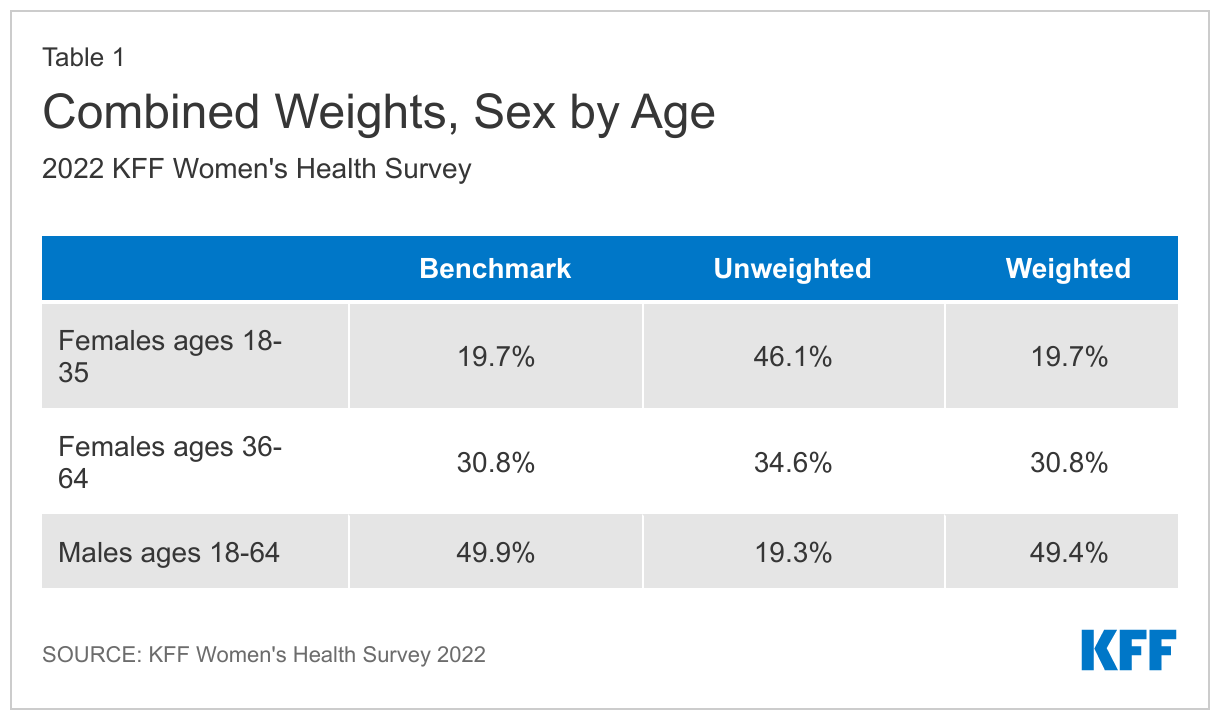
Weighting
The data were weighted to represent U.S. adults ages 18 to 64. The data include oversamples of females ages 18 to 35 and females ages 36 to 64. Due to this oversampling, the data were classified into three subgroups: females 18 to 35, females 36 to 64, and males 18 to 64. The weighting consisted of two stages: 1) application of base weights and 2) calibration to population parameters. Each subgroup was calibrated separately, then the groups were put into their proper proportions relative to their size in the population.
Calibration to Population Benchmarks
The sample was balanced to match estimates of each of the three subgroups (females ages 18 to 35, females ages 36 to 64, and males ages 18 to 64) along the following dimensions: age; education (less than a high school graduate, high school graduate, some college, four-year college or more); region (Northeast, Midwest, South, West); and race/ethnicity (White non-Hispanic, Black non-Hispanic, Hispanic-born in U.S., Hispanic-born Outside the U.S., Asian non-Hispanic, Other non-Hispanic). The sample was weighted within race (White, non-Hispanic; Black, non-Hispanic; Hispanic; and Asian) to match population estimates. Benchmark distributions were derived from 2021 Current Population Survey (CPS) data.
Weighting summaries for females ages 18 to 35, females ages 36 to 64, and males ages 18 to 64 are available upon request.
Finally, the three weights were combined, and a final adjustment was made to match the groups to their proper proportions relative to their size in the population (Table 1).
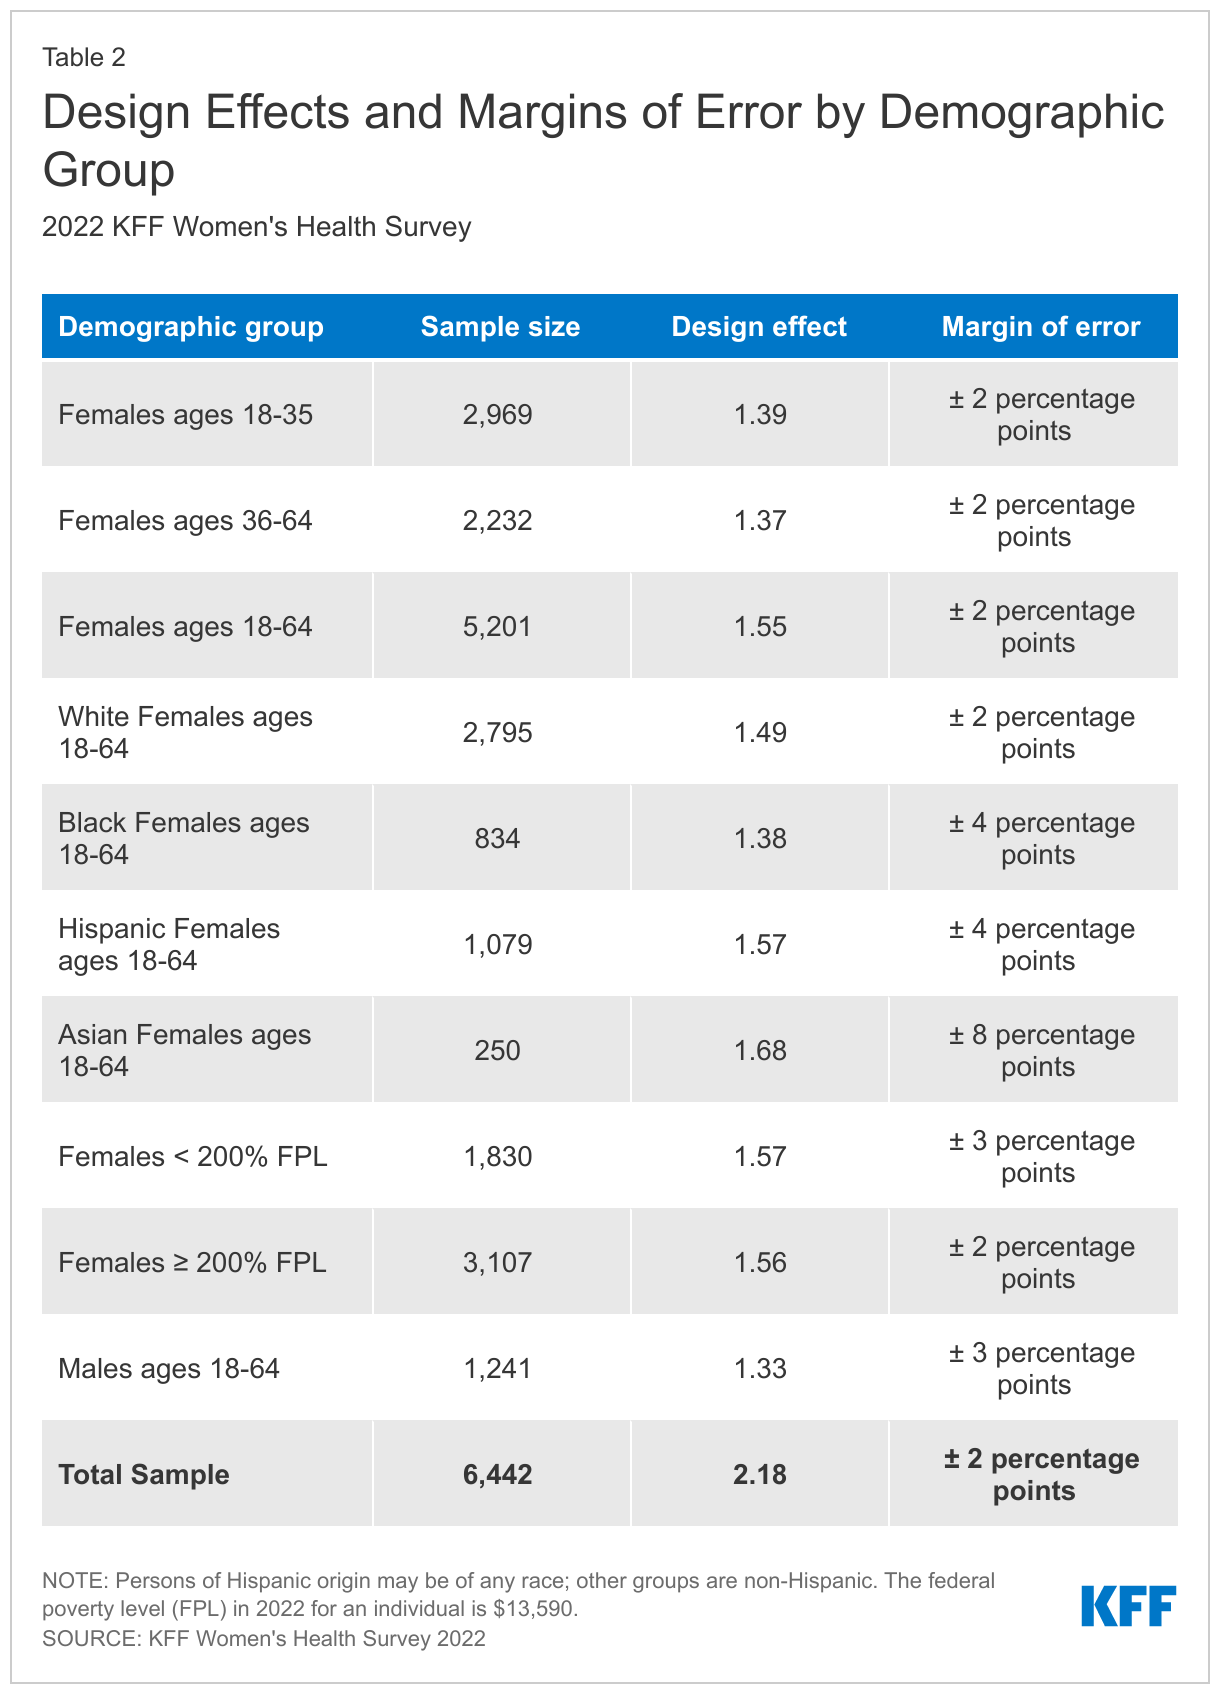
Margin of Sampling Error
The margin of sampling error, including the design effect for subgroups, is presented in Table 2 below. It is important to remember that the sampling fluctuations captured in the margin of error are only one possible source of error in a survey estimate and there may be other unmeasured error in this or any other survey.
KFF Analysis
Researchers at KFF conducted further data analysis using the R survey package, including creating constructed variables, running additional testing for statistical significance, and coding responses to open-ended questions. The survey instrument is available upon request.
Rounding and sample sizes
Some figures in the report do not sum to totals due to rounding. Although overall totals are statistically valid, some breakdowns may not be available due to limited sample sizes or cell sizes. Where the unweighted sample size is less than 100 or where observations are less than 10, figures include the notation “NSD” (Not Sufficient Data).
Statistical significance
All statistical tests are performed at the .05 confidence level. Statistical tests for a given subgroup are tested against the reference group (Ref.) unless otherwise indicated. For example, White is the standard reference for race/ethnicity comparisons and private insurance is the standard reference for types of insurance coverage. Some breakouts by subsets have a large standard error, meaning that sometimes even large differences between estimates are not statistically different.
A note about sex and gender language
Our survey asked respondents which sex they were assigned at birth, on their original birth certificate (male or female). They were then asked what their current gender is (man, woman, transgender, non-binary, or other). Those who identified as transgender men are coded as men and transgender women are coded as women. While we attempted to be as inclusive as possible and recognize the importance of better understanding the health of non-cisgendered people, as is common in many nationally representative surveys, we did not have a sufficient sample size (n >= 100) to report gender breakouts other than men and women with confidence that they reflect the larger non-cisgender population as a whole. The data in our reproductive health reports use the respondent’s sex assigned at birth (inclusive of all genders) to account for reproductive health needs/capacity (e.g., ever been pregnant) while the data in our other survey reports use the respondent’s gender.
Endnotes
Respondents were asked their sex assigned at birth as well as their gender identity. This brief presents data on respondents who said they were assigned female at birth and includes all gender identities, including transgender, non-binary, and others. ↩︎
The federal poverty level (FPL) in 2022 for an individual is $13,590. ↩︎
Contraceptive care is an important component of overall health care for many people. Federal and state policies shape access to and the availability of contraceptive care, but factors such as provider characteristics, as well as individual preferences and experiences also impact contraceptive choices and use. This report provides a close examination of reproductive age (18-49) females’ (including those who identify as women and other genders) experiences with contraception, insurance coverage, contraceptive preferences, and interactions with the health care system based on an analysis of the 2022 KFF Women’s Health Survey, a nationally representative survey of females ages 18 to 64 in the U.S.
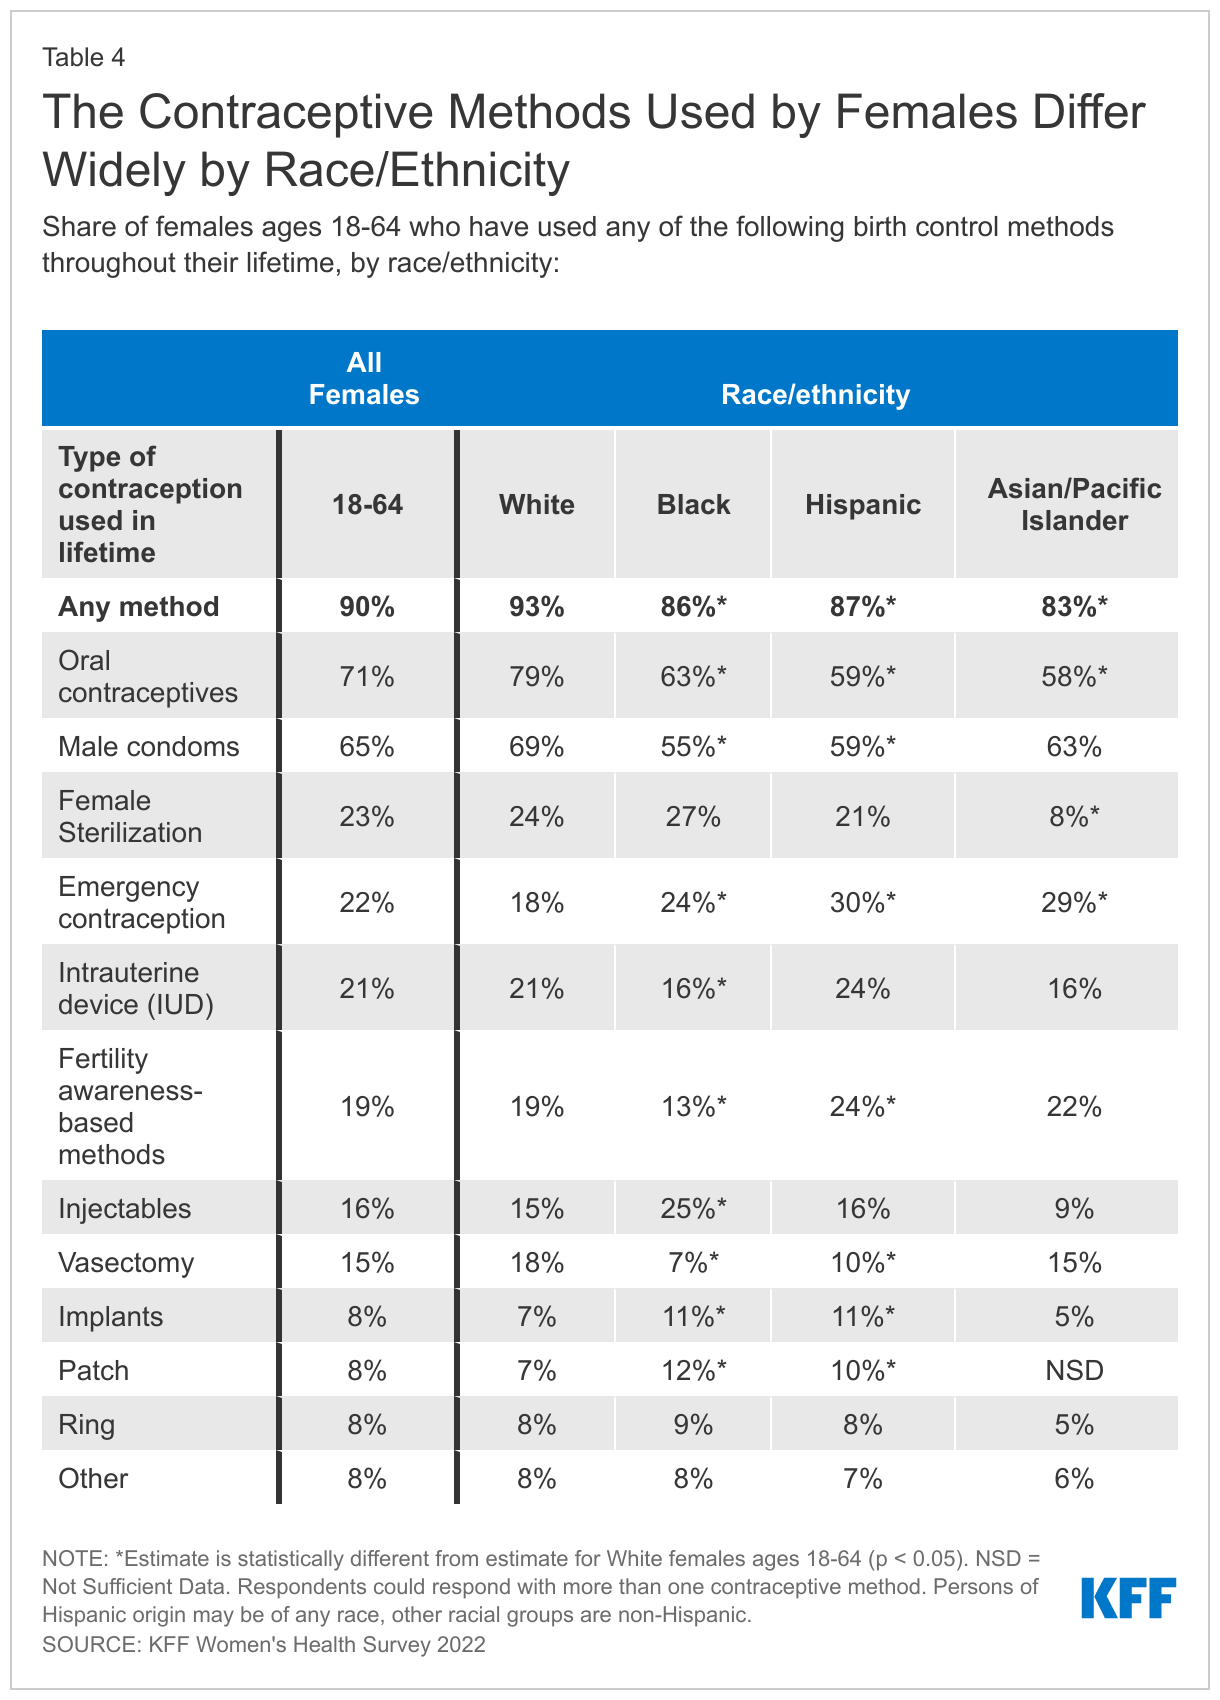
Use of Contraceptives
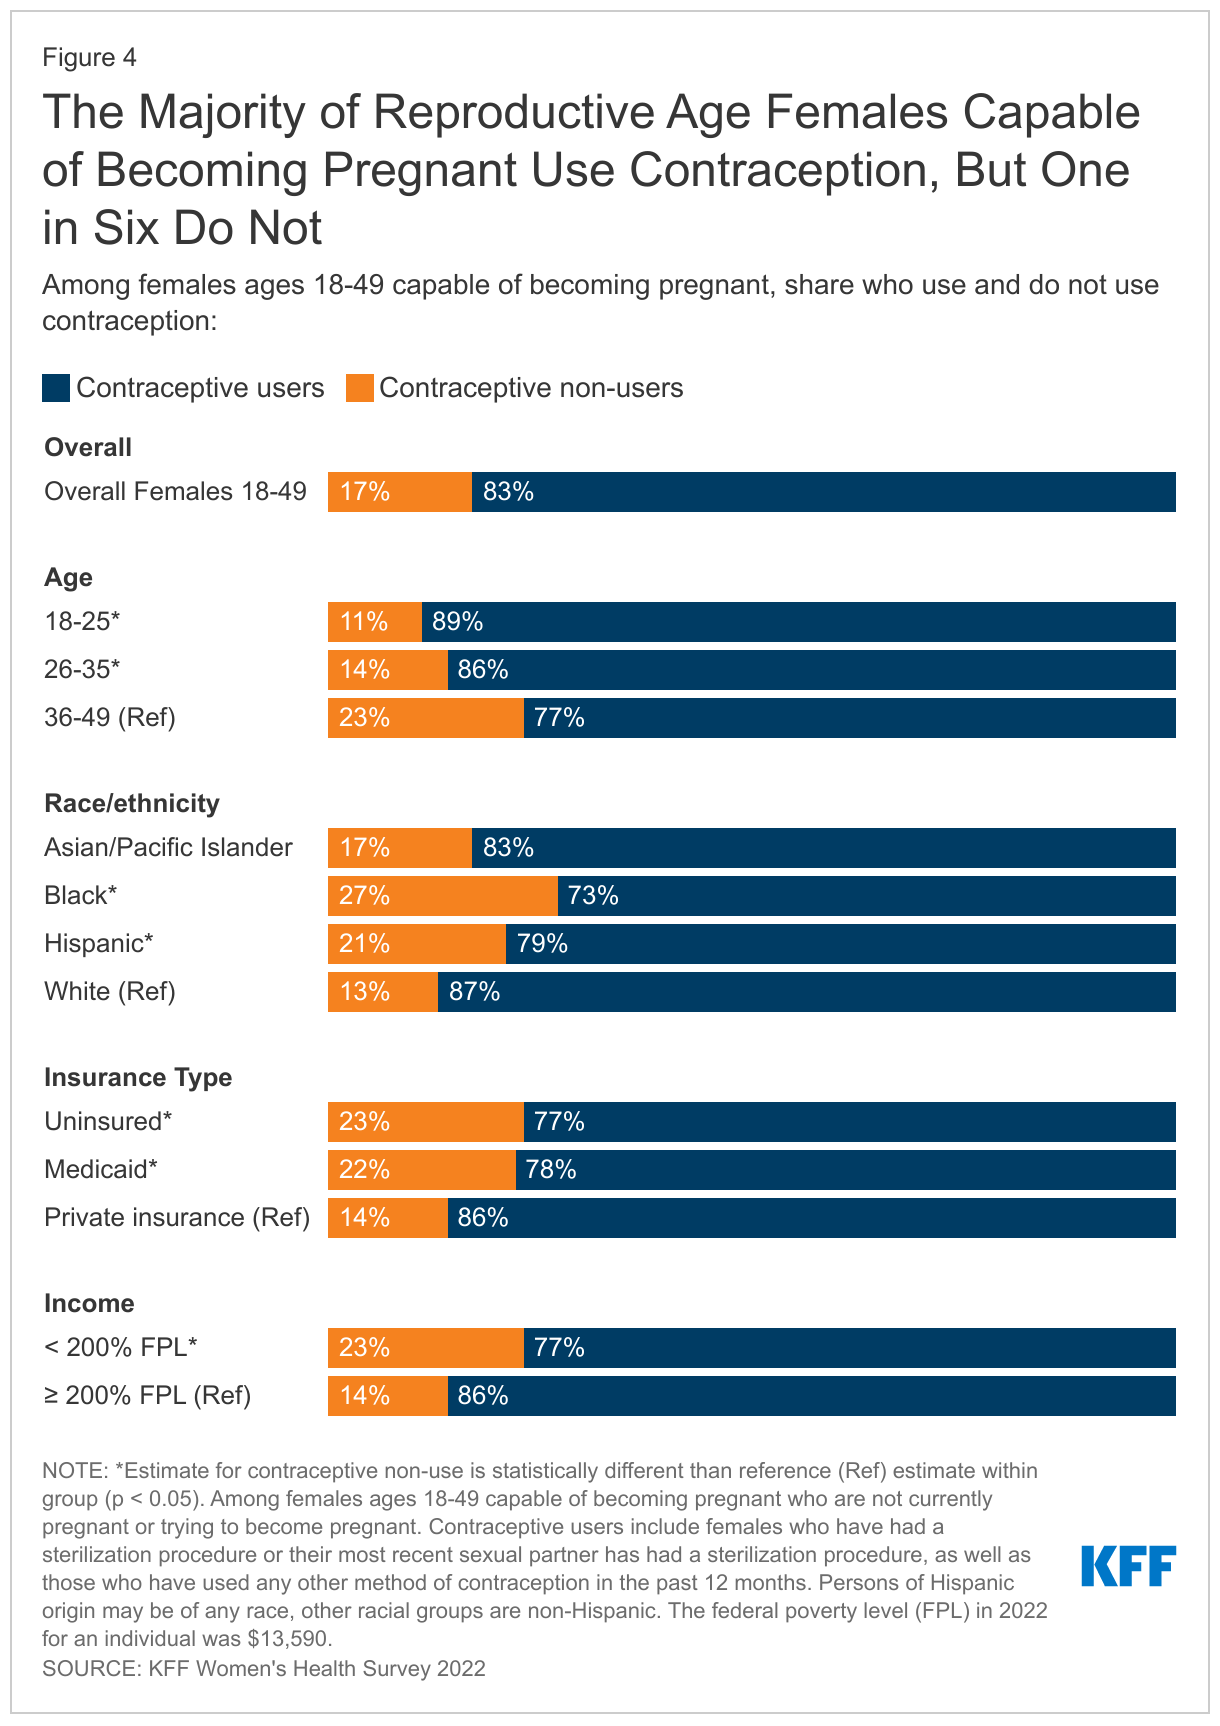
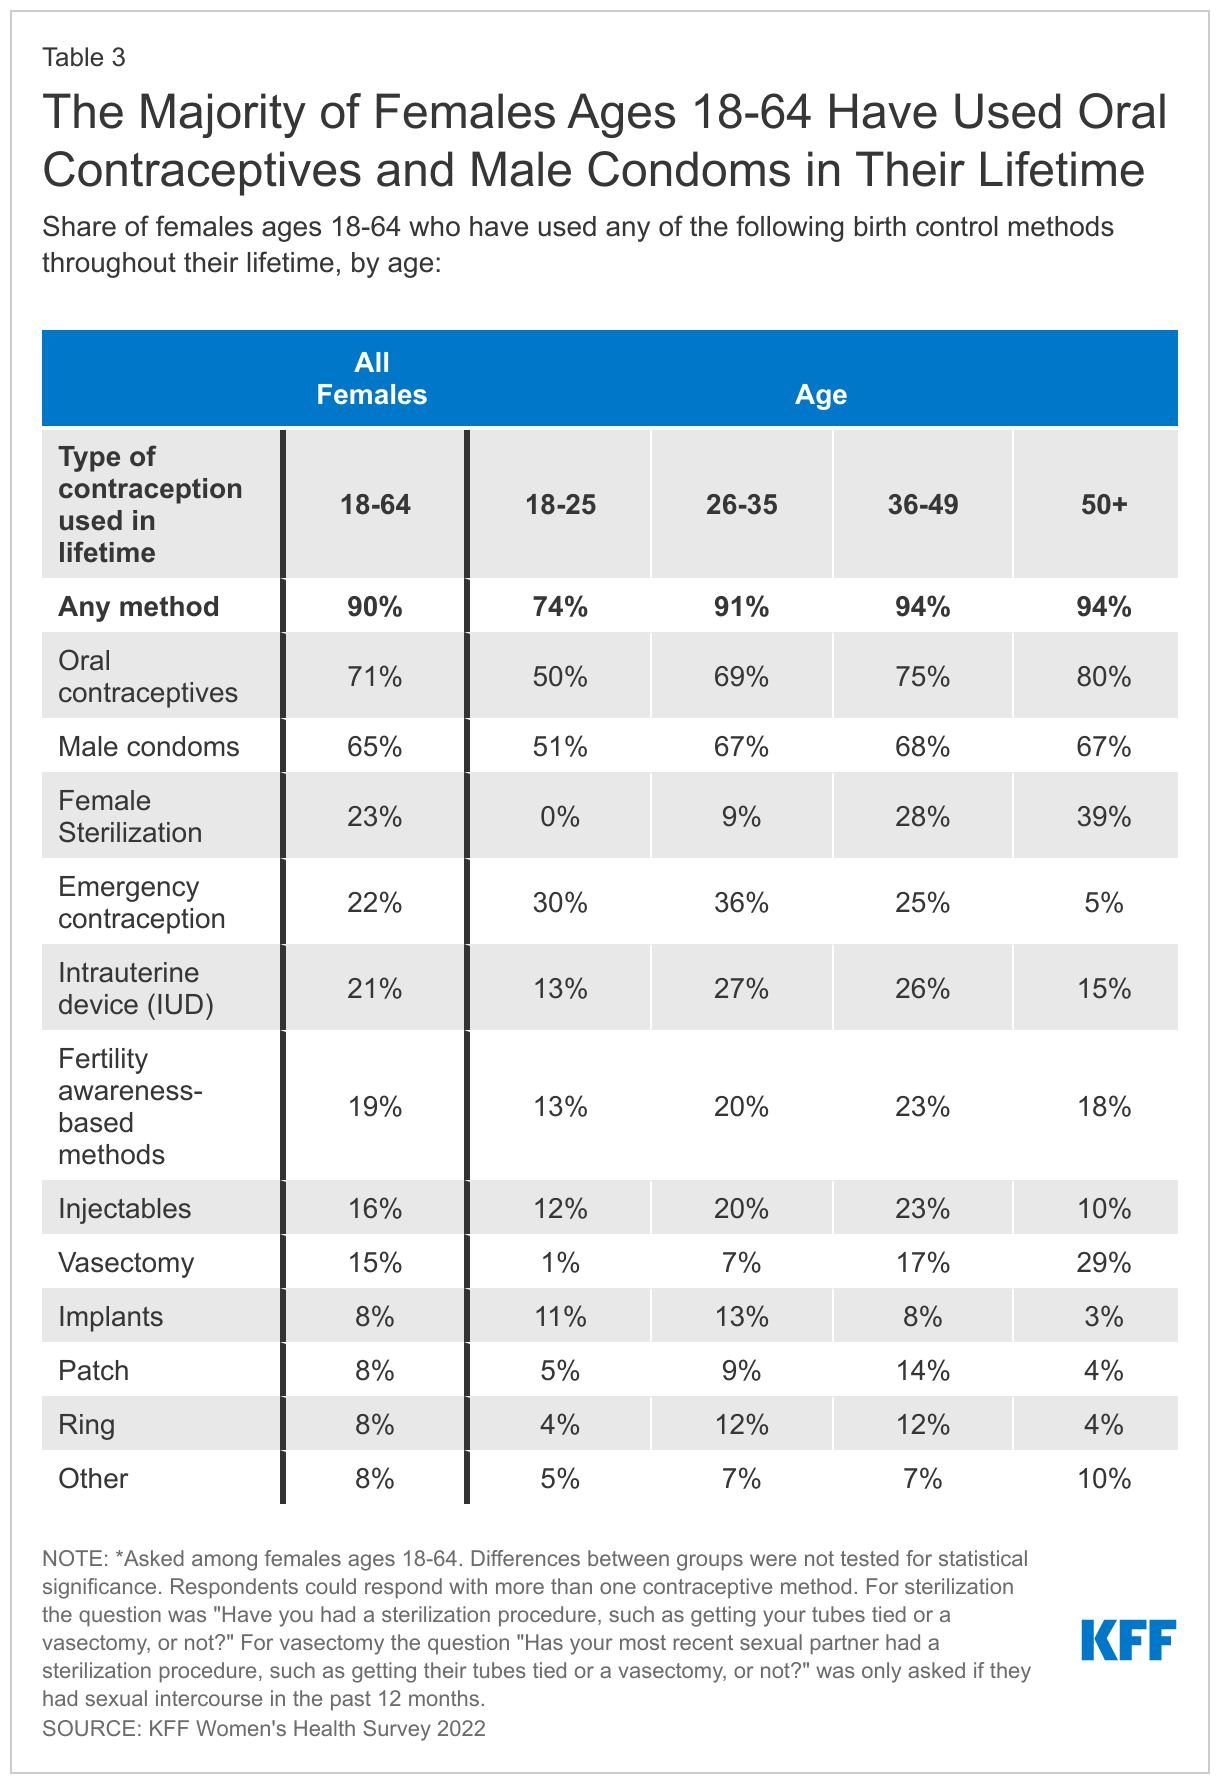
The majority of females 18 to 64 (90%) have used contraception at some point in their reproductive years and many have used more than one contraceptive method throughout their lifetime (76%). People’s needs and preferences for different types of methods can change and speaks to the importance of having a broad range of contraceptive options available. Not surprisingly, most people use contraception to prevent pregnancy (85%), but four in ten also say that they use contraception for another reason such as managing a medical condition or preventing a sexually transmitted infection (STI).
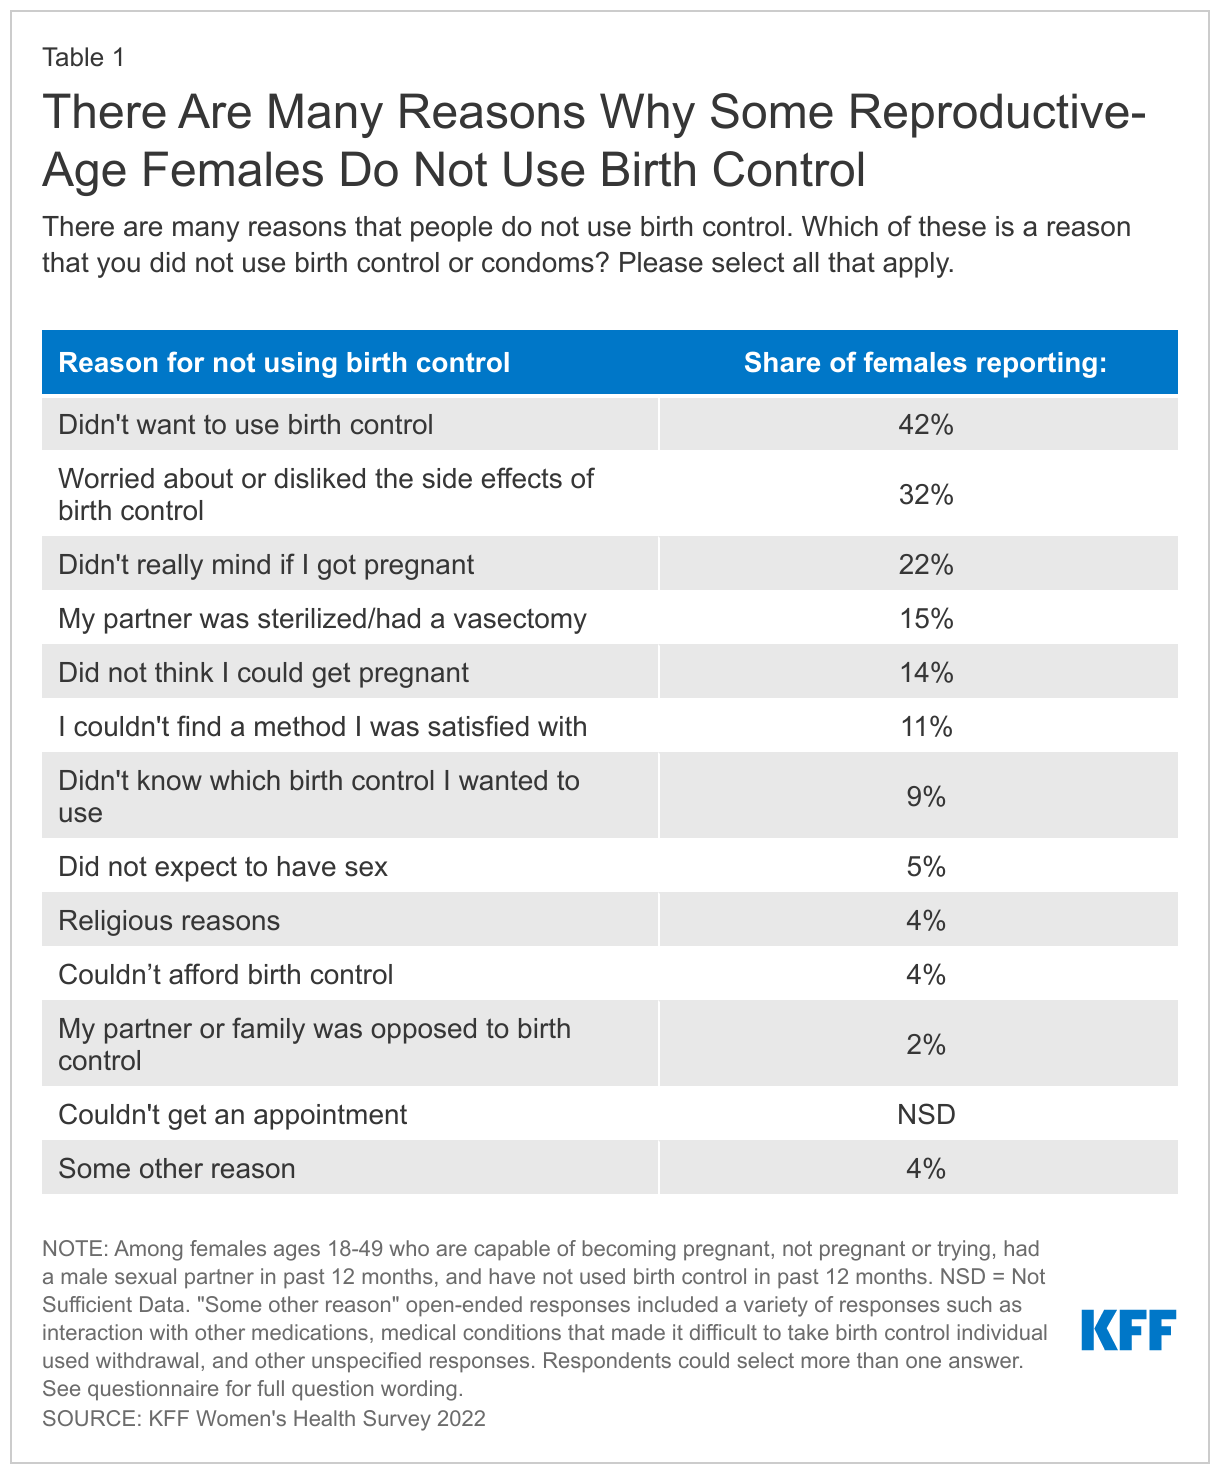
Not all people who want to prevent pregnancy use contraceptives. One in six (17%) sexually active females who say they are not trying to get pregnant are not using contraception. There are many reasons why people may not use contraceptives, ranging from concerns about side effects, lack of desire to use a method, to those who aren’t trying but would not mind if they got pregnant or have religious reasons.
Contraceptive Coverage
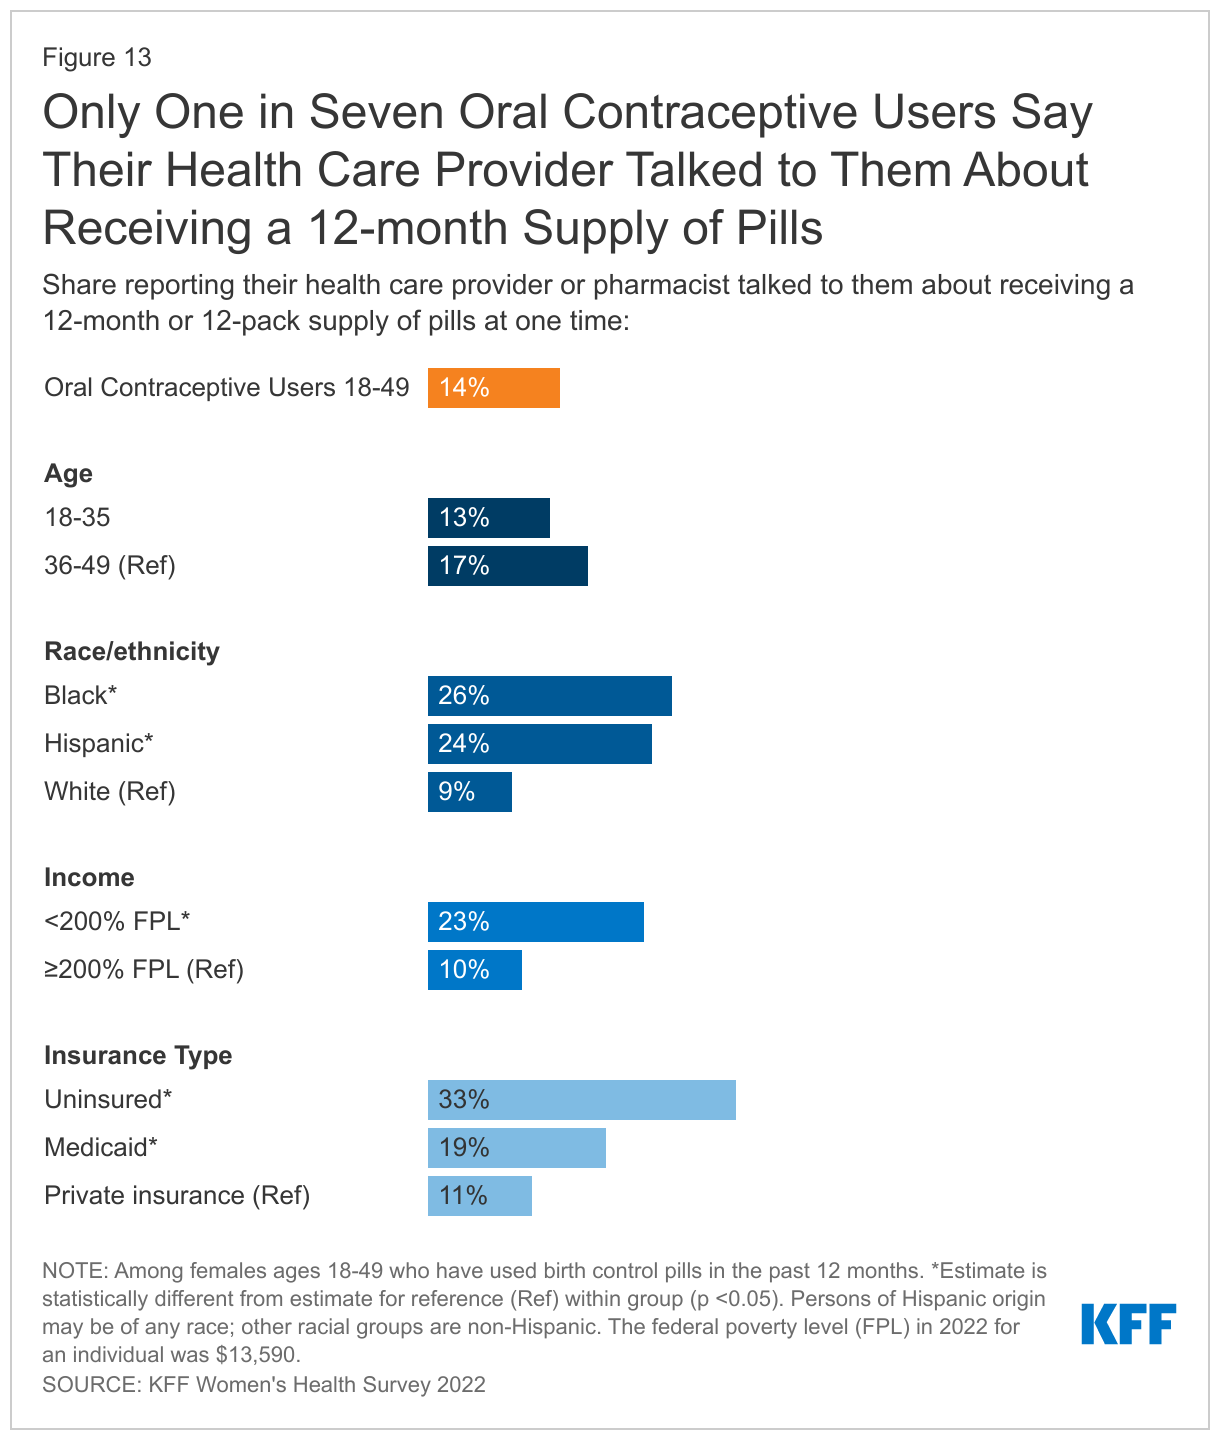
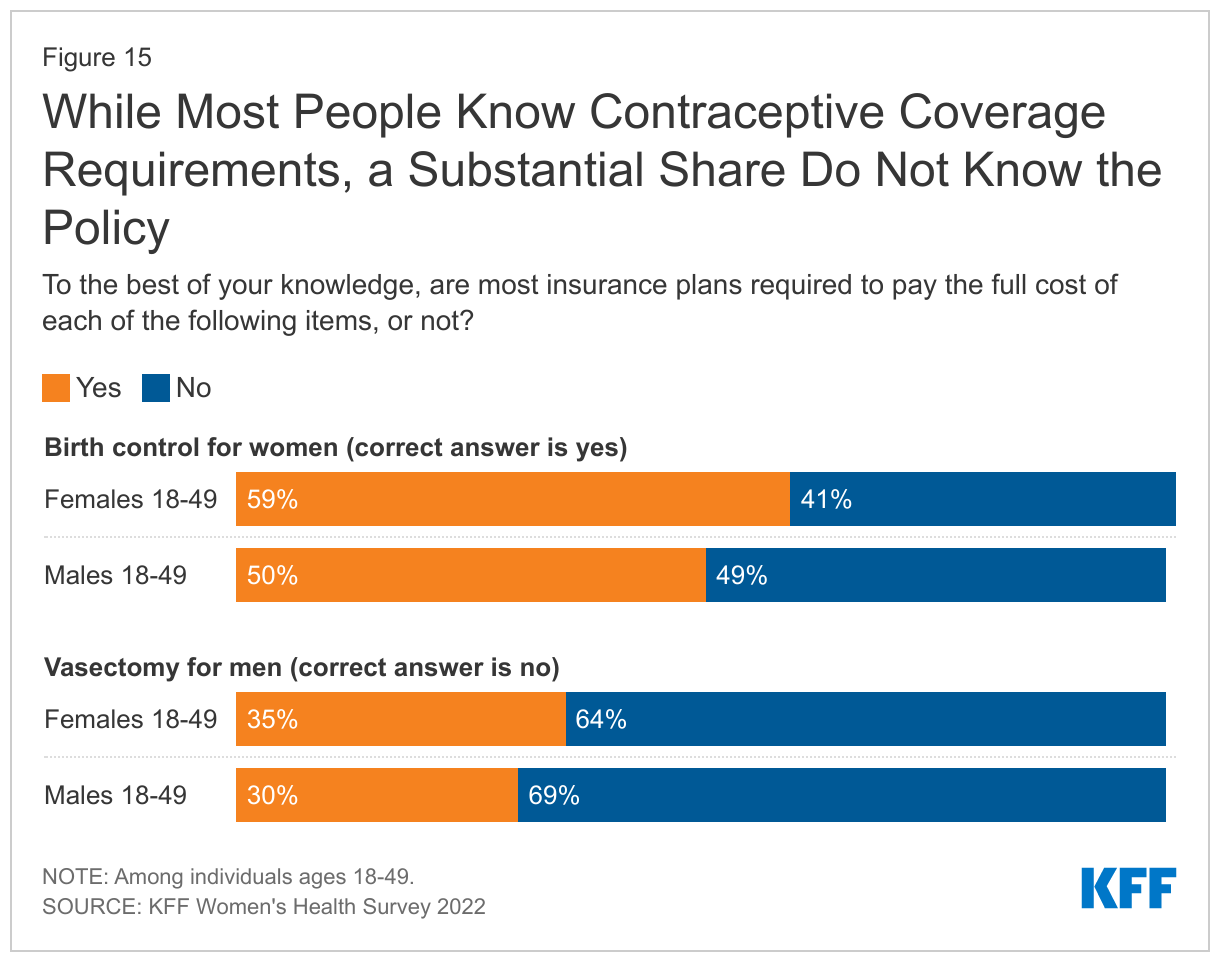
Although the ACA has required contraceptive coverage for over a decade, many still do not know about the policy and some privately insured females are still paying for their contraceptives. Four in ten (41%) females of reproductive age do not know that most insurance plans are required to pay the full cost of birth control for women.
While most females (70%) with private insurance say their insurance covered the full cost of their most recent birth control method, a quarter say they paid at least part of the cost out-of-pocket. Of those who paid out of pocket, 16% say it was because they wanted a certain brand of contraception that was not covered by their plan (even though their plan should cover it if their provider recommends it for them). Others say it is because their prescribing provider (10%) or pharmacy (5%) was out of network. Half did not know why they had to pay.
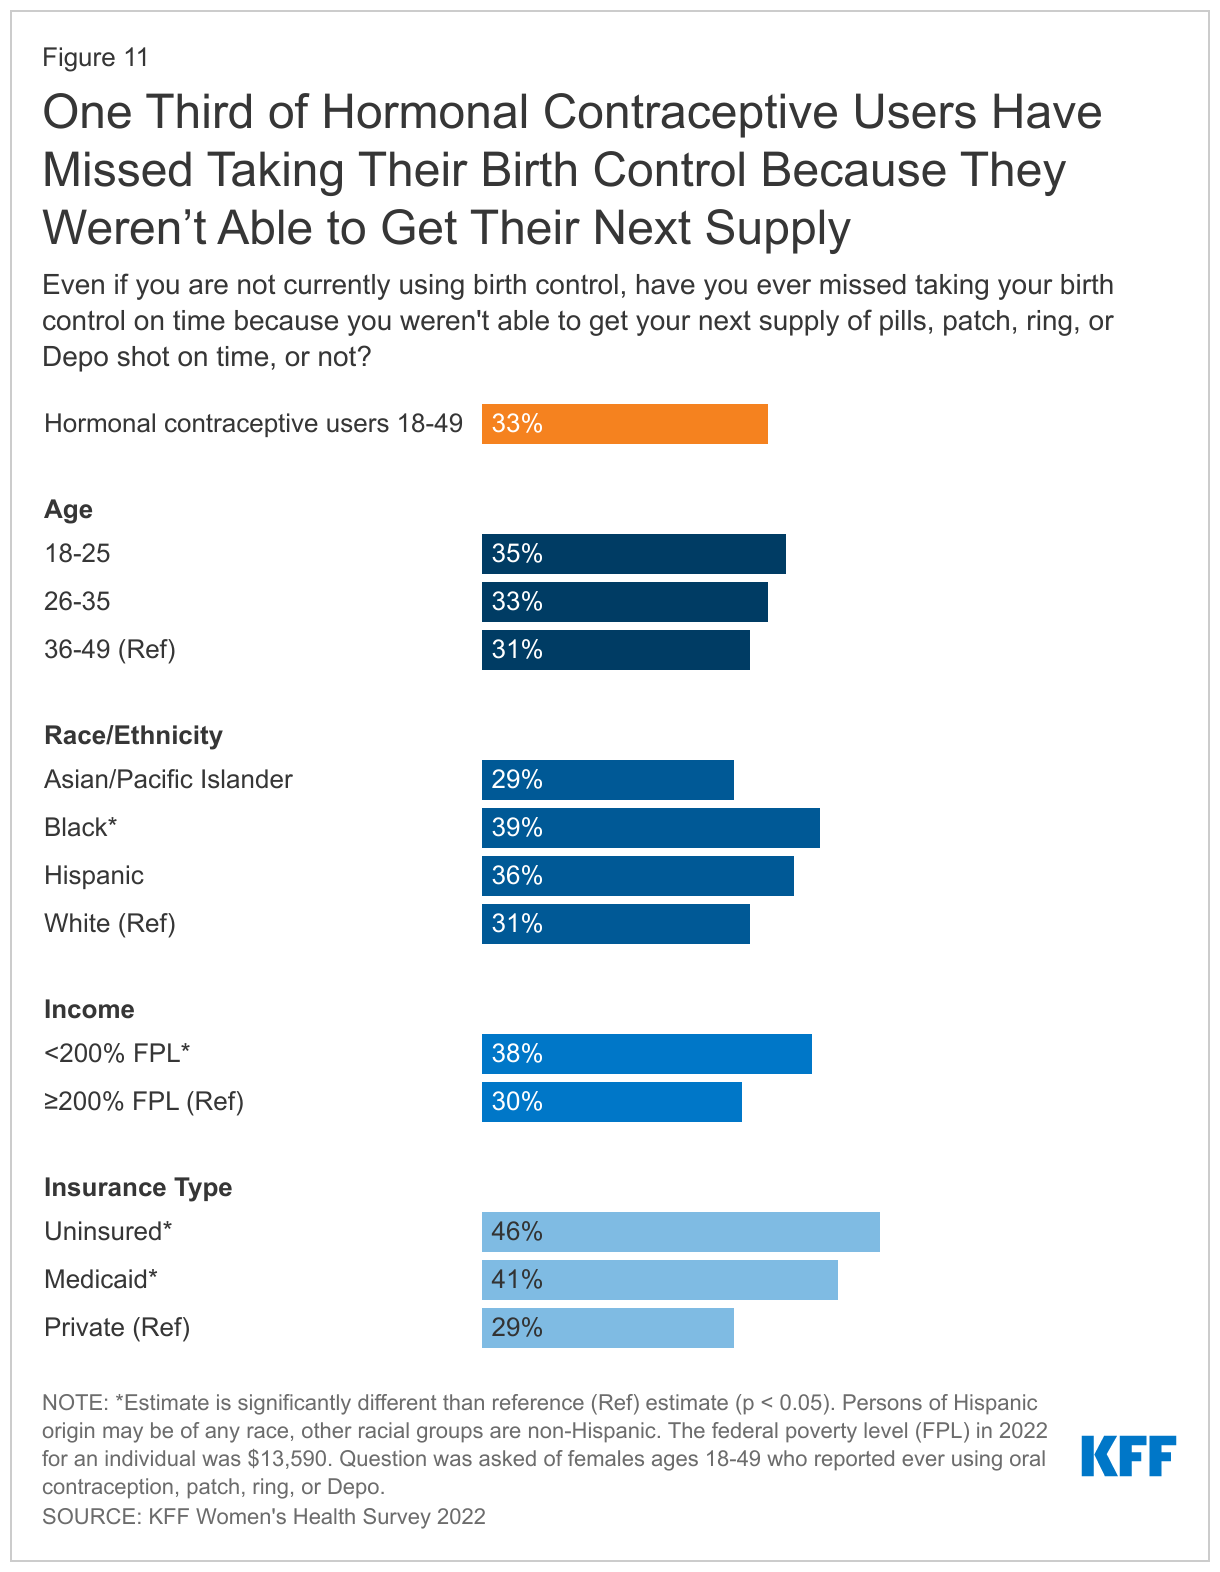
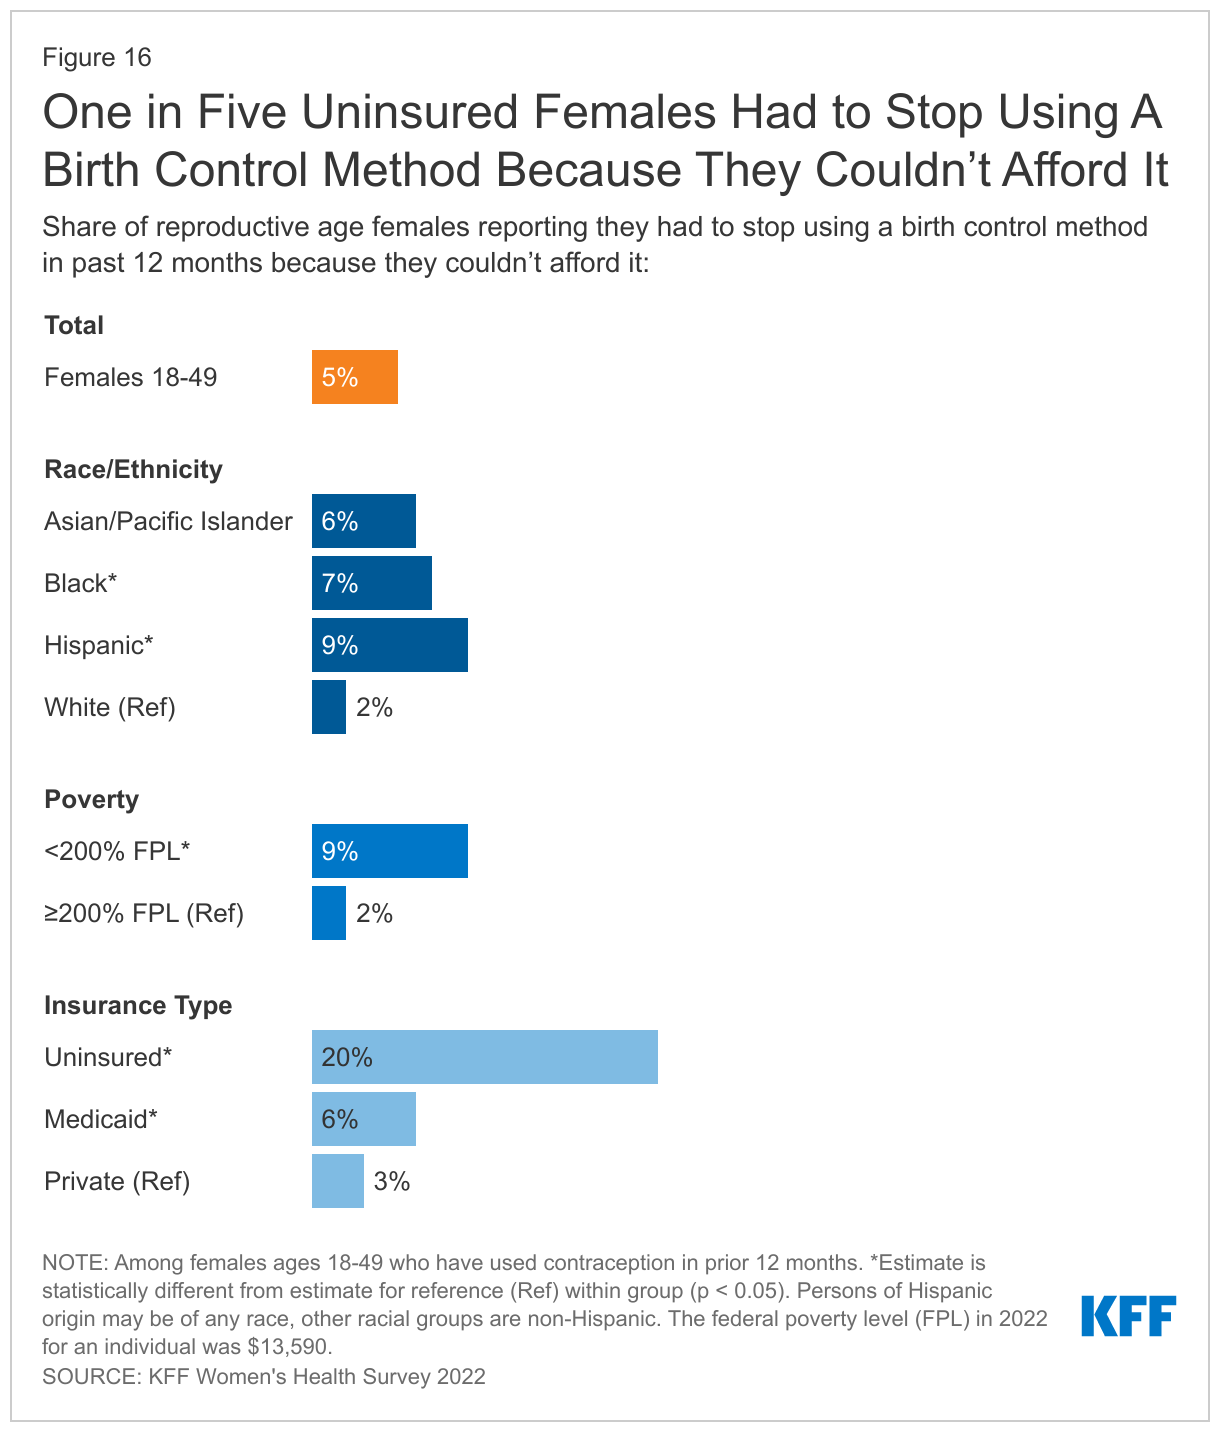
Cost can be a barrier to contraceptive use for some. One in five uninsured females of reproductive age say they had to stop using a contraceptive method because they couldn’t afford it. A smaller share of those on Medicaid (6%) or with private coverage (3%) cited cost as a barrier to continued use. For low-income women, 17% said cost was the leading reason they weren’t using their preferred method.
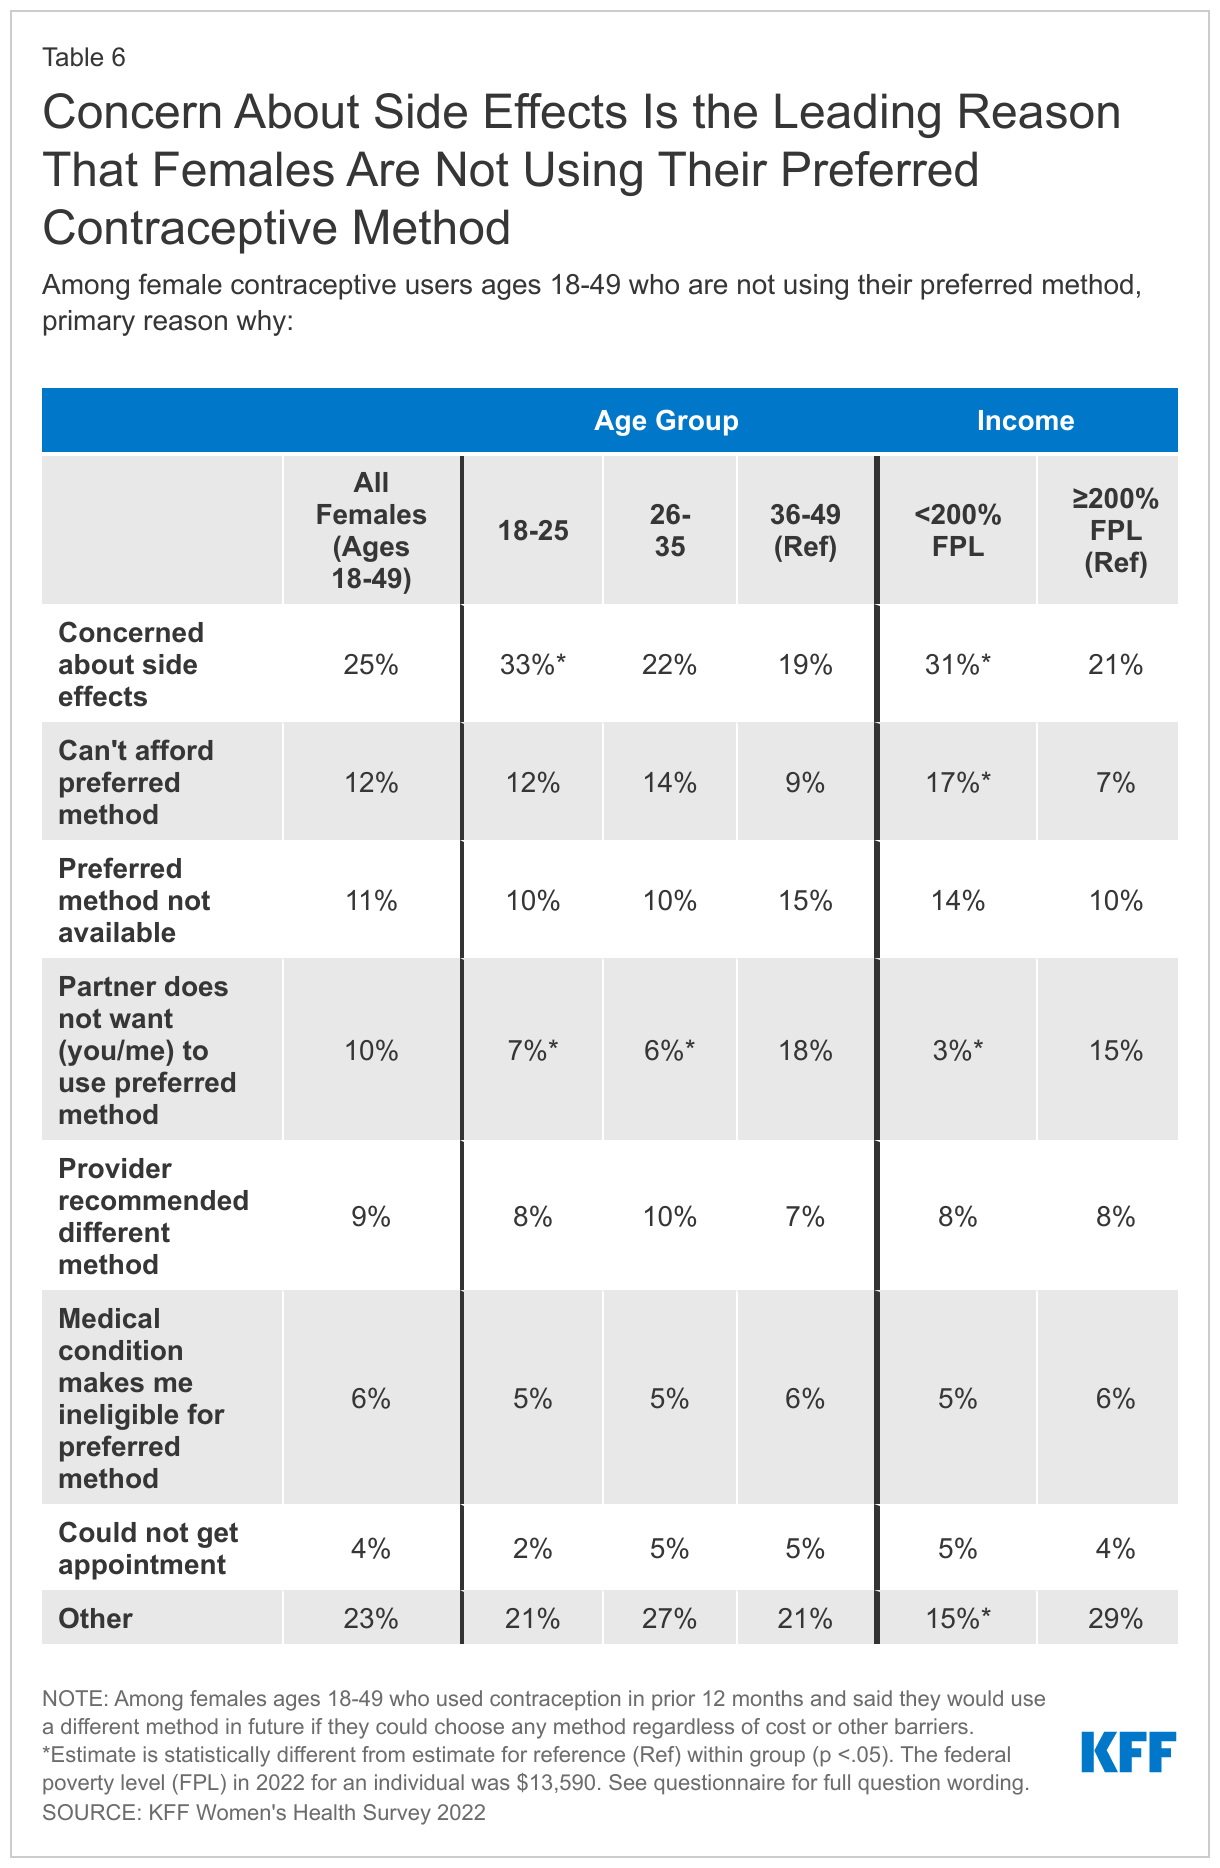
Contraceptive Preferences and Side Effects
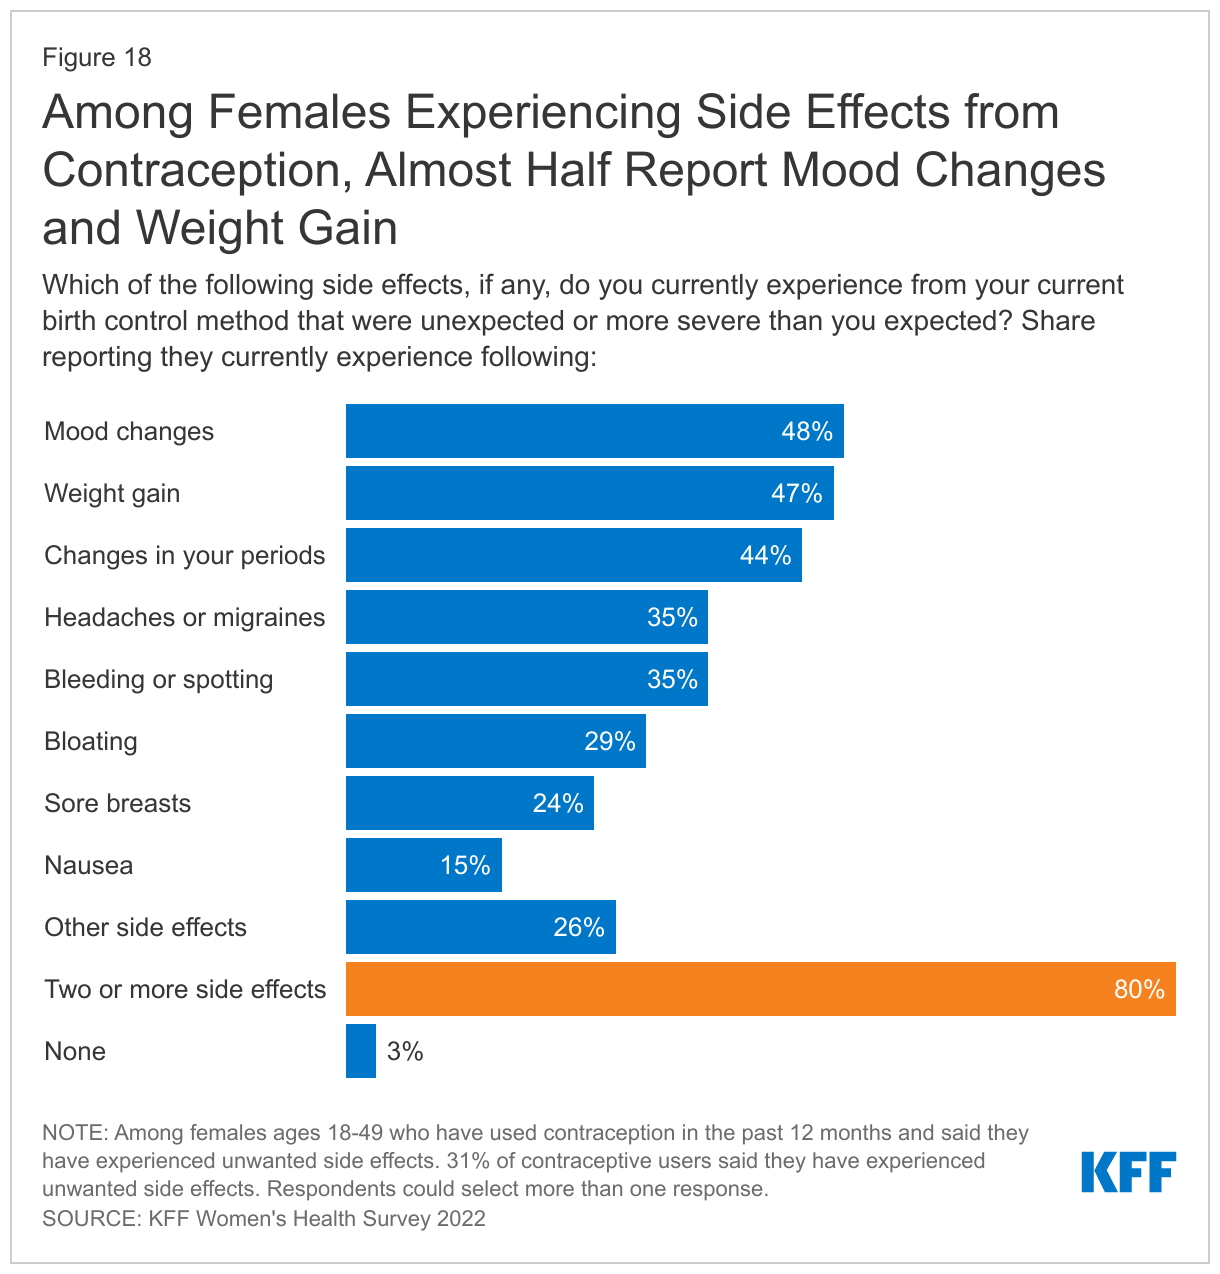
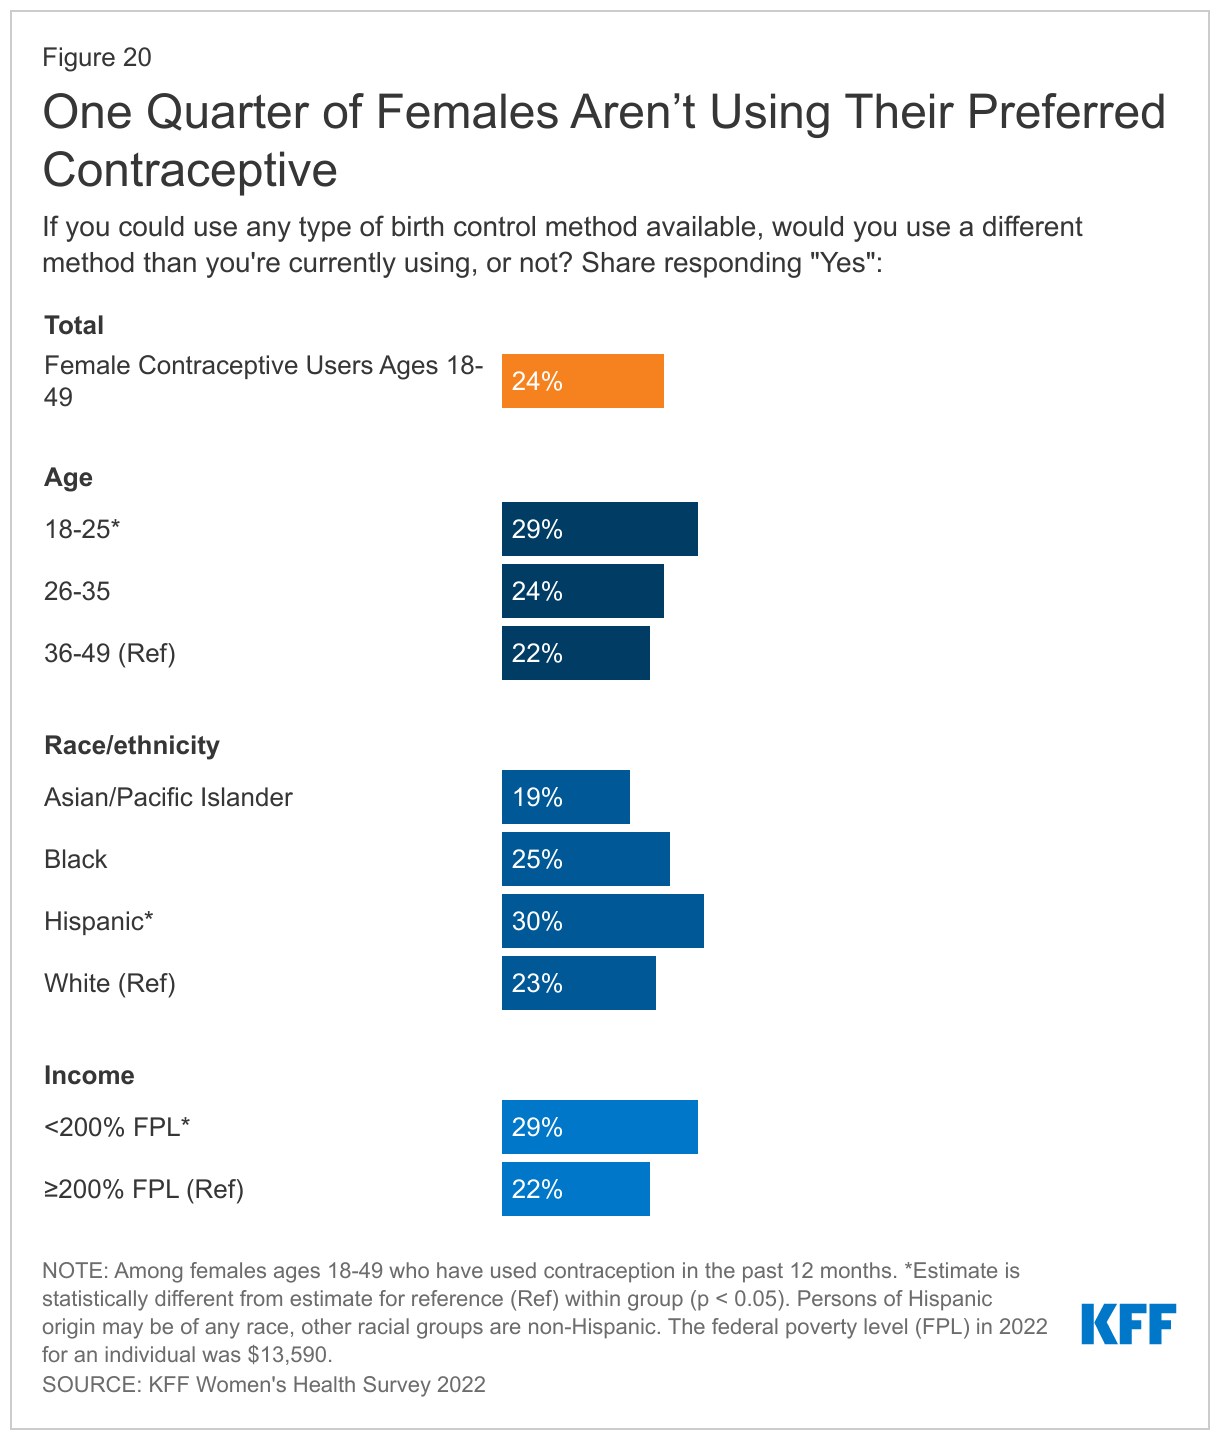
Overall, one quarter of females who are using contraception are not using their preferred method. The leading reason for this is concern about side effects, a theme that comes up in many aspects of contraceptive care. Almost one-third of contraceptive users (31%) say they are experiencing side effects from their current method, and just over half (52%) say the side effects are more severe than they expected.
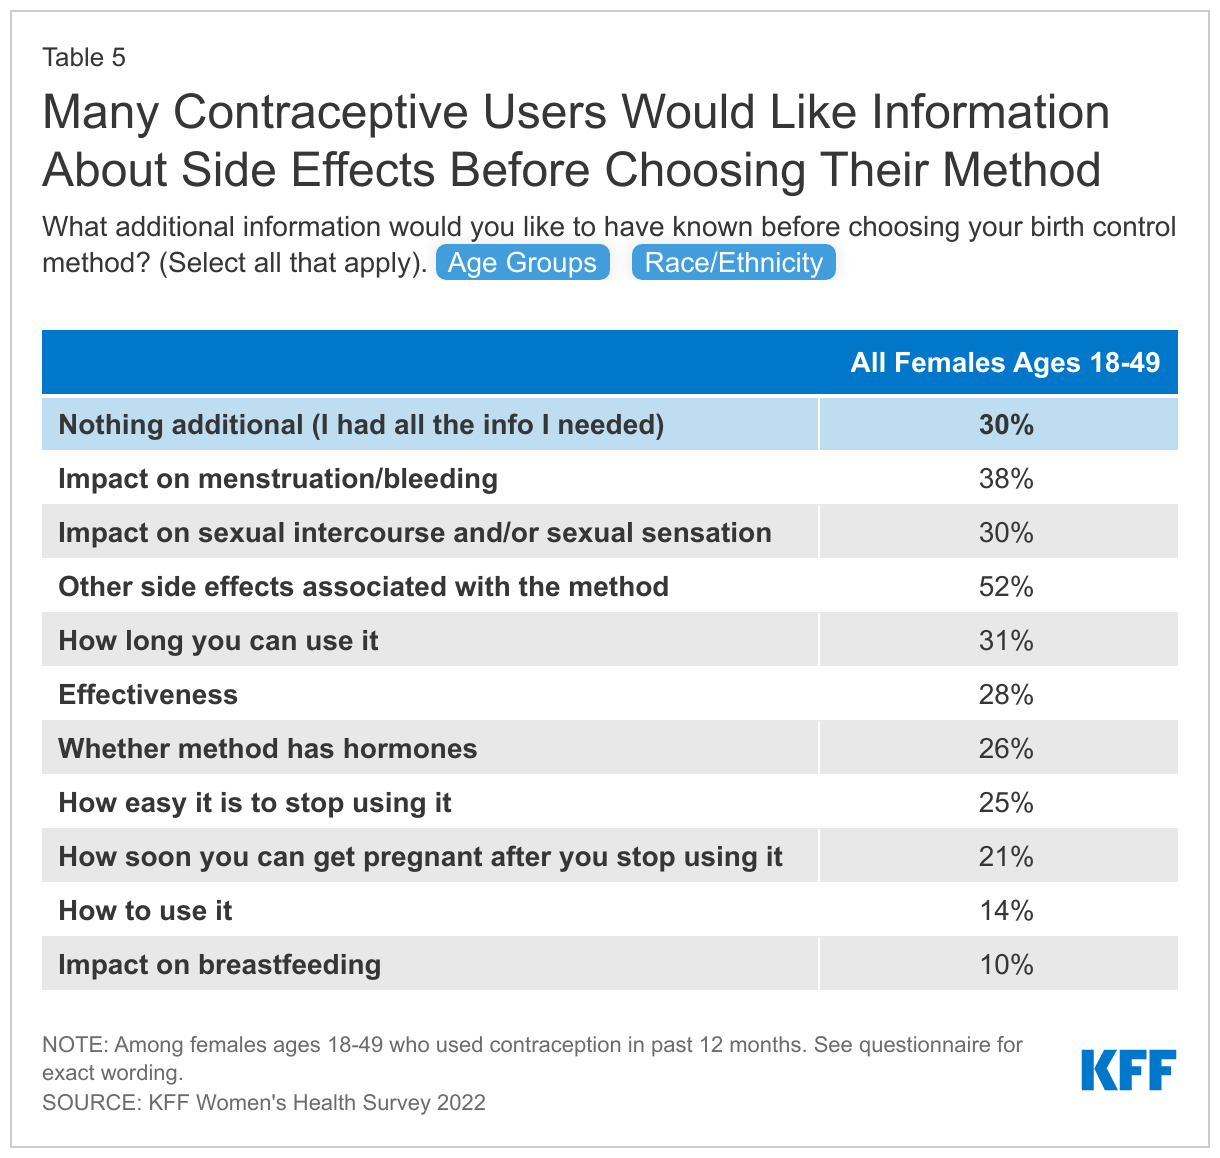
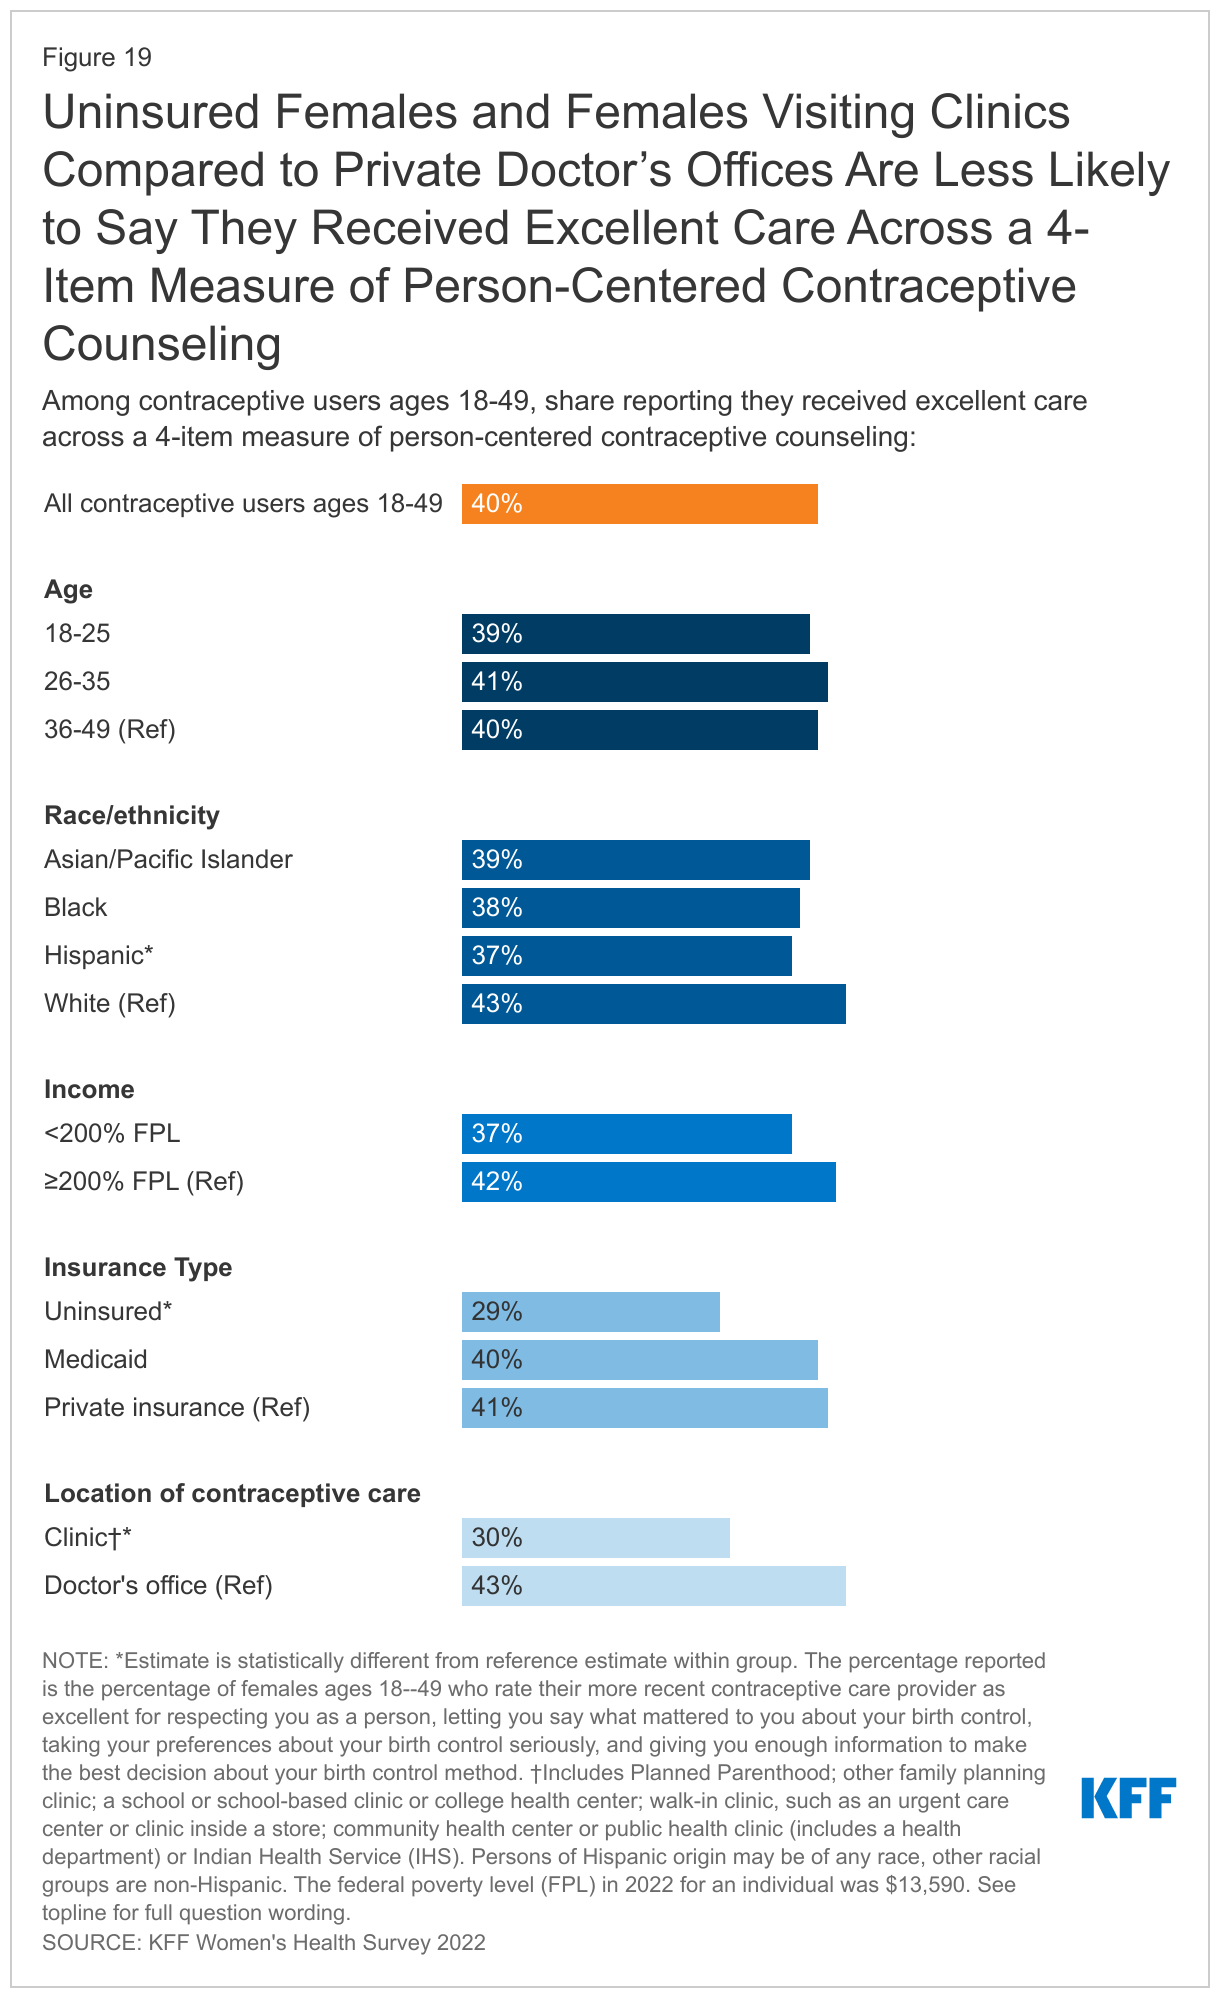
Just 30% of females say they received all the information they needed before choosing their birth control method. This is even lower among Asian/Pacific Islander females, just 12% of whom say they had all the information they needed before choosing a method, compared to more than a quarter of Hispanic (26%) and Black (28%) females and one-third of White females (34%). Person-centered contraceptive counseling is a key element to assuring people can select the contraceptive method that suits them. However, only 40% of those receiving contraceptive care rate their most recent contraceptive counseling as “excellent.”
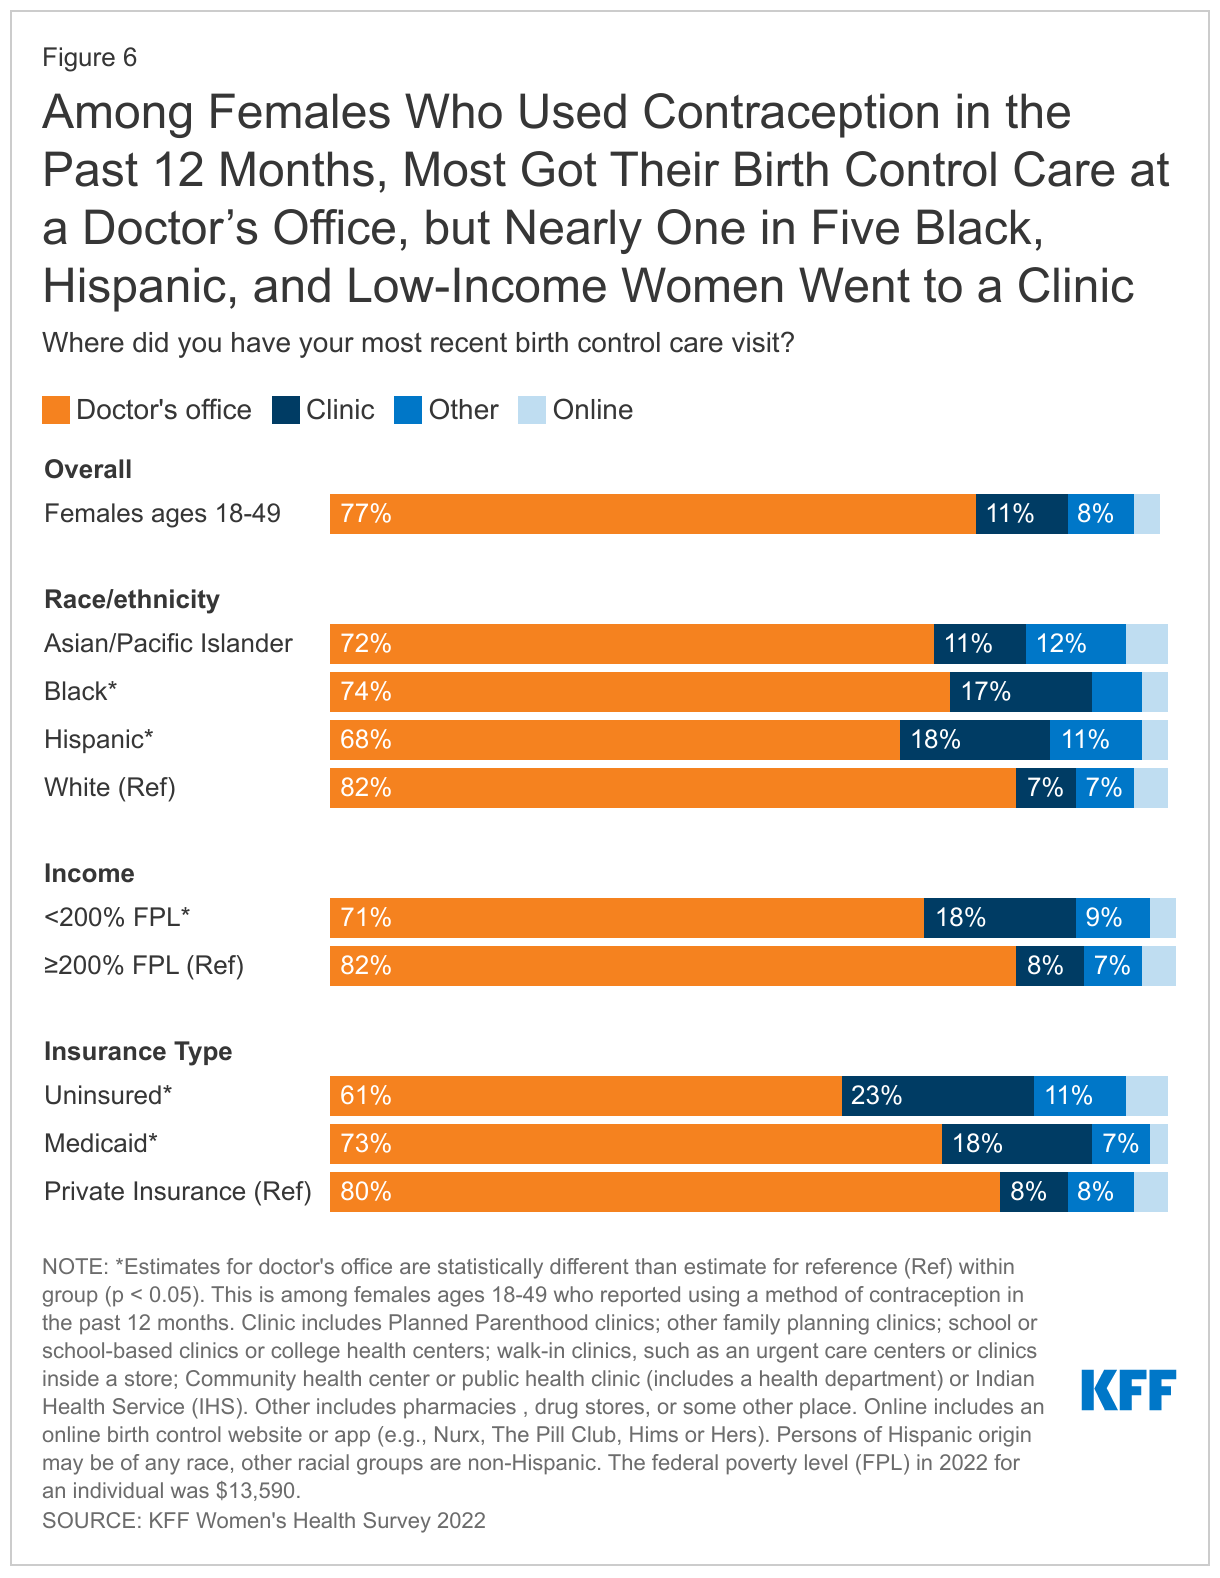
Accessing Contraception
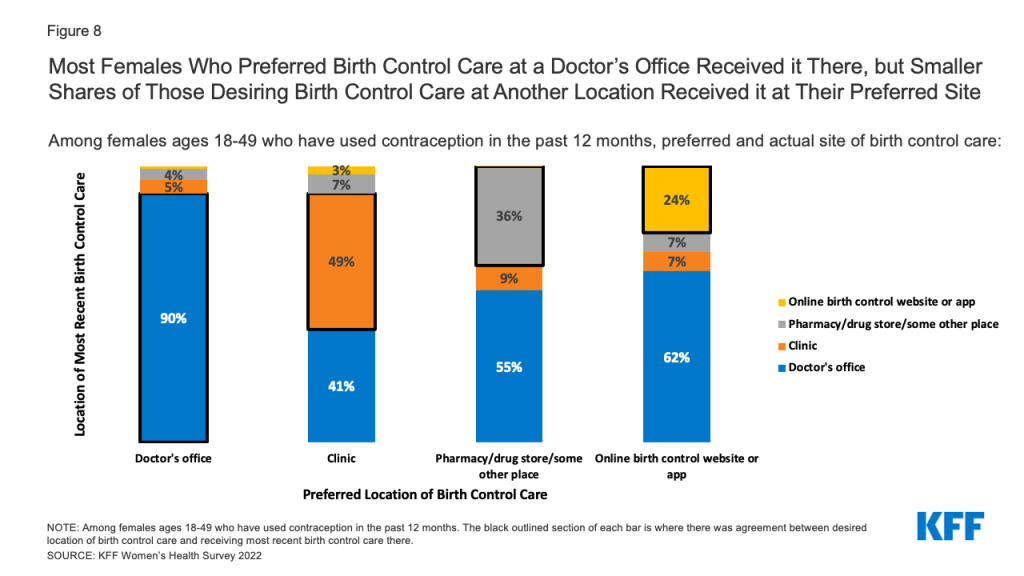
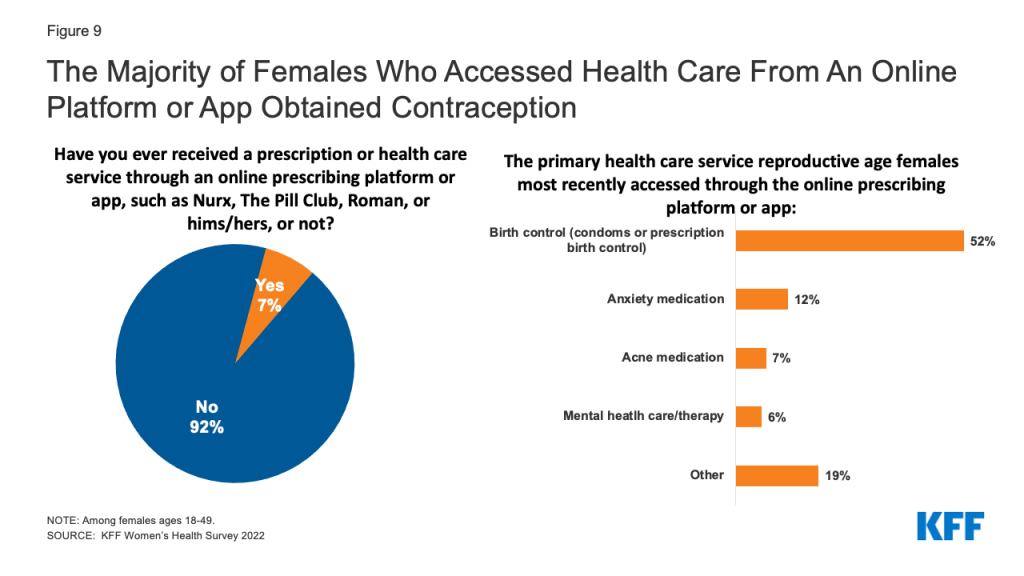
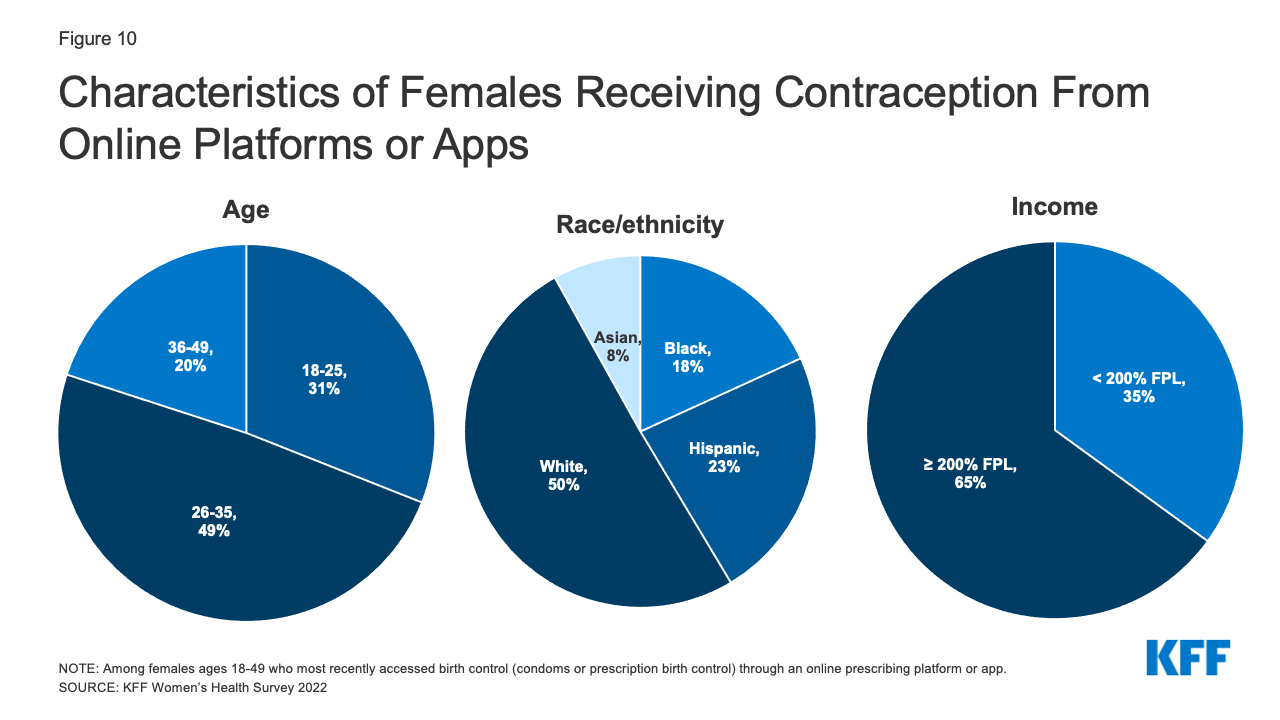
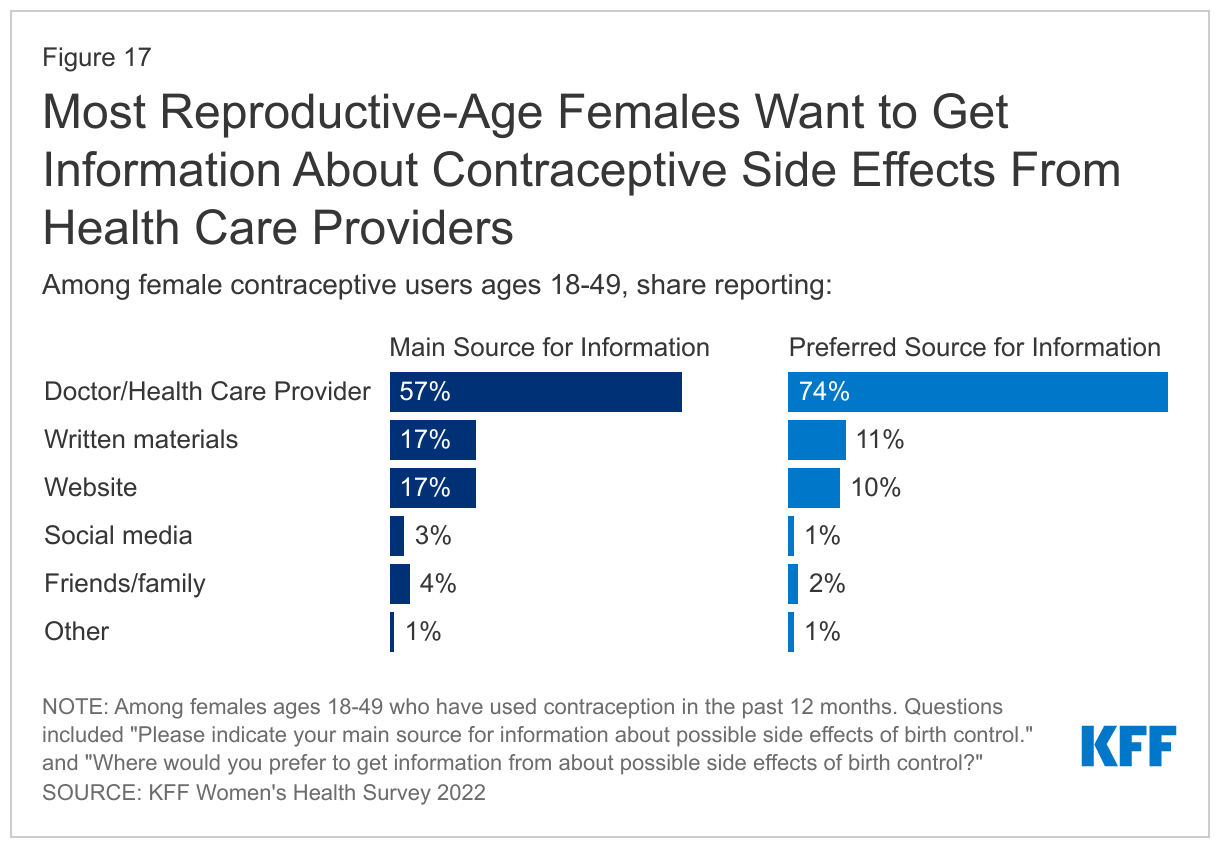
The majority of reproductive age females get their birth control care at a doctor’s office (77%) and prefer to get their care there, even as more services have become available online with growing numbers of online contraception platforms. Many also rely on clinics and health centers for their care, particularly those who are low-income, uninsured, Black or Hispanic. Far fewer (7%) have received a prescription or obtained a health care service from an online company in the prior 12 months. Convenience is the main reason those who would prefer to get their birth control care from an online company cite for their preference.
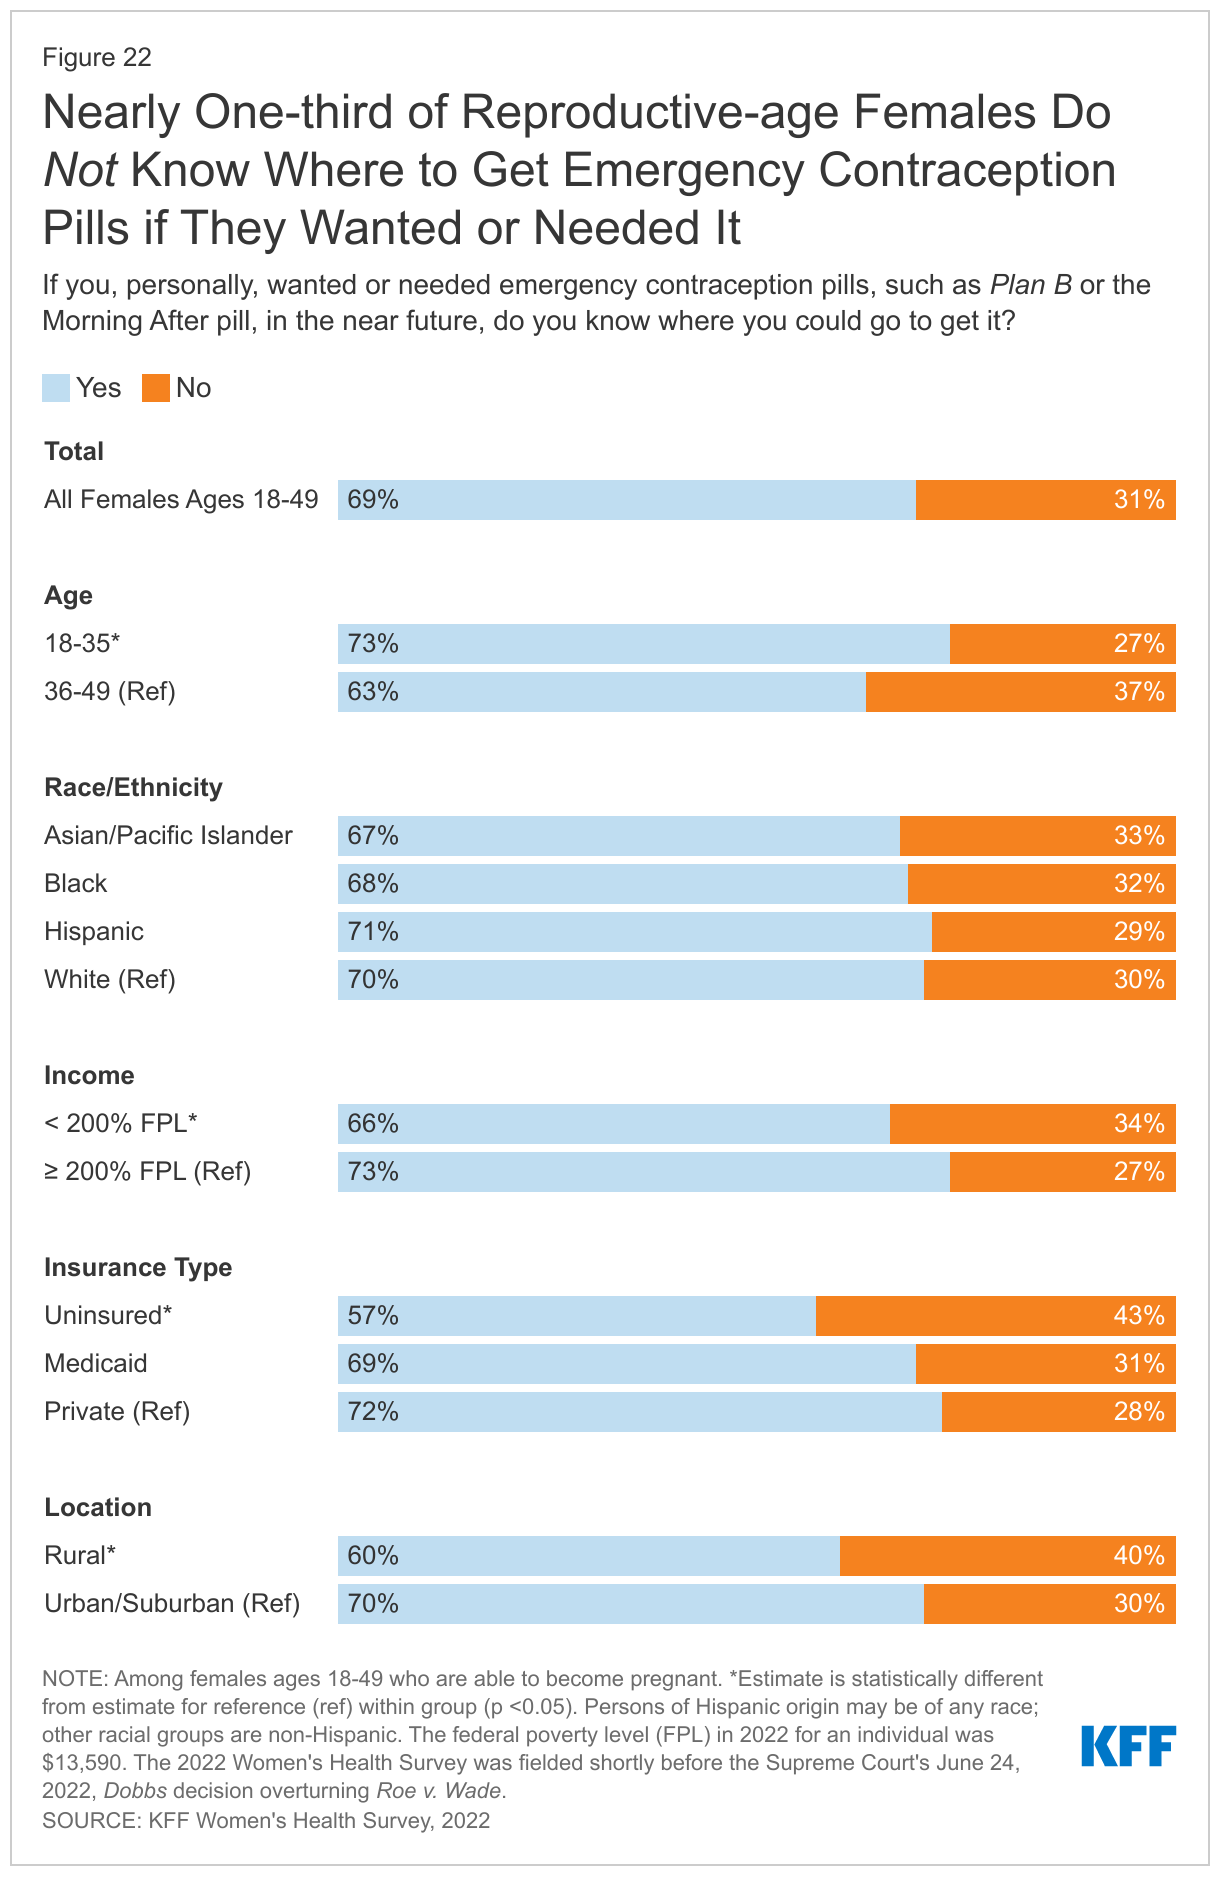
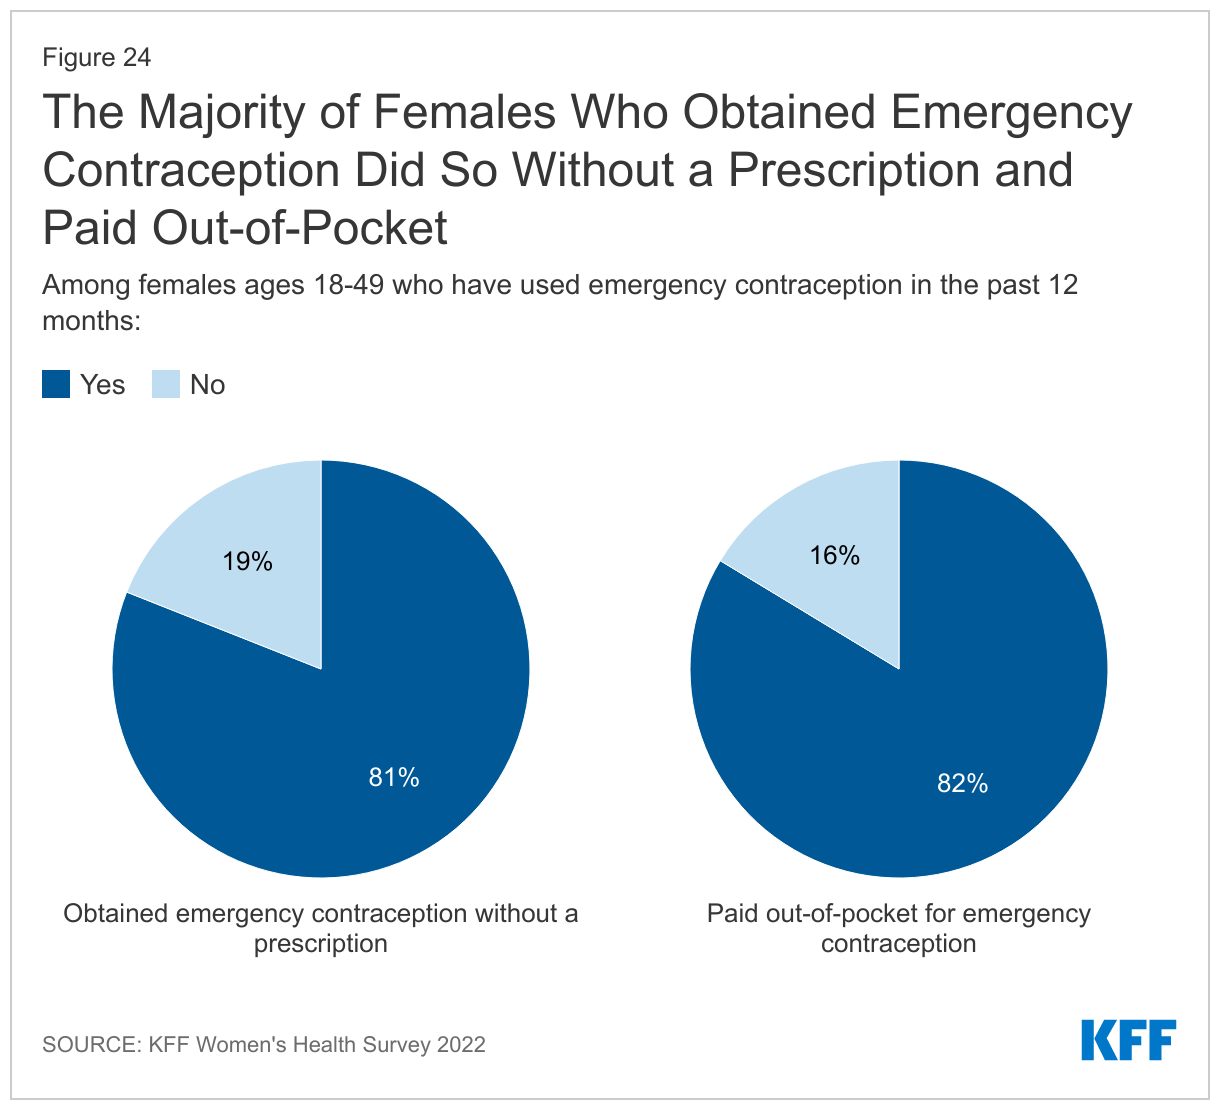
Emergency contraceptive pills (EC) are an effective form of back up birth control, but a sizable minority of people who might benefit from them don’t know where to get them or that they’re available over the counter. Emergency contraceptive pills, which can be taken to prevent pregnancy after a contraceptive failure or unprotected sex, have been available over the counter for more than 15 years. One in four reproductive age females (27%) either don’t know EC pills are available over the counter or have never heard of them. Among those who have heard of EC pills and could become pregnant, three in ten (31%) don’t know where they could get it.
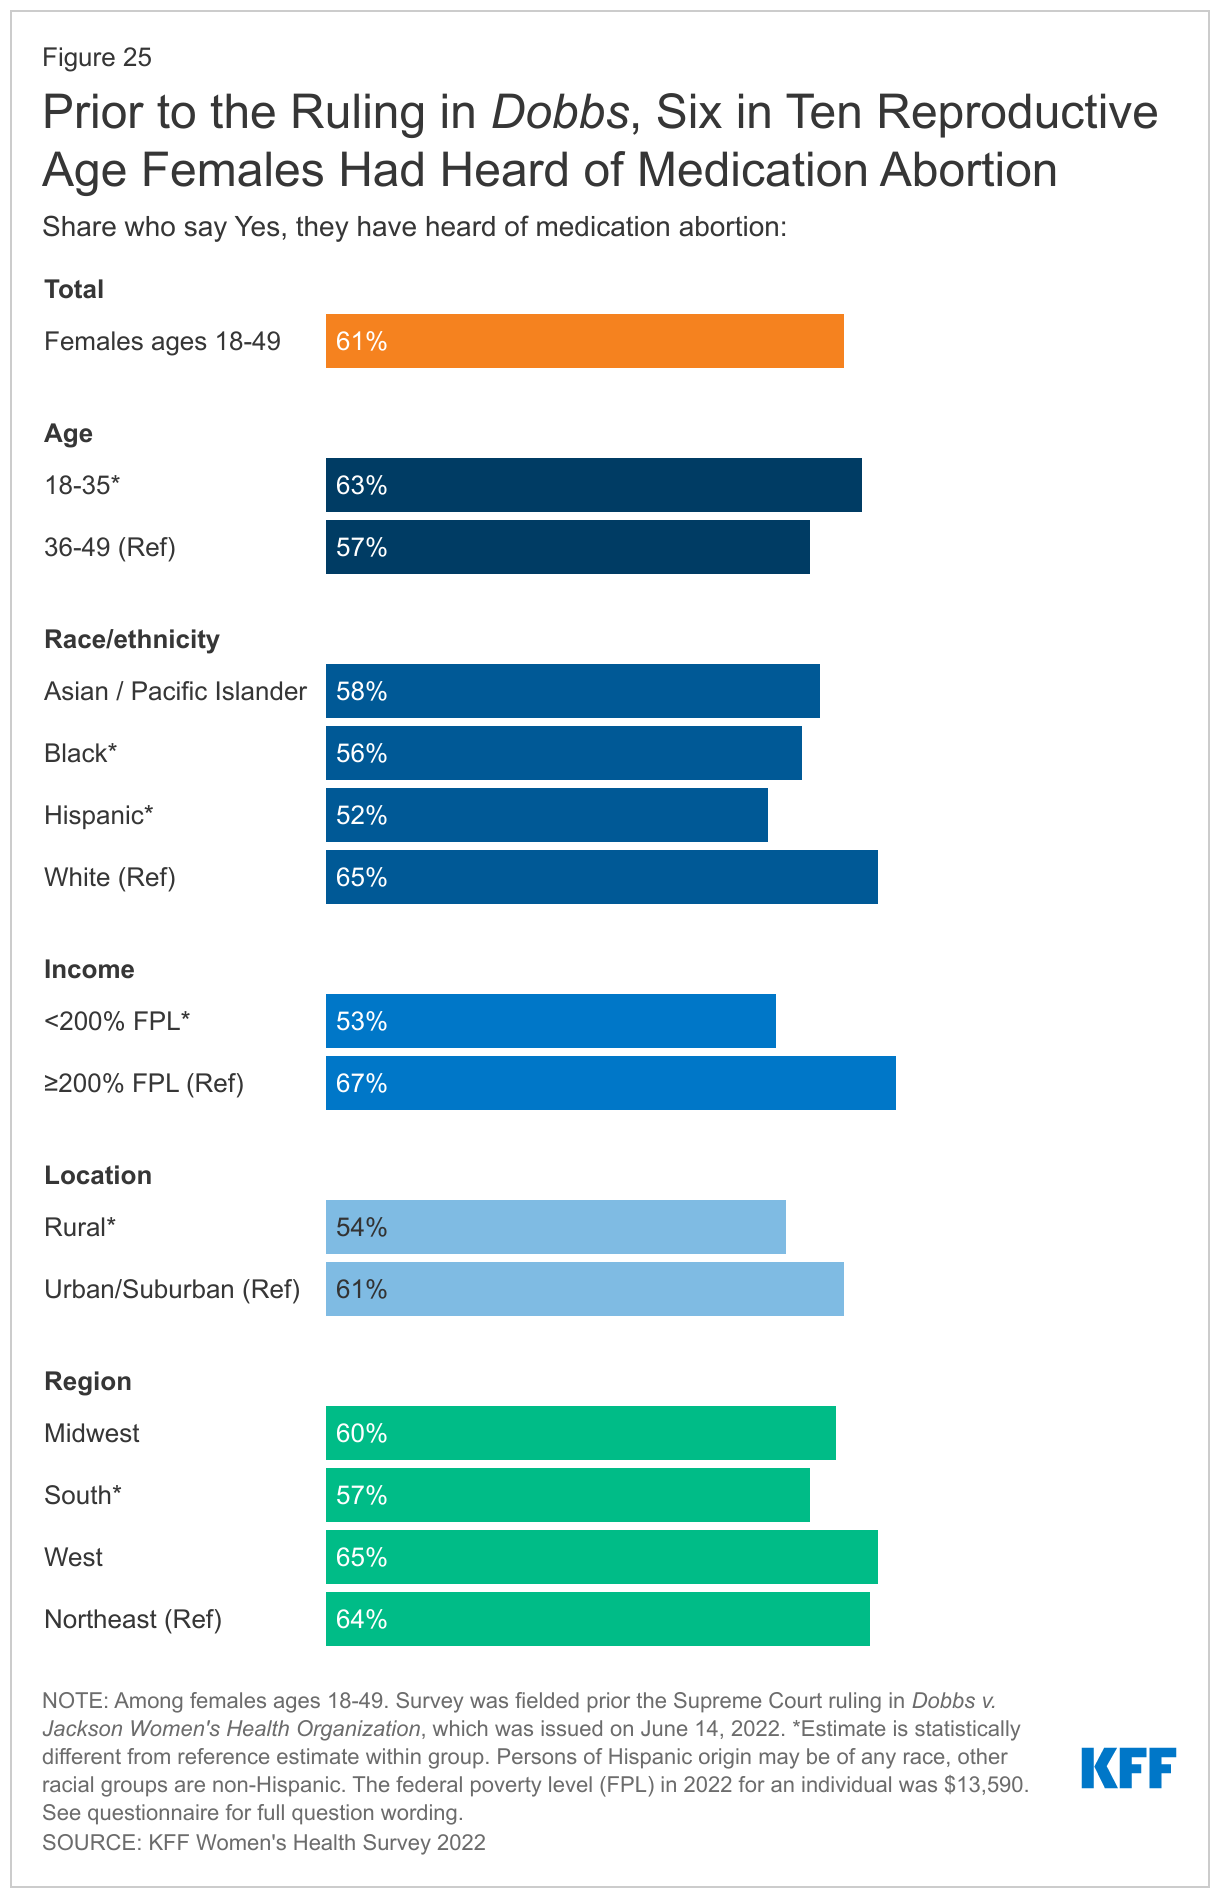
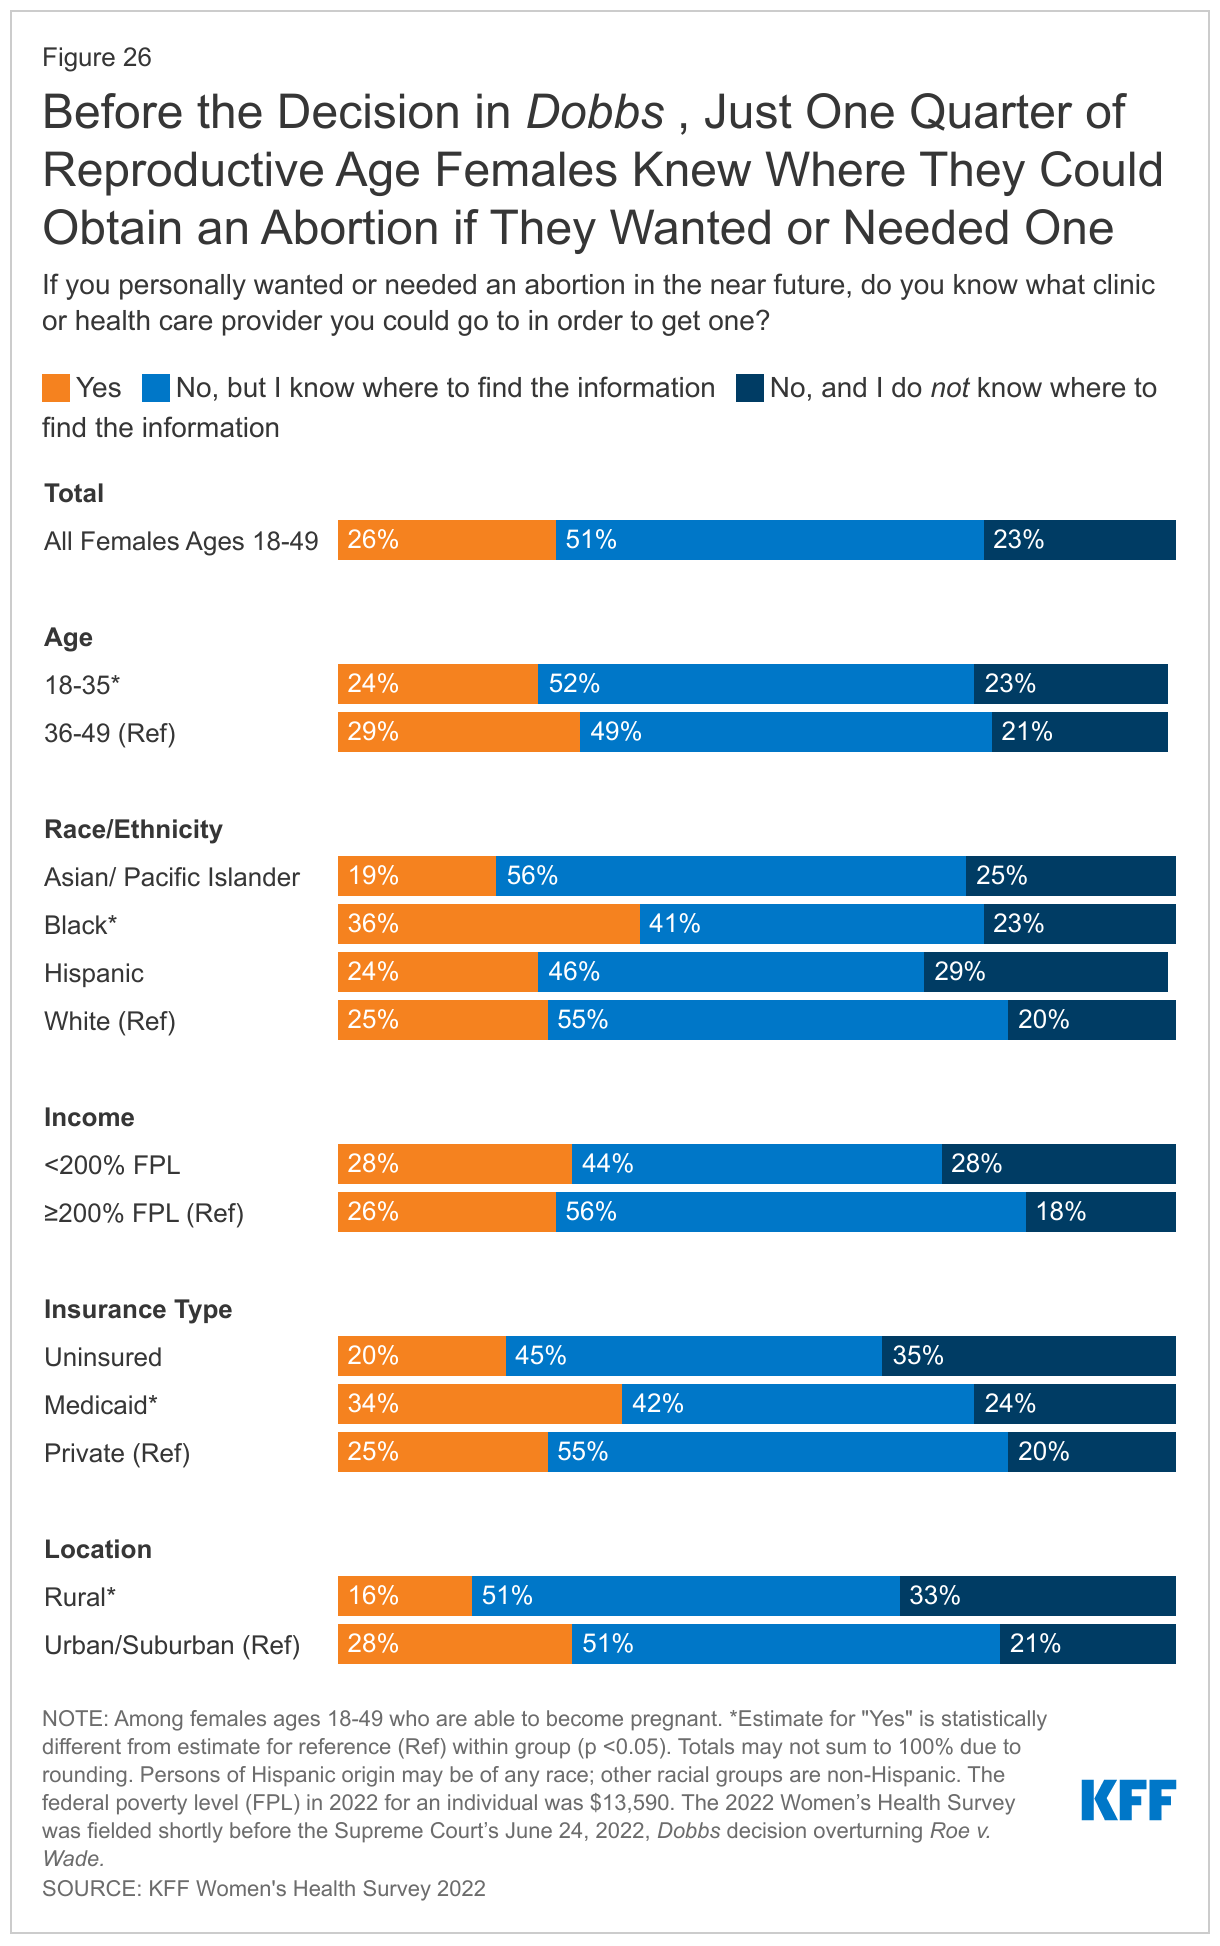
Not only was there a lack of awareness about where to get emergency contraceptive pills, but even before the Supreme Court overturned Roe v. Wade, few knew where they could get an abortion if they needed one. Prior to the ruling in Dobbs, just one-quarter (26%) of females ages 18-49 said they knew what clinic or health care provider they could go to for an abortion if they wanted or needed one. Smaller shares of females living in rural areas, where services are more limited, knew where they could go to get an abortion compared to females living in more urban areas (16% vs. 28%).
Access to abortion and contraception continues to remain at the center of policy debates across the nation. Not only has abortion access been banned in many states, but access to effective methods to prevent pregnancy, like emergency contraceptive pills and long-acting reversible contraception (such as IUDs), may also become restricted. Doctors and health care providers are trusted sources of information for many people, which means they could play an important role in filling information gaps and addressing misinformation. While the ACA preventive services coverage requirement has markedly improved the affordability of contraceptives, the policy is being challenged yet again in the courts by those who object to preventive services such as contraception on religious or moral grounds. The outcomes of these debates, along with state, federal and private sector actions will continue to shape the availability and use of contraceptive care for millions in the years to come.
This work was supported in part by Arnold Ventures. KFF maintains full editorial control over all of its policy analysis, polling, and journalism activities.
Contraceptive care is an important component of overall health care for many people. Federal and state policies shape access to and the availability of contraceptive care, but factors such as provider characteristics, as well as individual preferences and experiences also impact contraceptive choices and use. For most people, private coverage and Medicaid greatly reduce or eliminate financial barriers to contraceptive care, but access to contraceptive services is still limited in many parts of the U.S. with more than 19 million women living in contraceptive deserts where they may not have access to a health center offering the full range of contraceptive methods. The federal Title X family planning program aims to provide quality contraceptive care to low-income and uninsured females across the country, but not all are reached.
The public programs that subsidize contraceptive services and coverage expansions for contraception under private insurance and Medicaid aim to expand access to contraception. In addition, there have been more efforts to broaden contraceptive availability outside of traditional clinical settings, including through commercial apps, state efforts to allow pharmacists to prescribe birth control, and growing momentum toward gaining FDA approval for over-the-counter (OTC) oral contraception without a prescription.
The recent Supreme Court decision in Dobbs v. Jackson Women’s Health Organization, eliminating the federal standard for abortion access brings new salience to and reinforces the importance of access to effective and affordable contraception, particularly for those who live in states that seek to ban abortion.
This brief provides new information about the state of contraceptive access for females in the US, with the goal of better understanding the factors that influence use and experiences with contraceptive care. From May 10 to June 7, 2022, prior to the Dobbs decision, KFF partnered with SSRS to field the 2022 KFF Sexual and Reproductive Health Survey. The survey, developed and analyzed by KFF staff, is a nationally representative survey of 5,201 females (self-reported sex at birth) and 1,241 males ages 18 to 64. SSRS conducted the field work for the survey, with most respondents answering online and a small share by telephone. The sample was drawn from two nationally representative, probability-based survey panels – the SSRS Opinion Panel and IPSOS’s KnowledgePanel. The sample was constructed to ensure sufficient sample sizes for analysis of key groups of interest, including females who are Black, Hispanic, Asian/Pacific Islander, low-income, covered by Medicaid, lesbian, gay, or bisexual, and living in rural areas. The data were weighted to represent U.S. adults ages 18 to 64, based on benchmarks from the U.S. Census Bureau’s Current Population Survey. See the methodology section for more information.
Individuals were asked about their sex at birth as well as their gender identity. To be as inclusive as possible to all those who use contraceptive methods regardless of their gender identity, this brief presents data on individuals who responded their sex at birth was female, including those who identify as cisgender women and those who identify as a different gender such as transmen and other gender nonbinary individuals. The survey covers several aspects of reproductive health and well-being, including access, coverage, and utilization of health care outside of sexual and reproductive health. This brief presents survey findings on females’ experiences using contraception, including access, payment, as well as their preferences and concerns regarding different methods and care.
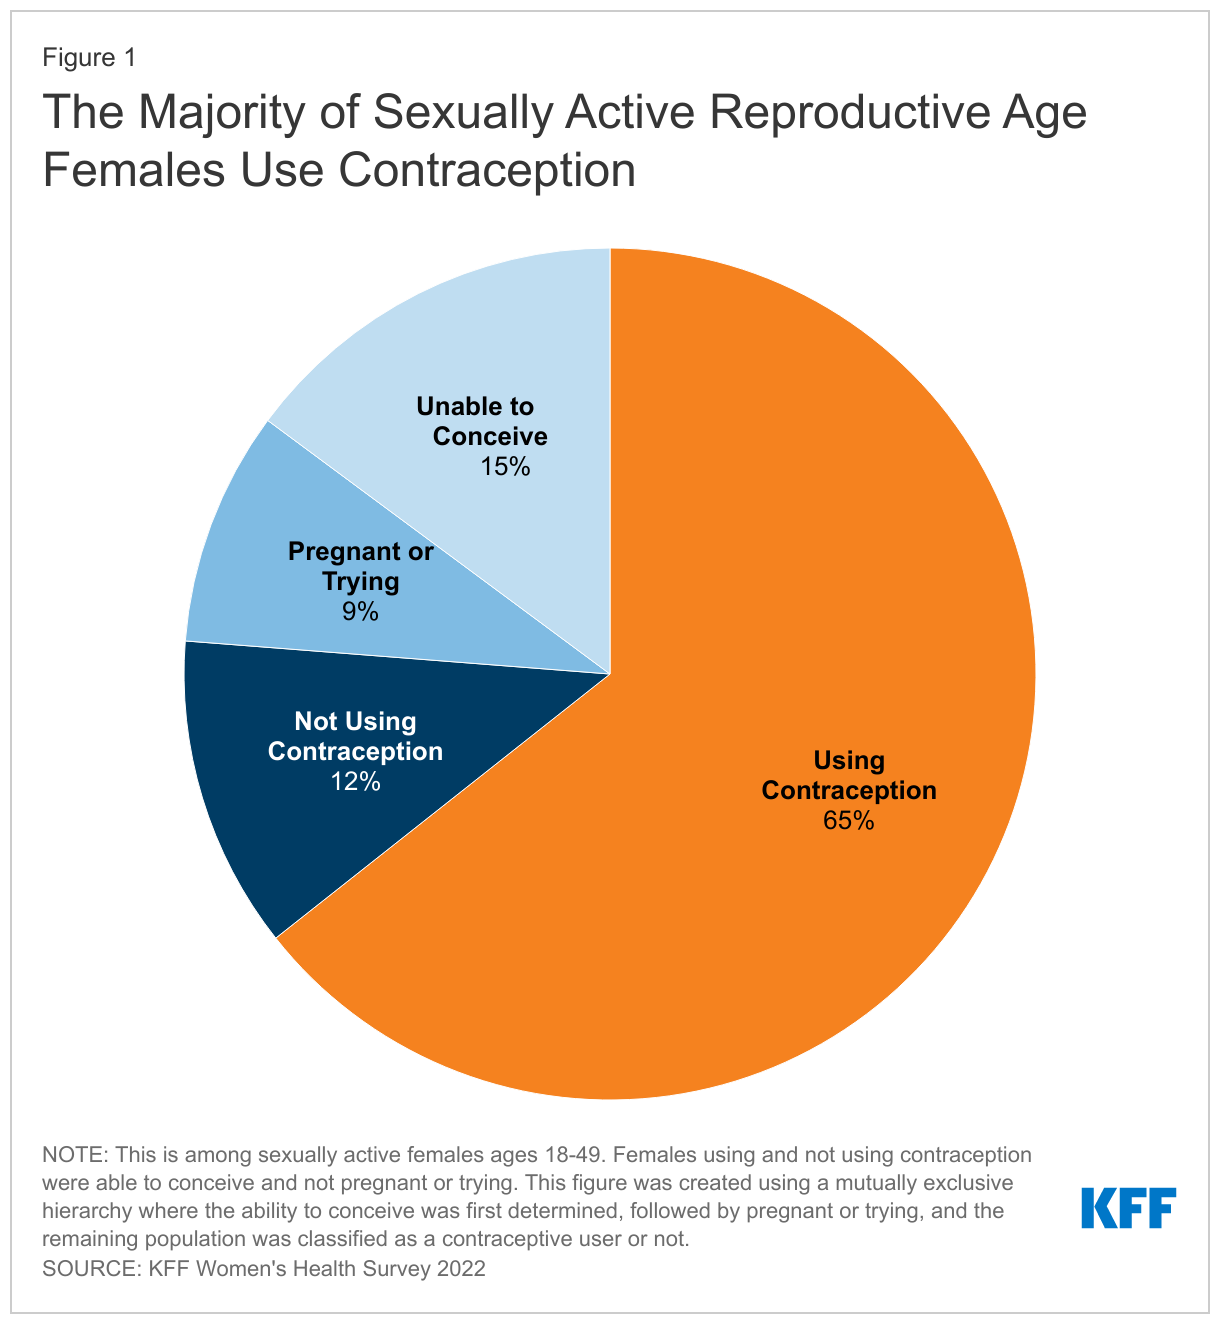
Most sexually active females ages 18-49 are using some form of contraception. When looking at the profile of sexually active reproductive age females, 15% report that either they or their most recent sexual partner have a medical condition that makes it impossible for them to ever get pregnant (15%), while 9% are pregnant or trying to get pregnant. Two-thirds of females ages 18-49 say they are using some form of contraception (65%) and 12% report not using contraception (Figure 1).
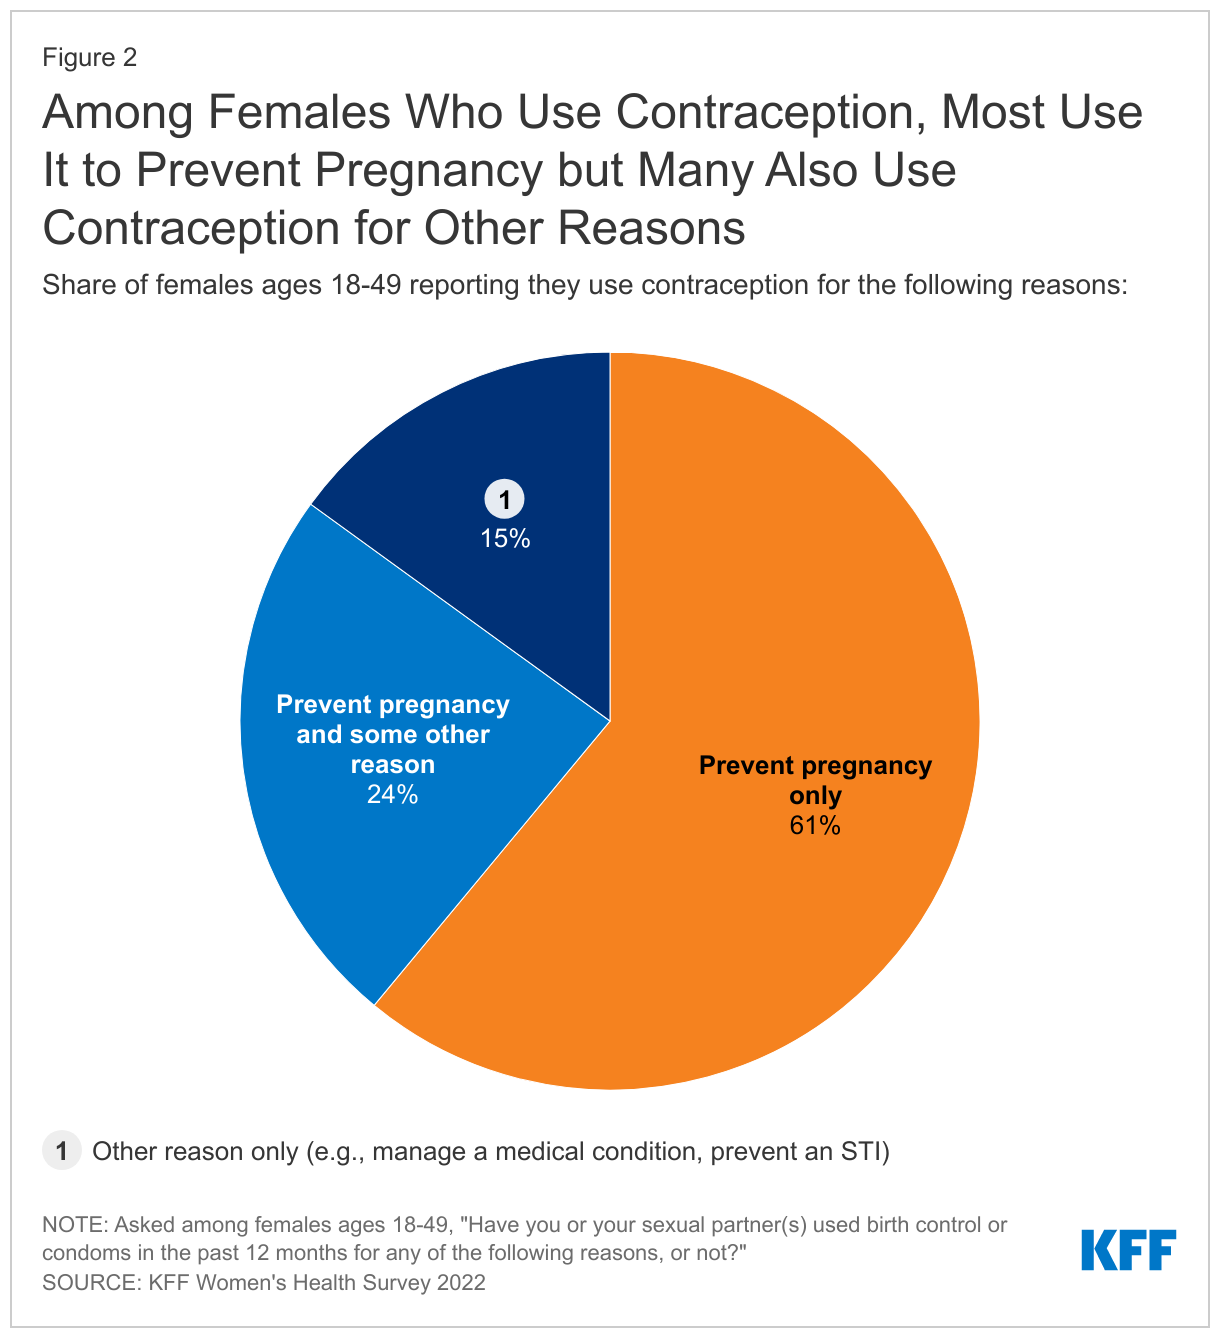
Among females who are using contraception, six in ten (61%) say they use contraception only to prevent pregnancy, but almost one-quarter (24%) say they use contraception both to prevent pregnancy and some other reason (Figure 2). One in seven (15%) use contraception solely for a reason not related to preventing pregnancy such as managing a medical condition or preventing a sexually transmitted infection (STI).
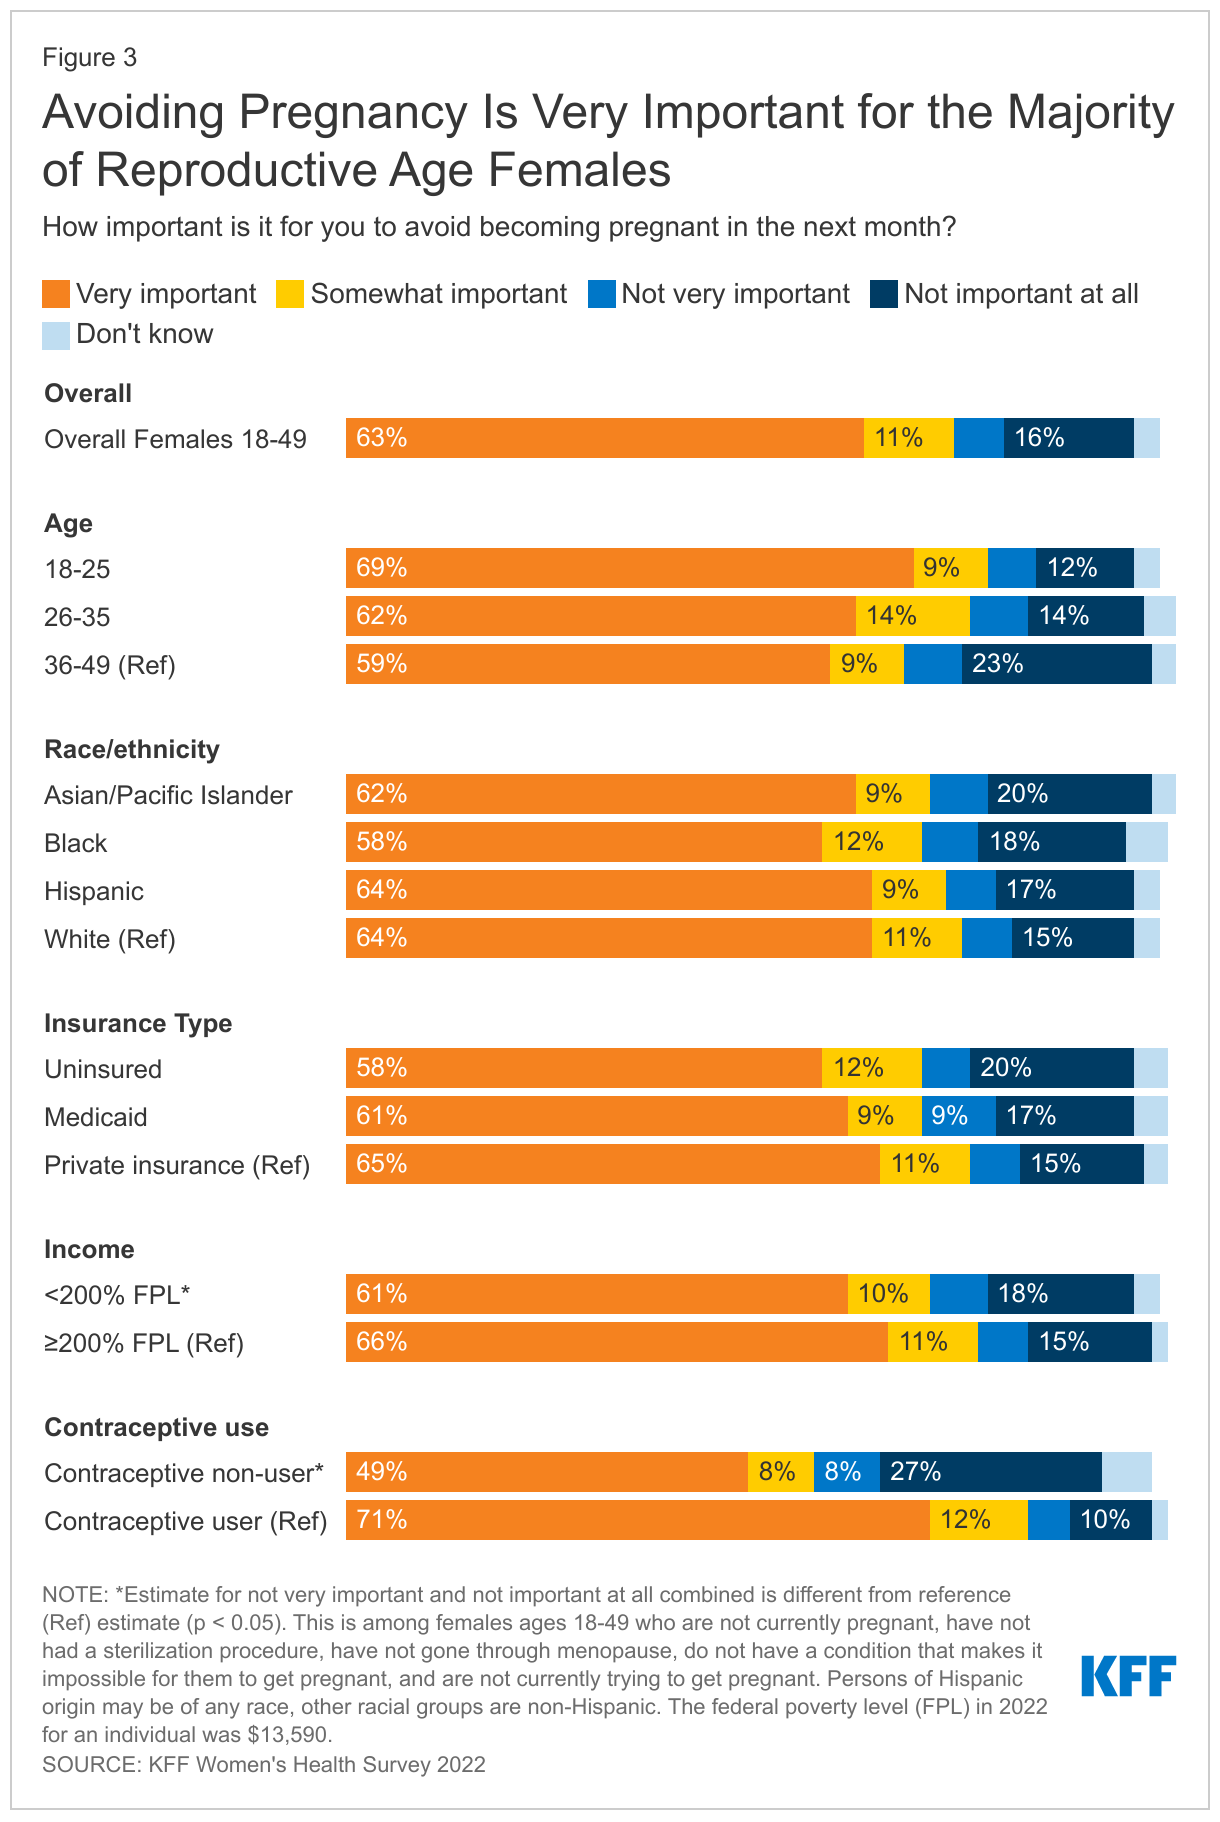
Most reproductive age females who are not actively trying to get pregnant say it is important to them to prevent pregnancy. However, one in five say avoiding pregnancy is not a priority.It is often assumed that pregnancy prevention is a priority for women who are not actively trying to get pregnant, but that is not always the case. Among females ages 18-49 who are not currently trying to get pregnant, the majority say it is very important (63%) or somewhat important (11%) for them to avoid becoming pregnant in the next month, but one in five (22%) females say it is not very important or not important at all (Figure 3). (Note that this survey was conducted before Roe v. Wade was overturned and this share could have changed now that abortion is no longer available in many states.)
Conversely, among females who are who are capable of becoming pregnant, not trying to get pregnant, and not using contraception, over half (57%) say that it is very important or somewhat important for them to avoid pregnancy. These data speak to the fact that some females may not have found a method that meets their needs or that they can access. In addition, there are others who are not necessarily trying to get pregnant but may be open to having a pregnancy and may not want to use contraception for reasons ranging from prior personal experiences, lack of acceptable contraceptive options, or religious beliefs.
More than eight in ten sexually active females who are not currently pregnant and capable of becoming pregnant use contraception, but one in six do not. The majority (83%) of sexually active reproductive age females who are able to conceive, not currently pregnant nor trying to become pregnant report using at least one method of contraception in the past 12 months (Figure 4). However, one in six (17%) report that they do not use contraception and are not trying to conceive. More than a quarter (27%) of Black females in this group report that they are not using contraception compared to one in five (21%) Hispanic females, 17% of Asian/Pacific Islander females, and 13% of White females. Nearly one in four (23%) uninsured females and those with Medicaid coverage (22%) report not using contraception compared to 14% of females with private insurance (employer-sponsored and individual). Similarly, 23% of females with low incomes report not using contraception compared to 14% of individuals with higher incomes.
Among reproductive age females who are able to conceive and are not pregnant or trying to become pregnant who are not using contraception, four in ten they say it is because they did not want to use birth control (42%). One in three females who are not currently using contraception report concern about side effects (32%), and one in five (22%) say they don’t really mind if they become pregnant (Table 1). Fourteen percent say that they do not think they could get pregnant and about one in ten couldn’t find a method they were satisfied with (11%) or don’t know which birth control they want to use (9%). Four percent say “some other reason”, and responses include having medical conditions that made it difficult to take birth control or using withdrawal.
Among those that currently use contraception, condoms, oral contraception, and IUDs are the most commonly used methods. When looking at current contraceptive use (in the prior 12 months), one-third of reproductive age females report using oral contraceptives (33%) and condoms (32%) (Table 2). One in five report using IUDs (19%). Larger shares of younger female contraceptive users ages 18-25 report using all contraceptive method types compared to older female contraceptive users ages 36-49, except for IUDs where the largest share of users are females ages 26-35. For all age groups, oral contraceptives and condoms are the most frequently used methods. One in seven females (15%) across all age groups reports using fertility-awareness based methods to avoid pregnancy in the past 12 months.
Fewer than half of people say they used contraception including condoms the last time they had sex.Four in ten (42%) reproductive age females and males (41%) say they used contraception, including condoms, the last time they had sex. Use of a contraceptive method at last sex is lower among females (38%) and males (38%) who are married or living with a partner, compared to just over half (52%) of females and nearly half (47%) of males who are not married or living with a partner (Figure 5).
Overall, 17% of females say their partner used a condom the last time they had sex, and 22% of males report using a condom. This differs significantly by whether someone is married or living with a partner compared to not. In addition to preventing pregnancy, condoms are also effective in reducing the risk of transmission of STIs. Males who are married or living with a partner are almost twice as likely to use a condom than males who are widowed, divorced, separated, or never married (32% vs. 18%). Thirteen percent of females who are married or living with a partner say their partner used a condom the last time they had sex compared to 27% of females who are widowed, divorced, separated, or never married.
When asked if they had discussed birth control or condom use with their most recent sexual partner, the majority of males (69%) and females (72%), regardless of partner status, say they discussed with their partner.
Nine in ten females (90%) report using contraception at some point in their lifetime and most (76%) use more than one type of contraception across their lifespan.Contraceptive preferences often change throughout one’s reproductive years. On average, females use 2.7 different contraceptive methods throughout their lifetime. Seven in ten females (71%) ages 18-64 say they have used oral contraceptives, including a larger share of females ages 36-64 (Table 3). Male condoms are the second most frequently used contraceptive among females ages 18-64 (65%). Among younger females ages 18-35, higher shares have used implants and emergency contraception compared to females overall. Switching to different contraceptive methods is common, reinforcing the importance of access to the full range of contraceptive methods without financial barriers. Also, because contraceptive needs can change over one’s reproductive lifespan; what works in one’s twenties may not be what is best for them in their thirties or forties.
The types of contraceptive methods females use also can differ by race/ethnicity groups (Table 4). Smaller shares of Asian/Pacific Islander females (8%) report being sterilized compared to White females (24%). However, similar shares of both White (18%) and Asian/Pacific Islander (15%) females report relying on a partner’s vasectomy for contraception. One in four (25%) Black females report using injectable contraception in their lifetime compared to only 15% of White females. There are not significant differences in intrauterine device (IUD) lifetime use, but larger shares of Black (11%) and Hispanic (11%) females report using contraceptive implants compared to White females (7%). Black and Hispanic females are also less likely to say they have used condoms and more likely to say they have used fertility-awareness based methods compared to White females.
The majority of reproductive age females get their birth control care at a doctor’s office, but distribution of site of care differs by race/ethnicity, insurance coverage, and income. Overall, more than three in four females using contraception (77%) had their most recent birth control care visit at a doctor’s office (Figure 6). One in ten (11%) went to a clinic like Planned Parenthood, another family planning clinic or a community health care, or a walk-in clinic, such as an urgent care center or clinic inside a store. Less than one in ten females (8%) got their birth control care at a pharmacy or drug store or some other place and just 3% had their most recent visit through an online birth control website or app like Nurx, The Pill Club, or Hims or Hers.
Larger shares of Black (17%) and Hispanic (18%) females got their most recent birth control care at a clinic compared to White females (7%). Similarly, larger shares of uninsured females (23%) and females with Medicaid coverage (18%) went to clinics compared to those with private insurance (8%).
When asked where they would prefer to get their birth control care, most females say a doctor’s office, but this varies by income and insurance. Two-thirds (67%) of reproductive age females say that if they could go anywhere for birth control care, they would choose a doctor’s office (Figure 7). About one in ten would choose a clinic (12%), online (9%), or another location, such as a pharmacy or drug store (12%). While majorities across all groups would choose a doctor’s office, about one in five females who are Black (19%), Hispanic (18%), low-income (17%), uninsured (21%), and covered by Medicaid (19%) would choose a clinic as their preferred site of contraceptive care. Preferences may be influenced by where people usually seek care or where they can get affordable care.
Females have several options for where to receive their birth control care, however, there is not always alignment between the site they prefer and the site they end up using. Six in ten females (59%) who used contraception in the past 12 months get their birth control care at their preferred location. Among females who prefer to receive their birth control care at a doctor’s office, 90% received their most recent care at a doctor’s office (Figure 8). However, only 49% of females who prefer to receive their birth control care at a clinic received their care there. Just over a third (36%) of females who prefer to receive their birth control at a pharmacy or drug store received their care there, and just about one-quarter (24%) of females who prefer to receive their birth control care through an online birth control website or app actually receive their most recent care through one (Figure X).
Figure 8: Most Females Who Preferred Birth Control Care at a Doctor’s Office Received it There, but Smaller Shares of Those Desiring Birth Control Care at Another Location Received it at Their Preferred Sit
Females also report different reasons for preferring one setting over another for contraceptive care. Most people who prefer doctor’s offices say they choose it because that’s where they usually go (36%) or they trust the providers there (37%). Similarly, people who prefer clinics say they choose it because they trust the providers (28%), convenience (24%), and it’s where they usually go (22%). A large majority who prefer a pharmacy or drug store (71%) or online birth control app (88%) as their site of care say convenience is the reason.
In recent years, there has been growth in companies, such as Nurx, The Pill Club, Roman, or hims/hers, which are online prescribing platforms or apps that operate outside of the traditional medical care system to provide a variety of primary care services, including contraception. While there have been reports of an influx of customers to these apps in recent years, particularly during the pandemic, they still serve only a small fraction of contraceptive users.
Overall, 7% of females ages 18-49 say they have received a prescription or obtained a health care service from one of these companies in the prior 12 months. Among this group, the majority have received birth control (condoms or prescription birth control) (52%). A smaller share of users obtained other services or products, including anxiety medications (12%), acne medications (7%), and mental health care/therapy (6%) (Figure 9). Common reasons for accessing health care services through an online prescribing platform include management of a chronic condition, including medications, as well as treatment for infections.
Figure 9: The Majority of Females Who Accessed Health Care From An Online Platform or App Obtained Contraception
Among females who most recently obtained contraception from an online platform or app, 80% are under the age of 36, half (50%) are White, and more than one-third have low incomes (35%) (Figure 10).
Most online contraception platforms accept some form of insurance for some services and products, although not all companies accept both private insurance and Medicaid. Over half of reproductive age females who have received contraception through an online platform say their insurance, Medicaid, or some other public program covered the full cost of the service they received through the online prescribing platform or app (52%). Theoretically, they would be eligible for no cost coverage of their contraceptive visits and method if they went to an in-network provider. However, over half report paying out-of-pocket for at least some of the service (54%). This includes 13% whose insurance covered part of the cost and they paid the rest; 8% who had insurance, but it did not cover the product and they ended up paying out-of-pocket; and 8% who had coverage for the product, but the online platform didn’t accept it and they paid for it themselves. Fifteen percent said they didn’t have any insurance and paid the full amount of the service and product.
One-third (33%) of hormonal contraceptive users say they have missed taking their birth control because they were not able to get their next supply on time. This share is higher among Black females (39%) compared to White females (31%) and those with low incomes (38%) compared to those with higher incomes (30%). This was a problem for nearly half (46%) of uninsured females and four in ten (41%) females with Medicaid (Figure 11). Studies have documented the importance of ensuring people have adequate contraceptive supply in adherence to their contraceptive method.
There has been a growing interest in making an extended supply of contraceptive pills and other hormonal methods available to those who use them. However, many females are still only getting one to two months' supply at time. Overall, about one third of females who used oral contraceptives got a one- or two-month supply. This share was higher among Black females, as well as those with low incomes, and those with Medicaid coverage (Figure 12).
Research has shown that best practice is to offer oral contraceptive users an extended supply, and some states now require their state-regulated plans to cover a 12-month supply of contraceptives. However, few females get a 12-month supply. Furthermore, only 14% of females who have used birth control pills in the past 12 months say their health care provider or pharmacist talked to them about receiving a 12-months or 12-pack supply of pills at one time. Larger shares of Hispanic (24%), Black (26%), uninsured (33%), females with Medicaid (19%), and females with low incomes (23%) say their health care provider or pharmacist talked to them about receiving a 12-month or 12-pack supply of pills at one time than their counterparts (Figure 13).
The ACA requires that most private plans cover contraceptive services for females without cost-sharing – this includes patient education and counseling and FDA approved methods of contraception with a prescription. This provision has dramatically reduced cost-sharing for contraception among females with employer or individual insurance market plans.
Among those using contraception in the past 12 months, seven in ten females with private insurance report that their insurance covered the full cost of their contraceptive method (70%), but 25% say they paid at least part of the cost out-of-pocket (Figure 14). There are a number of reasons that someone might have to pay part of the cost for contraceptives even though they have private coverage. For example, someone could be using a brand-name contraceptive that is not in the plan’s formulary or they are unaware of or not offered a generic alternative. Some people paying out-of-pocket could also be receiving care out-of-network or still be enrolled in a grandfathered health insurance plan, which is exempt from the requirement. However, half (50%) of this group do not know why they had to pay part of the cost out-of-pocket. Sixteen percent say they had to pay part of the cost themselves because they wanted a certain brand of contraception that was not covered by their plan (even though their plan should cover it if their provider recommends it for them). Some say it is because their prescribing provider (10%) or pharmacy (5%) was out of network, and one in five say it is for some other reason. Just one in five females who paid part of the cost out-of-pocket say that a health care provider or pharmacist offered them a no-cost alternative. Among those who had partial coverage for contraception and paid the rest out-of-pocket, almost one-third (32%) paid less than $15, almost one in five (19%) paid between $15 and $24, and one-third (37%) paid $25 or more (Figure 14).
Many people do not know that insurance plans are required to cover contraceptives for females.Although the ACA’s requirement for most private insurance plans to cover the cost of contraceptives for women took effect over ten years ago, many people are still not aware of it of this requirement. Four in ten reproductive age females (41%) do not know that plans are required to contraceptives for women. Conversely, while there is no federal requirement for coverage of vasectomies, three in ten males incorrectly believe there is (Figure 15).
No cost contraceptive coverage has helped alleviate cost barriers to contraceptives for many people, yet some still experience problems with getting their plan to cover their method in full. Six percent of reproductive age females with some form of coverage who used contraception in the past year report that they encountered problems getting their plan to cover or pay the full cost of their prescription birth control. Notably, a higher share of Black females, 11%, say they had problems getting their plan to cover or pay the full cost of their prescription birth control compared to 5% of White females. Of those who had problems, just 29% appealed the decision to their insurance company, even though federal rules require insurance companies to have a process for their enrollees to appeal contraceptive coverage denials.
The cost of contraceptives remains a barrier for some, even limiting their ability to continue their method. For those who are uninsured, costs can pose an even greater barrier. One in five uninsured females of reproductive age say they had to stop using a contraceptive method because they couldn’t afford it (Figure 16). This was also the case for nearly one in ten females who are Hispanic (9%) or make less than 200% of the federal poverty level (9%). Without coverage or access to free or low-cost services, uninsured females are faced with having have to pay out of pocket for contraceptives, use a method they do not prefer, or go without contraception altogether. Among females who say they had to stop using a method due to affordability problems, many (60%) did let their health care provider know, but nearly four in ten (38%) did not.
Just three in ten (30%) reproductive age contraceptive users say they had all the information they needed to choose a contraceptive method. Side effects from contraception are a major concern for females. When asked what information they would have liked to have had before starting on their current method, nearly four in ten (38%) contraceptive users say impact on menstruation and bleeding, 30% say impact on sex, and over half (52%) say other side effects associated with the method (Table 5). Other top informational needs are how long you can use the method (31%) and effectiveness (28%). In addition, a higher share of younger females than older females say they would have liked information on how easy it is to stop using a contraceptive and how soon you can get pregnant after stopping it.
While 35% of females ages 36-49 say that they did not need any additional information, this was the case for only 24% of females ages 18-25. A higher share of females ages 18-25 than females ages 36-49 would have liked information on how easy it is to stop using a contraceptive and how soon you can get pregnant after stopping it.
Across race/ethnicity groups, side effects associated with the method is the leading informational need. About half of White (51%), Black (50%), and Hispanic (48%) females would have liked to know about side effects before choosing a contraceptive method, while two-thirds of Asian/Pacific Islander females (67%) say they wished they had that information. Just 12% of Asian/Pacific Islander females say they had all the information they needed before choosing a method, compared to more than a quarter of Hispanic (26%) and Black (28%) females and one-third of White females (34%).
Health care providers are the main source of information about possible side effects from birth control for over half (57%) of reproductive-age females who use contraception (Figure 17). Fewer rely on written materials (17%) or a website (17%). When asked their preferred source for information about birth control side effects, three in four (74%) say doctors and health care providers. Although many (52%) say they would have wanted additional information about side effects, most females who have had a recent provider visit and use contraception (62%) say that their provider had talked to them about possible side effects before they started their current method. Providers often have limited time to counsel patients, which can leave patients without the information they want to make an informed decision about contraception.
Almost one-third of contraceptive users (31%) say they are experiencing side effects from their current method, and just over half (52%) say the side effects are more severe than they expected. Among those experiencing side effects, more than four in ten report mood changes (48%), weight gain (47%), and changes in periods (44%) (Figure 18). Eight in ten (80%) say they experienced more than one of these side effects. Just over half (54%) say they have talked to their health care provider about these side effects.
Only four in ten females report receiving person-centered counseling that is rated excellent on all dimensions.
Interactions with providers play an important role in the quality of contraceptive care, as providers are the main source of information that people have when making a decision about their birth control and understand potential side effects. While there has been considerable emphasis on prioritizing access to the most effective methods, there is also growing recognition of the importance of ensuring that patient-provider relationships are patient-centered and support patient decision making in the context of contraceptive counseling. Approximately 40% of female contraceptive users rate their most recent contraceptive care provider as “excellent” on all four items of person-centered contraceptive counseling (Figure 19): respecting them as a person, letting them say what mattered to them about their birth control method, taking their preferences about their birth control seriously, and giving them enough information to make the best decision about their birth control. Uninsured females and females receiving contraceptive counseling at clinics compared to private doctor’s offices are less likely to rate their care as excellent.
While most people are using their preferred method of contraception, a sizable minority -- one in four contraceptive users -- are not. Another important component of high-quality contraceptive counseling is taking seriously patients’ preferences and letting them say what matters to them about their birth control method. When asked if they would use a different method than the one they are using, three in four contraceptive users say “no”, but one in four (24%) say “yes.” Higher shares of Hispanic females (30%) and females with lower incomes (29%) are not using their preferred method, compared to their counterparts (Figure 20).
Among females who are not using their preferred contraceptive method, one in four say the primary reason is concern about side effects (25%). About one in ten say they can’t afford their preferred method (12%), their preferred method was not available (11%), their partner does not want them to use their preferred method (10%), or their provider recommended a different method (9%). However, there are some differences by age, race/ethnicity and income level (Table 6). One in three younger females ages 18-25 (33%) cites side effects as the primary reason they aren’t using their preferred method, compared to one in five females ages 36-49 (19%). About one in ten say they can’t afford their preferred method (12%), their preferred method was not available (11%), their partner does not want them to use their preferred method (10%), or their provider recommended a different method (9%). Notably, 17% percent of females with lower incomes say that they aren’t using their preferred method because they can’t afford it compared to 7% of females with higher incomes, and 15% of females with higher incomes say they aren’t using their preferred method because their partner objects to it compared to 3% of females with lower incomes.
Most sexually active, reproductive age females are not familiar with contraceptive methods that have recently come to the market. In recent years, the FDA has approved some new contraceptive options, some of which are designed to have fewer side effects. However, awareness of these newer methods is low. Just over one in five (22%) sexually active females has heard some or a lot about Annovera, a vaginal ring that is effective for up to one year approved by the FDA in 2018 (Figure 21). Phexxi is a novel contraceptive vaginal gel that received FDA approval in 2020, but just over one in ten (13%) females has ever heard anything about it. A higher share of females (45%) has heard a lot or some about Natural Cycles, an app that can be used to track the menstrual cycle and identify fertile periods and was cleared by the FDA as a medical device in 2018. A higher share of younger females ages 18-35 than those ages 36-49 report having heard at least something about Annovera (24%, 20% respectively) and the Natural Cycles app (51%, 38% respectively) (data not shown).
Nearly one-third of reproductive age females (31%) don’t know where to get emergency contraceptive pills (EC), a backup for missed birth control or contraceptive failure.EC pills, also called the morning after pill or Plan B, are a form of backup birth control that can be used within three to five days of unprotected sex or contraceptive failure to prevent pregnancy. Progestin only pills such as Plan B and its generic equivalents have been available over the counter (OTC) for many years, while another EC pill with a different chemical formulation, ella, (ulipristal acetate) requires a prescription and has a longer window of time that it is effective after unprotected sex. EC pills are not the same as medication abortion pills (mifepristone and misoprostol) and do not end a pregnancy nor cause an abortion.
Over one in four females ages 18-35 (27%) and 37% of those ages 36-49 do not know where they could obtain EC pills if they wanted it in the near future (Figure 22). Lack of knowledge about where to get EC pills is higher among females living in rural areas (40%) compared to those who live in urban/suburban areas (30%). While Plan B is an OTC drug, studies have found that access in pharmacies can be limited, particularly in rural communities.
More than one in four reproductive age females are not aware that some EC pills are available over the counter without a prescription. Since EC must be taken soon after sex, over the counter availability can help people obtain it more quickly. Seven in ten (73%) reproductive age females know that some EC pills are available over the counter without a doctor’s prescription, but 19% do not know that and 8% have not heard of EC (Figure 23). This could affect their ability to obtain EC in a timely manner.
Among those who have used EC recently, most obtained it without a prescription and had to pay for it out of pocket. Among reproductive age females who have used EC in the prior 12 months, more than eight in ten (81%) obtained it without a prescription (Figure 24). Most also reported that they had to pay for it out of pocket (82%). On average, Plan B pills can range from $10-$50 when purchased over the counter, which may be unaffordable for many young people.
Access to contraception intersects with abortion policy, especially now in the aftermath of the Supreme Court decision in Dobbs v. Jackson Women’s Health Organization, which eliminated the federal right to an abortion. The decision whether to ban or permit abortion is now largely up to state policymakers and there is increasing evidence that some states may also move to limit access to contraceptives like IUDs and emergency contraception.
This survey finds that approximately one in four (27%) females ages 18-64 say they have had an abortion during their lifetime, similar to findings in other studies. Abortions can be conducted by medical procedures or by medication. Medication abortion, which are pills that can be taken at home, is approved by the FDA for use up to 10 weeks gestation, and now accounts for more than half of abortions nationally.
In this survey, which was conducted shortly before the ruling in Dobbs, six in ten reproductive age females (61%) had heard of medication abortion, while 39% had not. Awareness was lower among some groups (Figure 25), including Hispanic females, females with low incomes, those living in rural communities and in the South, where abortion availability is more limited than in other parts of the country.
Prior to the ruling in Dobbs, just one-quarter (26%) of females ages 18-49 said they knew what clinic or health care provider they could go to for an abortion if they wanted or needed one. A relatively small share of reproductive age females knew where they could obtain abortion if they needed one, and while half (51%) said they did not know a specific place where they could get an abortion but knew where they could get the information, that has likely become more difficult since the Dobbs ruling. Abortion is now outlawed in many states and in some states, there is ongoing litigation. Ongoing court rules have created a confusing and shifting patchwork of policies in many states across the country. Just prior to the Dobbs decision, nearly one in four (23%) females did not know where they could go and did not know where to find that information (Figure 26).
Knowledge about abortion was higher among some groups. Compared to their White counterparts (25%), Black females (36%) were more likely to know what clinic or health care provider they could go to for an abortion if they wanted or needed one before the Dobbs ruling. The abortion rate in the U.S. is highest among Black women. A smaller share of females who live in rural areas (16%) compared to those living in urban/suburban areas (28%) knew where they could obtain an abortion. Rural areas have fewer abortion clinics than more populated areas.
Contraceptive care is a key component of one’s overall reproductive and sexual health care. Several factors go into ensuring people can obtain quality contraceptive care that is aligned with their personal preferences, including timeliness, efficiency, accessibility, affordability, equity, and patient-centeredness. The Affordable Care Act and Medicaid expansion, as well as state policies to ensure people have adequate contraceptive supply, have increased access to affordable and high-quality contraceptive care for many. New avenues for expanding contraceptive access and choices continue to grow through online platforms, as well as new methods and formulations that give people more contraceptive options.
Despite these efforts to improve accessibility and coverage, many of those we surveyed continue to report problems affording and accessing contraceptive care, and a sizeable minority of females are not using the method they prefer. Side effects, problems with insurance, inadequate supply, and other factors still affect whether people are obtaining the contraceptive care that they desire and seek. Health care providers are the most trusted source for information on contraception, and while there has been greater emphasis on patient centered care, many people still report that the quality of care falls short and that they do not have enough information to make an informed decision about their birth control method.
Sexual and reproductive health continues to remain at the center of many polarized policy debates at the state and federal levels. The coverage requirement for contraception and other preventive sexual health services is being challenged yet again in the courts by those who object to these services on religious or moral grounds. Furthermore, the loss of the federal standard protecting the right to abortion and action by many states to ban abortion could lead to limits on access to other sexual and reproductive health services, like effective methods of contraception, particularly emergency contraception and IUDs. The outcomes of these debates, along with state, federal and private sector actions will undoubtedly shape the availability and use of contraceptive care for millions in the years to come.
This work was supported in part by Arnold Ventures. KFF maintains full editorial control over all of its policy analysis, polling, and journalism activities.
Methodology
Overview
The 2022 KFF Women’s Health Survey is a nationally representative survey of 6,442 people ages 18 to 64, including 5,201 females (self-reported sex at birth) and 1,241 males, conducted from May 10, 2022, to June 7, 2022. The objective of the survey is to help better understand respondents’ experiences with contraception, potential barriers to health care access, and other issues related to reproductive health. The survey was designed and analyzed by researchers at KFF (Kaiser Family Foundation) and fielded online and by telephone by SSRS using its Opinion Panel, supplemented with sample from IPSOS’s KnowledgePanel.
This work was supported in part by Arnold Ventures. KFF maintains full editorial control over all of its policy analysis, polling, and journalism activities.
Questionnaire design
KFF developed the survey instrument with SSRS feedback regarding question wording, order, clarity, and other issues pertaining to questionnaire quality. The survey was conducted in English and Spanish. The survey instrument is available upon request.
Sample design
The majority of respondents completed the survey using the SSRS Opinion Panel (n=5,202), a nationally representative probability-based panel where panel members are recruited in one of two ways: (1) through invitations mailed to respondents randomly sampled from an Address-Based Sample (ABS) provided by Marketing Systems Group through the U.S. Postal Service’s Computerized Delivery Sequence. (2) from a dual-framed random digit dial (RDD) sample provided by Marketing Systems Group.
In order to have large enough sample sizes for certain subgroups (females ages 18 to 35, particularly females in the following subgroups: lesbian/gay/bisexual; Asian; Black; Hispanic; Medicaid enrollees; low-income; and rural), an additional 1,240 surveys were conducted using the IPSOS KnowledgePanel, a nationally representative probability-based panel recruited using a stratified ABS design.
Data collection
Web Administration Procedures
The majority of surveys completed using the SSRS Opinion Panel (n=5,056) and all of the surveys completed using the KnowledgePanel (n=1,240) were self-administered web surveys. Panelists were emailed an invitation, which included a unique passcode-embedded link, to complete the survey online. In appreciation for their participation, panelists received a modest incentive in the form of a $5 or $10 electronic gift card. All respondents who did not respond to their first invitation received up to five reminder emails and panelists who had opted into receiving text messages from the SSRS Opinion Panel received text message reminders.
Overall, the median length of the web surveys was 13 minutes.
Phone Administration Procedures
In addition to the self-administered web survey, n=146 surveys were completed by telephone with SSRS Opinion Panelists who are web reluctant. Overall, the median length of the phone surveys was 28 minutes.
Data processing and integration
SSRS implemented several quality assurance procedures in data file preparation and processing. Prior to launching data collection, extensive testing of the survey was completed to ensure it was working as anticipated. After the soft launch, survey data were carefully checked for accuracy, completeness, and non-response to specific questions so that any issues could be identified and resolved prior to the full launch.
The data file programmer implemented a “data cleaning” procedure in which web survey skip patterns were created in order to ensure that all questions had the appropriate numbers of cases. This procedure involved a check of raw data by a program that consisted of instructions derived from the skip patterns designated on the questionnaire. The program confirmed that data were consistent with the definitions of codes and ranges and matched the appropriate bases of all questions. The SSRS team also reviewed preliminary SPSS files and conducted an independent check of all created variables to ensure that all variables were accurately constructed.
As a standard practice, quality checks were incorporated into the survey. Quality control checks for this study included a review of “speeders,” reviewing the internal response rate (number of questions answered divided by the number of questions asked) and open-ended questions. Among all respondents, the vast majority (97%) answered 96% or more of the survey questions they received, with no one completing less than 91% of the administered survey (respondents were informed at the start of the survey that they could skip any question).
Weighting
The data were weighted to represent U.S. adults ages 18 to 64. The data include oversamples of females ages 18 to 35 and females ages 36 to 64. Due to this oversampling, the data were classified into three subgroups: females 18 to 35, females 36 to 64, and males 18 to 64. The weighting consisted of two stages: 1) application of base weights and 2) calibration to population parameters. Each subgroup was calibrated separately, then the groups were put into their proper proportions relative to their size in the population.
Calibration to Population Benchmarks
The sample was balanced to match estimates of each of the three subgroups (females ages 18 to 35, females ages 36 to 64, and males ages 18 to 64) along the following dimensions: age; education (less than a high school graduate, high school graduate, some college, four-year college or more); region (Northeast, Midwest, South, West); and race/ethnicity (White non-Hispanic, Black non-Hispanic, Hispanic-born in U.S., Hispanic-born Outside the U.S., Asian non-Hispanic, Other non-Hispanic). The sample was weighted within race (White, non-Hispanic; Black, non-Hispanic; Hispanic; and Asian) to match population estimates. Benchmark distributions were derived from 2021 Current Population Survey (CPS) data.
Weighting summaries for females ages 18 to 35, females ages 36 to 64, and males ages 18 to 64 are available upon request.
Finally, the three weights were combined, and a final adjustment was made to match the groups to their proper proportions relative to their size in the population (Table 1).
Margin of Sampling Error
The margin of sampling error, including the design effect for subgroups, is presented in Table 2 below. It is important to remember that the sampling fluctuations captured in the margin of error are only one possible source of error in a survey estimate and there may be other unmeasured error in this or any other survey.
KFF Analysis
Researchers at KFF conducted further data analysis using the R survey package, including creating constructed variables, running additional testing for statistical significance, and coding responses to open-ended questions. The survey instrument is available upon request.
Rounding
Some figures in the report do not sum to totals due to rounding. Although overall totals are statistically valid, some breakdowns may not be available due to limited sample sizes or cell sizes. Where the unweighted sample size is less than 100 or where observations are less than 10, figures include the notation “NSD” (Not Sufficient Data).
Statistical significance
All statistical tests are performed at the .05 confidence level. Statistical tests for a given subgroup are tested against the reference group (Ref.) unless otherwise indicated. For example, White is the standard reference for race/ethnicity comparisons and private insurance is the standard reference for types of insurance coverage. Some breakouts by subsets have a large standard error, meaning that sometimes even large differences between estimates are not statistically different.
A note about sex and gender language
Our survey asked respondents which sex they were assigned at birth, on their original birth certificate (male or female). They were then asked what their current gender is (man, woman, transgender, non-binary, or other). Those who identified as transgender men are coded as men and transgender women are coded as women. While we attempted to be as inclusive as possible and recognize the importance of better understanding the health of non-cisgendered people, as is common in many nationally representative surveys, we did not have a sufficient sample size (n >= 100) to report gender breakouts other than men and women with confidence that they reflect the larger non-cisgender population as a whole. The data in our reproductive health reports use the respondent’s sex assigned at birth (inclusive of all genders) to account for reproductive health needs/capacity (e.g., ever been pregnant) while the data in our other survey reports use the respondent’s gender.
Most Women are in Favor of Making Birth Control Pills Available Over the Counter without a Prescription if Research Shows they are Safe and Effective
A Substantial Share of Women with Private Insurance are Paying for Some or All of the Cost of their Contraceptives Indicating Plans May Not Be Complying with the Affordable Care Act
A new KFF survey finds that more than three-quarters (77%) of females ages 18-49 favor making birth control pills available without a doctor’s prescription if research shows they are safe and effective. Among those who favor making birth control pills available over the counter and who currently use prescription oral contraception, 60% say they would be likely to use over-the-counter birth control pills. Most say the main reason is convenience (59%).
Many females who would be unlikely to use over-the-counter birth control pills (46%) or are unsure (14%) say the main reason is they don’t currently use birth control pills nor plan to use them in the future (53%). Among those who use oral contraception, the main reason is they would prefer to talk to a provider before starting or refilling their birth control. Other reasons include concerns about safety, cost, and health insurance coverage.
While the Affordable Care Act (ACA) has required most insurance plans to cover prescription contraceptives at no cost to patients for over a decade, 41% of females ages 18-49 are unaware of this requirement. One-quarter of these females with private insurance say they paid at least part of the cost of their contraceptive care out-of-pocket. A growing number of reports note that some insurance plans are failing to comply with the ACA’s contraceptive coverage requirement, which has been scaled back through regulations and court decisions.
These survey findings come as the U.S. Food and Drug Administration decides whether to approve a progestin-only oral contraceptive pill (Opill) for over-the-counter status, making it as accessible as pain relievers and allergy medications.
Periodically conducted since 2001, the 2022 KFF Women’s Health Survey includes a nationally representative sample of 5,201 people who say they were assigned female at birth (including those who identify as women or other genders). Our analyses present the state of contraceptive access and preferences, including differences in contraceptive use and experiences by income, race and ethnicity, and insurance status.
Additional findings include:
The vast majority of females ages 18-64 (90%) have used contraceptives at some point in their reproductive years, and most have used more than one contraceptive method throughout their lifetime (76%).
Most females get their birth control care at a doctor’s office (77%) and prefer to get their care there, even as more services have become available online. Clinics and health centers remain an essential source of contraceptive care, particularly for those who have low incomes (18%) or are uninsured (23%).
One in five uninsured females say they had to stop using a birth control method because they couldn’t afford it.
One-quarter of females aren’t using their preferred method of contraception, with many raising concerns about side effects and affordability. Only 30% of females say they received all the information they needed before choosing their birth control method.
One in four females either don’t know emergency birth control pills are available over the counter or have never heard of them. Among those who have heard of emergency birth control pills and could become pregnant, three in ten (31%) say they don’t know where they could get them.
An updated KFF issue brief on racial disparities in maternal and infant health includes new and updated analysis of data on pregnancy-related mortality, birth risks and infant mortality. The brief reviews the underlying factors contributing to maternal and infant health racial disparities, ranging from historical and ongoing racism to differences in access to health care and coverage and other social and economic factors that drive health.
With recent attention to this issue by federal and state policymakers, there are ongoing efforts to address the problem. The American Rescue Plan expanded access to and helped stabilize Medicaid coverage during the postpartum period, which many states have adopted. Other approaches include better data collection, better utilization of evidenced-based practices and diversifying the health workforce.
Looking forward, the overturning of Roe v. Wade is leading to increased barriers to abortion. This policy change may contribute to an increase in racial disparities in maternal and infant health and should be monitored.
Two New KFF Analyses Show That a Relatively Small Share of Medicare Beneficiaries Compared Plan Options Or Switched Plans During a Recent Open Enrollment Period
As Medicare’s annual open enrollment period gets underway, two new analyses from KFF suggest that a relatively small share of the nation’s 65 million Medicare beneficiaries will shop around among the many coverage options for 2023 or switch plans. That decision could have a significant impact on enrollees’ coverage and costs.
Results from one new KFF analysis show that only 3 in 10 beneficiaries (29%) compared their current plan with other Medicare plans offered during the open enrollment period for 2020.
The share of beneficiaries reviewing their coverage options was even lower among certain subgroups, including beneficiaries with lower incomes (15%); enrolled in both Medicare and Medicaid (16%); age 85 or older (18%); Hispanic (19%); or under age 65 with disabilities (22%).
A second KFF analysis finds that few beneficiaries choose to switch plans during open enrollment, regardless of whether they are enrolled in Medicare Advantage or traditional Medicare. For instance, among people in Medicare Advantage plans with prescription drug coverage, only 1 in 10 beneficiaries enrolled in such plans voluntarily switched plans for 2020. Among beneficiaries in in traditional Medicare with a stand-alone drug plan, only 2 in 10 opted for a different plan during open enrollment.
(This analysis excluded beneficiaries who receive low-income subsidies for Part D coverage because they have a more limited set of choices and because some are auto-assigned to new plans every year by the government.)
Coverage and costs vary widely among both Medicare Advantage plans and Part D prescription drug plans. From one year to the next, plans can change their premiums, cost-sharing requirements, and scope of covered drugs and supplemental benefits, as well as provider networks or prior authorization requirements. These changes could lead to unexpected and avoidable costs, and disruptions in care for beneficiaries who stay put and do not at least review their options annually, as the Centers for Medicare & Medicaid Services (CMS) recommended.
Despite year-to-year changes in Medicare Advantage plans, about half (54%) of all Medicare Advantage enrollees reviewed their current plan for potential changes in premiums or other out-of-pocket costs for coverage in 2020, while the other half did not, according to the study. The same share (54%) reported they reviewed their current plan for potential changes in the kinds of treatments, drugs, and services that would be covered in the following year.
The analysis also finds Medicare’s official information resources are not widely used, especially the 1-800-MEDICARE helpline. Just under half of beneficiaries (49%) reported that they had read all or part of the Medicare & You handbook, and 44 percent said that they (or someone on their behalf) had visited the Medicare.gov website. Only 29 percent said they had called the helpline.
The two new KFF analyses are based on Medicare beneficiary survey and claims data from the Centers for Medicare & Medicaid Services.