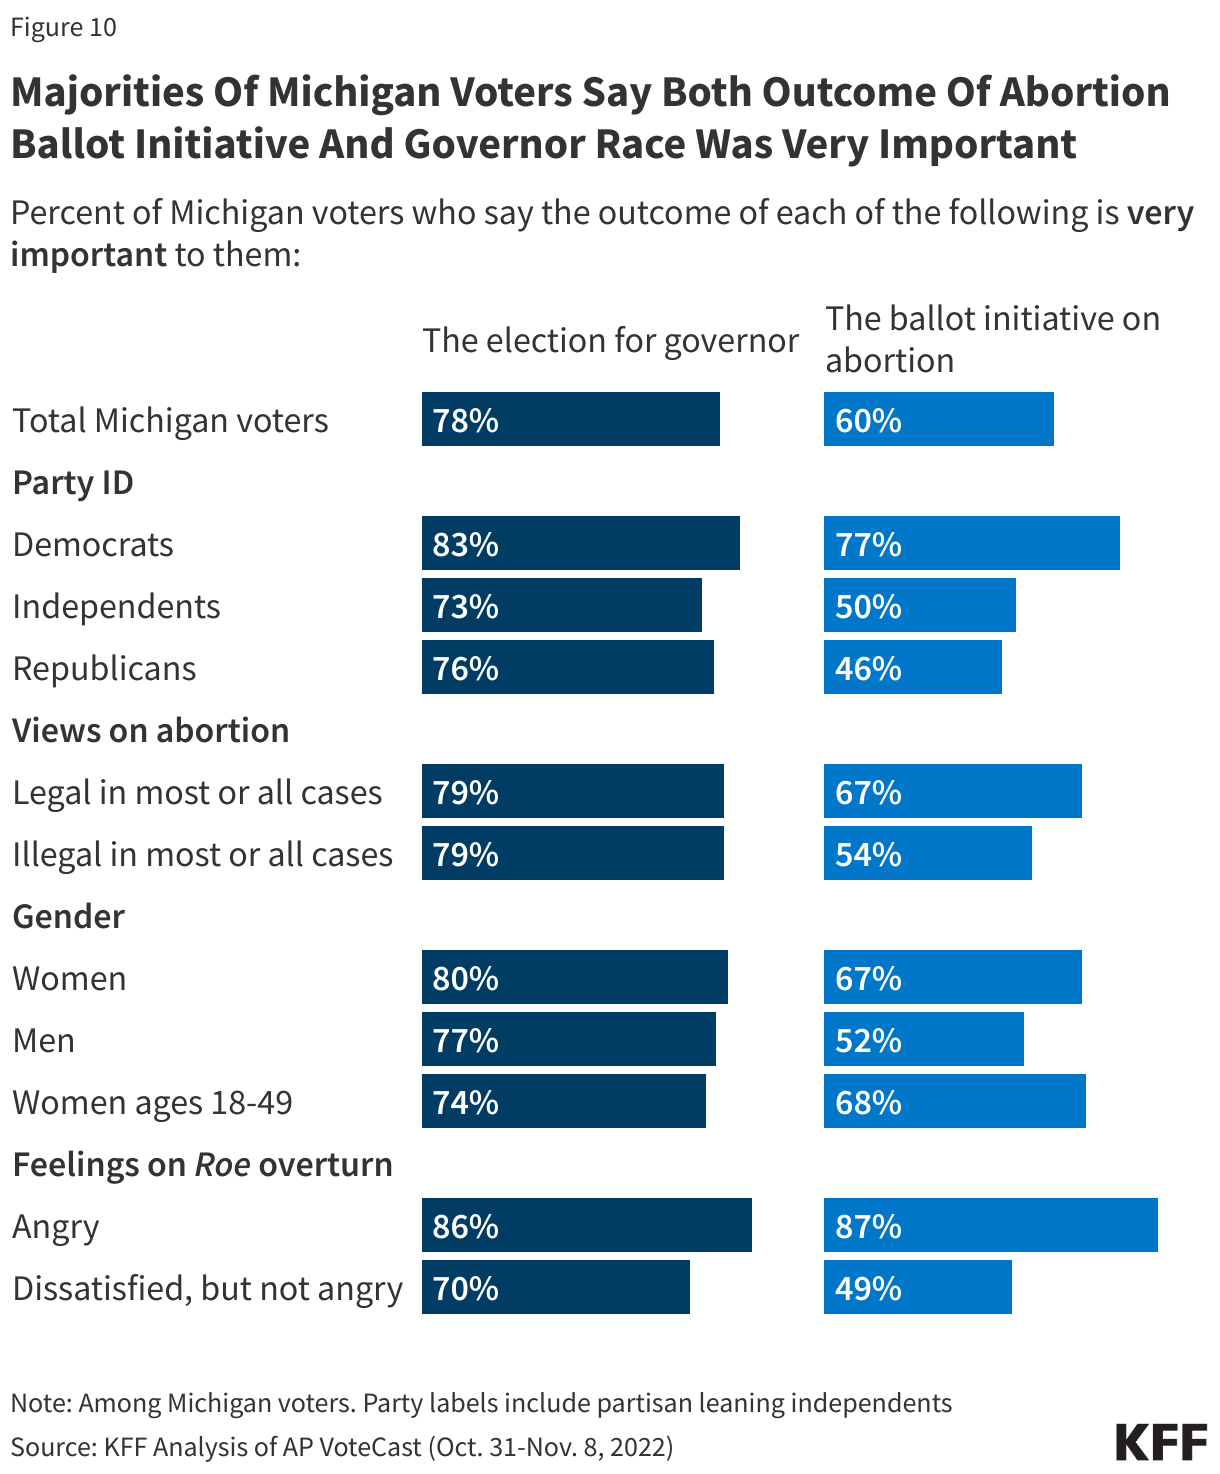
Abortion Bans May Limit Essential Medications for Women with Chronic Conditions
The Supreme Court’s decision to overturn Roe v. Wade and send the decision to ban or permit abortion back to the states will likely have health implications beyond banning abortion in many states. There have already been reports of clinicians and pharmacists denying women access to medications like methotrexate and misoprostol to manage their chronic conditions, such as autoimmune diseases and gastric ulcers, because the drugs are also used for medication abortions and treatment of ectopic pregnancies. In these reports, pharmacists have denied or delayed filling prescriptions unless specific codes for non-pregnancy related conditions are given. Some providers are also requesting patients take a pregnancy test to confirm a non-pregnant status before they will prescribe the medications. This analysis finds that the majority of those who use these drugs are women who are not pregnant but have diagnoses for other chronic conditions and rely on these medications to manage their health. Consequently, women of reproductive age with chronic conditions will be most impacted by these actions.
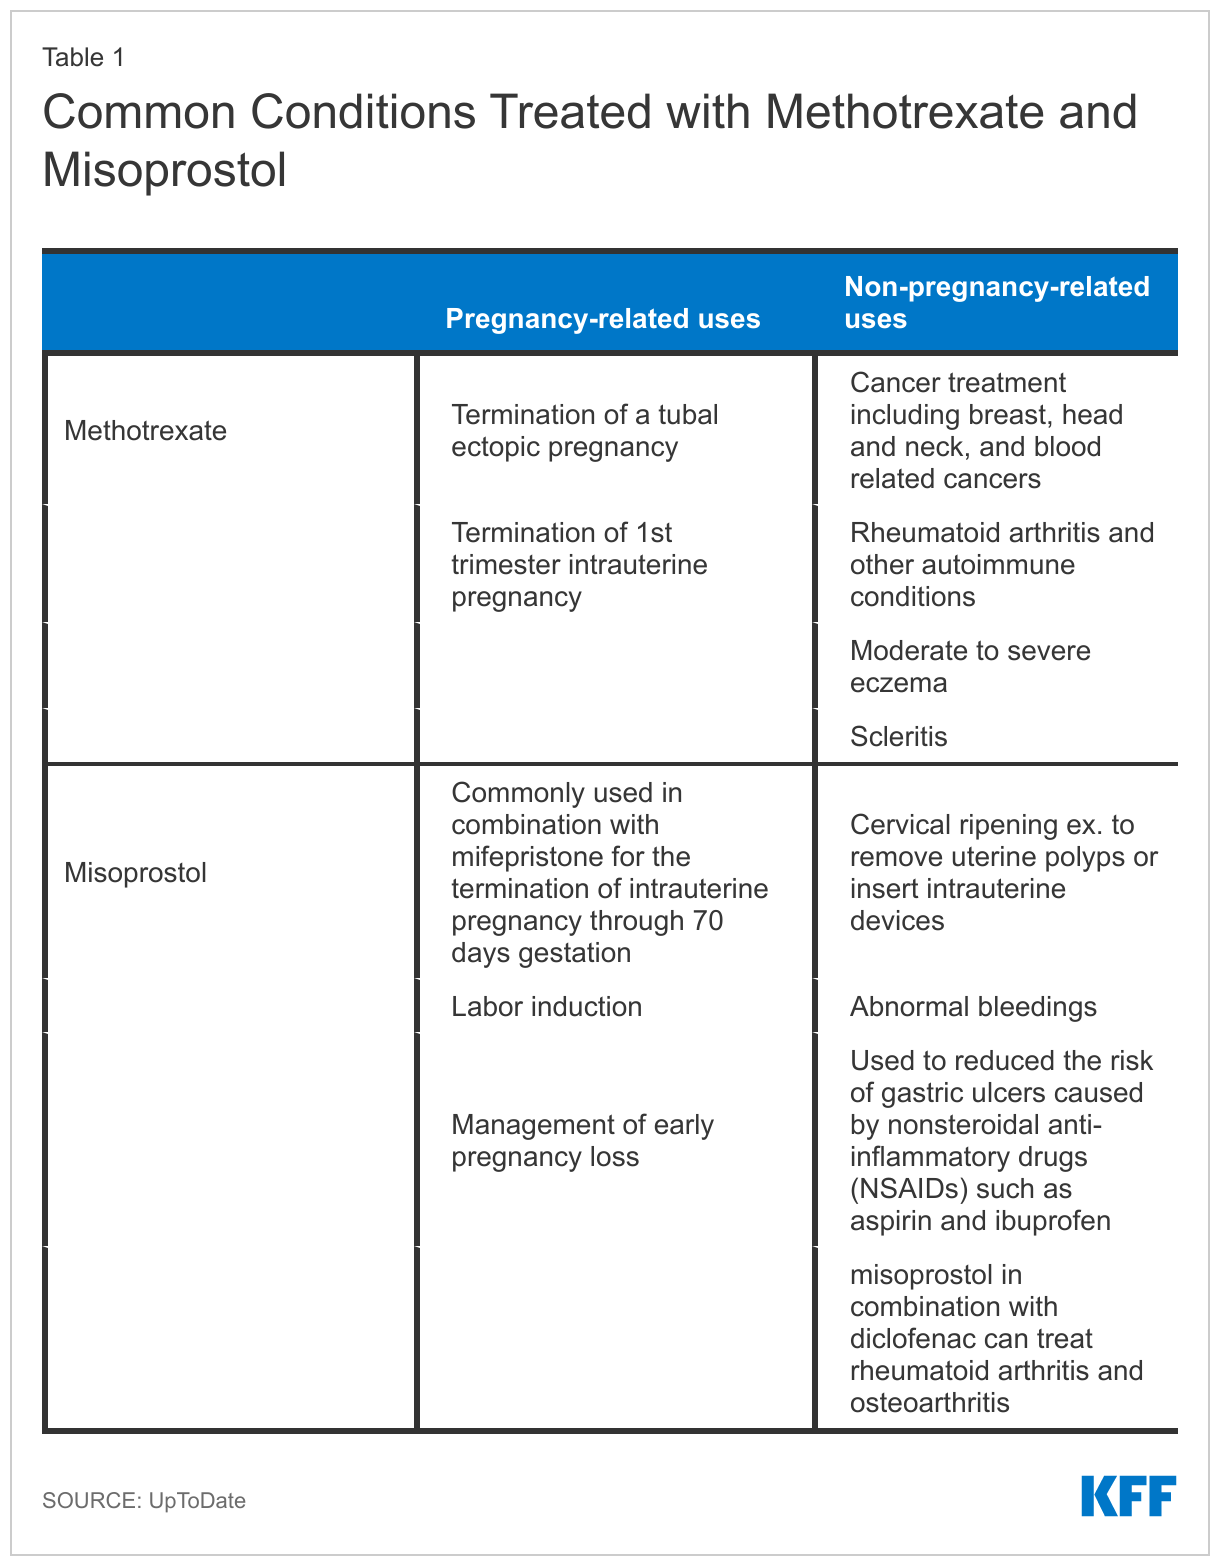
Indications for Use of Methotrexate and Misoprostol
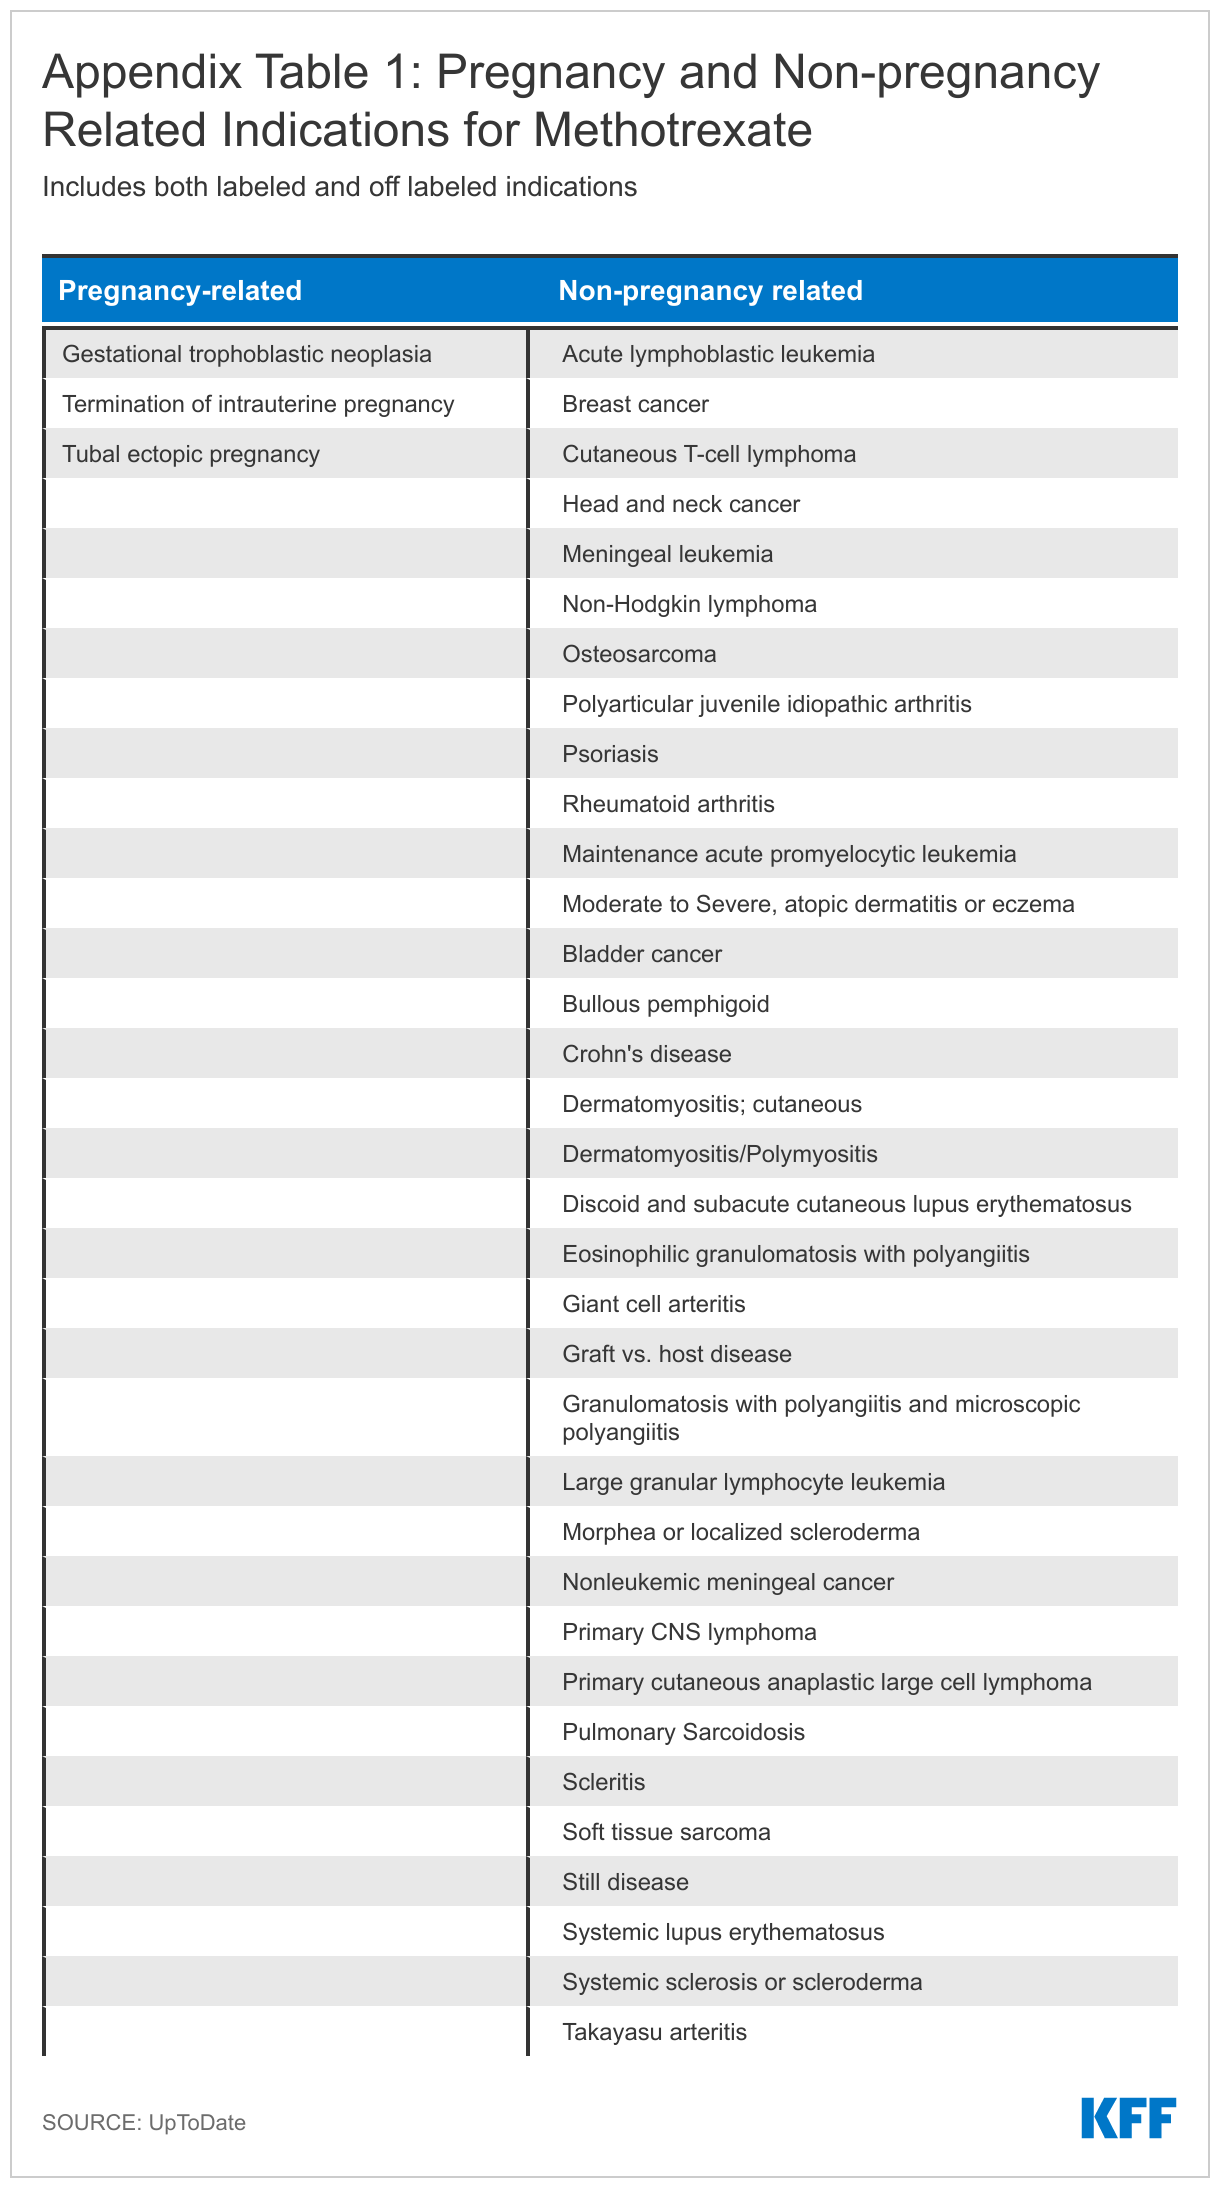
Methotrexate is indicated for treatment of rheumatoid arthritis and other autoimmune diseases that disproportionately affect women. The drug works by suppressing the immune system. Additionally, many chemotherapy regimens include methotrexate for treatment of adult and pediatric cancers, such as leukemia and breast cancer, where it works to slow or stop the growth of cancer cells. It also has some off label uses for common conditions like Crohn’s disease, lupus, and eczema. The drug is also a common treatment for ectopic pregnancies where it stops cells from dividing by interfering with the folic acid in your body.
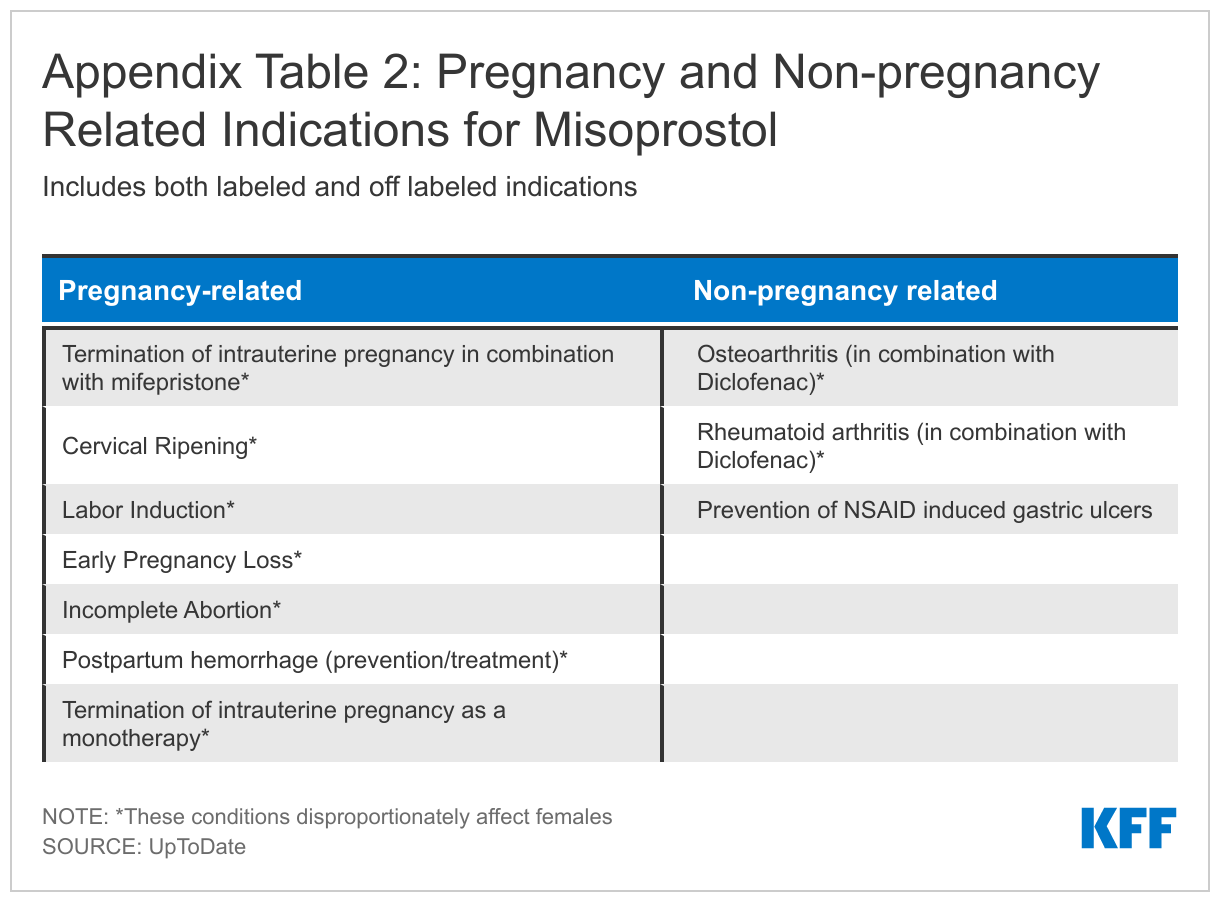
Beyond methotrexate, another drug that may be limited because of its use in pregnancy terminations is misoprostol. Misoprostol is a prostaglandin that causes cervical softening and dilation, as well as uterine contractions. It is frequently used in obstetrics and gynecology for procedures like the medical management of miscarriage, induction of labor, cervical ripening before surgical procedures, and the treatment of postpartum hemorrhage. It is also indicated for reducing the risk of nonsteroidal anti-inflammatory drug (NSAIDs like aspirin and ibuprofen) induced gastric ulcers in patients at high risk of complications from gastric ulcers. In combination with mifepristone, misoprostol can be used to terminate an intrauterine pregnancy through 70 days gestation. Access to methotrexate and misoprostol is essential for patients, especially women, with these cross-cutting conditions. A more detailed version of Table 1 can be found in the Appendix.
Findings
We examined the gender, age, and diagnosis of people with methotrexate and misoprostol prescriptions and injections in claims from the IBM MarketScan Encounter Database in 2019, a database of claims paid on behalf of enrollees of large employer private health plans. We looked at utilization for both men and women enrollees ages 0-64, with a focus on reproductive aged women, ages 15-49, who did not have indication of a pregnancy in the year. The claims used in this analysis only reflect use under the benefit plan and do not include services for which the enrollee did not file a claim such as a medication abortion that was paid for out-of-pocket without using insurance, which could result in an underestimate of individuals using these drugs.
Methotrexate
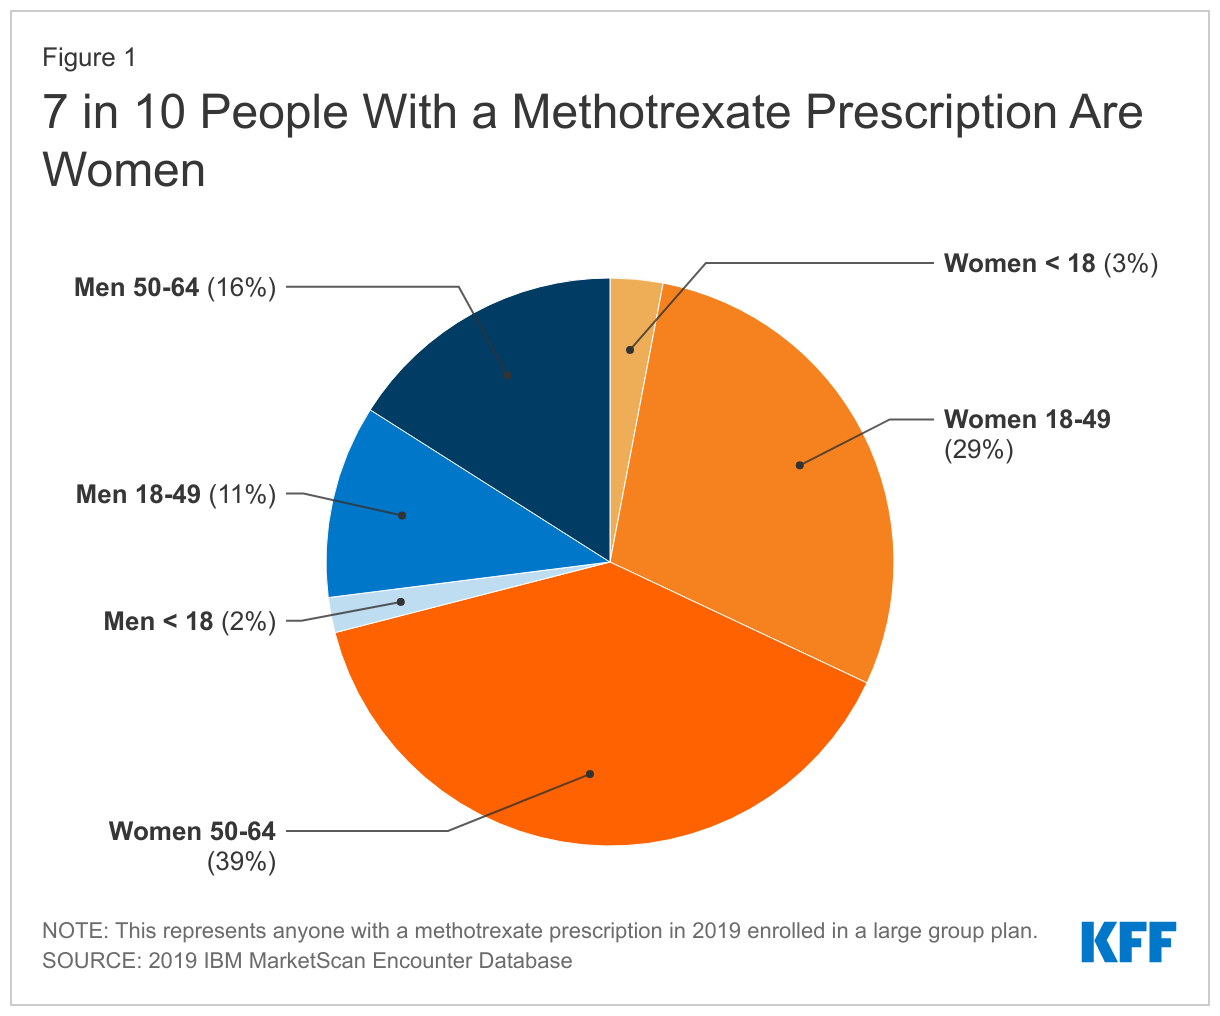
We find that women make up the majority of people (71%) with a methotrexate prescription in the 2019 IBM MarketScan Encounter Database compared to 29% of methotrexate prescriptions going to men (Figure 1). Over a quarter (29%) of people with a methotrexate prescription are women of reproductive age, ages 18-49, while 39% are women ages 50-64.
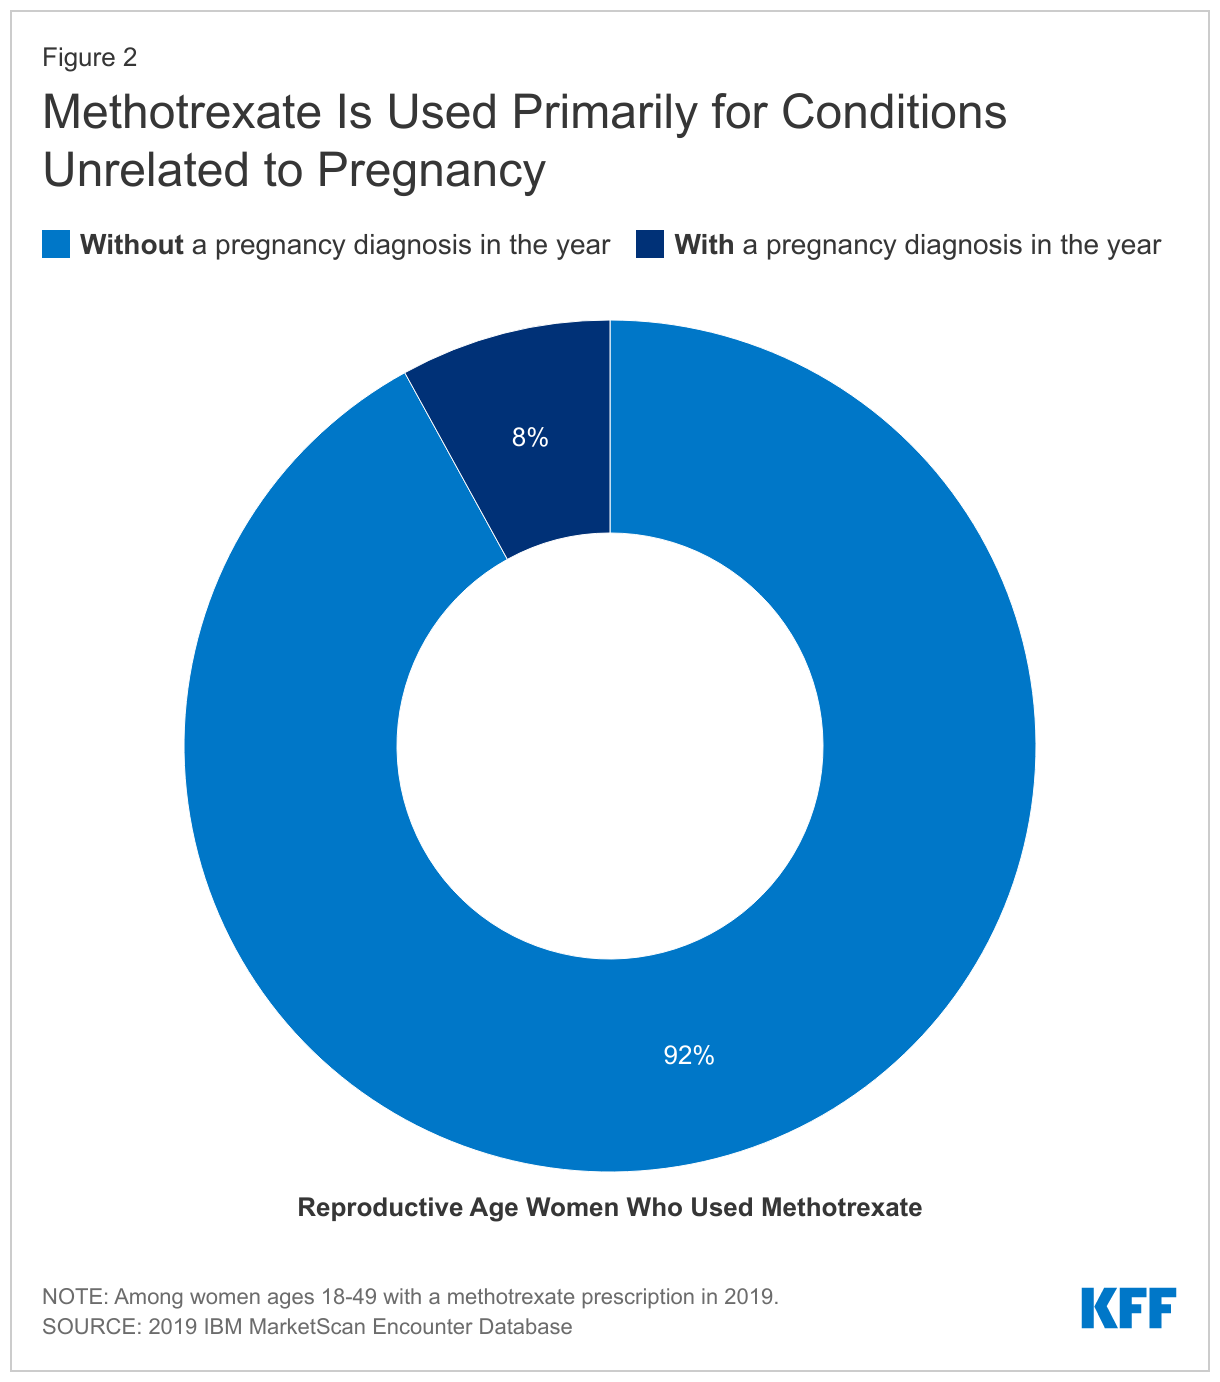
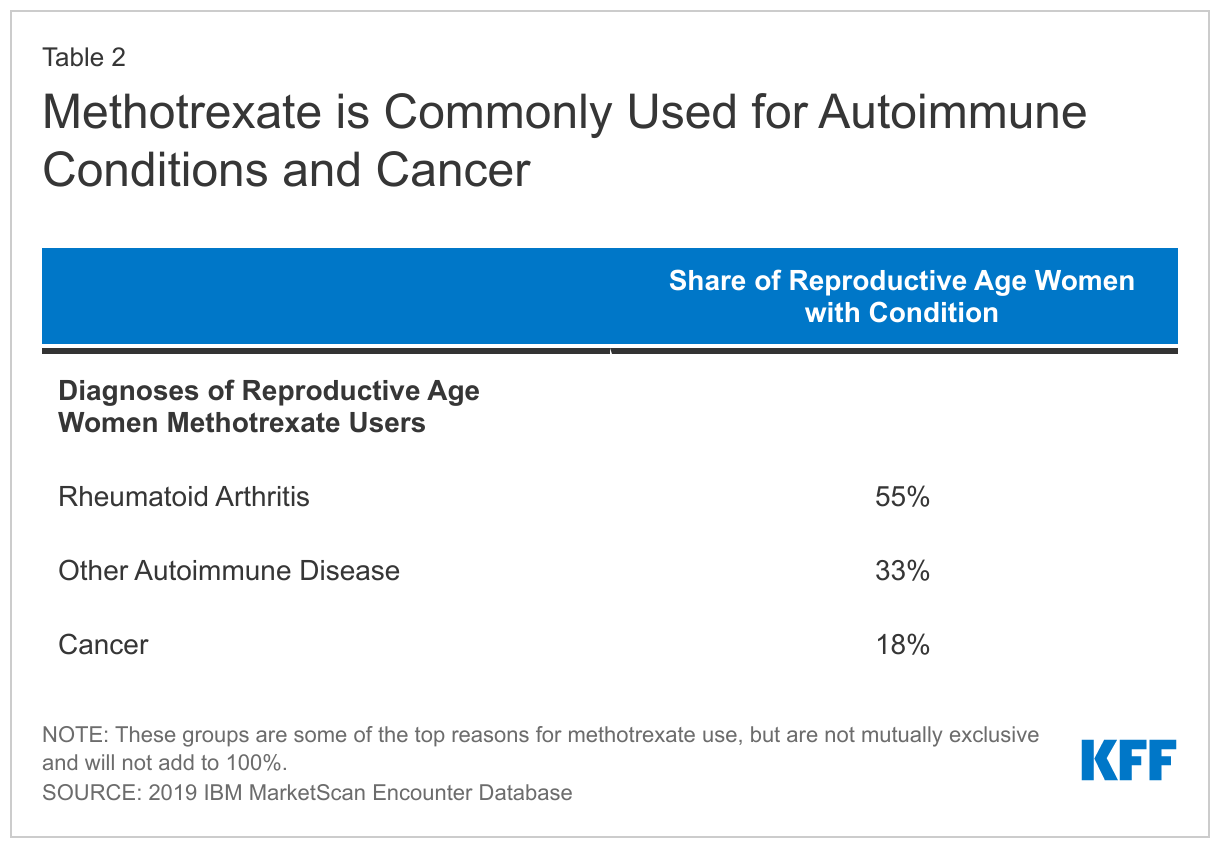
Among reproductive-aged women with a methotrexate prescription claim, 92% had no indication of pregnancy in the measurement year (Figure 2). Among those who were not pregnant, over half (55%) of reproductive-aged women with a claim for a methotrexate prescription had a diagnosis code for rheumatoid arthritis at some point during the year. Nearly a third (33%) had a diagnosis for another autoimmune disease we looked at and just over one in five (18%) had a cancer diagnosis at some point in the year (Table 2).
Misoprostol
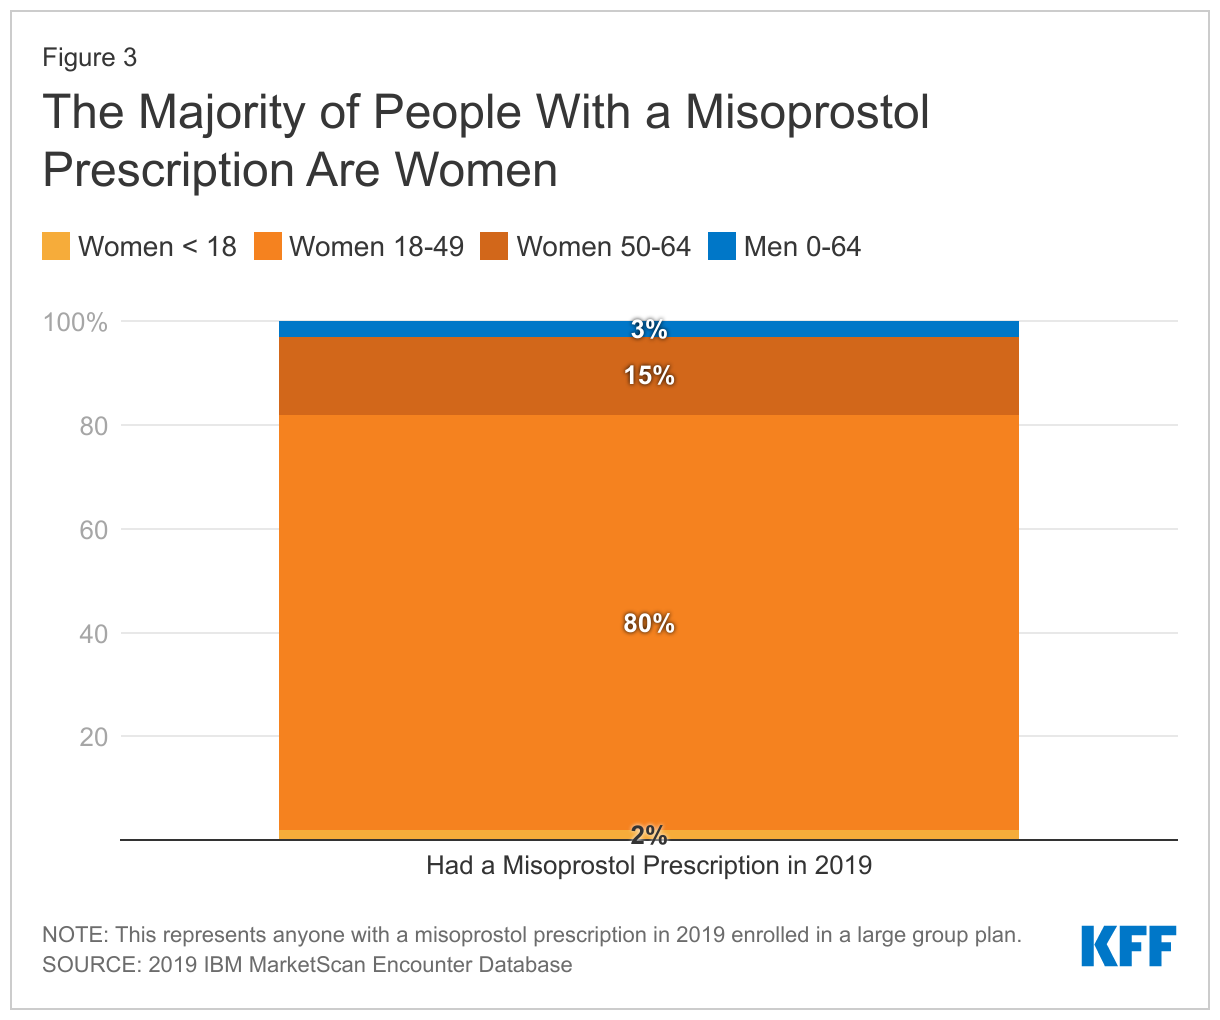
Among misoprostol prescriptions, 97% are prescribed to women compared to 3% for men. The majority of women using misoprostol are of reproductive age (80%) (Figure 3).
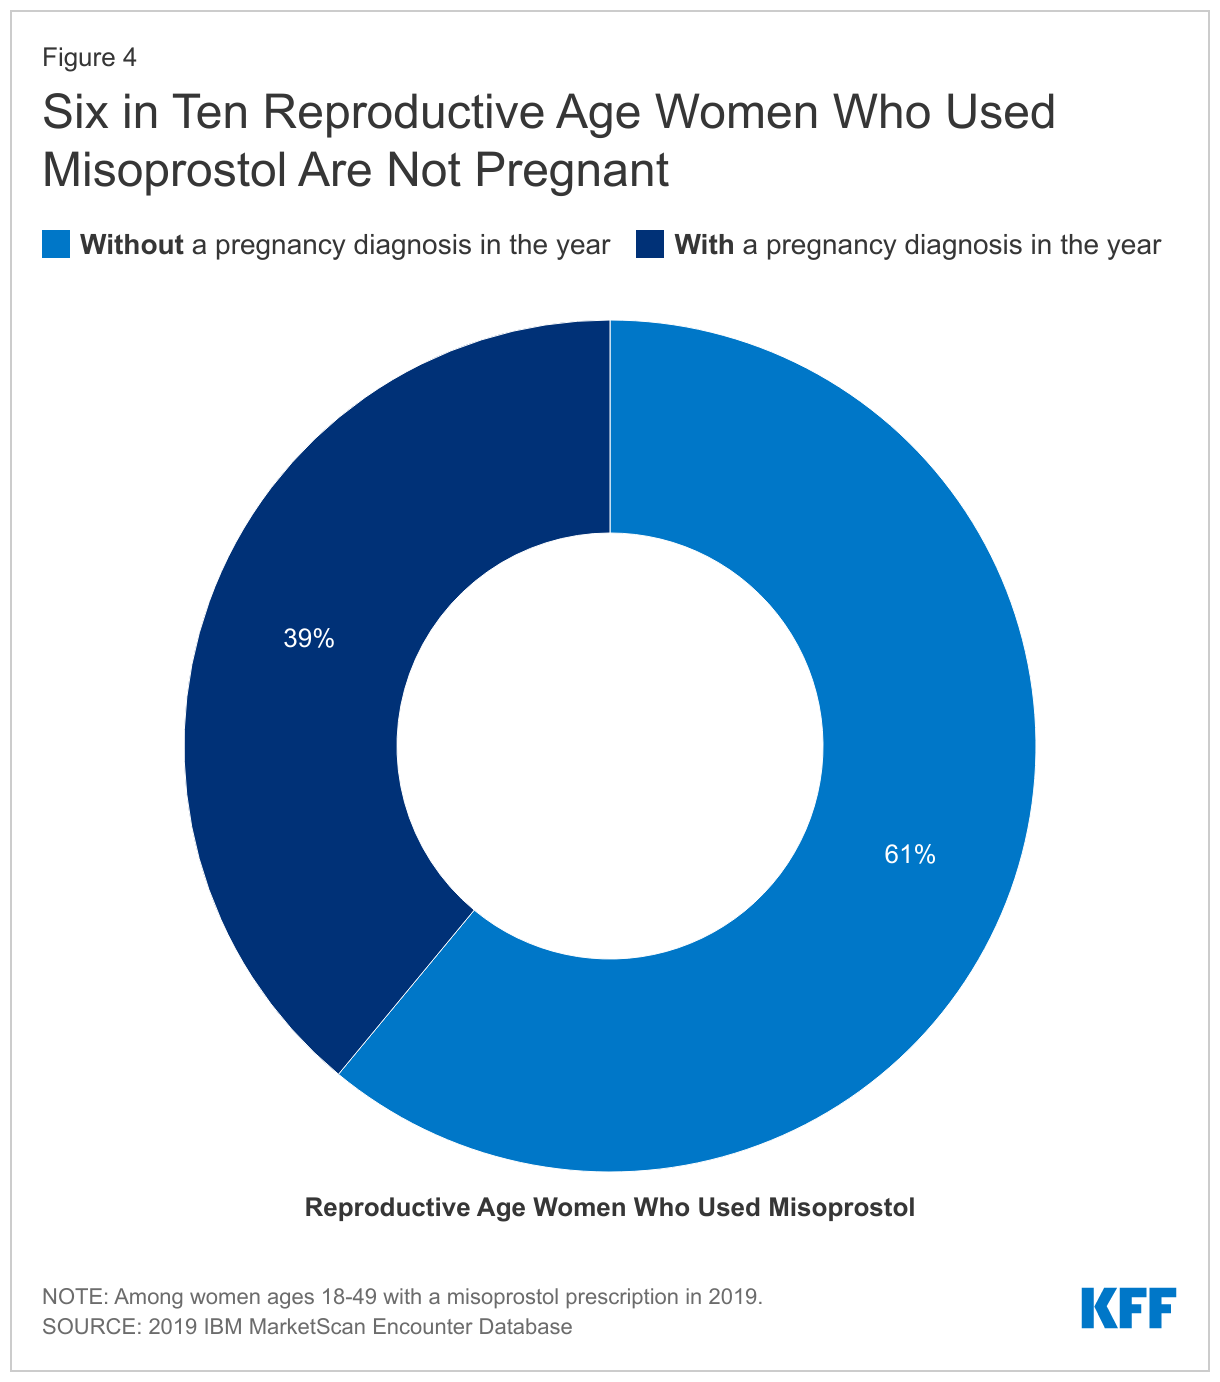
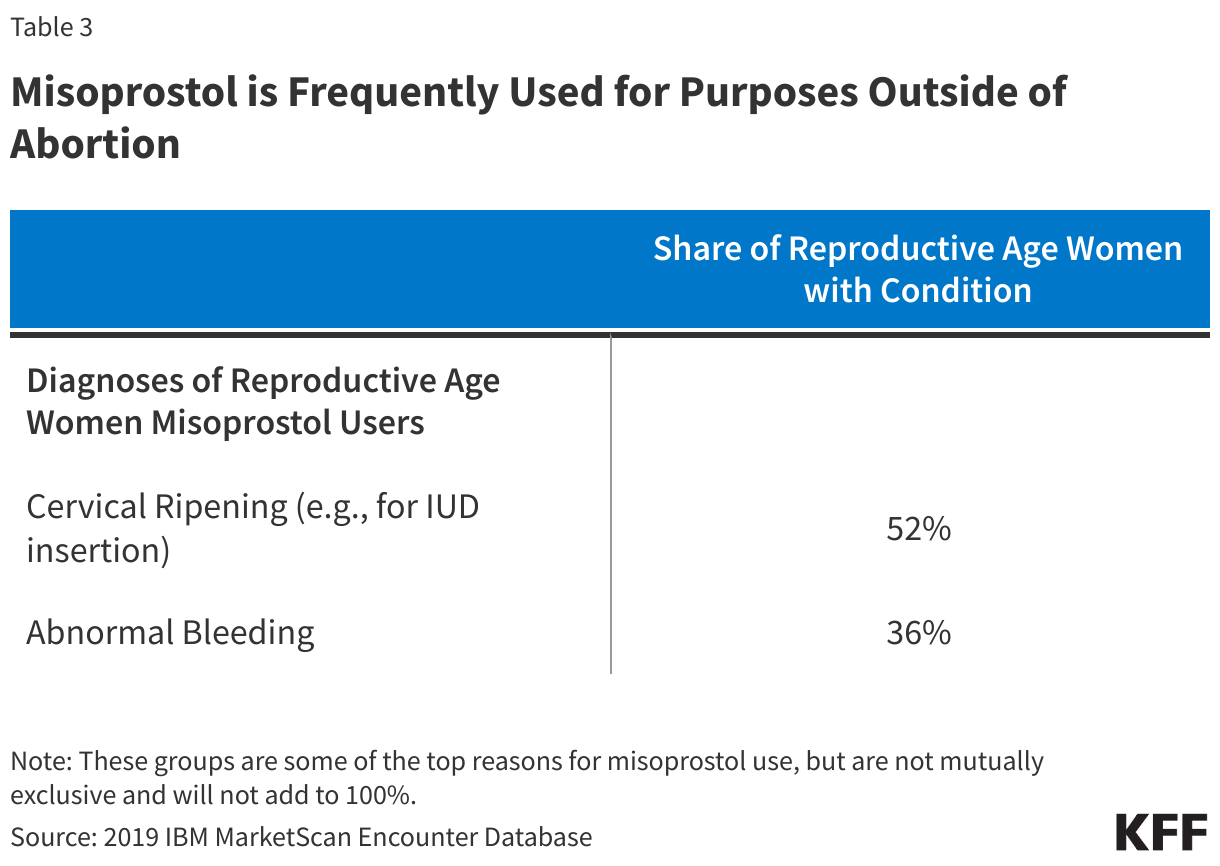
Among reproductive-aged women with misoprostol prescription, 61% had no indication of pregnancy in the year (Figure 4). Over half (52%) of non-pregnant women of reproductive age had a diagnosis for conditions where misoprostol would be indicated for cervical ripening, such as for an IUD insertion, while another one in three (36%) had a diagnosis code for abnormal bleeding (Table 3).
Implications
As abortion bans are implemented in states in the South and Midwest, reproductive-aged women with autoimmune diseases or cancer could see delays or denials in receiving medications like methotrexate and misoprostol, used to manage their chronic conditions. The abortion bans also have implications for the management of a broad range of conditions that impact women. This analysis finds that limitations and barriers to these treatments will have a disproportionate impact on women, beyond limiting the availability of abortions to terminate pregnancies.
Providers and pharmacists in states where abortion is banned could refrain from prescribing or dispensing these drugs out of fear of prosecution. In response to concerns about access to these medications, on July 13, 2022, the U.S. Department of Health and Human Services issued guidance reminding retail pharmacies that as recipients of federal financial assistance, including Medicare and Medicaid payments, that they are prohibited from discriminating based on sex and other bases (i.e., race, color, national origin, age, and disability) under Section 1557 of the Affordable Care Act. The administration’s stance is that decisions to limit access to these medications could be discriminatory based on age, sex, and disability and could violate Section 1557 of the ACA. This is one of the many unanticipated consequences of the Supreme Court decision to overturn Roe v. Wade and states actions to ban abortion.
Methods
We analyzed prescription drug claims from the 2019 IBM Health Analytics MarketScan Commercial Claims and Encounters Database, which contains claims information provided by a sample of large employer plans. Non-elderly enrollees in MarketScan were included if they were enrolled for at least 6 months. This analysis used claims for almost 14,000 million non-elderly people representing about 17% of the 85,453,000 million people in large group plans (employers with a thousand or more workers) in 2019. To make MarketScan data representative of enrollment in large group plans nationally, weights were applied to match counts in the Current Population Survey for enrollees and their dependents employed by firms of a thousand or more workers by sex, age and state. Weights were trimmed at eight times the interquartile range. In total, there were claims for 3,816,000 women of reproductive age (18-49), representing 16% of those in a large group plan.
This data collects the utilization of retail prescription drugs but does not include a diagnosis associated with the prescription. ICD-10 diagnosis codes were used to classify illnesses and conditions. Individuals are classified as having a diagnosis if they had either an outpatient or inpatient claim within the year which included one of the identified diagnoses. Persons with a pregnancy claim were first identified with diagnoses including any ICD-10 diagnosis code beginning with O, Z33, Z34, Z3A, Z322, Z3201, Z36, Z39 or Z37. After excluding persons with a pregnancy claim, we identified persons with a claim for rheumatoid arthritis or cancer using the disease definitions developed by the Healthcare Cost and Utilization Project (HCUP). Persons using the drugs who had another autoimmune disease, cervical ripening, or abnormal bleeding were identified using a select group of diagnosis codes available upon request. The claims used in this analysis only reflect use under the benefit plan and do not include services for which the enrollee did not file a claim, which could result in an underestimate of individuals using these drugs.
Appendix