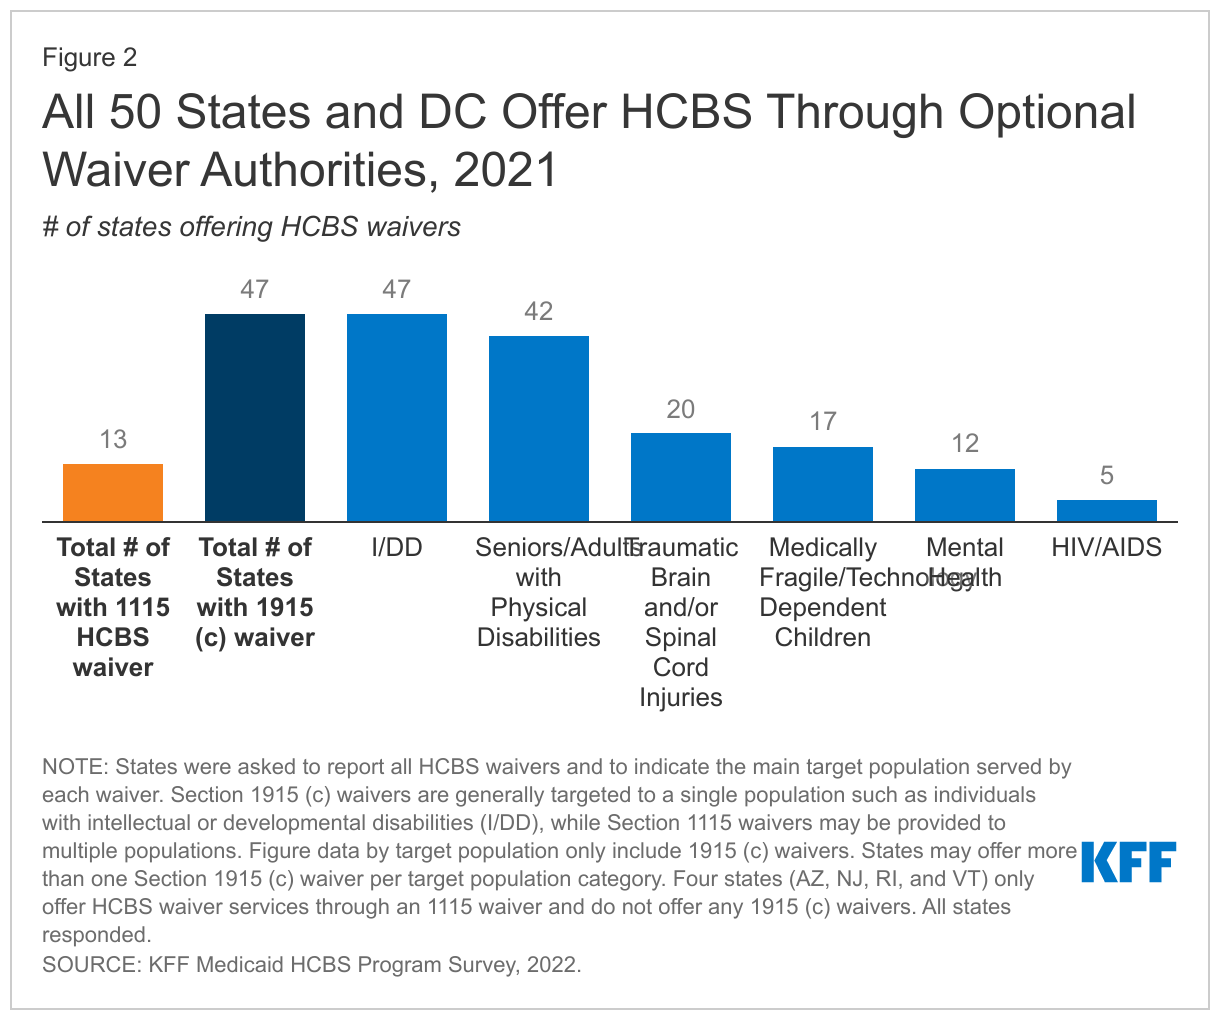
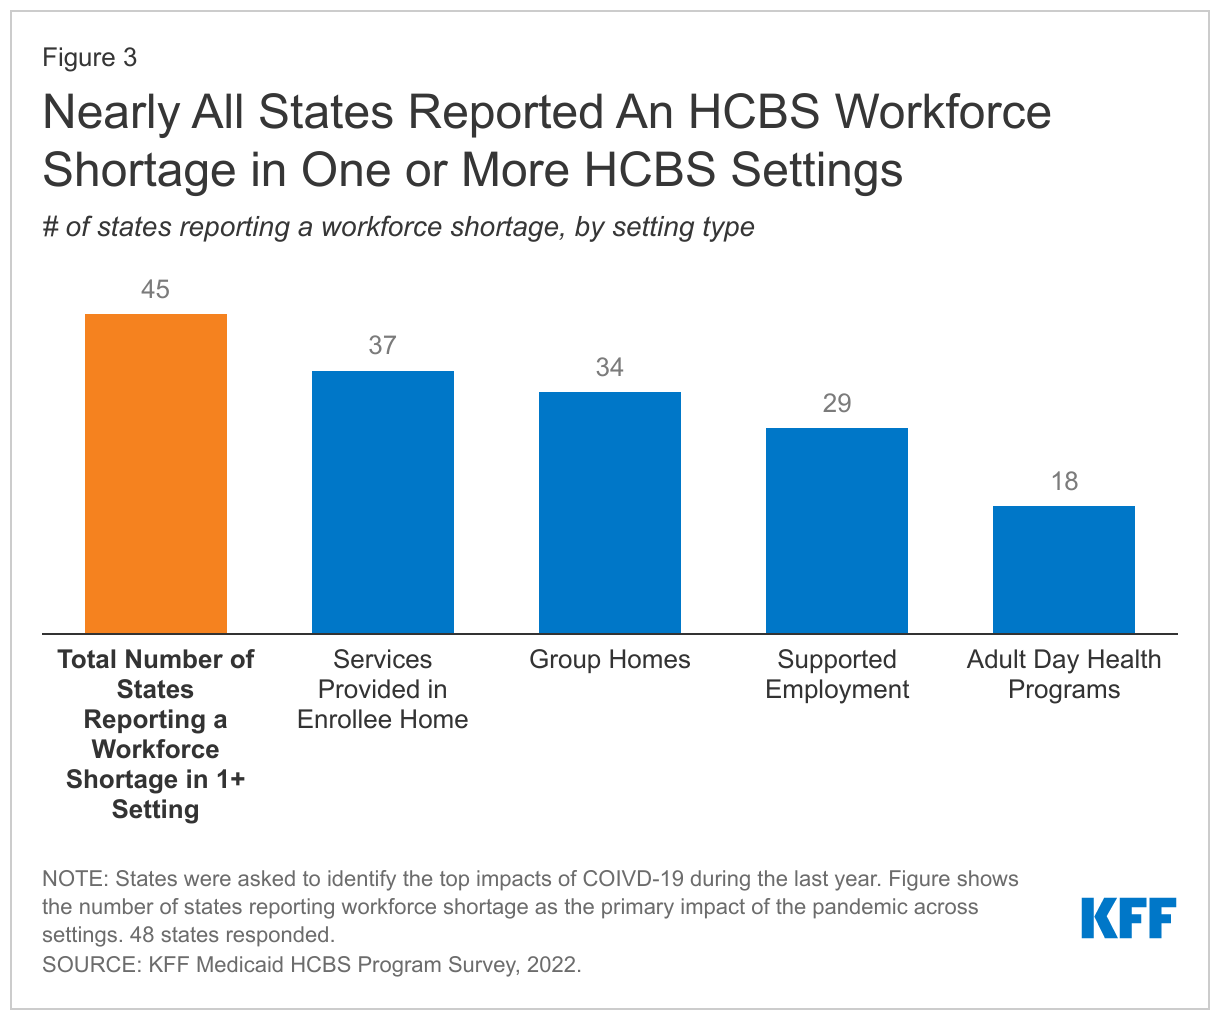
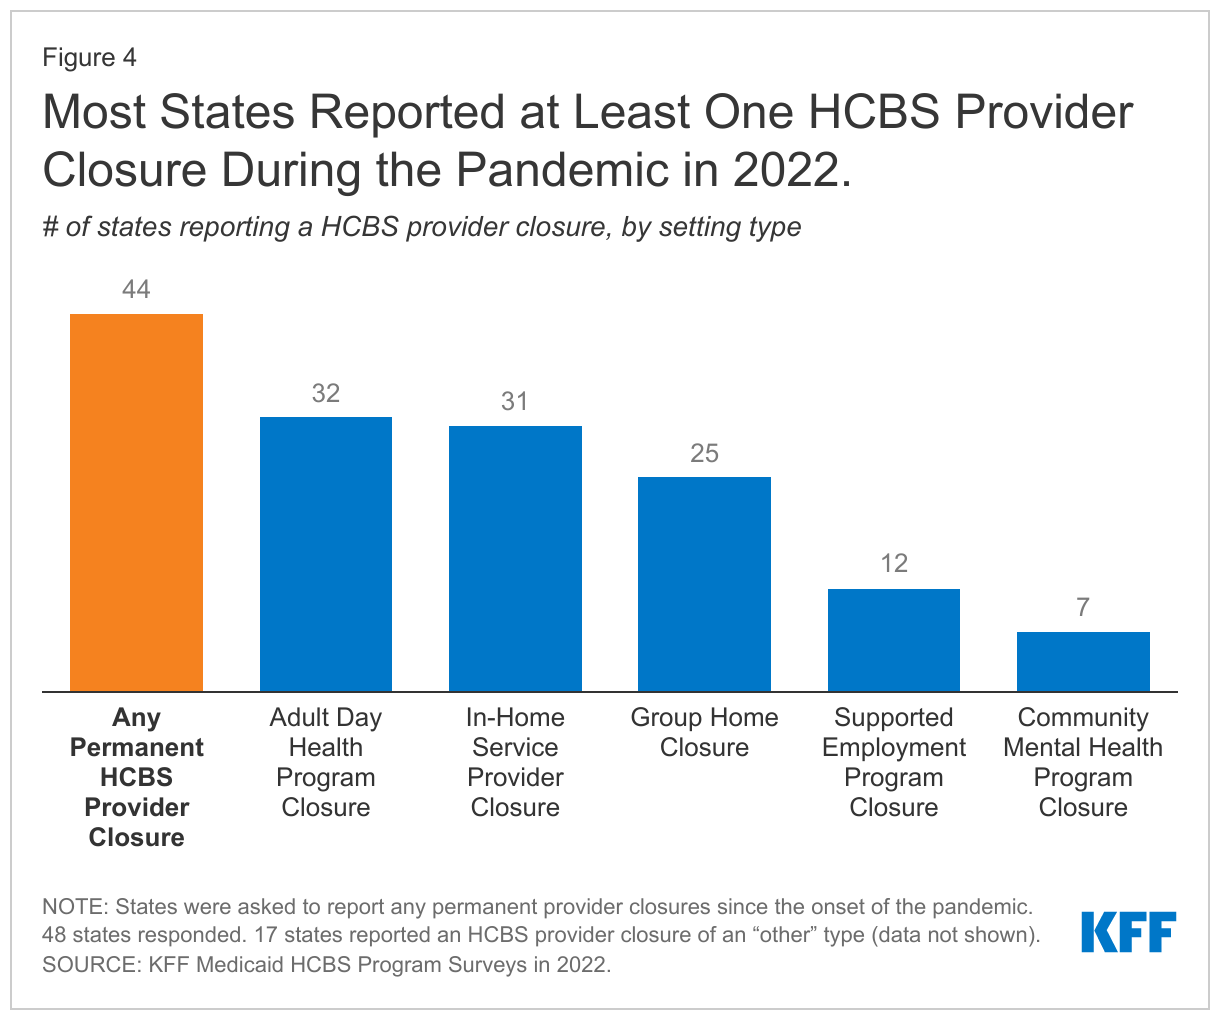
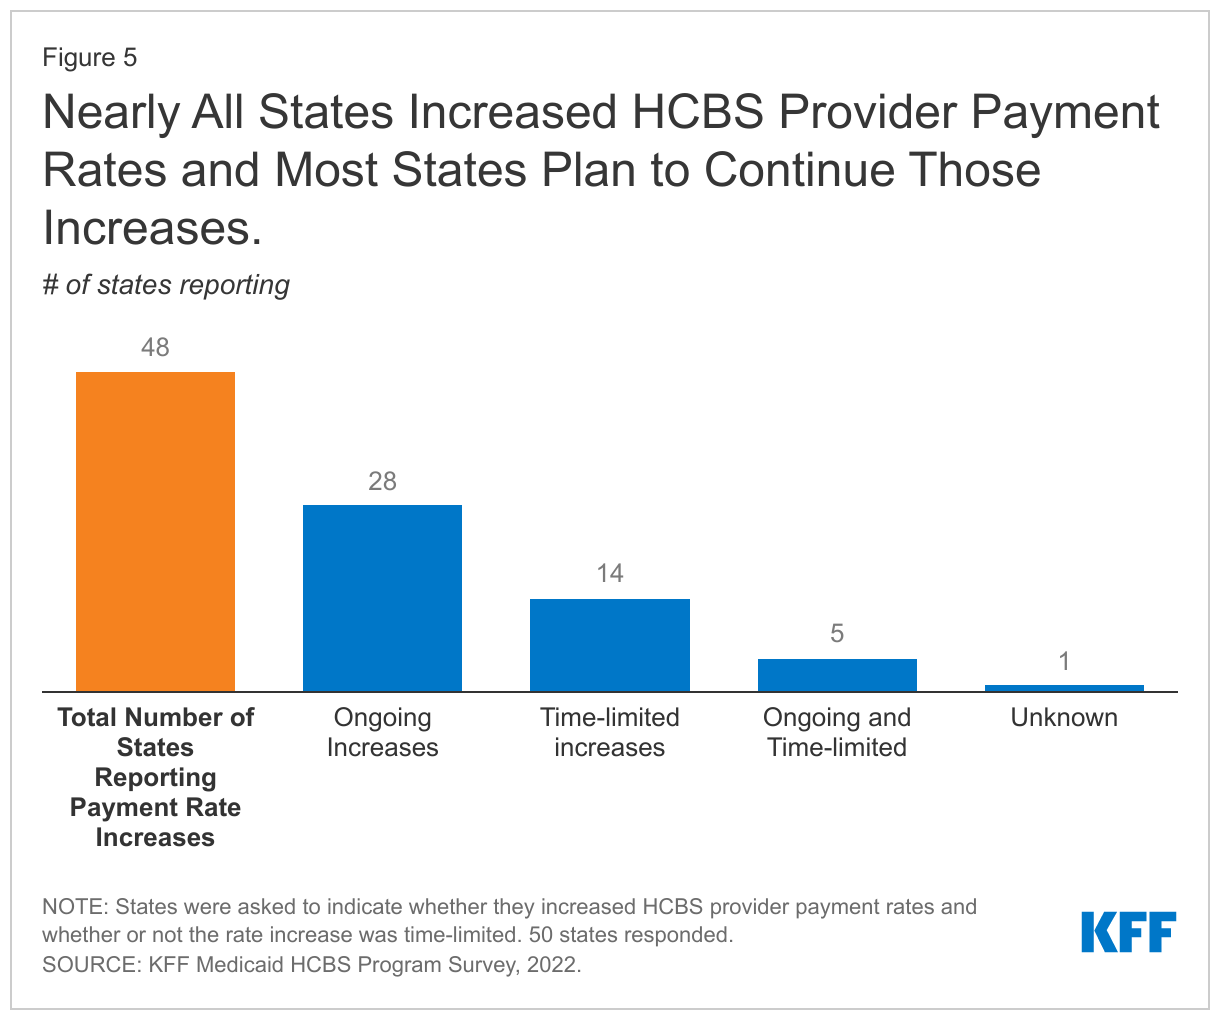
Potential Effects of the Proposed Medicaid Eligibility Rule for Newly Enrolled Medicare-Medicaid Enrollees

Published: Nov 30, 2022

Editor’s Note: This brief was updated on April 3, 2023. We reduced the follow-up period in our analysis from 12 months to 11 months, which aligns with CMS’ approach for analyzing Medicare administrative data.

On August 31, 2022, the Centers for Medicare & Medicaid Services (CMS) released a proposed rule designed to make it easier for people to obtain and maintain coverage in Medicaid. Among the many changes in that rule are several major changes to the eligibility process for people with Medicare who are also eligible for help from Medicaid. CMS proposes to better integrate Medicaid applications with eligibility and enrollment data based on Medicare Part D Low-Income Subsidies (LIS) for prescription drugs. The proposed rule would also automatically enroll some people in Medicare Savings Programs where Medicaid pays their Medicare premiums and, in many cases, cost sharing, for people with limited financial resources.

In this issue brief, we estimate rates of Medicaid coverage loss among people who became Medicare-Medicaid enrollees (MMEs) during 2018 for the first time. They may have had Medicare or Medicaid in a prior year, but were newly dually-eligible for both programs. We compare outcomes for partial-benefit MMEs and full-benefit MMEs. For partial-benefit enrollees, Medicaid pays Medicare premiums and, in many cases, also pays Medicare’s deductibles and cost sharing on behalf of MMEs. Full-benefit MMEs also receive the full range of Medicaid benefits that are not covered by Medicare, such as long-term services and supports and non-emergency medical transportation. Among full-benefit MMEs, we defined loss of coverage as losing full Medicaid benefits. In 2018, there were 12.0 million MMEs in the 50 states and D.C., including 11 million in the 42 states included in this analysis. Of those 11 million, we included 1.3 million newly-enrolled MMEs in the analysis. See methods for further details on the study population and outcomes of interest.

Our analysis finds that 28% of newly-enrolled full-benefit MMEs in 2018 lost coverage within their first year of enrollment and 20% lost coverage for more than 3 months. Among newly-enrolled partial benefit MMEs, 17% lost coverage for one or more months and 11% lost coverage for more than 3 months. Such substantive rates of Medicaid coverage loss among Medicare beneficiaries are notable because many Medicare beneficiaries live on fixed incomes and are unlikely to experience increases in income or assets that would trigger losing eligibility for Medicaid. Instead, the loss of Medicaid likely reflects administrative burdens associated with verifying applicants’ eligibility and renewing their enrollment. The proposed rule aims to reduce Medicaid coverage loss by reducing those burdens.

How Does the Proposed Rule Simplify Eligibility and Enrollment Processes for Medicare-Medicaid Enrollees?

The Medicaid proposed rule addresses several factors that contribute to high rates of Medicaid coverage loss among Medicare enrollees. The proposed rule would simplify the eligibility process for MMEs. Those changes are intended to increase enrollment among Medicare beneficiaries who have never enrolled in Medicaid and to reduce the number of Medicaid enrollees who lose coverage only a few months after enrolling on account of administrative barriers. Specifically, the rule would:

  • Encourage states to use the LIS definitions of financial resources so that the financial resource documentation Medicare beneficiaries complete for LIS would also document eligibility for Medicaid,
  • Require states with definitions of financial resources that differ from LIS to accept applicants’ self-reported value of resources unless the state already has information that is inconsistent with that value, and
  • Require states to assist applicants with procuring appropriate documentation validating income and assets when it is required.

The rule also aims to reduce loss of Medicaid at the time of renewal. Those changes are intended to reduce the number of Medicaid enrollees who are still eligible but lose coverage during the renewal process on account of administrative barriers. Specifically, the rule would:

  • Require states to renew Medicaid only once per year,
  • Eliminate states’ option to require an in-person interview as part of the application process,
  • Apply other simplified enrollment and renewal requirements that already exist for children and other adults in Medicaid, and
  • Institute requirements for how states must respond when mail to an applicant or enrollee is returned.

CMS estimates that the changes affecting MMEs would result in an additional 1.5 million person-years of Medicaid enrollment, nearly $7 billion in additional Medicaid spending, and nearly $3 billion in additional Medicare spending in the year 2027. Medicaid spending would increase because Medicaid would be paying for additional months of Medicare premiums and in some cases, Medicare cost sharing and Medicaid benefits. Medicare spending is expected to increase because Medicaid coverage of cost sharing would lead MMEs to use more Medicare-covered services. Because the enrollment process would be simpler and there would be fewer renewals, the proposed rule would decrease Medicaid administrative spending. (CMS estimates that administrative spending would decrease by over $1 billion in 2027, but that includes administrative savings from provisions that would affect all Medicaid and CHIP enrollees in addition to the provisions affecting MMEs.)

What Do the Data Show?

In describing the proposed changes, CMS cited a study that showed nearly 30% of Medicare-Medicaid enrollees (MMEs) lost Medicaid for a least one month and over 20% lost coverage for more than 3 months in the year after their initial enrollment month. That study used Medicaid claims data from 2006 – 2010 and limited the analysis to full-benefit MMEs. The Medicare-Medicaid Coordination Office within CMS recently updated that analysis using Medicare administrative data from 2016 – 2018. Their new analysis found that rates of coverage loss were largely unchanged.

KFF finds that 28% of newly-enrolled full-benefit MMEs in 2018 lost at least one month of coverage within their first year of enrollment (Figure 1). The analysis also finds that 20% lost over three months of coverage. New partial-benefit MMEs in 2018 had lower loss of coverage than full-benefit MMEs, with 17% losing at least one month of coverage within their first year of enrollment and 11% losing over 3 months. Among those MMEs who lost coverage within the first year, the vast majority lost coverage for more than 3 months. People who lose Medicaid coverage for more than 3 months include some Medicare beneficiaries who lost Medicaid at the time of renewal in states that do more than one renewal period per year. There are also people losing Medicaid before the renewal period which may suggest that individuals were disenrolled due to post-enrollment eligibility verification. Post-enrollment eligibility verification may require submission of detailed financial records that enrollees have trouble locating and would be prohibited in most cases under the proposed rule.

Percentage of Newly-Enrolled Medicare-Medicaid Enrollees Who Lost Medicaid Coverage Within Their First Year

Coverage loss in the first year of enrollment was more common among newly-enrolled full-benefit MMEs under the age of 65 than among newly-enrolled full-benefit MME ages 65 and older: 33% lost coverage for one or more months in their first year of enrollment (Figure 2). In contrast, coverage loss was lower among full-benefit MMEs 65 and older: 24% lost coverage for one or more months. Coverage loss was lower among all partial-benefit MMEs of all ages – 19% of those under 65 and 16% of those ages 65 and older lost coverage for at least one month.

Percentage of Newly-Enrolled Medicare-Medicaid Enrollees Who Lost Medicaid Coverage Within Their First Year, by Age Group

Among the 28% of newly enrolled full-benefit MMEs who lost Medicaid, 74% lost all Medicaid coverage for at least one month during their 11-month follow-up period, including coverage of Medicare premiums and cost-sharing, and other Medicaid benefits (Figure 3). Those Medicare beneficiaries would have had to start paying Medicare premiums and if applicable, cost-sharing. The remaining 26% lost eligibility for full Medicaid but retained Medicaid coverage of Medicare premiums and cost sharing (if applicable). All MMEs who lose coverage no longer have coverage of Medicaid benefits, which include long-term supports and services and nonemergency medical transportation among other services and may be particularly important for people who are elderly or with disabilities. In some states, Medicaid benefits include dental, vision, and hearing – services which are important to Medicare beneficiaries but not covered by Medicare.

Type of Coverage Loss Among Newly Enrolled Full-Benefit MMEs Who Lost Medicaid Coverage

Looking Ahead

Our analysis shows that just under one-third of MMEs lose Medicaid in their first year of enrollment, which is unexpected given most MMEs are living on fixed incomes and unlikely to experience changes in eligibility. These findings highlight the challenges people face when trying to access Medicaid and how the new proposed rule could help people more easily navigate the application and eligibility renewal processes. They also build on the findings of older research that CMS cited as a basis for the proposed changes. This analysis does not explore how many people losing coverage re-enroll in Medicaid, whether rates of Medicaid coverage loss differ for MMEs who are not new to the program, and how the proposed rule would impact Medicare beneficiaries who are eligible for Medicaid but not enrolled. Understanding those issues will be helpful to better understand the potential effects of the proposed rule.

Methods

Data: We used monthly enrollment and eligibility information from the 2017-2019 T-MSIS Research Identifiable Demographic-Eligibility Files and linked records across years using the Chronic Condition Warehouse beneficiary ID.

Identifying Newly Enrolled Full-Benefit and Partial Benefit MMEs: We identified MMEs using the monthly dual eligibility code but used the monthly restricted benefits code to determine which MMEs were eligible for full benefits (codes 1,A,D,4,5,7) or were only eligible for partial benefits (2,3,C,6,E,F). The dual eligibility code indicates full and partial benefit status for some types of MMEs, but for other types (such as Qualified Individuals) it does not. Using the restricted benefits code allowed us to identify some enrollees who would be categorized as partial-benefit using the dual eligibility code but are likely to have had full Medicaid benefits. We defined newly enrolled full-benefit MMEs as people who were full-benefit MMEs for at least one month in 2018 and were not full MMEs for the 12-month period prior. We defined newly enrolled partial-benefit MMEs as people who were partial-benefit MMEs for at least one month during 2018 and were not MMEs for the 12-month period prior.

Enrollee and State Exclusion Criteria: We excluded states whose rates of coverage loss for newly enrolled MMEs with full benefits were greater than 25 percentage points different than CMS’ recent findings. We eliminated six states based on these criteria (DE, KY, ME, MI, NE, and RI). We also excluded one state that reported no MME enrollment in 2017-2018 (AR) and two states that reported only partial MME enrollment in 2017-2018 (MS, ID).

Defining Coverage Loss: We estimated enrollment outcomes for 11 months after the original enrollment month, for a total of 12 months follow-up. In each month, we assigned MME’s benefit status as “full,” “partial,” or “none” and then summed the number of months by benefit status. For partial-benefit MMEs, greater than zero months of no benefits indicated coverage loss. For full-benefit MMEs, greater than zero months of no benefits or partial benefits indicated coverage loss. We also split coverage loss among full-benefit MMEs into coverage loss with no Medicaid and coverage loss with partial benefits, using the number of months of partial and no coverage variable.

Sensitivity Analyses: We found broadly similar results when we used the dual eligibility code instead of the monthly restricted benefits code to determine Medicaid eligibility and when we excluded MMEs who were eligible for Medicaid on a medically-needy basis (eligibility is determined monthly for those enrollees).

This work was supported in part by Arnold Ventures. KFF maintains full editorial control over all of its policy analysis, polling, and journalism activities.

The COVAX Humanitarian Buffer for COVID-19 Vaccines: Review and Assessment of Policy Implications

Published: Nov 30, 2022

Overview

Persons living in conflict settings, areas of state failure, and those affected by humanitarian emergencies are some of the most vulnerable in the world. Not easily reached with existing governmental and institutional efforts, they are at particular risk when it comes to accessing health interventions, especially during a health emergency like COVID-19. Recognizing this issue early on in the COVID-19 pandemic, a “Humanitarian Buffer” vaccine delivery mechanism was created as part of COVAX, the international partnership launched to help distribute COVID-19 vaccines globally. COVAX and the Buffer have been able to develop and introduce new structures and innovations for serving those in humanitarian settings and as such offer lessons for the future. At the same time, the Buffer has faced numerous structural, legal, and operational challenges, including some faced by COVAX more broadly as well as others specific to setting up an international vehicle for delivering novel vaccines to those in humanitarian settings. As a result, the Buffer has only been able to deliver a relatively limited number of vaccines to these populations.

With much of the world now shifting from an acute pandemic response to supporting longer-term resilience and looking to draw lessons from the past two years, it is an opportune time to review and assess the effort to support global vaccine equity. Still, little independent assessment and policy analysis has been directed so far toward examining humanitarian vaccine access during COVID-19 and the Buffer experience, and thus far, this issue has not featured prominently in global discussions on reforming pandemic response. This runs the risk of leaving those facing humanitarian crises further behind and could pose even more serious challenges if a future pandemic is more virulent. To help shine a light on this issue and inform ongoing policy discussions, this brief summarizes the experience of the COVAX Humanitarian Buffer, reviewing its history, its operational approach, its progress to date, and the challenges it has faced.

Introduction

Those living in conflict settings, areas of state failure, and affected by humanitarian emergencies are some of the most vulnerable people in the world. They are often not easily reached with existing governmental and institutional efforts and therefore at particular risk when it comes to accessing health interventions, especially during a health emergency like COVID-19. At the start of the COVID-19 pandemic, it was estimated that as many as 167 million people worldwide were living in such conditions, raising concerns about their ability to access COVID-19 vaccines once they became available. With this in mind, as the World Health Organization (WHO), Gavi, the Vaccine Alliance (Gavi), donors, governments, and other partners developed COVAX (the international facility to support global COVID-19 vaccine access), they included a mechanism designed to provide humanitarian access to vaccines. This mechanism, which was formally created in December 2020 and which began operations in May 2021, is known as the COVAX Humanitarian Buffer (the “Buffer”).

Despite what appeared to be a significant need worldwide and support from variety of key public health and humanitarian actors at its launch, however, the impact of the Buffer has been quite limited so far. While an idea early on, the Buffer itself did not begin operating until almost a year after COVAX was formed. Since its launch in May 2021 COVAX has received a total of nine applications for Buffer doses and approved six. Just two of these – 1.6 million doses provided to Iran for vaccination of Afghan refugees and 840,000 doses provided to the Uganda government with support from UNICEF for vaccination of refugees in Uganda – were finalized and doses distributed for use in country. Moreover, even though indemnity waivers were eventually secured for seven vaccine products, no mRNA vaccines – some of the most popular vaccines globally – have been available via the Buffer in part because their manufacturers have not agreed to such waivers as well as initial concerns about the feasibility of maintaining the necessary cold chain requirements in humanitarian settings. The Buffer effort faced a host of other challenges as well, from a limited global supply of vaccines to having to navigate geographic areas with little to no government presence and cross-border and disputed territorial sovereignty concerns.

With much of the world now shifting from an acute pandemic response to supporting longer-term resilience and looking to draw lessons from the past two years, it is an opportune time to review and assess the effort to support global vaccine equity. The process has begun already, with a number of efforts already published and surely more to come. For its part, COVAX has begun examining lessons from the last two years to determine how vaccine access may be promoted in future epidemics and pandemics, and Gavi released a preliminary report summarizing the lessons learned in spearheading the Buffer. Still, little independent assessment and policy analysis has been directed so far toward examining humanitarian vaccine access during COVID-19 and the Buffer experience, and (at least so far) this issue has not featured prominently in global discussions on reforming pandemic response.

To help shine a light on this issue and inform ongoing policy discussions, this brief draws on published literature, news articles, key informant interviews and other sources to summarize the experience of the COVAX Humanitarian Buffer, reviewing its history, its operational approach, its progress to date, and the challenges it has faced.

Background and Overview

Concept

The Buffer was designed to be a safety net of last resort, intended to fill in gaps where standard national COVID-19 vaccine procurement and distribution processes could not or would not reach vulnerable populations that were facing humanitarian emergencies. While governments would be responsible for vaccinating most people within their territories, there were going to be some populations that government vaccination programs would not or could not reach, including refugees, persons living in conflict zones, and those facing disasters or other emergencies. Through the Buffer, COVAX would designate and set aside a portion of its COVID-19 vaccine doses to help reach these populations. Governments, humanitarian agencies, non-governmental organizations, and others would be able to apply for these designated Buffer doses, after identifying that there were high-priority populations without access via other means. Applications would be reviewed and, if they met certain criteria, would be approved and a shipment of doses from the Buffer’s earmarked supply would be provided to the applicants (whether a government, agency, or non-governmental organization) who would oversee administration of the vaccines in the identified population in need.

Timeline

The COVAX facility overall began to take shape over the early months of 2020, soon after the COVID-19 pandemic emerged. Even early on during discussions about creating COVAX, there was an idea that a specific mechanism to direct vaccines for humanitarian purposes would be important. COVAX itself launched in June 2020, and conversations about the Buffer proceeded throughout the summer and fall of 2020, and more detail about how the mechanism would work began to take shape. In December 2020, the Gavi Board officially approved the Humanitarian Buffer, and subsequently more details about its operations were discussed throughout early 2021. In May 2021, applications to the Buffer were opened, and the Buffer has been in continuous operation since then, revising and updating its practices and procedures over time.

The Buffer concept evolved as pandemic and policy conditions themselves changed. For example, upon its initial approval by the Gavi Board, the COVAX Buffer was to include two components: 1) a Contingency Provision to set aside and direct doses for outbreak response in low- and middle-income countries with limited vaccine access but significant public health needs and, 2) a Humanitarian Buffer to set aside and direct doses to vulnerable populations in emergencies, conflicts, and other humanitarian situations. However, the Contingency Provision was repeatedly put on hold and actually never implemented as it became clearer over time that the epidemiology of COVID-19, the characteristics of the vaccines, and the magnitude of vaccine inequity argued against reserving a pool of COVAX vaccines for outbreak response purposes. The argument in favor of a Buffer component, in contrast, grew stronger over time as it became clearer that governments often overlooked the issue of vaccine access for vulnerable populations facing humanitarian emergencies in their COVID-19 response plans.

For more information about key milestones in the development, launch, and operation of the Buffer, see Box 1.

Box 1: COVAX Humanitarian Buffer – A Timeline

  • Pre-2020: Gavi, the Vaccine Alliance (Gavi) Fragility, Emergencies, and Displaced Persons Policy developed and adopted, first in 2012; revised and updated several times since, most recently in June 2022.
  • Jan 2020:  World Health Organization (WHO) declares COVID-19 a Public Health Emergency of International Concern (PHEIC).
  • Apr 2020: The COVAX facility, the vaccine arm of the international Access to COVID Tools Accelerator (ACT-A), is announced. WHO, Gavi, and the Coalition for Epidemic Preparedness Innovations (CEPI) are named as its three lead organizations.
  • June 2020: COVAX formally established with the launch of the COVAX Advance Market Commitment (COVAX AMC).
  • Summer 2020: Discussions on COVAX design and operations include an “intent to explore creating a flexible buffer of doses housed in the facility,” including for humanitarian purposes
  • Sep 2020:  WHO Strategic Advisory Group of Experts on Immunization (SAGE) Framework for Fair and Equitable Allocation of COVID Tools includes recommendation for countries to prioritize high-risk populations for vaccination including refugees and those facing humanitarian emergencies.
  • Sep 2020: Gavi Board meeting paper on COVAX describes the buffer idea, conceived of as having two components: 1) a Contingency Provision to enable an emergency release of doses for public health needs and outbreak response, and 2) a Humanitarian Buffer to ensure vaccine access for high-risk populations in humanitarian settings not covered in national vaccine deployment plans.
  • Dec 2020: Gavi Board approves initial Buffer principles and operational details, including reserving 5% of COVAX AMC funding. Board identifies potential policy issues for Buffer, including: indemnification and liability concerns, lack of funding to support delivery/administration, and oversight and accountability needs.
  • Dec 2020: First COVID-19 vaccine authorized for emergency use by WHO (Pfizer).
  • Feb 2021: United Nations (UN) Security Council passes Resolution 2565 on “equitable and affordable access to COVID-19 vaccines in conflict areas” calling for cooperation to provide vaccines for populations in humanitarian emergencies and for countries to include and prioritize vulnerable populations in national vaccination plans.
  • Feb 2021: Gavi establishes a No Fault Compensation (NFC) program for COVID-19 vaccines, which provides a “process to receive compensation for rare but serious adverse events associated with COVAX-distributed vaccines” for the COVAX AMC countries, including doses supplied by the Buffer.
  • Mar 2021: Gavi Board approves more operational aspects of the Humanitarian Buffer while postponing implementation of the Contingency Provision. A “Decision Group” comprised of members of the UN Inter-Agency Standing Committee (IASC) is created to review and approve Buffer applications and make allocation decisions. Gavi Board agrees to make 5% of the $150 million set already aside to support COVAX delivery available to support Buffer delivery costs.
  • May 2021: Applications for Buffer doses open.
  • June 2021: External group of experts raises concerns about barriers to Buffer implementation, especially the lack of indemnification and liability waivers from pharmaceutical companies for doses to be delivered by humanitarian agencies and non-governmental organizations (as opposed to those delivered by governments). Gavi continues discussions with vaccine manufacturers to reach agreement on these issues.
  • Aug 2021: WHO Releases Interim Guidance on COVID-19 immunization in refugees and migrants.
  • Nov 2021: U.S. government announces it helped broker a deal to provide U.S.-owned doses of the J&J COVID-19 vaccine for distribution via the Buffer to refugees on the Thailand/Myanmar border and reached agreement with J&J about waiving indemnification requirements.
  • Nov 2021: First shipment of vaccines delivered via the Buffer: 1.6 million doses provided to Iran for vaccination of Afghan refugees.
  • Feb 2022: Request for Buffer doses for Thailand/Myanmar border refugee vaccination is canceled after Thai government agrees to perform vaccinations there.
  • Mar 2022: Second shipment via the Buffer: 840,000 doses delivered to Uganda for vaccination of refugees by the Ugandan government, UNICEF and other partners.
  • April 2022: COVAX introduces a new, simpler process for Buffer applications.
  • Jun 2022: Gavi secretariat releases discussion paper: “Taking stock of humanitarian access to pandemic vaccines”.

Governance and Administration

Broadly, governance of the Buffer mirrors the governance of COVAX. Gavi is the organization with primary responsibility for developing policy and administering the Buffer, with Gavi Secretariat staff providing much of the day-to-day operational oversight and the Gavi Board reviewing and approving Buffer policies. Even so, given the cross- sectoral nature of Buffer operations – which overlap with global humanitarian efforts, multiple UN agencies, national governments, and other entities – there have been many other organizations involved in the design, operationalization, and oversight of the Buffer. These include WHO, UNICEF, the UN-based humanitarian agencies such as the Office for the Coordination of Humanitarian Affairs (OCHA), the UN High Committee United Nations High Commissioner for Refugees (UNHCR), the International Organization for Migration (IOM), and the International Committee of the Red Cross (IASC). Also involved have been governments, private donors, non-governmental organizations such as ICRC, Medicines sans Frontières (MSF), and independent outside experts. Many of these organizations have also been involved in review and approval of Buffer applications (see below for more information).

Doses and Funding

As initially outlined by the Gavi Secretariat and approved by the Gavi Board, 5% of COVAX Advance Market Commitment (AMC) funding (drawn from donor contributions to support vaccine access for 92 low- and middle-income country participants of the COVAX facility) was to be reserved for purchase of vaccine doses for use via the Buffer. With COVAX initially expecting to be able to procure up to 2 billion doses in 2021 alone, this could have translated into 100 million doses earmarked for Buffer use. However, global supply constraints driven by a number of factors (e.g., hoarding of vaccine supplies by higher income countries, India’s months-long ban on vaccine exports, longer than expected timelines for regulatory approval for some vaccines) meant COVAX was able to procure far fewer doses in 2021 than initially hoped. This restricted supply environment translated into similarly restricted supply for the Buffer, especially in the first few months after the Buffer was launched.

In addition to fewer doses than expected, funding for administration of Buffer doses was also limited. As COVAX rolled out, it was initially unable to fund the bulk of administration costs for COVAX participants, costs which instead fall on governments or other entities receiving COVAX doses. “Exceptional delivery support” financing totaling $150 million was made available for COVAX-wide use in early 2021, but it was estimated that $983 million more was needed to support delivery operations in COVAX AMC countries in 2021 alone. The Gavi Board decided to reserve 5% of the $150 million – or $7.5 million – for delivery support funding for Buffer applicants specifically. Additional funding for administration of Buffer doses was made available through donations to UNICEF’s Humanitarian Appeal for Children (HAC), but there remained a significant gap in the estimated need and the actual level of funding available for in-country operations via the Buffer through early 2022.

Eligibility, Application, Approval, and Shipment PROCESS

The processes for eligibility, application, and approval for Buffer doses were developed by Gavi, with significant input from other partners, including the WHO and other UN agencies, and external experts. All COVAX facility participant country governments are considered eligible to apply for Buffer doses, including the 92 COVAX AMC countries as well as “self-financing” countries, although non-participating governments are not eligible. In addition to national governments, humanitarian agencies are also eligible to apply for Buffer doses. This includes UN humanitarian agencies, ICRC, national Red Cross and Red Crescent societies, as well as non-governmental/civil society-based humanitarian organizations. In their submission, applicants are required to demonstrate why the target populations for which they are applying for doses were not included in national vaccination plans and what other attempts have been made to provide vaccines for them, as a reflection that the application represented a “last resort” need. They are also required to indicate whether they are able to import COVID-19 vaccines to the country or territory of concern or, alternatively, if they are working with a consignee who is able to do so.

Decision-making on Buffer applications rests primarily with an IASC Emergency Directors Group (EDG), which is comprised principally of experts from UN humanitarian agencies. Delegating the review and approval process to this group is designed to “ensure that humanitarian experts are involved in decision-making…and judgements on the feasibility of delivery to populations of concern are made by those with experience.” An IASC EDG expert “decision group” reviews applications to assess merit, and (with input and support from Gavi Secretariat staff) makes decisions about dose allocations taking into consideration such factors as the number and type of Buffer doses available, the preference of the applicant, and specific circumstances in country. This decision group is comprised of members from the following agencies and organizations: WHO, UNICEF, OCHA, IOM, UNHCR, ICRC, the International Federation of Red Cross and Red Crescent Societies (IFRC), MSF and ICVA (the International Council of Voluntary Agencies, a global network of non-governmental humanitarian organizations). The process from receipt of a complete application to allocation decision is meant to take no longer than a few weeks.

The actual shipment of Buffer doses (along with supplies such as syringes) to a destination country or territory requires a few more steps and takes additional time. These steps include reviewing and signing legal agreements between relevant parties (such as Gavi, the UNICEF Supply Division, and in some cases the vaccine manufacturer), ensuring regulatory approval of the vaccine is in place, obtaining import authorization from the relevant government, checking cold-chain preparedness, submitting a purchase order, and packing, labelling and, finally, shipment. Where vaccines are deployed “in territories subject to relevant bilateral or UN sanctions, additional time will be needed to obtain the necessary licenses and undertake preparedness checks” and the “global supply of injection devices and shipping containers may also impact final shipment timelines.” Much of this Buffer review and approval process mirrors that used for any doses coming from COVAX in general, though in the case of Buffer doses there may be even additional complications and challenges given that multiple actors beyond governments could be involved, and there may be even greater logistical challenges due to restricted access to some populations and geographic areas due to instability, conflict, and/or emergency situations.

Vaccine Products, Liability, and Indemnification

The Buffer, and COVAX overall, have had to find ways address liability risk inherent in the use of newly developed vaccine products, just as national governments have. These risks exist to manufacturers, those executing orders and shipments (like COVAX) and the entities administering the product, because each can be exposed to legal action from persons claiming injury/adverse events from vaccination. In general, there are several approaches to addressing liability risk, including: liability insurance (such as insurance policies that cover financial costs borne from legal action), indemnification (such as when a government or other procuring entity grants a manufacturer protection against legal action within procurement contracts), and vaccine injury compensation schemes (such as government-provided financial compensation for individuals found to have been injured by a vaccine). However, the rapid development and deployment timeline for COVID-19 vaccines meant that, at least initially, they were administered under emergency use authorizations rather than full regulatory approval, so traditional vaccine liability insurance was not available and manufacturers were unwilling to shoulder the insurance risk themselves. This led pharmaceutical companies to require that entities procuring COVID-19 vaccines indemnify them from any liability associated with use of their products. In practice, this meant that each government negotiated legal agreements with each manufacturer to cover the vaccines they sought to procure. Many governments (particularly in higher income countries) were willing and able to undergo this process and granted indemnification to gain access to vaccines. In addition, many governments had prior vaccine injury compensation schemes and adapted them for COVID-19 vaccines, or implemented new schemes for that purpose.

Lower-income country recipients of vaccines through COVAX (including through the Buffer) faced the same liability issues, but many were not in a position to address them fully or in a timely fashion. Recognizing this, Gavi and COVAX tried to overcome these legal obstacles in several ways. For one, Gavi and others developed model language and provided legal assistance to COVAX AMC countries for their contract negotiations with vaccine manufacturers, including on the topic of indemnification. Second, a vaccine injury compensation scheme for COVAX was created known as the No Fault Compensation Program (NFC), which launched in February 2021 and applied to the 92 COVAX AMC countries (the group of low- and middle-income countries that were the primary focus for COVAX vaccine distribution). While this helped to reduce liability threats, some risk did remain for COVAX recipients because civil legal claims could be filed that the NFC program could not address.

For Buffer doses specifically, liability issues proved even more complex and difficult. For example, NFC program protections applied only to the 92 COVAX AMC countries and given that an estimated one-third of people facing humanitarian conditions were residing in non-COVAX AMC countries, a significant portion of the potential target population for the Buffer would not have this protection in place. Further, given that the presence and authority of governments in many of the areas facing humanitarian conditions is weak, contested, or non-existent, there may be an absence of relevant governmental authorities willing and able to shoulder the liability burden or negotiate contracts with manufacturers for doses provided to persons in humanitarian emergencies. In theory, non-governmental organizations or humanitarian agencies could assume these roles in procuring and administering Buffer doses, but in practice such organizations have said they are not in a position to take on the associated legal burdens and liability risks. Gavi recognized this would be an issue as the Buffer was being designed and sought to address it by asking vaccine manufacturers to waive their indemnification requirements for vaccines used via the Buffer for humanitarian purposes. However, talks between Gavi and manufacturers were slow, and there were concerns that the waivers would not offer complete protection from liability. So, at the time the Buffer mechanism was formally launched in May 2021 no manufacturer had granted such a blanket waiver, though a number of companies did so months later (see more below).

Status of Applications, Shipments, and Waiver Agreements

From the time applications opened in May 2021 through October 2022, nine formal applications for Buffer doses had been received by COVAX. Six applications had been approved after review, one withdrawn before review, and two rejected after review. Of the six approved applications, one was put on indefinite hold, three eventually withdrawn, and two deliveries completed. The first, 1.6 million doses sent to Iran to support vaccination of Afghan refugees, was completed in November 2021. The second, 840,000 doses sent to Uganda to support vaccination of refugees in several regions of the country, was completed in March 2022.

While no blanket waivers had been granted by vaccine manufacturers at the launch of the Buffer in May 2021, by the end of that year, four companies had announced such waivers: Johnson & Johnson (J&J), Sinovac, Sinopharm, and Clover (Clover’s COVID-19 vaccine is not yet authorized and therefore has not been available for Buffer use). By September 2022, another two manufacturers had granted blanket waivers for the Buffer, covering three COVID-19 vaccines: Serum Institutes’ Covishield & Covovax, and Novavax. Neither Pfizer nor Moderna, which produce some of the most popular vaccines worldwide, have granted a blanket waiver for use of their mRNA vaccines via the Buffer.

Key Issues and Challenges

Despite high expectations upon launch and early estimates of a large potential humanitarian need for COVID-19 vaccines, the number of applications actually submitted and approved was relatively small, with only about 2.5 million doses having been shipped to two countries. This compares to the potential to have provided up to 70 million doses (5% of the 1.4 billion doses procured by COVAX in 2021) via the Buffer.

Many barriers and challenges contributed to this relatively limited impact to date. Some of these were specific to the Buffer itself, while others were reflective of broader challenges faced by COVAX and, indeed, by the overall global response to the pandemic. Based on the existing literature (including Gavi’s own assessment of the Buffer and an external evaluation of the Access to COVID Tools Accelerator (ACT-A) of which COVAX is the vaccine arm) and information from interviews with subject matter experts, key barriers and challenges included the following:

  • Limited vaccine availability. Throughout 2021, the global supply of COVID-19 vaccines fell far short of global demand. Much of the early supply of vaccines with WHO emergency use authorization (the only vaccines available for use by COVAX and the Buffer) had been monopolized through advance purchases by governments, particularly those in high income countries. This left COVAX with limited and delayed access to COVID-19 vaccine doses, which translated into limited supply for the Buffer as it launched and throughout the rest of 2021 and into 2022.
  • Limited funding. In parallel with a restricted supply of vaccines was a limited amount of funding for COVAX overall, and for the Buffer specifically. The lack of available funding early on was a major reason why COVAX could not complete purchase agreements with pharmaceutical manufacturers in a timely fashion, which led to delayed access. It also restricted the amount of operational and delivery support that COVAX and/or the Buffer could offer, even with significant need for this type of assistance in many areas with populations facing humanitarian emergencies. Some humanitarian organizations report the lack of operational support presented a barrier for potential applicants, which may have reduced demand for Buffer doses and/or the narrowed the scope of applications submitted.
  • Lack of priority placed on vaccinating populations facing humanitarian emergencies. The target populations for the Buffer were often not prioritized (and sometimes ignored) by governments when drawing up national COVID-19 vaccination plans. Despite WHO, humanitarian agencies, and others emphasizing the need for governments to include high-risk migrants, refugees, and other people facing humanitarian emergencies in such plans as the Buffer was launched, a majority of the national vaccination plans submitted to COVAX in early 2021 did not explicitly include these populations among priority vaccination groups. The relative lack of inclusion or priority by many governments contributed to a belated focus on vaccinating these groups in some cases, translating into lower initial demand for Buffer doses.
  • Added complexity from pandemic conditions. Delivering and administering vaccines requires a functioning transportation/logistics capability, cold and supply chains, a sufficient number of prepared personnel, adequate safety and security, among other conditions. Ensuring all of these pieces were in place during a pandemic was challenging enough, but ensuring they were in place in areas facing humanitarian emergencies was even more difficult, and it added another layer of complexity to delivering and administering Buffer doses where they were most needed.
  • Extended delays and restricted choice of vaccines due to liability and indemnification issues that were only partially solved. Vaccine manufacturers’ requirement they be indemnified against liability for potential damages from their products proved to be one of the most critical sticking points for implementation of the Buffer. While legal assistance for countries negotiating contracts and a global NFC program helped reduce liability risk in COVAX AMC countries, these did not eliminate the issue, particularly for Buffer doses outside of these countries. Shouldering the risk of liability was a non-starter for the humanitarian agencies and non-governmental groups that were positioned to be a core set of partners in administering the vaccines in the populations being targeted by the Buffer. A blanket liability waiver was viewed as the best option to address this issue for the Buffer, but the extended negotiations with pharmaceutical companies and their initial reluctance to sign on to the waivers led to major delays. Moreover, only a subset of manufacturers eventually agreed to such blanket waivers, and agreements were reached piecemeal over a period of months, which limited which vaccines available for Buffer use at any given time. In addition, there were concerns that the waivers that were granted were insufficient and left partners open to some residual risk.
  • No access to effective and popular mRNA-based vaccines. Moreover, Pfizer and Moderna have not provided a blanket liability waiver for use of their COVID-19 vaccine products via the Buffer, unlike a number of other vaccine manufacturers. So there has been no option for Buffer applicants to request these vaccines, despite their proven effectiveness and global popularity. While mRNA vaccines have presented additional challenges compared to other vaccines due to logistical and ultra cold chain requirements, the inability to request these specific vaccines represented a limitation of the Buffer.
  • Weak or absent regulatory and/or government oversight in many areas. An overarching structural challenge facing the Buffer was a lack of regulatory and other decision-making authority in many areas facing humanitarian emergencies. COVID-19 vaccine authorization, approval, procurement, and distribution processes have primarily relied on governments that are willing and able to take on these tasks. However, many humanitarian situations occur in areas with weak or no government presence. For example, there may be cross-border issues, disputed territorial sovereignty concerns, and large numbers of refugees and/or people in conflict situations that result in a decision-making vacuum. If there is no entity in a position to take on an important role such as overseeing the import of vaccines for such areas, the system breaks down. Given the limited authority of international humanitarian agencies and non-governmental organizations to take on many of these very same responsibilities, people in these areas can be left behind. The Buffer mechanism was not able or intended to solve these structural, political, and governance issues.
  • Complex application, review and approval process. As an entirely new mechanism launched in the context of the ongoing evolution of COVAX itself and the changing supply and epidemiological circumstances of the pandemic, there was a balance struck between a speedy approval and delivery process for Buffer doses and the due diligence required to ensure those doses were being used according to the principles of the Buffer – in an effective and efficient manner, and in keeping with the rules, legal obligations, and other constraints of the various stakeholders. The cross-agency and multi-sectoral nature of providing COVID-19 vaccines for use in humanitarian contexts meant that Buffer applications had multiple stages of review and points at which approvals had to be obtained (even more so than regular COVAX channels), and each stage and review added further complexity and time to a process that already had a steep learning curve for all involved. At a minimum, Gavi, COVAX, WHO, other UN agencies, national governments, and (often) non-governmental organizations had to be involved. Some external groups have criticized the process as being drawn out, bureaucratic, and a significant challenge to navigate to completion.
  • Shifting pandemic risk perceptions and waning demand over time. While the global COVID-19 vaccine context of very limited supply and very high demand was present through much of 2021, it changed as the pandemic entered its third year in early 2022. Supply finally began to catch up with and overtake demand as production grew, additional vaccines were authorized, and perceptions about the risk from the pandemic shifted for many. Given the time that elapsed from Buffer concept to operationalization, and post-launch delays generated by the many complications discussed above, demand for Buffer doses (and COVID-19 vaccines overall) eventually dropped off.

Implications for the Future

With much of the world now shifting from an acute pandemic response to supporting longer-term resilience and looking to draw lessons from the past two years, it is an opportune time to review and assess the effort to support global vaccine equity. COVAX and ACT-A, for example, have entered into a transition process that aims to integrate these tools and partnerships into routine country and global immunization and health systems efforts and ensuring systems are better prepared for future health emergencies. A new Pandemic Fund, supported by donors such as the U.S., has been launched at the World Bank and is meant to stimulate investments in global, regional, and country-level pandemic preparedness capacities. In addition, member states of the WHO are in the process of negotiating changes to the global governance framework for pandemics, including making revisions to the International Health Regulations and potentially crafting a new and more expansive pandemic treaty instrument. So far, however, little attention has been directed in these processes to how best to ensure humanitarian access to pandemic vaccines going forward, or in taking a systematic approach to building on the Buffer experience to improve future pandemic response efforts. This runs the risk of leaving those facing humanitarian crises further behind and could pose even more serious challenges if a future pandemic is more virulent. Among the areas that could be examined in this regard include:

  • Ensuring ongoing visibility for the issue of humanitarian access to pandemic vaccines in the context of discussions around new global health security and pandemic preparedness and response mechanisms, including those related to the Pandemic Fund, the pandemic treaty, IHR reforms, as well as humanitarian sector reform efforts.
  • Extending and building up cross-agency and cross-sectoral partnerships forged by the Buffer. Many of these relationships and processes were built from scratch when designing and implementing the Buffer, so institutionalizing them to the extent possible could mean not having to reinvent the wheel during the next pandemic.
  • Addressing in advance liability and indemnification issues for pandemic vaccines administered under emergency authorizations for humanitarian needs. Global sharing of newly developed pandemic vaccines will likely always raise issues of liability. Policy tools put in place by COVAX during COVID-19, such as the NFC program and legal assistance for governments in designing indemnification agreements provide partial solutions but do not fully address the added complications of delivering pandemic vaccines for humanitarian populations, which could require a specially tailored approach. Requesting manufacturers grant blanket waivers during a pandemic was one approach used by the Buffer, but given the extended time needed to reach the agreements for COVID-19 vaccines, it could help to pre-position or vet these kinds of agreements and negotiations in advance as much as possible, for example via an insurance or contingency fund set up for this purpose. Robust discussions about how risks can be shared more effectively and in a more timely fashion, especially related to last-mile implementers of vaccination programs in these populations, will be helpful in advance of another emergency.
  • Assuring that adequate funding is available in advance of a health emergency that allows international agencies to purchase countermeasures and help defray operational costs of delivering and administering vaccines during a pandemic, rather than having to request such funding from donors during a crisis response. For humanitarian contexts, this could include assured delivery and operational support for non-governmental organizations that might have the best or only access to key target populations in need.

This work was supported in part by The Hilton Foundation. KFF maintains full editorial control over all of its policy analysis, polling, and journalism activities.

News Release

More Than Half a Million People in the U.S. Are On Waiting Lists for Medicaid Home- and Community-Based Services, But Waiting Lists Can Both Overstate and Understate Unmet Need

Other Findings From Our 50-State Survey of Medicaid HCBS Programs Focus on How States Are Responding to Chronic Workforce Shortages That Were Exacerbated by the Pandemic

Published: Nov 28, 2022

About 656,000 people across the country were on state waiting lists for home and community-based services financed through Medicaid waivers in 2021, finds a new KFF analysis. But such waiting lists are an incomplete and often inaccurate measure that can both overstate and understate unmet need.

The data about waiting lists are among the latest findings from the 20th KFF survey of state officials administering Medicaid HCBS programs in all 50 states and Washington DC.

Waiting lists can sometimes overstate the need for services because not all states screen for Medicaid eligibility before adding people to their lists, which inflates the numbers with people who may never be eligible for services. In all years since 2016, over half of people on HCBS waiting lists lived in states that did not screen people on waiting lists for eligibility, the new analysis found. This also is a key reason that waiting lists are not comparable across states.

Waiting lists can also understate need. They reflect the populations a state chooses to serve, as well as the resources it commits. In many cases, people may need additional services, but because the state doesn’t offer them—or doesn’t offer them to specific populations, such as people ages 65 and older—they would not appear on a waiting list.

HCBS waiting lists remain a source of concern to policymakers and proposals to eliminate them have been put forth by both Republicans and Democrats.

Many of the other findings from the 50-state survey focus on chronic workforce shortages that were exacerbated by the COVID-19 pandemic and are the biggest challenges facing state Medicaid HCBS programs. Key takeaways from that analysis include:

  • Amid the pandemic, HCBS workforce shortages have contributed to provider closures. Most states (44) reported a permanent closure of at least one Medicaid HCBS provider during the pandemic, up from 30 states in 2021.
  • Almost all states (48) responded to the workforce crisis by increasing HCBS provider payment rates. States also increased self-directed and family caregiving opportunities for HCBS beneficiaries. All states offer at least one HCBS program with the option for enrollees to self-direct their services. Forty-eight states allow legally responsible relatives to be paid caregivers, up from 36 states in 2020.
  • When asked how they used temporary funding from the American Rescue Plan Act of 2021, over two-thirds of states (35) reported initiatives with high start-up costs that were generally time-limited to avoid higher ongoing costs after the enhanced federal funding ended. Some of the most common initiatives included offering providers bonuses or incentive payments to stay on, developing or expanding worker training or certification programs, and upgrading IT systems.

The full analyses of the survey findings are available here:

For more data and analyses about Medicaid HCBS, visit kff.org.

Ongoing Impacts of the Pandemic on Medicaid Home & Community-Based Services (HCBS) Programs: Findings from a 50-State Survey

Authors: Molly O’Malley Watts, Alice Burns, and Meghana Ammula
Published: Nov 28, 2022

Issue Brief

Executive Summary

Widespread workforce shortages are the biggest challenges facing state Medicaid home and community-based (HCBS) programs and those shortages were greatly amplified by the COVID-19 pandemic, which reduced the number of potential workers and increased the demand for services. The American Rescue Plan Act (ARPA) and COVID-19 public health emergency (PHE) authorities gave states new—but temporary—flexibility and funding to address pandemic-related challenges, which all states used. Those initiatives enabled states to respond to the pandemic and invest in HCBS programs, helping millions of seniors and people with disabilities who rely on Medicaid HCBS to meet daily self-care and independent living needs in community-based settings.

This issue brief presents the latest findings on key state policy choices about Medicaid HCBS in 2022 based on the 20th KFF survey of state officials administering Medicaid HCBS programs in all 50 states and DC. The data were collected from April through September 2022. The survey was sent to each state official responsible for overseeing the administration of HCBS benefits (e.g., home health, personal care, and services for specific populations such as people with physical disabilities), but some states submitted responses for the state overall. All states responded to the 2022 survey, but response rates for certain questions varied. Key findings include:

All responding states indicated they were experiencing shortages of direct care workers in 2022 (see Figure). States most frequently cited workforce shortages as the pandemic’s primary impact across all HCBS settings. As the pandemic persisted, HCBS workforce shortages contributed to provider closures. Most states (44) reported a permanent closure of at least one Medicaid HCBS provider during the pandemic, up from 30 states in 2021. This trend suggests that even as the broader economy returns to normal, HCBS providers continue to struggle.

Almost all states (48) responded to the workforce crisis by increasing HCBS provider payment rates. While some of these increases may have been supported through temporary ARPA funding or emergency PHE authorities, more than half of states plan to continue rate increases even after temporary funding and authorities expire. States also increased self-directed and family caregiving opportunities for HCBS beneficiaries throughout the pandemic. All states offer at least one HCBS program with the option for enrollees to self-direct their services. Forty-eight states allow legally responsible relatives (LRRs) to be paid caregivers, up from 36 states in 2020.

All States Reported Workforce Shortages and Almost All Increased Their Payment Rates.

When asked about how they used the ARPA funding, over two-thirds of states (35) reported initiatives with high start-up costs that were generally time-limited to avoid higher ongoing costs after enhanced federal funding ended. Ten (of those 35) states reported pursuing both time-limited and ongoing HCBS initiatives using ARPA funds. Some of the most common initiatives included offering providers bonuses or incentive payments to stay on, developing or expanding worker training or certification programs, funding studies to assess provider rates or workforce development, expanding workforce registries, and upgrading IT systems.

States adopted policies to streamline enrollment processes and expand access to Medicaid HCBS during the PHE, and states reported that some policies (e.g. telehealth) will continue after the PHE ends. All states (49 of 49 reporting) allowed virtual evaluations for eligibility determinations and almost all (47 of 49 reporting) provided telehealth service delivery. Many states also provided more services to HCBS users by increasing utilization limits or offering new waiver services. Telehealth service delivery will continue in most states but increases in utilization limits are more likely to expire at the end of the PHE. Fewer states opted to use the PHE authorities to expand waiver slots or eligibility.

The COVID-19 pandemic illuminated fundamental, long-term challenges for states in providing Medicaid HCBS, but also provided opportunities for change, particularly with new authorities and funding.  While states have adopted a number of policies to bolster the HCBS workforce, it remains to be seen whether initiatives undertaken during the pandemic will yield more systemic changes longer-term. Policymakers of both parties have called for additional changes to HCBS including eliminating waiting lists for services (nearly 656,000 people were on a waiting list in 2021), increasing opportunities for family members to be paid caregivers, increasing wages for all HCBS providers, and enabling more people to live in their homes as they age. Although there is consensus on those broad policy goals, there is little consensus on how to pay for significant federal investments needed to achieve these goals, suggesting it may be some time before major reforms are enacted.

Introduction

The COVID-19 pandemic exacerbated existing challenges for state Medicaid home and community-based (HCBS) programs and the people they serve, most notably a heightened shortage of direct care workers coupled with increased demand for services. Together, the American Rescue Plan Act (ARPA) and the COVID-19 public health emergency (PHE) authorities gave states new but temporary federal funding and policy flexibility to address pandemic-related challenges. All states used these initiatives to make investments in their HCBS programs, helping millions of seniors and people with disabilities who rely on Medicaid HCBS to meet daily self-care and independent living needs in community-based settings. As states continue pandemic recovery efforts, consumer demand for HCBS remains high and longstanding challenges facing Medicaid HCBS including the aging population and provider workforce shortages will likely continue for the foreseeable future.

Medicaid paid for about two-thirds of all HCBS in 2020, and waivers are the primary authority that states use to offer HCBS benefit packages with all of the 50 states and D.C. providing at least some HCBS through either a 1915(c) or an 1115 waiver. Medicaid HCBS encompass a wide range of medical and nonmedical services that assist Medicaid beneficiaries with physical, mental, and other chronic conditions or disabilities. States are required to cover Medicaid long-term services and supports (LTSS) provided in nursing homes, while all HCBS other than home health care services are optional. HCBS may be provided through state plans but are more commonly provided through waivers. Unlike Medicaid state plan authorities, which require states to cover everyone who meets certain eligibility criteria, waivers allow states to provide services to specific populations, limit the number of people served, and expand financial eligibility. The Centers for Medicare & Medicaid Services (CMS) estimates that nearly 8 million Medicaid enrollees had at least one claim for a service that could potentially be HCBS during 2019.

This issue brief presents the latest findings from a survey of states on key state policy choices about Medicaid HCBS in 2022 and the HCBS waiver landscape as of 2021. We also asked states about policies they adopted in response to the COVID-19 pandemic through the ARPA and PHE authorities, and whether they planned to continue policies adopted through PHE authorities. The Appendix Tables contain detailed state-level data.

What is the Current Landscape of Medicaid HCBS?

When asked about the waivers they had in 2021, states reported offering 255 waivers under 1915(c) authority, which is the largest source of HCBS spending. (The four states that do not provide HCBS through 1915(c) authority all offer HCBS services through an 1115 waiver.) Section 1915(c) waivers are generally targeted to a single population, such as people with physical disabilities or people with intellectual and development disabilities (I/DD). The number of Section 1915(c) waivers averages five per state. Almost all states serve people with I/DD, seniors, and nonelderly adults with physical disabilities through 1915(c) waivers (Figure 2, Appendix Table 1). Fewer states use HCBS waivers to serve people with traumatic brain and/or spinal cord injuries (TBI/SCI), children who are medically fragile or technology dependent, people with mental health disparities, and people with HIV/AIDS. States may use other authorities such as 1115 waivers to provide HCBS, but when HCBS are provided through 1115 waivers, they may be provided to multiple—or broader—target populations and may be part of larger Medicaid reforms. Thirteen states reported offering HCBS waivers authorized under Section 1115 in 2021.

All 50 States and DC Offer HCBS Through Optional Waiver Authorities, 2021

Four states reported offering new waivers in 2021, the most recent year in which states were asked to report all of their HCBS waivers. Alabama and the District of Columbia reported new 1915(c) waivers serving populations with I/DD, while Missouri had a new 1915(c) waiver serving seniors and adults with physical disabilities. Idaho reported offering a new Section 1115 waiver serving individuals with mental illness. Additionally, Oregon submitted a new 1115 waiver request to provide in-home supports to individuals with higher income and assets and for those who do not meet nursing facility level of care criteria. Tennessee has pending waiver amendments to integrate the 1915 (c) waivers into its 1115 waiver.

New funding from the ARPA and authorities granted to states under the PHE helped states respond to the challenges posed by the pandemic. Under the PHE authority, the federal government granted states temporary authorities that were intended to maintain enrollment and service levels during extraordinary times. The current PHE is currently in effect until January 11, 2023, and the Biden administration has said it will give states a 60-day notice before ending the PHE. Since that notice was not issued in November 2022, it is expected the PHE will be extended again. At the end of the PHE, most waivers and broad flexibilities will expire, requiring states to either end the temporary practices or transition the practices to a permanent authority with CMS approval.

Enacted in March 2021, the ARPA increased the federal medical assistance percentage (FMAP) by 10 percentage points for states’ HCBS expenditures that were paid between April 1, 2021, and March 31, 2022. Receipt of the funds required states to demonstrate that the additional federal funding would not supplant any state funds for HCBS. To implement that requirement, participating states are required to submit spending plans that describe the amount of funds they received from the higher FMAP and on how they are spending those funds on HCBS. Activities funded with the additional ARPA money must be intended to enhance, expand, or strengthen HCBS such as providing retention bonuses or student loan forgiveness for HCBS workers, expanding coverage of HCBS, or funding infrastructure investments related to the delivery of HCBS. States have until March 31, 2025 to spend the extra federal funds that were provided for HCBS expenditures that were paid between April 1, 2021 and March 31, 2022. Funds spent after March 31, 2022, are reimbursed at the states’ normal FMAPs instead of at the higher FMAP.

How is the Pandemic Affecting the Workforce?

Workforce shortages have been exacerbated by the pandemic: All states that responded to this question indicated they were experiencing shortages of direct care workers in 2022.  When asked about shortages for specific types of workers, states reported shortages of all types of HCBS providers including home health aides, personal care attendants, direct support professionals, and community-based mental health providers. States most frequently cited workforce shortages as the pandemic’s primary impact across all HCBS settings including in-home services, group homes, adult day health programs, and supported employment programs (Figure 3).

Nearly All States Reported An HCBS Workforce Shortage in One or More HCBS Settings

As the pandemic persisted, HCBS workforce shortages contributed to provider closures: 44 states reported a permanent closure of at least one Medicaid HCBS provider during the pandemic (Figure 4). States reported more closures in 2022 than the year prior (30), suggesting that even as the broader economy returns to normal, HCBS providers continue to struggle. Although states did not provide explanations for why so many HCBS providers closed in 2022, it could be attributed to ongoing workforce shortages potentially coupled with provider financial difficulties stemming from pandemic-related service disruptions. Other research shows that the pandemic’s effect on employment was particularly profound for LTSS workers. Recent analysis on the Peterson-KFF Health System Tracker shows that the number of workers dropped by 14% in nursing care facilities and by 9% in community elder care facilities between February 2020 and June 2022. Many states (31) reported permanent closures affecting services provided in enrollees’ homes, adult day programs (32), and group homes (25). Fewer states reported permanent closures of other types of HBCS providers such as community mental health providers and supported employment providers, who provide job search, placement, and coaching support.

Most States Reported at Least One HCBS Provider Closure During the Pandemic in 2022.

How did States Respond to the Workforce Crisis?

When asked about their overall responses to workforce shortages, most states reported that they increased HCBS provider payment rates and most plan to continue those rate increases even after pandemic authorities and funding end (Figure 5). Among the 48 states that increased rates, over half (28) plan ongoing increases to provider payment rates. For the remaining states,14 implemented time-limited increases, 5 implemented a combination of both time-limited and ongoing increases, and 1 state reported that they didn’t know whether the rate increases would be permanent.

Nearly All States Increased HCBS Provider Payment Rates and Most States Plan to Continue Those Increases.

Half (24) of the states that increased provider payment rates required the rate increase to be passed through to worker wages. These requirements typically are being implemented through provider attestation (18 states) or another method such as a statutorily specified split between the workers and the agency or through post-payment audits and cost reporting (10 states). Few states added such a requirement to Medicaid provider agreements (4) or health plan contracts (2). The other strategies states reported using to address the workforce shortage included offering incentive payments to recruit workers (36), developing or expanding worker education programs (34 states), and establishing or raising a minimum wage requirement for workers (20 states) (Appendix Table 2).

All states participated in the ARPA HCBS program and when asked how they used the funding, most states reported making upfront investments and confronting immediate recruitment and retention challenges in the workforce (Appendix Table 3). Most states (35) chose initiatives with high start-up costs that were generally time limited so that they would not face higher ongoing costs in the future after the period of enhanced federal funding ended. For example, states used ARPA funding to provide bonuses or incentive payments (36), develop or expand worker training or certification programs (33), expand family caregiver supports (23), fund studies to assess provider rates or workforce development (21), and develop or expand workforce registries (15). It is unknown to what extent those initiatives will continue after states have exhausted the additional federal funding they received from the ARPA.

“Self-direction has increased in all programs in which it is offered.  When traditional site-based programs were closed/short-staffed due to the pandemic, this provided additional opportunities to learn about self-direction, and individuals and families were able to hire staff to continue to receive support.” State official

States increased self-directed and family caregiving opportunities for HCBS beneficiaries throughout the pandemic as one way of addressing workforce challenges (Figure 6, Appendix Table 4). All states offer self-directed opportunities for Medicaid HCBS beneficiaries. Self-direction typically allows individuals to select and dismiss their direct care workers, determine worker schedules, set worker payments rates, and/or allocate their services budgets. Over half of states (30) reported an increase in the number of enrollees self-directing Medicaid HCBS since the onset of the pandemic, while just two states (OR, TX) reported a decline.

All States Now Offer Beneficiaries the Opportunity to Self-Direct Their Care.

One of the biggest changes during the pandemic is that 48 states now allow legally responsible relatives (LRRs) to be paid caregivers (up from 36 in 2020). Legally responsible relatives may include a spouse, parent, or adult child. Covering more provider types, including LRRs, can help to increase access to services that meet daily need such as personal care and habilitation, especially when other providers are not available. About half of states (27 of 45 reporting) report an increase in the number of paid LRRs since the onset of the COVID-19 pandemic, while the remaining states saw no change (6) or reported unknown (12). Over three-quarters of states (39) reported that payment to LLRs was granted through the PHE/Medicaid emergency authority and half of those states (20) plan to make this flexibility permanent for at least one HCBS program/waiver.

A second major change is that all states now offer some types of supports for family caregivers, who may be either paid or unpaid. Most states (36) offer more than one type of support for family caregivers. Frequently reported family supports include respite care (48), caregiver training (29), and caregiver counseling/support groups (18). There were 14 states that reported other types of supports such as peer support services, family caregiver stipends, child day support, and supported family living.

Most (37) states report using HCBS provider sufficiency standards to help measure the extent to which there are sufficient providers to meet enrollee needs (Figure 7). For services that the states pay for directly, there are no consequences for failing to meet the standards, but they provide a useful tool for assessing provider availability and the sufficiency of the provider network. Alternatively, states are required to use provider sufficiency standards in their contracts with private care plans when HCBS are delivered by those plans. CMS finalized changes to those managed care regulations in 2020. The 2020 rule removes the requirement that states use time and distance standards to ensure health plans’ provider network adequacy and instead allows states to choose any quantitative standard. Alternate standards could include minimum provider to enrollee ratios, maximum travel time or distance to providers, minimum percentage of contracting providers accepting new patients, maximum wait times for an appointment, or hours of operation requirements.

About half of states (27) required at least one network adequacy standard for HCBS providers in a fee-for-service (FFS) model, while 23 states required at least one standard in a capitated (risk-based) model. The most common standards include time and distance when an enrollee must travel to a provider (22 states), maximum travel time or distance to a provider (22 states), and minimum provider to enrollee ratio (20 states). Fewer states reported hours of operation requirements, minimum percentage of providers accepting new patients and maximum wait time for an appointment.

States Are Implementing HCBS Provider Sufficiency Standards to Ensure the Number of Providers Meets Enrollees Needs.

What Other HCBS Strategies Did States Use to Respond to the Pandemic?

States have adopted numerous policies to streamline and expand access to Medicaid HCBS during the PHE, and some policies are expected to continue after the PHE ends (Figure 8, Appendix Table 5). One of the biggest changes to Medicaid HCBS policy during the pandemic was the use of virtual evaluations for determining enrollees’ eligibility for HCBS and their appropriate level of care. All states (49 of 49 reporting) adopted virtual evaluations. Of those, 10 states plan to continue this policy once the PHE ends and 9 noted the policy would only continue under certain circumstances or as needed. The remaining states were either uncertain about future plans (16) or plan to discontinue the policy (14) once the PHE ends.

Fewer states opted to use the PHE authorities to expand waiver slots or eligibility. Ten states reported increasing the number of waiver slots during the PHE, and eight states will continue after the PHE ends. Five states expanded eligibility either by expanding waiver financial eligibility limits (IL, NC, NV, OR) or functional eligibility criteria (MD).

“Limits for some HCBS were extended to better support individuals through the pandemic. Pre-pandemic limitations will be in place 6 months after the PHE ends.” – State official

Twenty-five states added new services to at least one HCBS waiver during the PHE, with home delivered meals the most frequently reported new service (9 states). Sixteen states will continue to offer these new waiver services after the PHE ends, five states were planning to end the services when the PHE ends, and the final four states were still undecided at the time of the survey. Most states provided more services to HCBS users by increasing utilization limits, but many of those changes will end when the PHE does. Thirty-seven states increased utilization limits on existing HCBS services, with less than one third (eleven) of states opting to continue the policy after the PHE ends. States reported increasing limits for home delivered meals, respite, day supports, personal care services, dental, and home modifications.Almost all states provided telehealth services to address challenges in delivering in-person HCBS during the pandemic. All but two (47 of 49 responding) states reported providing HCBS via telehealth in at least one waiver, and almost two-thirds (29) of states plan to allow at least some telehealth service delivery moving forward. States reported relying on telehealth for services such as: wellness checks, case management, supported employment, life skills training, behavioral and mental health counseling, companion, and adult day and habilitation services.

Medicaid Public Health Emergency Unwinding Policies Impacting HCBS Enrollees and Providers

Some states used ARPA funds to make changes to their HCBS programs beyond confronting workforce challenges. Although most states reported workforce-related uses of the ARPA funding, over half of states reported offering new HCBS services and adopting or upgrading information technology systems (e.g., incident reporting, case management, and electronic visit verification) with the ARPA money (30 states each). Twelve states reported adopting or expanding HCBS quality measures (Appendix Table 3).

Looking Ahead

The COVID-19 pandemic illuminated fundamental, long-term challenges for states in providing Medicaid HCBS, but also provided opportunities for change, particularly with new authorities and funding. While states have adopted many new policies to bolster the HCBS workforce, it remains to be seen whether initiatives undertaken during the pandemic will yield more systemic changes longer-term.

In the recent months, CMS has also taken steps to improve the accessibility and quality of Medicaid HCBS. In July, the agency released the first-ever set of HCBS quality measures to promote consistent evaluation of quality across state HCBS programs and over time. The list of measures is extensive and encompasses a number of difference outcomes, but reporting is currently voluntary and it’s uncertain how widely the measures will be used. In August, CMS awarded planning grants to three states and two territories, joining the 36 states that participate in the Money Follows the Person program, which is a demonstration that allows states to receive additional federal funding for HCBS delivered to people who transition from institutional to community-based settings. That month, the agency also issued a proposed rule aimed at easing the application and enrollment process for Medicaid, which included several changes intended to increase Medicaid enrollment among seniors and individuals with disabilities.

States reported that a permanent FMAP increase for HCBS would enable them to prioritize more systemic improvements over the longer-term, such as increasing the number of waiver slots or adding permanent wage increases instead of temporary increases in the form of bonuses or incentive payments. Although it’s unlikely that the ARPA FMAP increase – which would require increased federal funding – will be made permanent in the near term, policymakers of both parties have called for systemic changes to HCBS including eliminating waiting lists, increasing opportunities for family members to be paid caregivers, increasing wages for all HCBS providers, and enabling more people to live in their homes as they age. It is unclear whether the consensus on those broad policy goals will translate into new federal laws or funding.

Appendix

States’ Medicaid HCBS Waivers, by Authority, 2021

(back to top)

States’ Strategies to Address the HCBS Workforce Shortage, 2022

(back to top)

Selected ARPA HCBS Initiatives, 2022

(back to top)

States’ Self-direction and Family Caregiving Opportunities, 2022

(back to top)

State Adoption of Selected PHE Authorities, 2022

(back to top)

News Release

The U.S.-Mexico Border Region Faced a Range of Health Challenges Long Before the Current Immigration Surge

Texas’ Lagging Health Infrastructure and Lack of Medicaid Expansion Stand Out

Published: Nov 21, 2022

With intense immigration activity at the U.S.-Mexico border this year and attention focused on the plight of newly arriving migrants, a new KFF analysis finds communities along the border faced an array of socioeconomic challenges and weak health infrastructures well before this year’s surge.

Texas – which has the most counties along the border and is the only border state that has not expanded Medicaid under the Affordable Care Act – stands out as facing the greatest challenges with twice the uninsured rate among both its border county (26%) and non-border county (20%) nonelderly residents compared with California, Arizona, and New Mexico.

A major factor behind Texas’ higher uninsured rates is that 1 in 3 nonelderly adults in border counties lack health insurance. Medicaid expansion for adults could reduce the uninsured rate among the state’s nonelderly adults. However, compared with non-border counties, the border counties in the state have higher shares of noncitizens who may be ineligible for Medicaid.

Texas trails the three other border states in its supply of providers in all counties. California and Texas border counties lag other counties in the states in their supply of four types of health care providers: primary care, obstetrics and gynecology, dental, and emergency medicine.

Texas trails the three other border states in its supply of providers in all counties. California and Texas border counties lag other counties in the states in their supply of four types of health care providers: primary care, obstetrics and gynecology, dental, and emergency medicine.

Texas also stands in contrast to the three other border states in the clear differences between its border and non-border country residents in other socioeconomic indicators, pointing to more systemic issues. Texas border county residents have lower education levels, household incomes, and full-time employment rates than the state’s non-border county residents.

Arizona, California, New Mexico, and Texas have 44 counties along the border with Mexico that are home to 8 million people. People in the four border states generally are more likely to be Hispanic, noncitizen immigrants, poor, and uninsured than those in other parts of the country. Across all four states, the large majority (over 80%) of residents in both border and non-border counties are U.S. citizens, with most being U.S.-born citizens. Health and Health Care in the U.S.-Mexico Border Region reveals further distinctions between and within the four border states. Better understanding the characteristics and needs of residents in these areas may help inform efforts to respond to the recent immigration surge.

Navigating the Family Glitch Fix: Hurdles for Consumers with Employer-sponsored Coverage

Authors: Kaye Pestaina and Karen Pollitz
Published: Nov 21, 2022

With the 2023 Marketplace Open Enrollment now underway in all states, many are focused on the roll out of the so-called “family glitch” fix as one of the new changes to watch in this tenth Marketplace Open Enrollment. Some consumers with access to employer-sponsored family coverage with high premiums will for the first time be able to enroll in Marketplace plans with financial assistance (premium tax credits and cost sharing reductions) that might make this coverage more affordable to them than their employer-sponsor coverage. However, navigating Marketplace eligibility and enrollment requirements is complicated even without the new rules on the family glitch. This Issue Brief looks at some of the challenges consumers can expect to face in deciding whether to take advantage of the family glitch fix.

Affordability and Employer Coverage

Eligibility for premium tax credits in the Marketplace is based on a person’s household income and whether they have an offer of “affordable” employer-sponsored coverage (among other factors). However, for family members of working individuals, affordability until now was based solely on the cost of self-only coverage available to the worker; the added premium for family members was not considered. That interpretation, adopted in 2013, is sometimes called the “family glitch.” In 2022, the average annual premium for employer-sponsored family health insurance is $22,463, while the average cost of self-only coverage is $7,911. Under the “family glitch”, if, for example, an employer had paid the entire premium for workers’ self-only coverage but contributed nothing toward the added cost of enrolling family members, the workers’ family members would nonetheless have been considered to have an affordable offer of employer-sponsored coverage, preventing them from getting financial assistance for Marketplace coverage.

Under new federal regulations published this fall, the worker’s required premium contributions for self-only coverage and for family coverage will be compared to the affordability threshold of 9.12% of household income. If the cost of self-only coverage is affordable, but the cost for family coverage is not, the worker will not be eligible for Marketplace financial assistance, but her family members can apply for this assistance. If employers offer a choice of plans, the lowest cost option with an actuarial value of at least 60% (the ACA “minimum value” standard) is used to evaluate affordability. (An actuarial value of 60% means the plan covers 60% of the cost of covered benefits on average for a typical group of enrollees, with the remainder being paid by patients through deductibles, copays, and coinsurance.)

Individuals determined eligible for Marketplace premium tax credits can also apply for cost sharing reductions if they enroll in a Silver plan and generally have a household income between 100 and 250 percent of the poverty level (between $23,030 and $57,575 for a household of three for 2023). Cost sharing reductions will lower a consumer’s out-of-pocket costs such as deductibles, copayments or coinsurance. The amount of the cost sharing reduction is determined on a sliding scale based on income. Those in cost sharing reduction plans will also have a lower annual out-of-pocket limit than the maximum amount allowed under ACA rules ($9,100 individual and $18,200 family for 2023).

KFF estimated that more than 5.1 million people fell in the ACA family glitch. KFF also estimates that 85% of these people (4.4 million) are currently enrolled through employer-sponsored insurance and are likely spending more for coverage than individuals with similar incomes would pay in premiums for subsidized Marketplace coverage. Consumers affected by the family glitch could be spending on average 15.8% of their income on their employer-based coverage according to one study. By contrast, the ACA affordability threshold for employer coverage in 2023 is 9.12% of income—an individual spending more than 9.12% of their income in premium contributions for her employer coverage is considered to have unaffordable coverage and is eligible for Marketplace subsidies.

Implementing the Family Glitch Fix

Now that the final regulation has been changed and the employee contribution toward family coverage is taken into account to determine affordability, what can consumers expect as they consider enrolling in a Marketplace Plan with financial assistance?

Consumers need information from their employer

One stumbling block for some employees will be the need to seek specific information from their employer before they can even evaluate whether it makes sense to enroll their families in Marketplace coverage with financial assistance. There is no requirement for an employer to provide this information to their employees, putting the onus on employees to try to gather it. To assist consumers in collecting some of this information, the federal exchange has updated its “Employer Coverage Tool,” which employees can take to their employer and request them to provide information about coverage eligibility, cost and minimum value. Consumers can use this tool to complete their Marketplace application. (Table 1)

Table 1: Key Information Needed from Employer to Implement Glitch Fix
Information NeededWhy Needed?Where can consumer get it?
Do employer-sponsored health plan options meet the test of “minimum value”The ACA affordability test is only applied to employer plans that offer “minimum value,” meaning they have an actuarial value of at least 60% and provide substantial coverage for hospitalization and physician servicesConsumers can ask their employer for this information. Alternatively, the Summary of Benefits and Covered (SBC) for the relevant plan option, must indicate whether it meets the minimum value threshold
What is the employee’s premium contribution (for self-only and for family coverage) for the lowest cost plan option that meets minimum value This information is needed to determine whether a worker would have to pay more than the affordability threshold —9.12% of household income for 2023—for family coverageThe employer is the only source for this information. Many firms post the required employee contribution for all plan options during the employer’s open enrollment period. Other employers might not provide this information automatically, requiring the employee to ask for it
Will the employer-sponsored plan allow an employee to revoke coverage for their family mid-year in order to enroll the family in a Marketplace planEmployees and/or family members enrolled in employer coverage will need to disenroll in order to enroll in Marketplace coverage for 2023Each employer plan sponsor decides whether they will allow employees to revoke coverage. Consumers will need to find out what rules their employer uses. If the employer does not allow disenrollment, the family members cannot access financial assistance for Marketplace coverage

IRS rules generally require employer-plan participants to select their coverage option before the beginning of the plan year. After that, employers are only required to permit mid-year changes following specific qualifying events. This can make it difficult to coordinate Marketplace enrollment with employer coverage disenrollment. For instance, an employer may have a plan year that does not begin in January (a non-calendar year plan), in which case Marketplace open enrollment would not coincide with the employer’s open enrollment. New and existing IRS guidance give employers the choice (whether they have a calendar year or non-calendar year plan)1  to allow the employee or household members to revoke their employer coverage and disenroll mid-year if, due to the family glitch fix, they are newly eligible for Marketplace financial assistance. Employers would need to amend their health plans to allow this disenrollment.

Many employers might not know that they must take action to allow employees to revoke coverage in order to take advantage of the glitch fix for their families. While employers do not have to allow this revocation, in most circumstances it would not adversely affect the employer. Allowing a spouse and a dependent to enroll in subsidized Marketplace coverage, for instance, does not cause an employer to violate the ACA’s employer mandate. Some employers may find cost savings in allowing these family members to disenroll since they are no longer covering these family members.

Consumers have complex choices to evaluate

Even if a consumer can get the information that they need in a timely manner, a more affordable premium for Marketplace coverage is only one item to consider in deciding to enroll:

  • “Split” families. The glitch fix does not affect the affordability rule for the worker, only for the worker’s household members. If employer coverage is affordable for the employee but not family members, the employee might still stay in her employer coverage, while her dependents enroll in a Marketplace plan. This “split” family scenario means the family will have two plans, with separate (and likely different) deductibles and out-of-pocket limits and different provider networks. Also, an employee could decide to enroll along with her family in Marketplace coverage. However, because the employee would not be eligible for premium tax credits, her share of the family premium would not be subsidized. In addition, if her family would otherwise be eligible for cost sharing reductions, the family members would have to enroll in a separate Silver marketplace plan from the employee under existing cost sharing reduction rules.
  • Networks and cost sharing.
    • Differences in plan provider networks. The breadth of provider networks for Marketplace coverage might not be as robust as those in a typical employer plan. Consumers will need to investigate whether they can still see their existing providers in their new Marketplace plan.
    • Differences in cost-sharing: Those not eligible for cost sharing reductions may also find higher deductibles and out-of-pocket maximums then they had in their employer coverage. For example, the average per-person deductible in job-based plans in 2022 was $1,763, compared to $4,753 under the average Marketplace Silver plan that year.

Considerations going forward

CMS has already ramped up outreach to relevant stakeholders to provide training on the family glitch fix. Time will tell whether more is needed to assure that the family glitch fix is implemented so that affected individuals can access this benefit. Easier ways to access information about employer cost and coverage may be one area to evaluate to alleviate the current complexity. As policymakers evaluate how best to make affordable coverage more accessible in our fragmented health coverage system, implementation of the family glitch is one clear area where trained assistance is clearly important to help consumers.

  1. Even for some calendar-year employer plans, if the employer’s open enrollment period does not align with the Marketplace open enrollment period or an employee or employer did not take action to revoke coverage prior to January 1, 2023, consumers still might need permission to disenroll in 2023 outside of their employer plan’s open enrollment period.  IRS Notice 2022-41 released in October 2022 only addressed non-calendar year plans, but in early November 2022 the IRS corrected the Notice to include calendar year plans as well. ↩︎

Health and Health Care in the U.S.-Mexico Border Region

Published: Nov 21, 2022

Introduction

The four states (Arizona, California, New Mexico, and Texas) along the U.S.-Mexico border are home to over 78 million people of whom 8 million live in 44 counties that form the border area and border activity is at an all-time high.1 ,2 ,3  This year, there have been over two million encounters at the U.S.-Mexico border, which is 24% higher than the number of encounters last year. Although migrants and asylum seekers generally have short stays in border communities, this increased activity is leading to growing demands on border processing capacity and border communities that already face health and socioeconomic challenges and to some state governors busing migrants to other states.4 ,5 ,6 . Understanding of who lives in the region and their experiences, including their health and access to health care, may help inform efforts to address their needs.

Overall, people living in the four border states generally are more likely to be Hispanic and noncitizen immigrants compared to those in other parts of the country. They also are generally more likely to be poor, and uninsured.7  This analysis further examines differences between and within border states in sociodemographic characteristics, health coverage and access to care, as well as health outcomes of people living there. It is based on KFF’s analysis of county-level data from the American Community Survey (ACS) five-year data tables, the Health Resources and Services Administration’s Area Health Resource Files (AHRF), the Centers for Disease Control and Prevention’s (CDC) WONDER database, and the Behavioral Risk Factors Surveillance System (BRFSS). Aside from 2020 mortality data from CDC, the most recent reliable available county-level data from these sources are from 2019. All differences described between border and non-border counties and between states in the text are statistically significant at the p<0.05 level. The data included in this brief are from the two years preceding the influx at the U.S.-Mexico border to provide context for the situation in the border region before the recent increase in immigration activity.

The findings show that, across many of the measures examined, Texas fared worse compared to the other border states. Moreover, within Texas, individuals in border counties faced increased challenges compared to those in non-border counties, with particularly low levels of educational attainment and income, higher shares of households with limited English proficiency (LEP) and no computer access, higher uninsured rates, and more limited access to providers. In the other border states, there are smaller differences in these measures between people living in border vs. non-border counties. In contrast to the other border states, Texas has not implemented the Affordable Care Act (ACA) Medicaid expansion to adults, contributing to lower rates of Medicaid coverage and higher uninsured rates compared with the other states, especially in border counties.

While immigration remains a contentious political issue, these findings highlight the potential benefits of providing resources and support to the border region to meet the needs of the growing number of migrants and asylum seekers in the area. Better preparedness, more job opportunities, and a greater allocation of resources to help migrants assimilate in the community may be helpful not only in improving socioeconomic and health outcomes and reducing disparities in border areas, but in improving the economy overall, particularly in these border communities.8  Policies that increase opportunities for newly arriving migrants to work, such as reducing the wait time for applying for work authorization, could also reduce overcrowding at migrant shelters.9  Although such policies could increase competition for jobs, research has found that immigrants and U.S.-born citizens in the low-skilled workforce usually fill different types of jobs as opposed to competing for the same types of jobs.10  A separate study found that immigrants in the U.S create more jobs than they take, thereby improving the economic outcomes for U.S.-born workers.11 

Funding to support organizations providing direct assistance to newly arriving migrants and asylum seekers, funding to support community health workers and Federally Qualified Health Centers in border areas, and funding to address social needs such as poverty and LEP may help improve outcomes in the border region.12  Moreover, implementation of the Medicaid expansion in Texas could help to increase overall coverage rates and provide increased financial resources to support health providers and the health care system.

What happens when migrants arrive at the U.S.-Mexico border?

Immigration activity at the border is at an all-time high, with over two million encounters in 2022, a number that is 24% higher than the year before. Historically, the U.S.-Mexico border was primarily used as an entry point by migrants from Mexico, Guatemala, Honduras, and El Salvador; however, migrants from other countries, including Venezuelans, Cubans, and Nicaraguans, accounted for 43% of border encounters in 2022, a 39 percentage point increase since 2017.13  Some migrants from European countries like Ukraine have also used the Southwestern border between the U.S. and Mexico to seek entry into the country following political turmoil.14 

U.S. Customs and Border Protection (CBP) screens and processes migrants and asylum seekers when they arrive at the border. Based on this screening, individuals may be returned to Mexico under Title 42 or other policies, detained, placed under expedited removal to return to their home country, or, if seeking asylum, released into the U.S. with a notice to appear in court or report for further processing.15 ,16 

A range of nonprofit organizations help support migrants and asylum-seekers in the border region. Individuals released from custody may seek to reunite with family and friends already living in the U.S., with many traveling on to other areas of the country outside of the border region. However, they typically have very limited or no resources available and often rely on nonprofit organizations for assistance, particularly when they first arrive in the country. While refugees are authorized to work immediately upon arrival to the U.S.,17  asylum seekers must wait at least 150 days after filing their asylum application to apply for employment authorization and are not eligible to receive employment authorization until at least 180 days post-asylum filing, limiting their opportunities to work.18  The U.S. Congress recently appropriated $150 million in funding through the Federal Emergency Management Agency to reimburse faith-based, nonprofit, and government organizations providing humanitarian assistance, such as food and housing, to migrants.

Who lives in the U.S.-Mexico border region?

Overall, there are 78 million people living in the four states (Arizona, California, New Mexico and Texas) along the U.S.-Mexico border. Within these four states, there are 44 counties that sit along the border that are home to over 8 million people. Most (32) of these counties are in Texas, while 6 are in New Mexico, 4 are in Arizona, and 2 are in California. These states also include 316 non-border counties, with Texas again accounting for the largest number of these counties (222).

In Arizona, California, and Texas, border county residents are more likely to be Hispanic as compared with those in non-border counties (Figure 1). In Arizona, California, and New Mexico, over half of residents in border counties are Hispanic, while this share rises to over three-quarters (76%) in Texas. In contrast, Hispanic people make up less than a quarter of residents in non-border counties in Arizona (23%) and less than a third of non-border county residents in Texas (29%) and California (30%), while they account for closer to half of people in non-border counties in New Mexico (47%). The age distribution of people living in border and non-border counties is largely similar across all four states.

In Arizona and Texas, border counties include higher shares of noncitizens compared with non-border counties, but the vast majority of residents in both types of counties in all four states are U.S.-born citizens. In Arizona and Texas, roughly one in ten people in border counties is a noncitizen, which is higher than non-border counties. The share is slightly higher in California border counties (13%) and lower in New Mexico border counties (6%) with no statistically significant difference between border and non-border counties in these states. Across all four states, the large majority (over 80%) of residents in both border and non-border counties are U.S. citizens, with most being U.S.-born citizens.

Demographics of People Living in Border and Non-Border Counties in Border States, 2019

In Texas, border county residents have lower levels of educational attainment, full-time employment, and household incomes than their counterparts in non-border counties. (Figure 2). In Texas, the proportion of border county residents with less than a high school education is nearly twice as high as non-border county residents (30% vs. 17%). In contrast, the share of residents with less than a high school education is similar across border and non-border counties in the other three states. Regarding employment, the share of individuals living in border counties who are full-time workers is similar to the share in non-border counties in Arizona (48% vs. 45%), California (45% vs. 47%), and New Mexico (43% vs. 48%). However, the share of people in border counties who are full-time workers is lower than the share in non-border counties in Texas (49% vs. 55%), which has the highest share of full-time workers in non-border counties across the four states. Consistent with these findings, households in border counties in Texas are more likely than households in non-border counties to have incomes less than $25,000 (25% vs. 16%) and less likely to have incomes at or above $100,000 (18% vs. 28%). In contrast, the income distribution in Arizona, California, and New Mexico is similar between border and non-border counties. In California, over a third of residents in both border and non-border counties has household income of at least $100,000, which is higher compared to the other three states.

Education, Work Status, and Household Income of People Living in Border and Non-Border Counties in Border States, 2019

In California and Texas, households in border counties are more likely than those in non-border counties to face language barriers (Figure 3). Texas and California have the highest shares of households with limited English proficiency (LEP) in border counties (17% and 15%, respectively), which are over four and three times higher than the shares in their non-border counties (4% and 6%, respectively). In Arizona and New Mexico there are no statistically significant differences between border and non-border counties in the share of households with LEP. Access to computers and broadband access is generally similar between border and non-border counties in Arizona, California, and New Mexico. However, in Texas, nearly a quarter (23%) of households in border counties lack computer access compared to 14% of those in non-border counties. Texas also has the highest shares of households reporting no broadband access in both border and non-border counties across the four states, with lower broadband access in non-border than border counties (22% without broadband access vs. 18% without broadband access).

Limited English Proficiency (LEP), Computer, and Internet Access among Households in Border and Non-Border Counties in Border States, 2019

What is the status of health and health care in the border region?

Uninsured rates among nonelderly residents in both border and non-border counties in Texas are at least twice as high as the other three border states, and nonelderly residents in its border counties are more likely to be uninsured than those in its non-border counties (26% vs. 20%) (Figure 4). In Texas, private coverage rates are lower in border counties than non-border counties. While the Medicaid coverage rate is higher in border counties than non-border counties, it does not fully offset the difference in private coverage leading to the higher uninsured rate for its residents in border counties. In the other three border states, there are no significant differences in insurance coverage patterns between border and non-border counties. The higher uninsured rates in Texas are mostly driven by higher uninsured rates for nonelderly adults, which are particularly high in border counties, where one in three adults lacked coverage. Children in Texas also have higher uninsured rates compared to the other border states, but there is little difference in uninsured rates for children in border vs. non-border counties.

In contrast to the other border states, Texas has not implemented the ACA Medicaid expansion to lower-income adults, contributing to its lower rates of Medicaid coverage and higher uninsured rates compared to the other states. Overall, over 770,000 poor adults are in the Medicaid coverage gap in Texas, accounting for over a third of all adults in the gap nationwide.19  As noted, in Texas, border county residents have lower levels of full-time employment and household incomes than their counterparts in non-border counties, which may contribute to the lower rates of private coverage in the border counties. While Medicaid coverage helps offset some of this difference, border counties also include higher shares of noncitizens compared with non-border counties, who may face eligibility restrictions for Medicaid. Specifically, those who are undocumented are not eligible to enroll in Medicaid or CHIP or to purchase coverage through the Marketplaces.

Insurance Coverage among the Nonelderly in Border and Non-Border Counties in Border States, 2019

In California and Texas, border counties have a more limited supply of certain health care providers than non-border counties. Moreover, Texas has more limited availability of all four types of providers examined in both border and non-border counties compared with the other three states. In Arizona and New Mexico, the supply of providers between border and non-border counties varies based on provider type (Figure 5). For example, Arizona has fewer dentists per 100,000 people in border counties vs. non-border counties (45.3 vs. 55.1) but has more primary care providers per 100,000 in border counties vs. non-border counties (59.3 vs. 49.3).

Providers per 100,000 in Border and Non-Border Counties in Border States, 2019

Adults in Texas border counties are more likely to report poor physical health compared to non-border counties. In Texas border counties, one-third of adults report being in fair or poor health as compared to roughly one-quarter in border and non-border counties in the other border states (Figure 6).There is limited variation in the share reporting 14 or more poor physical or mental health days in a month across border and non-border counties in the four states, however, more adults reported 14 or more poor mental health days in Texas as compared to the other three states.

Health Status of Adults Living in Border and Non-Border Counties in Border States, 2019

California, New Mexico, and Texas had higher rates of COVID-19 deaths in border counties vs. non-border counties overall, with the largest difference in Texas, where the border county death rate was nearly twice as high as the rate for non-border counties (161.2 vs. 83.6 per 100,000) (Figure 7). These differences are primarily driven by a higher COVID-19 death rate among Hispanic people in border counties vs. non-border counties. Across the four states, Texas had the highest death rate among Hispanic people. Moreover, within Texas, the death rate among Hispanic people was over 1.5 times higher in border counties than in non-border counties (290.9 vs. 167.1 per 100,000). The death rate for White people in Texas border counties was also higher than their counterparts in non-border counties (89.5 vs. 67.2).

COVID-19 Death Rates (per 100,000) in Border and Non-Border Counties in Border States, 2020

Implications

With the recent surge in immigration activity at the border, it is helpful to better understand who lives in the region and their experiences, including their health and access to health care. Overall, people in the four states along the U.S.-Mexico border are more likely to be Hispanic, noncitizen immigrants, poor, and uninsured than people in other areas of the country. This analysis reveals further distinctions between and within these four states. It shows that, across many of the measures examined, Texas fared worse compared to the other border states. Moreover, within Texas, individuals in border counties fare worse across many examined measures compared to those in non-border counties, with particularly low levels of educational attainment and income, higher shares of households with LEP and no computer access, higher uninsured rates, and limited access to providers. In the other border states, there are smaller differences between people living in border vs. non-border counties.

In contrast to the other border states, Texas has not implemented the ACA Medicaid expansion to adults, contributing to lower rates of Medicaid coverage and higher uninsured rates. These differences are particularly pronounced in its border counties, where over a quarter of nonelderly residents, including one in three nonelderly adults, lacked health coverage. These high uninsured rates coupled with more limited availability of providers, particularly in border counties, likely contribute to challenges accessing health care and strains on safety-net providers, which are likely exacerbated by increased social and economic challenges in these areas.

Overall, these findings highlight the potential benefits of providing resources and support to the border region to meet the needs of the growing number of migrants and asylum seekers in the area. Better preparedness, more job opportunities, and a greater allocation of resources to help migrants assimilate in the community may be helpful not only in improving socioeconomic and health outcomes and reducing disparities in border areas, but in improving the economy overall, particularly in these border communities. Policies that increase opportunities for newly arriving migrants to work, such as reducing the wait time for applying for work authorization, could also reduce overcrowding at migrant shelters. Funding to support organizations providing direct assistance to newly arriving migrants and asylum seekers, funding to support community health workers and Federally Qualified Health Centers in border areas, and funding to address social needs such as poverty and LEP may help improve outcomes in the border region. Moreover, implementation of the Medicaid expansion in Texas could help to increase overall coverage rates and provide increased financial resources to support health providers and the health care system. Immigration remains a contentious political issue, and there are other competing demands for public dollars, but this analysis shows particularly acute health and social needs along the U.S.-Mexico border.

  1. U.S. Census Bureau, “Quick Facts”, https://www.census.gov/quickfacts, accessed November 14, 2022. ↩︎
  2. U.S. Census Bureau, “County Population Totals: 2020-2021”, https://www.census.gov/data/tables/time-series/demo/popest/2020s-counties-total.html, accessed November 14, 2022. ↩︎
  3. U.S. Customs and Border Protection (2022), “Southwest Land Border Encounters”, https://www.cbp.gov/newsroom/stats/southwest-land-border-encounters, accessed October 20, 2022. ↩︎
  4. Pew Charitable Trusts (2022), “Minus the Politics, Migrants Often Use Buses, Planes to Reach Shelter”, https://www.pewtrusts.org/en/research-and-analysis/blogs/stateline/2022/10/04/minus-the-politics-migrants-often-use-buses-planes-to-reach-shelter, accessed October 26, 2022. ↩︎
  5. National Public Radio (2022), “A dramatic shift at the border as migrants converge on a remote corner of South Texas” https://www.npr.org/2022/09/23/1124561261/a-dramatic-shift-at-the-border-as-migrants-converge-on-a-remote-corner-of-south-, accessed September 23, 2022. ↩︎
  6. Migration Policy Institute (2022), “Busing and Flights of Migrants by GOP Governors Mark a New Twist in State Intervention on Immigration”, https://www.migrationpolicy.org/article/migrant-asylum-seeker-busing, accessed October 26, 2022. ↩︎
  7. Kaiser Family Foundation (KFF), “State Health Facts”, https://modern.kff.org/statedata/, accessed October 28, 2022. ↩︎
  8. The Brookings Institution (2022), “Who are the 1 million missing workers that could solve America’s labor shortages?”, https://www.brookings.edu/blog/up-front/2022/07/14/who-are-the-1-million-missing-workers-that-could-solve-americas-labor-shortages/, accessed October 26, 2022. ↩︎
  9. Press Herald (2022), “Rep. Pingree submits bill to shorten asylum seekers’ wait time for work authorization”, https://www.pressherald.com/2022/02/11/pingree-introduces-bill-to-shorten-waiting-period-for-asylum-seeker-work-authorization/, accessed October 26, 2022. ↩︎
  10. Urban Institute (2015), “Immigrants and native workers compete for different low-skilled jobs”, https://www.urban.org/urban-wire/immigrant-and-native-workers-compete-different-low-skilled-jobs, accessed November 14, 2022. ↩︎
  11. Azoulay, Pierre, Benjamin F. Jones, J. Daniel Kim, and Javier Miranda. 2022. "Immigration and Entrepreneurship in the United States." American Economic Review: Insights, 4 (1): 71-88. ↩︎
  12. Rural Health Information Hub (2019), “Rural Border Health”, https://www.ruralhealthinfo.org/topics/border-health, accessed October 21, 2022. ↩︎
  13. Migration Policy Institute (2022), “Record-Breaking Migrant Encounters at the U.S.-Mexico Border Overlook the Bigger Story”, https://www.migrationpolicy.org/news/2022-record-migrant-encounters-us-mexico-border, accessed October 26, 2022. ↩︎
  14. National Public Radio (2022), “Thousands of Ukrainian refugees arrive at U.S.-Mexico Border”, https://www.npr.org/2022/04/08/1091769484/hundreds-of-ukrainian-refugees-at-the-u-s-mexico-border-hoping-for-asylum, accessed September 23, 2022. ↩︎
  15. Kaiser Family Foundation (KFF) (2022), “Title 42 and its Impact on Migrant Families”, https://modern.kff.org/racial-equity-and-health-policy/issue-brief/title-42-and-its-impact-on-migrant-families/, accessed October 26, 2022. ↩︎
  16. U.S. Citizenship and Immigration Services (2022), “Asylum”, https://www.uscis.gov/humanitarian/refugees-and-asylum/asylum, accessed October 21, 2022. ↩︎
  17. U.S. Citizenship and Immigration Services (2022), “Refugees”, https://www.uscis.gov/humanitarian/refugees-and-asylum/refugees, accessed October 26, 2022. ↩︎
  18. U.S. Citizenship and Immigration Services (2022), “USCIS Stopped Applying June 2020 Rules Pursuant to Court Order in Asylumworks v. Mayorkas”, https://www.uscis.gov/laws-and-policy/other-resources/class-action-settlement-notices-and-agreements/uscis-stopped-applying-june-2020-rules-pursuant-to-court-order-in-asylumworks-v-mayorkas#:~:text=You%20may%20apply%20for%20employment,you%20file%20your%20asylum%20application., accessed October 21, 2022. ↩︎
  19. Kaiser Family Foundation (KFF) (2021), “The Coverage Gap: Uninsured Poor Adults in States that Do Not Expand Medicaid”, https://modern.kff.org/medicaid/issue-brief/the-coverage-gap-uninsured-poor-adults-in-states-that-do-not-expand-medicaid/, accessed October 26, 2022. ↩︎

The Typical Medicare Beneficiary Has Close to 70 Different Medicare Advantage and Medicare Part D Stand-Alone Plan Options for 2023

Published: Nov 17, 2022

The Medicare open enrollment period that runs from October 15 to December 7 each year is an opportunity for Medicare beneficiaries in traditional Medicare and Medicare Advantage to evaluate their current coverage, compare plans, and decide whether to make a change for the coming year. Beneficiaries can compare Medicare Advantage plans, mainly HMOs and PPOs, which provide all Medicare-covered benefits, typically including Part D drug coverage, and may offer other benefits such as vision, dental, and hearing benefits. Beneficiaries can also compare Part D stand-alone prescription drug plans, which add drug coverage to traditional Medicare. Costs and coverage can vary from one plan to another and can change from one year to the next.

For coverage in 2023, the typical beneficiary has close to 70 different Medicare private plan options, consisting of 43 Medicare Advantage plans, including 35 with Part D drug coverage and 8 without, and 24 Part D stand-alone drug plans. This total represents two-thirds more plan options than the typical beneficiary had six years ago, an increase driven by a substantial expansion of Medicare Advantage plan offerings.

News Release

A Fall Update on COVID-19 Cases and Deaths, Vaccinations, and Treatments by Race/Ethnicity

Published: Nov 17, 2022

KFF has updated its national analysis of race/ethnicity data of COVID-19 cases and deaths, vaccinations, and treatments as concerns grow over a potential increase in COVID-19 cases during winter and upcoming holiday gatherings and the low take-up of the COVID-19 bivalent booster vaccine among the eligible public.

Despite earlier progress narrowing disparities in COVID-19 vaccination, new disparities have emerged in take-up of boosters and treatment.

Federal data from earlier this month indicates that, among the eligible population, 10% of White people had received a COVID-19 bivalent booster dose, twice the rate of eligible Black (5%) and Hispanic (4%) people and nearly twice as high as for Native Hawaiian or Other Pacific Islander people (6%). Eleven percent of Asian people and 8% of American Indian and Alaskan Native people had received a bivalent booster dose.

The bivalent booster data stands in contrast to the vaccination rates among racial and ethnic groups for at least one dose of the primary COVID-19 vaccine. The rate for a primary COVID-19 vaccine dose among White people stood at 56% earlier this month. The primary vaccine dose rate among Black people lagged at 50%, while other racial and ethnic groups had surpassed the rates among White people. Uptake of at least one dose of the primary COVID-19 vaccine began leveling off across all racial/ethnic groups in late winter 2021.

Racial and ethnic gaps are also found in the data on the treatment of COVID-19. As of mid-2022, among COVID-19 patients aged 20 and older, people of color were less likely to have been treated with the antiviral treatment Paxlovid. While the disparities were found across all age groups, the Paxlovid treatment gap was more evident among adults aged 50 or older and those who are immunocompromised (groups more at risk for serious health outcomes).

For the full analysis including a look at the trends in racial disparities in cases and deaths which have widened and narrowed over the course of the pandemic read, COVID-19 Cases and Deaths, Vaccinations, and Treatments by Race/Ethnicity as of Fall 2022.


COVID-19 Cases and Deaths, Vaccinations, and Treatments by Race/Ethnicity as of Fall 2022

Published: Nov 17, 2022

As the United States enters its third holiday season navigating a potential increase in COVID-19 cases as well as other respiratory illnesses, federal data from the Centers for Disease Control and Prevention (CDC) show that as of November 9, 2022, 80% of the total population in the United States have received at least one dose of a COVID-19 vaccine and only 10% of eligible individuals have received the updated, bivalent booster that was authorized for use among individuals 5 years of age and older in early Fall 2022. Individuals who have not received any booster dose are at higher risk of infection from the virus, and people who remain unvaccinated continue to be at particularly high risk for severe illness and death.

Over the course of the pandemic, racial disparities in cases and deaths have widened and narrowed. However, overall, Black, Hispanic, and American Indian and Alaska Native (AIAN) people have borne the heaviest health impacts of the pandemic, particularly when adjusting data to account for differences in age by race and ethnicity. While Black and Hispanic people were less likely than their White counterparts to receive a vaccine during the initial phases of the vaccination rollout, these disparities have narrowed over time and reversed for Hispanic people. Despite this progress, a vaccination gap persists for Black people. COVID-19 outpatient treatments, which can mitigate hospitalization and death from COVID-19, are also available. However, early data suggest racial disparities in access to and receipt of these treatments.

This data note presents an update on the status of COVID-19 cases and deaths, vaccinations, and treatments by race/ethnicity as of Fall 2022, based on federal data reported by the Centers for Disease Control and Prevention (CDC).

What is the status of COVID-19 cases and deaths by race/ethnicity?

Racial disparities in COVID-19 cases and deaths have widened and narrowed over the course of the pandemic, but when data are adjusted to account for differences in age by race/ethnicity, they show that AIAN, Black, and Hispanic people have had higher rates of infection and death than White people over most of the course of the pandemic. Early in the pandemic, there were large racial disparities in COVID-19 cases. Disparities narrowed when overall infection rates fell. However, during the surge associated with the Omicron variant in Winter 2022, disparities in cases once again widened with Hispanic (4,341 per 100,000), AIAN (3,818 per 100,000), Black (2,937 per 100,000), and Asian (2,755 per 100,000) people having higher age-adjusted infection rates than White people (2,693 per 100,000) as of January 2022 (Figure 1). Following that surge, infection rates fell in Spring 2022 and disparities have once again narrowed. However, as of September 2022, the age-adjusted COVID-19 infection rates were still highest for Black and Hispanic people (192 per 100,000 for each group), followed by AIAN people at 188 per 100,000. White and Asian people had the lowest infection rates at 164 per 100,000 and 153 per 100,000, respectively. While death rates for most groups of color were substantially higher compared with White people early on in the pandemic, since late Summer 2020, there have been some periods when death rates for White people have been higher than or similar to some groups of color. However, age-adjusted data show that AIAN, Black, and Hispanic people have had higher rates of death compared with White people over most of the pandemic and particularly during surges. For example, as of January 2022, amid the Omicron surge, age-adjusted death rates were higher for Black (37.4 per 100,000), AIAN (34.7 per 100,000), and Hispanic people (29.9 per 100,000) compared with White people (23.5 per 100,000) (Figure 1). Following that surge, disparities narrowed when death rates fell. As of August 2022, age-adjusted death rates were similar for AIAN (4.9 per 100,000), Black (4.4 per 100,000), and White people (4.2 per 100,000) and lower for Hispanic (3.6 per 100,000) and Asian (2.7 per 100,000) people. Despite these fluctuations over time, total cumulative age-adjusted data continue to show that Black, Hispanic, and AIAN people have been at higher risk for COVID-19 cases, hospitalizations, and deaths compared with White people.

COVID-19 Monthly Age-Adjusted Cases in the United States per 100,000 by Race/Ethnicity, April 2020 to September 2022

What are COVID-19 vaccination and booster patterns by race/ethnicity?

While disparities in COVID-19 vaccinations have narrowed over time and have been reversed for Hispanic people, they persist for Black people. Ongoing KFF analysis shows that at both the federal and state level, there were large gaps in vaccination for Black and Hispanic people in the initial phases of the vaccination rollout, which narrowed over time and eventually reversed for Hispanic people. Despite this progress, a vaccination gap persists for Black people. According to the CDC, overall, 80% of people had received at least one COVID-19 vaccination dose as of November 9, 2022, and race/ethnicity was known for 75% of people who had received at least one dose. Based on those with known race/ethnicity, about half (50%) of Black people had received at least one dose compared with 56% of White people, two-thirds (66%) of Hispanic people, and over seven in ten Native Hawaiian and other Pacific Islander (NHOPI) (70%), Asian (72%), and AIAN (77%) people (Figure 2).

Overall, few people have received the updated bivalent booster vaccine dose, and Black and Hispanic people are about half as likely as White people to have received this booster so far. The updated bivalent boosters protect against both the original virus that causes COVID-19 and the BA.4 and BA.5 Omicron variants. These boosters became available for people ages 12 years and older on September 2, 2022, and for people ages 5-11 years old on October 12, 2022. The CDC recommends that people ages 5 years and older receive one bivalent booster at least 2 months after their last COVID-19 vaccine dose. The CDC reports that, overall, 10% of people over age five have received the updated bivalent booster vaccine dose as of November 9, 2022, with race/ethnicity data available for 88%. Based on those with known race/ethnicity, 11% of eligible Asian and 10% of eligible White people had received a bivalent booster dose, roughly twice the shares of eligible Black (5%) and Hispanic people (4%) (Figure 2). The bivalent booster dose rate was 6% for eligible NHOPI people and 8% for eligible AIAN people.

Percent of People Receiving At Least One Dose of the COVID-19 Vaccines by Race/Ethnicity, as of November 9, 2022

What are COVID-19 treatment patterns by race/ethnicity?

New data from CDC show racial disparities in receipt of COVID-19 oral antiviral treatments, including Paxlovid, the most widely prescribed antiviral. As of November 2022, there are four COVID-19 outpatient treatments, including: Paxlovid and Lagevrio, oral antivirals that were both approved in December 2021; Veklury, an IV infusion antiviral that was approved in January 2021; and Bebtelovimab a monoclonal antibody that was approved in February 2022. Outpatient COVID-19 treatments are recommended for people who have tested positive for COVID-19 with mild to moderate symptoms and who are at high risk of developing severe illness. Prior KFF analysis pointed to potential disparities in access to COVID-19 treatments for counties with the highest poverty rates and those that are majority Black, Hispanic, and AIAN. Other analyses have documented disparities in monoclonal antibody treatments by race and ethnicity as well as disparities in oral antiviral treatment by zip-code vulnerability. An October 2022 CDC Morbidity and Mortality Weekly Report adds to these findings showing that, through July 2022, people of color were less likely to receive currently available outpatient antiviral COVID-19 treatments compared with their White counterparts. Specifically, between April to July 2022, the percentage of COVID-19 patients aged 20 years and older treated with Paxlovid was lower among Black (21%) and Hispanic (21%) patients than among White (32%) and non-Hispanic (30%) patients, respectively (Figure 3). The shares of AIAN and NHOPI (25%) and Asian (26%) patients receiving prescriptions were also smaller compared to the share of White patients. These disparities were observed across all age groups and were more evident among adults ages 50 and older and immunocompromised patients. Racial and ethnic disparities existed for treatment with other medications, but differences were small given overall low levels of treatment with these other medications.

Percent of COVID-19 Patients Ages 20 Years and Older Treated with Paxlovid, by Race and Ethnicity

Discussion

While disparities in cases and deaths have widened and narrowed over the course of the pandemic, age-adjusted data show that AIAN, Black, and Hispanic people have had higher rates of cases and death compared with White people over most of the course of the pandemic and that they have experienced overall higher rates of infection, hospitalization, and death.

Data point to significantly increased risks of COVID-19 illness and death for people who remain unvaccinated or have not received an updated bivalent booster dose. During the initial vaccine rollout, Black and Hispanic people were less likely to receive vaccines than their White counterparts. However, these disparities have narrowed over time and reversed for Hispanic people, though they persist for Black people. Despite this progress in initial vaccination uptake, overall uptake of the updated bivalent booster dose has been slow so far, and there have been racial disparities in receipt of these booster doses, with eligible Black, Hispanic, and NHOPI people about half has likely to have received an updated booster than their White counterparts. Data also point to disparities in receipt of COVID-19 treatments, with patients of color less likely to receive oral antivirals, including Paxlovid, compared to White patients.

Overall, these data show that although the pandemic has contributed to growing awareness and focus on addressing racial disparities, they persist, reflecting the underlying structural inequities that drive them. The findings highlight the importance of a continued focus on equity and efforts to address inequities that leave people of color at increased risk for exposure, illness, and death as well as to close gaps in access to health care, including COVID-19 treatments. Addressing these gaps is of increasing importance as these disparities may be exacerbated when federal funding for COVID-19 vaccines, treatments, and tests runs out and some people may face increased out-of-pocket costs to access these services. Addressing these inequities is key for narrowing the disparate effects of COVID-19 going forward as well as for preventing similar disparities associated with future public health threats.